Why and how GitHub encrypts sensitive database columns using ActiveRecord::Encryption

Post Syndicated from Kylie Stradley original https://github.blog/2022-10-26-why-and-how-github-encrypts-sensitive-database-columns-using-activerecordencryption/

You may know that GitHub encrypts your source code at rest, but you may not have known that we also encrypt sensitive database columns in our Ruby on Rails monolith. We do this to provide an additional layer of defense in depth to mitigate concerns, such as:

  • Reading or tampering with sensitive fields if a database is inappropriately accessed
  • Accidentally exposing sensitive data in logs

Motivation

Until recently, we used an internal library called Encrypted Attributes. GitHub developers would declare a column should be encrypted using an API that might look familiar if you have used ActiveRecord::Encryption:

class PersonalAccessToken
  encrypted_attribute :encrypted_token, :plaintext_token
end

Given that we had an existing implementation, you may be wondering why we chose to take on the work of converting our columns to ActiveRecord::Encryption. Our main motivation was to ensure that developers did not have to learn a GitHub-specific pattern to encrypt their sensitive data.

We believe strongly that using familiar, intuitive patterns results in better adoption of security tools and, by extension, better security for our users.

In addition to exposing some of the implementation details of the underlying encryption, this API did not provide an easy way for developers to encrypt existing columns. Our internal library required a separate encryption key to be generated and stored in our secure environment variable configuration—for each new database column. This created a bottleneck, as most developers don’t work with encryption every day and needed support from the security team to make changes.

When assessing ActiveRecord::Encryption, we were particularly interested in its ease of use for developers. We wanted a developer to be able to write one line of code, and no matter if their column was previously plaintext or used our previous solution, their column would magically start using ActiveRecord::Encryption. The final API looks something like this:

class PersonalAccessToken
  encrypts :token
end

This API is the exact same as what is used by traditional ActiveRecord::Encryption while hiding all the complexity of making it work at GitHub scale.

How we implemented this

As part of implementing ActiveRecord::Encryptioninto our monolith, we worked with our architecture and infrastructure teams to make sure the solution met GitHub’s scalability and security requirements. Below is a brief list of some of the customizations we made to fit the implementation to our infrastructure.

As always, there are specific nuances that must be considered when modifying existing encryption implementations, and it is always a good practice to review any new cryptography code with a security team.

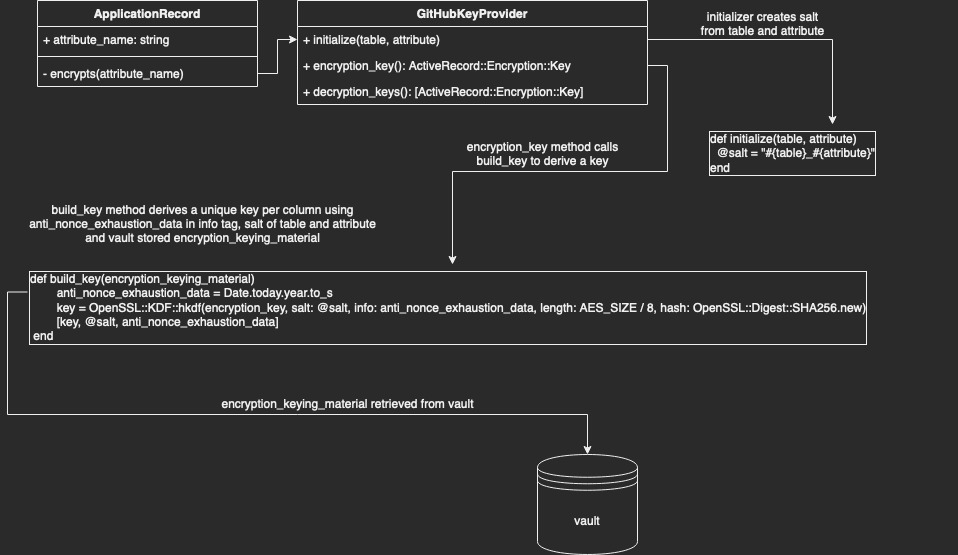
Diagram 1: Key access and derivation flow for GitHub’s `ActiveRecord::Encryption` implementation

Secure primary key storage

By default, Rails uses its built-in credentials.yml.enc file to securely store the primary key and static salt used for deriving the column encryption key in ActiveRecord::Encryption.

GitHub’s key management strategy for ActiveRecord::Encryption differs from the Rails default in two key ways: deriving a separate key per column and storing the key in our centralized secret management system.

Deriving per-column keys from a single primary key

As explained above, one of the goals of this transition was to no longer bottleneck teams by managing keys manually. We did, however, want to maintain the security properties of separate keys. Thankfully, cryptography experts have created a primitive known as a Key Derivation Function (KDF) for this purpose. These functions take (roughly) three important parameters: the primary key, a unique salt, and a string termed “info” by the spec.

Our salt is simply the table name, an underscore, and the attribute name. So for “PersonalAccessTokens#token” the salt would be “personal_access_tokens_token”. This ensures the key is different per column.

Due to the specifics of the ActiveRecord::Encryption algorithm (AES256-GCM), we need to be careful not to encrypt too many values using the same key (to avoid nonce reuse). We use the “info” string parameter to ensure the key for each column changes automatically at least once per year. Therefore, we can populate the info input with the current year as a nonce during key derivation.

The applications that make up GitHub store secrets in Hashicorp Vault. To conform with this pre-existing pattern, we wanted to pull our primary key from Vault instead of the credentials.yml.enc file. To accommodate for this, we wrote a custom key provider that behaves similarly to the default DerivedSecretKeyProvider, retrieving the key from Vault and deriving the key with our KDF (see Diagram 1).

Making new behavior the default

One of our team’s key principles is that solutions we develop should be intuitive and not require implementation knowledge on the part of the product developer. ActiveRecord::Encryption includes functionality to customize the Encryptor used to encrypt data for a given column. This functionality would allow developers to optionally use the strategies described above, but to make it the default for our monolith we needed to override the encrypts model helper to automatically select an appropriate GitHub-specific key provider for the user.

{
def self.encrypts(*attributes, key_provider: nil, previous: nil, **options)
      # snip: ensure only one attribute is passed
# ...

    # pull out the sole attribute
    attribute = attributes.sole

      # snip: ensure if a key provider is passed, that it is a GitHubKeyProvider
      # ...

    # If no key provider is set, instantiate one
    kp = key_provider || GitHub::Encryption::GitHubKeyProvider.new(table: table_name.to_sym, attribute: attribute)

      # snip: logic to ensure previous encryption formats and plaintext are supported for smooth transition (see part 2)
      # github_previous = ...

    # call to rails encryption
    super(attribute, key_provider: kp, previous: github_previous, **options)
end
}

Currently, we only provide this API to developers working on our internal github.com codebase. As we work with the library, we are experimenting with upstreaming this strategy to ActiveRecord::Encryption by replacing the per-class encryption scheme with a per-column encryption scheme.

Turn off compression by default

Compressing values prior to encryption can reveal some information about the content of the value. For example, a value with more repeated bytes, such as “abcabcabc,” will compress better than a string of the same length, such as “abcdefghi”. In addition to the common encryption property that ciphertext generally exposes the length, this exposes additional information about the entropy (randomness) of the underlying plaintext.

ActiveRecord::Encryption compresses data by default for storage efficiency purposes, but since the values we are encrypting are relatively small, we did not feel this tradeoff was worth it for our use case. This is why we replaced the default to compress values before encryption with a flag that makes compression optional.

Migrating to a new encryption standard: the hard parts

This post illustrates some of the design decisions and tradeoffs we encountered when choosing ActiveRecord::Encryption, but it’s not quite enough information to guide developers of existing applications to start encrypting columns. In the next post in this series we’ll show you how we handled the hard parts—how to upgrade existing columns in your application from plaintext or possibly another encryption standard.

Serverless and Application Integration sessions at AWS re:Invent 2022

Post Syndicated from James Beswick original https://aws.amazon.com/blogs/compute/serverless-and-application-integration-sessions-at-aws-reinvent-2022/

This post is written by Josh Kahn, Tech Leader, AWS Serverless.

AWS re:Invent 2022 is only a few weeks away, featuring an exciting slate of sessions on Serverless and Application Integration. This post highlights many of the sessions we are hosting on Serverless and Application Integration. It groups sessions by theme to help you quickly find the sessions most interesting to you.

AWS re:Invent 2022

As in past years, the conference offers a variety of session formats:

  • Breakout sessions: lecture-style presentations delivered by AWS experts, builders, and customers.
  • Builder’s sessions: smaller sessions led by AWS experts during which you will build a project on your own laptop.
  • Chalk talks: interactive sessions led by experts on a variety of topics. Share your own experiences and feedback.
  • Workshops: hands-on learning sessions designed to help you learn about new technologies. Bring your own laptop.

For detailed descriptions and schedule, visit the AWS re:Invent Session Catalog. If you are attending re:Invent, we would love to connect at our AWS Village and Serverlesspresso booths in the Expo or the Modern Applications Zone at the Venetian. You can also reach out to your AWS account team.

Don’t have a ticket yet? Join us in Las Vegas from November 28-December 2, 2022 by registering for re:Invent 2022.

Leadership session (SVS210)

Join Holly Mesrobian, Vice President of Serverless Compute at AWS, to learn how serverless technology empowers organizations to go to market faster while lowering cost across a wide range of applications. Learn about the innovations happening at all layers of the stack, across both serverless functions and serverless containers. Explore newly released innovations that enable more secure, reliable, and performant applications.

Getting started

Are you new to Serverless or taking your first steps? Hear from AWS experts and customers on best practices and strategies for building serverless workloads. Get hands-on with services by building the next great “to do” app or customer experience for a theme park:

We also offer a series of Builder’s Sessions where you can build the same serverless project using three different infrastructure as code frameworks (attend one or more). These sessions are an opportunity to test drive another IaC framework or understand how your framework of choice can be used with serverless:

Event-driven architectures

Event-driven architectures (EDA) are a popular approach to building modern applications. EDA utilizes events (a change in state) to communicate between decoupled services. This architectural approach lends itself well to a wide-variety of use cases from ecommerce to order fulfillment with individual components able to scale (and fail) independently.

Whether you are getting started with EDA, want to get hands-on, or dive into complex architectures, there is a session for you:

Building serverless architectures

Explore the range of tools available to build serverless architectures and cross-cutting concerns, such as security and observability. These sessions cover the brass tacks of building with serverless, going to beyond “hello world” to help builders understand how to implement a serverless strategy:

Orchestration

AWS offers several options to orchestrate complex workflows. Whether you need to tightly control data processing workflows or user sign-ups, you can take advantage of these orchestration engines to simplify, become more agile, and modernize your workflows.

Integration patterns

Explore the variety of enterprise integration patterns available using AWS, including Amazon SNS, Amazon SQS, Amazon MQ, and more. These sessions explore the wide variety of patterns available using managed services:

Advanced topics

If you are already familiar with serverless, advanced sessions provide an opportunity to go deeper, including under the hood of the AWS Lambda service. Learn advanced design patterns, best practices, and how to build performant, reliable workloads:

Building serverless applications with Java

New this year, there are several sessions dedicating to building serverless applications with the Java runtime. These sessions dive deep on best practices for building performant Java-based applications:

Other talks

Serverless has become such a popular topic that you will also find related sessions in other tracks as well. This list is not exhaustive, but includes talks that you may want to explore:

If you are unable to join us in-person, Breakout Sessions will be available via our YouTube channel after the event. Contact your AWS Account Team is you are interested in learning more about any of these sessions or how to bring our experts to you.

We look forward to seeing you at re:Invent 2022! For more serverless learning resources, visit Serverless Land.

Verify the resilience of your workloads using Chaos Engineering

Post Syndicated from Seth Eliot original https://aws.amazon.com/blogs/architecture/verify-the-resilience-of-your-workloads-using-chaos-engineering/

The following is an early preview of new guidance to be published as part of updates to the AWS Well-Architected content:

Chaos Engineering enables us to find shortcomings before our customers find them and therefore, provides us with the opportunity to create a better customer experience. Chaos Engineering does not introduce chaos into your systems, instead, it finds the chaos that is already there. By definition, chaos experiments should be fail-safe and tolerated by the system. It is therefore key that you use tools that allow for controlled experiments. A controlled experiment has a clear scope of impact, built in rollback mechanisms, and tight integration with monitoring that provides deep insights to the impact of the experiment in real-time. Chaos Engineering allows you to inject real-world cloud provider faults that give you insights on what you need to improve in regards to observability, incident response, and architecture to be resilient against faults that you cannot predict. To help you with this journey, we have adjusted our guidance in the Well-Architected Reliability Pillar, enabling you to build more robust and resilient workloads on AWS.


Well-Architected Reliability best practice: verify the resilience of your workloads using Chaos Engineering

Chaos Engineering provides your teams with capabilities to continuously inject real world disruptions (simulations) in a controlled way at the service provider, infrastructure, workload, and component levels, with minimal to no impact to your customers. It allows your teams to learn from faults and observe, measure, and improve the resilience of your workloads, as well as validate that alerts fire and teams get notified in the case of an event. When run continuously, Chaos Engineering can highlight deficiencies in your workloads that, if left unaddressed, could negatively affect availability and operation.

Chaos Engineering is the discipline of experimenting on a system in order to build confidence in the system’s capability to withstand turbulent conditions in production. – Principles of Chaos Engineering

If a system is able to withstand these disruptions, the chaos experiment should be maintained as an automated regression test. In this way, chaos experiments should be run as part of your software development lifecycle (SDLC) and as part of your CI/CD pipeline.

To ensure that your workload can survive component failure, inject real-world events as part of your experiments. For example, experiment with the loss of EC2 instances or failover of the primary Amazon RDS database instance, and verify that your workload is not impacted (or only minimally impacted). Use a combination of component faults to simulate events that may be caused by a disruption in an Availability Zone.

For application-level faults (such as crashes), you can start with stressors such as memory and CPU exhaustion.

To validate fallback or failover mechanisms for external dependencies due to intermittent network disruptions, your components should simulate such an event by blocking access to the third-party providers for a specified duration that might last from seconds to hours.

Other modes of degradation might cause reduced functionality and slow responses, often resulting in a disruption of your services. Common sources of this type of degradation are increased latency on critical services and unreliable network communication (dropped packets). Experiments with these faults, including networking effects such as latency, dropped messages, and DNS failures, could include the inability to resolve a name, reach the DNS service, or establish connections to dependent services.

Chaos Engineering tools

AWS Fault Injection Simulator (AWS FIS) is a fully managed service for running fault injection experiments that can be used as part of your CD pipeline, or outside of the pipeline. AWS FIS is a good choice to use during Chaos Engineering game days. It supports simultaneously introducing faults across different types of resources including Amazon EC2, Amazon ECS, Amazon EKS, and Amazon RDS. These faults include termination of resources, forcing failovers, stressing CPU or memory, throttling, latency, and packet loss. Since it is integrated with Amazon CloudWatch alarms, you can set up stop conditions as guardrails to rollback an experiment if it causes an unexpected impact (Figure 1).

AWS Fault Injection Simulator integrates with AWS resources to enable you to run fault injection experiments for your workloads

Figure 1. AWS Fault Injection Simulator integrates with AWS resources to enable you to run fault injection experiments for your workloads

To expand the scope of faults that can be injected on AWS, AWS FIS integrates with Chaos Mesh and Litmus Chaos, enabling you to coordinate fault injection workflows among multiple tools. For example, you can run a stress test on a pod’s CPU using Chaos Mesh or Litmus faults while terminating a randomly selected percentage of cluster nodes using AWS FIS fault actions.

Implementation steps

1. Determine which faults to use for experiments

Assess the design of your workload for resiliency. Such designs (created using the best practices of the Well-Architected Framework) consider risks based on critical dependencies, past events, known issues, and compliance requirements. List each element of the design intended to maintain resilience and the faults it is designed to mitigate. For more information about creating such lists, see the Operational Readiness Review whitepaper, which guides you on how to create a process to prevent reoccurrence of previous incidents. The Failure Modes & Effects Analysis (FMEA) process provides a framework for performing a component-level analysis of failures and how they impact your workload. FMEA is outlined in more detail in Failure Modes and Continuous Resilience by Adrian Cockcroft.

2. Assign a priority to each fault

To assess priority, consider the frequency of the fault and the impact of failure to the overall workload. It is fine to start with a coarse categorization, such as high, medium, or low, and refine it.

When considering frequency of a given fault, analyze past data for this workload when available. If not available, use data from other workloads running in a similar environment.

When considering impact of a given fault, the larger the scope of the fault, generally the larger the impact. Also consider the workload design and purpose. For example, the ability to access the source data stores is critical for a workload doing data transformation and analysis. In this case, you would prioritize experiments for access faults, as well as throttled access and latency insertion.

Post-incident analyses are a good source of data to understand both frequency and impact of failure modes.

Use the assigned priority to determine which faults to experiment with first and the order with which to develop new fault injection experiments.

3. For each experiment that you will execute, follow the Chaos Engineering/continuous resilience flywheel (Figure 2)

Chaos Engineering/continuous resilience flywheel, using the scientific method by Adrian Hornsby

Figure 2. Chaos Engineering/continuous resilience flywheel, using the scientific method by Adrian Hornsby

3A. Define steady state as some measurable output of a workload that indicates normal behavior

Your workload exhibits steady state if it is operating reliably and as expected. Therefore, validate that your workload is healthy before defining steady state. Steady state does not necessarily mean that there is no impact to the workload when a fault occurs, as a certain percentage in faults could be within acceptable limits. The steady state is your baseline that you will observe during the experiment, which will highlight anomalies if your hypothesis defined in the next step does not turn out as expected.

For example, a steady state of a payments system can be defined as the processing of 300 transactions per second (TPS) with a 99% success rate and round-trip time of 500 ms.

3B. Form a hypothesis about how the workload will react to the fault

A good hypothesis is based on how the workload is expected to mitigate the fault to maintain the steady state. The hypothesis states that given the fault of a specific type, the system or workload will continue steady state, because the workload was designed with specific mitigations. The specific type of fault and mitigations should be specified in the hypothesis.

The following template can be used for the hypothesis (but other wording is also acceptable):

If [specific fault] occurs the [workload name] workload will [describe mitigating controls] to maintain [business or technical metric].

For example:

  • If 20% of the nodes in the EKS node-group are taken down, the Transaction Create API continues to serve the 99th percentile of requests in under 100 ms (steady state). The EKS nodes will recover within five minutes, and pods will get scheduled and process traffic within eight minutes after the initiation of the experiment. Alerts will fire within three minutes.
  • If a single EC2 instance failure occurs, the order system’s Elastic Load Balancer (ELB) health check will cause the ELB to only send requests to the remaining healthy instances while the EC2 Auto scaling replaces the failed instance, maintaining a less than 0.01% increase in server-side (5xx) errors (steady state).
  • If the primary RDS database instance fails, the supply chain data collection workload will failover and connect to the standby RDS database instance to maintain less than one minute of database read/write errors (steady state).

3C. Run the experiment by injecting the fault

An experiment should, by default, be fail-safe and tolerated by the workload. If you know that the workload will fail, do not run the experiment. Chaos Engineering should be used to find known-unknowns or unknown-unknowns. Known-unknowns are things you are aware of but don’t fully understand, and unknown-unknowns are things you are neither aware of nor fully understand. Experimenting against a workload that you know is broken won’t provide you with new insights. Your experiment should be carefully planned, have a clear scope of impact, and provide a roll back mechanism that can be run in case of unexpected turbulence. If your due diligence shows that your workload should survive the experiment, move forward with running the experiment. There are several options for injecting the faults. For workloads on AWS, AWS FIS provides many pre-defined fault simulations called actions. You can also define custom actions that run in AWS FIS using AWS Systems Manager documents.

We discourage the use of custom scripts for chaos experiments, unless the scripts have the capabilities to understand current state of the workload, are able to emit logs, and provide mechanisms for roll backs and stop conditions where possible.

An effective framework or toolset that supports Chaos Engineering should track the current state of an experiment, emit logs, and provide rollback mechanisms, to support the controlled running of an experiment. Start with an established service like AWS FIS that allows you to run experiments with a clearly defined scope and safety mechanisms that rollback the experiment if the experiment introduces unexpected turbulence. To learn about a wider variety of experiments using AWS FIS, see the Resilient and Well-Architected Apps with Chaos Engineering lab. Also, AWS Resilience Hub will analyze your workload and create experiments that you can choose to implement and run in AWS FIS.

For every experiment, clearly understand its scope and its impact. We recommend that faults should be simulated first on a non-production environment before being run in production.

It is ideal to ultimately run in production under real-world load via canary deployments that spin up both a control and experimental system deployment, where feasible. Running experiments during off-peak times is a good practice to mitigate potential impact when first experimenting in production. Also, if using actual customer traffic poses too much risk, you can run experiments using synthetic traffic on production infrastructure against the control and experimental deployments. When using production is not possible, run experiments in pre-production environments that are as close to production as possible.

You must establish and monitor guardrails to ensure that the experiment does not impact production traffic or other systems beyond acceptable limits. Establish stop conditions to stop an experiment if it reaches a threshold on a guardrail metric that you define. This should include the metrics for steady state for the workload, as well as the metric against the components into which you’re injecting the fault. A synthetic monitor (also known as a “user canary”) is one metric you should usually include as a user proxy. Stop conditions for AWS FIS are supported as part of the experiment template, enabling up to five stop-conditions per template.

One of the Principles of Chaos Engineering is to minimize the scope of the experiment and its impact, specifically “While there must be an allowance for some short-term negative impact, it is the responsibility and obligation of the Chaos Engineer to ensure the fallout from experiments are minimized and contained”. A method to verify the scope and potential impact is to run the experiment in a non-production environment first, verifying that thresholds for stop conditions occur as expected during an experiment and observability is in place to catch an exception, instead of directly experimenting in production.

When running fault injection experiments, verify that all responsible parties are well informed. Communicate with appropriate teams, such as the operations teams, service reliability teams, and customer support, to let them know when experiments will be run and what to expect. Give these teams communication tools to inform those running the experiment if they see any adverse effects.

You must restore the workload and its underlying systems back to the original known-good state. Often, the resilient design of the workload will self-heal. But some fault designs or failed experiments can leave your workload in an unexpected failed state. By the end of the experiment, you must be aware of this and restore the workload and systems. With AWS FIS, you can set a rollback configuration (also called a post action) within the action parameters. A post action returns the target to the state that it was in before the action was run. Whether automated (such as using AWS FIS) or manual, these post actions should be part of a playbook that describes how to detect and handle failures.

3D. Verify the hypothesis

The Principles of Chaos Engineering gives this guidance on how to verify steady state of your workload: “Focus on the measurable output of a system, rather than internal attributes of the system. Measurements of that output over a short period of time constitute a proxy for the system’s steady state. The overall system’s throughput, error rates, latency percentiles, etc. could all be metrics of interest representing steady state behavior. By focusing on systemic behavior patterns during experiments, Chaos verifies that the system does work, rather than trying to validate how it works.”

In our two examples from Step 3B, we include the steady state metrics:

  • Less than 0.01% increase in server-side (5xx) errors
  • Less than 1 minute of database read/write errors

The 5xx errors are a good metric because they are a consequence of the failure mode that a client of the workload will experience directly. The database errors measurement is good as a direct consequence of the fault, but should also be supplemented with a client impact measurement such as failed customer requests or errors surfaced to the client. Additionally, include a synthetic monitor (also known as a “user canary”) on any APIs or URIs directly accessed by the client of your workload.

3E. Improve the workload design for resilience

If steady state was not maintained, then investigate how the workload design can be improved to mitigate the fault, applying the best practices of the AWS Well-Architected Reliability Pillar. Additional guidance and resources can be found in the AWS Builder’s Library, which hosts articles about how to improve your health checks and employ retries with backoff in your application code, among others.

After these changes have been implemented, run the experiment again (shown by the dotted line in Figure 2) to determine their effectiveness. If the verify step indicates the hypothesis holds true, then the workload will be in steady state, and the cycle in Figure 2 continues.

4. Run experiments regularly

A chaos experiment is a cycle, and experiments should be run regularly as part of Chaos Engineering. After a workload meets the experiment’s hypothesis, the experiment should be automated to run continuously as a regression part of your CI/CD pipeline. To learn how to do this, explore this blog on how to run AWS FIS experiments using AWS CodePipeline. This lab on recurrent AWS FIS experiments in a CI/CD pipeline enables you to work hands-on with this.

Fault injection experiments are also a part of game days. Game days simulate a failure or event to verify systems, processes, and team responses. The purpose of game days is to actually perform the actions that the team would perform as if an exceptional event happened.

5. Capture and store experiment results

Results for fault injection experiments must be captured and persisted. Include all necessary data necessary (such as time, workload, and conditions) to be able to later analyze experiment results and trends. Examples of results might include screenshots of dashboards, CSV dumps from your metrics database, or a hand-recorded record of events and observations from the experiment. Experiment logging with AWS FIS can be part of this data capture.


This blog post gives early access to the updated implementation guidance on Chaos Engineering we are publishing as part of updates to the AWS Well-Architected content. Using the implementation steps described in this post, you can begin using Chaos Engineering to verify the resilience of your workloads.
Australia Increases Fines for Massive Data Breaches

Post Syndicated from Bruce Schneier original https://www.schneier.com/blog/archives/2022/10/australia-increases-fines-for-massive-data-breaches.html

After suffering two large, and embarrassing, data breaches in recent weeks, the Australian government increased the fine for serious data breaches from $2.2 million to a minimum of $50 million. (That’s $50 million AUD, or $32 million USD.)

This is a welcome change. The problem is one of incentives, and Australia has now increased the incentive for companies to secure the personal data or their users and customers.

Сборник с ученически разкази от цяла Европа дописва историята на Холокоста

Post Syndicated from original https://bivol.bg/%D1%81%D0%B1%D0%BE%D1%80%D0%BD%D0%B8%D0%BA-%D1%81-%D1%83%D1%87%D0%B5%D0%BD%D0%B8%D1%87%D0%B5%D1%81%D0%BA%D0%B8-%D1%80%D0%B0%D0%B7%D0%BA%D0%B0%D0%B7%D0%B8-%D0%BE%D1%82-%D1%86%D1%8F%D0%BB%D0%B0-%D0%B5.html

сряда 26 октомври 2022


Излезе от печат сборникът „Необикновени постъпки на обикновени хора” с разкази, получили награди на Деветия международен литературен ученически конкурс „Който спаси един човешки живот, спасява цяла вселена”, организиран от Център…

Partial Cloudflare outage on October 25, 2022

Post Syndicated from John Graham-Cumming original https://blog.cloudflare.com/partial-cloudflare-outage-on-october-25-2022/

Partial Cloudflare outage on October 25, 2022

Partial Cloudflare outage on October 25, 2022

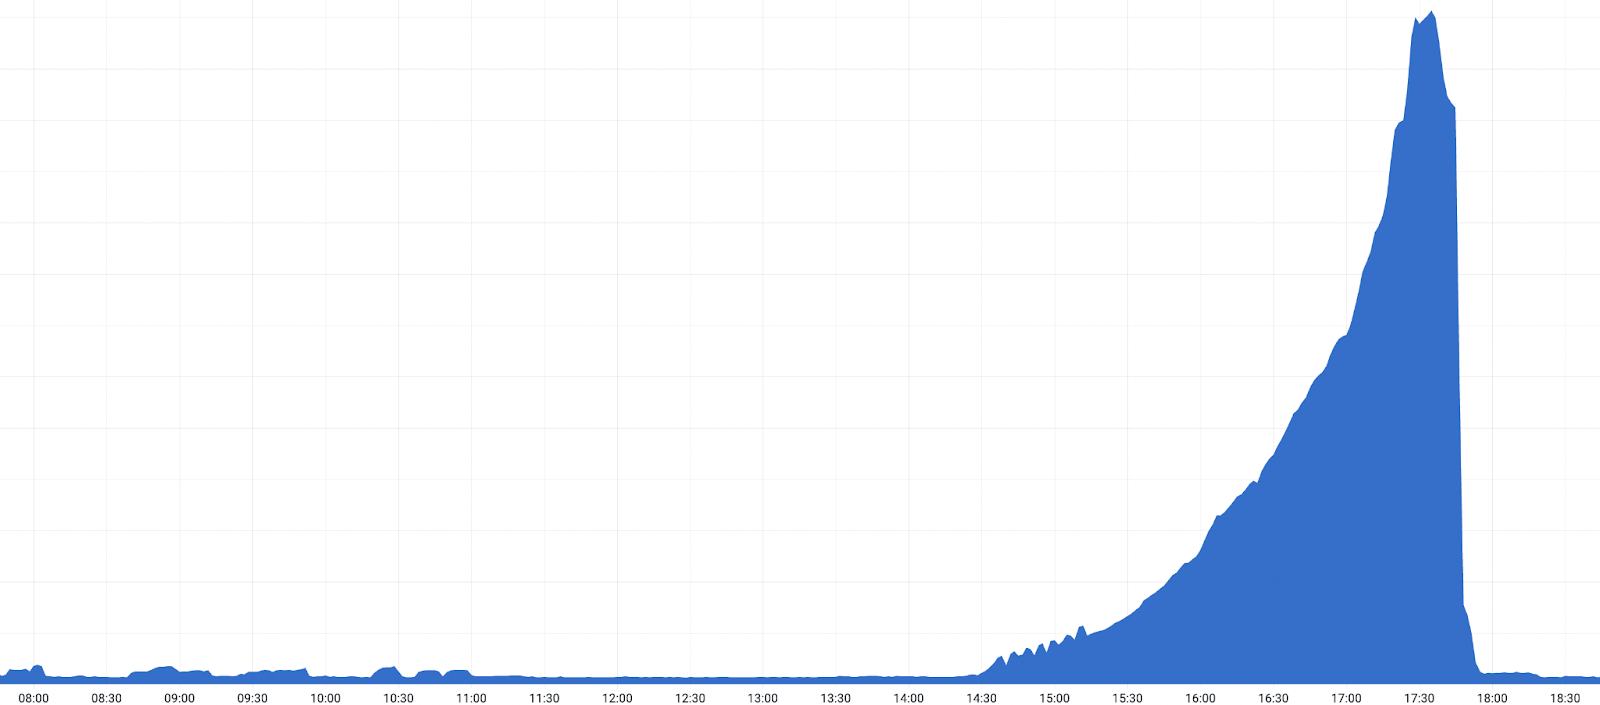
Today, a change to our Tiered Cache system caused some requests to fail for users with status code 530. The impact lasted for almost six hours in total. We estimate that about 5% of all requests failed at peak. Because of the complexity of our system and a blind spot in our tests, we did not spot this when the change was released to our test environment.  

The failures were caused by side effects of how we handle cacheable requests across locations. At first glance, the errors looked like they were caused by a different system that had started a release some time before. It took our teams a number of tries to identify exactly what was causing the problems. Once identified we expedited a rollback which completed in 87 minutes.

We’re sorry, and we’re taking steps to make sure this does not happen again.

Background

One of Cloudflare’s products is our Content Delivery Network, or CDN. This is used to cache assets for websites globally. However, a data center is not guaranteed to have an asset cached. It could be new, expired, or has been purged. If that happens, and a user requests that asset, our CDN needs to retrieve a fresh copy from a website’s origin server. But the data center that the user is accessing might still be pretty far away from the origin server. This presents an additional issue for customers: every time an asset is not cached in the data center, we need to retrieve a new copy from the origin server.

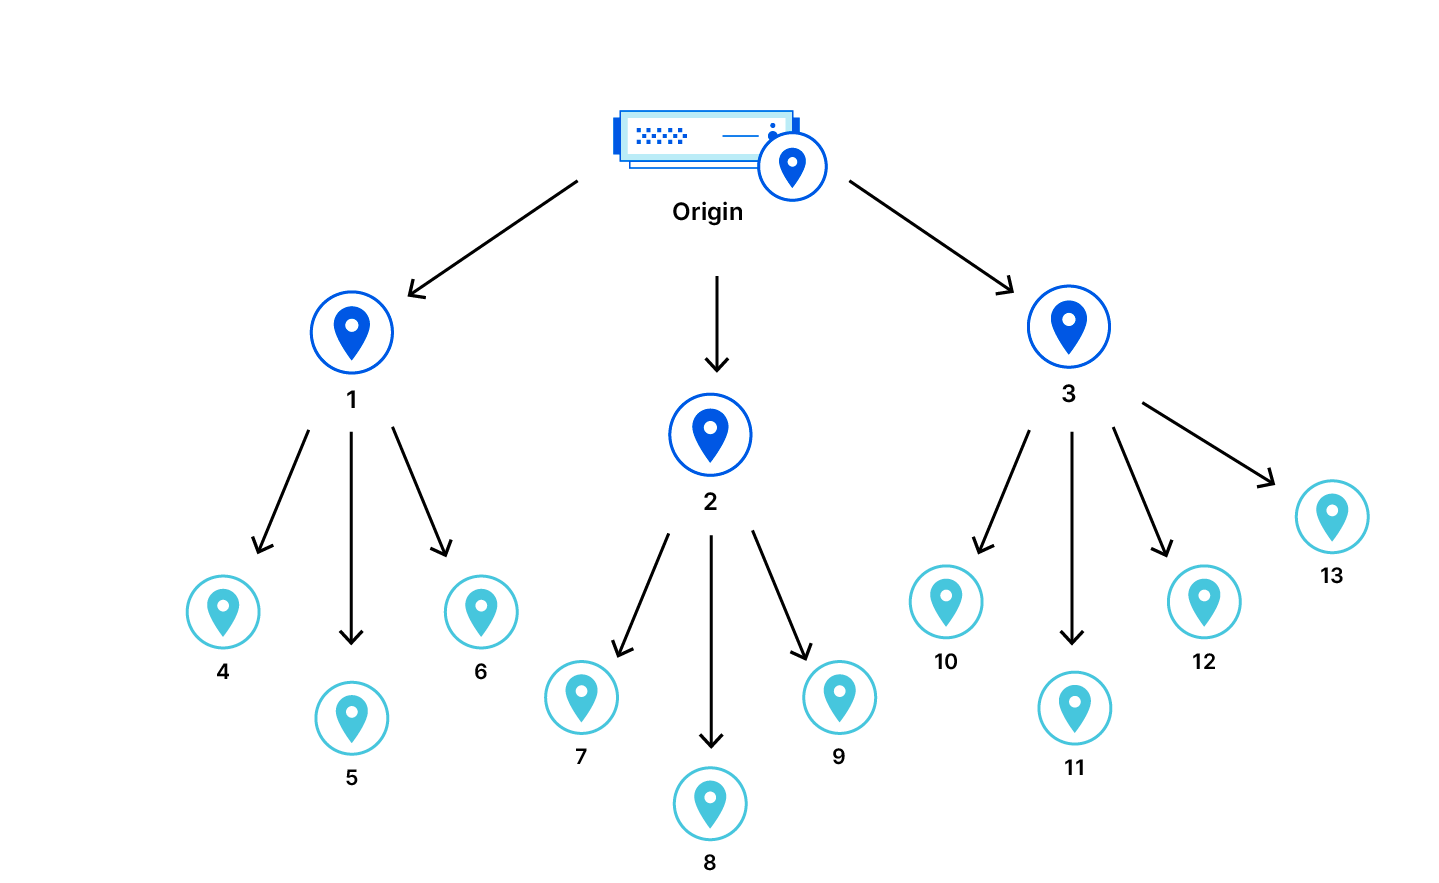
To improve cache hit ratios, we introduced Tiered Cache. With Tiered Cache, we organize our data centers in the CDN into a hierarchy of “lower tiers” which are closer to the end users and “upper tiers” that are closer to the origin. When a cache-miss occurs in a lower tier, the upper tier is checked. If the upper tier has a fresh copy of the asset, we can serve that in response to the request. This improves performance and reduces the amount of times that Cloudflare has to reach out to an origin server to retrieve assets that are not cached in lower tier data centers.

Partial Cloudflare outage on October 25, 2022

Incident timeline and impact

At 08:40 UTC, a software release of a CDN component containing a bug began slowly rolling out. The bug was triggered when a user visited a site with either Tiered Cache, Cloudflare Images, or Bandwidth Alliance configured. This bug caused a subset of those customers to return HTTP Status Code 530 — an error. Content that could be served directly from a data center’s local cache was unaffected.

We started an investigation after receiving customer reports of an intermittent increase in 530s after the faulty component was released to a subset of data centers.

Once the release started rolling out globally to the remaining data centers, a sharp increase in 530s triggered alerts along with more customer reports, and an incident was declared.

Partial Cloudflare outage on October 25, 2022
Requests resulting in a response with status code 530

We confirmed a bad release was responsible by rolling back the release in a data center at 17:03 UTC. After the rollback, we observed a drop in 530 errors. After this confirmation, an accelerated global rollback began and the 530s started to decrease. Impact ended once the release was reverted in all data centers configured as Tiered Cache upper tiers at 18:04 UTC.

Timeline:

  • 2022-10-25 08:40: The release started to roll out to a small subset of data centers.
  • 2022-10-25 10:35: An individual customer alert fires, indicating an increase in 500 error codes.
  • 2022-10-25 11:20: After an investigation, a single small data center is pinpointed as the source of the issue and removed from production while teams investigate the issue there.
  • 2022-10-25 12:30: Issue begins spreading more broadly as more data centers get the code changes.
  • 2022-10-25 14:22: 530s errors increase as the release starts to slowly roll out to our largest data centers.
  • 2022-10-25 14:39: Multiple teams become involved in the investigation as more customers start reporting increases in errors.
  • 2022-10-25 17:03: CDN Release is rolled back in Atlanta and root cause is confirmed.
  • 2022-10-25 17:28: Peak impact with approximately 5% of all HTTP requests resulting in an error with status code 530.
  • 2022-10-25 17:38: An accelerated rollback continues with large data centers acting as Upper tier for many customers.
  • 2022-10-25 18:04: Rollback is complete in all Upper Tiers.
  • 2022-10-25 18:30: Rollback is complete.

During the early phases of the investigation, the indicators were that this was a problem with our internal DNS system that also had a release rolling out at the same time. As the following section shows, that was a side effect rather than the cause of the outage.  

Adding distributed tracing to Tiered Cache introduced the problem

In order to help improve our performance, we routinely add monitoring code to various parts of our services. Monitoring code helps by giving us visibility into how various components are performing, allowing us to determine bottlenecks that we can improve on. Our team recently added additional distributed tracing to our Tiered Cache logic. The tiered cache entrypoint code is as follows:

* Before:

function _M.go()
   -- code to run here
end

* After:

local trace_fn = require("opentracing").trace_fn
local function go()
-- code to run here
end
function _M.go()
trace_fn(ngx.ctx, "tiered_cache_rewrite", go)
end

The code above wraps the existing go() function with trace_fn() which will call the go() function and then reports its execution time.

However, the logic that injects a function to the opentracing module clears control headers on every request:

require("opentracing").configure_module(conf,
-- control header extractor
function(ctx)
-- Always clear the headers.
clear_control_headers()

Normally, we extract data from these control headers before clearing them as a routine part of how we process requests.

But internal tiered cache traffic expects the control headers from the lower tier to be passed as-is. The combination of clearing headers and using an upper tier meant that information that might be critical to the routing of the request was not available. In the subset of requests affected, we were missing the hostname to resolve by our internal DNS lookup for origin server IP addresses. As a result, a 530 DNS error was returned to the client.

Remediation and follow-up steps

To prevent this from happening again, in addition to the fixing the bug, we have identified a set of changes that help us detect and prevent issues like this in the future:

  • Include a larger data center that is configured as a Tiered Cache upper tier in an earlier stage in the release plan. This will allow us to notice similar issues more quickly, before a global release.
  • Expand our acceptance test coverage to include a broader set of configurations, including various Tiered Cache topologies.
  • Alert more aggressively in situations where we do not have full context on requests, and need the extra host information in the control headers.
  • Ensure that our system correctly fails fast in an error like this, which would have helped identify the problem during development and test.

Conclusion

We experienced an incident that affected a significant set of customers using Tiered Cache. After identifying the faulty component, we were able to quickly rollback and remediate the issue. We are sorry for any disruption this has caused our customers and end users trying to access services.

Remediations to prevent such an incident from happening in the future will be put in place as soon as possible.

Poettering: Brave new trusted boot world

Post Syndicated from original https://lwn.net/Articles/912370/

Lennart Poettering has posted a
detailed specification
for a new approach to “trusted computing”
systems.

Central to the proposed design is the concept of a Unified Kernel
Image (UKI)
. These UKIs are the combination of a Linux kernel
image, and initrd, a UEFI boot stub program (and further resources,
see below) into one single UEFI PE file that can either be directly
invoked by the UEFI firmware (which is useful in particular in some
cloud/Confidential Computing environments) or through a boot loader
(which is generally useful to implement support for multiple kernel
versions, with interactive or automatic selection of image to boot
into, potentially with automatic fallback management to increase
robustness).

This work is evidently the first in a series that will come out of the
newly formed Linux Userspace API
Group
.

Hands-On IoT Hacking: Rapid7 at DEF CON 30 IoT Village, Pt. 2

Post Syndicated from Deral Heiland original https://blog.rapid7.com/2022/10/25/hands-on-iot-hacking-rapid7-at-def-con-30-iot-village-pt-2/

Hands-On IoT Hacking: Rapid7 at DEF CON 30 IoT Village, Pt. 2

Welcome back to our blog series on Rapid7’s IoT Village exercise from DEF CON 30. Last week, we covered the basics of the exercise and achieving access to flash memory. In this post, we’ll cover how to extract partition data.

Extracting partition data

The next step in our hands-on IoT hacking exercise is to identify the active partition and extract the filesystems for modification. The method I have used for this is to examine the file date stamps – the one with the most current date is likely the current active file system.

Note: Curious why there are multiple or duplicate filesystem partitions on an embedded device? Typically, with embedded device firmware, there are two of each partition, two kernel images, and two root file system images. This is so the device’s firmware can be updated safely and prevent the device from being bricked if an error or power outage occurs during the firmware update. The firmware update process updates the files on the offline partitions, and once that is completed properly, the boot process loads the new updated partitions as active and takes the old partitions offline. This way, if a failure occurs, the old unchanged partition can be reloaded, preventing the device from being bricked.

On this cable modem, we have 7 partitions. The key ones we want to work with are Partition 5, 6, 12, 13. This cable modem has two MCU:, an ARM and an ATOM processor. Partition 5 and 6 are root filesystems for the ARM processor, which is what we will be hacking. Partition 12 and 13 are for the root filesystems for the ATOM process, which controls the RF communication on the cable.

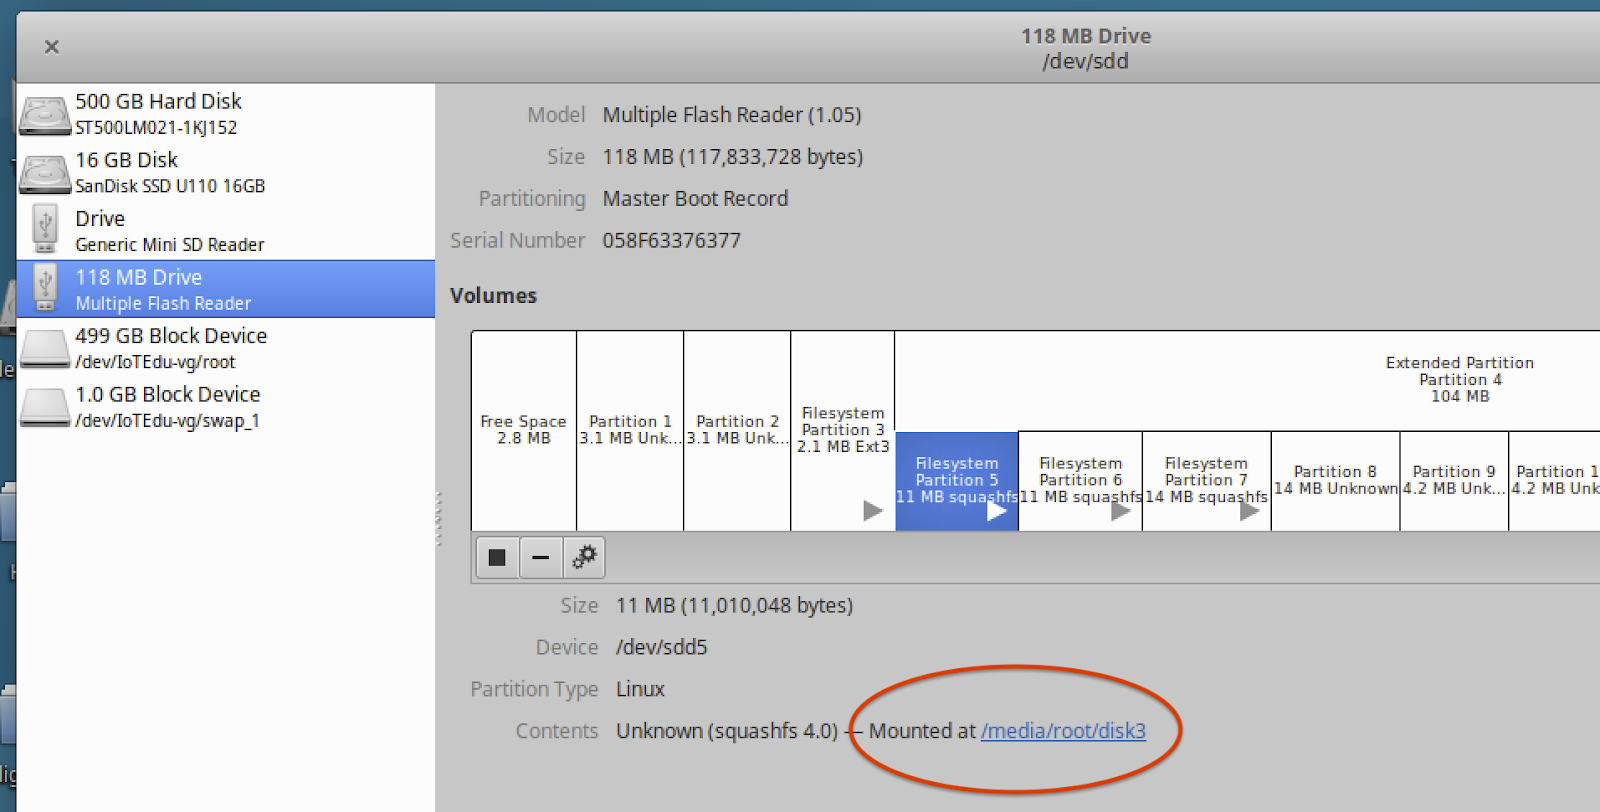
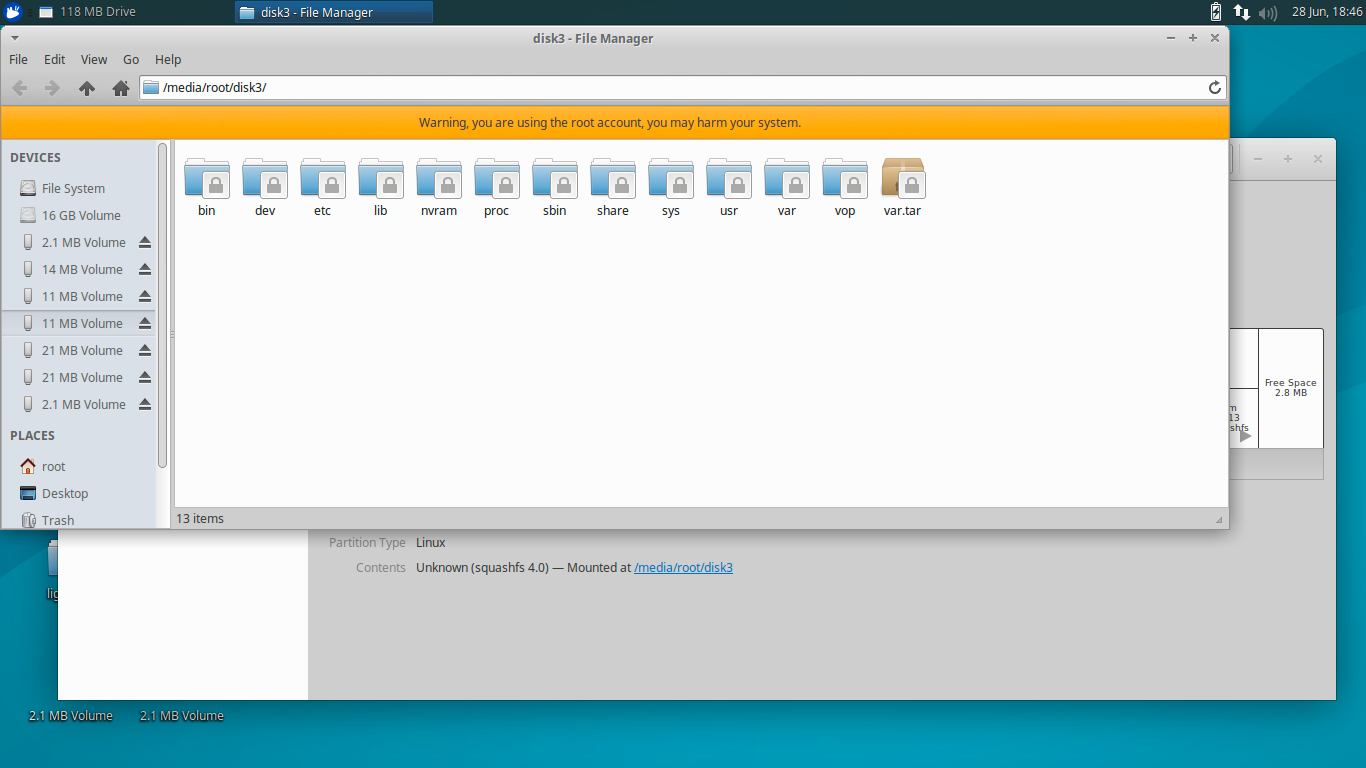
To ensure we alter the active partition, the first thing we need to do is check the date stamps on the mounted file systems to see whether partition 5 or partition 6 is the active partition. There are several ways to do this, but the method we use is to click on partition 5 or 6 in the Disks application to highlight it, and then click on the “Mounted at:” link as shown below in Figure 4 to open the mounted file partition shown in Figure 5:

Hands-On IoT Hacking: Rapid7 at DEF CON 30 IoT Village, Pt. 2

Figure 4: Partition File System Mount Locations

Hands-On IoT Hacking: Rapid7 at DEF CON 30 IoT Village, Pt. 2

Figure 5: Mounted File System Partition 5

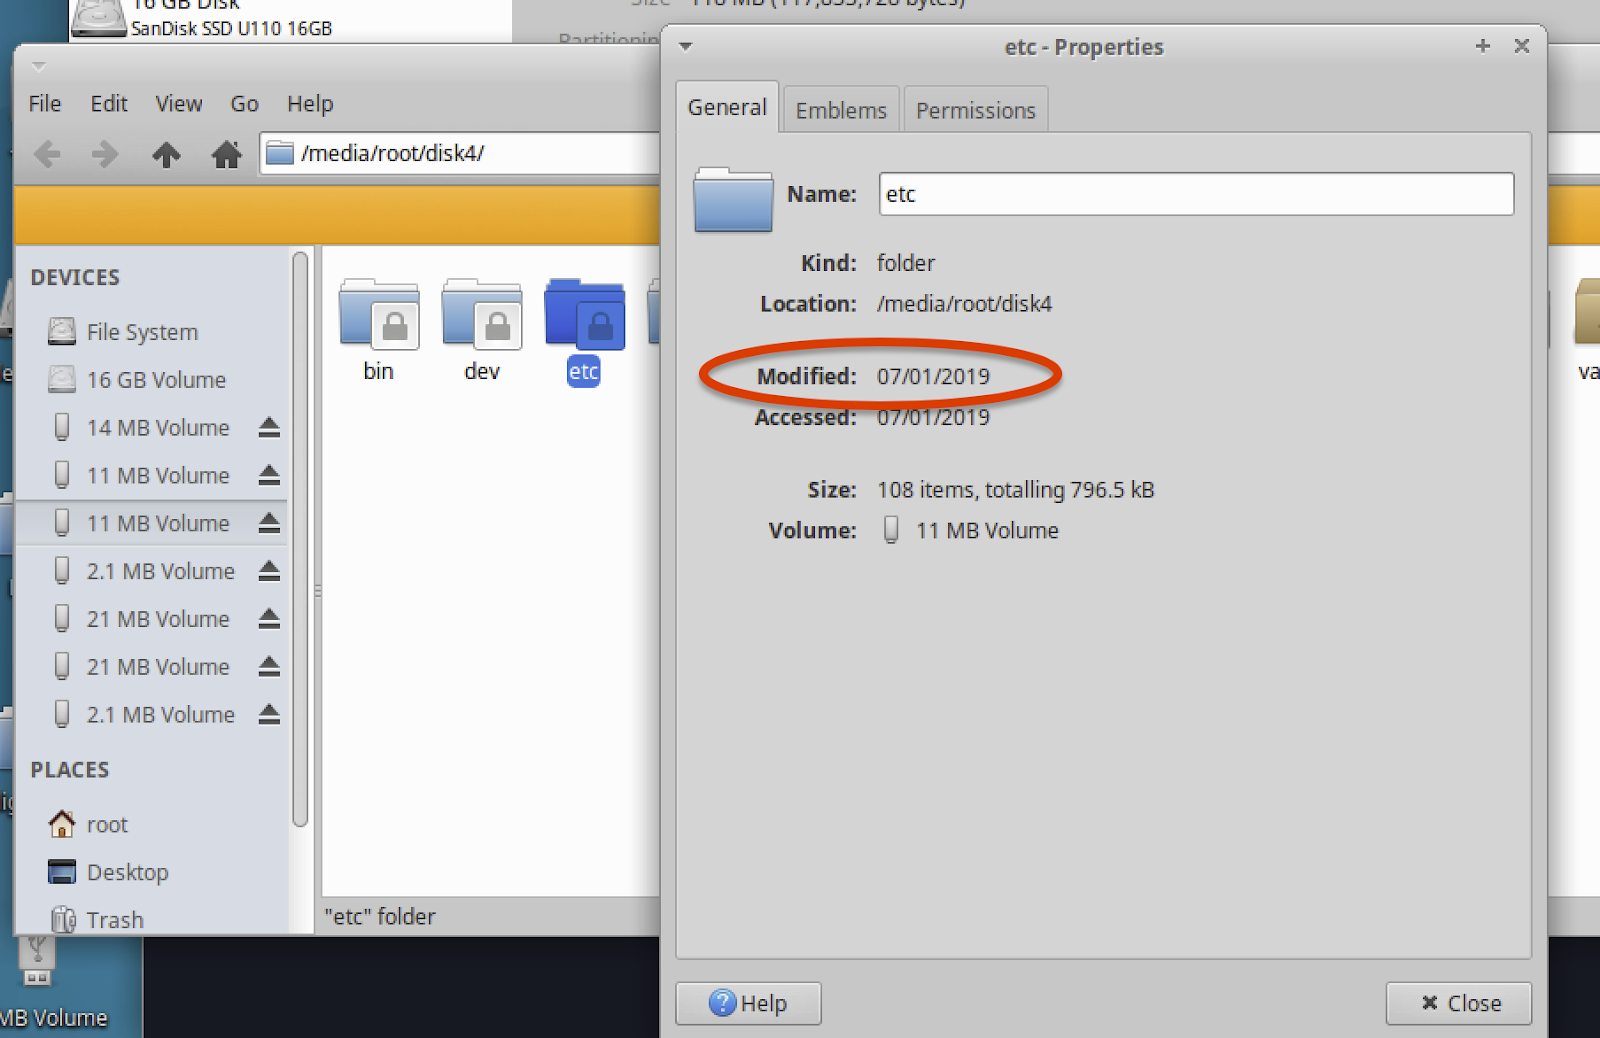
Once File Manager opens the folders, you can right click on the “etc” folder, select “Properties,” and check the date listed in “Modified:” as shown below in Figure 6:

Hands-On IoT Hacking: Rapid7 at DEF CON 30 IoT Village, Pt. 2

Figure 6: Folder Date Stamp

You will want to do this on both partitions 5 and 6 for the cable modem to identify the partition with the most current date stamp, as this is typically the active partition. For the example cable modems we used at DEF CON IoT Village, partition 5 was found to have the most current date stamp.

Extracting the active partition

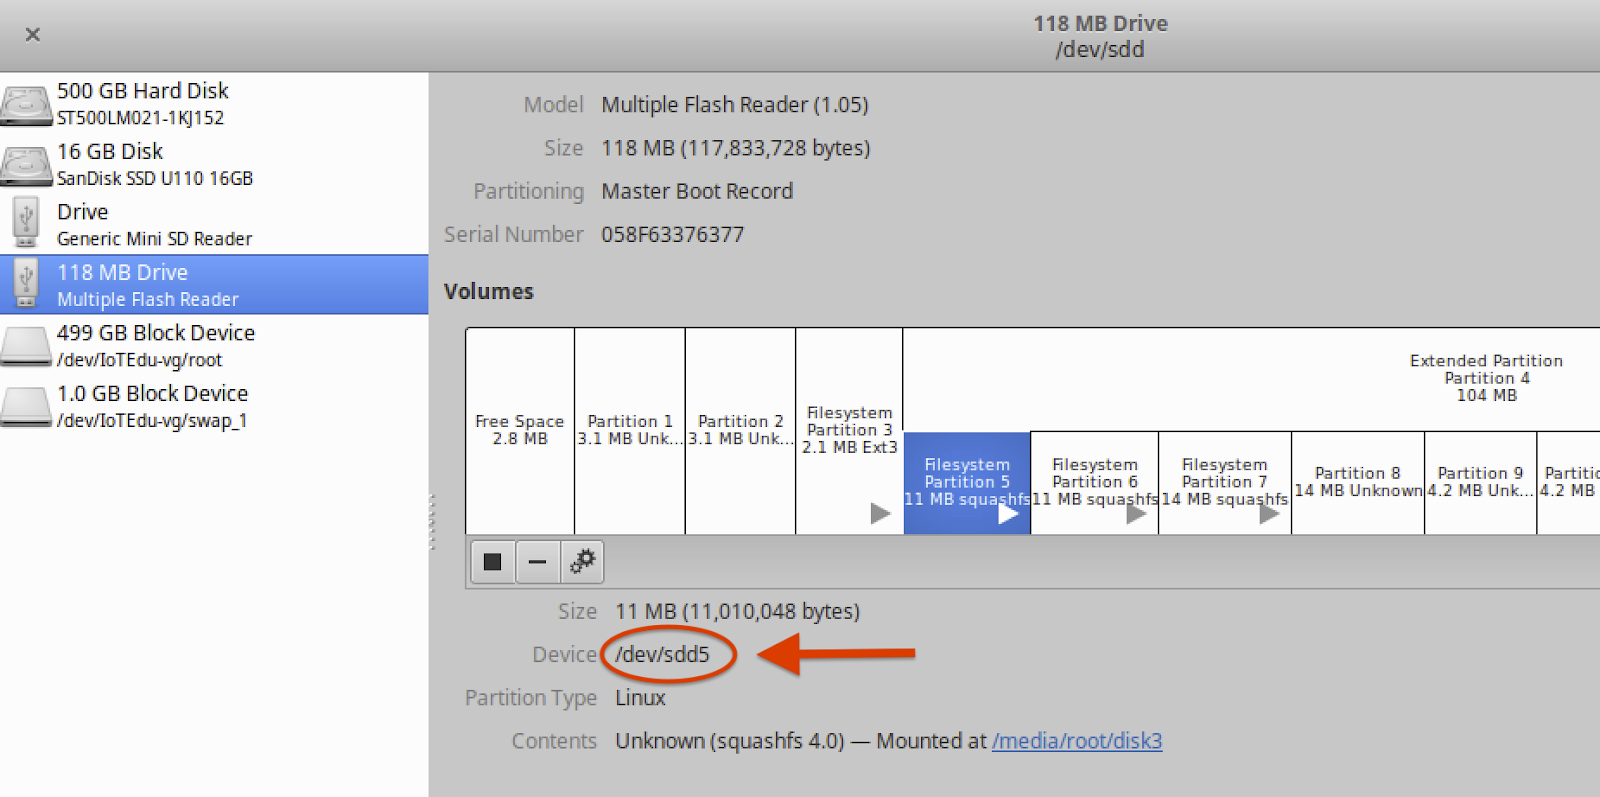
The next step is to extract the partition with the newest date stamp (Partition 5). To do this, we first need to identify which Small Computer System Interface (SCSI) disk partition 5 is attached to. This can be identified by selecting Partition 5 with the Disks application and then read the “Device:” as shown below in Figure 7:

Hands-On IoT Hacking: Rapid7 at DEF CON 30 IoT Village, Pt. 2

Figure 7: Device

Also remember to record the “Device:” information. You’ll need this during several of the future steps. In our example, we see that this is /dev/sdd5, as shown in Figure 7.

To extract the partition image, we launched the Terminal application on your Linux host to gain access to the command line interface (CLI). Once the CLI is opened, create a storage area to hold the partition binary and file system data. In our example, we created a folder for this called /Desktop/Work.

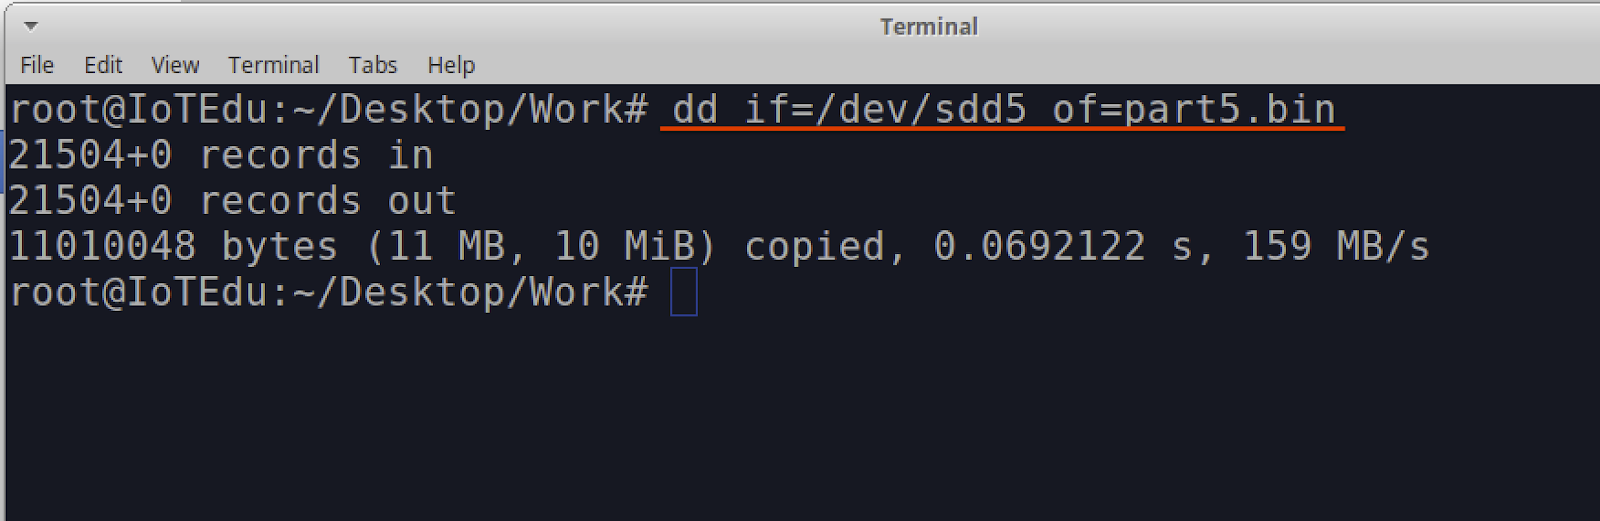
From CLI within the /Desktop/Work folder, we ran the Linux dd command to make a binary copy of Partition 5. We used the following command to make sure we used the device location that Partition 5 was connected to: /dev/sdd5. A sample output of this dd command is shown below in Figure 8:

  • dd command arguments:
    if=file Read input
    of=file Write output
  • dd if=/dev/sdd5 of=part5.bin
Hands-On IoT Hacking: Rapid7 at DEF CON 30 IoT Village, Pt. 2

Figure 8: dd Command

Note: Before proceeding, we highly recommend that you make a binary copy of the Cable Modem full NAND flash. This may come in handy if anything goes wrong and you need to return the device to its original operation mode. This can be done by running the following dd command against the full “Device:“. In this example that would be /dev/sdd

  • dd if=/dev/sdd of=Backup_Image.bin

Unsquashfs the partition binary

Next, we’ll extract the file system from the Partition 5 image that we dd’d from the cable modem in the previous steps. This file system was determined to be a Squash file system, a type commonly used on embedded devices.

Note: A Squash file system is a compressed read-only file system commonly found on embedded devices. Since the file system is read-only, it is not possible to make alteration of that files system while it is in place. To make modifications, the file system will need to be extracted from the device’s storage and uncompressed, which is what we’ll do in the following exercise steps.

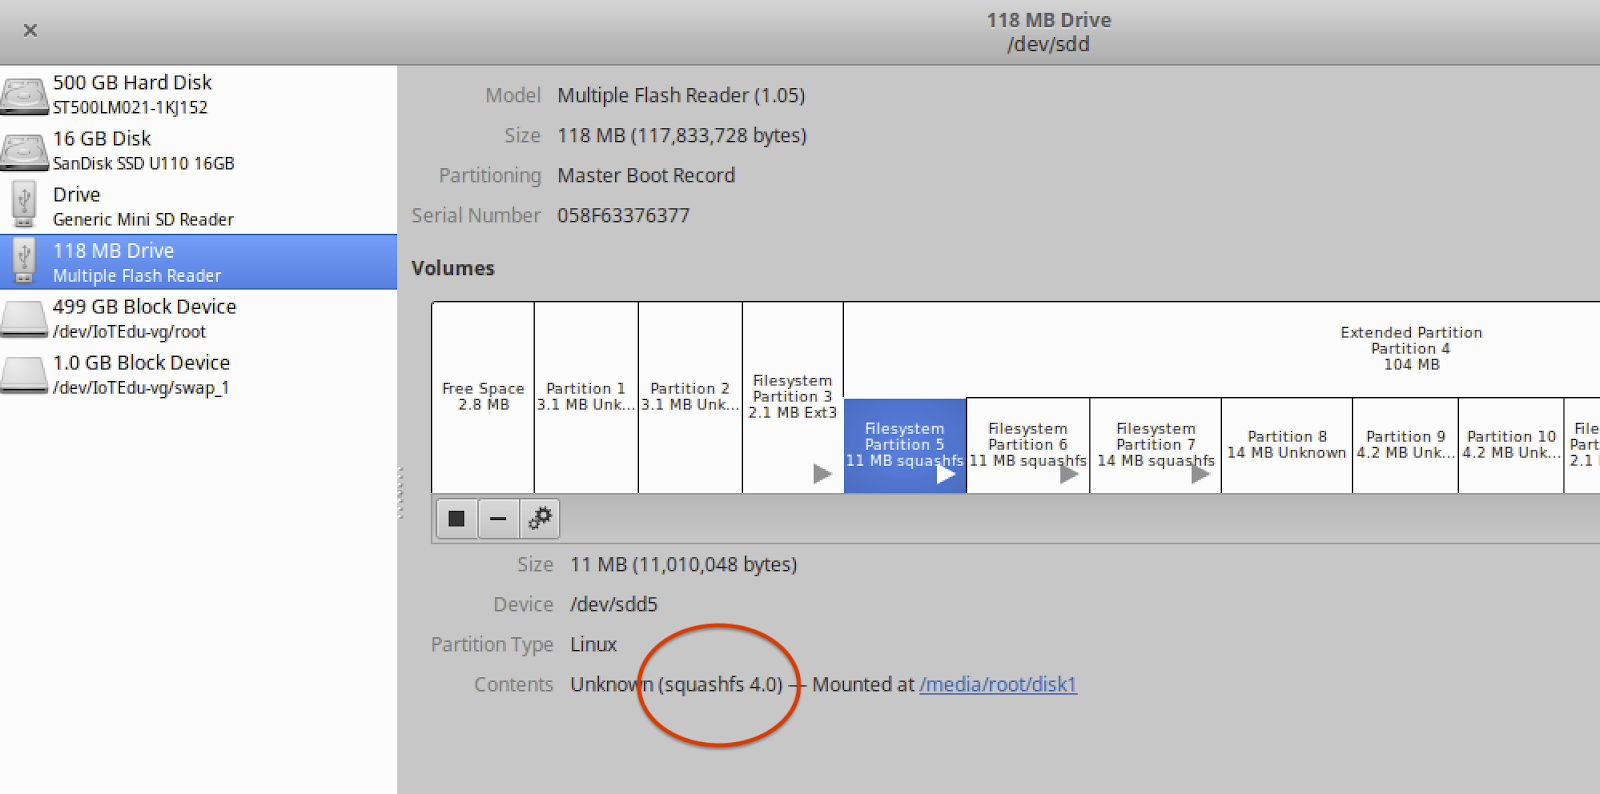
So, your first question may be, “How do we know that this is a squash file system?” If you look at the partition data in the application “disks”, you will see that “Content:” shows (squashfs 4.0)

Hands-On IoT Hacking: Rapid7 at DEF CON 30 IoT Village, Pt. 2

Another simple option to identify the content of the file is to run the file command against the binary file extracted from modem with the dd command and view the output. An example of this output is shown below in Figure 9:

  • file part5.bin
Hands-On IoT Hacking: Rapid7 at DEF CON 30 IoT Village, Pt. 2

Figure 9: Ouput from File Command

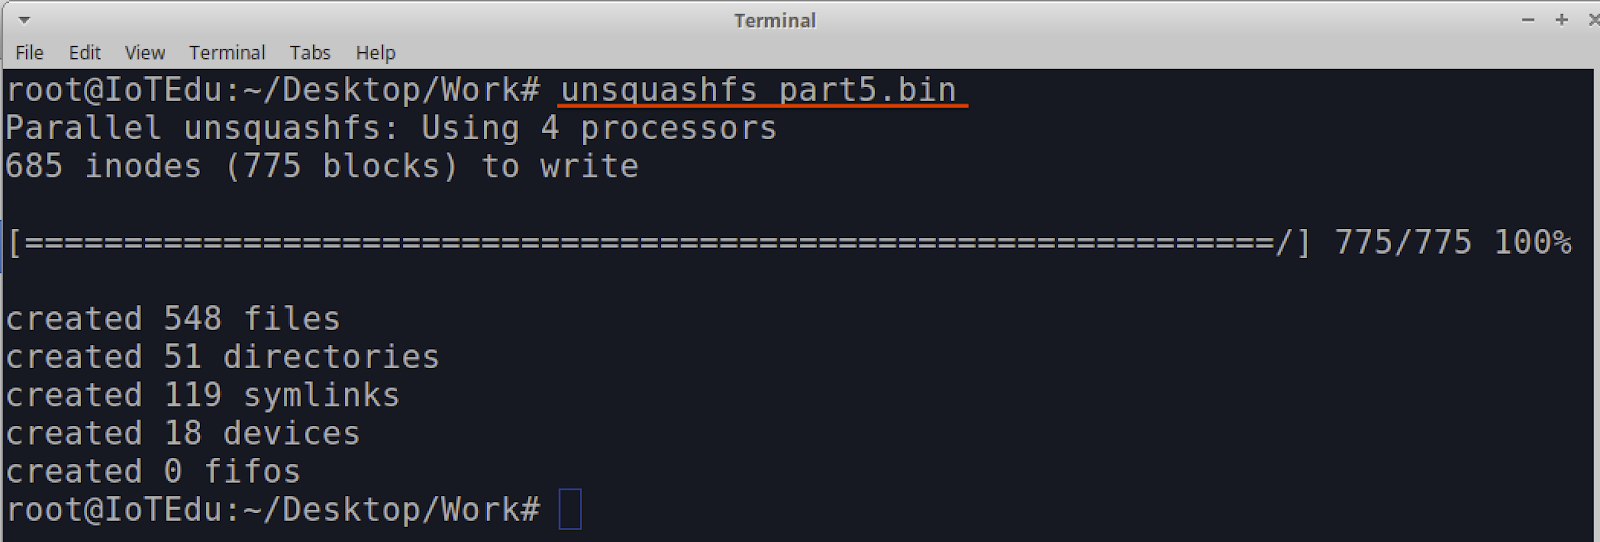
To gain access to the partition binary squash file system, we will be extracting/unpacking the squash file system using the unsquashfs command. A squash file system is read-only and cannot be altered in place – the only way to alter a squashfs is to unpack it first. This is a simple process and is done by running the unsquashfs command against the binary file part5.bin:

  • unsquashfs part5.bin
Hands-On IoT Hacking: Rapid7 at DEF CON 30 IoT Village, Pt. 2

Once the command completes you should now have a folder called “squashfs-root”. This folder contains the extracted embedded Linux root file systems for the cable modem.

In our next post, we’ll cover how to modify the data we just extracted. Check back with us next week!

[$] Accessing QEMU storage features without a VM

Post Syndicated from original https://lwn.net/Articles/911281/

The QEMU emulator has a sizable set of
storage features, including disk-image file formats like qcow2, snapshots,
incremental backup, and storage migration, which are available to virtual
machines. This software-defined storage functionality that is available
inside QEMU has not
been easily
accessible outside of it, however. Kevin Wolf and Stefano Garzarella
presented at
KVM Forum
2022 on the new qemu-storage-daemon program and the libblkio
library that make QEMU’s storage functionality available even when the goal
is not
to run a virtual machine (VM).

Security updates for Tuesday

Post Syndicated from original https://lwn.net/Articles/912324/

Security updates have been issued by Debian (libbluray and wkhtmltopdf), Fedora (firefox, libksba, libmodsecurity, libxml2, qemu, and xmlsec1), Red Hat (389-ds-base, 389-ds:1.4, git-lfs, gnutls, java-1.8.0-ibm, kernel, kernel-rt, kpatch-patch, libksba, mysql:8.0, pki-core, postgresql:12, samba, sqlite, and zlib), Scientific Linux (389-ds-base, libksba, and pki-core), SUSE (bluez, firefox, jdom, kernel, libosip2, libxml2, multipath-tools, and python-Mako), and Ubuntu (barbican, mysql-5.7, mysql-8.0, openvswitch, and pillow).

AWS Batch for Amazon Elastic Kubernetes Service

Post Syndicated from Steve Roberts original https://aws.amazon.com/blogs/aws/aws-batch-for-amazon-elastic-kubernetes-service/

Today I’m pleased to announce AWS Batch for Amazon Elastic Kubernetes Service (Amazon EKS). AWS Batch for Amazon EKS is ideal for customers who no longer want to shoulder the burden of configuring, fine-tuning, and managing Kubernetes clusters and pods to use with their batch processing workflows. Furthermore, there is no charge for this service. You only pay for the resources that your batch jobs launch.

When I’ve previously considered Kubernetes, it appeared to be focused on the management and hosting of microservice workloads. I was therefore surprised to discover that Kubernetes is also used by some customers to run large-scale, compute-intensive batch workloads. The differences between batch and microservice workloads mean that using Kubernetes for batch processing can be difficult and requires you to invest significant time in custom configuration and management to fine-tune a suitable solution.

Microservice and batch workloads on Kubernetes
Before we look further at AWS Batch for Amazon EKS, let’s consider some of the important differences between batch and microservice workloads to help set some context on why running batch workloads on Kubernetes can be difficult:

  • Microservice workloads are assumed to start and not stop—we expect them to be continuously available. In contrast, batch workloads run to completion and then exit—regardless of success or failure.
  • The results from a batch workload might not be available for several minutes—and sometimes hours or even days. Microservice workloads are expected to respond to requests within milliseconds.
  • We usually deploy microservice workloads across several Availability Zones to ensure high availability. This isn’t a requirement for batch workloads. Although we might distribute a batch job to allow it to process different input data in a distributed analysis, we more typically want to prioritize fast and optimal access to resources the job needs within the Availability Zone in which it is running.
  • Microservice and batch workloads scale differently. For microservices, scaling is generally predictable and usually linear as load increases (or decreases). With batch workloads, you might first perform an initial, or infrequently repeated, proof-of-concept run to analyze performance and discover the correct tuning needed for a full production run. The difference in size between the two can be exponential. Furthermore, with batch workloads, we might scale to an extreme level for a run, then scale back to zero instances for long periods of time, sometimes months.

Although third-party frameworks can help with running batch workloads on Kubernetes, you can also roll your own. Whichever approach you take, significant gaps and challenges can remain in handling the undifferentiated heavy lifting of building, configuring, and maintaining custom batch solutions. Then you also need to consider the scheduling, placing, and scaling of batch workloads on Kubernetes in a cost-effective manner. So how does AWS Batch on Amazon EKS help?

AWS Batch for Amazon EKS
AWS Batch for Amazon EKS offers a fully managed service to run batch workloads using clusters hosted on Amazon Elastic Compute Cloud (Amazon EC2) with no need to install and manage complex, custom batch solutions to address the differences highlighted earlier. AWS Batch provides a scheduler that controls and runs high-volume batch jobs, together with an orchestration component that evaluates when, where, and how to place jobs submitted to a queue. There’s no need for you, as the user, to coordinate any of this work—you just submit a job request into the queue.

Job queueing, dependency tracking, retries, prioritization, compute resource provisioning for Amazon Elastic Compute Cloud (EC2) and Amazon Elastic Compute Cloud (EC2) Spot, and pod submission are all handled using a serverless queue. As a managed service, AWS Batch for Amazon EKS enables you to reduce your operational and management overhead and focus instead on your business requirements. It provides integration with other services such as AWS Identity and Access Management (IAM), Amazon EventBridge, and AWS Step Functions and allows you to take advantage of other partners and tools in the Kubernetes ecosystem.

When running batch jobs on Amazon EKS clusters, AWS Batch is the main entry point to submit workload requests. Based on the queued jobs, AWS Batch then launches worker nodes in your cluster to process the jobs. These nodes are kept separate in a distinct namespace from your other node groups in Amazon EKS. Similarly, nodes in other pods are isolated from those used with AWS Batch.

How it works
AWS Batch uses managed Amazon EKS clusters, which need to be registered with AWS Batch, and permissions set so that AWS Batch can launch and manage compute environments in those clusters to process jobs submitted to the queue. You can find instructions on how to launch a managed cluster that AWS Batch can use in this topic in the Amazon EKS User Guide. Instructions for configuring permissions can be found in the AWS Batch User Guide.

Once one or more clusters have been registered, and permissions set, users can submit jobs to the queue. When a job is submitted, the following actions take place to process the request:

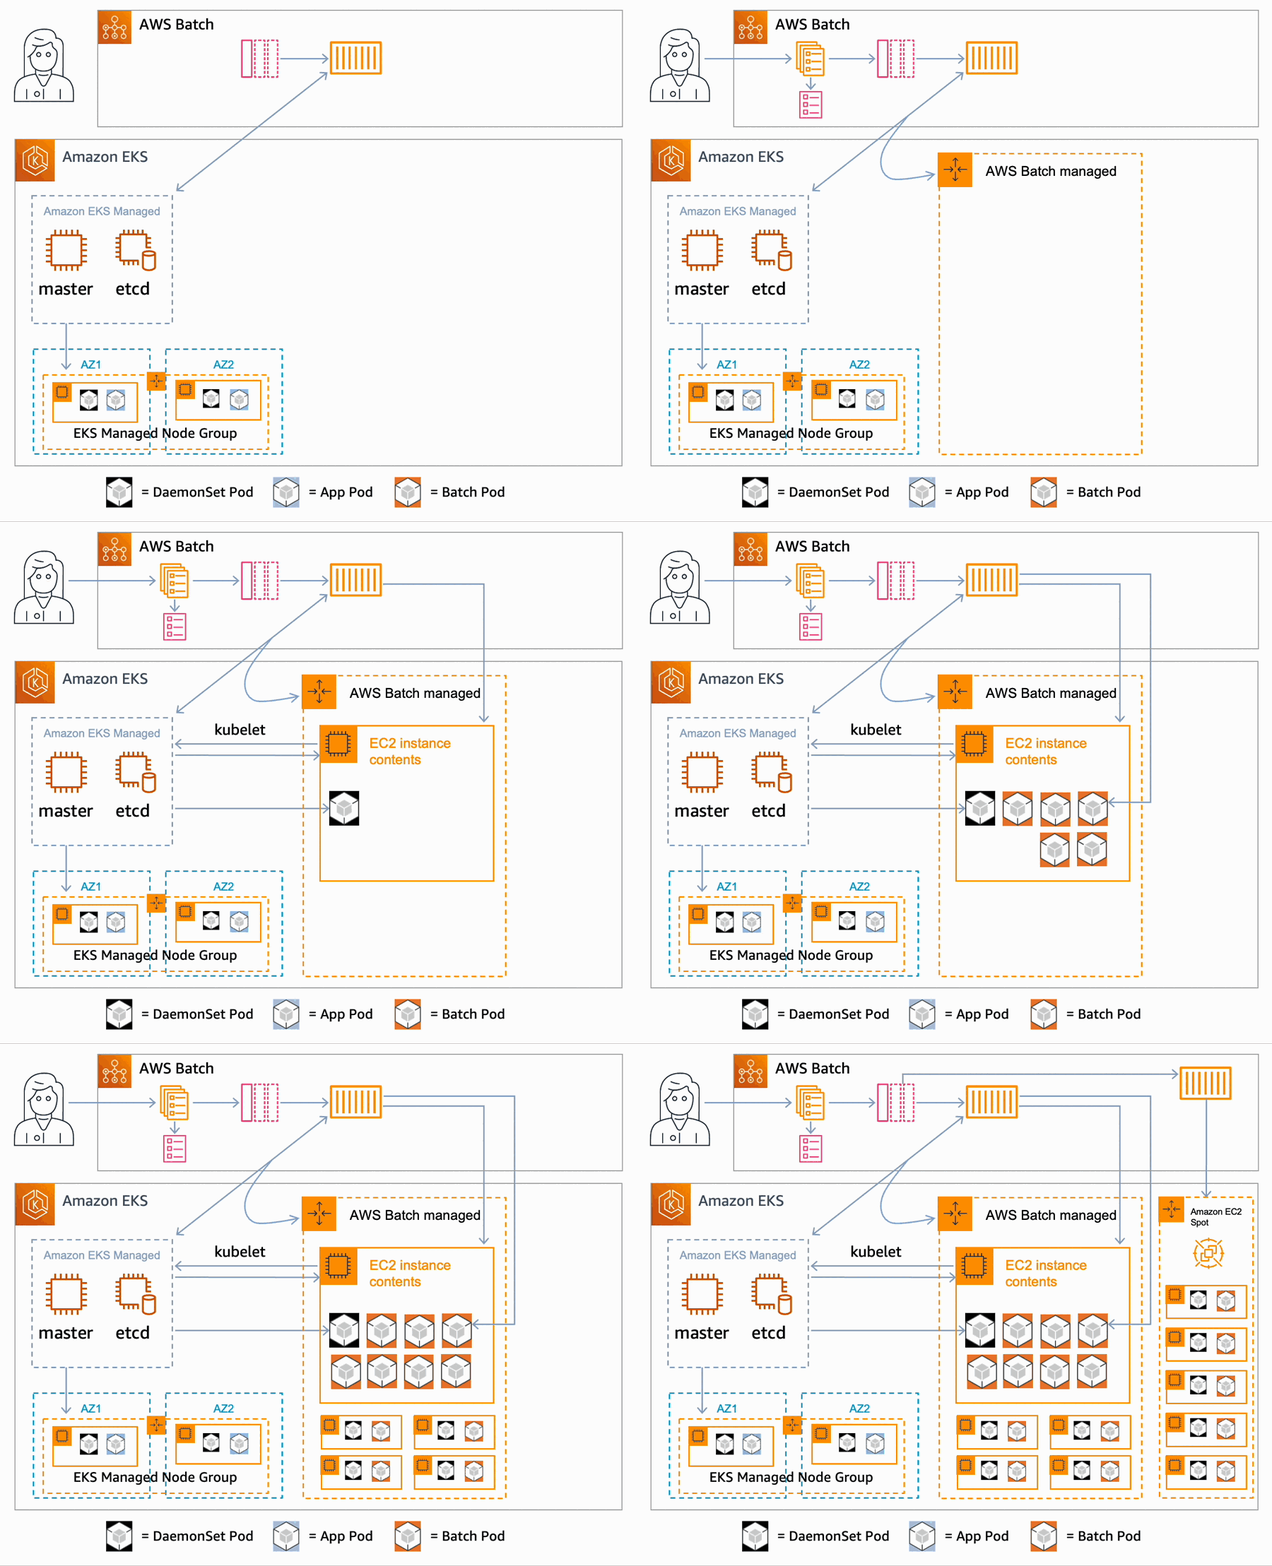
  • On receiving a job request, the queue dispatches a request to the configured compute environment for resources. If an AWS Batch managed scaling group does not yet exist, one is created, and AWS Batch then starts launching Amazon Elastic Compute Cloud (EC2) instances in the group. These new instances are added to the AWS Batch Kubernetes namespace of the cluster.
  • The Kubernetes scheduler places any configured DaemonSet on the node.
  • Once the node is ready, AWS Batch starts sending pod placement requests to your cluster, using labels and taints to make the placement choices for the pods, bypassing much of the logic of the k8s scheduler.
  • This process is repeated, scaling as needed across more EC2 instances in the scaling group until the maximum configured capacity is reached.
  • If the job queue has another compute environment defined, such as one configured to use Spot instances, it will launch additional nodes in that compute environment.
  • Once all work is complete, AWS Batch removes the nodes from the cluster, and terminates the instances.

These steps are illustrated in the animation below.

Animation showing the steps AWS Batch takes when processing a request using an Amazon EKS cluster

Start using your clusters with AWS Batch today
AWS Batch for Amazon Elastic Kubernetes Service (Amazon EKS) is available today. As I noted earlier, there is no charge for this service, and you pay only for the resources your jobs consume. To learn more, visit the Getting Started with Amazon EKS topic in the AWS Batch User Guide. There is also a self-guided workshop to help introduce you to AWS Batch on Amazon EKS.

— Steve

Email Routing leaves Beta

Post Syndicated from Celso Martinho original https://blog.cloudflare.com/email-routing-leaves-beta/

Email Routing leaves Beta

Email Routing leaves Beta

Email Routing was announced during Birthday Week in 2021 and has been available for free to every Cloudflare customer since early this year. When we launched in beta, we set out to make a difference and provide the most uncomplicated, more powerful email forwarding service on the Internet for all our customers, for free.

We feel we’ve met and surpassed our goals for the first year. Cloudflare Email Routing is now one of our most popular features and a top leading email provider. We are processing email traffic for more than 550,000 inboxes and forwarding an average of two million messages daily, and still growing month to month.

In February, we also announced that we were acquiring Area1. Merging their team, products, and know-how with Cloudflare was a significant step in strengthening our Email Security capabilities.

All this is good, but what about more features, you ask?

The team has been working hard to enhance Email Routing over the last few months. Today Email Routing leaves beta.

Also, we feel that this could be a good time to give you an update on all the new things we’ve been adding to the service, including behind-the-scenes and not-so-visible improvements.

Let’s get started.

Public API and Terraform

Cloudflare has a strong API-first philosophy. All of our services expose their primitives in our vast API catalog and gateway, which we then “dogfood” extensively. For instance, our customer’s configuration dashboard is built entirely on top of these APIs.

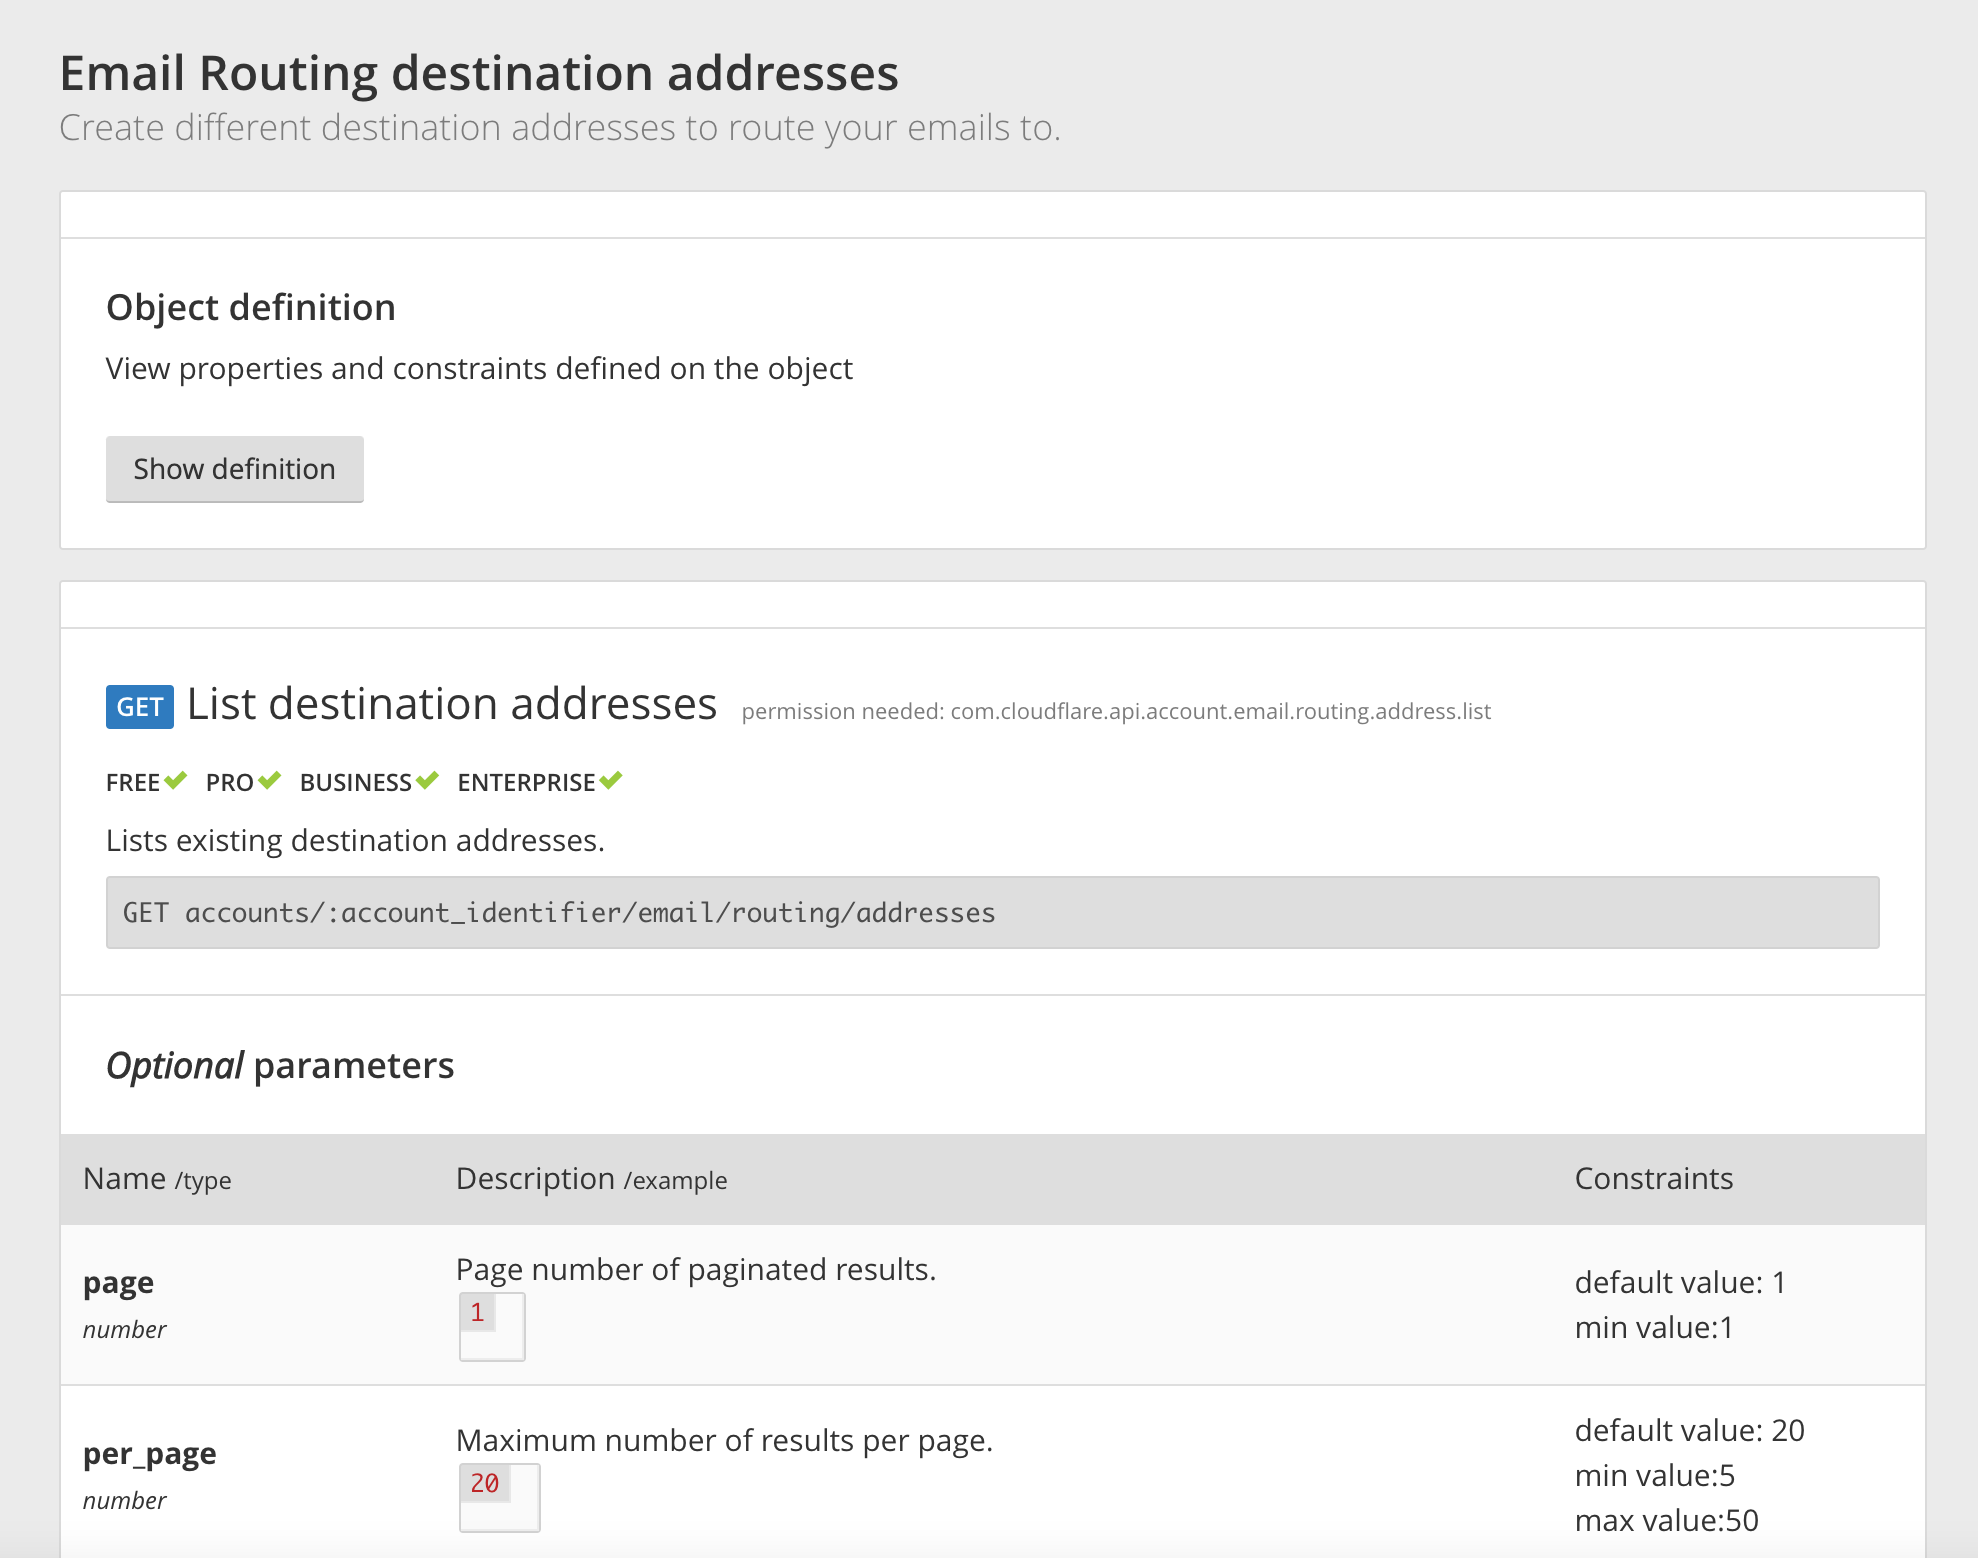
The Email Routing APIs didn’t quite make it to this catalog on day one and were kept private and undocumented for a while. This summer we made those APIs available on the public Cloudflare API catalog. You can programmatically use them to manage your destination emails, rules, and other Email Routing settings. The methods’ definitions and parameters are documented, and we provide curl examples if you want to get your hands dirty quickly.

Even better, if you’re an infrastructure as code type of user and use Terraform to configure your systems automatically, we have you covered too. The latest releases of Cloudflare’s Terraform provider now incorporate the Email Routing API resources, which you can use with HCL.

Email Routing leaves Beta

IPv6 egress

IPv6 adoption is on a sustained growth path. Our latest IPv6 adoption report shows that we’re nearing the 30% penetration figure globally, with some countries, where mobile usage is prevalent, exceeding the 50% mark. Cloudflare has offered full IPv6 support since 2011 as it aligns entirely with our mission to help build a better Internet.

We are IPv6-ready across the board in our network and our products, and Email Routing has had IPv6 ingress support since day one.

➜  ~ dig celso.io MX +noall +answer
celso.io.		300	IN	MX	91 isaac.mx.cloudflare.net.
celso.io.		300	IN	MX	2 linda.mx.cloudflare.net.
celso.io.		300	IN	MX	2 amir.mx.cloudflare.net.
➜  ~ dig linda.mx.cloudflare.net AAAA +noall +answer
linda.mx.cloudflare.net. 300	IN	AAAA	2606:4700:f5::b
linda.mx.cloudflare.net. 300	IN	AAAA	2606:4700:f5::c
linda.mx.cloudflare.net. 300	IN	AAAA	2606:4700:f5::d

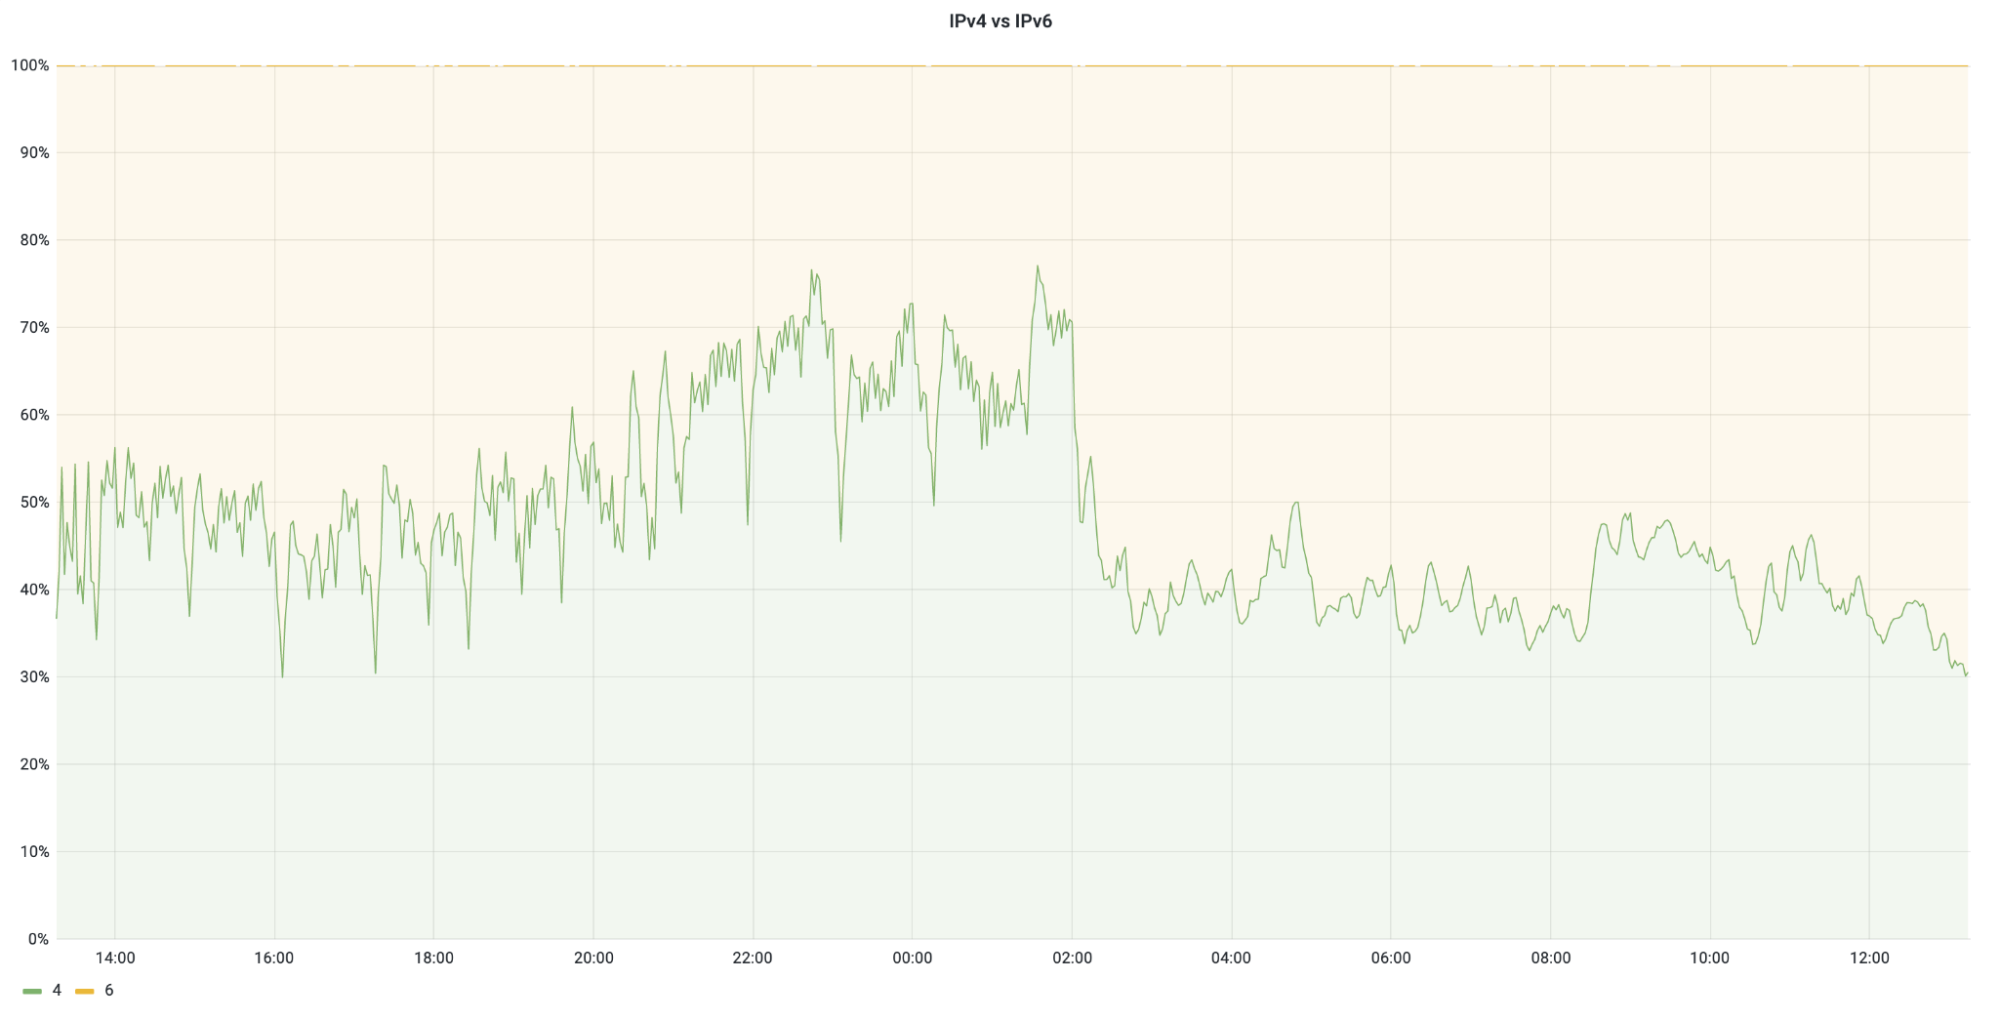
More recently, we closed the loop and added egress IPv6 as well. Now we also use IPv6 when sending emails to upstream servers. If the MX server to which an email is being forwarded supports IPv6, then we will try to use it. Gmail is one good example of a high traffic destination that has IPv6 MX records.

➜  ~ dig gmail.com MX +noall +answer
gmail.com.		3362	IN	MX	30 alt3.gmail-smtp-in.l.google.com.
gmail.com.		3362	IN	MX	5 gmail-smtp-in.l.google.com.
gmail.com.		3362	IN	MX	10 alt1.gmail-smtp-in.l.google.com.
gmail.com.		3362	IN	MX	20 alt2.gmail-smtp-in.l.google.com.
gmail.com.		3362	IN	MX	40 alt4.gmail-smtp-in.l.google.com.
➜  ~ dig gmail-smtp-in.l.google.com AAAA +noall +answer
gmail-smtp-in.l.google.com. 116	IN	AAAA	2a00:1450:400c:c03::1a

We’re happy to report that we’re now delivering most of our email to upstreams using IPv6.

Email Routing leaves Beta

Observability

Email Routing is effectively another system that sits in the middle of the life of an email message. No one likes to navigate blindly, especially when using and depending on critical services like email, so it’s our responsibility to provide as much observability as possible about what’s going on when messages are transiting through our network.

End to end email deliverability is a complex topic and often challenging to troubleshoot due to the nature of the protocol and the number of systems and hops involved. We added two widgets, Analytics and Detailed Logs, which will hopefully provide the needed insights and help increase visibility.

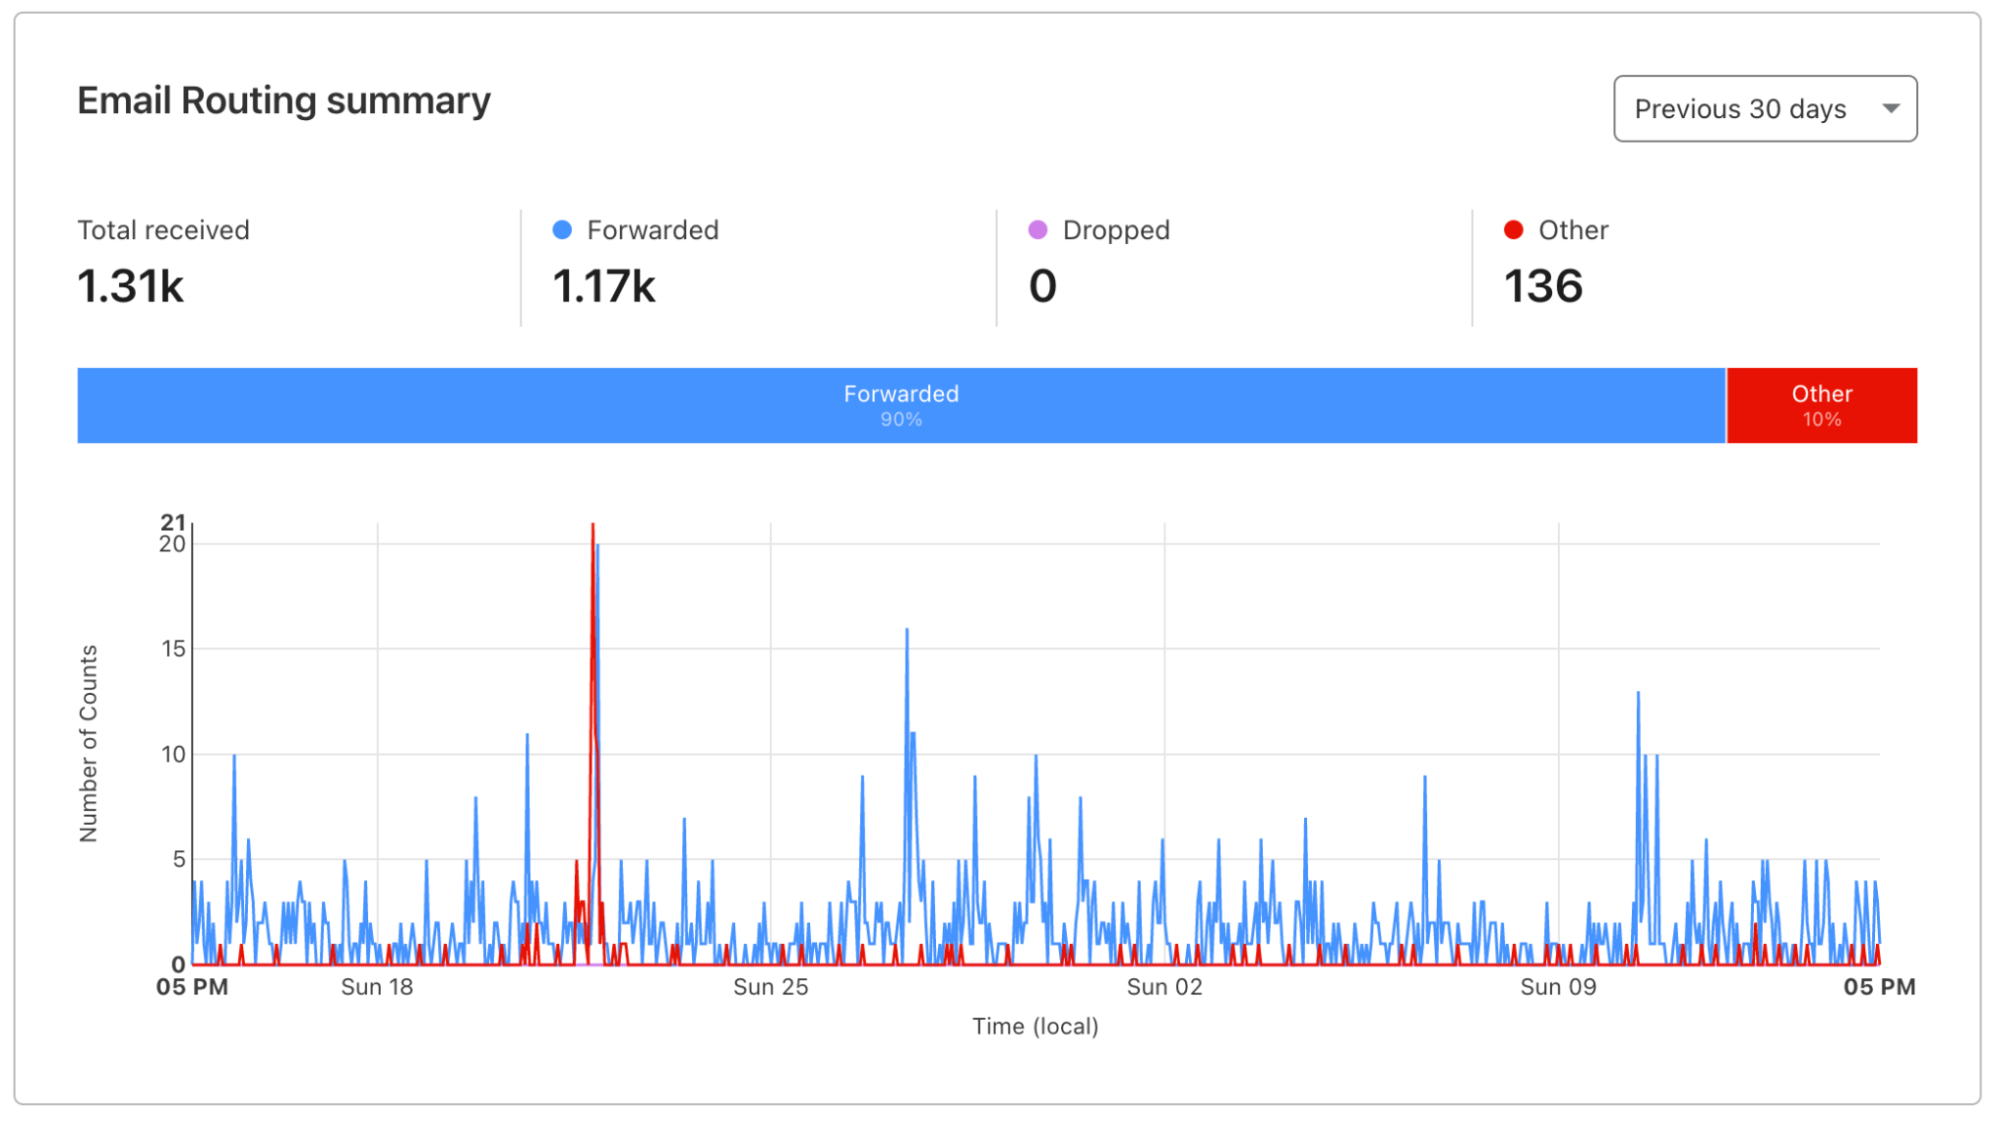
The Analytics section of Email Routing shows general statistics about the number of emails received during the selected timeframe, how they got handled to the upstream destination addresses, and a convenient time-series chart.

Email Routing leaves Beta

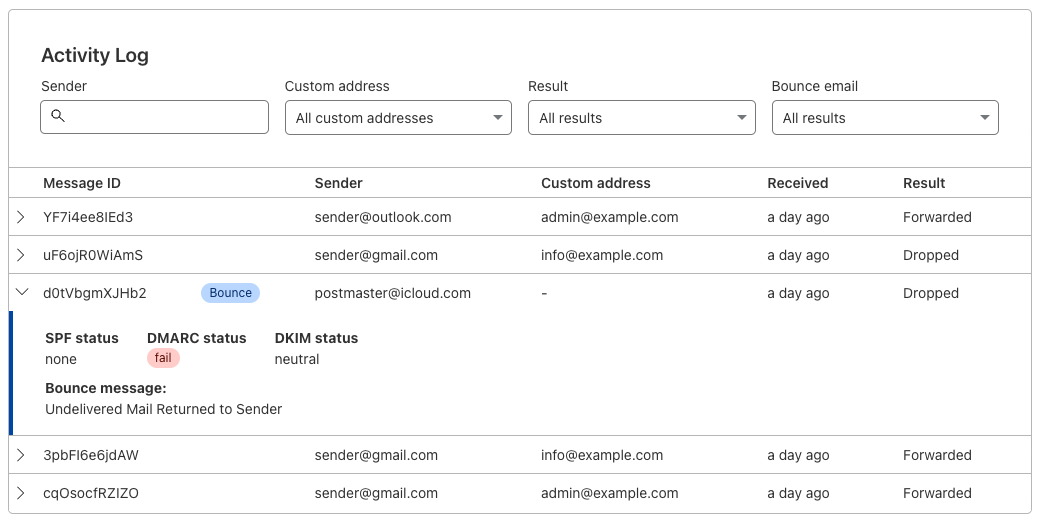
On the Activity Log, you can get detailed information about what happened to each individual message that was received and then delivered to the destination. That information includes the sender and the custom address used, the timestamp, and the delivery attempt result. It also has the details of our SPF, DMARC, and DKIM validations. We also provide filters to help you find what you’re looking for in case your message volume is higher.


More recently, the Activity Log now also shows bounces. A bounce message happens when the upstream SMTP server accepts the delivery, but then, for any reason (exceeded quota, virus checks, forged messages, or other issues), the recipient inbox decides to reject it and return a new message back with an error to the latest MTA in the chain, read from the Return-Path headers, which is us.

Email Routing leaves Beta

Audit Logs

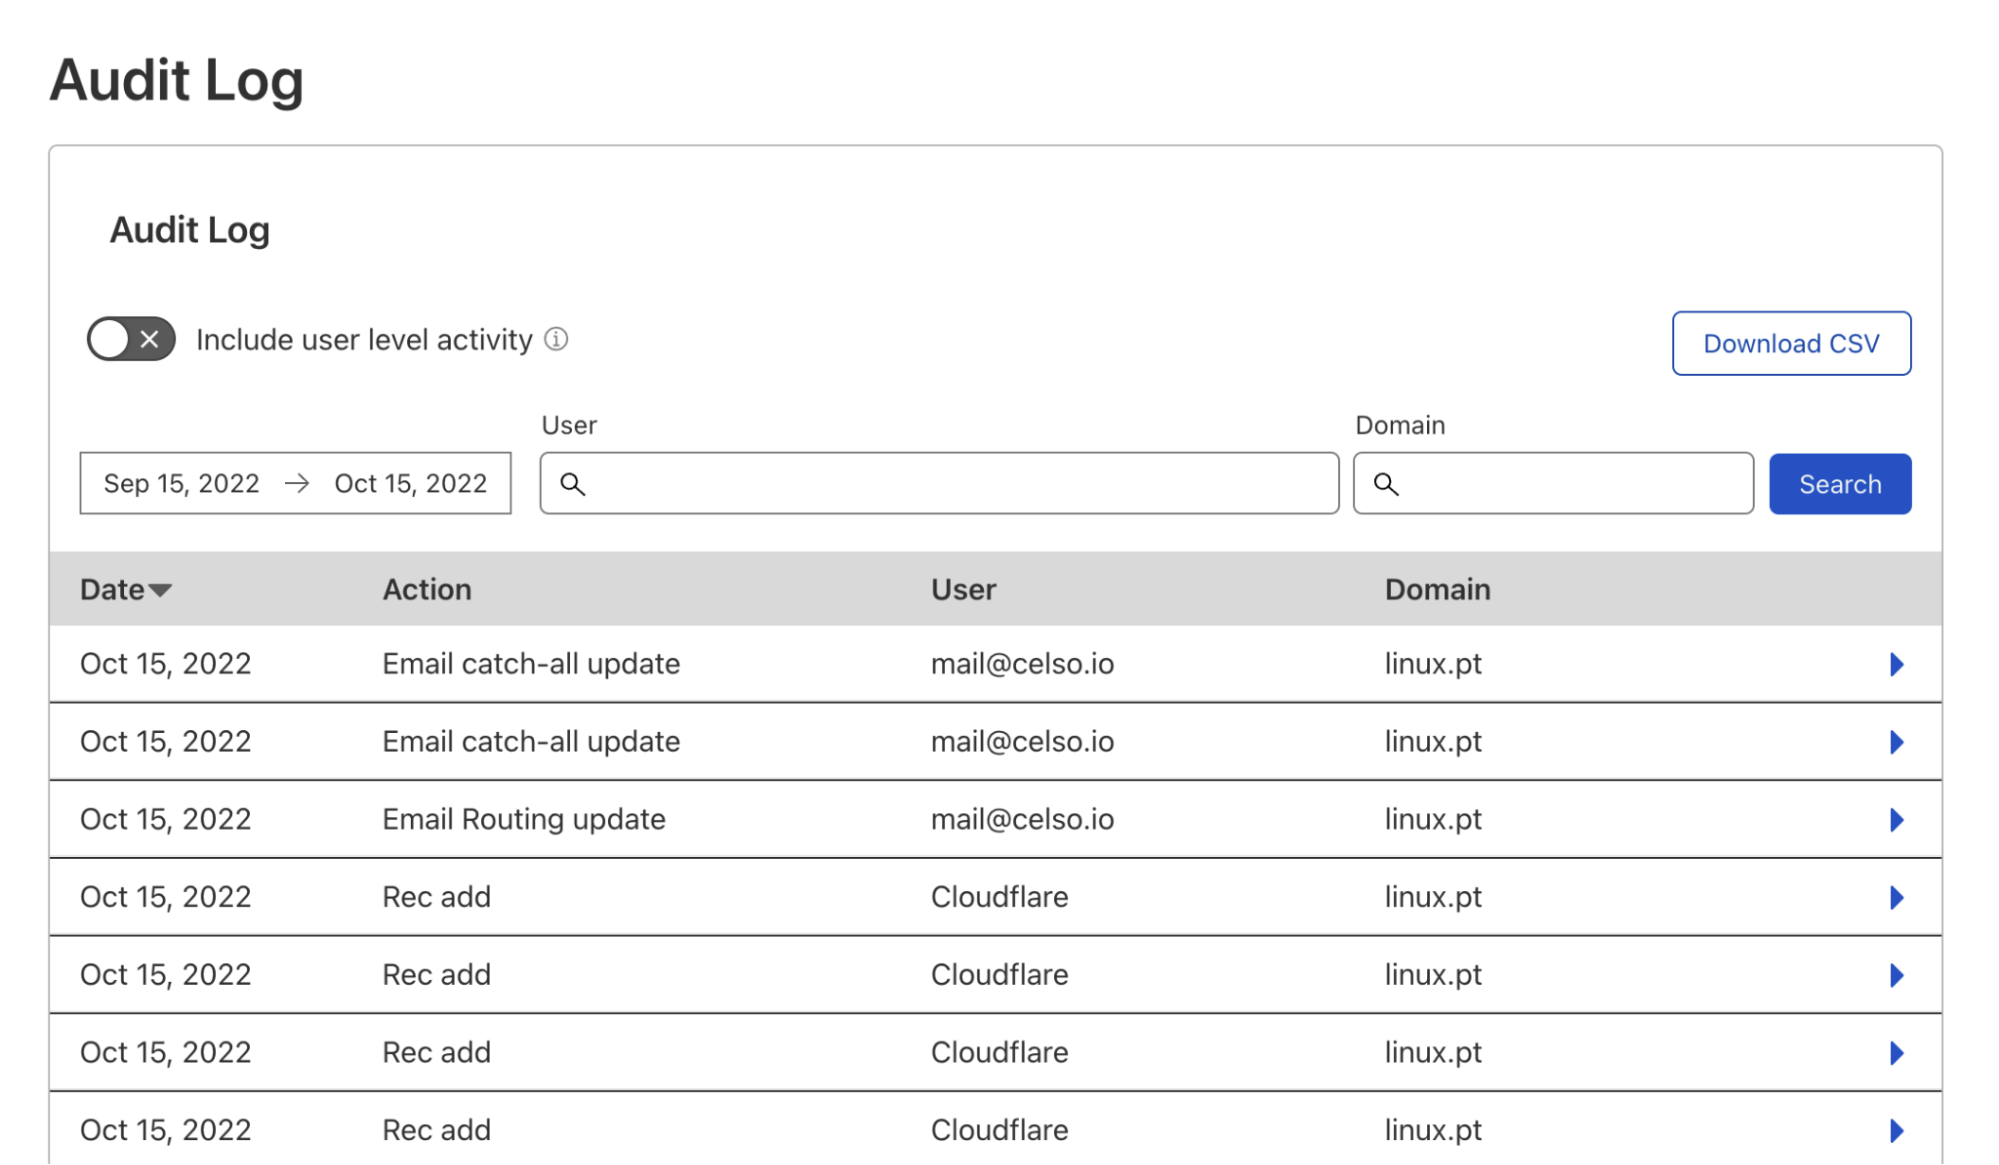
Audit Logs are available on all plan types and summarize the history of events, like login and logout actions, or zone configuration changes, made within your Cloudflare account. Accounts with multiple members or companies that must comply with regulatory obligations rely on Audit logs for tracking and evidence reasons.

Email Routing now integrates with Audit Logs and records all configuration changes, like adding a new address, changing a rule, or editing the catch-all address. You can find the Audit Logs on the dashboard under “Manage Account” or use our API to download the list.

Email Routing leaves Beta

Anti-spam

Unsolicited and malicious messages plague the world of email and are a big problem for end users. They affect the user experience and efficiency of email, and often carry security risks that can lead to scams, identity theft, and manipulation.

Since day one, we have supported and validated SPF (Sender Policy Framework) records,  DKIM (DomainKeys Identified Mail) signatures, and DMARC (Domain-based Message Authentication) policies in incoming messages. These steps are important and mitigate some risks associated with authenticating the origin of an email from a specific legitimate domain, but they don’t solve the problem completely. You can still have bad actors generating spam or phishing Attacks from other domains who ignore SPF or DKIM completely.

Anti-spam techniques today are often based on blocking emails whose origin (the IP address of the client trying to deliver the message) confidence score isn’t great. This is commonly known in the industry as IP reputation. Other companies specialize in maintaining reputation lists for IPs and email domains, also known as RBL lists, which are then shared across providers and used widely.

Simply put, an IP or a domain gets a bad reputation when it starts sending unsolicited or malicious emails. If your IP or domain has a bad reputation, you’ll have a hard time delivering Emails from them to any major email provider. A bad reputation goes away when the IP or domain stops acting bad.

Cloudflare is a security company that knows a few things about IP threat scores and reputation. Working with the Area1 team and learning from them, we added support to flag and block emails received from what we consider bad IPs at the SMTP level. Our approach uses a combination of heuristics and reputation databases, including some RBL lists, which we constantly update.

This measure benefits not only those customers that receive a lot of spam, who will now get another layer of protection and filtering, but also everyone else using Email Routing. The reputation of our own IP space and forwarding domain, which we use to deliver messages to other email providers, will improve, and with it, so will our deliverability success rate.

IDN support

Internationalized domain names, or IDNs for short, are domains that contain at least one non-ASCII character. To accommodate backward compatibility with older Internet protocols and applications, the IETF approved the IDNA protocol (Internationalized Domain Names in Applications), which was then adopted by many browsers, top-level domain registrars and other service providers.

Cloudflare was one of the first platforms to adopt IDNs back in 2012.  Supporting internationalized domain names on email, though, is challenging. Email uses DNS, SMTP, and other standards (like TLS and DKIM signatures) stacked on top of each other. IDNA conversions need to work end to end, or something will break.

Email Routing didn’t support IDNs until now. Starting today, Email Routing can be used with IDNs and everything will work end to end as expected.

Email Routing leaves Beta

8-bit MIME transport

The SMTP protocol supports extensions since the RFC 2821 revision. When an email client connects to an SMTP server, it announces its capabilities on the EHLO command.

➜  ~ telnet linda.mx.cloudflare.net 25
Trying 162.159.205.24...
Connected to linda.mx.cloudflare.net.
Escape character is '^]'.
220 mx.cloudflare.net Cloudflare Email ESMTP Service ready
EHLO celso.io
250-mx.cloudflare.net greets celso.io
250-STARTTLS
250-8BITMIME
250 ENHANCEDSTATUSCODES

This tells our client that we support the Secure SMTP over TLS, Enhanced Error Codes, and the 8-bit MIME Transport, our latest addition.

Most modern clients and servers support the 8BITMIME extension, making transmitting binary files easier and more efficient without additional conversions to and from 7-bit.

Email Routing now supports transmitting 8BITMIME SMTP messages end to end and handles DKIM signatures accordingly.

Other fixes

We’ve been making other smaller improvements to Email Routing too:

  • We ported our SMTP server to use BoringSSL, Cloudflare’s SSL/TLS implementation of choice, and now support more ciphers when clients connect to us using STARTTLS and when we connect to upstream servers.
  • We made a number of improvements when we added our own DKIM signatures in the messages. We keep our Rust 🦀DKIM implementation open source on GitHub, and we also contribute to Lettre, a Rust mailer library that we use.
  • When a destination address domain has multiple MX records, we now try them all in their preference value order, as described in the RFC, until we get a good delivery, or we fail.

Route to Workers update

We announced Route to Workers in May this year. Route to Workers enables everyone to programmatically process their emails and use them as triggers for any other action. In other words, you can choose to process any incoming email with a Cloudflare Worker script and then implement any logic you wish before you deliver it to a destination address or drop it. Think about it as programmable email.

The good news, though, is that we’re near completing the project. The APIs, the dashboard configuration screens, the SMTP service, and the necessary Cap’n Proto interface to Workers are mostly complete, and “all” we have left now is adding the Email Workers primitives to the runtime and testing the hell out of everything before we ship.

Thousands of users are waiting for Email Workers to start creating advanced email processing workflows, and we’re excited about the possibilities this will open. We promise we’re working hard to open the public beta as soon as possible.

Email Routing leaves Beta

What’s next?

We keep looking at ways to improve email and will add more features and support to emerging protocols and extensions. Two examples are ARC (Authenticated Received Chain), a new signature-based authentication system designed with email forwarding services in mind, and EAI (Email Address Internationalization), which we will be supporting soon.

In the meantime, you can start using Email Routing with your own domain if you haven’t yet, it only takes a few minutes to set up, and it’s free. Our Developers Documentation page has details on how to get started, troubleshooting, and technical information.

Ping us on our Discord server, community forum, or Twitter if you have suggestions or questions, the team is listening.

Using mobile sensor data to encourage safer driving

Post Syndicated from Grab Tech original https://engineering.grab.com/using-mobile-sensor-data-to-encourage-safer-driving

“Telematics”, a cross between the words telecommunications and informatics, was coined in the late 1970s to refer to the use of communication technologies in facilitating exchange of information. In the modern day, such technologies may include cloud platforms, mobile networks, and wireless transmissions (e.g., Bluetooth). Although the initial intention is for a more general scope, telematics is now specifically used to refer to vehicle telematics where details of vehicle movements are tracked for use cases such as driving safety, driver profiling, fleet optimisation, and productivity improvements.

We’ve previously published this article to share how Grab uses telematics to improve driver safety. In this blog post, we dive deeper into how telematics technology is used at Grab to encourage safer driving for our driver and delivery partners.

Background

At Grab, the safety of our users and their experience on our platform is our highest priority. By encouraging safer driving habits from our driver and delivery partners, road traffic accidents can be minimised, potentially reducing property damage, injuries, and even fatalities. Safe driving also helps ensure smoother rides and a more pleasant experience for consumers using our platform.

To encourage safer driving, we should:

  1. Have a data-driven approach to understand how our driver and delivery partners are driving.
  2. Help partners better understand how to improve their driving by summarising key driving history into a personalised Driving Safety Report.

Understanding driving behaviour

One of the most direct forms of driving assessment is consumer feedback or complaints. However, the frequency and coverage of this feedback is not very high as they are only applicable to transport verticals like JustGrab or GrabBike and not delivery verticals like GrabFood or GrabExpress. Plus, most driver partners tend not to receive any driving-related feedback (whether positive or negative), even for the transport verticals.

A more comprehensive method of assessing driving behaviour is to use the driving data collected during Grab bookings. To make sense of these data, we focus on selected driving manoeuvres (e.g., braking, acceleration, cornering, speeding) and detect the number of instances where our data shows unsafe driving in each of these areas.

We acknowledge that the detected instances may be subjected to errors and may not provide the complete picture of what’s happening on the ground (e.g., partners may be forced to do an emergency brake due to someone swerving into their lane).

To address this, we have incorporated several fail-safe checks into our detection logic to minimise erroneous detection. Also, any assessment of driving behaviour will be based on an aggregation of these unsafe driving instances over a large amount of driving data. For example, individual harsh braking instances may be inconclusive but if a driver partner displays multiple counts consistently across many bookings, it is likely that the partner may be used to unsafe driving practices like tailgating or is distracted while driving.

Telematics for detecting unsafe driving

For Grab to consistently ensure our consumers’ safety, we need to proactively detect unsafe driving behaviour before an accident occurs. However, it is not feasible for someone to be with our driver and delivery partners all the time to observe their driving behaviour. We should leverage sensor data to monitor these driving behaviour at scale.

Traditionally, a specialised “black box” inertial measurement unit (IMU) equipped with sensors such as accelerometers, gyroscopes, and GPS needs to be installed in alignment with the vehicle to directly measure vehicular acceleration and speed. In this manner, it would be straightforward to detect unsafe driving instances using this data. Unfortunately, the cost of purchasing and installing such devices for all our partners is prohibitively high and it would be hard to scale.

Instead, we can leverage a device that all partners already have: their mobile phone. Modern smartphones already contain similar sensors to those in IMUs and data can be collected through the telematics SDK. More details on telematics data collection can be found in a recently published Grab tech blog article1.

It’s important to note that telematics data are collected at a sufficiently high sampling frequency (much more than 1 Hz) to minimise inaccuracies in detecting unsafe driving instances characterised by sharp acceleration impulses.

Processing mobile sensor data to detect unsafe driving

Unlike specialised IMUs installed in vehicles, mobile sensor data have added challenges to detecting unsafe driving.

Accounting for orientation: Phone vs. vehicle

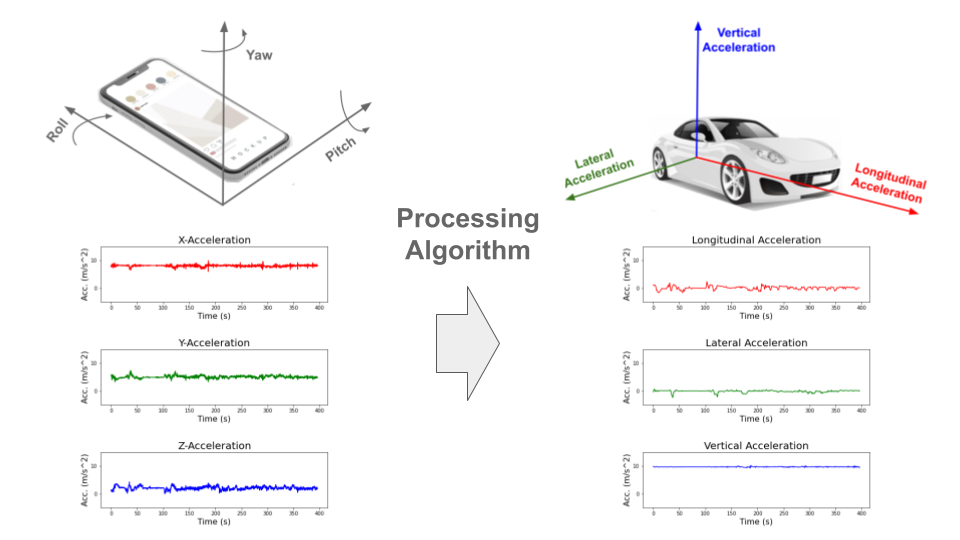
The phone is usually in a different orientation compared to the vehicle. Strictly speaking, the phone accelerometer sensor measures the accelerations of the phone and not the vehicle acceleration. To infer vehicle acceleration from phone sensor data, we developed a customised processing algorithm optimised specifically for Grab’s data.

First, the orientation offset of the phone with respect to the vehicle is defined using Euler angles: roll, pitch and yaw. In data windows with no net acceleration of the vehicle (e.g., no braking, turning motion), the only acceleration measured by the accelerometer is gravitational acceleration. Roll and pitch angles can then be determined through trigonometric manipulation. The complete triaxial accelerations of the phone are then rotated to the horizontal plane and the yaw angle is determined by principal component analysis (PCA).

An assumption here is that there will be sufficient braking and acceleration manoeuvring for PCA to determine the correct forward direction. This Euler angles determination is done periodically to account for any movement of phones during the trip. Finally, the raw phone accelerations are rotated to the vehicle orientation through a matrix multiplication with the rotation matrix derived from the Euler angles (see Figure 1).

Figure 1: Inference of vehicle acceleration from the phone sensor data. Smartphone and car images modified from designs found in Freepik.com.

Handling variations in data quality

Our processing algorithm is optimised to be highly robust and handle large variations in data quality that is expected from bookings on the Grab platform. There are many reported methods for processing mobile data to reorientate telematics data for four wheel vehicles23.

However, with the prevalent use of motorcycles on our platform, especially for delivery verticals, we observed that data collected from two wheel vehicles tend to be noisier due to differences in phone stability and vehicular vibrations. Data noise can be exacerbated if partners hold the phone in their hand or place it in their pockets while driving.

In addition, we also expect a wide variation in data quality and sensor availability from different phone models, such as older, low-end models to the newest, flagship models. A good example to illustrate the robustness of our algorithm is having different strategies to handle different degrees of data noise. For example, a simple low-pass filter is used for low noise data, while more complex variational decomposition and Kalman filter approaches are used for high noise data.

Detecting behaviour anomalies with thresholds

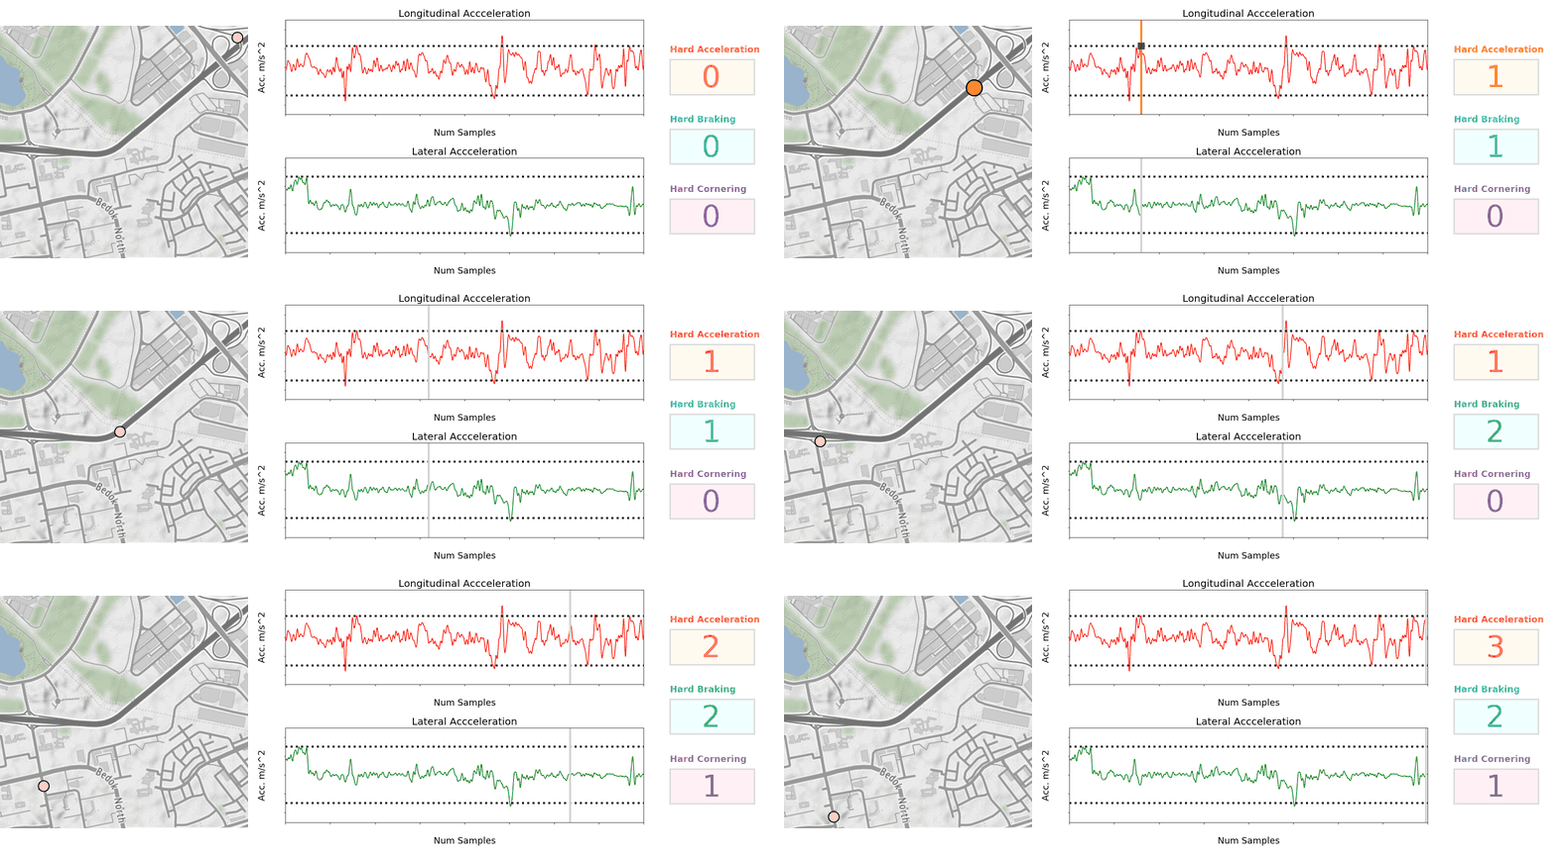
Once the vehicular accelerations are inferred, we can use a thresholding approach (see Figure 2) to detect unsafe driving instances.

For unsafe acceleration and braking, a peak finding algorithm is used to detect acceleration peaks beyond a threshold in the longitudinal (forward/backward) direction. For unsafe cornering, older and lower end phones are usually not equipped with gyroscope sensors, so we should look for peaks of lateral (sidewards) acceleration (which constitutes the centripetal acceleration during the turn) beyond a threshold. GPS bearing data that coarsely measures the orientation of the vehicle is then used to confirm that a cornering and not lane change instance is being detected. The thresholds selected are fine-tuned on Grab’s data using initial values based on published literature4 and other sources.

To reduce false positive detection, no unsafe driving instances will be flagged when:

  1. Large discrepancies are observed between speeds derived from integrating the longitudinal (forward/backward) acceleration and speeds directly measured by the GPS sensor.
  2. Large phone motions are detected. For example, when the phone falls to the seat from the dashboard, accelerations recorded on the phone sensor will deviate significantly from the vehicle accelerations.
  3. GPS speed is very low before and after the unsafe driving instance is detected. This is limited to data collected from motorcycles which is usually used by delivery partners. It implies that the partner is walking and not in a vehicle. For example, a GrabFood delivery partner may be collecting the food from the merchant partner on foot, so no unsafe driving instances should be detected.
Figure 2: Animation showing unsafe driving detection by thresholding. Dotted lines in acceleration charts indicate selected thresholds. Map tiles by stamen design.

Detecting speeding instances from GPS speeds and map data

To define speeding along a stretch of road, we used a rule-based method by comparing raw speeds from GPS pings with speeding thresholds for that road. Although GPS speeds are generally accurate (subjected to minimal GPS errors), we need to take more precautions to ensure the right speeding thresholds are determined.

These thresholds are set using known speed limits from available map data or hourly aggregated speed statistics where speed limits are not available. The coverage and accuracy of known speed limits is continuously being improved by our in-house mapping initiatives and validated comprehensively by the respective local ground teams in selected cities.

Aggregating GPS pings from Grab driver and delivery partners can be a helpful proxy to actual speed limits by defining speeding violations as outliers from socially acceptable speeds derived from partners collectively. To reliably compute aggregated speed statistics, a representative speed profile for each stretch of road must first be inferred from raw GPS pings (see Figure 3).

As ping sampling intervals are fixed, more pings tend to be recorded for slower speeds. To correct the bias in the speed profile, we reweigh ping counts by using speed values as weights. Furthermore, to minimise distortions in the speed profile from vehicles driving at lower-than-expected speeds due to high traffic volumes, only pings from free-flowing traffic are used when inferring the speed profile.

Free-flowing traffic is defined by speeds higher than the median speed on each defined road category (e.g., small residential roads, normal primary roads, large expressways). To ensure extremely high speeds are flagged regardless of the speed of other drivers, maximum threshold values for aggregated speeds are set for each road category using heuristics based on the maximum known speed limit of that road category.

Figure 3: Steps to infer a representative speed profile for computing aggregated speed statistics.

Besides a representative speed profile, hourly aggregation should also include data from a sufficient number of unique drivers depending on speed variability. To obtain enough data, hourly aggregations are performed on the same day of the week over multiple weeks. This way, we have a comprehensive time-specific speed profile that accounts for traffic quality (e.g., peak hour traffic, traffic differences between weekdays/weekends) and driving conditions (e.g., visibility difference between day/night).

When detecting speeding violations, the GPS pings used are snapped-to-road and stationary pings, pings with unrealistic speeds, while pings with low GPS accuracy (e.g., when the vehicle is in a tunnel) are excluded. A speeding violation is defined as a sequence of consecutive GPS pings that exceed the speeding threshold. The following checks were put in place to minimise erroneous flagging of speeding violations:

  1. Removal of duplicated (or stale) GPS pings.
  2. Sufficient speed buffer given to take into account GPS errors.
  3. Sustained speeding for a prolonged period of time is required to exclude transient speeding events (e.g., during lane change).

Driving safety report

The driving safety report is a platform safety product that driver and delivery partners can access via their driver profile page on the Grab Driver Application (see Figure 4). It is updated daily and aims to create awareness regarding driving habits by summarising key information from the processed data into a personalised report that can be easily consumed.

Individual reports of each driving manoeuvre (e.g., braking, acceleration, cornering and speeding) are available for daily and weekly views. Partners can also get more detailed information of each individual instance such as when these unsafe driving instances were detected.

Figure 4: Driving safety report for driver and delivery partners using four wheel vehicles. a) Actionable insights feature circled by red dotted lines. b) Daily view of various unsafe driving instances where more details of each instance can be viewed by tapping on “See details”.

Actionable insights

Besides compiling the instances of unsafe driving in a report to create awareness, we are also using these data to provide some actionable recommendations for our partners to improve their driving.

With unsafe driving feedback from consumers and reported road traffic accident data from our platform, we also train machine learning models to identify patterns in the detected unsafe driving instances and estimate the likelihood of partners receiving unsafe driving feedback or getting into accidents. One use case is to compute a safe driving score that equates a four-wheel partner’s driving behaviour to a numerical value where a higher score indicates a safer driver.

Additionally, we use Shapley additive explanation (SHAP) approaches to determine which driving manoeuvre contributes the most to increasing the likelihood of partners receiving unsafe driving feedback or getting into accidents. This information is included as an actionable insight in the driving safety report and helps partners to identify the key area to improve their driving.

What’s next?

At the moment, Grab performs telematics processing and unsafe driving detections after the trip and updates the report the next day. One of the biggest improvements would be to share this information with partners faster. We are actively working on developing a real-time processing algorithm that addresses this and also, satisfies the robustness requirements such that partners are immediately aware after an unsafe driving instance is detected.

Besides detecting typical unsafe driving manoeuvres, we are also exploring other use cases for mobile sensor data in road safety such as detection of poor road conditions, counterflow driving against traffic, and phone usage leading to distracted driving.

Join us

Grab is the leading superapp platform in Southeast Asia, providing everyday services that matter to consumers. More than just a ride-hailing and food delivery app, Grab offers a wide range of on-demand services in the region, including mobility, food, package and grocery delivery services, mobile payments, and financial services across 428 cities in eight countries.

Powered by technology and driven by heart, our mission is to drive Southeast Asia forward by creating economic empowerment for everyone. If this mission speaks to you, join our team today!

References

  1. Burhan, W. (2022). How telematics helps Grab to improve safety. Grab Tech Blog. https://engineering.grab.com/telematics-at-grab ↩

  2. Mohan, P., Padmanabhan, V.N. and Ramjee, R. (2008).Nericell: rich monitoring of road and traffic conditions using mobile smartphones. SenSys ‘08: Proceedings of the 6th ACM conference on Embedded network sensor systems, 312-336. https://doi.org/10.1145/1460412.1460444 ↩

  3. Sentiance (2016). Driving behavior modeling using smart phone sensor data. Sentiance Blog. https://sentiance.com/2016/02/11/driving-behavior-modeling-using-smart-phone-sensor-data/ ↩

  4. Yarlagadda, J. and Pawar, D.S. (2022). Heterogeneity in the Driver Behavior: An Exploratory Study Using Real-Time Driving Data. Journal of Advanced Transportation. vol. 2022, Article ID 4509071. https://doi.org/10.1155/2022/4509071 ↩

The collective thoughts of the interwebz