[$] ioctl() forever?

Post Syndicated from original https://lwn.net/Articles/897202/

In a combined storage and filesystem session at the
2022 Linux Storage,
Filesystem, Memory-management and BPF Summit
(LSFMM), Luis Chamberlain
and James Bottomley led a discussion about the use of ioctl()
as a mechanism for configuration. There are plenty of downsides to the use
of ioctl() commands, and alternatives exist, but in general kernel
developers have chosen to continue using this multiplexing system
call. While there is interest in changing things, at least in some
quarters, the discussion did not seem to indicate major changes on the horizon.

Security updates for Wednesday

Post Syndicated from original https://lwn.net/Articles/897297/

Security updates have been issued by Debian (avahi), Fedora (firefox), Oracle (grub2, python-twisted-web, shim, shim-signed, and thunderbird), Red Hat (kernel and python-twisted-web), SUSE (gcc48, go1.17, go1.18, and mariadb), and Ubuntu (e2fsprogs, linux, linux-aws, linux-aws-5.13, linux-azure, linux-azure-5.13, linux-gcp, linux-gcp-5.13, linux-hwe-5.13, linux-intel-5.13, linux-kvm, linux-oracle, linux-oracle-5.13, linux-raspi, linux, linux-aws, linux-aws-5.4, linux-azure, linux-azure-5.4, linux-azure-fde, linux-gcp, linux-gke, linux-gke-5.4, linux-gkeop, linux-gkeop-5.4, linux-hwe-5.4, linux-ibm, linux-ibm-5.4, linux-kvm, linux-oracle, linux-oracle-5.4, linux-raspi, linux-raspi-5.4, linux, linux-aws, linux-aws-hwe, linux-azure, linux-azure-4.15, linux-gcp, linux-hwe, linux-kvm, linux-oracle, linux-raspi2, linux-snapdragon, linux, linux-aws, linux-azure, linux-gcp, linux-gke, linux-ibm, linux-intel-iotg, linux-kvm, linux-lowlatency, linux-oracle, linux-raspi, linux, linux-aws, linux-kvm, linux-lts-xenial, linux-oem-5.14, linux-oem-5.17, and ntfs-3g).

In Ukraine and beyond, what it takes to keep vulnerable groups online

Post Syndicated from Jocelyn Woolbright original https://blog.cloudflare.com/in-ukraine-and-beyond-what-it-takes-to-keep-vulnerable-groups-online/

In Ukraine and beyond, what it takes to keep vulnerable groups online

This post is also available in 日本語, Deutsch, Français, Español, Português.

In Ukraine and beyond, what it takes to keep vulnerable groups online

As we celebrate the eighth anniversary of Project Galileo, we want to provide a view into the type of cyber attacks experienced by organizations protected under the project. In a year full of new challenges for so many, we hope that analysis of attacks against these vulnerable groups provides researchers, civil society, and targeted organizations with insight into how to better protect those working in these spaces.

For this blog, we want to focus on attacks we have seen against organizations in Ukraine, including significant growth in DDoS attack activity after the start of the conflict. Within the related Radar dashboard, we do a deep dive into attack trends against Project Galileo participants in a range of areas including human rights, journalism, and community led non-profits.

To read the whole report, visit the Project Galileo 8th anniversary Radar Dashboard.

Understanding the Data

  • For this dashboard, we analyzed data from July 1, 2021 to May 5, 2022 from 1,900 organizations from around the world that are protected under the project.
  • For DDoS attacks, we classify this as traffic that we have determined is part of a Layer 7 (application layer) DDoS attack. Such attacks are often malicious floods of requests designed to overwhelm a site with the intention of knocking it offline. We block the requests associated with the attack, ensuring that legitimate requests reach the site, and that it stays online.
  • For traffic mitigated by the web application firewall, this is traffic that was determined to be malicious and was blocked by Cloudflare’s firewall. We provide free Business level services under Project Galileo, and our WAF is one of the valuable tools used to mitigate attempts to exploit vulnerabilities intended to gain unauthorized access to an organization’s online application.
  • For graphs that represent changes in traffic or domains under Project Galileo, we are using the average daily traffic (number of requests) of the first two weeks of July 2021 as the baseline.

Highlights of past year

  • We continue to see cyberattack activity increase, with nearly 18 billion attacks between July 2021 and May 2022. This is an average of nearly 57.9 million cyberattacks per day over the last nine months, an increase of nearly 10% over last year.
  • Mitigated DDoS traffic targeting organizations in Ukraine reached as much as 90% of total traffic during one significant attack in April.
  • After the war in Ukraine started, applications to the project increased by 177% in March 2022.
  • Journalism and media organizations in Europe and the Americas saw traffic grow ~150% over the last year.
  • We see a range of unsophisticated cyberattacks against organizations that work in human rights and journalism. Up to 40% of WAF mitigated requests were classified as HTTP Anomalies, the largest of any WAF rule type, a type of attack that can be damaging to unprotected organizations but is automatically blocked by Cloudflare.
  • From July 2021 to May 2022, organizations based in Europe consistently accounted for half to two-thirds of request traffic out of all the regions covered under the project.

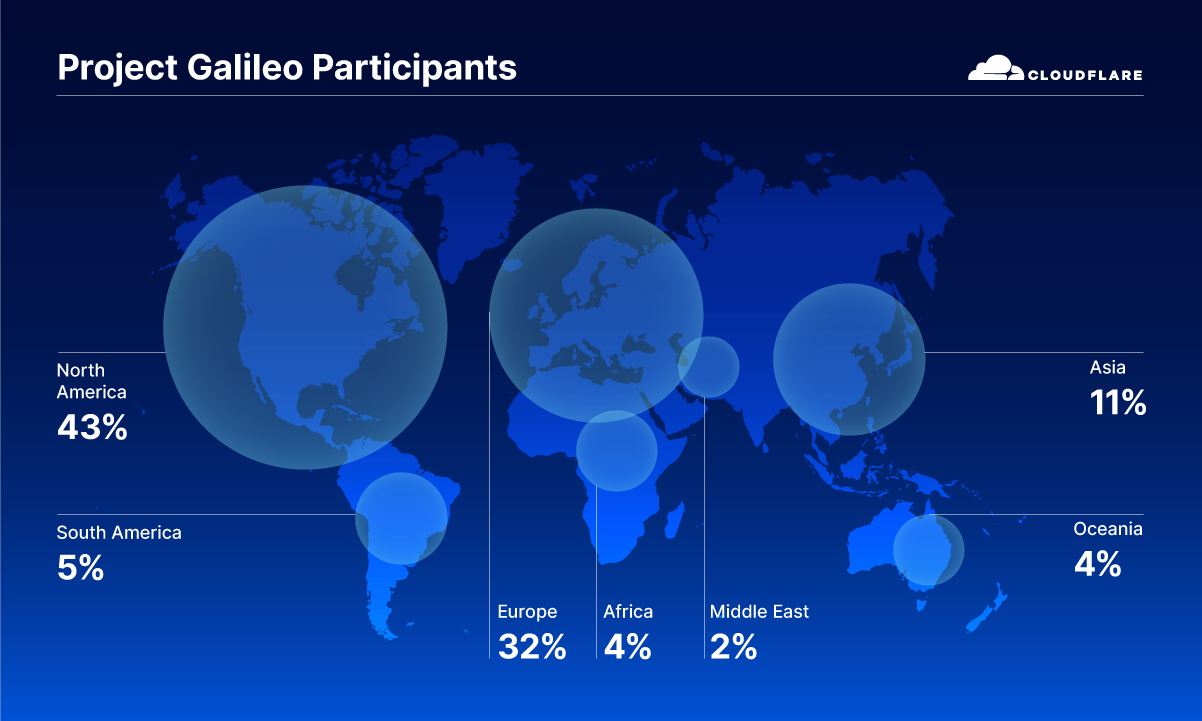
Global Coverage of Project Galileo

In Ukraine and beyond, what it takes to keep vulnerable groups online

Protecting organizations in Ukraine

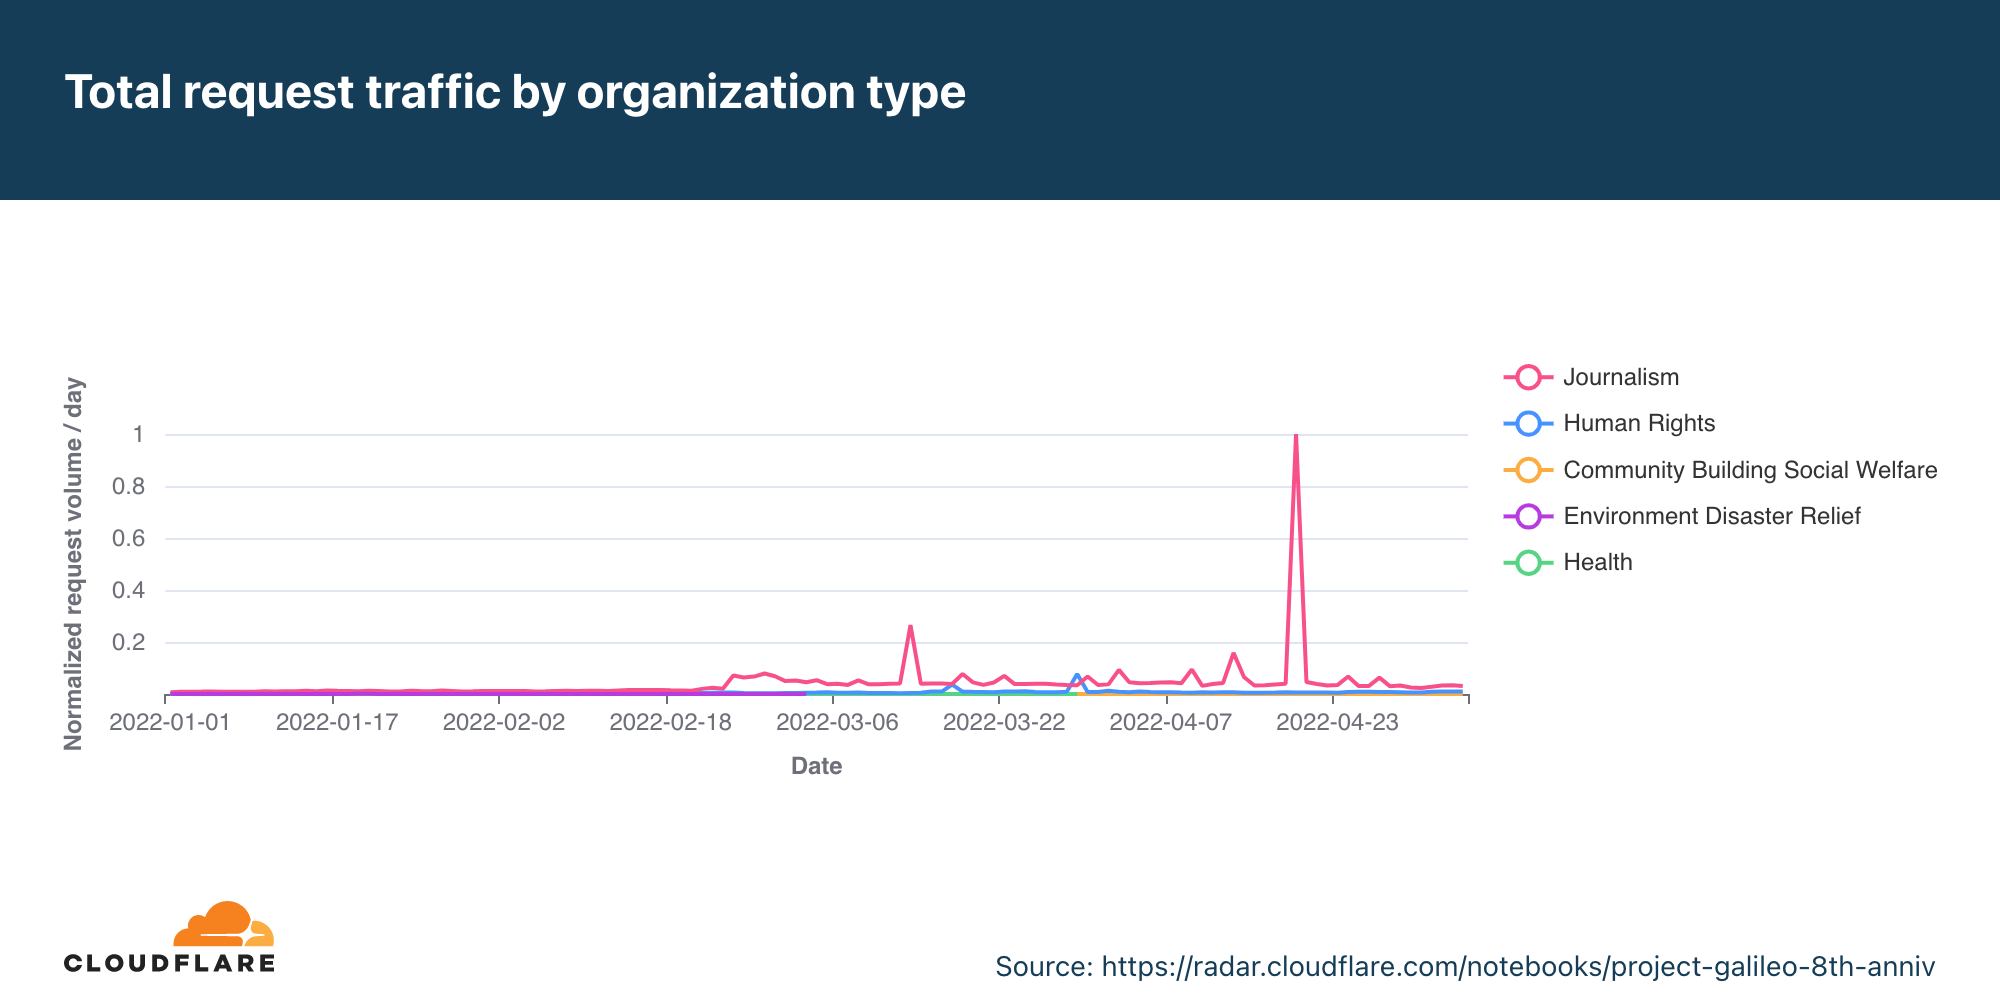
As the war started in Ukraine, we saw an increase in applications for participation in Project Galileo from organizations looking for our assistance. Many came in while under DDoS attack, but we also saw sites subject to large influxes of traffic from people on the ground in Ukraine attempting to access information due to the ongoing Russian invasion. While traffic from organizations in Ukraine was largely flat before the start of the war, since that time, traffic increases primarily have been driven by organizations that work in journalism and media.

In Ukraine and beyond, what it takes to keep vulnerable groups online

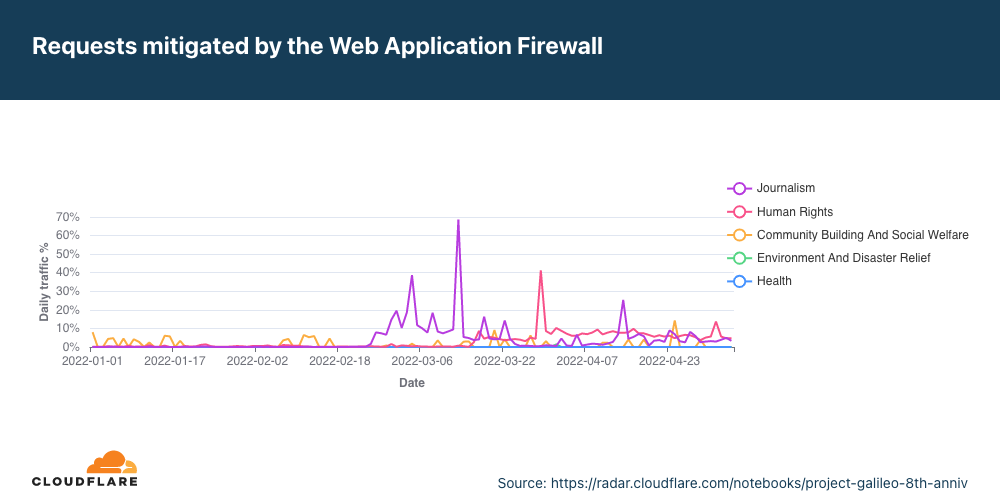
Ahead of the war, organizations that work in community building/social welfare, such as those who provide direct assistance to refugees, or provide donation platforms to support those in Ukraine were responsible for what little traffic that was mitigated by the web application firewall (WAF). However, after the war began, journalism organizations saw the most WAF-mitigated traffic, with frequent spikes, including one on March 13 representing 69% of traffic. During this period of increased WAF-mitigated requests that started in late February, the majority of the attacks were classified as SQLi. WAF mitigated traffic for human rights organizations increased in mid-March, growing to between 5-10% of traffic.

In Ukraine and beyond, what it takes to keep vulnerable groups online

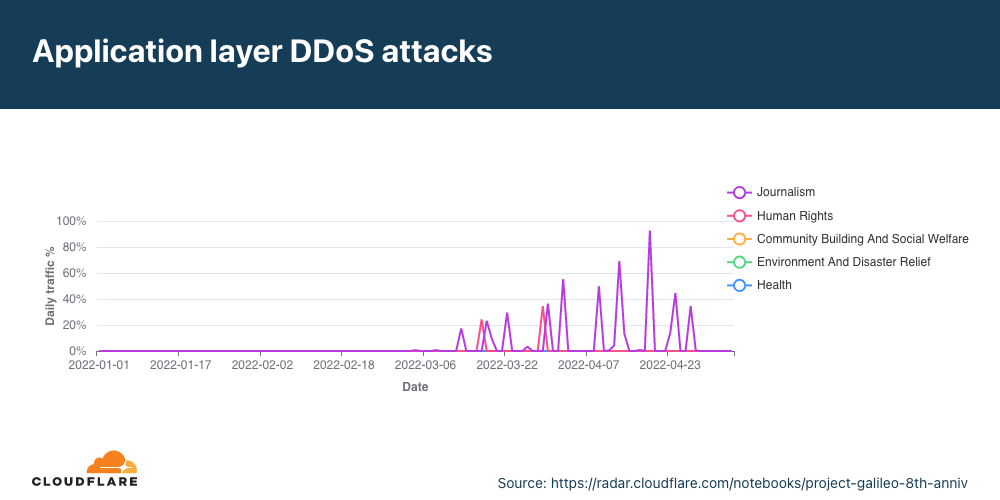
Mitigated DDoS traffic for organizations in Ukraine was concentrated in the mid-March to May timeframe, with rapid growth in the percentage of traffic it represents. The first spikes were in the 20% range, but rapidly grew before receding, including an attack on April 19 that accounted for over 90% of traffic that day.

In Ukraine and beyond, what it takes to keep vulnerable groups online

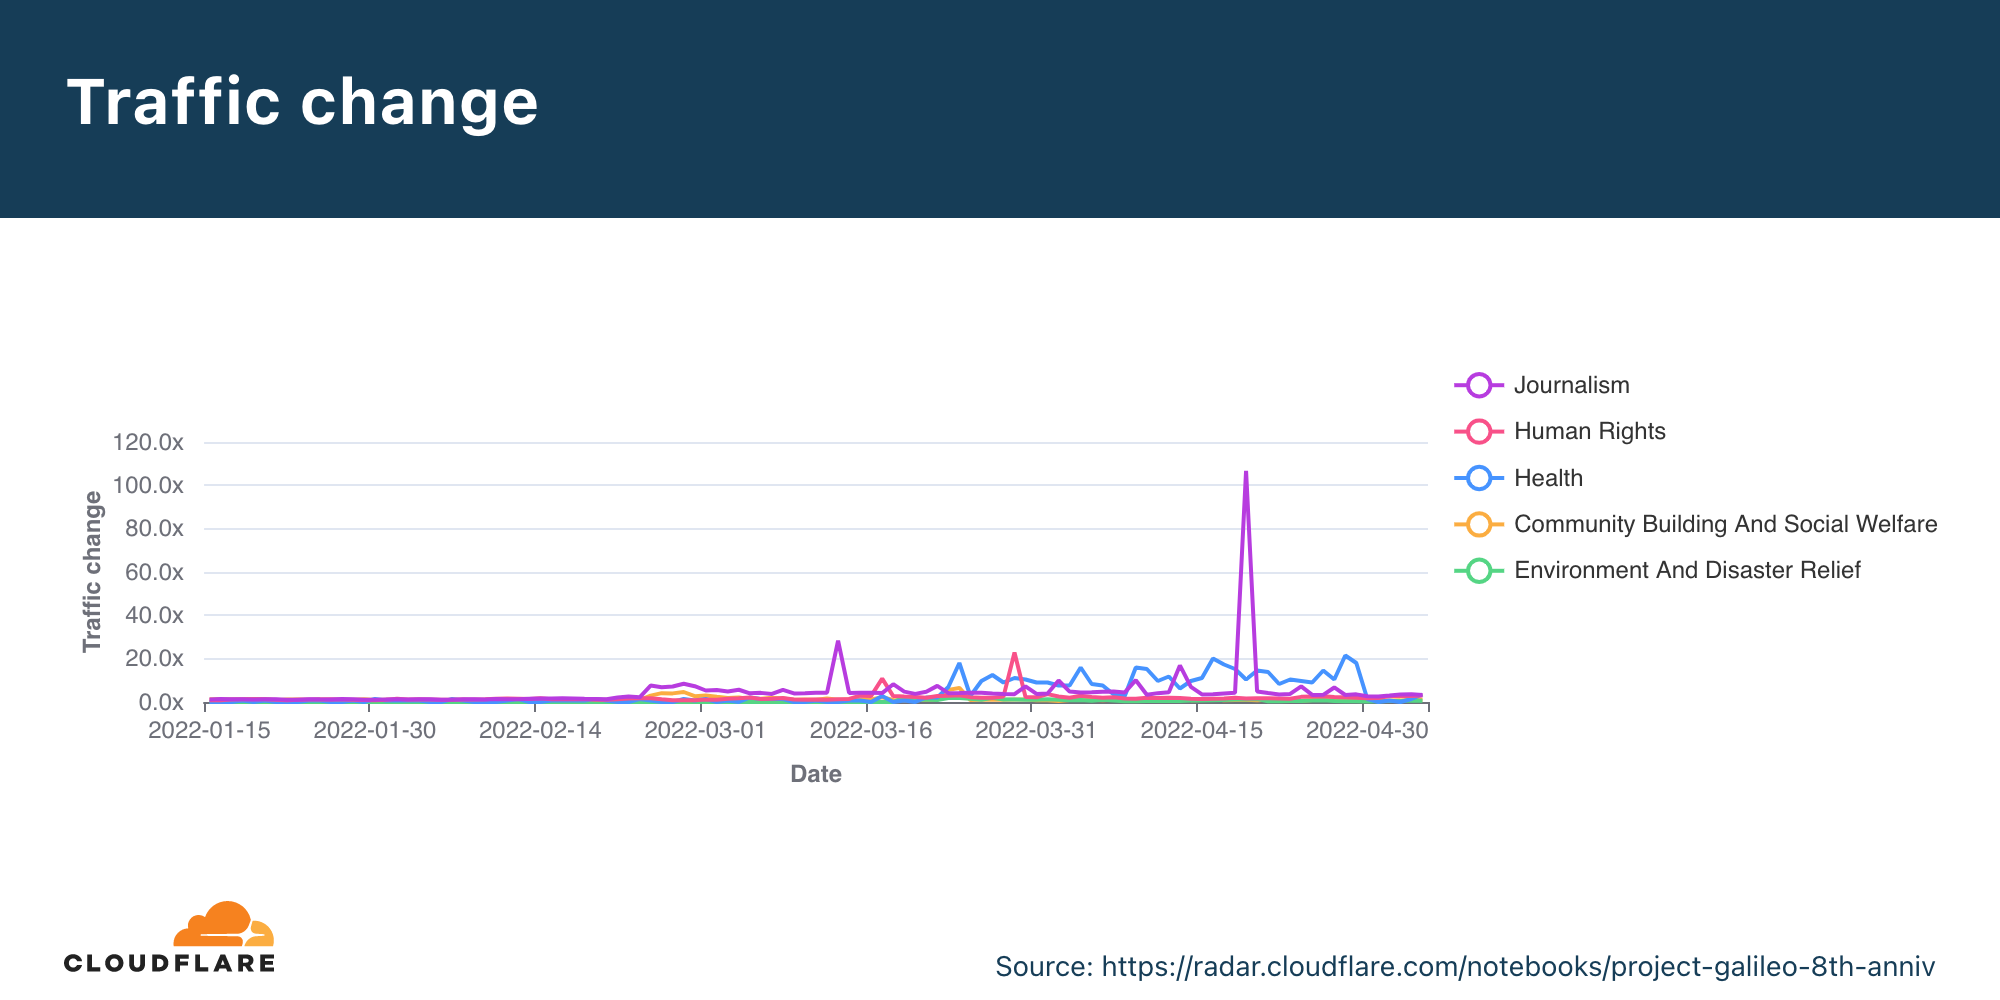
Since the start of the war, growth in traffic from protected organizations has varied across the categories. Traffic among Health organizations increased by 20-30x over baseline between late March and later April. Setting aside attack spikes, traffic from Journalism organizations was generally up 3-4x over baseline. Growth in the other categories was generally below 3x.

In Ukraine and beyond, what it takes to keep vulnerable groups online

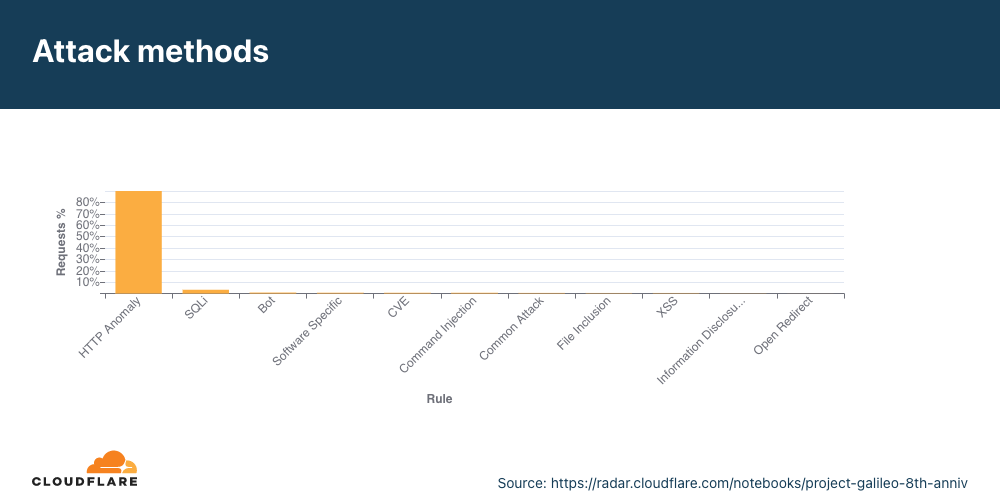
For traffic mitigated by the web application firewall (WAF), the most frequently applied rule was HTTP Anomaly, associated with 92% of requests. Requests for Web content (HTTP requests) have an expected structure, set of headers, and related values. Some attackers will send malformed requests, including anomalies like missing headers, unsupported request methods, using non-standard ports, or invalid character encoding. These requests are classified as “HTTP anomalies”. These anomalous requests are frequently associated with unsophisticated attacks, and are automatically blocked by Cloudflare’s WAF.

In Ukraine and beyond, what it takes to keep vulnerable groups online

With the ongoing war, we continue to onboard and provide protection to organizations in Ukraine and neighboring countries to ensure they have access to information. Any Ukrainian organizations that are facing attack can apply for free protection under Project Galileo by visiting www.cloudflare.com/galileo, and we will expedite their review and approval.

Attack methods based on region

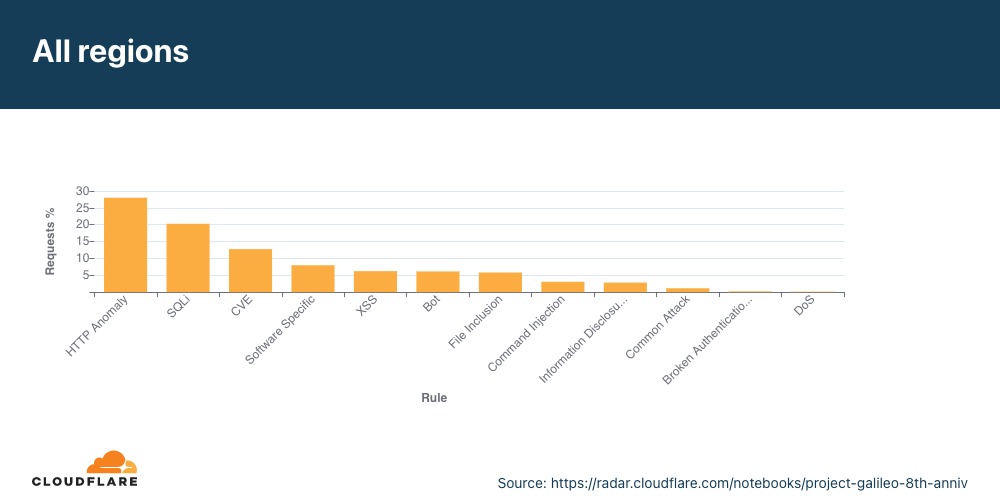
Across the Americas, Asia Pacific, Europe, and Africa/Middle East regions, the largest fraction (28%) of mitigated requests were classified as “HTTP Anomaly”, with 20% of mitigated requests tagged as SQL injection attempts and nearly 13% as attempts to exploit specific CVEs. CVEs are publicly disclosed cybersecurity vulnerabilities. Cloudflare monitors new vulnerabilities and quickly determines which require additional rulesets to protect our users. Depending on the vulnerability, they can be sophisticated attacks but depend on the severity, identification and response by security professionals.

In our previous report, we identified similar attack trends with SQLi injection and HTTP anomalies, classified as User agent anomalies, making up a large part of mitigated requests.

In Ukraine and beyond, what it takes to keep vulnerable groups online

Attacks methods by on organization type

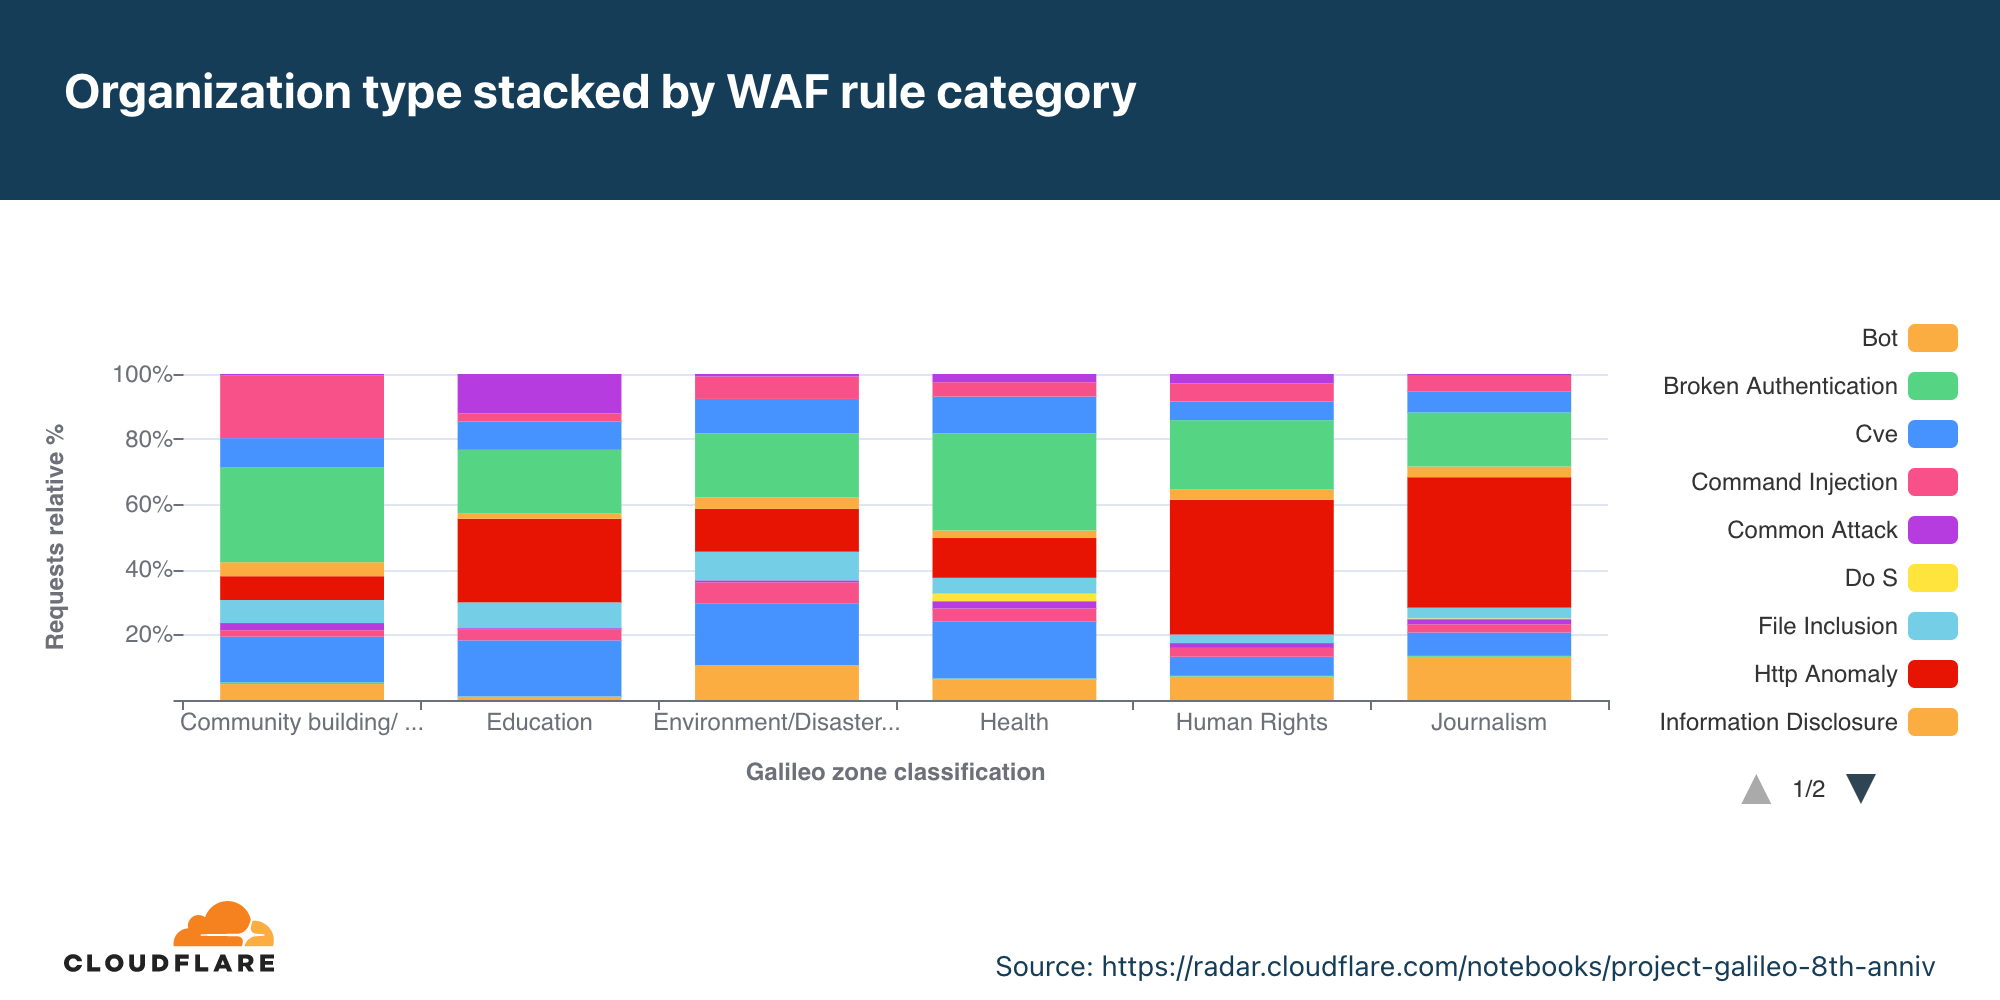
We protect a range of organizations under Project Galileo. For this dashboard, we categorized them in 6 groups: community building/social welfare, education, environmental/disaster relief, human rights and journalism. To help understand threats against these groups, we broke down the types of attacks we saw that were mitigated by the web application firewall. A majority of the mitigated traffic is from HTTP anomalies and SQLi (SQL injection).

SQLi is an attack technique designed to modify or retrieve data from SQL databases. By inserting specialized SQL statements into a form field, attackers attempt to execute commands that allow for the retrieval of data from the database, modification of data within the database, the destruction of sensitive data, or other manipulative behaviors.

In Ukraine and beyond, what it takes to keep vulnerable groups online

Learn more on the 8th Anniversary Radar DashboardSee the full report on attack trends we observed against a wide range of organizations protected under Project Galileo.

Дилемата пред Близкия изток. Разговор с Надим Шeхади

Post Syndicated from Мирослав Зафиров original https://toest.bg/nadim-shehadi-interview/

Надим Шехади (р. 1956) е изпълнителен директор на Академичния център на Ливано-американския университет в Ню Йорк и асоцииран сътрудник в Кралския институт за международни отношения („Чатъм Хаус“), където по-рано е ръководил програмата за Близкия изток. Бил е директор на Центъра за източносредиземноморски изследвания „Фарес“ към Факултета по право и дипломация в Университета „Тъфтс“ и дългогодишен директор на „Ливански изследвания“ в колежа „Св. Антоний“ към Оксфордския университет. Той е водещ учен по въпросите на Близкия изток и Северна Африка и е консултант на няколко правителства и международни организации, в т.ч. и на Европейския съюз. Негови статии са публикувани в големи международни новинарски издания, като „Ню Йорк Таймс“, „Гардиън“ и Си Ен Ен. 

По повод наскоро състоялите се парламентарни избори в Ливан, а и цялостната обстановка в Близкия изток в светлината на настоящите глобални кризи, с г-н Шехади разговаря Мирослав Зафиров. 


Според мнозина Ливан е своеобразен паноптикум на Близкия изток. Доколкото това е вярно, смятате ли, че е трудно да се предвиди какво е бъдещето на Близкия изток? Вече много години регионът сякаш не може да намери себе си.

Мнозинството от дисидентите, интелектуалците и хората на бизнеса намираха пристан в Бейрут, където свободно можеха да упражняват своите професии и да изразяват себе си. На практика Бейрут беше поле на сблъсък на идеи, които едва по-късно намираха аудитория на други места. Ливанската гражданска война от 1975 до 1990 г. се превърна в лаборатория на съперничещите си идеологии на исляма и национализма, на светското и религиозното начало, на шиитския и сунитския ислям, на либерализма и авторитаризма, и т.н.

Ние вече не се намираме в това положение, днес ще откриете този дебат по-скоро в Лондон, отколкото в Бейрут. Регионът постепенно навлезе в спиралата на непредсказуемостта – процес, започнал още през 50-те години на XX век. Възходът на светските националистически военни режими, който постепенно изтласка традиционната аристокрация и елитите, останали от Османската империя, показа истинското си лице – това на репресивния режим. Този режим бе особено безпощаден спрямо движенията, принадлежащи към политическия ислям. Но не само ислямистите бяха целта, скоро жертви на преследвания станаха левите политически течения и либералите.

Вероятно всичко това е в дъното на т.нар. Арабска пролет и е в основата на исканията на младото поколение за решително противопоставяне срещу доминацията на организации като милициите, свързани с иранския Корпус на стражите на Ислямската революция. Борбата беше срещу опита на КСИР да получи надмощие на всички места, където институционалността на държавата отслабваше или отсъстваше.

Какво е мнението Ви за наскоро проведените парламентарни избори в Ливан? След години на нарастващо напрежение, икономическа криза и политическа нестабилност смятате ли, че страната е готова да излекува своите рани? 

Изборите в Ливан наподобяват тези в Ирак от 2021 г., доколкото резултатите демонстрираха намаляване на влиянието на проиранските партии и милиции. И в двете държави имаше сходно по дух обществено настроение. В случая с Ливан „Хизбулла“ се ползваше с абсолютния контрол над шиитските гласове, а коалицията ѝ с другата шиитска партия – „Амал“, ѝ осигури 27 места в парламента, въпреки че партиите загубиха двете места, които не бяха предвидени за шиитите.

Системата в Ливан дава възможност на „Хизбулла“ и нейните съюзници да упражняват правото на вето върху всички назначения: председател на парламента, министър-председател, президент и т.н. Коалицията е в състояние да парализира всеки изборен процес, докато условията, налагани от „Хизбулла“, не бъдат изпълнени. Те направиха това през 2006 г., когато окупираха центъра на Бейрут и парализираха страната за 19 месеца. Кризата приключи едва със Споразумението от Доха от 2008 г., в което ветото на „Хизбулла“ беше на практика институционализирано. По-късно отново шиитската коалиция блокира политическия процес за нови 29 месеца – между 2013 и 2016 г., когато Ливан съществуваше без президент, изборите за парламент бяха забавени, а правителството беше лишено от възможност да функционира. И всичко това – за да може отново „Хизбулла“ да наложи избора си за държавен глава.

На 15 май 2022 г. бяха проведени парламентарни избори в Ливан, на които за първи път след десетилетия на доминация „Хизбулла“ загуби мнозинството си. Коалицията, водена от шиитското движение, разполага с 62 от 128 места в Народното събрание. Противниците на шиитската коалиция – в т.ч. и финансираната от Саудитска Арабия християнска партия „Ливански сили“ – спечелиха мнозинство. Сред големите изненади бе и победата на движението на друзкия лидер Уалид Джумблат над неговия исторически противник и лидер на другата основна друзка фамилия – Талал Арслан. Джумблат е известен с позицията си срещу влиянието на Сирия в Ливан. Заслужава внимание и ниската избирателна активност сред сунитското население, като много от поддръжниците на бившия премиер Саад Харири по този начин изразиха подкрепа за сина на загиналия през 2005 г. Рафик Харири и решението му да не участва в изборите.

Какъв е Вашият анализ на парламентарните резултати? Наистина ли говорим за постепенно отслабване на „Хизбулла“? 

Резултатите демонстрираха нарастваща опозиция срещу „Хизбулла“, но тези резултати засегнаха единствено нейните нешиитски съюзници. Основно „пострадаха“ просирийските кандидат-депутати, чиито имена бяха включени в списъците под натиска на Сирия или на „Хизбулла“. Всичко това обаче няма да повлияе особено на позициите на партията, защото хегемонията ѝ над шиитите остава, както и влиянието ѝ над шиитските депутати. Тя е в състояние да диктува своите условия.

Важно е да се отбележи, че общите листи между „Амал“ и „Хизбулла“ са резултат от споразумение, постигнато след тригодишни преговори. Лидерът на „Амал“ Набих Бери беше заявил, че „Хизбулла“ олицетворява Дракула, защото живее за сметка на кръвта, която пролива, и обвини партията, че е отговорна за убийството на повече шиити, отколкото самият Израел. Няколко от водещите фигури в „Амал“ бяха убити, а други напуснаха страната или бяха изолирани, докато най-сетне не беше сключено споразумението за обща листа. По този начин това, което по-късно стана известно като „шиитското дуо“, видя бял свят и не позволи появата на нови независими политически гласове сред шиитите. В шиитските части на Ливан общата листа получи почти пълна подкрепа. Подобно на вота в един авторитарен режим, 97,6 % от гласовете на шиитите бяха за коалицията между „Амал“ и „Хизбулла“.

През 2020 г. в статия за „Ню Йорк Таймс“ Лина Мунзер написа, че въпреки убеждението си, че могат да преживеят всичко, ливанците се оказаха излъгани. Вие съгласен ли сте с нея? И ако е така, кое е онова нещо, което ливанците не успяха да преживеят – последиците от Споразумението от Таиф? Възхода на „Хизбулла“ през годините? Сирийската война, а преди нея – израелската окупация в Южен Ливан? 

Признавам си, че не си спомням тази статия, но дори последните две години в Ливан бяха достатъчно трудни. Мнозина ливанци осъзнаха, че повече не са в състояние да „преживеят всичко“. Ливанците трябваше да избират между няколко дилеми – конфронтация или компромис, сигурност или свобода, война или мир, и т.н. Но в крайна сметка политическата ни система не можа да издържи на постоянния натиск на „Хизбулла“. Това е все едно да играете футбол под прицела на снайперист, по чиято воля във всеки момент всеки от играчите може да бъде елиминиран. Някои ливанци обвиняват системата, но аз лично смятам, че никоя система не е в състояние да понесе подобен партньор и да оцелее под подобен натиск.

Вие сте известен с позицията си спрямо Иран. Предвид санкциите смятате ли, че Иран някак успя да оцелее въпреки всички атаки срещу себе си? Също така успя ли Техеран да намери изход от кризата в Сирия?

Моето отношение не е спрямо Иран, а спрямо регионалната криминална структура, от която страдат включително и иранските граждани – по същия начин, по който жертви са и сирийците, и иракчаните, а донякъде – и палестинците и йеменците. Регионът е заложник на КСИР и неговите военни съюзници. Всички те използват един и същи набор от средства: убийства, парализа на политическата система, натиск.

Ние всички живеем в условията на последиците от войната между Иран и Ирак от 1980 г. Войната позволи на режима на Саддам Хюсеин да консолидира властта си и да наложи пълен контрол над Ирак, така както стори и КСИР в Иран. „Хизбулла“ е продължение на този процес, използвайки същата методология. Днес обаче ние виждаме ново поколение от хора, които се изправят срещу описаната тенденция в Ливан, Ирак, а и в самия Иран.

През 2011 и 2012 г., благодарение на Вашата помощ, София успя да стане домакин на първата истинска среща на сирийската опозиция. Мнозина бяха скептични, но срещата произведе първата обща декларация, която, за съжаление, впоследствие беше неглижирана от някои страни. Днес, десет години по-късно, какъв е изходът от продължаващата криза в Сирия, или тя вече е хроничен проблем, подобно на палестинския въпрос – две кризи, които влияят на стабилността в региона? 

От работата си по Сирия мога да направя два извода. Първият сочи, че беше грешка да се опитваме да формираме опозиция на режима в Дамаск. Подобен опит всъщност беше в полза на самия режим, тъй като това доведе до необходимостта самата опозиция да доказва своята легитимност и жизнеспособност. Дамаск се възползва от ситуацията, тъй като цялото световно обществено внимание се съсредоточи върху опозицията, а не върху деянията на режима.

Появата на опозицията също така позволи на медиите да започнат да говорят за водена в Сирия „гражданска война“, като по този начин се измести акцентът от темата за революцията, която настъпи там, и престъпленията, които режимът на Башар ал Асад извършваше срещу своите граждани, за да остане на власт. Опозицията беше под натиск да докаже легитимността си, че е обединена, че е светска, че има силно ръководство и т.н. Докато всъщност някаква форма на плурализъм, а и отсъствие на единно ръководство можеше да се смята за положителен феномен в нововъзникващото демократично общество след периода „Асад“.

Вторият извод, който мога да направя, говори за това, че в резултат на над 50-годишното управление на режима на семейство Асад сирийското общество беше доведено до ниво на политическа нефункционалност. Хората се надигнаха, излизайки анонимно по улиците, но едва сблъскали се с форма на лидерство или алтернативни групи, у тях веднага се появи едно вродено недоверие и подозрителност. Подозрение, което режимът и неговите служби за сигурност съзнателно подклаждаха.

Попаднеш ли в затвора, от теб ще бъде поискано да станеш доносник. Тези, които откажат, никога не напускат затвора и загиват там. Прекаралите години в затвора и хората, чиито семейства са страдали, веднага попадат под подозрение единствено заради това, че са успели да оцелеят. Всичко това наподобява поведението на ЩАЗИ и останалите служби за сигурност. По тази причина беше безсмислено да се опитваме да формираме опозиция, при условие че режимът бе все на мястото си, очаквайки, че ще можем да го заменим. Имаше един мъничък Башар във всеки човек в Сирия по това време.

След 24 февруари т.г. системата на международните отношения, завещана ни след Втората световна война, сякаш престана да съществува. Русия де факто не се ползва от привилегията да е част от клуба на т.нар. големи сили, представени от постоянните членки на Съвета за сигурност на ООН. Струва ли си да се поддадем на изкушението да мислим за свят след модела, заложен от държавите победителки, или по-скоро следва да запазим реда, докато не намерим с какво по-добро да заменим вече съществуващата система? 

Много от държавите в Близкия изток сякаш гледат на войната в Украйна с оптимизъм. Западът игнорираше руските действия в Сирия и сега западните държави осъзнават, че това, което се случва в Украйна, е своеобразно повторение на сирийския сценарий. Ние непрекъснато повтаряхме, че Башар ал Асад следва правилата от Хама и Грозни и че Иран действа по един криминален начин в Сирия чрез своите милиции, извършващи масови убийства. Но Западът избра да сключи сделка с Русия, с Иран и с Ал Асад за сметка на сирийския народ и за сметка на задълбочаваща се криза в Близкия изток.

Мнозина в Близкия изток са някак скептични да последват действията на САЩ и ЕС спрямо Русия. Египет, Ирак и ключови държави от Залива са дори доста внимателни. Какво мислите за това? 

Много малко е доверието в региона спрямо способността на САЩ или ЕС да отстояват своите позиции в Украйна. Видяхме, че и Вашингтон, и Брюксел сякаш признаха своето поражение в тази война, преди дори тя да е започнала. На президента Зеленски беше предложено той и семейството му да напуснат Украйна, докато САЩ и ЕС обсъждаха санкции, които да бъдат наложени едва след войната, а дори и по този въпрос нямаше съгласие. Да обсъждаш последиците от дадено събитие на практика означава да го приемеш за вече случило се. И страните в Залива и Ирак са непосредствено изложени на иранската заплаха и нямат никакво доверие, че САЩ ще ги защити. Египет се намира във фарватера на Залива, а режимът на Абделфатах ал Сиси не е в състояние да оцелее дори седмица без финансовата помощ на ОАЕ и Саудитска Арабия. Така виждам аз събитията.

Заглавна снимка: © Chatham House / Flickr

Източник

За украинските бежанци… и за нас

Post Syndicated from original http://www.gatchev.info/blog/?p=2457

Напоследък чух тонове плювни срещу украинските бежанци:

– че са гадове, понеже имат хубави коли и домове
– че искат да наливат бензин и да ядат в ресторанти, без да плащат
– че ние им даваме по 40 лева на ден от джоба си, а те искат повече
– (въпреки че имат цели куфари с пачки долари и евро, и мезонети по Черноморието)
– че им плащаме от джоба си да живеят в петзвездни хотели, докато българските пенсионери мрат от глад
– че са неблагодарници, понеже не им харесва да ги тъпчем по 6 души в стари ЖП контейнери
– че са неблагодарници, понеже се възмущават, че някой тук им обстрелвал децата с въздушна пушка
– че са неблагодарници, понеже не им харесва български патриоти да ги пребиват на улицата
– че са претенциозни, понеже някои искат да имат достъп до аптека, а някои – даже до лекар
– че са нагли, понеже се учудват, ако към храната няма прибори
– че нямат място тук, след като за по цяла седмица все още не са научили български добре
– че ако ги подслоняваме, Русия ще ни атакува (заслужено – украинците са нацисти!)
– че а пък в Германия умните германци не им дават никакви помощи
– че а пък в Германия тъпите германци им дават по 200 евро помощ на ден, и проклетите мръсници си живеят безгрижно
– накрая и че хич не са бежанци, след като след известен престой тук започват да бягат от България, обратно в Украйна, при войната…

(Съкратил съм списъка няколко пъти, читателю – нищо лошо не си ми направил…)

Срещу тези приказки стои само една, простичка и обикновена – че украинските бежанци бягат от война и имат нужда от помощ. Не са и нужни повече – истината по всеки въпрос е една, безкрайно много и различни могат да са лъжите.

Но има нещо, още по-важно от това.

На какви струни в човешката душа се опитват да свирят тези твърдения?
Какви качества и черти са нужни, за да им вярва човек?
И какви качества и черти са нужни, за да ги разпространява?
Що за човек трябва да е – отвътре, под маската, която носи?

И какви струни в душата докосва другото – че бежанците бягат от зло и имат нужда от помощ?
Какви качества трябва да има човек, за да мисли първо за това, а после дали имат пари?
Какви качества са нужни, за да им помага с каквото може – подслон, дарения, добра дума в Интернет?…
Какъв трябва да е такъв човек отвътре, под маската на ежедневието?

С кой от тези два типа хора искате да сте близки, приятели… свои?
А от кой е добре да се пазите и да стоите по-далече?
На кой от тези два типа хора бихте вярвали, а на кой – не?
Кой от тях ще ви се отплати дори за доброто със зло, а кой – дори за прегрешенията с добро?

Сред кой от тези типове хора искате да живеете и да бъдете?

В момента правите именно този избор.

Нямам какво да добавя.

One developer’s journey bringing Dependabot to GitHub Enterprise Server

Post Syndicated from Landon Grindheim original https://github.blog/2022-06-07-one-developers-journey-bringing-dependabot-to-github-enterprise-server/

If you’re like me, you’re still excited by last week’s news that Dependabot is generally available on GitHub Enterprise Server (GHES). Developers using GHES can now let Dependabot secure their dependencies and keep them up-to-date. You know who would have loved that? Me at my last job.

Before joining GitHub, I spent five years working on teams that relied on GHES to host our code. As a GHES user, I really, really wanted Dependabot. Here’s why.

🤕 Dependencies

One constant pain point for my previous teams was staying on top of dependencies. Creating a Rails project with rails new results in an app with 74 dependencies, Django apps start with 88 dependencies, and a project initialized with Create React App will have 1,432 dependencies!

Unfortunately, security vulnerabilities happen, and they can expose your customers to existential risk, so it’s important they are handled as soon as they’re published.

As I’m most familiar with the Ruby ecosystem, I’ll use Nokogiri, a gem for parsing XML and HTML, to illustrate the process of manually resolving a vulnerability. Nokogiri has been a dependency of every Rails app I’ve maintained. It’s also seen seven vulnerabilities since 2019. To fix these manually, we’ve had to:

  • Clone `my_rails_app`
  • Track down and parse the Nokogiri release notes
  • Patch Nokogiri in `my_rails_app` to a non-vulnerable version
  • Push the changes and open a pull request
  • Wait for CI to pass
  • Get the necessary reviews
  • Deploy, observe, and merge

This is just one of (at least) 74 dependencies in one Rails app. My team maintained 14 Rails apps in our microservices-based architecture, so we needed to repeat the process for each app. A single vulnerability would eat up days of engineering time. That’s just one dependency in one ecosystem. We also worked on apps written in Elixir, Python, JavaScript, and PHP.

If an engineer was patching vulnerabilities, they couldn’t pursue feature work, the thing our customers could actually see. This would, understandably, lead to conversations about which vulnerabilities were most likely to be exploited and which we could tolerate for now.

If we had Dependabot security updates, that process would have started with a pull request. What took an engineer days to complete on their own could have been done before lunch.

We could have invested in keeping all of our dependencies up-to-date. Incremental upgrades are typically easier to perform and pose less risk. They also give bad actors less time to find and exploit vulnerabilities. One of my previous teams was still running Rails 3.2, which was no longer maintained when Rails 6 was released six years later. As support phased out, we had to apply our own security patches to our codebase instead of getting them from the framework. This made upgrading even harder. We spent years trying to get to a supported version, but other product priorities always won out.

If my team had Dependabot version updates, Dependabot would have opened pull requests each time a new version of Rails was released. We’d still need to make changes to ensure our apps were compliant with the new versions, but the changes would be made incrementally, making the lift much lighter. But we didn’t have Dependabot. We had to upgrade manually, and that meant upgrading didn’t happen until it became a P0.

A new home

I joined GitHub in 2021 to work on Dependabot. Being intimately familiar with the challenges Dependabot could help address, I wanted to be part of the solution. Little did I know, the team was just starting the process of bringing Dependabot to GHES. Call it serendipity, a dream come true, or tea leaves arranged just so.

I quickly realized why Dependabot wasn’t already on GHES. GitHub acquired Dependabot in 2019, and it took some time to scale Dependabot to be able to secure GitHub’s millions of repositories. To achieve this, we ported the service’s backend to run on Moda, GitHub’s internal Kubernetes-based platform. The dependency update jobs that result in pull requests were updated to run on lightweight Firecracker VMs, allowing Dependabot to create millions of pull requests in just hours. It was an impressive effort by a small team.

That effort, however, didn’t lend itself to the architecture of GHES, where everything runs on a single server with limited resources. An auto-scaling backend and network of VMs wasn’t an option. Instead, we needed to port Dependabot’s backend to run on Nomad, the container orchestration option on GHES. The jobs running on Firecracker VMs needed to run on our customers’ hardware. Fortunately, organizations can self-host GitHub Actions runners in GHES, so we adapted them to run on GitHub Actions. We also had to adjust our development processes to support continuous delivery in the cloud and less frequent GHES releases.

The result is that developers relying on GHES now have the option to have their dependencies updated for them. Now, my former teammates can update their dependencies by:

  • Viewing the already opened pull request
  • Reviewing the pull request and the included release notes
  • Deploying, observing, and merging

We’re really proud of that. As for me, I get the immense satisfaction of knowing that I built something that will directly benefit my former teammates. It doesn’t get much better than that!

Guess what? GitHub is hiring. What would you like to make better?

If you’re inspired to work at GitHub, we’d love for you to join us. Check out our Careers page to see all of our current job openings.

  • Dedicated remote-first company with flexible hours
  • Building great products used by tens of millions of people and companies around the world
  • Committed to nurturing a diverse and inclusive workplace
  • And so much more!

AWS HITRUST Shared Responsibility Matrix version 1.2 now available

Post Syndicated from Sonali Vaidya original https://aws.amazon.com/blogs/security/aws-hitrust-shared-responsibility-matrix-version-1-2-now-available/

The latest version of the AWS HITRUST Shared Responsibility Matrix is now available to download. Version 1.2 is based on HITRUST MyCSF version 9.4[r2] and was released by HITRUST on April 20, 2022.

AWS worked with HITRUST to update the Shared Responsibility Matrix and to add new controls based on MyCSF v9.4[r2]. You don’t have to assess these additional controls because AWS already has completed HITRUST assessment using version 9.4 in 2021 . You can deploy your environments on AWS and inherit our HITRUST Common Security Framework (CSF) certification, provided that you use only in-scope services and apply the controls detailed on the HITRUST website.

What this means for our customers

The new AWS HITRUST Shared Responsibility Matrix has been tailored to reflect both the Cross Version ID (CVID) and Baseline Unique ID (BUID) in HITRUST so that you can select the correct control for inheritance even if you’re still using an older version of HITRUST MyCSF for your own assessment.

With the new version, you can also inherit some additional controls based on MyCSF v9.4[r2].

At AWS, we’re committed to helping you achieve and maintain the highest standards of security and compliance. We value your feedback and questions. You can contact the AWS HITRUST team at AWS Compliance Contact Us. If you have feedback about this post, submit comments in the Comments section below.

Want more AWS Security ‘how-to’ content, news, and feature announcements? Follow us on Twitter.

Author

Sonali Vaidya

Sonali leads multiple AWS global compliance programs, including HITRUST, ISO 27001, ISO 27017, ISO 27018, ISO 27701, ISO 9001, and CSA STAR. Sonali has over 20 years of experience in information security and privacy management and holds multiple certifications such as CISSP, C-GDPR|P, CCSK, CEH, CISA, PCIP, ISO 27001, and ISO 22301 Lead Auditor.

AWS achieves ISO 22301:2019 certification

Post Syndicated from Sonali Vaidya original https://aws.amazon.com/blogs/security/aws-achieves-iso-223012019-certification/

We’re excited to announce that Amazon Web Services (AWS) has successfully achieved ISO 22301:2019 certification without audit findings. ISO 22301:2019 is a rigorous third-party independent assessment of the international standard for Business Continuity Management (BCM). Published by the International Organization for Standardization (ISO), ISO 22301:2019 is designed to help organizations prevent, prepare for, respond to, and recover from unexpected and disruptive events.

EY CertifyPoint, an independent third-party auditor, issued the certificate on June 2, 2022. The covered AWS Regions are included on the ISO 22301:2019 certificate, and the full list of AWS services in scope for ISO 22301:2019 is available on our ISO and CSA STAR Certified webpage. You can view and download the AWS ISO 22301:2019 certificate on demand online and in the AWS Management Console through AWS Artifact.

As always, we value your feedback and questions and are committed to helping you achieve and maintain the highest standard of security and compliance. Feel free to contact our team through AWS Compliance Contact Us. If you have feedback about this post, submit comments in the Comments section below.

Want more AWS Security how-to content, news, and feature announcements? Follow us on Twitter.

Author

Sonali Vaidya

Sonali leads multiple AWS global compliance programs, including HITRUST, ISO 27001, ISO 27017, ISO 27018, ISO 27701, ISO 9001, and CSA STAR. Sonali has over 20 years of experience in information security and privacy management and holds multiple certifications, such as CISSP, C-GDPR|P, CCSK, CEH, CISA, PCIP, and Lead Auditor for ISO 27001 and ISO 22301.

Introduction to Amazon QuickSight ML Insights

Post Syndicated from Rashid Sajjad original https://aws.amazon.com/blogs/big-data/introduction-to-amazon-quicksight-ml-insights/

Amazon QuickSight was launched in November 2016 as a fast, cloud-powered business analytics service to build visualizations, perform ad hoc analysis, and quickly get business insights from a variety of data sources. In 2018, ML Insights for QuickSight (Enterprise Edition) was announced to add machine learning (ML)-powered forecasting and anomaly detection with a few clicks. These insights are automatically generated as suggested insights, and you can also add custom insights to your analysis. Because they’re written out in narrative format, they’re easily consumable by any non-technical user and are a great way to increase adoption of your dashboards. Let’s dive deeper on how these insights are built and how to correctly set up your data to maximize the Suggested Insights feature.

What are ML Insights?

QuickSight uses ML to help uncover hidden insights and trends in your data. It does that by using an ML model that over time and with an increasing volume of data being fed into QuickSight, continually learns and improves its abilities to provide three key features (as of this writing):

  • ML-powered anomaly detection – Detect outliers that show significant variance from the dataset. This can help identify significant changes in your business metrics such has low-performing stores or products, or top selling items.
  • ML-powered forecasting – Detect trends and seasonality to forecast based on historical data. This can help project sales, orders, website traffic, and more.
  • Autonarratives – Embed narratives in your dashboard to tell the story of your data in plain language. This can help convey a shared understanding of the data within your organization. You can use either the suggested autonarrative or you can customize the computations and language to meet your organization’s unique requirements.

How does the ML model work?

QuickSight uses a built-in version of the Random Cut Forest (RCF) algorithm. This is a special type of Random Forest (RF) algorithm, a widely used and successful technique in ML. It takes a set of random data points, cuts them down to the same number of points, and then builds a collection of models. In contrast, a model corresponds to a decision tree—thereby the name “forest.” Because RFs can’t be easily updated in an incremental manner, RCFs were invented with variables in tree construction that were designed to allow incremental updates.

The key takeaway is that RCF is great for finding anomalies and building forecasts. This algorithm is good at finding data points that are outliers or finding trends and patterns to forecast future values.

One important thing to know about ML models is that each model is good at a certain set of predictive activities, but no one model is good for all activities.

Now that you understand what the RCF model is good at, namely anomaly detection and forecasting, you need to make sure the data meets certain requirements, so let’s walk through those steps.

Best practices for setting up data

To maximize the RCF model’s efficiency, the data that is being imported needs to contain certain properties:

  • At least one metric – Whatever you’re measuring (sold units, orders, and so on).
  • At least one dimension – The category or slice by which you look at the metric (product category, industry, customer type, and so on).
  • Data volumes – Your dataset requirements depend on your objective:
    • Anomaly detection – Requires at least 15 data points. For example, if you have Bicycles as a product category and want to detect anomalies at a daily level, you need at least 15 days of transactions (you could have multiple rows for multiple transactions in a given day) for Bicycles in the dataset.
    • Forecasting – This works best with a large dataset simply because the more history you have, the better the model can extract patterns and trends and generate future probable values. If you have daily aggregates, you need at least 38 days of data.
  • At least one date column – If we want to analyze anomalies or forecasts in the dataset.

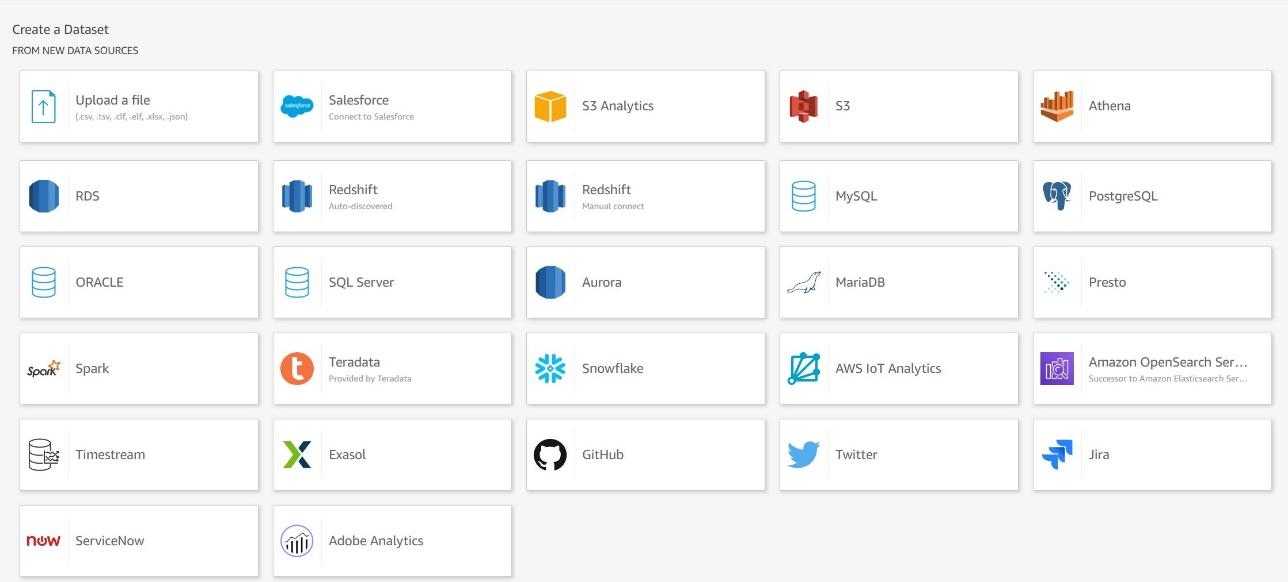
QuickSight supports a wide variety of connections, like Amazon Simple Storage Service (Amazon S3), Amazon Athena, and Apache Spark. For more information about supported connections and some connection examples, refer to Amazon QuickSight Connection examples.

Get started with Suggested Insights

Let’s use a sample dataset and walk through an example of how to use the Suggested Insights feature.

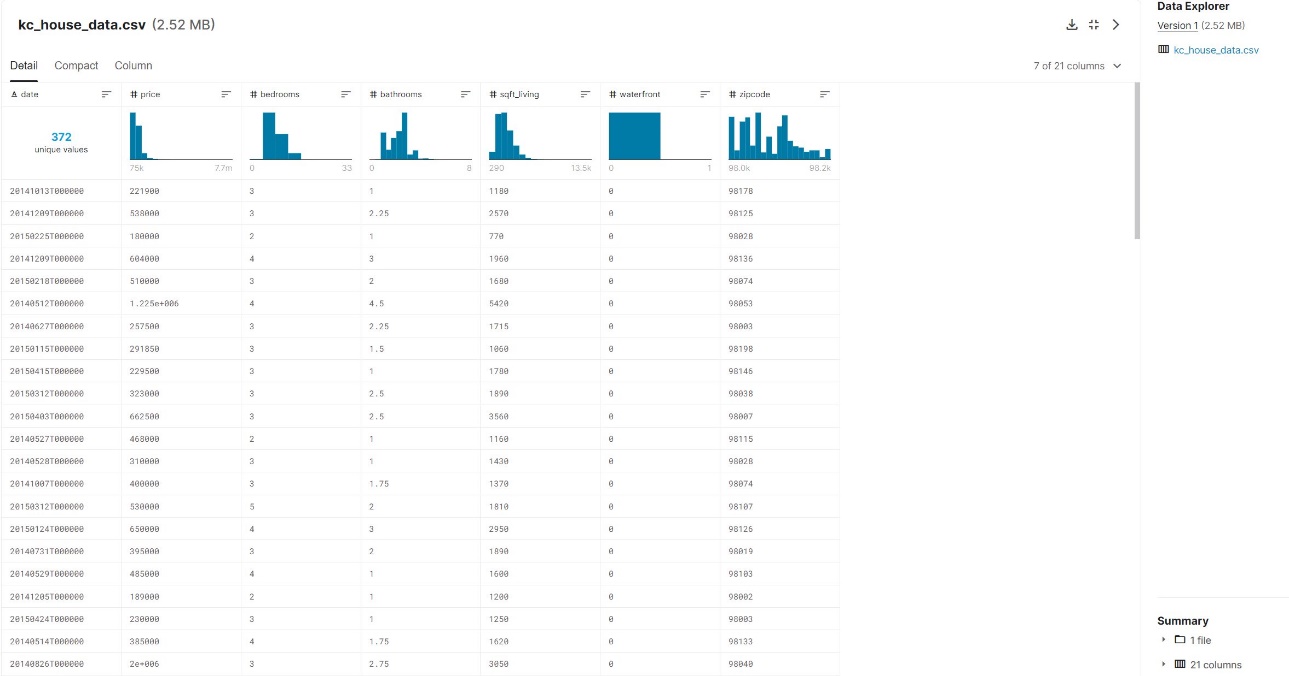
To get started, let’s download a sample dataset from the public domain. For this post, we use House Sales in King County, USA. You need to have a Kaggle account to download the resource.

  1. Download and unzip the file.

If you inspect the CVS file, you will notice it has the right grain (date), metrics (price, bedrooms) and categories (zipcode, waterfront).

Depending on what your analysis needs are, even bedrooms could be a category by which you analyze price. So your metrics and categories ultimately depend on your analysis goals.

  1. Log in to your QuickSight account or sign up for a QuickSight Enterprise Edition account to use ML Insights.

We need to create a dataset first before we can create a QuickSight analysis.

  1. Choose New dataset.
  2. Choose Upload a file.
  3. Choose the unzipped CSV file.
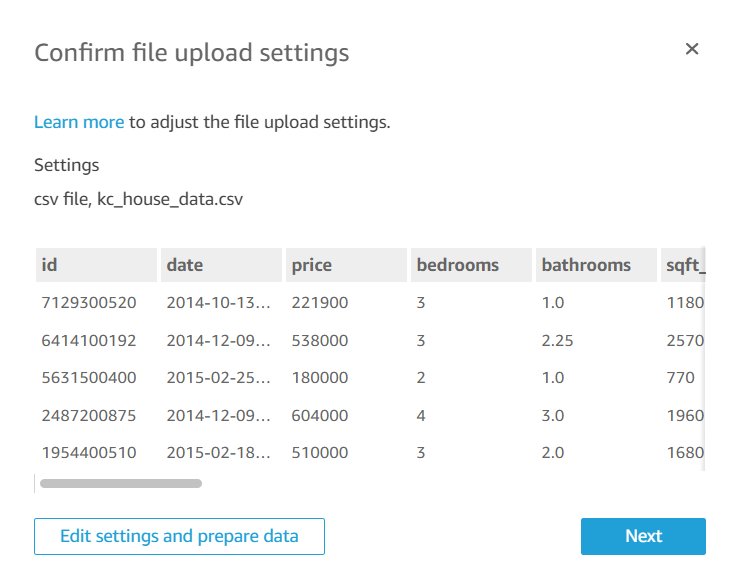
  4. In the pop-up window, confirm the file upload settings, then choose Edit settings and prepare data.

You’re redirected to the data preparation editor. This is one of the most important yet overlooked functions in QuickSight.

This editor allows you to review your imported fields and their data types, specify if the field will be used as a dimension or measure, along with many other important data import functions. For production datasets, you should spend time reviewing how the dataset has been set up here.

For our sample CSV file, it’s imported into a QuickSight SPICE by default. SPICE is an in-memory engine for fast querying of imported data. For more details, see Importing data into SPICE.

  1. Choose Save & publish to start importing the CSV file into the SPICE engine.

The default dataset name is the file name that was imported, so in our case it’s kc_house_data. You can choose the dataset on the Datasets page to see the import stats for the dataset.

  1. Choose Create analysis to start creating your QuickSight analysis.

The analysis editor page starts by showing a blank Sheet 1 on your workspace. On the top right, your dataset’s import stats are shown again (this becomes important when importing or refreshing large datasets because the import job might still be in progress).

Let’s start by creating our first visual. The default visual type is AutoGraph, which will try to pick the best visual type based on the fields being selected.

  1. Choose the date field.

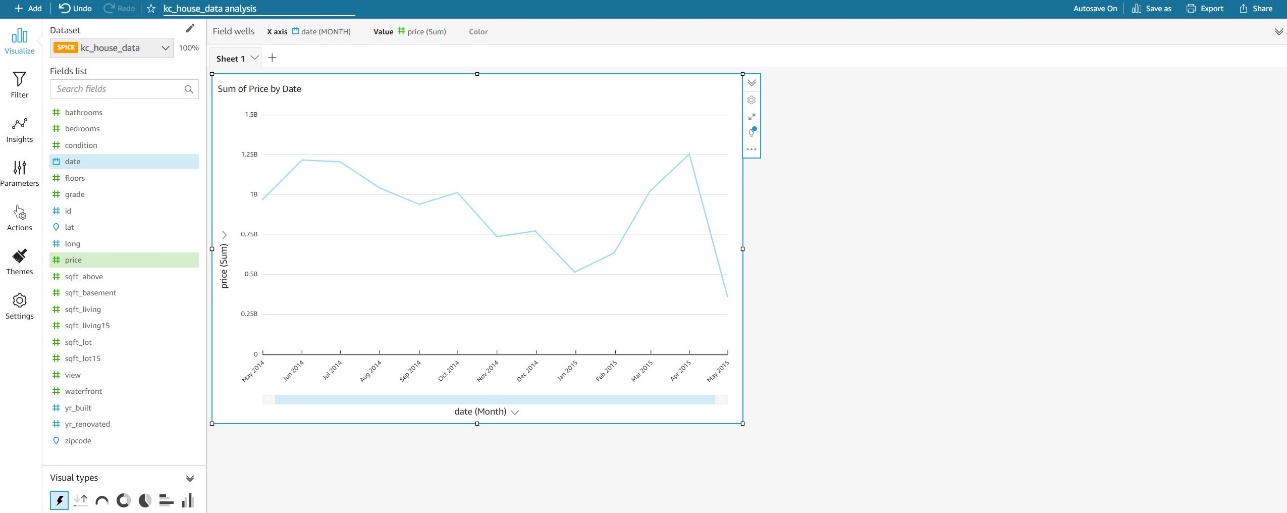
The visual changes to Count of Records by Date, with the date aggregation set to Day.

  1. To change the aggregation to monthly, choose the down arrow next to date on the X axis.
  2. Choose the price field.

The AutoGraph detects that the date is a dimension (blue color) and the price is a measure (green color) because these were set up like that in the dataset editor screen (I mentioned earlier how important the data preparation editor was).

Because these fields are already set up as dimensions and measures, the AutoGraph automatically changes to Sum of Price by Date.

This visualization isn’t very helpful. What we’re really looking for is the average price per month.

  1. For Field wells, choose price for Value and change the aggregate to Average.

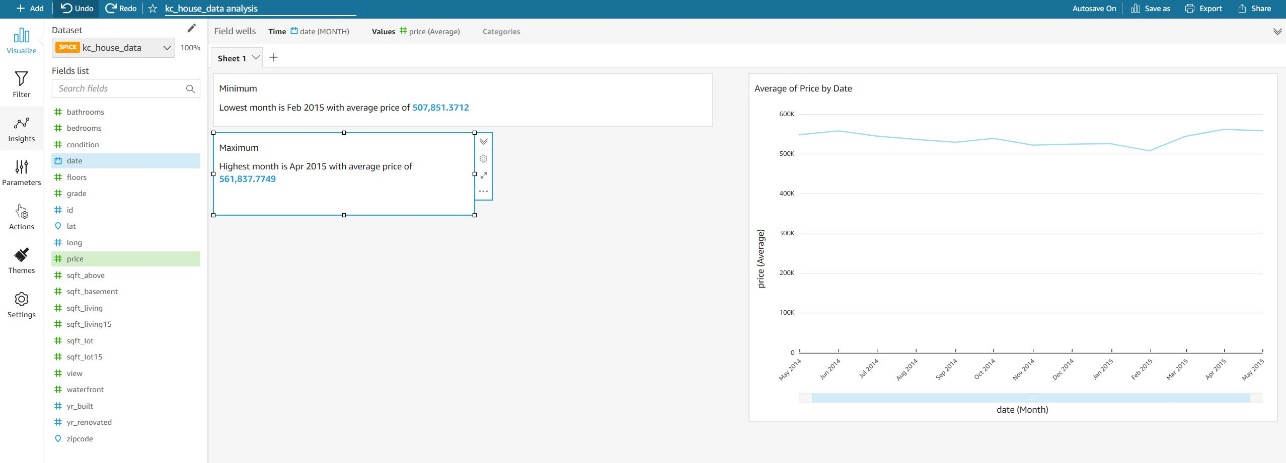
We now have a nice visual that shows us the average sale price of homes in Kings County by month.

Now comes the fun part—ML Insights!

  1. In the navigation pane, choose Insights.

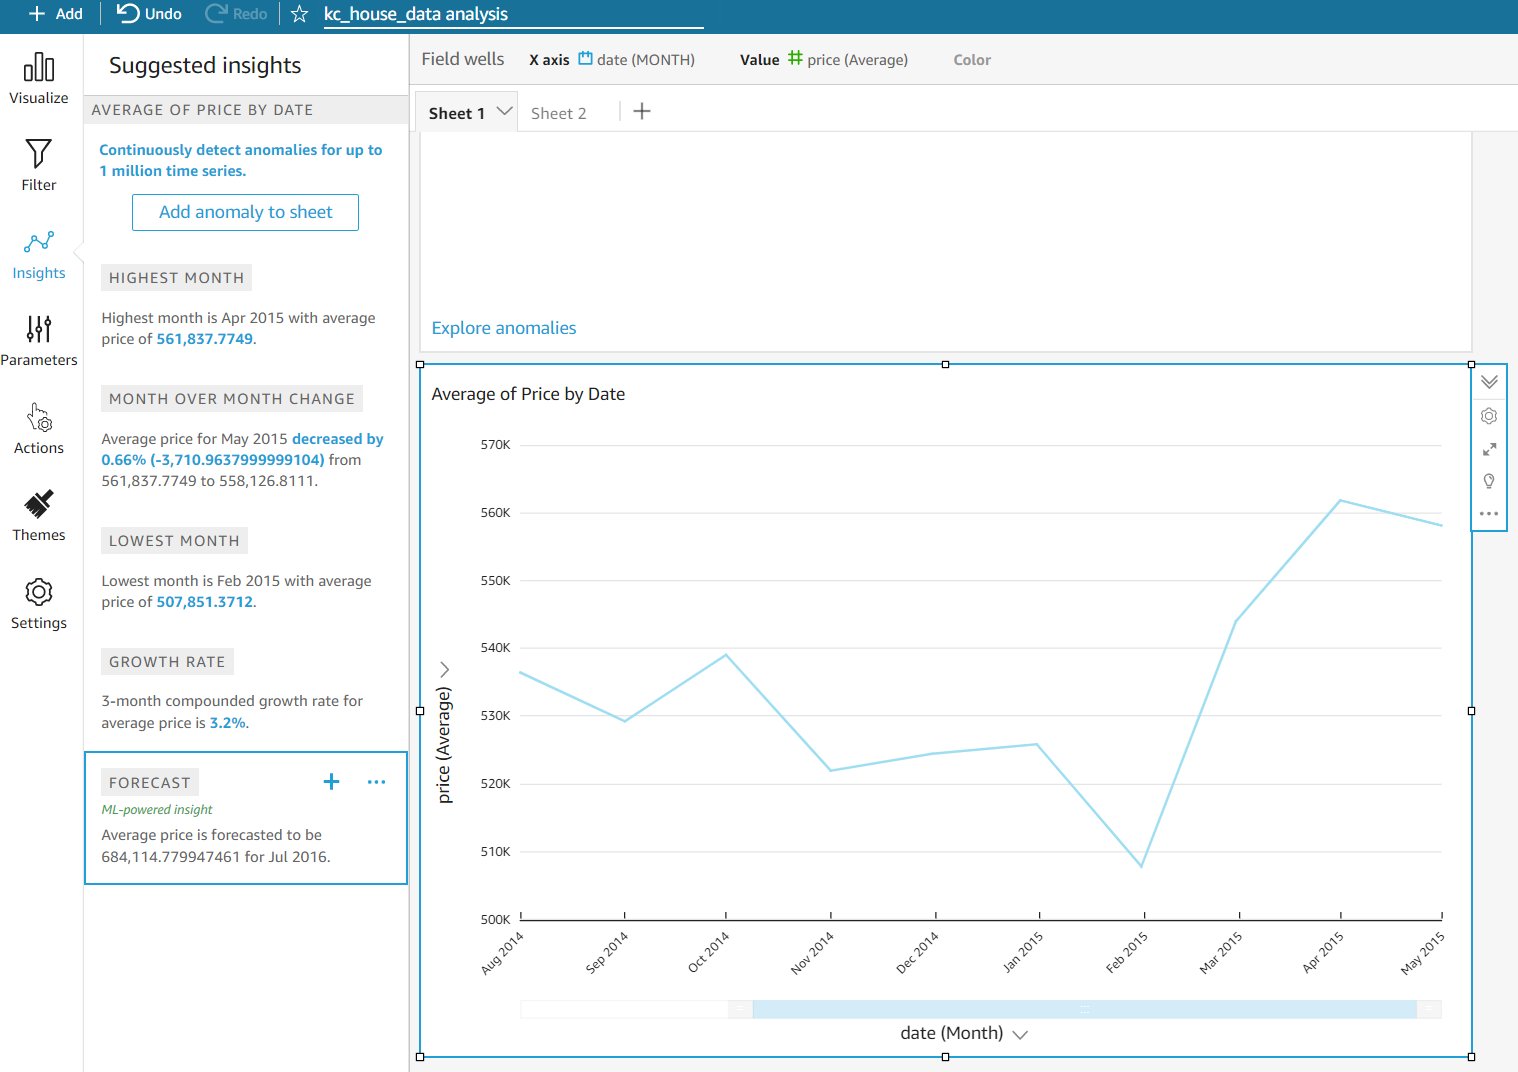
Voila! QuickSight has already run the RCF model along with other statistical computations and has generated insights that are ready to be added.

These suggested insights change based on the type of visual and data that is currently in the visual. We look at how suggested insights change later in this post.

Two immediately useful insights are Highest Month and Lowest Month.

Hover over the Highest Month insight and choose the plus sign to add it to the current Sheet 1.

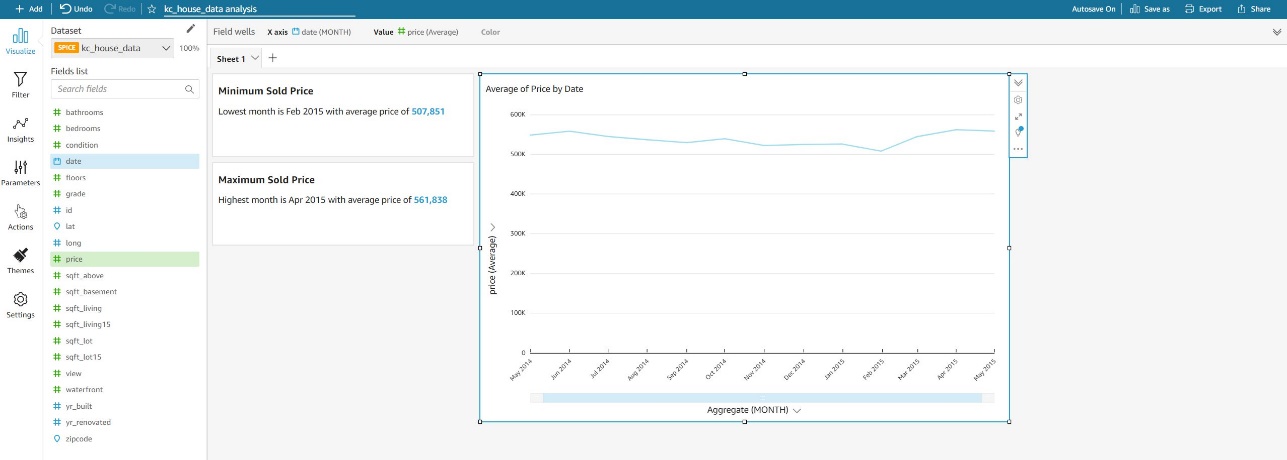
I can start rearranging insights and visuals and format the price field to give my current layout a more polished look.

  1. For this post, change the format of the price field to 1,2345 to remove decimals.
  2. You can also add titles for the insights and rename the X axis label date to Aggregate.
  3. To add another sheet, choose the plus sign next to Sheet 1.

By default, we start again with an AutoGraph visual.

  1. Under Visual types¸ choose the vertical bar chart.
  2. Choose the price and zipcode fields.
  3. Change the aggregation of price from Sum to Average.
  4. Choose Insights in the navigation pane.

Suggested Insights now displays a completely different set of data highlights compared to Sheet 1.

Although the vertical bar chart may already tell you the top three and bottom three zip codes, Suggested Insights already recognized the type of analysis and selected the best insights to display.

Although you might eventually build a visual to portray the intended story, Suggested Insights speeds up the process of showcasing the highlights in your data and adding them to your worksheet to quickly give the reader the most important insights from your visuals.

Anomaly detection

An anomaly in QuickSight is described a data point that fall outside an overall pattern of distribution. ML-powered anomaly detection in QuickSight enables you to identify the causations and correlations to make data-driven decisions.

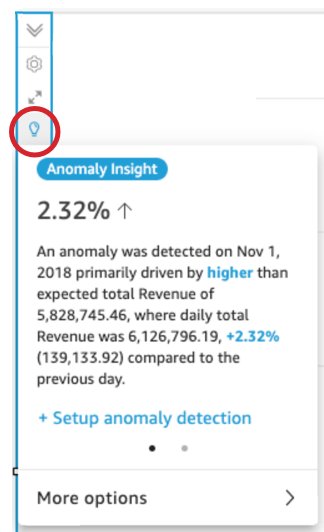
We already talked about data preparation for anomaly detection earlier. QuickSight already ran the RCF model during data import. As soon as a visual is added, QuickSight notifies you on the visual if it has detected an “Anomaly Insight.” This part of Suggested Insights. You can choose Setup anomaly detection to add this to your sheet.

You can also manually add an ML insight to detect anomalies.

  1. Let’s go back to Sheet 1 with the line chart displayed.
  2. When you choose the first suggested insight, it starts creating a widget for anomaly detection.

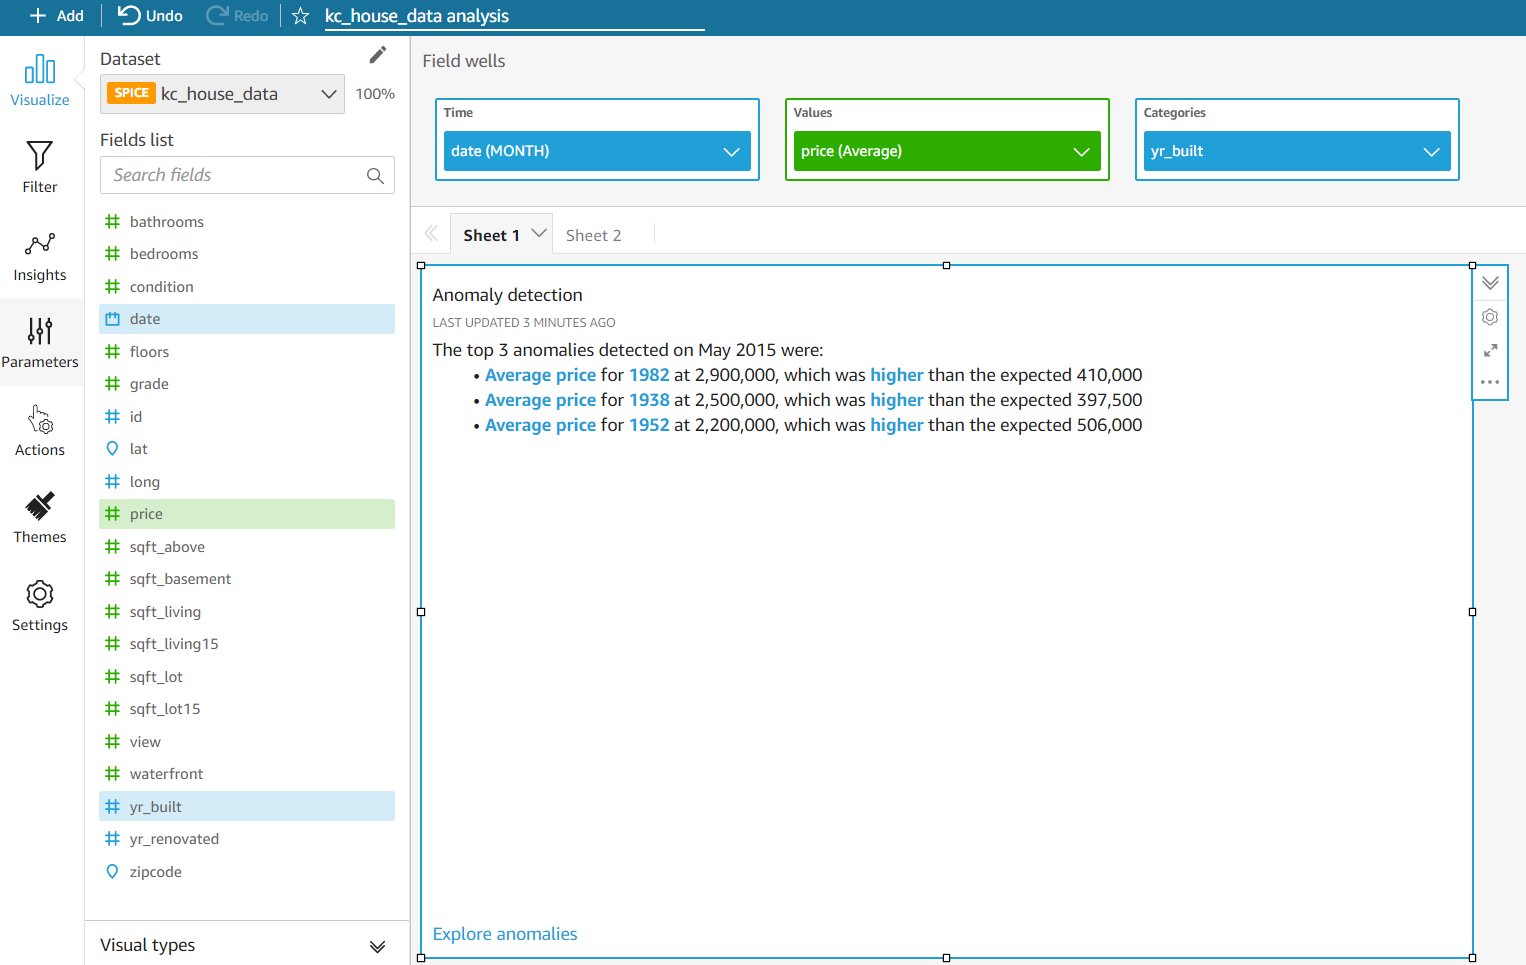
You can add up to five dimensions fields (not calculated fields, unless they were created in the data prep screen). QuickSight splits the metrics using the fields in the Categories section. We use the date field (our time dimension), price (our metric), and yr_built (our category) to create an anomaly detection insight. The question we are trying to answer is “Were there any monthly outliers in price based on the year built?”

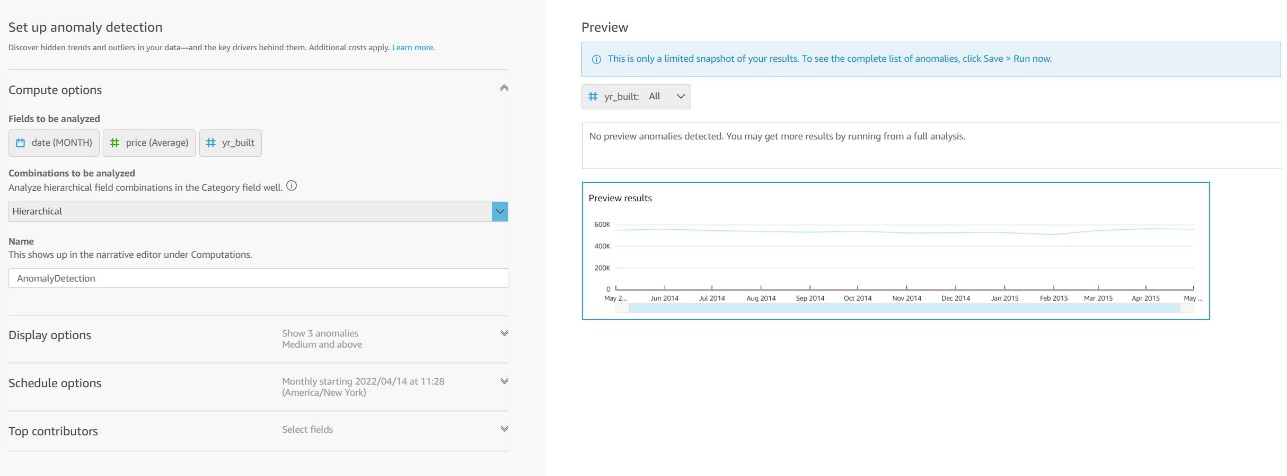
  1. Choose Get started to set up anomaly detection.
  2. For Combinations to be analyzed, choose your field combinations.

Choosing Exact means that the date and price are analyzed against the yr_built dimension. You can also choose Hierarchical or All. These latter options become relevant when you choose multiple dimensions in the Categories list. For more information about these options, refer to Adding an ML insight to detect outliers and key drivers.

  1. Choose Save to return to Sheet 1.

Our widget is configured at this point.

  1. Choose Run now to start analyzing the data for anomalies.

Based on the volume of data and the number of data points in the analysis, it may take a while to run the anomaly detection.

Keep in mind that at least 15 data points are needed to run an anomaly, but then you can change the aggregation of a field to have a zoom-out view and therefore view anomalies at a higher level.

For example, if you choose the date field and change Aggregate to Monthly, you get the top anomalies at the monthly level.

In our test case, QuickSight identified a top anomaly. This is a great widget that immediately draws the reader to highlights in data that are outliers and might require further investigation.

Forecast

With ML-powered forecasting, you can forecast your key business metrics in QuickSight easily. The ML algorithm in QuickSight is designed to handle complex real-world scenarios. Not only does QuickSight provide the capability to create forecasts, it also provides Forecast as a Suggested Insight.

  1. Going back to Sheet 1, choose the line chart and expand Insights.

At the bottom you will see a suggested forecast insight. Forecast insights, along with all other suggested insights, are dynamic in the sense that when your data updates or when a user applies filters, the values in the insight will update immediately. Once you add this to your sheet you can even customize how many periods in the future you want the insight to display for the forecast by editing the Narrative and then editing the forecast Calculation.

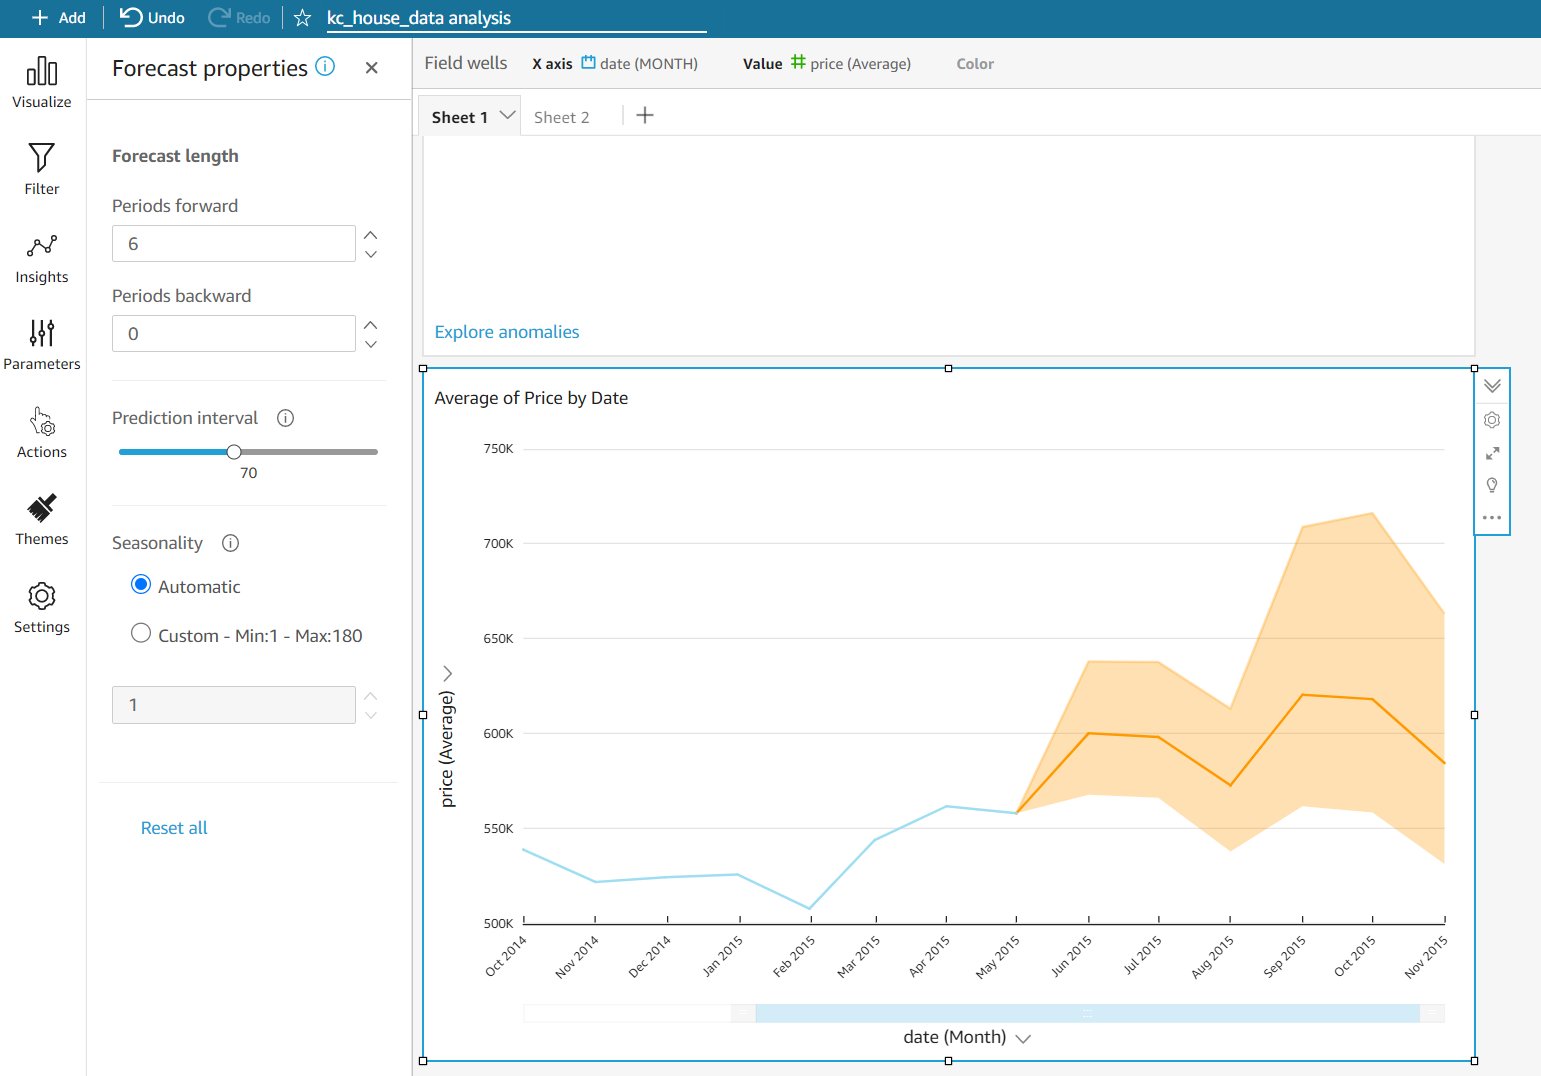
What if we wanted to customize the price forecasting on this line chart and add it in the visual?

  1. Choose the options menu (three dots) at the top right of the visual and choose Add forecast.
  2. For Periods forward, enter 6.

That is the time interval selected for the visual.

  1. Set Prediction interval to 70.

This is the amount of interval between data points. It causes the forecast to either go wider or narrower. A wider interval means wider gaps between data points, which means the net change is higher, and vice versa.

  1. Leave Seasonality set to Automatic.

Seasonality takes into account complex seasonal trends in your data. You can experiment with both settings to see how it affects the forecast. For our scenario, because house sales are seasonal, we chose Automatic.

  1. Choose Apply.

With just a few clicks, we have added a forecast to our visual, as shown in the following screenshot. The orange shaded area represents the upper and lower bound of the forecasted price.

This is another great way to add intelligence to your data and quickly let analysts focus on key data points and trends.

Conclusion

The Suggested Insights feature in QuickSight allows you to speed up the discovery and highlighting of key data elements. You can find insights in your data faster, and because they’re written out in narrative format, they’re very easy for non-technical users to quickly gain insight into the most interesting trends in the data with no ML training needed.

For more details on QuickSight ML Insights, refer to the QuickSight documentation or interact with the QuickSight Community.

As always, AWS is customer obsessed and we are ready to help with any specific questions.


About the Author

Rashid Sajjad is a Partner Management Solutions Architect focused on Big Data & Analytics with Amazon Web Services. He works with APN Partners to help develop their Migration, Data & Analytics and AI/ML Practices with enterprise, mission critical solutions for their end customers.r

Identifying Cloud Waste to Contain Unnecessary Costs

Post Syndicated from Ryan Blanchard original https://blog.rapid7.com/2022/06/07/identifying-cloud-waste-to-contain-unnecessary-costs/

Identifying Cloud Waste to Contain Unnecessary Costs

Cloud adoption has exploded over the past decade or so, and for good reason. Many digital transformation advancements – and even the complete reimagination of entire industries – can be directly mapped and attributed to cloud innovation. While this rapid pace of innovation has had a profound impact on businesses and how we connect with our customers and end users, the journey to the cloud isn’t all sunshine and rainbows.

Along with increased efficiency, accelerated innovation, and added flexibility comes an exponential increase in complexity, which can make managing and securing cloud-based applications and workloads a daunting challenge. This added complexity can make it difficult to maintain visibility into what’s running across your cloud(s).

Beyond management challenges, organizations often run into massive increases in IT costs as they scale. Whether from neglecting to shut down old resources when they are no longer needed or over-provisioning them from the beginning to avoid auto-scaling issues, cloud waste and overspend are among the most prevailing challenges that organizations face when adopting and accelerating cloud consumption.

Just how prevalent is this issue? Well, according to Flexera’s 2022 State of Cloud Report, nearly 60% of cloud decision-makers say optimizing their cloud usage to cut costs is a top priority for this year.

The cost benefits of reducing waste can be massive, but knowing where to look and what the most common culprits of waste can be a challenge, particularly if your organization are relative novices when it comes to cloud.

Common cases of cloud waste and how to avoid them

Now that we’ve covered the factors that drive exploding cloud budgets, let’s take a look at some of the most common cases of cloud waste we see, and the types of checks you and your teams should make to avoid unnecessary spending. I’ve categorized these issues as major, moderate, and minor, based on the relative cost savings possible when customers we’ve worked with eliminate them.

Important to note: While this is what we’ve seen in our experience, it’s important to keep in mind that the actual real-world impact will vary based on each organization’s specific situation.

Unattached volumes (major)

Multiple creation and termination of instances often results in certain volumes remaining attached to already terminated instances. These unused and overlooked volumes contribute directly to increased costs, while delivering little or no value.

Cloud teams should identify volumes that are not shown as attached to any instances. Once detected, schedule unattached storage volumes for deletion if they are no longer in use. Alternatively, you could minimize overhead by transitioning these volumes to serve as offline backups.

Load balancer with no instances (major)

Load balancers distribute traffic across instances to handle the load of your application. If a load balancer is not attached to any instances, it will consume costs without providing any functionality. An orphaned load balancer could also be an indication that an instance was deleted or otherwise impaired.

You should identify unattached load balancers, and double-check to make sure there isn’t a larger problem related to an improperly deleted instance that was once associated with those load balancers. After you’ve determined there isn’t a bigger issue to dig into, notify the necessary resource owners that they should delete them.

Database instance with zero connections (moderate)

Databases that have not been connected to within a given time frame are likely to be billable for all classes of service, except for free tiers.

After some agreed-upon time frame (we typically see teams use about 14 days), you should consider these databases stale and remove them. It’s important here to be sure there isn’t a good reason for the perceived inactivity before you go ahead and hit that delete button.

Snapshot older than 60 days (moderate)

Snapshots represent a complete backup of your computing instances at a specific point in time. Maintaining snapshot backups incurs cost and provides diminishing returns over time, as snapshots become old and diverge more and more from the instances they originally represented.  

Unless regulatory compliance or aggressive backup schedules mandate otherwise, old snapshots should be purged. Before scheduling a deletion or taking any other actions, create a ServiceNow Incident for reporting purposes and to ensure snapshot policy socialization.

Instance with high core counts (minor)

Instances that have more cores will tend to perform tasks more quickly and be able to handle larger loads. However, with greater power comes greater costs. For many workloads, eight cores should be more than sufficient.

Users should identify these instances, mark them non-compliant, and notify the resource owner or operations team about potentially downsizing, stopping, or deleting instances with more than eight cores.

How InsightCloudSec can help contain cloud costs

By this point, you might be wondering why we here at Rapid7 would be writing about cloud cost management. I mean, we’re a security company, right? While that’s true, and our dedication to powering protectors hasn’t waned one bit, the benefits of InsightCloudSec (ICS) don’t stop there.

ICS provides real-time visibility into your entire cloud asset inventory across all of your cloud platforms, which gives us the ability to provide relevant insights and automation that help improve cost effectiveness. In fact, we’ve got built-in checks for each of the issues outlined above (and many more) available right out of the box, as well as recommended remediation steps and tips for automating the entire process with native bots. So while you might initially look into our platform for the ability to simplify cloud security and compliance, you can also use it to get a handle on that runaway cloud spend.

Our customers have realized massive savings on their cloud bills over the years, covering portions –  or in some cases, the entirety – of the cost of their InsightCloudSec licenses. (Gotta love a security platform that can pay for itself!) If you’re interested in learning more about how you accelerate in the cloud without sacrificing security and save some money at the same time, don’t hesitate to request a free demo!

Additional reading:

NEVER MISS A BLOG

Get the latest stories, expertise, and news about security today.

[$] Best practices for fstests

Post Syndicated from original https://lwn.net/Articles/897061/

As a followup to a session on testing
challenges
earlier in the day, Josef Bacik led a discussion on best
practices for testing in a combined storage and filesystem session at the
2022 Linux Storage,
Filesystem, Memory-management and BPF Summit
(LSFMM). There are a
number of ways that developers can collaborate on improving the testing
landscape using fstests and blktests, starting with gathering and sharing
information about which tests are expected to pass and fail. That
information depends on a lot of different factors, including kernel version
and configuration, fstest options, and more.

Fedora 34 is EOL

Post Syndicated from original https://lwn.net/Articles/897247/

The Fedora 34 distribution release has gone out of the supported mode:
“No further updates, including security updates, will be available for
Fedora 34
“. Users should update to the Fedora 35 or 36
release.

The collective thoughts of the interwebz