Post Syndicated from Crosstalk Solutions original https://www.youtube.com/watch?v=Ok8NVINK87c
Lex Borrero | The New Multi-Hyphenate | Talks at Google
Post Syndicated from Talks at Google original https://www.youtube.com/watch?v=hpIzALZC3Vc
Introducing Cloudflare’s Technology Partner Program
Post Syndicated from Matt Lewis original https://blog.cloudflare.com/technology-partner-program/
The Internet is built on a series of shared protocols, all working in harmony to deliver the collective experience that has changed the way we live and work. These open standards have created a platform such that a myriad of companies can build unique services and products that work together seamlessly. As a steward and supporter of an open Internet, we aspire to provide an interoperable platform that works with all the complementary technologies that our customers use across their technology stack. This has been the guiding principle for the multiple partnerships we have launched over the last few years.
One example is our Bandwidth Alliance — launched in 2018, this alliance with 18 cloud and storage providers aims to reduce egress fees, also known as data transfer fees, for our customers. The Bandwidth Alliance has broken the norms of the cloud industry so that customers can move data more freely. Since then, we have launched several technology partner programs with over 40+ partners, including:
- Analytics — Visualize Cloudflare logs and metrics easily, and help customers better understand events and trends from websites and applications on the Cloudflare network.
- Network Interconnect — Partnerships with best-in-class Interconnection platforms offer private, secure, software-defined links with near instant-turn-up of ports.
- Endpoint Protection Partnerships — With these integrations, every connection to our customer’s corporate application gets an additional layer of identity assurance without the need to connect to VPN.
- Identity Providers — Easily integrate your organization’s single sign-on provider and benefit from the ease-of-use and functionality of Cloudflare Access.
These partner programs have helped us serve our customers better alongside our partners with our complementary solutions. The integrations we have driven have made it easy for thousands of customers to use Cloudflare with other parts of their stack.
We aim to continue expanding the Cloudflare Partner Network to make it seamless for our customers to use Cloudflare. To support our growing ecosystem of partners, we are excited to launch our Technology Partner Program.
Announcing Cloudflare’s Technology Partner Program
Cloudflare’s Technology Partner Program facilitates innovative integrations that create value for our customers, our technology partners, and Cloudflare. Our partners not only benefit from technical integrations with us, but also have the opportunity to drive sales and marketing efforts to better serve mutual customers and prospects.
This program offers a guiding structure so that our partners can benefit across three key areas:
- Build with Cloudflare: Sandbox access to Cloudflare enterprise features and APIs to build and test integrations. Opportunity to collaborate with Cloudflare’s product teams to build innovative solutions.
- Market with Cloudflare: Develop joint solution brief and host joint events to drive awareness and adoption of integrations. Leverage a range of our partners tools and resources to bring our joint solutions to market.
- Sell with Cloudflare: Align with our sales teams to jointly target relevant customer segments across geographies.
Technology Partner Tiers
Depending on the maturity of the integration and fit with Cloudflare’s product portfolio, we have two types of partners:
- Strategic partners: Strategic partners have mature integrations across the Cloudflare product suite. They are leaders in their industries and have a significant overlap with our customer base. These partners are strategically aligned with our sales and marketing efforts, and they collaborate with our product teams to bring innovative solutions to market.
- Integration partners: Integration partners are early participants in Cloudflare’s partnership ecosystem. They already have or are on a path to build validated, functional integrations with Cloudflare. These partners have programmatic access to resources that will help them experiment with and build integrations with Cloudflare.
Work with Us
If you are interested in working with our Technology Partnerships team to develop and bring to market a joint solution, we’d love to hear from you! Partners can complete the application on our Technology Partner Program website and we will reach out quickly to discuss how we can help build solutions for our customers together.
Kicking Off Cloudflare’s Summer 2022 Internship Program
Post Syndicated from Ellie Jamison original https://blog.cloudflare.com/kicking-off-cloudflares-summer-2022-internship-program/


Fall is my favorite season for numerous reasons: the change in temperature, pumpkin spice flavored…everything, and of course, the start of the university recruitment cycle. I am excited to announce Cloudflare has begun hiring for our Summer 2022 internship program. We just opened many of our internship roles on our careers website and will begin reviewing applications on a rolling basis. We are looking for Software Engineer, Product Management, Research, Data Science interns and more. We also have a host of virtual events and tech talks to engage prospective students throughout October and November. Find our event lineup below and RSVP through the attached links by clicking on the event titles.
| Date | Time | |
|---|---|---|
| Inside Look: Hiring Software Engineering Interns and New Grads | October 15, 2021 | 10:00-10:45 PT |
| Inside Look: Cloudflare’s Intern Hiring Process | October 19, 2021 | 11:15-12:00 PT |
| Inside Look: Nativeflare | October 27, 2021 | 10:45-11:30 PT |
| Inside Look: Cloudflare’s Intern Experiences | October 28, 2021 | 13:00-13:45 PT |
| Inside Look: Cloudflare’s Culture | November 11, 2021 | 13:00-13:30 PT |
*We have many more events coming up later in the fall and early spring 2022, join our community here for news and updates from us!
In September, Cloudflare kicked off our fall university recruitment efforts by participating in the virtual Grace Hopper Celebration 2021 (#vGHC21) with a team of hiring managers and recruiters from various teams such as Software Engineering, Security, Research, and Product Management. We have sponsored this conference for years but this was our first experience participating virtually. We met and engaged with 1,000+ attendees through 1:1 conversations and tech talks in our virtual booth. Overall, we had an incredible experience with the virtual Grace Hopper Celebration this year and continue to be committed to hiring and providing opportunities for women at Cloudflare.
This upcoming summer, we expect to have the largest intern class ever at Cloudflare. We have more opportunities on more teams than in any previous summer. To learn more about our Engineering and Product internship opportunities, please check out this video from our hiring managers last fall. Many of our interns have written blog posts about their experiences working at Cloudflare. Check out Meyer Zinn’s blog post from this past summer. Our intern opportunities are not limited to technical roles, we have a host of internships for MBA and J.D. students, as well as those in non-technical majors such as our Communications Internship. We will be opening these opportunities later this fall and early spring 2022.
If you are interested in staying informed about our internships, virtual events and opportunities to engage with Cloudflare, feel free to sign up for email updates or join our community. We will be reviewing all applications on a rolling basis, so if you are waiting to hear back from us, please check out our blog or catch a segment on CloudflareTV to learn more about Cloudflare in the meantime.
Europa: Is There Life on Jupiter’s Frozen Moon?
Post Syndicated from Geographics original https://www.youtube.com/watch?v=4mHopzitVwk
4 Simple Steps for an Effective Threat Intelligence Program
Post Syndicated from Alon Arvatz original https://blog.rapid7.com/2021/10/15/4-simple-steps-for-an-effective-threat-intelligence-program/

Threat intelligence is a critical part of an organization’s cybersecurity strategy, but given how quickly the state of cybersecurity evolves, is the traditional model still relevant?
Whether you’re a cybersecurity expert or someone who’s looking to build a threat intelligence program from the ground up in 2021, this simple framework transforms the traditional model, so it can apply to the current landscape. It relies on the technologies available today and can be implemented in four simple steps.
A quick look at the threat intelligence framework
The framework we’ll be referencing here is called the Intelligence Cycle, which breaks down into four phases:
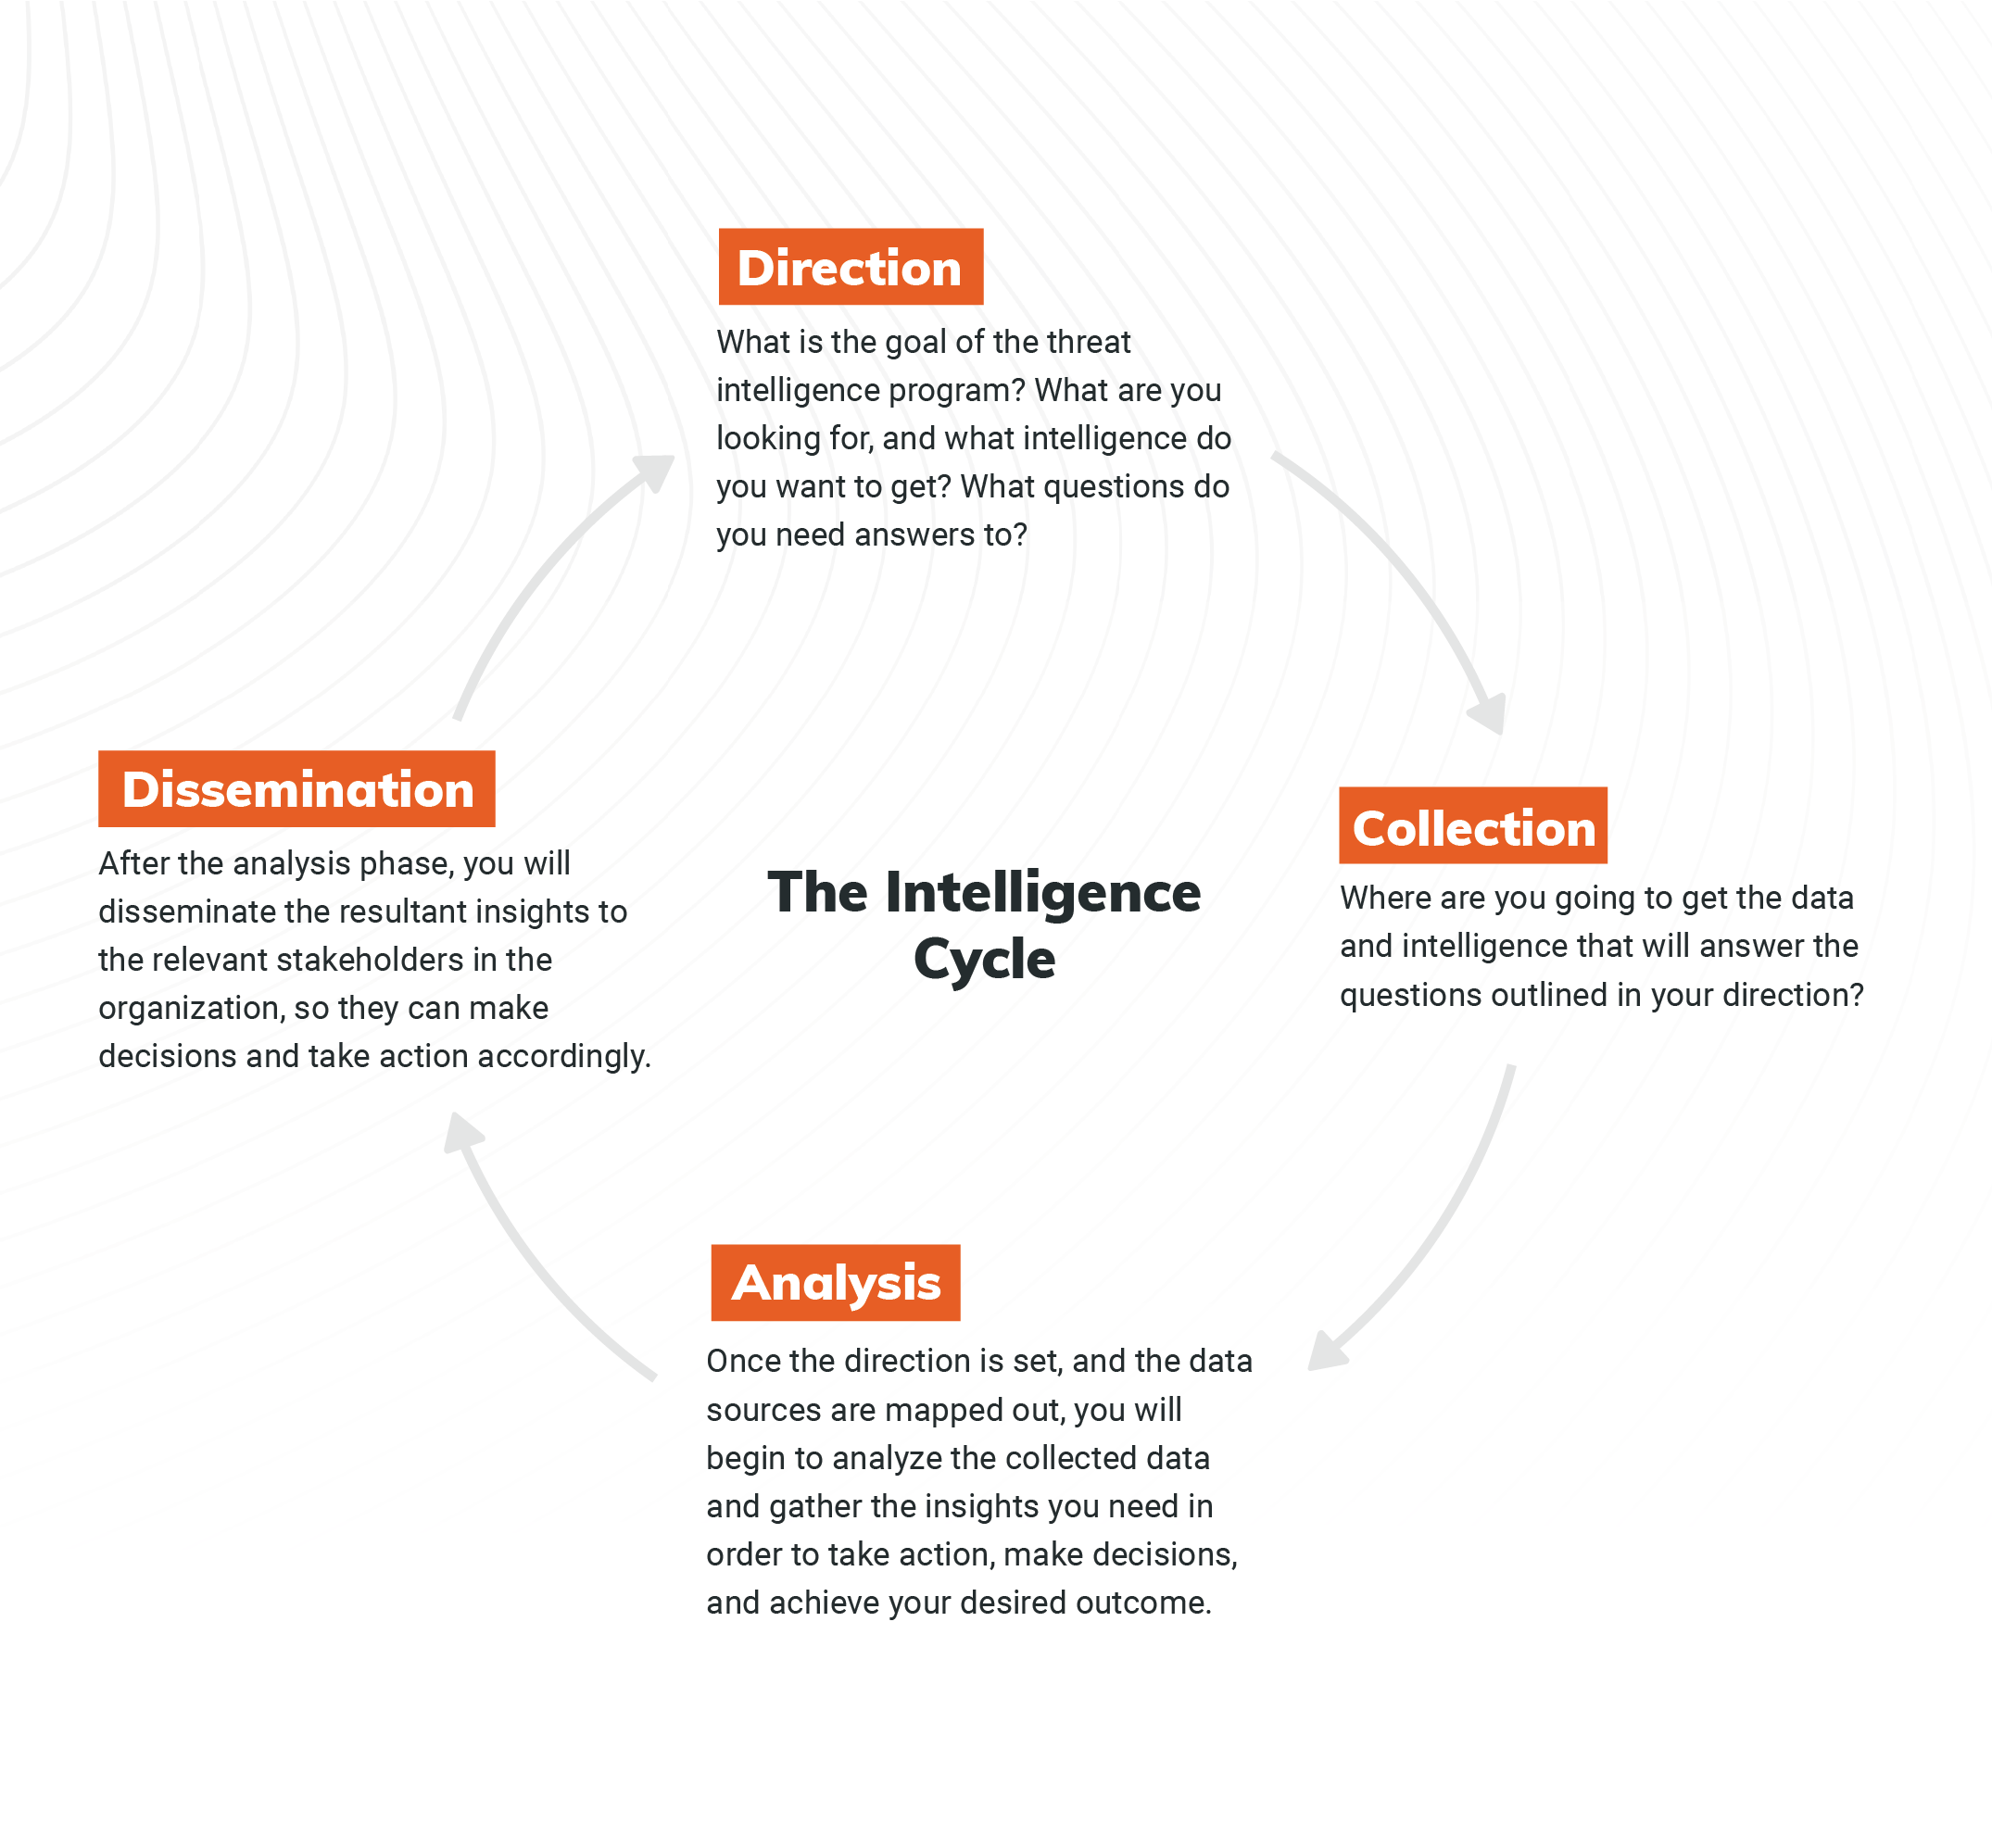
This is the traditional framework you can use to implement a threat intelligence program in your organization. Let’s take a deeper look at each step, update them for the modern day, and outline how you can follow them in 2021.
To do this, we’ll leverage a use case of credential leakage as an example, which is a very important use case today. According to Verizon’s 2021 Data Breach Investigations Report, credentials remain one of the most sought-after data types, and it’s this type of data that gets compromised the fastest. As such, credential leakage is an area organizations of all sizes should be aware of and familiar with, making it an optimal choice for illustrating how to build an effective threat intelligence program.
1. Set a direction
The first step in this process is to set the direction of your program, meaning you need to outline what you’re looking for and what questions you want to ask and answer. To help with this, you can create Prioritized Intelligence Requirements, or PIRs, and a desired outcome.
For both your PIRs and desired outcome, you should aim to be as explicit as possible. In the case of credential leakage, for example, let’s set our PIR as: “I want to identify any usernames and passwords belonging to my employees that have been exposed to an unauthorized entity.”
We’ve selected these credentials for this example, because they are risky for the organization. Depending on your needs, you may identify different credentials with higher risk, but this is the type we’re focusing on for this use case.
With this very specific PIR outlined, we can now determine a desired outcome, which would be something like: “I want to force password reset for any of these passwords that are being used in the corporate environment before threat actors can use them.”
This is crucial, and later, we’ll see how the desired outcome impacts how we build this threat intelligence program.
2. Map out what data to collect
Once you’ve set your PIRs and desired outcome, you need to map out the sources of intelligence that will serve the direction.
For this use case, let’s identify how threat actors gain credentials. A few of the most common sources include:
- Endpoints (usually harvested by botnets)
- Third-party breaches
- Code repositories
- Posts on a forum/pastebin
- Dark web black markets that buy/sell credentials
In the past, you might have turned to individual vendors who could help you with each of these areas. For example, you may have worked with an organization that specializes in endpoint security and another that could tackle incident response management for third-party breaches. But today, you’re better off finding a vendor who can support all the sources you need and provide complete coverage for all areas of risk, especially for something like credential leakage.
Regardless, by mapping out these sources, you can outline the areas you need to focus on for analysis.
3. Select your approach to analysis
Next up is analysis. You can take two approaches:
- Automated analysis: You can leverage AI or sophisticated algorithms that will classify relevant data into alerts of credential leakage, where the emails and passwords can be extracted and pulled out.
- Manual analysis: You can manually analyze the information by gathering all the data and having the analysts on your team review the data and decide what’s relevant to your organization.
The biggest advantage of manual analysis is flexibility. You can put more human resources, intelligence, and insight into the process to surface only what is relevant. But there are also disadvantages — for example, this process is much slower than automated analysis.
In the first phase of our program, we specified that we want to force password resets before threat actors leverage them for a cyberattack. This means that speed is extremely crucial in this use case. Now, you can see how the desired outcome is helping us make a decision about the type of approach we should take for analysis.
Automated analysis also requires significantly fewer resources. You don’t need a bunch of analysts to sort through the raw data and surface what is relevant. The classification and alerting of credential leakage is fully automated here. Plus, if threats are being automatically classified, they can likely be automatically remediated.
Let’s take a look at this in practice: Say your algorithm finds an email and password mentioned on a forum. The AI can classify the incident and extract the relevant information (e.g., the email/username and password) in a machine-readable format. Then, a response can be automatically applied, like force resetting the password for the identified user.
As you can see, there are advantages and disadvantages for each approach. When you assess them against our desired outcome, it’s clear that we should go with an automated approach for our credential leakage use case.
4. Disseminate analysis to take action
Finally, we come to the final phase: dissemination. Traditionally, when it comes to the intelligence cycle and the dissemination of threat intelligence, we talk about sending alerts and reports to the relevant stakeholders to review, so they can take action and respond accordingly.
But, as our example in the previous section shows, the future (and current state) of this process is fully automated remediation. With this in mind, we shouldn’t just discuss how we distribute alerts and information in the organization — we should also think about how we can take the intelligence and distribute it to security devices to automatically prevent the upcoming attack.
For leaked credentials, this could mean sending the intelligence to the active directory to automatically force password reset without human intervention. This is a great example of how shifting to an automated solution can dramatically reduce the time to remediation.
Once again, let’s go back to our PIR and desired outcome: We want to force the password reset before the threat actor uses the password. Speed is key here, so we should definitely automate the remediation. As such, we need a solution that takes the intelligence from the sources we’ve mapped out, automatically produces an alert with the information extracted, and then automatically remediates the threat to reduce risk as fast as possible.
This is how detection and response should look in 2021.
A simplified and modernized approach to threat intelligence
In summary, this revamped Intelligence Cycle resembles how to build an effective threat intelligence program today.
Start by identifying your PIRs and desired outcome. Then, decide on a collection plan by outlining all sources that will drive the relevant intelligence. Next, for the vast majority of use cases, it’s important to have an automated analysis algorithm in place to classify alerts quickly and precisely. And finally, you should transition from manual dissemination to automated remediation, which can dramatically reduce time to remediation — something that’s more critical than ever due to the current state of cybersecurity.
By following these steps, you can build an effective threat intelligence program, and with this foundation in place, you can fine-tune it until you have a seamless process that saves your organization time and reduces risk across the board.
Curious to learn more? Read about Rapid7’s approach to automatic detection and response here.
[$] Possible changes to Debian’s decision-making processes
Post Syndicated from original https://lwn.net/Articles/872710/rss
The name Debian brings to mind a Linux
distribution, but the Debian project is far more than that; it is an
ongoing experiment in democratic project governance. Debian’s processes
can result in a lot of public squabbling; one should not lose track,
though, of the fact that those processes have enabled a large community to
maintain and grow a complex distribution for decades without the benefit of
an overseeing corporate overlord. Processes can be improved, though; a
recent proposal
from Russ Allbery gives an interesting picture of where the pain points
are and what can be made better.
Security Risks of Client-Side Scanning
Post Syndicated from Bruce Schneier original https://www.schneier.com/blog/archives/2021/10/security-risks-of-client-side-scanning.html
Even before Apple made its announcement, law enforcement shifted their battle for backdoors to client-side scanning. The idea is that they wouldn’t touch the cryptography, but instead eavesdrop on communications and systems before encryption or after decryption. It’s not a cryptographic backdoor, but it’s still a backdoor — and brings with it all the insecurities of a backdoor.
I’m part of a group of cryptographers that has just published a paper discussing the security risks of such a system. (It’s substantially the same group that wrote a similar paper about key escrow in 1997, and other “exceptional access” proposals in 2015. We seem to have to do this every decade or so.) In our paper, we examine both the efficacy of such a system and its potential security failures, and conclude that it’s a really bad idea.
We had been working on the paper well before Apple’s announcement. And while we do talk about Apple’s system, our focus is really on the idea in general.
Ross Anderson wrote a blog post on the paper. (It’s always great when Ross writes something. It means I don’t have to.) So did Susan Landau. And there’s press coverage in the New York Times, the Guardian, Computer Weekly, the Financial Times, Forbes, El Pais (English translation), NRK (English translation), and — this is the best article of them all — the Register. See also this analysis of the law and politics of client-side scanning from last year.
Unboxing a NEW Xbox Console! 20 Years Later
Post Syndicated from LGR original https://www.youtube.com/watch?v=hn3me6w_dE8
Security updates for Friday
Post Syndicated from original https://lwn.net/Articles/873056/rss
Security updates have been issued by Debian (squashfs-tools, tomcat9, and wordpress), Fedora (openssh), openSUSE (kernel, mbedtls, and rpm), Oracle (httpd, kernel, and kernel-container), SUSE (firefox, kernel, and rpm), and Ubuntu (linux-azure, linux-azure-5.4).
“Look, Ma, no probes!” — Characterizing CDNs’ latencies with passive measurement
Post Syndicated from Vasilis Giotsas original https://blog.cloudflare.com/cdn-latency-passive-measurement/


Something that comes up a lot at Cloudflare is how well our network and systems are performing. Like many service providers, we need to be engaged in a constant process of introspection to evaluate aspects of Cloudflare’s service with respect to customers, within our own network and systems and, as was the case in a recent blog post, the clients (such as web browsers). Many of these questions are obvious, but answering them is decisive in opening paths to new and improved services. The important point here is that it’s relatively straightforward to monitor and assess aspects of our service we can see or measure directly.
However, for certain aspects of our performance we may not have access to the necessary data, for a number of reasons. For instance, the data sources may be outside our network perimeter, or we may avoid collecting certain measurements that would violate the privacy of end users. In particular, the questions below are important to gain a better understanding of our performance, but harder to answer due to limitations in data availability:
- How much better (or worse!) are we doing compared to other service providers (CDNs) by being in certain locations?
- Can we know “a priori” and rank where data centers will have the greatest improvement and know which locations might deteriorate service?
The last question is particularly important because it requires the predictive power of synthesising available network measurements to model and infer network features that cannot be directly observed. For such predictions to be informative and meaningful, it’s critical to distill our measurements in a way that illuminates the interdependence of network structure, content distribution practices and routing policies, and their impact on network performance.
Active measurements are inadequate or unavailable
Measuring and comparing the performance of Content Distribution Networks (CDN) is critical in terms of understanding the level of service offered to end users, detecting and debugging network issues, and planning the deployment of new network locations. Measuring our own existing infrastructure is relatively straightforward, for example, by collecting DNS and HTTP request statistics received at each one of our data centers.
But what if we want to understand and evaluate the performance of other networks? Understandably, such data is not shared among networks due to privacy and business concerns. An alternative to data sharing is direct observation with what are called “active measurements.” An example of active measurement is when a measuring tape is used to determine the size of a room — one must take an action to perform the measurement.
Active measurements from Cloudflare data centers to other CDNs, however, don’t say much about the client experience. The only way to actively measure CDNs is by probing from third-party points of view, namely some type of end-client or globally distributed measurement platform. For example, ping probes might be launched from RIPE Atlas clients to many CDNs; alternatively, we might rely on data obtained from Real User Measurements (RUM) services that embed JavaScript requests into various services and pages around the world.
Active measurements are extremely valuable, and we heavily rely on them to collect a wide range of performance metrics. However, active measurements are not always reliable. Consider ping probes from RIPE Atlas. A collection of direct pings is most assuredly accurate. The weakness is that the distribution of its probes is heavily concentrated in Europe and North America, and it offers very sparse coverage of Autonomous Systems (ASes) in other regions (Asia, Africa, South America). Additionally the distribution of RIPE Atlas probes to ASes does not reflect the distribution of users to ASes, instead university networks and hosting providers or enterprises are overrepresented in the probes population.
Similarly, data from third party Real User Measurements (RUM) services have weaknesses too. RUM platforms compare CDNs by embedding JavaScript request probes in websites visited by users all over the world. This sounds great, except the data cannot be validated by outside parties, which is an important aspect of measurement. For example, consider the following chart that shows Cloudfront’s median Round-Trip Time (RTT) in Greece as measured by the two leading RUM platforms, Cedexis and Perfops. While both platforms follow the same measurement method, their results for the same time period and the same networks differ considerably. If the two sets of measurements for the same thing differ, then neither can be relied upon.
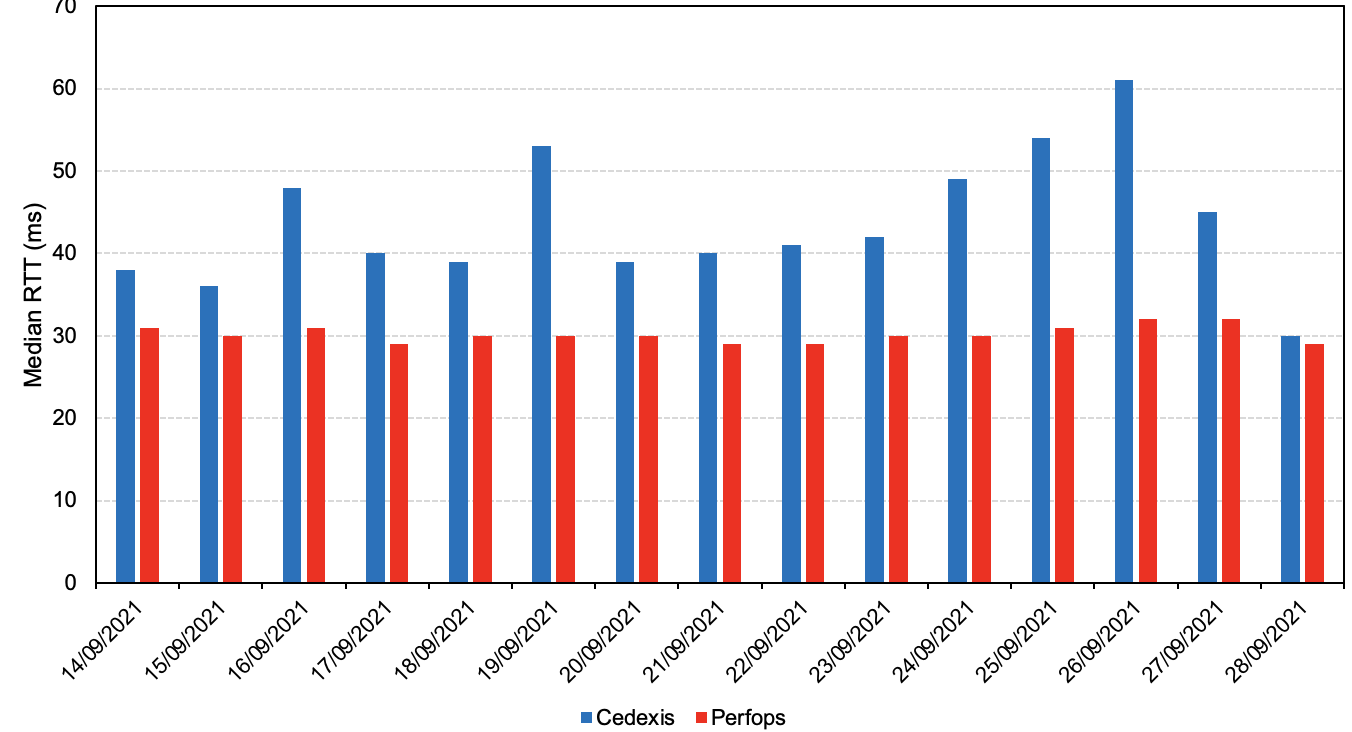
Ultimately, active measurements are always limited to and by the things that they directly see. Simply relying on existing measurements does not in and of itself translate to predictive models that help assess the potential impact of infrastructure and policy changes on performance. However, when the biases of active measurements are well understood, they can do two things really well: inform our understanding, and help validate models of our understanding of the world — and we’re going to showcase both as we develop a mechanism for evaluating CDN latencies passively.
Predicting CDNs’ RTTs with Passive Network Measurements
So, how might we measure without active probes? We’ve devised a method to understand latency across CDNs by using our own RTT measurements. In particular, we can use these measurements as a proxy for estimating the latency between clients and other CDNs. With this technique, we can understand latency to locations where CDNs have deployed their infrastructure, as well as show performance improvements in locations where one CDN exists but others do not. Importantly, we have validated the assumptions shown below through a large-scale traceroute and ping measurement campaign, and we’ve designed this technique so that it can be reproduced by others. After all, independent validation is important across measurement communities.
Step 1. Predicting Anycast Catchments
The first step in RTT inference is to predict the anycast catchments, namely predict the set of data centers that will be used by an IP. To this end, we compile the network footprint of each CDN provider whose performance we want to predict, which allows us to predict the CDN location where a request from a particular client AS will arrive. In particular, we collect the following data:
- List of ISPs that host off-net server caches of CDNs using the methodology and code developed in Gigis et al. paper.
- List of on-net city-level data centers according to PeeringDB, the network maps in the websites of each individual CDN, and IP geolocation measurements.
- List of Internet eXchange Points (IXPs) where each CDN is connected, in conjunction with the other ASes that are also members of the same IXPs, from IXP databases such as PeeringDB, the Euro-IX IXP-DB, and Packet Clearing House.
- List of CDN interconnections to other ASes extracted from BGP data collected from RouteViews and RIPE RIS.
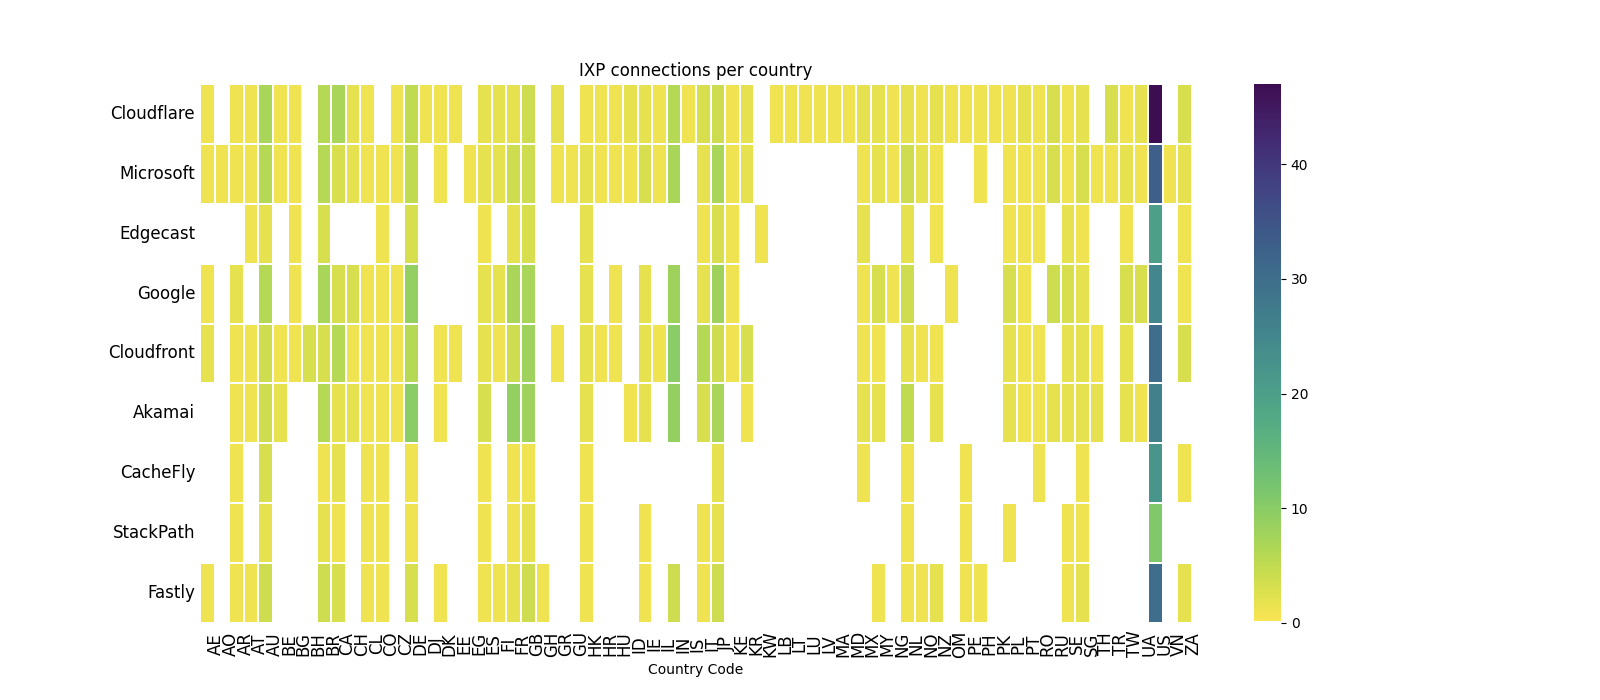
The figure below shows the IXP connections for nine CDNs, according to the above-mentioned datasets. Cloudflare is present in 258 IXPs, which is 56 IXPs more than Google, the second CDN in the list.
With the above data, we can compute the possible paths between a client AS and the CDN’s data centers and infer the Anycast Catchments using techniques similar to the recent papers by Zhang et al. and Sermpezis and Kotronis, which predict paths by reproducing the Internet inter-domain routing policies. For CDNs that use BGP-based Anycast, we can predict which data center will receive a request based on the possible routing paths between the client and the CDN. For CDNs that rely on DNS-based redirection, we don’t make an inference yet, but we first predict the latency to each data center, and we select the path with the lowest latency assuming that CDN operators manage to offer the path with the smallest latency.
The challenge in predicting paths emanates from the incomplete knowledge of the varying routing policies implemented by individual ASes, which are either hosting web clients (for instance an ISP or an enterprise network), or are along the path between the CDN and the client’s network. However, in our prediction problem, we can already partition the IP address space to Anycast Catchment regions (as proposed by Schomp and Al-Dalky) based on our extensive data center footprint, which allows us to reverse engineer the routing decisions of client ASes that are visible to Cloudflare. That’s a lot to unpack, so let’s go through an example.
Example
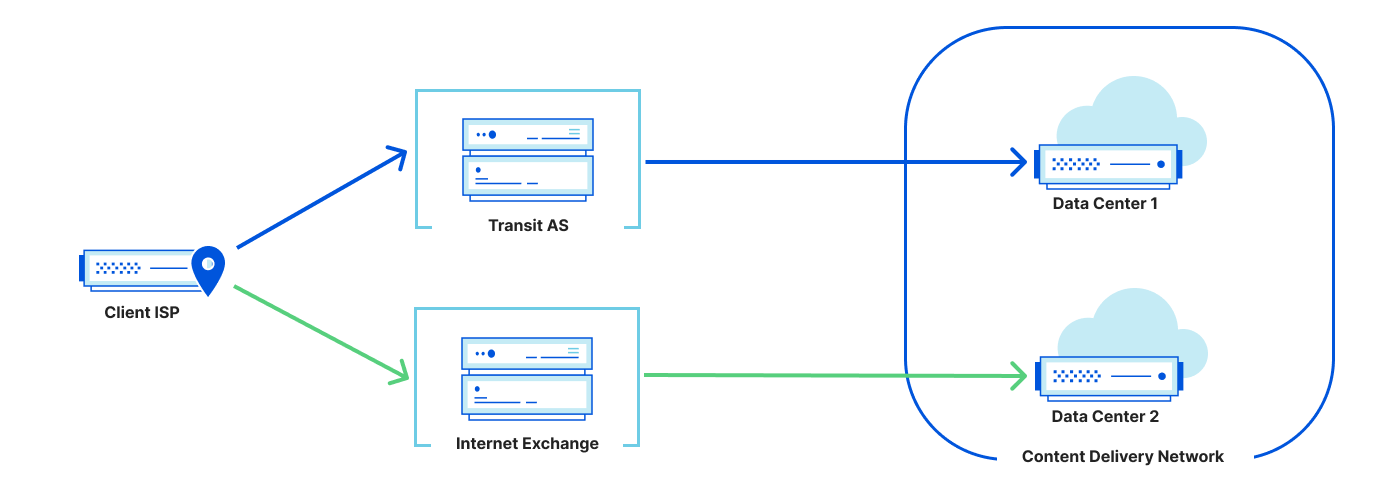
First, assume that an ISP has two potential paths to a CDN: one over a transit provider and one through a direct peering connection over an IXP, and each path terminates at a different data center, as shown in the figure below. In the example below, routing through a transit AS incurs a cost, while IXP peering links do not incur transit exchange costs. Therefore, we would predict that the client ISP would use the path to data center 2 through the IXP.
Step 2. Predicting CDN Path Latencies
The next step is to estimate the RTT between the client AS and the corresponding CDN location. To this end, we utilize passive RTT measurements from Cloudflare’s own infrastructure. For each of our data centers, we calculate the median TCP RTT for each IP /24 subnet that sends us HTTP requests. We then assume that a request from a given IP subnet to a data center that is common between Cloudflare and another CDN will have a comparable RTT (our approach focuses on the performance of the anycast network and omits host software differences). This assumption is generally true, because the distance between two endpoints is the dominant factor in determining latency. Note that the median RTT is selected to represent client performance. In contrast, the minimum RTT is an indication of closeness to clients (not expected performance). Our approach on estimating latencies is similar to the work of Madhyastha et al. who combined the median RTT of existing measurements with a path prediction technique informed by network topologies to infer end-to-end latencies that cannot be measured directly. While this work reported an accuracy of 65% for arbitrary ASes, we focus on CDNs which, on average, have much smaller paths (most clients are within 1 AS hop) making the path prediction problem significantly easier (as noted by Chiu et al. and Singh and Gill). Also note that for the purposes of RTT estimation, it’s important to predict which CDN data center the request from a client IP will use, not the actual hops along the path.
Example
Assume that for a certain IP subnet used by AS3379 (a Greek ISP), the following table shows the median RTT for each Cloudflare data center that receives HTTP requests from that subnet. Note that while requests from an IP typically land at the nearest data center (Athens in that case), some requests may arrive at different data centers due to traffic load management and different service tiers.
| Data Center | Athens | Sofia | Milan | Frankfurt | Amsterdam |
|---|---|---|---|---|---|
| Median RTT | 22 ms | 42 ms | 43 ms | 70 ms | 75 ms |
Assume that another CDN B does not have data centers or cache servers in Athens and Sofia, but only in Milan, Frankfurt, and Amsterdam. Based on the topology and colocation data of CDN B, we will predict the anycast catchments, and we find that for AS3379 the data center in Frankfurt will be used. In that case, we will use the corresponding latency as an estimate of the median latency between CDN B and the given prefix.
The above methodology works well because Cloudflare’s global network allows us to collect network measurements between 63,832 ASes (virtually every AS which hosts clients), and 300 cities in 115 different countries where Cloudflare infrastructure is deployed, allowing us to cover the vast majority of regions where other CDNs have deployed infrastructure.
Step 3. Validation
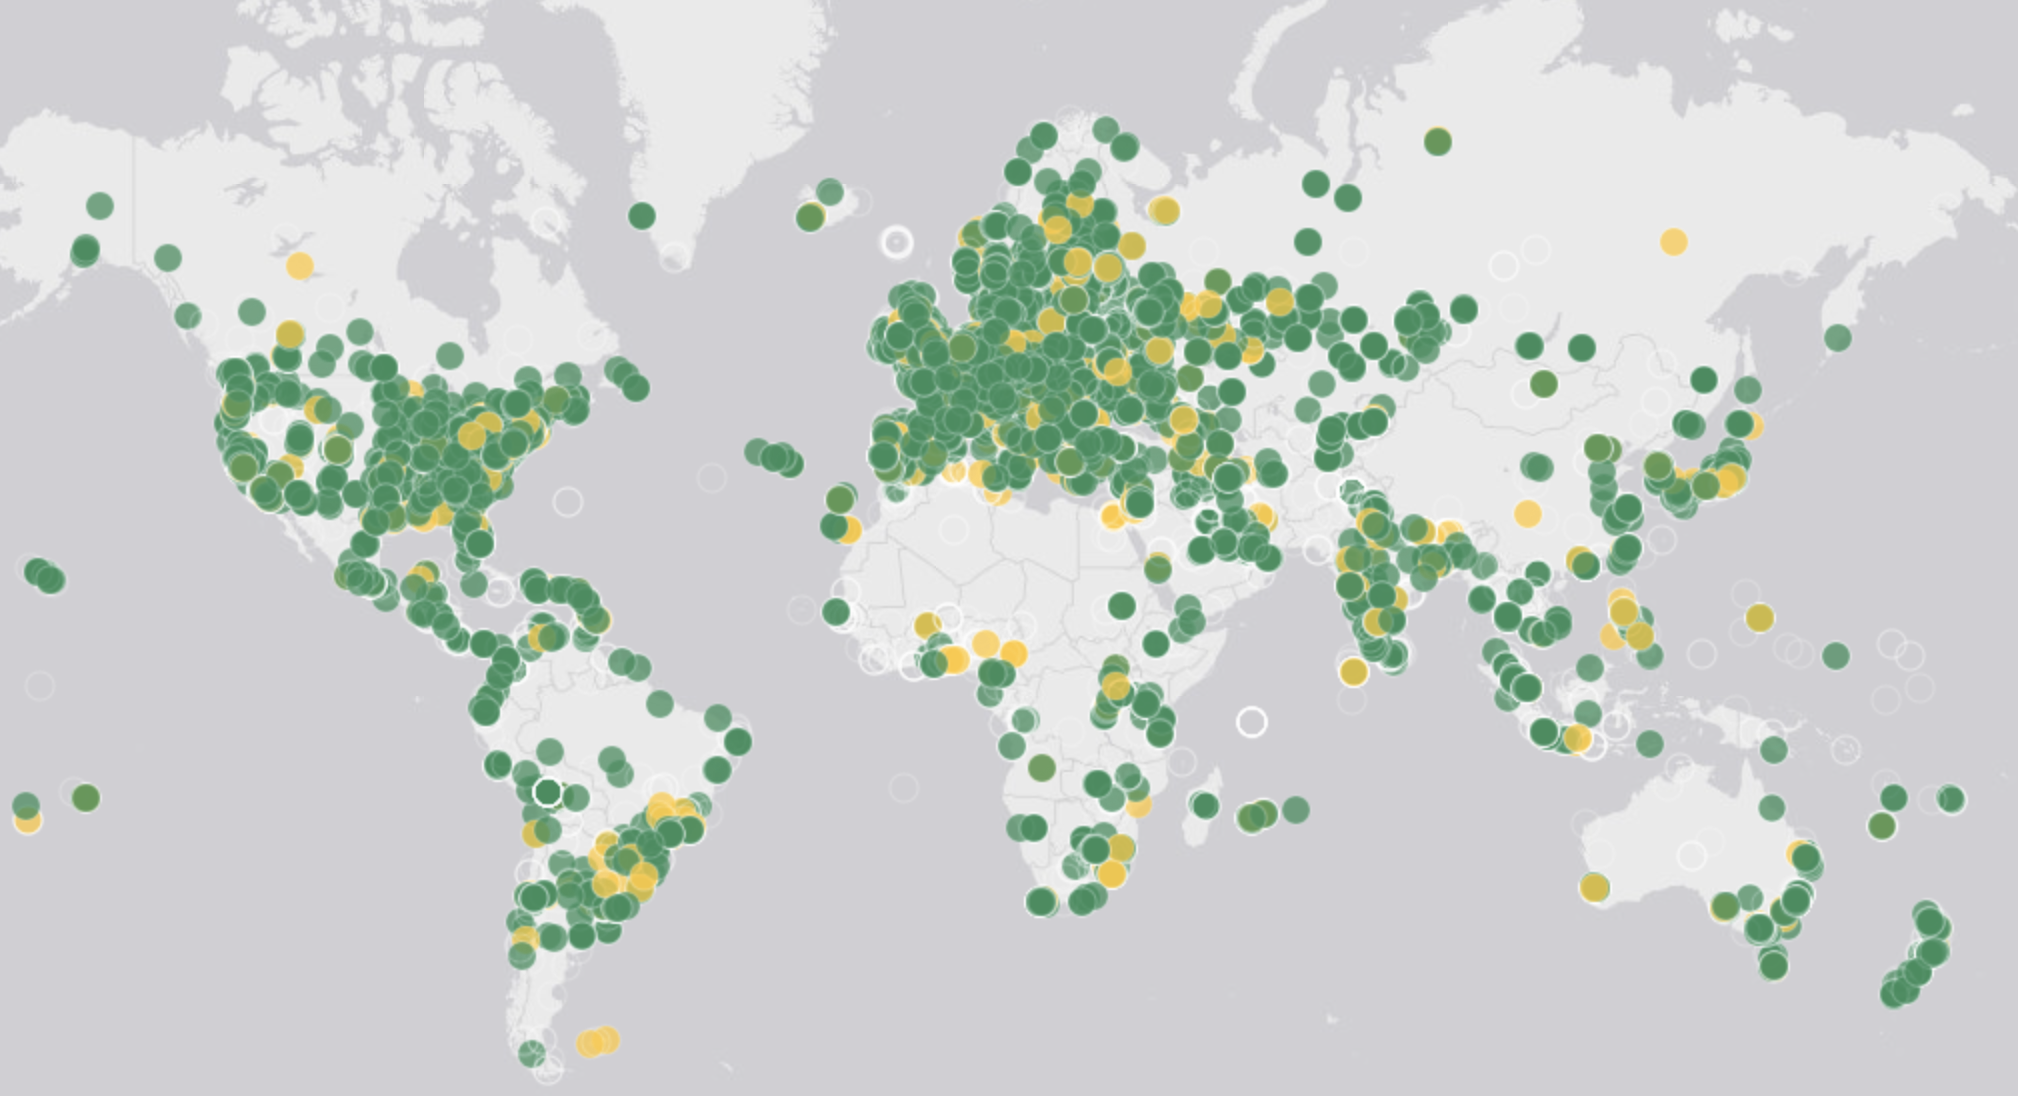
To validate the above measurement, we run a global campaign of traceroute and ping measurements from 9,990 Atlas probes in 161 different countries (see the interactive map for real-time data on the geographical distribution of probes).
For each CDN as a measurement target, we selected a destination hostname that is anycasted from all locations, and we selected the DNS resolution to run on each measurement probe so that the returned IP corresponds to the probe’s nearest location.
After the measurements were completed, we first evaluated the Anycast Catchment prediction, namely the prediction of which CDN data center will be used by each RIPE Atlas probe. To this end, we geolocated the destination IPs of each completed traceroute measurement against the predicted data center. Nearly 90% of our predicted data centers agreed with the measured data centers.
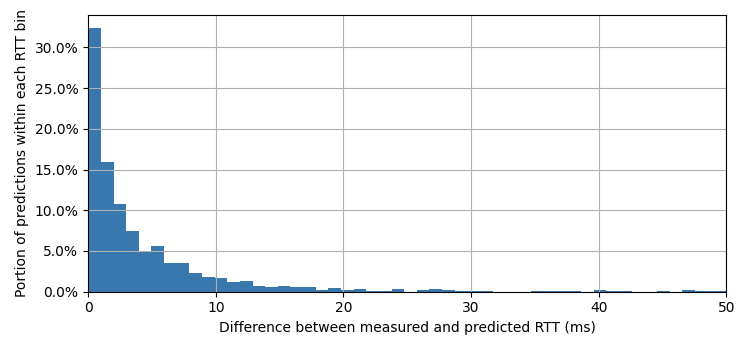
We also validated our RTT predictions. The figure below shows the absolute difference between the measured RTT and the predicted RTT in milliseconds, across all data centers. More than 50% of the predictions have an RTT difference of 3 ms or less, while almost 95% of the predictions have an RTT difference of at most 10 ms.
Results
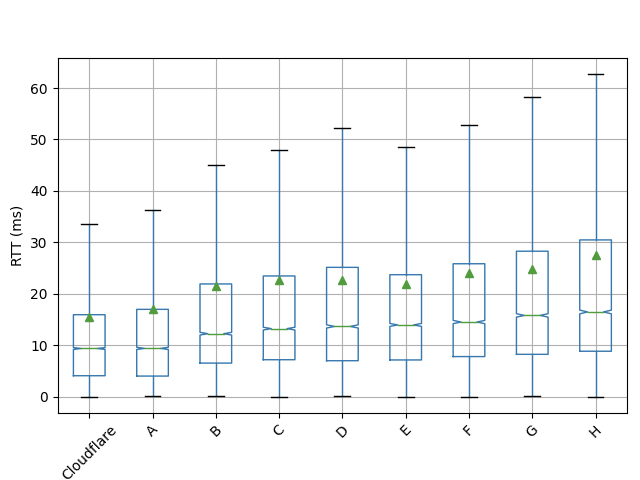
We applied our methodology on nine major CDNs, including Cloudflare, in September 2021. As shown in the boxplot below, Cloudflare exhibits the lowest median RTT across all observed clients, with a median RTT close to 10 ms.
Limitations of measurement methodology
Because our approach relies on estimating latency, it is not possible to obtain millisecond-accurate measurements. However, such measurements are essentially infeasible even when using real user measurements because the network conditions are highly dynamic, meaning that measured RTT may differ significantly between different measurements.
Secondly, our approach obviously cannot be used to monitor network hygiene in real time and detect performance issues that may often lie outside Cloudflare’s network. Instead, our approach is useful for understanding the expected performance of our network topology and connectivity, and we can test what-if scenarios to predict the impact on performance that different events may have (e.g. deployment of a new data center, interruption of connectivity to an ISP or IXP).
Finally, while Cloudflare has the most extensive coverage of data centers and IXPs compared to other CDNs, there are certain countries where Cloudflare does not have a data center in contrast to other CDNs. In some other countries, Cloudflare is present to a partner data center but not in a carrier-neutral data center which may restrict the number of direct peering links between Cloudflare’s and other regional ISPs. In such countries, client IPs may be routed to a data center outside the country because the BGP decision process typically prioritizes cost over proximity. Therefore, for about 7% of the client /24 IP prefixes, we do not have a measured RTT between a data center in the same country as the IP. We are working to alleviate this with traceroute measurements and will report back later.
Looking Ahead
The ability to predict and compare the performance of different CDN networks allows us to evaluate the impact of different peering and data center strategies, as well as identify shortcomings in our Anycast Catchments and traffic engineering policies. Our ongoing work focuses on measuring and quantifying the impact of peering on IXPs on end-to-end latencies, as well as identifying cases of local Internet ecosystems where an open peering policy may lead to latency increases. This work will eventually enable us to optimize our infrastructure placement and control-plane policies to the specific topological properties of different regions and minimize latency for end users.
Multi-User IP Address Detection
Post Syndicated from Alex Chen original https://blog.cloudflare.com/multi-user-ip-address-detection/
Cloudflare provides our customers with security tools that help them protect their Internet applications against malicious or undesired traffic. Malicious traffic can include scraping content from a website, spamming form submissions, and a variety of other cyberattacks. To protect themselves from these types of threats while minimizing the blocking of legitimate site visitors, Cloudflare’s customers need to be able to identify traffic that might be malicious.
We know some of our customers rely on IP addresses to distinguish between traffic from legitimate users and potentially malicious users. However, in many cases the IP address of a request does not correspond to a particular user or even device. Furthermore, Cloudflare believes that in the long term, the IP address will be an even more unreliable signal for identifying the origin of a request. We envision a day where IP will be completely unassociated with identity. With that vision in mind, multi-user IP address detection represents our first step: pointing out situations where the IP address of a request cannot be assumed to be a single user. This gives our customers the ability to make more judicious decisions when responding to traffic from an IP address, instead of indiscriminately treating that traffic as though it was coming from a single user.
Historically, companies commonly treated IP addresses like mobile phone numbers: each phone number in theory corresponds to a single person. If you get several spam calls within an hour from the same phone number, you might safely assume that phone number represents a single person and ignore future calls or even block that number. Similarly, many Internet security detection engines rely on IP addresses to discern which requests are legitimate and which are malicious.
However, this analogy is flawed and can present a problem for security. In practice, IP addresses are more like postal addresses because they can be shared by more than one person at a time (and because of NAT and CG-NAT the number of people sharing an IP can be very large!). Many existing Internet security tools accept IP addresses as a reliable way to distinguish between site visitors. However, if multiple visitors share the same IP address, security products cannot rely on the IP address as a unique identifying signal. Thousands of requests from thousands of different users need to be treated differently from thousands of requests from the same user. The former is likely normal traffic, while the latter is almost certainly automated, malicious traffic.
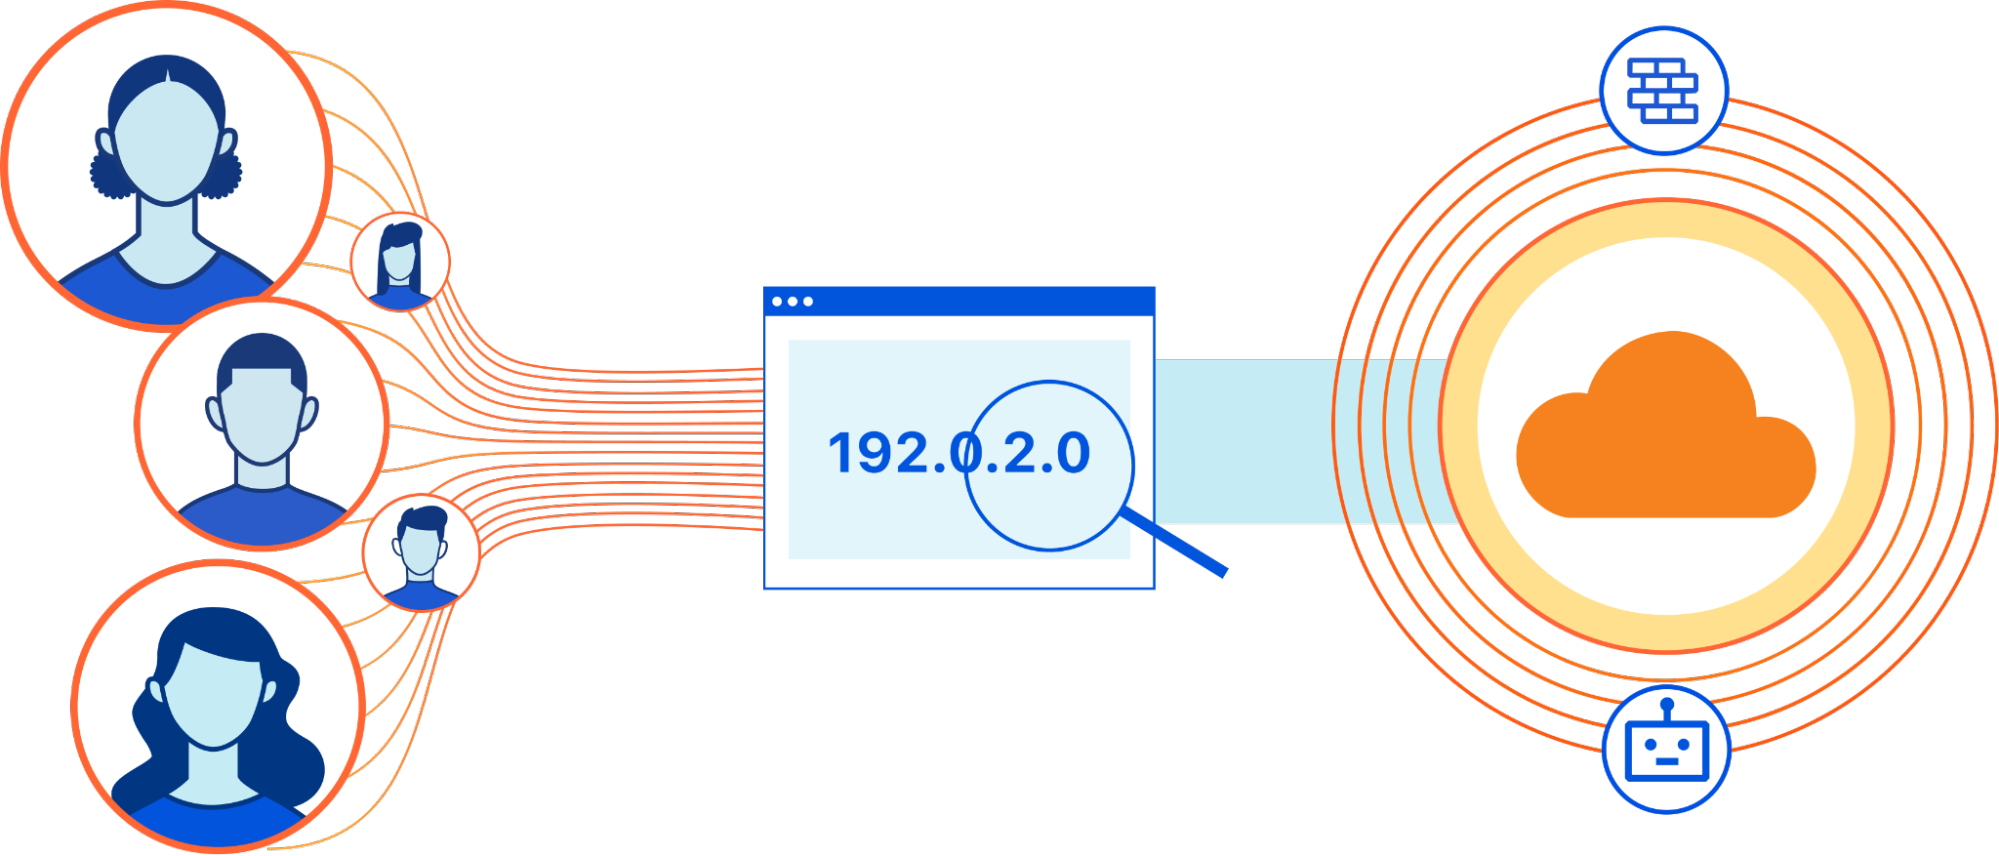
For example, if several people in the same apartment building accessed the same site, it’s possible all of their requests would be routed through a middlebox operated by their Internet service provider that has only one IP address. But this sudden series of requests from the same IP address could closely resemble the behavior of a bot. In this case, IP addresses can’t be used by our customers to distinguish this activity from a real threat, leading them to mistakenly block or challenge their legitimate site visitors.
By adding multi-user IP address detection to Cloudflare products, we’re improving the quality of our detection techniques and reducing false positives for our customers.
Examples of Multi-User IP Addresses
Multi-user IP addresses take on many forms. When your company uses an enterprise VPN, for example, employees may share the same IP address when accessing external websites. Other types of VPNs and proxies also place multiple users behind a single IP address.
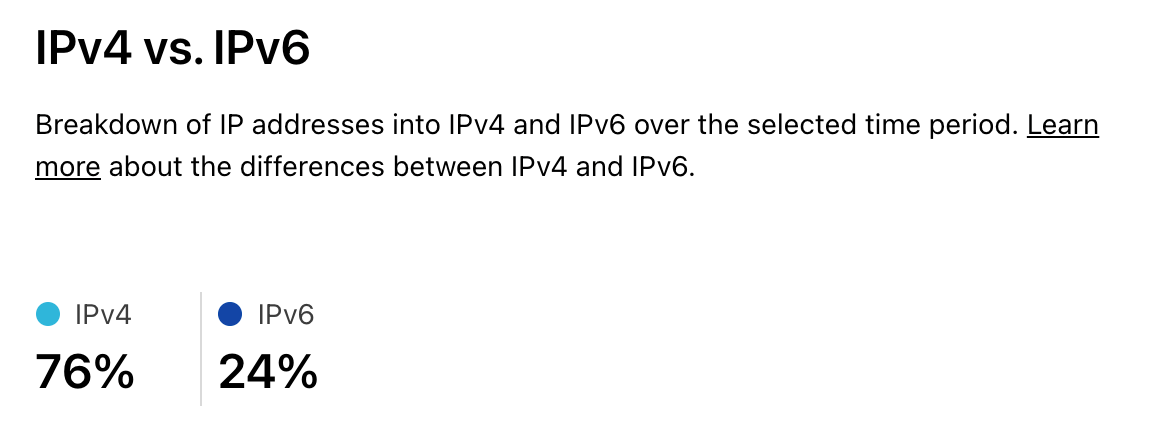
Another type of multi-user IP address originated from the core communications protocol of the Internet. IPv4 was developed in the 1980s. The protocol uses a 32-bit address space, allowing for over four billion unique addresses. Today, however, there are many times more devices than IPv4 addresses, meaning that not every device can have a unique IP address. Though IPv6 (IPv4’s successor protocol) solves the problem with 128-bit addresses (supporting 2128 unique addresses), IPv4 still routes the majority of Internet traffic (76% of human-only traffic is IPv4, as shown on Cloudflare Radar).
To solve this issue, many devices in the same Local Area Network (LAN) can share a single Internet-addressable IP address to communicate with the public Internet, while using private Internet addresses to communicate within the LAN. Since private addresses are to be used only within a LAN, different LANs can number their hosts using the same private IP address space. The Internet gateway of the LAN does the Network Address Translation (NAT), namely takes messages which arrive on that single public IP and forwards them to the private IP of the appropriate device on their local network. In effect it’s similar to how everyone in an office building shares the same street address, and the front desk worker is responsible for sorting out what mail was meant for which person.
While NAT allows multiple devices behind the same Internet gateway to share the same public IP address, the explosive growth of the Internet population necessitated further reuse of the limited IPv4 address space. Internet Service Providers (ISPs) required users in different LANs to share the same IP address for their service to scale. Carrier-Grade Network Address Translation (CG-NAT) emerged as another solution for address space reuse. Network operators can use CG-NAT middleboxes to translate hundreds or thousands of private IPv4 addresses into a single (or pool of) public IPv4 address. However, this sharing is not without side-effects. CG-NAT results in IP addresses that cannot be tied to single devices, users, or broadband subscriptions, creating issues for security products that rely on the IP address as a way to distinguish between requests from different users.
What We Built
We built a tool to help our customers detect when a /24 IP prefix (set of IP addresses that have the same first 24 bits) is likely to contain multi-user IP addresses, so they can more finely tune the security rules that protect their websites. In order to identify multi-user IP prefixes, we leverage both internal data and public data sources. Within this data, we look at a few key parameters.
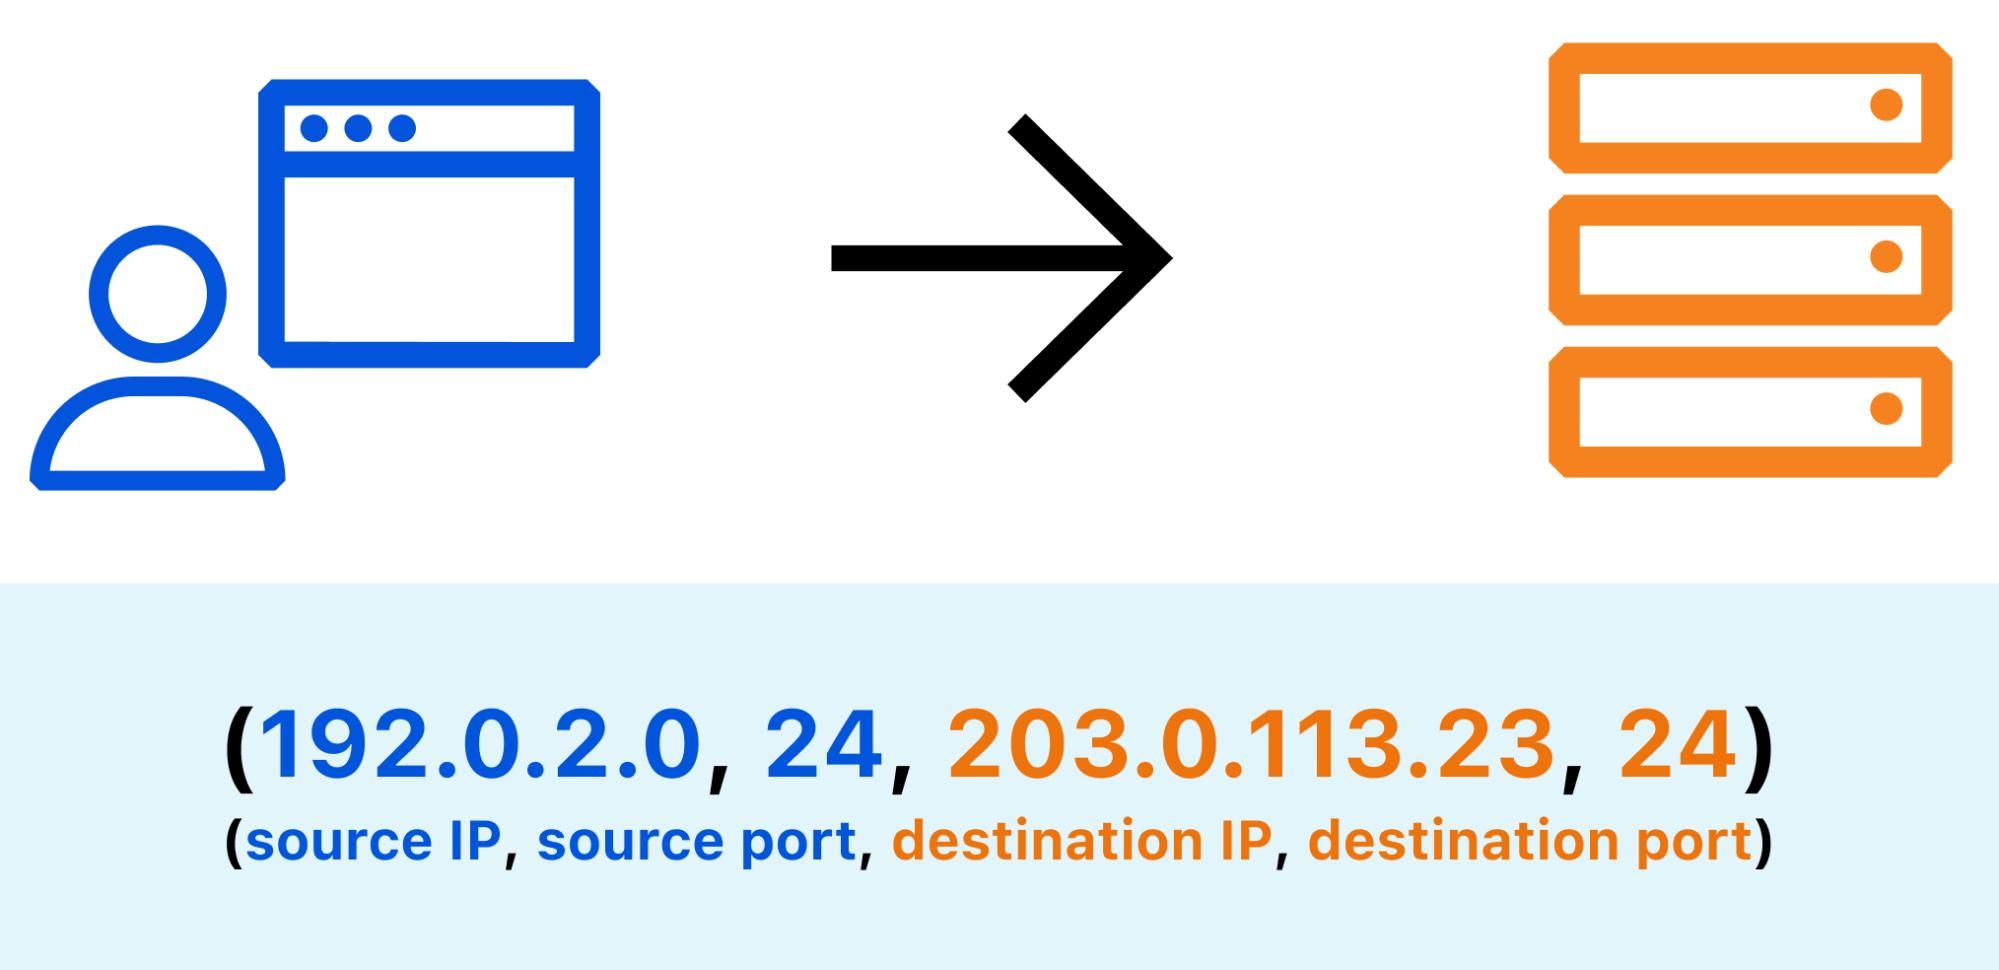
When an Internet user visits a website, the underlying TCP stack opens a number of connections in order to send and receive data from remote servers. Each connection is identified by a 4-tuple (source IP, source port, destination IP, destination port). Repeating requests from the same web client will likely be mapped to the same source port, so the number of distinct source ports can serve as a good indication of the number of distinct client applications. By counting the number of open source ports for a given IP address, you can estimate whether this address is shared by multiple users.
User agents provide device-reported information about themselves such as browser and operating system versions. For multi-user IP detection, you can count the number of distinct user agents in requests from a given IP. To avoid overcounting web clients per device, you can exclude requests that are identified as triggered by bots and we only count requests from user agents that are used by web browsers. There are some tradeoffs to this approach: some users may use multiple web browsers and some other users may have exactly the same user agent. Nevertheless, past research has shown that the number of unique web browser user agents is the best tradeoff to most accurately determine CG-NAT usage.
Mozilla/5.0 (X11; Linux x86_64; rv:92.0) Gecko/20100101 Firefox/92.0
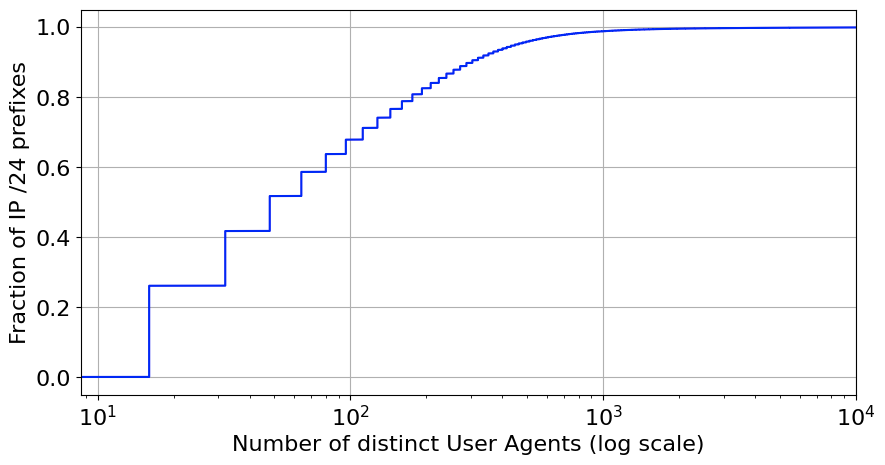
For our inferences, we group IP addresses to their corresponding /24 IP prefix. The figure below shows the distribution of browser User Agents per /24 IP prefix, based on data accumulated over the period of a day. About 35% of the prefixes have more than 100 different browser clients behind them.
Our service also uses other publicly available data sources to further refine the accuracy of our identification and to classify the type of multi-user IP address. For example, we collect data from PeeringDB, which is a database where network operators self-identify their network type, traffic levels, interconnection points, and peering policy. This data only covers a fraction of the Internet’s autonomous systems (ASes). To overcome this limitation, we use this data and our own data (number of requests per AS, number of websites in each AS) to infer AS type. We also use external data sources such as IRR to identify requests from VPNs and proxy servers.
These details (especially AS type) can provide more information on the type of multi-user IP address. For instance, CG-NAT systems are almost exclusively deployed by broadband providers, so by inferring the AS type (ISP, CDN, Enterprise, etc.), we can more confidently infer the type of each multi-user IP address. A scheduled job periodically executes code to pull data from these sources, process it, and write the list of multi-user IP addresses to a database. That IP info data is then ingested by another system that deploys it to Cloudflare’s edge, enabling our security products to detect potential threats with minimal latency.
To validate our inferences for which IP addresses are multi-user, we created a dataset relying on separate data and measurements which we believe are more reliable indicators. One method we used was running traceroute queries through RIPE Atlas, from each RIPE Atlas probe to the probe’s public IP address. By examining the traceroute hops, we can determine if an IP is behind a CG-NAT or another middlebox. For example, if an IP is not behind a CG-NAT, the traceroute should terminate immediately or just have one hop (likely a home NAT). On the other hand, if a traceroute path includes addresses within the RFC 6598 CGNAT prefix or other hops in the private or shared address space, it is likely the corresponding probe is behind CG-NAT.
To further improve our validation datasets, we’re also reaching out to our ISP partners to confirm the known IP addresses of CG-NATs. As we refine our validation data, we can more accurately tune our multi-user IP address inference parameters and provide a better experience to ISP customers on sites protected by Cloudflare security products.
The multi-user IP detection service currently recognizes approximately 500,000 unique multi-user IP addresses and is being tuned to further improve detection accuracy. Be on the lookout for an upcoming technical blog post, where we will take a deeper look at the system we built and the metrics collected after running this service for a longer period of time.
How Will This Impact Bot Management and Rate Limiting Customers?
Our initial launch will integrate multi-user IP address detection into our Bot Management and Rate Limiting products.

The Cloudflare Bot Management product has five detection mechanisms. The integration will improve three of the five: the machine learning (ML) detection mechanism, the heuristics engine, and the behavioral analysis models. Multi-user IP addresses and their types will serve as additional features to train our ML model. Furthermore, logic will be added to ensure multi-user IP addresses are treated differently in our other detection mechanisms. For instance, our behavioral analysis detection mechanism shouldn’t treat a series of requests from a multi-user IP the same as a series of requests from a single-user IP. There won’t be any new ways to see or interact with this feature, but you should expect to see a decrease in false positive bot detections involving multi-user IP addresses.
The integration with Rate Limiting will allow us to increase the set rate limiting threshold when receiving requests coming from multi-user IP addresses. The factor by which we increase the threshold will be conservative so as not to completely bypass the rate limit. However, the increased threshold should greatly reduce cases where legitimate users behind multi-user IP addresses are blocked or challenged.
Looking Forward
We plan to further integrate across all of Cloudflare’s products that rely upon IP addresses as a measure of uniqueness, including but not limited to DDoS Protection, Cloudflare One Intel, and Web Application Firewall.
We will also continue to make improvements to our multi-user IP address detection system to incorporate additional data sources and improve accuracy. One data source would allow us to get a fraction for the estimated number of subscribers over the total number of IPs advertised (owned) by an AS. ASes that have more estimated subscribers than available IPs would have to rely on CG-NAT to provide service to all subscribers.
As mentioned above, with the help of our ISP partners we hope to improve the validation datasets we use to test and refine the accuracy of our inferences. Additionally, our integration with Bot Management will also unlock an opportunity to create a feedback loop that further validates our datasets. The challenge solve rate (CSR) is a metric generated by Bot Management that indicates the proportion of requests that were challenged and solved (and thus assumed to be human). Examining requests with both high and low CSRs will allow us to check if the multi-user IP addresses we have initially identified indeed represent mostly legitimate human traffic that our customers should not block.
The continued adoption of IPv6 might someday make CG-NATs and other IPv4 sharing technologies irrelevant, as the address space will no longer be limited. This could reduce the prevalence of multi-user IP addresses. However, with the development of new networking technologies that obfuscate IP addresses for user privacy (for example, IPv6 randomized address assignment), it seems unlikely it will become any easier to tie an IP address to a single user. Cloudflare firmly believes that eventually, IP will be completely unassociated with identity.
Yet in the short term, we recognize that IP addresses still play a pivotal role for the security of our customers. By integrating this multi-user IP address detection capability into our products, we aim to deliver a more free and fluid experience for everyone using the Internet.
Geo Key Manager: Setting up a service for scale
Post Syndicated from Tanya Verma original https://blog.cloudflare.com/scaling-geo-key-manager/
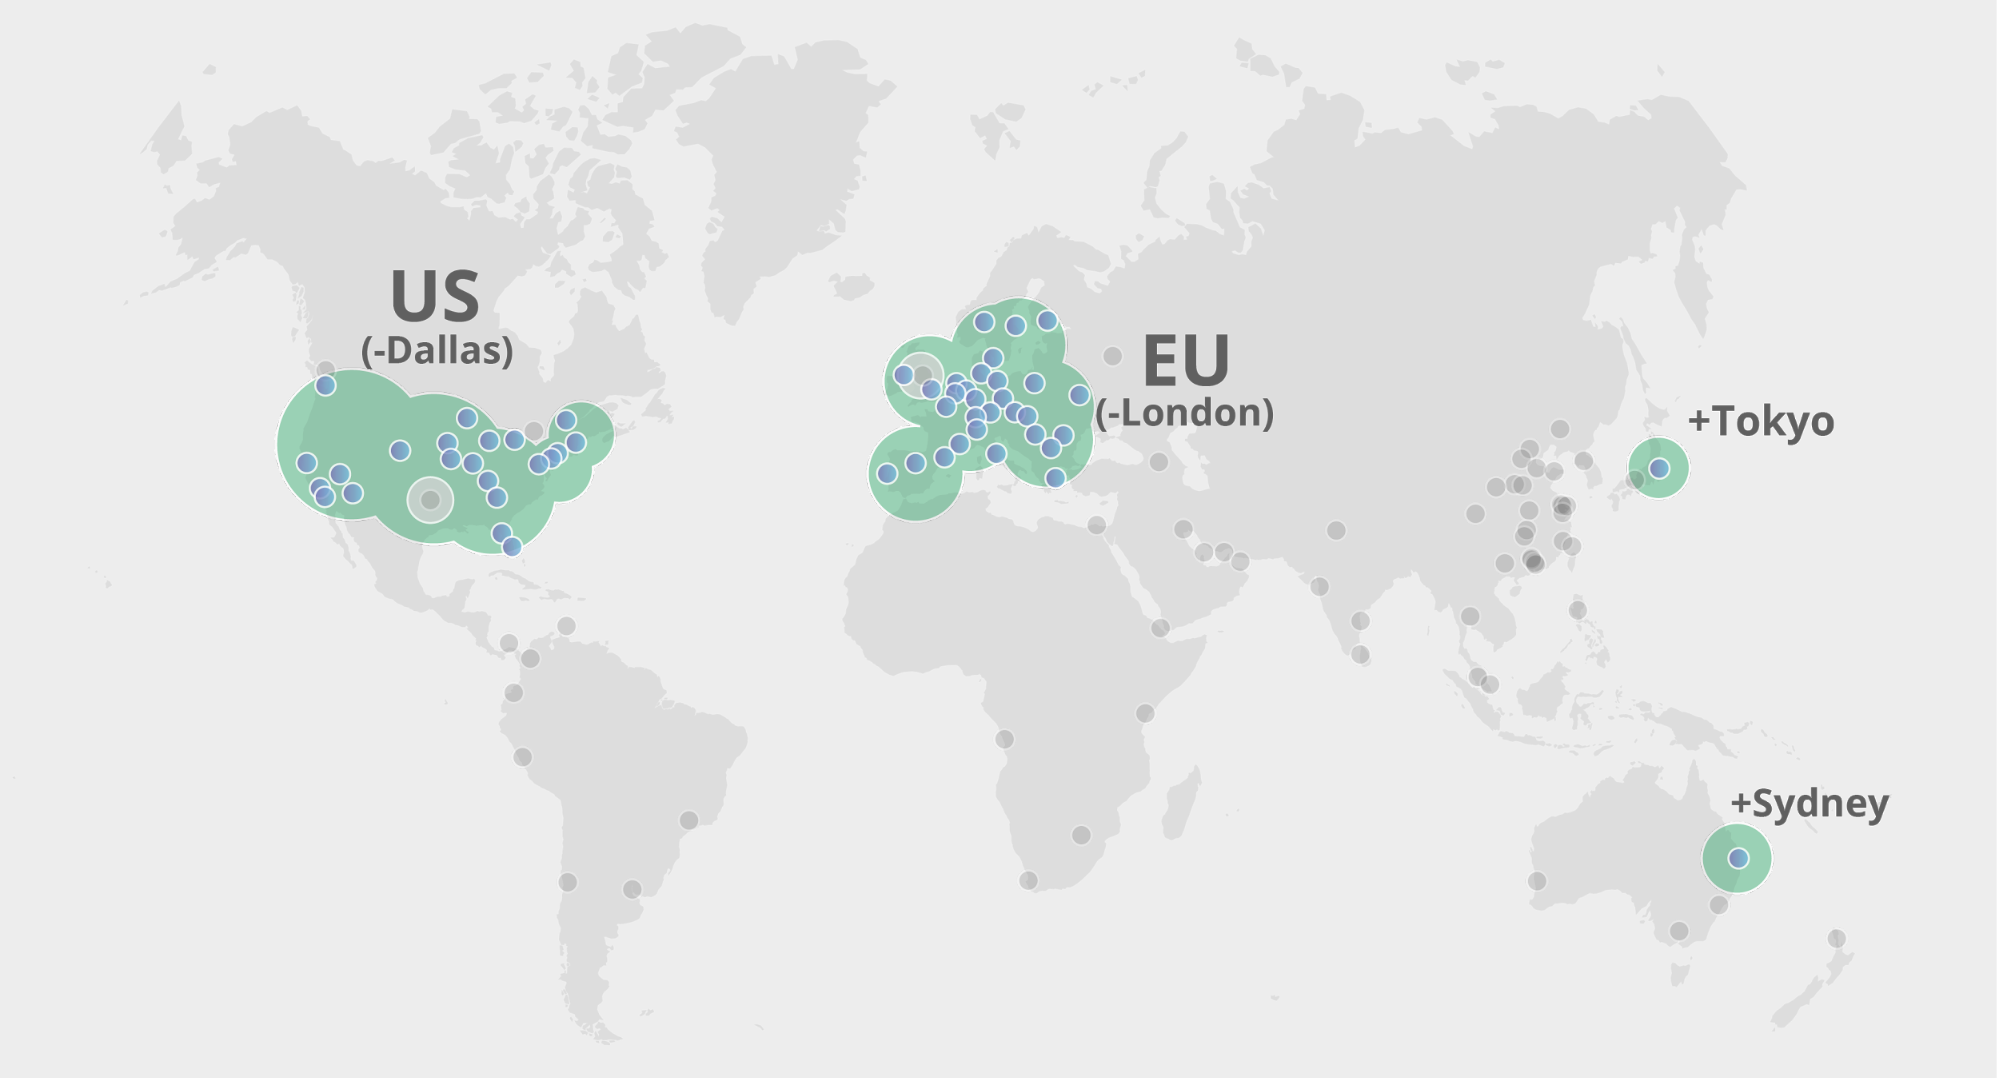
In 2017, we launched Geo Key Manager, a service that allows Cloudflare customers to choose where they store their TLS certificate private keys. For example, if a US customer only wants its private keys stored in US data centers, we can make that happen. When a user from Tokyo makes a request to this website or API, it first hits the Tokyo data center. As the Tokyo data center lacks access to the private key, it contacts a datacenter in the US to terminate the TLS request. Once the TLS session is established, the Tokyo datacenter can serve future requests. For a detailed description of how this works, refer to this post on Geo Key Manager.
This is a story about the evolution of systems in response to increase in scale and scope. Geo Key Manager started off as a small research project and, as it got used more and more, wasn’t scaling as well as we wanted it to. This post describes the challenges Geo Key Manager is facing today, particularly from a networking standpoint, and some of the steps along its way to a truly scalable service.
Geo Key Manager started out as a research project that leveraged two key innovations: Keyless SSL, an early Cloudflare innovation; and identity-based encryption and broadcast encryption, a relatively new cryptographic technique which can be used to construct identity-based access management schemes — in this case, identities based on geography. Keyless SSL was originally designed as a keyserver that customers would host on their own infrastructure, allowing them to retain complete ownership of their own private keys while still reaping the benefits of Cloudflare.
Eventually we started using Keyless SSL for Geo Key Manager requests, and later, all TLS terminations at Cloudflare were switched to an internal version of Keyless SSL. We made several tweaks to make the transition go more smoothly, but this meant that we were using Keyless SSL in ways we hadn’t originally intended.
With the increasing risks of balkanization of the Internet in response to geography-specific regulations like GDPR, demand for products like Geo Key Manager which enable users to retain geographical control of their information has surged. A lot of the work we do on the Research team is exciting because we get to apply cutting-edge advancements in the field to Cloudflare scale systems. It’s also fascinating to see projects be used in new and unexpected ways. But inevitably, many of our systems use technology that has never before been used at this scale which can trigger failures as we shall see.
A trans-pacific voyage
In late March, we started seeing an increase in TLS handshake failures in Melbourne, Australia. When we start observing failures in a specific data center, depending on the affected service, we have several options to mitigate impact. For critical systems like TLS termination, one approach is to reroute all traffic using anycast to neighboring data centers. But when we rerouted traffic away from the Melbourne data center, the same failures moved to the nearby data centers of Adelaide and Perth. As we were investigating the issue, we noticed a large spike in timeouts.
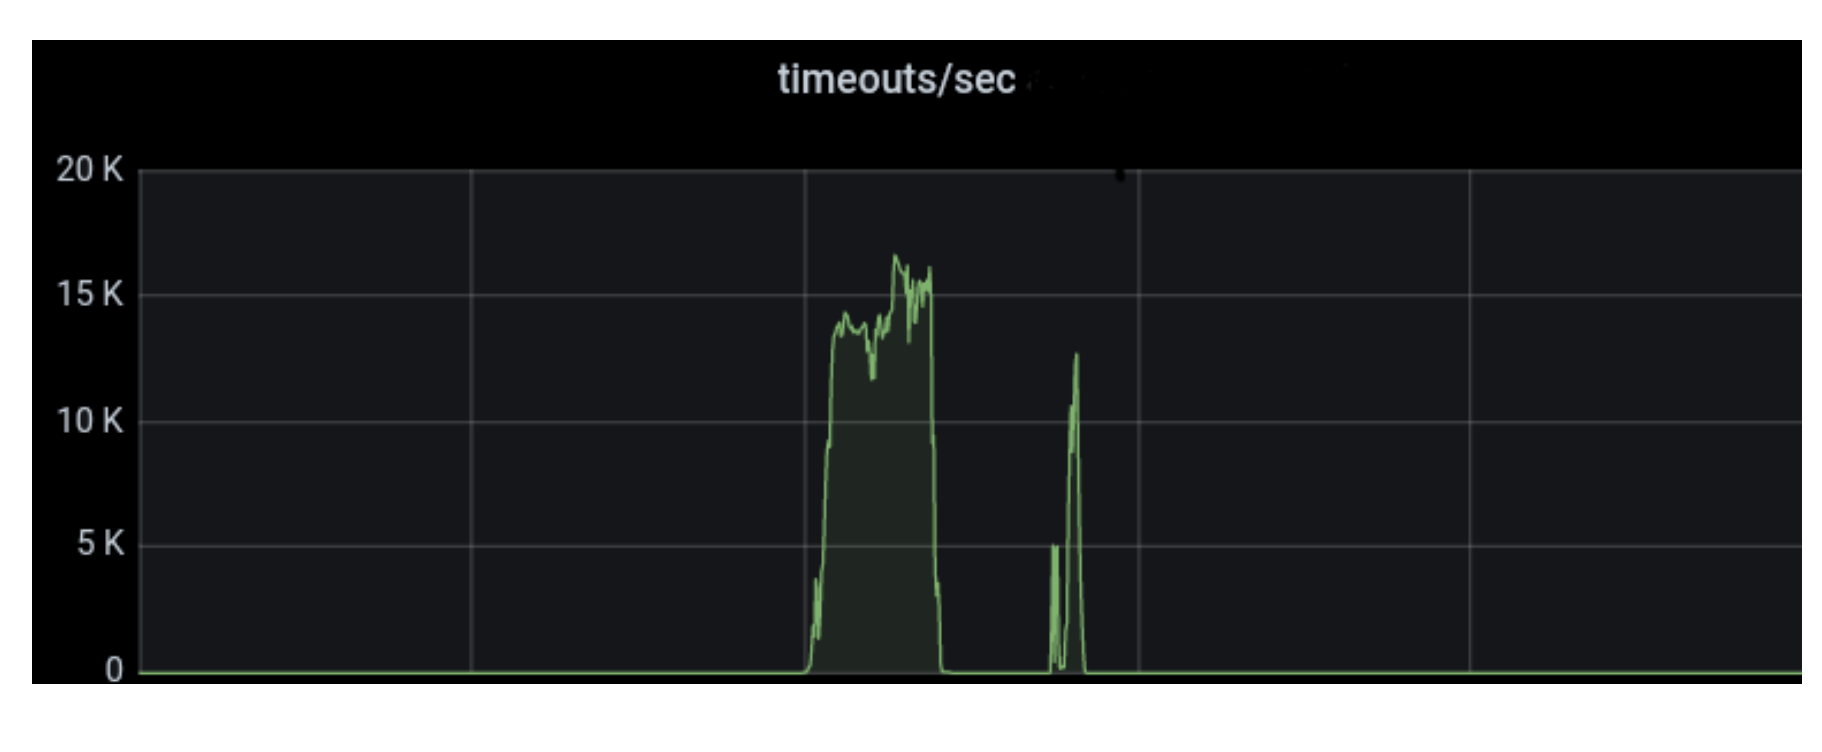
The service that is first in line in the system that makes up TLS termination at Cloudflare performs all the parts of TLS termination that do not require access to the customers’ private keys. Since it is an Internet-facing process, we try to keep sensitive information out of this process as much as possible, in case of memory disclosure bugs. So it forwards the key signing request to keynotto, a service written in Rust that performs RSA and ECDSA key signatures.
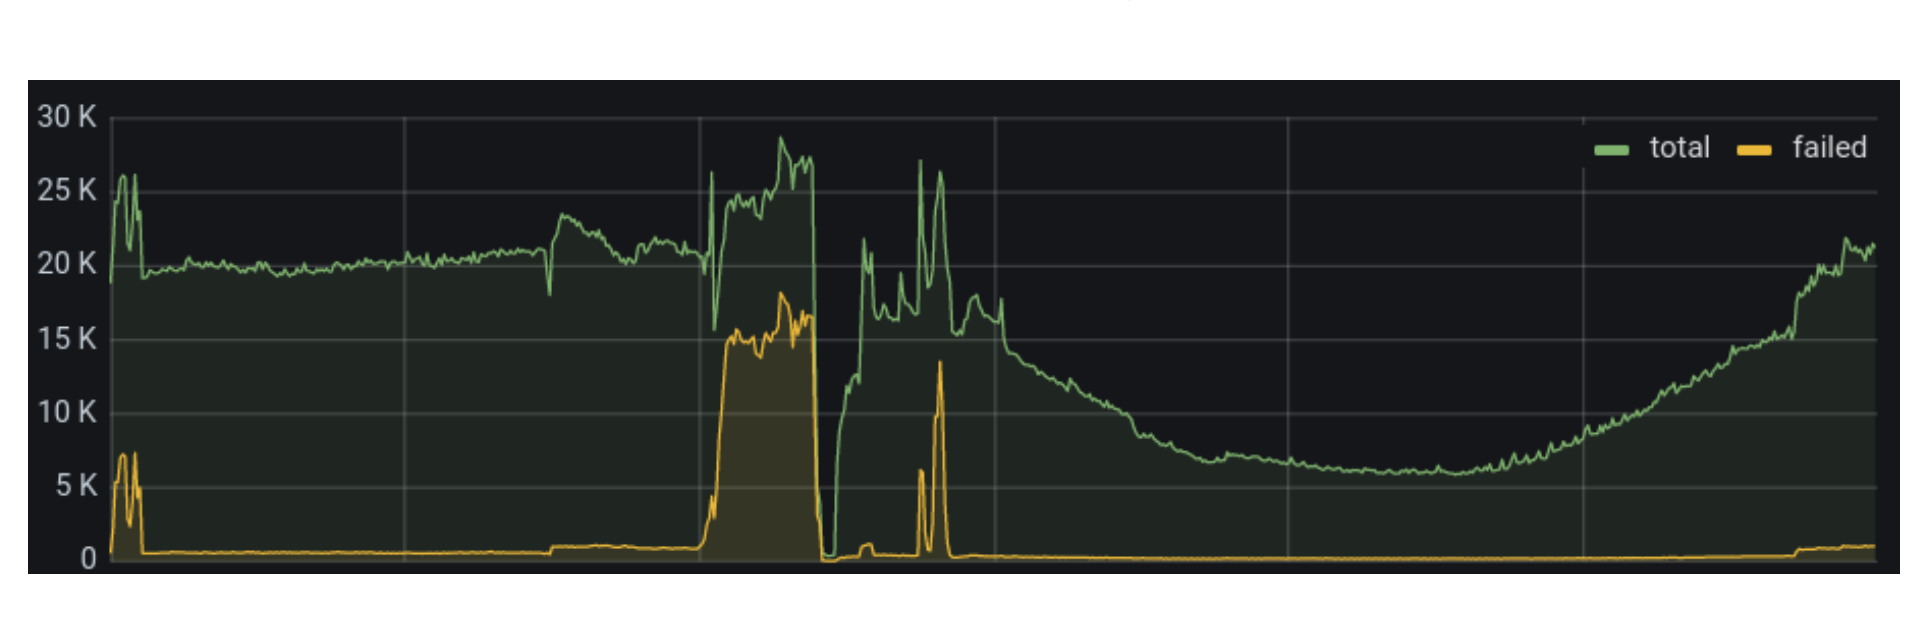
We continued our investigation. This service was timing out on the requests it sent to keynotto. Next, we looked into the requests itself. We observed that there was an increase in total requests, but not by a very large factor. You can see a large drop in traffic in the Melbourne data center below. That indicates the time where we dropped traffic from Melbourne and rerouted it to other nearby data centers.
We decided to track one of these timed-out requests using our distributed tracing infrastructure. The Jaeger UI allows you to chart traces that take the longest. Thanks to this, we quickly figured out that most of these failures were being caused by a single, new zone that was getting a large amount of API traffic. And interestingly, this zone also had Geo Key Manager enabled, with a policy set to US-only data centers.
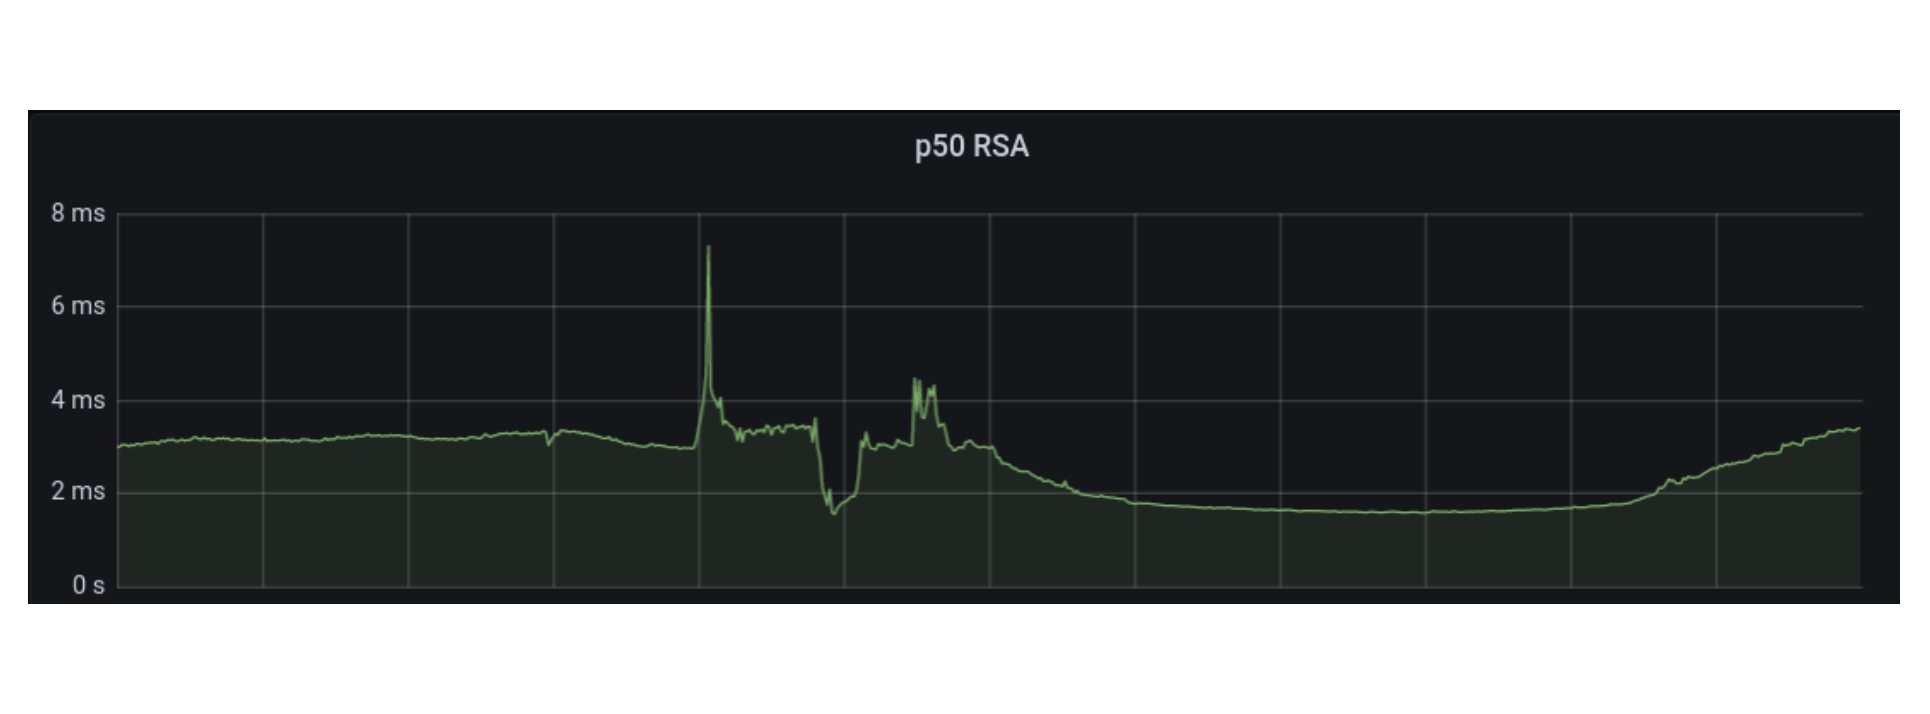
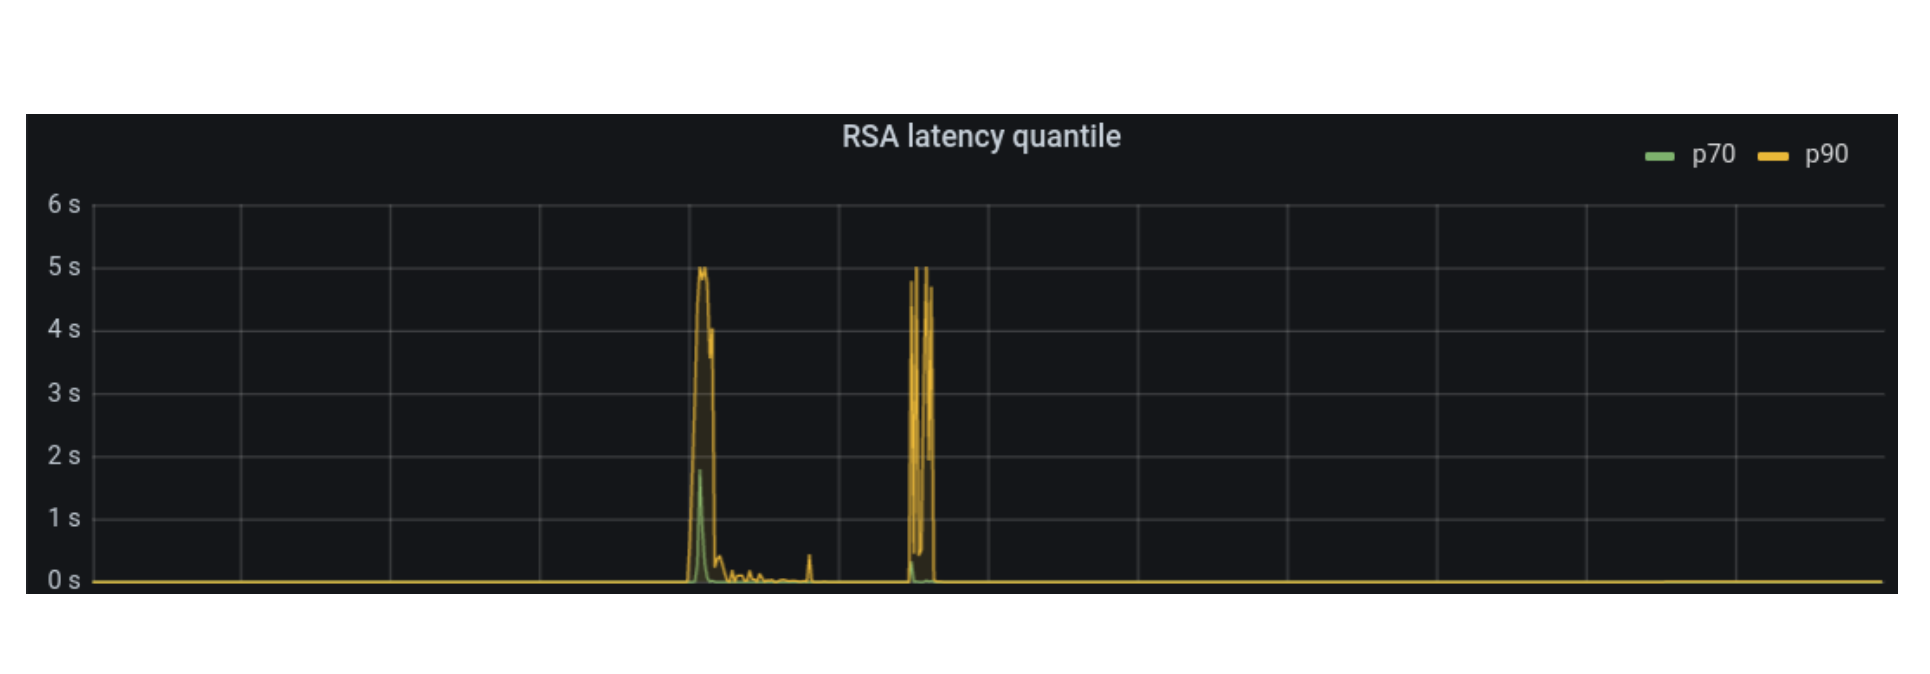
Geo Key Manager routes requests to the closest data center that satisfies the policy. This happened to be a data center in San Francisco. That meant adding ~175ms to the actual time spent performing the key signing (median is 3 ms), to account for the trans-pacific voyage 🚢. So, it made sense that the remote key signatures were relatively slow, but what was causing TLS timeouts and degradation for unrelated zones with nothing to do with Geo Key Manager?
Below are graphs depicting the increase by quantile in RSA key signatures latencies in Melbourne. Plotting them all on the same graph didn’t work right with the scale, so the p50 is shown separately from p70 and p90.
To answer why unrelated zones had timeouts and performance degradation, we have to understand the architecture of the three services involved in terminating TLS.
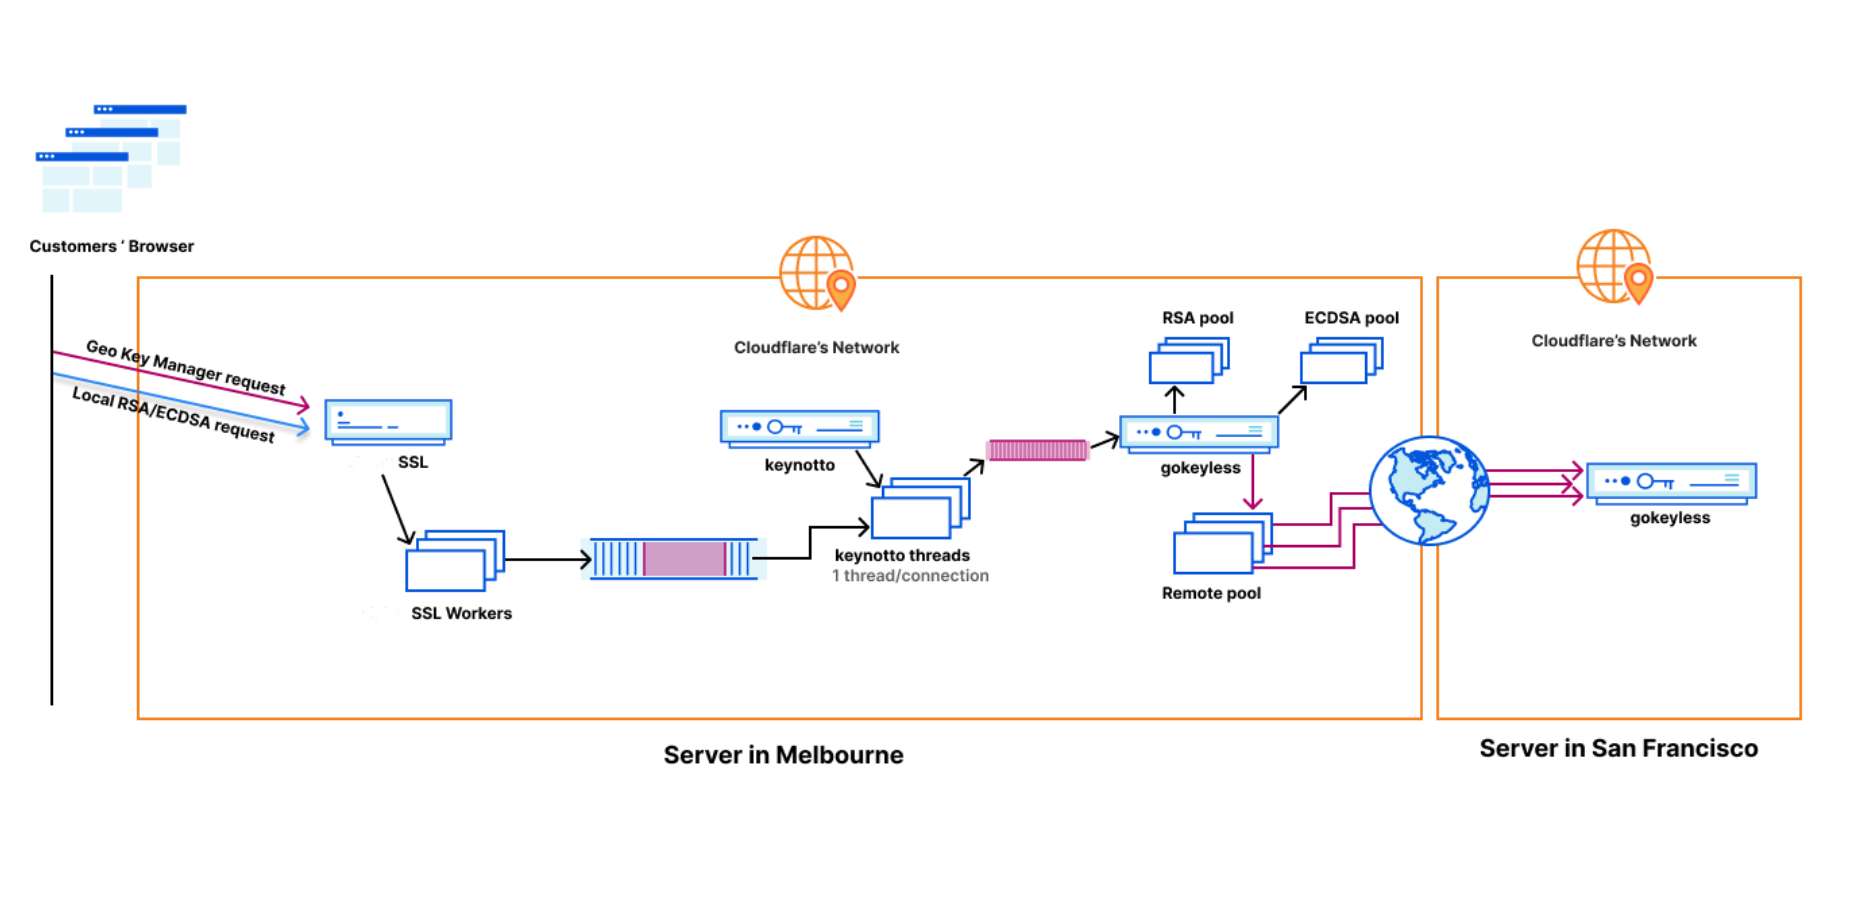
Life of a TLS request
TLS requests arrive at a data center routed by anycast. Each server runs the same stack of services, so each has its own instance of the initial service, keynotto, and gokeyless (discussed shortly). The first service has a worker pool of half the number of CPU cores. There’s 96 cores on each server, so 48 workers. Each of these workers creates their own connection to keynotto, which they use to send and receive the responses of key-signing requests. keynotto, at that point in time, could multiplex between all 48 of these connections because it spawned a new thread to handle each connection. However, it processed all requests on the same connection sequentially. Given that there could be dozens of requests per second on the same connection, if even a single one was slow, it would cause head of line blocking of all other requests enqueued after it. So long as most requests were short lived, this bug went unnoticed. But when a lot of traffic needed to be processed via Geo Key Manager, the head of line blocking created problems. This type of flaw is usually only exposed under heavy load or when load testing, and will make more sense after I introduce gokeyless and explain the history of keynotto.
gokeyless-internal, very imaginatively named, is the internal instance of our Keyless SSL keyserver written in Go. I’ll abbreviate it to gokeyless for the sake of simplicity. Before we introduced keynotto as the designated key signing process, the first service sent all key signing requests directly to gokeyless. gokeyless created worker pools based on the type of operation consisting of goroutines, a very lightweight thread managed by the Go runtime. The ones of interest are the RSA, ECDSA, and the remote worker pool. RSA and ECDSA are fairly obvious, these goroutines performed RSA key signatures and ECDSA key signatures. Any requests involving Geo Key Manager were placed in the remote pool. This prevented the network-dependent remote requests from affecting local key signatures. Worker pools were an artifact of a previous generation of Keyless which didn’t need to account for remote requests. Using benchmarks we had noticed that spinning up worker pools provided some marginal latency benefits. For local operations only, performance was optimal as the computation was very fast and CPU bound. However, when we started adding remote operations that could block the workers needed for performing local operations, we decided to create a new worker pool only for remote ops.
When gokeyless was designed in 2014, Rust was not a mature language. But that changed recently, and we decided to experiment with a minimal Rust proxy placed between the first service and gokeyless. This would handle RSA and ECDSA signatures, which were about 99% of all key signing operations, while handing off the more esoteric operations like Geo Key Manager over to gokeyless running locally on the same server. The hope was that we could eke out some performance gains from the tight runtime control afforded by Rust and the use of Rust’s cryptographic libraries. Performance is incredibly important to Cloudflare since CPU is one of the main limiting factors for edge servers. Go’s RSA is notorious for being slow and using a lot of CPU. Given that one in three handshakes use RSA, it is important to optimize it. CGo seemed to create unnecessary overhead, and there was no assembly-only RSA that we could use. We tried to speed up RSA without CGo and only using assembly and made some strides, but it was still a little non-optimal. So keynotto was built to take advantage of the fast RSA implementation in BoringSSL.
The next section is a quick diversion into keynotto that isn’t strictly related to the story, but who doesn’t enjoy a hot take on Go vs Rust?
Go vs Rust: The battle continues
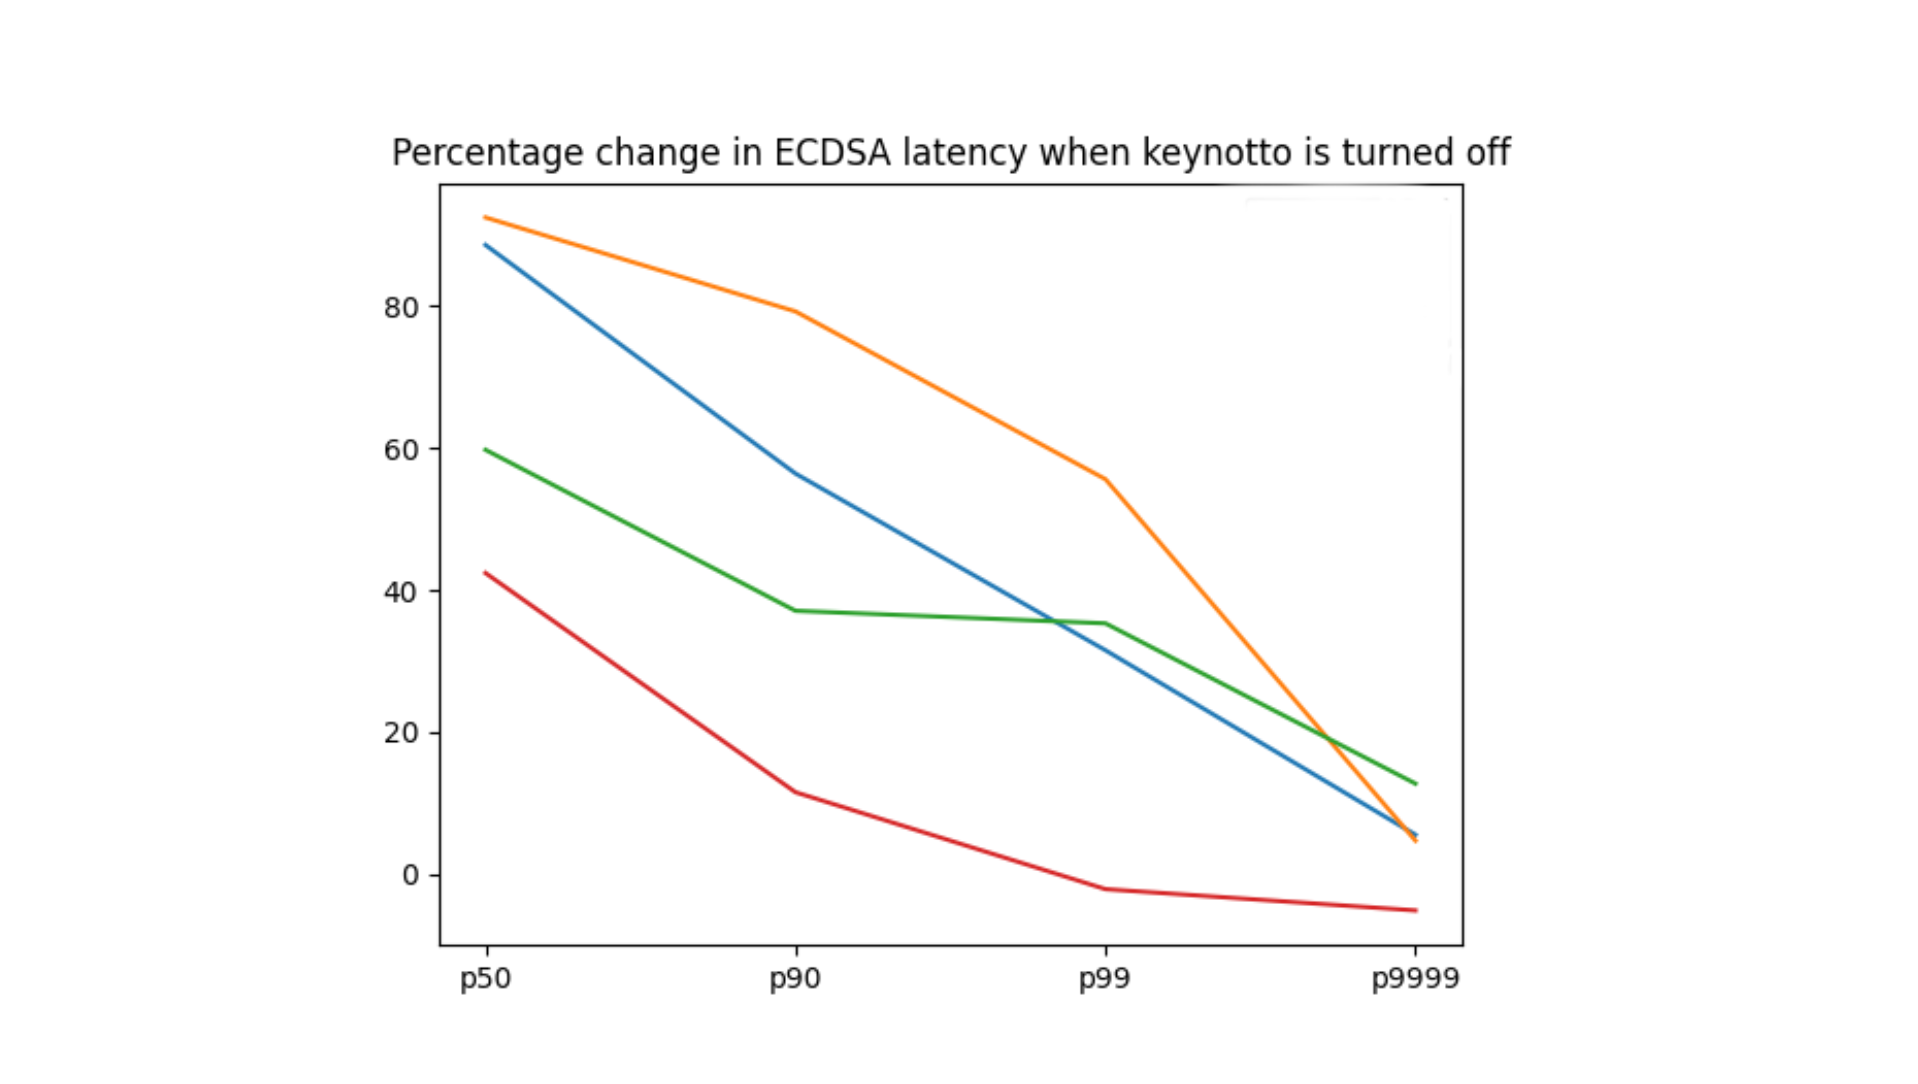
While keynotto was initially deployed because it objectively lowered CPU, we weren’t sure what fraction of its benefits over gokeyless were related to different cryptography libraries used vs the choice of language. keynotto used BoringCrypto, the TLS library that is part of BoringSSL, whereas gokeyless used Go’s standard crypto library crypto/tls. And keynotto was implemented in Rust, while gokeyless in Go. However, recently during the process of FedRAMP certification, we had to switch the TLS library in gokeyless to use the same cryptography library as keynotto. This was because while the Go standard library doesn’t use a FIPS validated cryptography module, this Google-maintained branch of Go that uses BoringCrypto does. We then turned off keynotto in a few very large data centers for a couple days and compared this to the control group of having keynotto turned on. We found that moving gokeyless to BoringCrypto provided a very marginal benefit, forcing us to revisit our stance on CGo. This result meant we could attribute the difference to using Rust over Go and implementation differences between keynotto and gokeyless.
Turning off keynotto resulted in an average 26% increase in maximum memory consumed and 71% increase in maximum CPU consumed. In the case of all quantiles, we observed a significant increase in latency for both RSA and ECDSA. ECDSA as measured across four different large data centers (each is a different color) is shown:
Remote ops don’t play fair
The first service, keynotto and gokeyless communicate over TCP via the custom Keyless protocol. This protocol was developed in 2014, and originally intended for communicating with external key servers aka gokeyless. After this protocol started being used internally, by increasing numbers of clients in several different languages, challenges started appearing. In particular, each client had to implement by hand the serialization code and make sense of all the features the protocol provided. The custom protocol also makes tracing more challenging to do right. So while older clients like the first service have tuned their implementations, for newer clients like keynotto, it can be difficult to consider every property such as the right way to propagate traces and such.
One such property that the Keyless protocol offers is multiplexing of requests within a connection. It does so by provisioning unique IDs for each request, which allows for out-of-order delivery of the responses similar to protocols like HTTP/2. While the first service and gokeyless leveraged this property to handle situations where the order of responses is different from the order of requests, keynotto, a much newer service, didn’t. This is why it had to process requests on the same connection sequentially. This led to local key signing requests — which took roughly 3ms — being blocked on the remote requests that took 60x that duration!
We now know why most TLS requests were degraded/dropped. But it’s also worth examining the remote requests themselves. The gokeyless remote worker pool had 200 workers in each server. One of the mitigations we applied was bumping that number to 2,000. Increasing the concurrency in a system when faced with problems that resemble resource constraints is an understandable thing to do. The reason not to do so is high resource utilization. Let’s get some context on why bumping up remote workers 10x wasn’t necessarily a problem. When gokeyless was created, it had separate pools with a configurable number of workers for RSA, ECDSA, and remote ops. RSA and ECDSA had a large fraction of workers, and remote was relatively smaller. Post keynotto, the need for the RSA and ECDSA pool was obviated since keynotto handled all local key signing operations.
Let’s do some napkin math now to prove that bumping it by 10x could not have possibly helped. We were receiving five thousand requests per second in addition to the usual traffic in Melbourne. 200 were remote requests. Melbourne has 60 servers. Looking at a breakdown of remote requests by server, the maximum remote requests one server had was ten requests per second (rps). The graph below shows the percentage of workers in gokeyless actually performing operations, “other” is the remote workers. We can see that while Melbourne worker utilization peaked at 47%, that is still not 100%. And we see that the utilization in San Francisco was much lower, so it couldn’t be SF that was slowing things down.
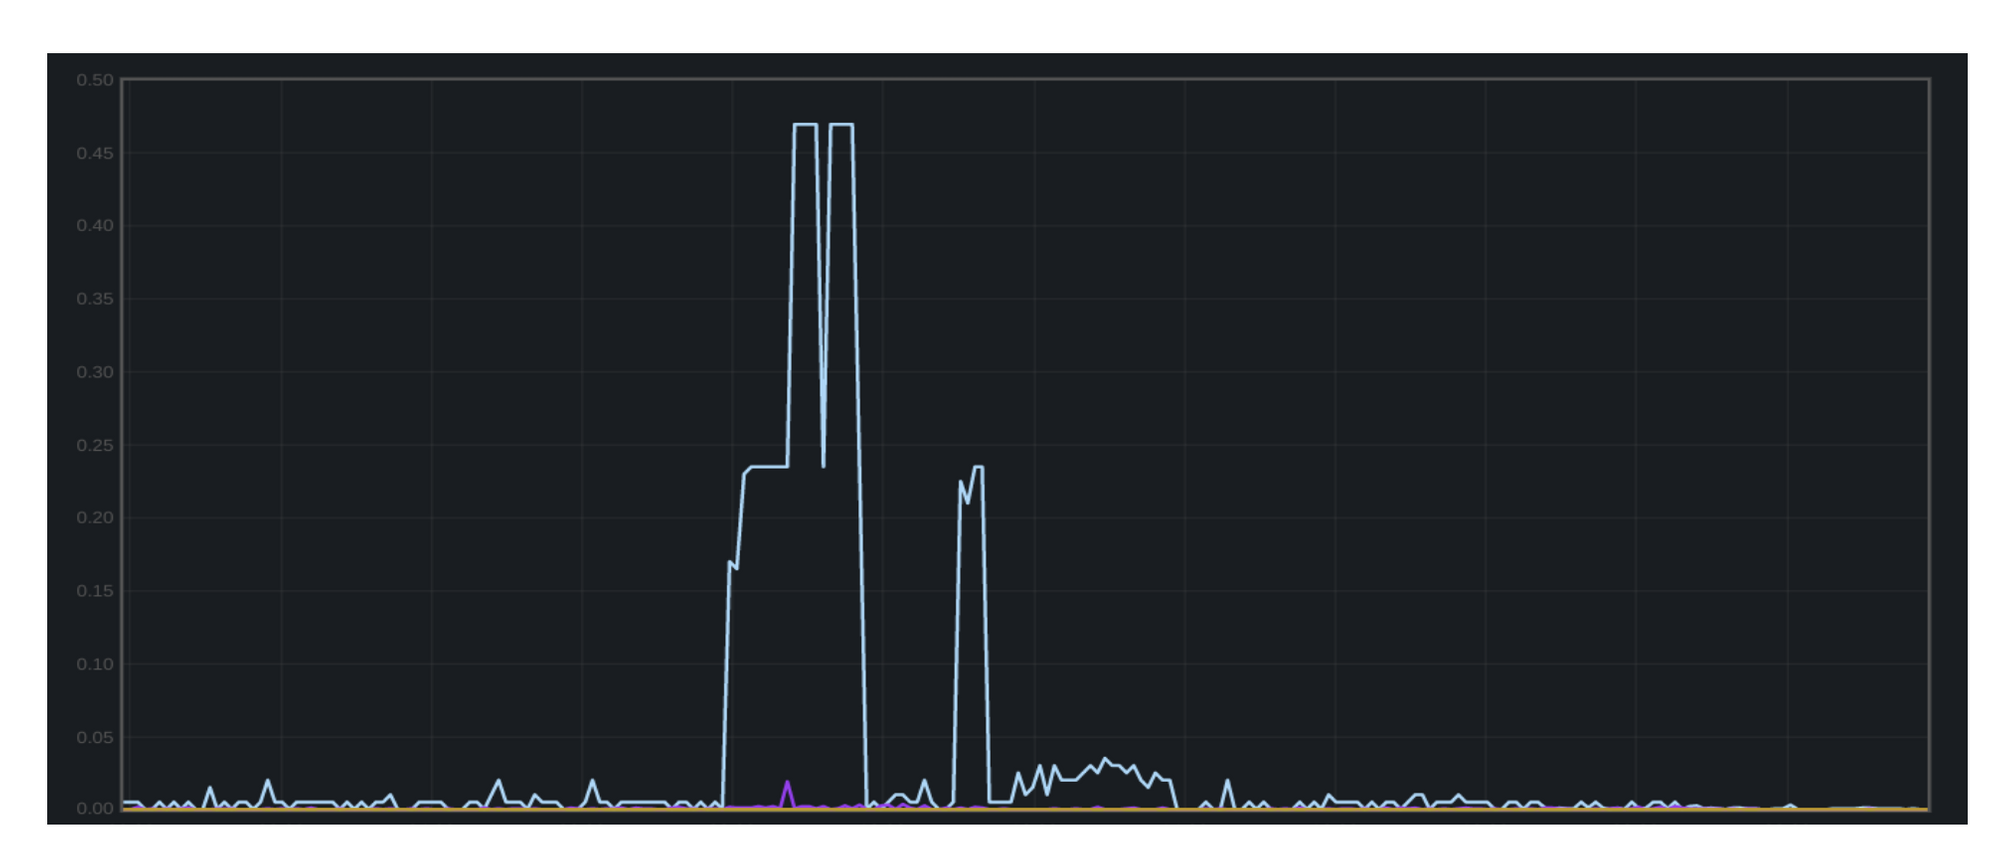
Given that we had 200 workers per server and at most ten requests per second, even if they took 200 ms each, gokeyless was not the bottleneck. We had no reason to increase the number of remote workers. The culprit here was keynotto’s serial queue.
The solution here was to prevent remote signing ops from blocking local ops in keynotto. We did this by changing the internal task handling model of keynotto to not just handle each connection concurrently, but also to process each request on a connection concurrently. This was done by using a multi-producer, single-consumer queue. When a request from a connection was read, it was handed off to a new thread for processing while the connection thread went back to reading requests. When the request was done processing, the response was written to a channel. A write thread for each connection was also created, which polled the read side of the channel and wrote the response back to the connection.
The next thing we added were carefully chosen timeout values to keynotto. Timeouts allow for faster failure and faster cleanup of resources associated with the timed out request. Choosing appropriate timeouts can be tricky, especially when composed across multiple services. Since keynotto is downstream of the first service but upstream of gokeyless, its timeout should be smaller than the former but larger than the latter to allow upstream services to diagnose which process triggered the timeout. Timeouts can further be complicated when network latency is involved, because trans-pacific p99 latency is very different from p99 between two US states. Using the worst case network latency can be a fair compromise. We chose keynotto timeouts to be an order of magnitude larger than the p99 request latency, since the purpose was to prevent continued stall and resource consumption.
A more general solution to avoid the two issues outlined above would be to use gRPC. gRPC was released in 2015, which was one year too late to be used in Keyless at that time. It has several advantages over custom protocol implementations such as multi-language client libraries, improved tracing, easy timeouts, load balancing, protobuf for serialization and so on, but directly relevant here is multiplexing. gRPC supports multiplexing out of the box which makes it unnecessary to handle request/response multiplexing manually.
Tracking requests across the Atlantic
Then in early June, we started seeing TLS termination timeouts in Chicago. This time, there were timeouts across the first service, keynotto, and gokeyless. We had on our hands a zone with Geo Key Manager policy set to the EU that had suddenly started receiving around 80 thousand remote rps, which was significantly more than the 200 remote rps in Australia. This time, keynotto was not responsible since its head of line blocking issues had been fixed. It was timing out waiting for gokeyless to perform the remote key signatures. A quick glance at the maximum worker utilization of gokeyless for the entire datacenter revealed that it was maxed out. To counteract the issue, we increased the remote workers from 200 to 20,000, and then to 200,000. It wasn’t enough. Requests were still timing out and worker utilization was squarely at 100% until we rate limited the traffic to that zone.
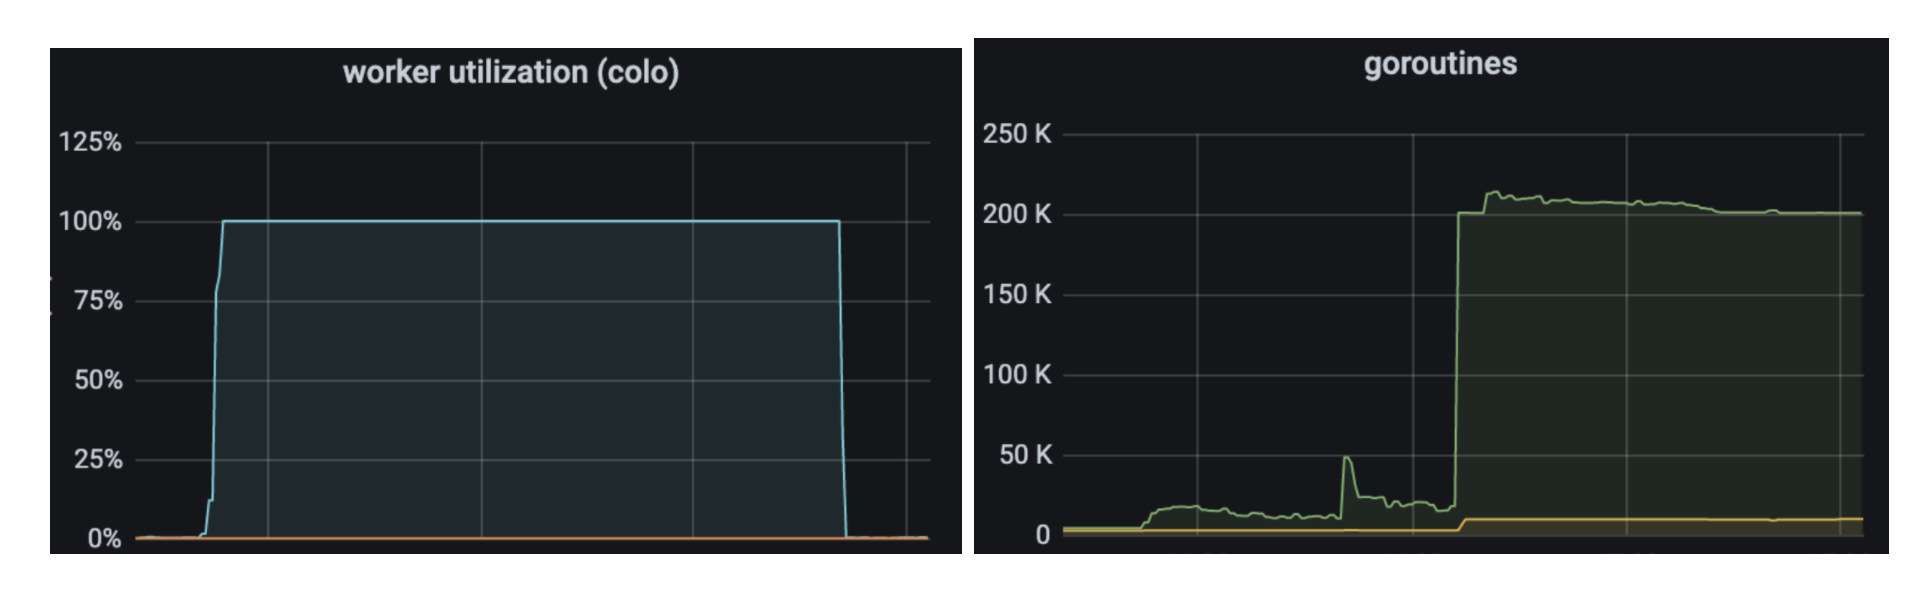
Why didn’t increasing the number of workers by a factor of 1,000 times help? We didn’t even have 250,000 rps for the entire datacenter, let alone every server.
File descriptors don’t scale
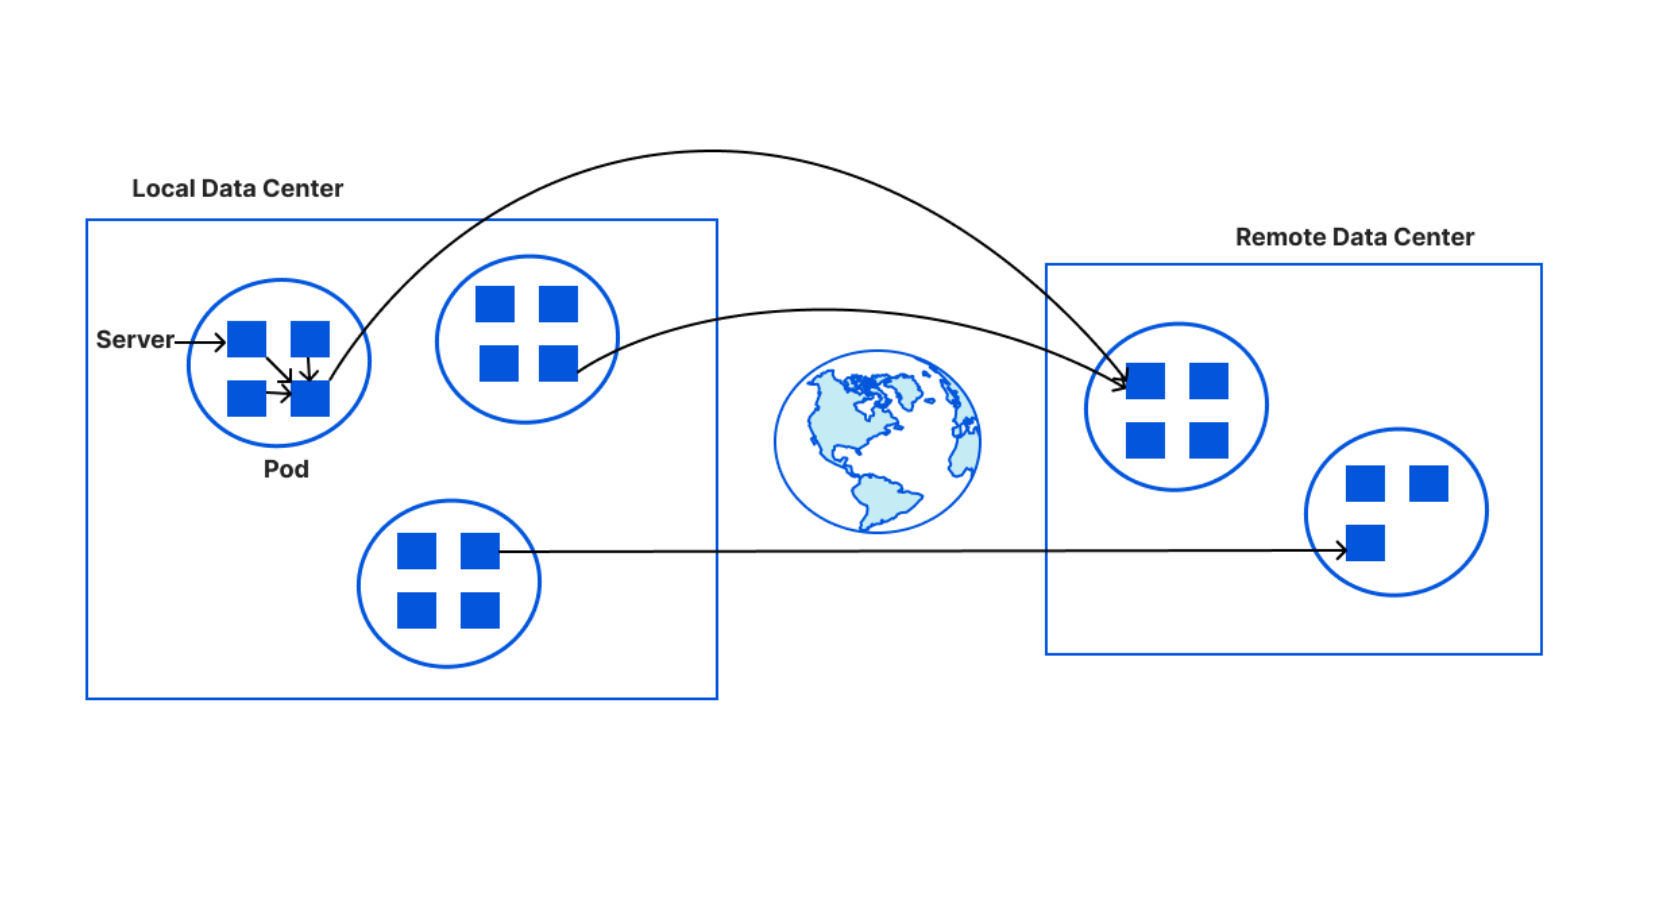
gokeyless maintains a map of ping latencies to each data center as measured from the data center that the instance is running in. It updates this map frequently and uses it to make decisions about which data center to route remote requests to. A long time ago, every server in every data center maintained its own connections to other data centers. This quickly grew out of hand and we started running out of file descriptors as the number of data centers grew. So, we switched to a new system of creating pods of 32 servers and shared the connections that each server needed to maintain with other data centers by the size of the pod. This was great for reducing the number of file descriptors being used by each server.
An example will illustrate this better. In a data center with 100 servers, there would be four pods: three with 32 servers each and one with four servers. If there were a total of 65 data centers in the world, then each server in a pod of 32 will be responsible for maintaining connections to two data centers, and each server in the pod of four will handle 16 servers. Remote requests are routed to the data center with the shortest latency. So in a pod of 32 servers, the server that maintains the connection with the closest data center will be responsible for sending remote requests from every member of the pod to the target data center. In case of failure or timeout, the data center which is second closest (and then the third closest) will be responsible. If all three closest data centers return failures, we give up and return a failure. So this means if a data center with 130 servers is receiving 80k remote rps, which is 615 rps/server, then there will be approximately four servers that are actually responsible for routing all remote traffic at any given time, and will each be handling ~20k rps. This was the case in Chicago. These requests were being routed to a data center in Hamburg, Germany and there could be a maximum of four connections at the same time between Chicago and Hamburg.
Little’s Law
At that time, gokeyless used a worker pool architecture with a queue for buffering additional tasks. This queue blocked after 1,024 requests were queued, to create backpressure on the client. This is a common technique to prevent overloading — not accepting more tasks than the server knows it can handle. p50 RSA latency was 4 ms. The latency from Chicago to Hamburg was ~100 ms. After we bumped up the remote workers for each server to 200,000 in Chicago, we were surely not constrained on the sending end since we only had 80k rps for the whole data center and each request shouldn’t take more than 100 ms in the vast majority of cases. We know this because of Little’s Law. Little’s Law states that the capacity of a system is the arrival rate multiplied by the service time for each request. Let’s see how it applies here, and how it allowed us to prove why increasing concurrency or queue size did not help.
Consider the queue in the German data center, Hamburg in this case. We hadn’t bumped the number of remote workers there, so only 200 remote workers were available. Assuming 20k rps arrived to one server in Hamburg and each took ~5 ms to process, the necessary concurrency in the system should be 100 workers. We had 200 workers. Even without a queue, Hamburg should’ve been easily able to handle the 20k rps thrown at it. We investigated how many remote rps were actually processed per server in Hamburg:
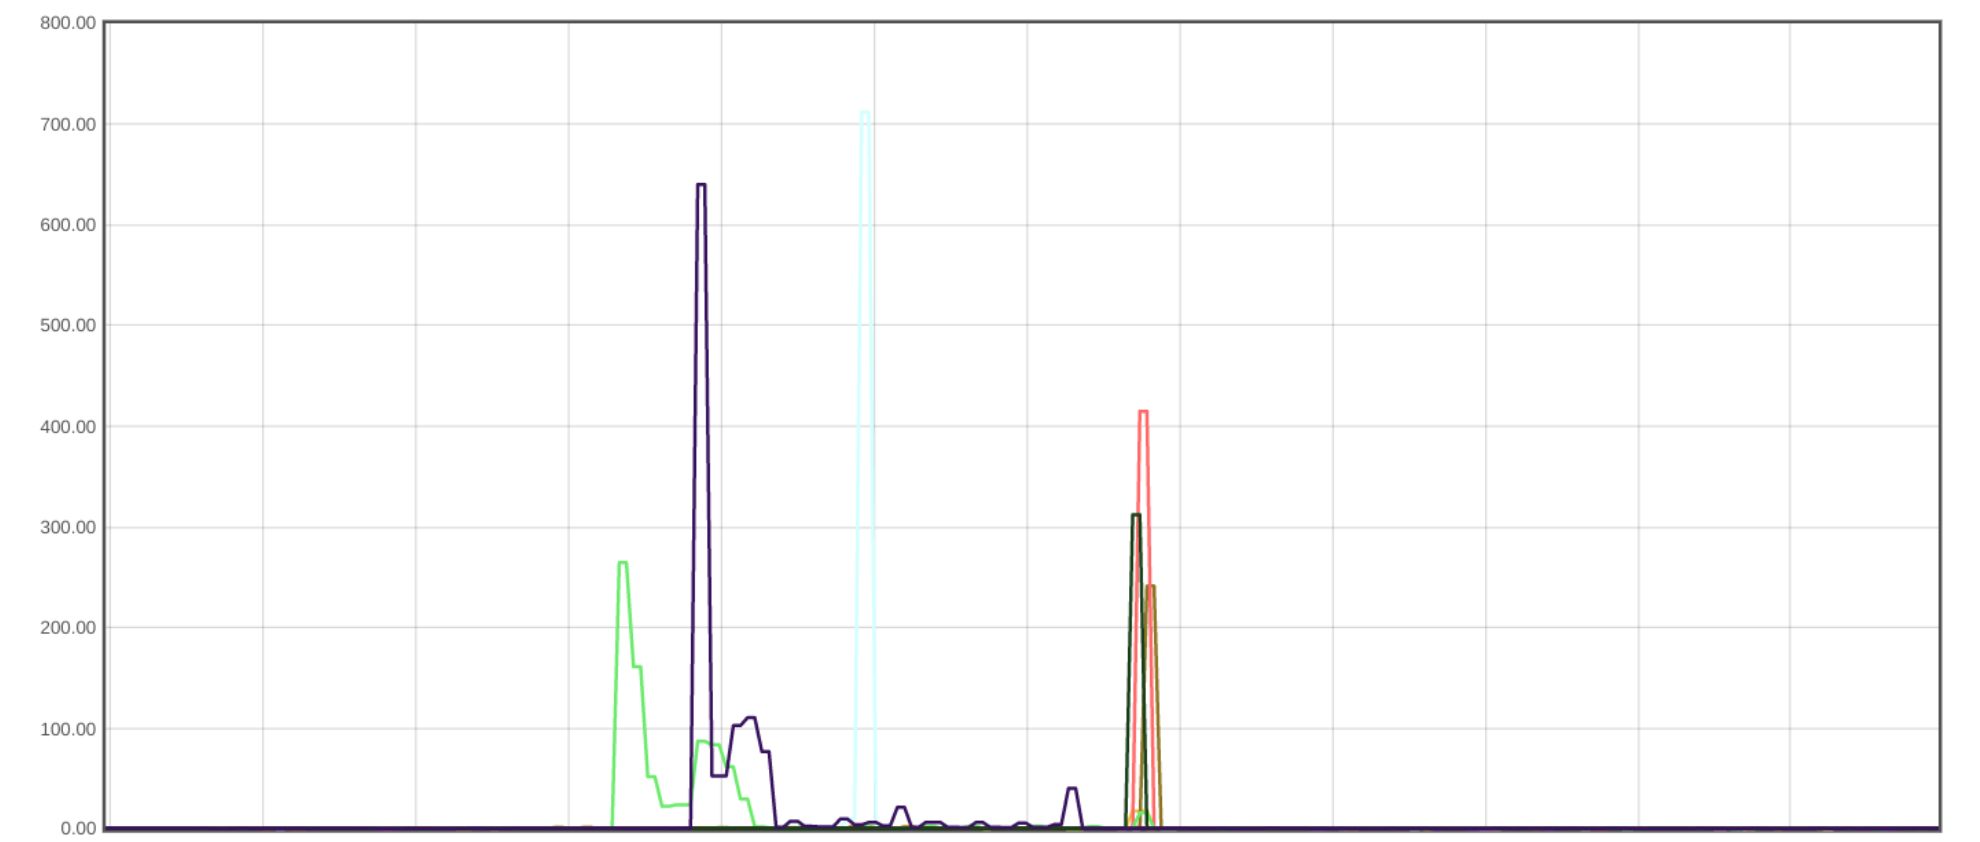
These numbers didn’t make any sense! The maximum number at any time was a little over 700. We should’ve been able to process orders of magnitude more requests. By the time we investigated this, the incident had ended. We had no visibility into the size of the service level queue — or the size of the TCP queue — to understand what could have caused the timeouts. We speculated that while p50 for the population of all RSA key signatures might be 4 ms, perhaps for the specific population of Geo Key Manager RSA signatures, things took a whole lot longer. With 200 workers, we processed ~500 rps, which meant each operation would have to take 400 ms. p99.9 for signatures can be around this much, so it is possible that was how long things took.
We recently ran a load test to establish an upper bound on remote rps, and discovered that one server in the US could process 7,000 remote rps to the EU — much lower than Little’s Law suggests. We identified several slow remote requests through tracing and noticed these usually corresponded with multiple tries to different remote hosts. The explanation for why these retries are necessary to get through to an otherwise very functional data center is that gokeyless uses a hardcoded list of data centers and corresponding server hostnames to establish connections to. Hostnames can change when new servers are added or removed. If we are attempting to connect to an invalid host and waiting on a one second timeout, we will certainly need to retry to another host, which can cause large increases in average processing time.
After the Hamburg outage, we decided to remove gokeyless worker pools and switch to a model of one goroutine per request. Goroutines are extremely lightweight, with benchmarks that suggest that a 4 GB machine can handle around one million goroutines. This was something that made sense to do after we had extended gokeyless to support remote requests in 2017, but because of the complexity involved in changing the entire architecture of processing requests, we held off on the change. Furthermore, when we launched Geo Key Manager, we didn’t have enough traffic that might have prompted us to rethink this architecture urgently. This removes complexity from the code, because tuning worker pool sizes and queue sizes can be complicated. We have also observed, on average, a 7x drop in the memory consumed on switching to this one goroutine per request model, because we no longer have idle goroutines active as was in the case of worker pools. It also makes it easier to trace the life of an individual request because you get to follow along all the steps in its execution, which can help when trying to chase down per request slowdowns.
Conclusion
The complexity of distributed systems can quickly scale up to unmanageable levels, making it important to have deep visibility into it. An extremely important tool to have is distributed tracing, which tracks a request through multiple services and provides information about time spent in each part of the journey. We didn’t propagate gokeyless trace spans through parts of the remote operation, which prevented us from identifying why Hamburg only processed 700 rps. Having examples on hand for various error cases can also make diagnosis easier, especially in the midst of an outage. While we load tested our TLS termination system in the common case, where key signatures happened locally, we hadn’t load tested the less common and lower volume use case of remote operations. Using sources of truth that update dynamically to reflect the current state of the world instead of static sources is also important. In our case, the list of data centers that gokeyless connected to for performing remote operation was hardcoded a long time ago and never updated. So while we added more data centers, gokeyless was unable to make use of them, and in some cases, may have been connecting to servers with invalid.
We’re now working on overhauling several pieces of Geo Key Manager to make it significantly more flexible and scalable, so think of this as setting up the stage for a future blog post where we finally solve some of the issues outlined here, and stay tuned for updates!
Mass Rescuer: Chiune Sugihara
Post Syndicated from The History Guy: History Deserves to Be Remembered original https://www.youtube.com/watch?v=4T94X2ICOk0
Comic for 2021.10.15
Post Syndicated from Explosm.net original http://explosm.net/comics/6002/
New Cyanide and Happiness Comic
Unsolved Math Problems
Post Syndicated from original https://xkcd.com/2529/

Architecture Monthly Magazine: Aerospace
Post Syndicated from Bonnie McClure original https://aws.amazon.com/blogs/architecture/architecture-monthly-magazine-aerospace/
The aerospace and space industries have changed considerably since the early days of jet travel and the Apollo missions. New technology is making space and sky more accessible than ever—startups are reaching skyward and towards the stars with seemingly every day new, innovative ideas.
This month’s issue of Architecture Monthly brings you curated content to highlight some of these ideas and innovations from our commercial aerospace, aerospace defense, and space leaders, including the newly launched AWS for Aerospace and Satellite organization. We highlight new and updated technology, practical solutions and their applications, and innovative companies that are working towards exploring and learning about the final frontier. Get inspired!
We’d like to thank our experts, Scott Eberhardt, Worldwide Tech Leader, Aerospace; Shayn Hawthorne, Sr. Mgr., Aerospace Tech Leader; and Buffy Wajvoda, Head of SA – Space & Satellite for their contributions.
Please give us your feedback! Include your comments on the Amazon Kindle page. You can view past issues and reach out to [email protected] anytime with your questions and comments.
In this month’s issue:
- Ask an Expert: Scott Eberhardt, Worldwide Tech Lead for Aerospace at AWS; Shayn Hawthorne, Space Technology Leader for AWS Aerospace and Satellite Solutions Division; and Buffy Wajvoda, Worldwide Leader for Aerospace and Satellite Solutions Architecture at AWS
- Website: Introduction to AWS for Aerospace and Satellite
- Blog: Capella uses space to bring you closer to Earth
- Reference Architecture: Run Machine Learning Algorithms with Satellite Data
- Blog: UAE Mars mission uses AWS to advance scientific discoveries
- Solution: AWS re:Invent 2020: Detecting extreme weather events from space
- Blog: Announcing the AWS Space Accelerator for startups
- Reference Architecture: Electro-Optical Imagery Reference Architecture
- Case Study: Avio Aero Accelerates Business Growth with HPC Solution on AWS
- Reference Architecture: Connected Aircraft
- Case Study: Joby Aviation Uses AWS to Revolutionize Transportation
- Whitepaper: Model Based Systems Engineering (MBSE) on AWS: From Migration to Innovation
- Reference Architecture: Using Computer Vision for Product Quality Analysis in Plants
- Videos:
- AWS re:Invent 2020: Advancing the future of space in the cloud
- AWS Connected Aircraft Overview
- AWS Vision for Model-based Engineering in Aerospace
- Avio Aero, a GE Aviation Business: Serverless Application to Manage Expense Purchase Approvals
- Cybersecurity and Compliance for Aerospace
- Product Lifecycle Management for Aerospace
How to access the magazine
- View and download past issues as PDFs on the AWS Architecture Monthly webpage.
- Readers in the US, UK, Germany, and France can subscribe to the Kindle version of the magazine at Kindle Newsstand.
- Visit Flipboard, a personalized mobile magazine app that you can also read on your computer.
We hope you’re enjoying Architecture Monthly, and we’d like to hear from you—leave us a star rating and comment on the Kindle Newsstand page or contact us anytime at [email protected].
New AWS workbook for New Zealand financial services customers
Post Syndicated from Julian Busic original https://aws.amazon.com/blogs/security/new-aws-workbook-for-new-zealand-financial-services-customers/
We are pleased to announce a new AWS workbook designed to help New Zealand financial services customers align with the Reserve Bank of New Zealand (RBNZ) Guidance on Cyber Resilience.
The RBNZ Guidance on Cyber Resilience sets out the RBNZ expectations for its regulated entities regarding cyber resilience, and aims to raise awareness and promote the cyber resilience of the financial sector, especially at board and senior management level. The guidance applies to all entities regulated by the RBNZ, including registered banks, licensed non-bank deposit takers, licensed insurers, and designated financial market infrastructures.
While the RBNZ describes its guidance as “a set of recommendations rather than requirements” which are not legally enforceable, it also states that it expects regulated entities to “proactively consider how their current approach to cyber risk management lines up with the recommendations in [the] guidance and look for [opportunities] for improvement as early as possible.”
Security and compliance is a shared responsibility between AWS and the customer. This differentiation of responsibility is commonly referred to as the AWS Shared Responsibility Model, in which AWS is responsible for security of the cloud, and the customer is responsible for their security in the cloud. The new AWS Reserve Bank of New Zealand Guidance on Cyber Resilience (RBNZ-GCR) Workbook helps customers align with the RBNZ Guidance on Cyber Resilience by providing control mappings for the following:
- Security in the cloud by mapping RBNZ Guidance on Cyber Resilience practices to the five pillars of the AWS Well-Architected Framework.
- Security of the cloud by mapping RBNZ Guidance on Cyber Resilience practices to control statements from the AWS Compliance Program.
The downloadable AWS RBNZ-GCR Workbook contains two embedded formats:
- Microsoft Excel – Coverage includes AWS responsibility control statements and Well-Architected Framework best practices.
- Dynamic HTML – Coverage is the same as in the Microsoft Excel format, with the added feature that the Well-Architected Framework best practices are mapped to AWS Config managed rules and Amazon GuardDuty findings, where available or applicable.
The AWS RBNZ-GCR Workbook is available for download in AWS Artifact, a self-service portal for on-demand access to AWS compliance reports. Sign in to AWS Artifact in the AWS Management Console, or learn more at Getting Started with AWS Artifact.
If you have feedback about this post, submit comments in the Comments section below.
Want more AWS Security how-to content, news, and feature announcements? Follow us on Twitter.
Introducing the Security at the Edge: Core Principles whitepaper
Post Syndicated from Maddie Bacon original https://aws.amazon.com/blogs/security/introducing-the-security-at-the-edge-core-principles-whitepaper/
Amazon Web Services (AWS) recently released the Security at the Edge: Core Principles whitepaper. Today’s business leaders know that it’s critical to ensure that both the security of their environments and the security present in traditional cloud networks are extended to workloads at the edge. The whitepaper provides security executives the foundations for implementing a defense in depth strategy for security at the edge by addressing three areas of edge security:
- AWS services at AWS edge locations
- How those services and others can be used to implement the best practices outlined in the design principles of the AWS Well-Architected Framework Security Pillar
- Additional AWS edge services, which customers can use to help secure their edge environments or expand operations into new, previously unsupported environments
Together, these elements offer core principles for designing a security strategy at the edge, and demonstrate how AWS services can provide a secure environment extending from the core cloud to the edge of the AWS network and out to customer edge devices and endpoints. You can find more information in the Security at the Edge: Core Principles whitepaper.
If you have feedback about this post, submit comments in the Comments section below.
Want more AWS Security how-to content, news, and feature announcements? Follow us on Twitter.
ESPHome 2021.10 Release Party
Post Syndicated from Home Assistant original https://www.youtube.com/watch?v=X10ToPN1gIk