Post Syndicated from The Atlantic original https://www.youtube.com/watch?v=iim4F8cVQ5E
A QUICker SASE client: re-building Proxy Mode
Post Syndicated from Koko Uko original https://blog.cloudflare.com/faster-sase-proxy-mode-quic/
When you need to use a proxy to keep your zero trust environment secure, it often comes with a cost: poor performance for your users. Soon after deploying a client proxy, security teams are generally slammed with support tickets from users frustrated with sluggish browser speed, slow file transfers, and video calls glitching at just the wrong moment. After a while, you start to chalk it up to the proxy — potentially blinding yourself to other issues affecting performance.
We knew it didn’t have to be this way. We knew users could go faster, without sacrificing security, if we completely re-built our approach to proxy mode. So we did.
In the early days of developing the device client for our SASE platform, Cloudflare One, we prioritized universal compatibility. When an admin enabled proxy mode, the Client acted as a local SOCKS5 or HTTP proxy. However, because our underlying tunnel architecture was built on WireGuard, a Layer 3 (L3) protocol, we faced a technical hurdle: how to get application-layer (L4) TCP traffic into an L3 tunnel. Moving from L4 to L3 was especially difficult because our desktop Client works across multiple platforms (Windows, macOS, Linux) so we couldn’t use the kernel to achieve this.
To get over this hurdle, we used smoltcp, a Rust-based user-space TCP implementation. When a packet hit the local proxy, the Client had to perform a conversion, using smoltcp to convert the L4 stream into L3 packets for the WireGuard tunnel.
While this worked, it wasn’t efficient. Smoltcp is optimized for embedded systems, and does not support modern TCP features. In addition, in the Cloudflare edge, we had to convert the L3 packets back into an L4 stream. For users, this manifested as a performance ceiling. On media-heavy sites where a browser might open dozens of concurrent connections for images and video, and the lack of a high performing TCP stack led to high latency and sluggish load times when even on high-speed fiber connections, proxy mode felt significantly slower than all the other device client modes.
To solve this, we’ve re-built the Cloudflare One Client’s proxy mode from the ground up and deprecated the use of WireGuard for proxy mode, so we can capitalize on the capabilities of QUIC. We were already leveraging MASQUE (part of QUIC) for proxying IP packets, and added the usage of QUIC streams for direct L4 proxying.
By leveraging HTTP/3 (RFC 9114) with the CONNECT method, we can now keep traffic at Layer 4, where it belongs. When your browser sends a SOCKS5 or HTTP request to the Client, it is no longer broken down into L3 packets.

Instead, it is encapsulated directly into a QUIC stream.
This architectural shift provides three immediate technical advantages:
-
Bypassing smoltcp: By removing the L3 translation layer, we eliminate IP packet handling and the limitations of smoltcp’s TCP implementation.
-
Native QUIC Benefits: We benefit from modern congestion control and flow control, which are handled natively by the transport layer.
-
Tuneability: The Client and Cloudflare’s edge can tune QUIC’s parameters to optimize performance.
In our internal testing, the results were clear: download and upload speeds doubled, and latency decreased significantly.
While faster is always better, this update specifically unblocks three key common use cases.
First, in coexistence with third-party VPNs where a legacy VPN is still required for specific on-prem resources or where having a dual SASE setup is required for redundancy/compliance, the local proxy mode is the go-to solution for adding zero trust security to web traffic. This update ensures that “layering” security doesn’t mean sacrificing the user experience.
Second, for high-bandwidth application partitioning, proxy mode is often used to steer specific browser traffic through Cloudflare Gateway while leaving the rest of the OS on the local network. Users can now stream high-definition content or handle large datasets without sacrificing performance.
Finally, developers and power users who rely on the SOCKS5 secondary listener for CLI tools or scripts will see immediate improvements. Remote API calls and data transfers through the proxy now benefit from the same low-latency connection as the rest of the Cloudflare global network.
The proxy mode improvements are available with minimum client version 2025.8.779.0 for Windows, macOS, and Linux devices. To take advantage of these performance gains, ensure you are running the latest version of the Cloudflare One Client.
-
Log in to the Cloudflare One dashboard.
-
Navigate to Teams & Resources > Devices > Device profiles > General profiles.
-
Select a profile to edit or create a new one and ensure the Service mode is set to Local proxy mode and the Device tunnel protocol is set to MASQUE.
You can verify your active protocol on a client machine by running the following command in your terminal:
warp-cli settings | grep protocolVisit our documentation for detailed guidance on enabling proxy mode for your devices.
If you haven’t started your SASE journey yet, you can sign up for a free Cloudflare One account for up to 50 users today. Simply create an account, download the Cloudflare One Client, and follow our onboarding guide to experience a faster, more stable connection for your entire team.
How Automatic Return Routing solves IP overlap
Post Syndicated from Steve Welham original https://blog.cloudflare.com/automatic-return-routing-ip-overlap/
The public Internet relies on a fundamental principle of predictable routing: a single IP address points to a logically unique destination. Even in an Anycast architecture like Cloudflare’s, where one IP is announced from hundreds of locations, every instance of that IP represents the same service. The routing table always knows exactly where a packet is intended to go.
This principle holds up because global addressing authorities assign IP space to organizations to prevent duplication or conflict. When everyone adheres to a single, authoritative registry, a routing table functions as a source of absolute truth.
On the public Internet, an IP address is like a unique, globally registered national identity card. In private networks, an IP is just a name like “John Smith”, which is perfectly fine until you have three of them in the same room trying to talk to the same person.
As we expand Cloudflare One to become the connectivity cloud for enterprise backbones, we’ve entered the messy reality of private IP address space. There are good reasons why duplication arises, and enterprises need solutions to handle these conflicts.
Today, we are introducing Automatic Return Routing (ARR) in Closed Beta. ARR is an optional tool for Cloudflare One customers that gives you the flexibility to route traffic back to where it originated, without requiring an IP route in a routing table. This capability allows overlapping networks to coexist without a single line of Network Address Translation (NAT) or complex Virtual Routing and Forwarding (VRF) configuration.
In enterprise networking, IP overlap is a fact of life. We see it in three common scenarios that traditionally cause toil for admins:
-
Mergers & acquisitions: Two companies merge, and both use
10.0.1.0/24for their core services. -
Extranets: Partners, vendors or customers securely connect to your network using their own internal IP schemes, leading to unavoidable conflicts.
-
Cookie-cutter architectures: SaaS providers or retail brands use identical IP space for every branch to simplify deployment and operation.
The problem arises when these sites try to talk to the Internet or a data center through Cloudflare. If two different sites send traffic from the same source IP, the return packet hits an architectural wall. The administrator has to make a decision on how to route the traffic based on the ambiguous destination. If the administrator puts both routes into the routing table, it will be non-deterministic as to which path is taken: the correct path or the incorrect path. From the perspective of a standard routing table, there is no way to distinguish between two identical paths.
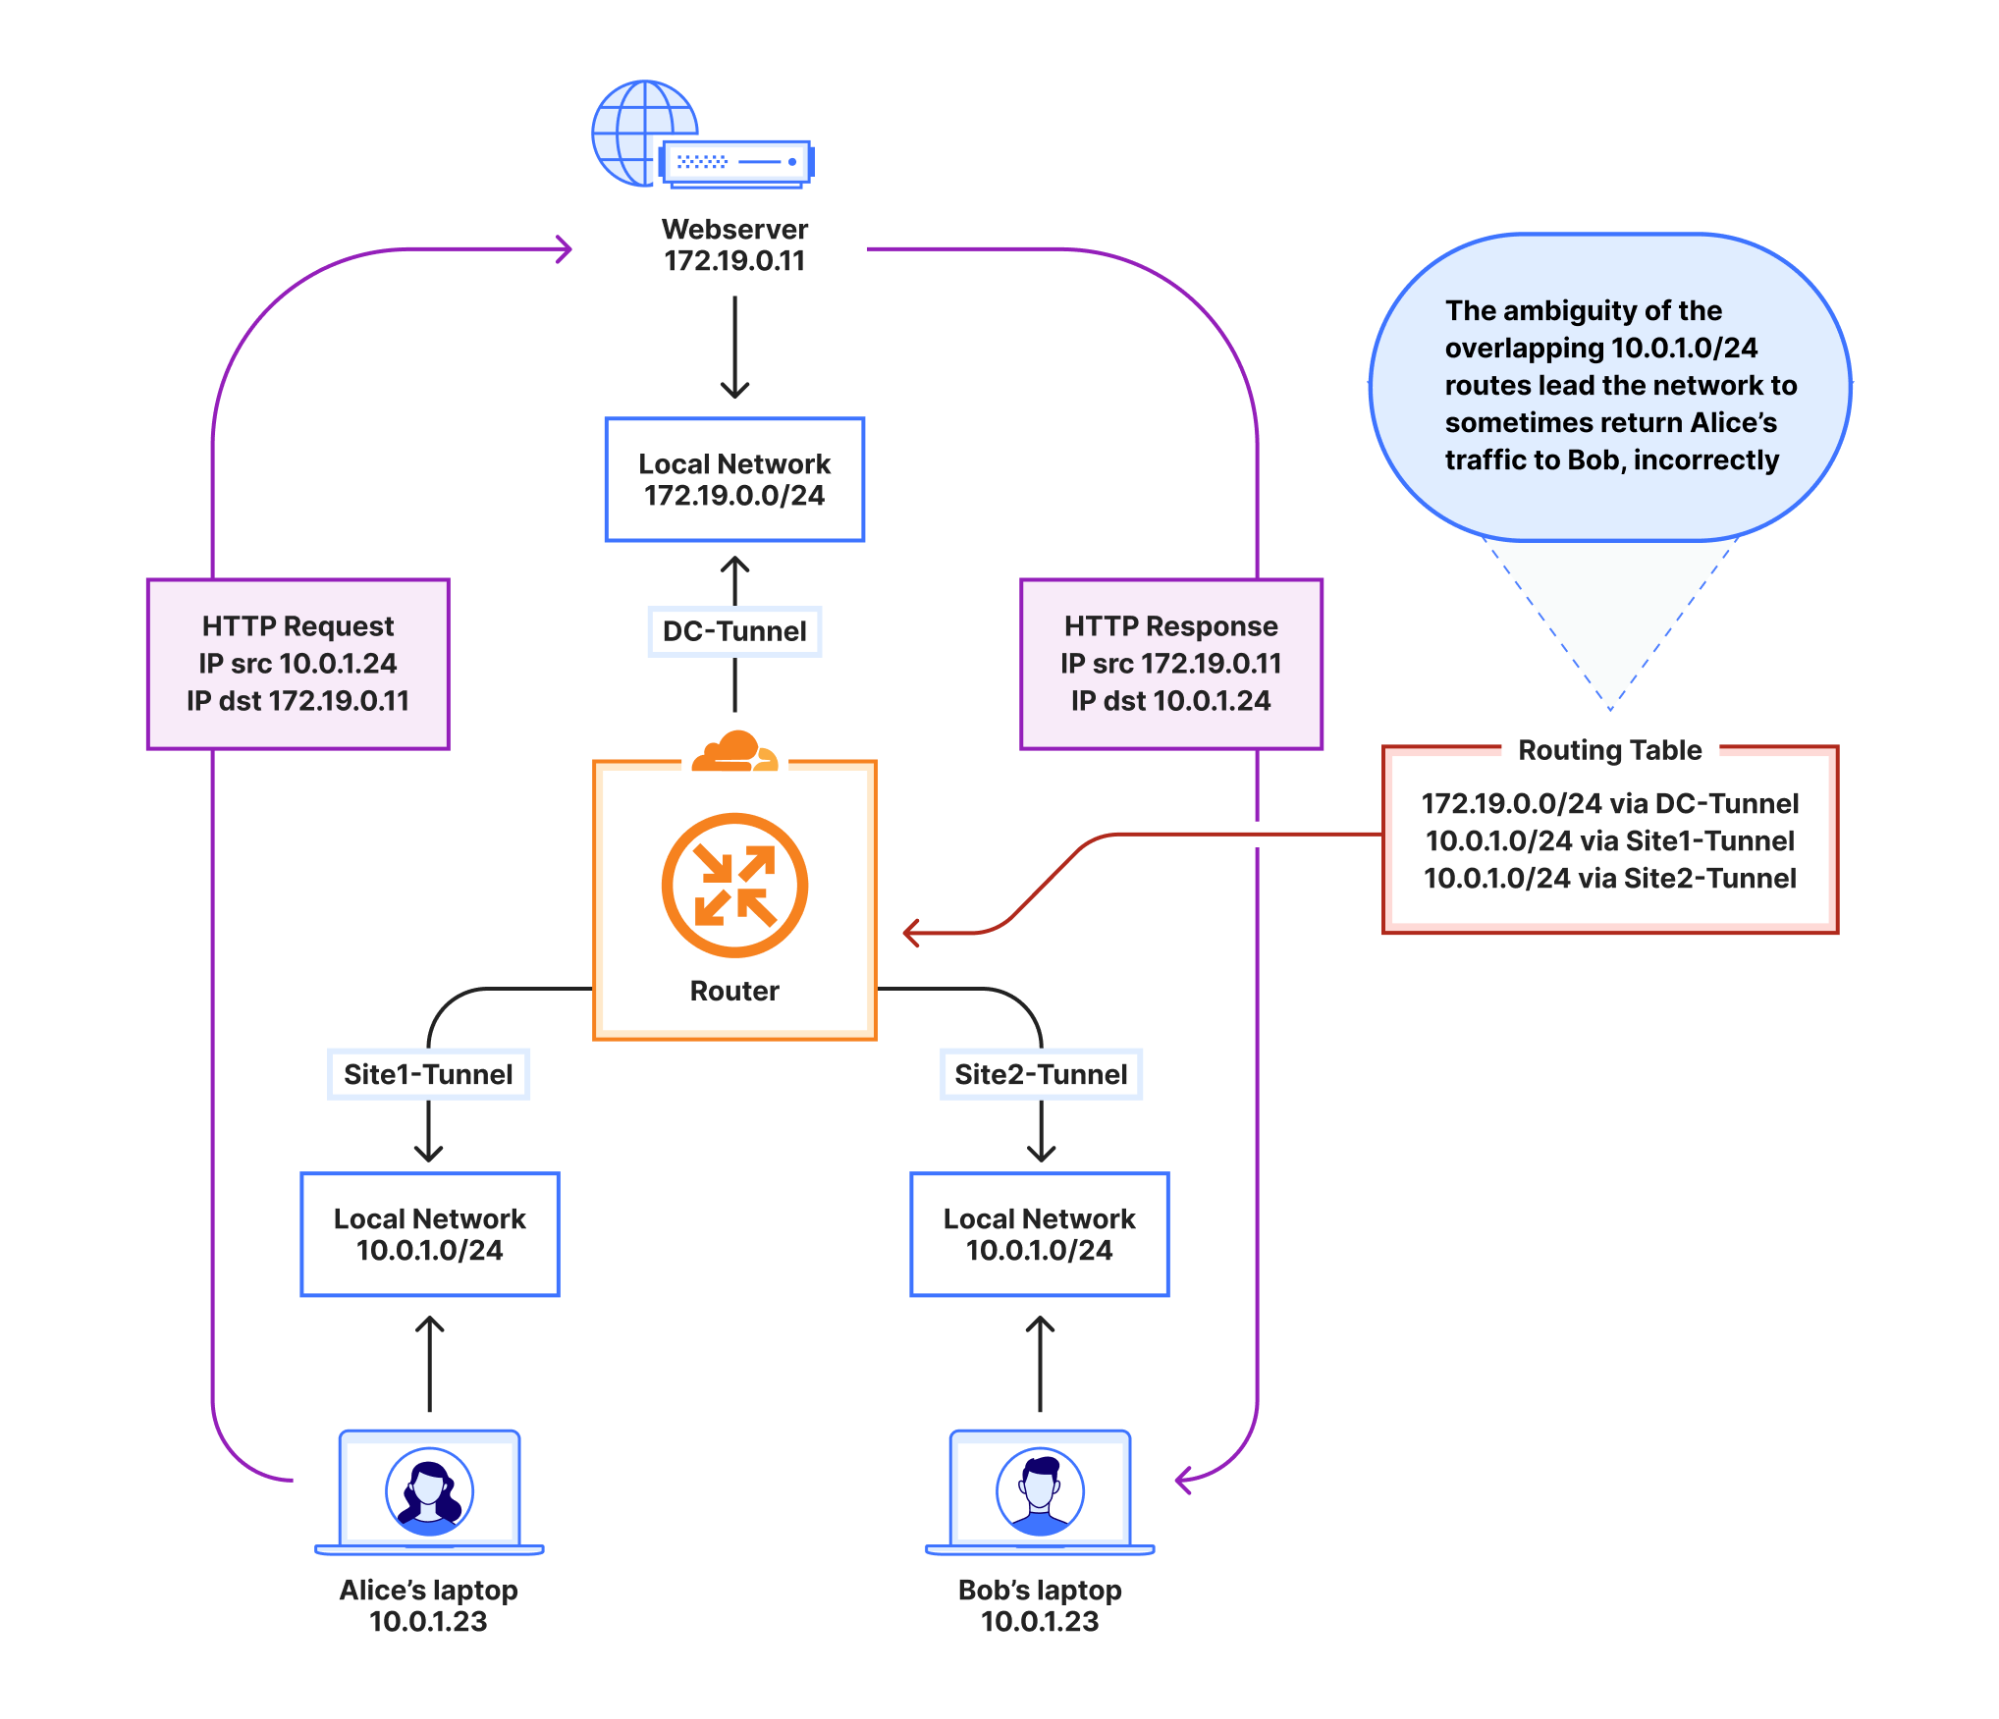
This diagram shows two branches (Site A and Site B) both using 10.0.1.0/24. They send packets to Cloudflare. The return packet from the Internet reaches the Cloudflare edge, and this return traffic is sometimes sent to the wrong site because the routing table has two identical egress options.
There are numerous ways to resolve this ambiguity, and we are committed to solving them in the easiest way for our customers to manage. The traditional “industry standard” fixes are functional, but they introduce significant administrative overhead and complexity that we are committed to eliminating:
-
Virtual Routing and Forwarding (VRF): This involves creating “virtual” routing tables to keep traffic isolated. While effective for separation, it adds administrative overhead. Managing cross-VRF communication (route leaking) is brittle and complex at scale.
-
Network Address Translation (NAT): You can NAT each overlapping subnet from an unmanaged IP space to a managed IP range that is unique in your network. This approach works well, but the mapping is administrative toil for each new site or partner.
Typically, the use case we hear from customers is an overlapping network needing to access the Internet or a private data center. How do we solve this without administrative overhead?
We developed ARR as a “zero-touch” solution to this problem. ARR moves the intelligence from the routing table to stateful tracking.
So what is stateful tracking?
In traditional networking, a router is “forgetful” (aka “stateless”). It treats every single packet like a total stranger. Even if it just saw a packet from the exact same source going to the exact same destination a millisecond ago, it has to look at its routing table all over again to decide where to send the next one.
With stateful tracking, the system has a memory. It recognizes when a series of packets are all part of the same “flow” (that is, a network conversation between two endpoints), and remembers key information about that flow until it finishes. With ARR, we remember one extra piece of information when initializing the flow: the specific tunnel that initiated it. This allows us to send return traffic back to that same tunnel, without ever consulting a routing table!
Instead of asking the network, “Where does this IP live?” ARR asks, “Where did this specific conversation originate?”
The Logic:
-
Ingress: A packet arrives at the Cloudflare edge from a site via a specific connection, i.e. an IPsec tunnel, GRE tunnel, or Network Interconnect.
-
Flow Matching: The Cloudflare Virtual Network first checks (by header inspection) whether that packet matches an existing flow.
-
Proxying: If the packet matches, that’s great! All of the decisions about this traffic have already been made and stored in our memory. All we need to do is pass that packet along already-established paths.
-
Flow Setup: If it doesn’t match an existing flow, we decide which parts of the Cloudflare One stack to pass it through (e.g. Gateway, DLP, Firewall), as well as its ultimate destination. We store all of this state in memory. With ARR, this is when we record which tunnel initiated the flow.
-
-
Symmetric Return: When return traffic arrives from the destination, the Cloudflare Virtual Network uses its existing in-memory state to proxy the traffic. Crucially, it does this without needing to examine the traffic’s destination IP, which could very well be reused across different sites. This completely bypasses the need to consult a routing table. We see the originating tunnel in the flow state and deliver the packet directly back to it.
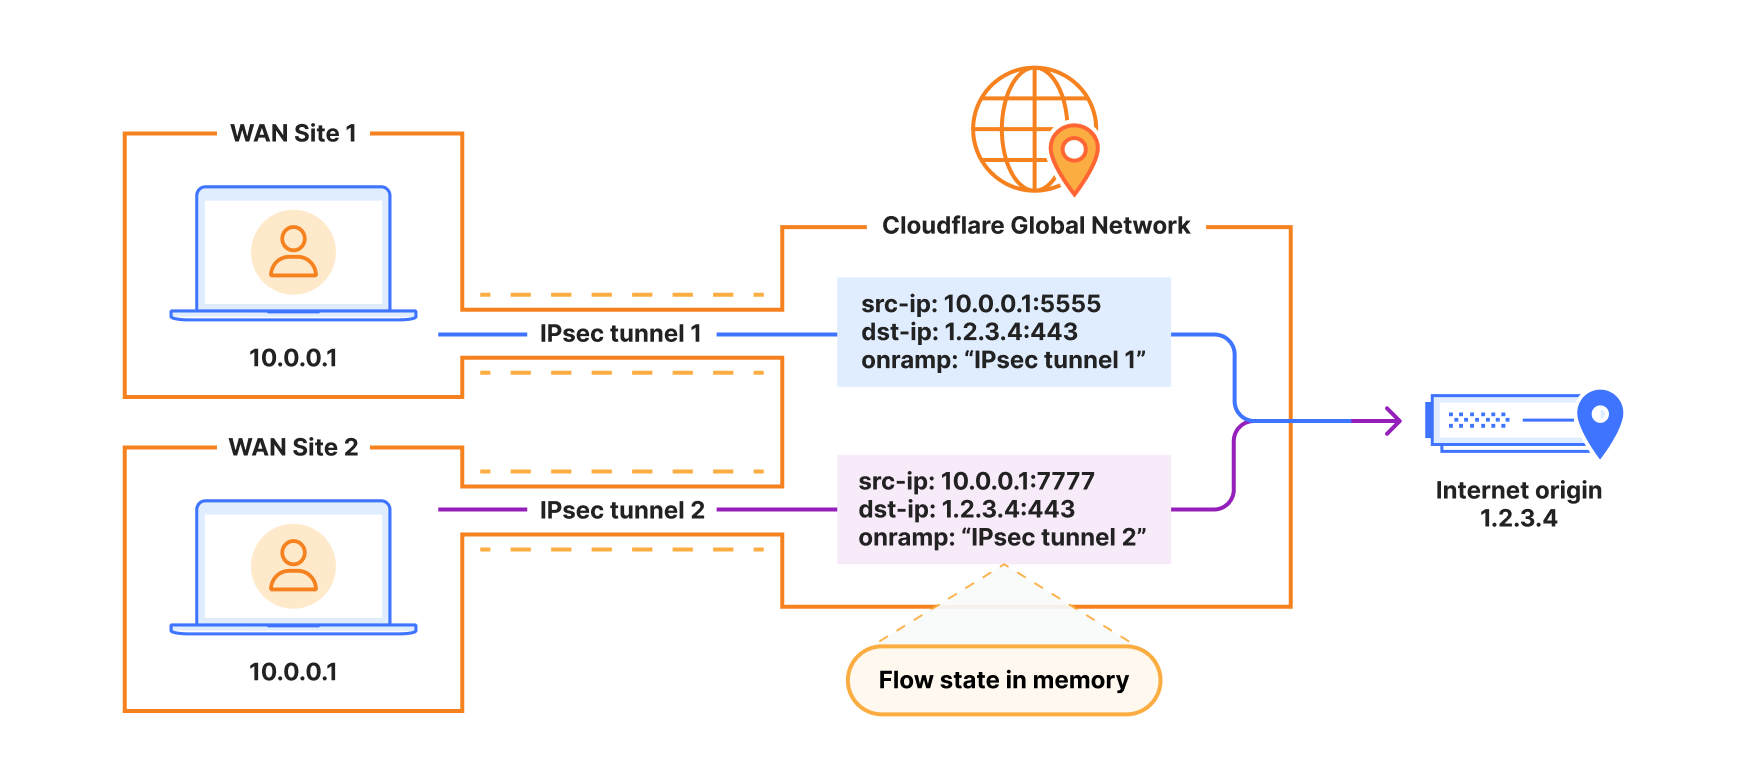
Example of overlapping source IPs tracked by in-memory flow state, tagged with source onramp to inform return routing decision.
By remembering the originating tunnel for every flow, ARR facilitates zero-touch routing. If your site traffic is only client-to-Internet, there is no need to configure return routes at all, reducing toil when deploying new branch sites or “Coffee Shop Networking.”
To make ARR a reality at Cloudflare scale, we plugged into another initiative we have been working on: Unified Routing.
Historically, Cloudflare Zero Trust (users/proxies) and Cloudflare WAN (network-layer/sites) lived at different levels of the system. Cloudflare WAN relied on kernel primitives (Linux network namespaces, routes, eBPF, etc). Zero Trust lived in userspace, where proxies could perform deep inspection and application-level security. This “split-brain” approach often required complex logic to move traffic between component services, and some of this complexity became product limitations that customers might notice.

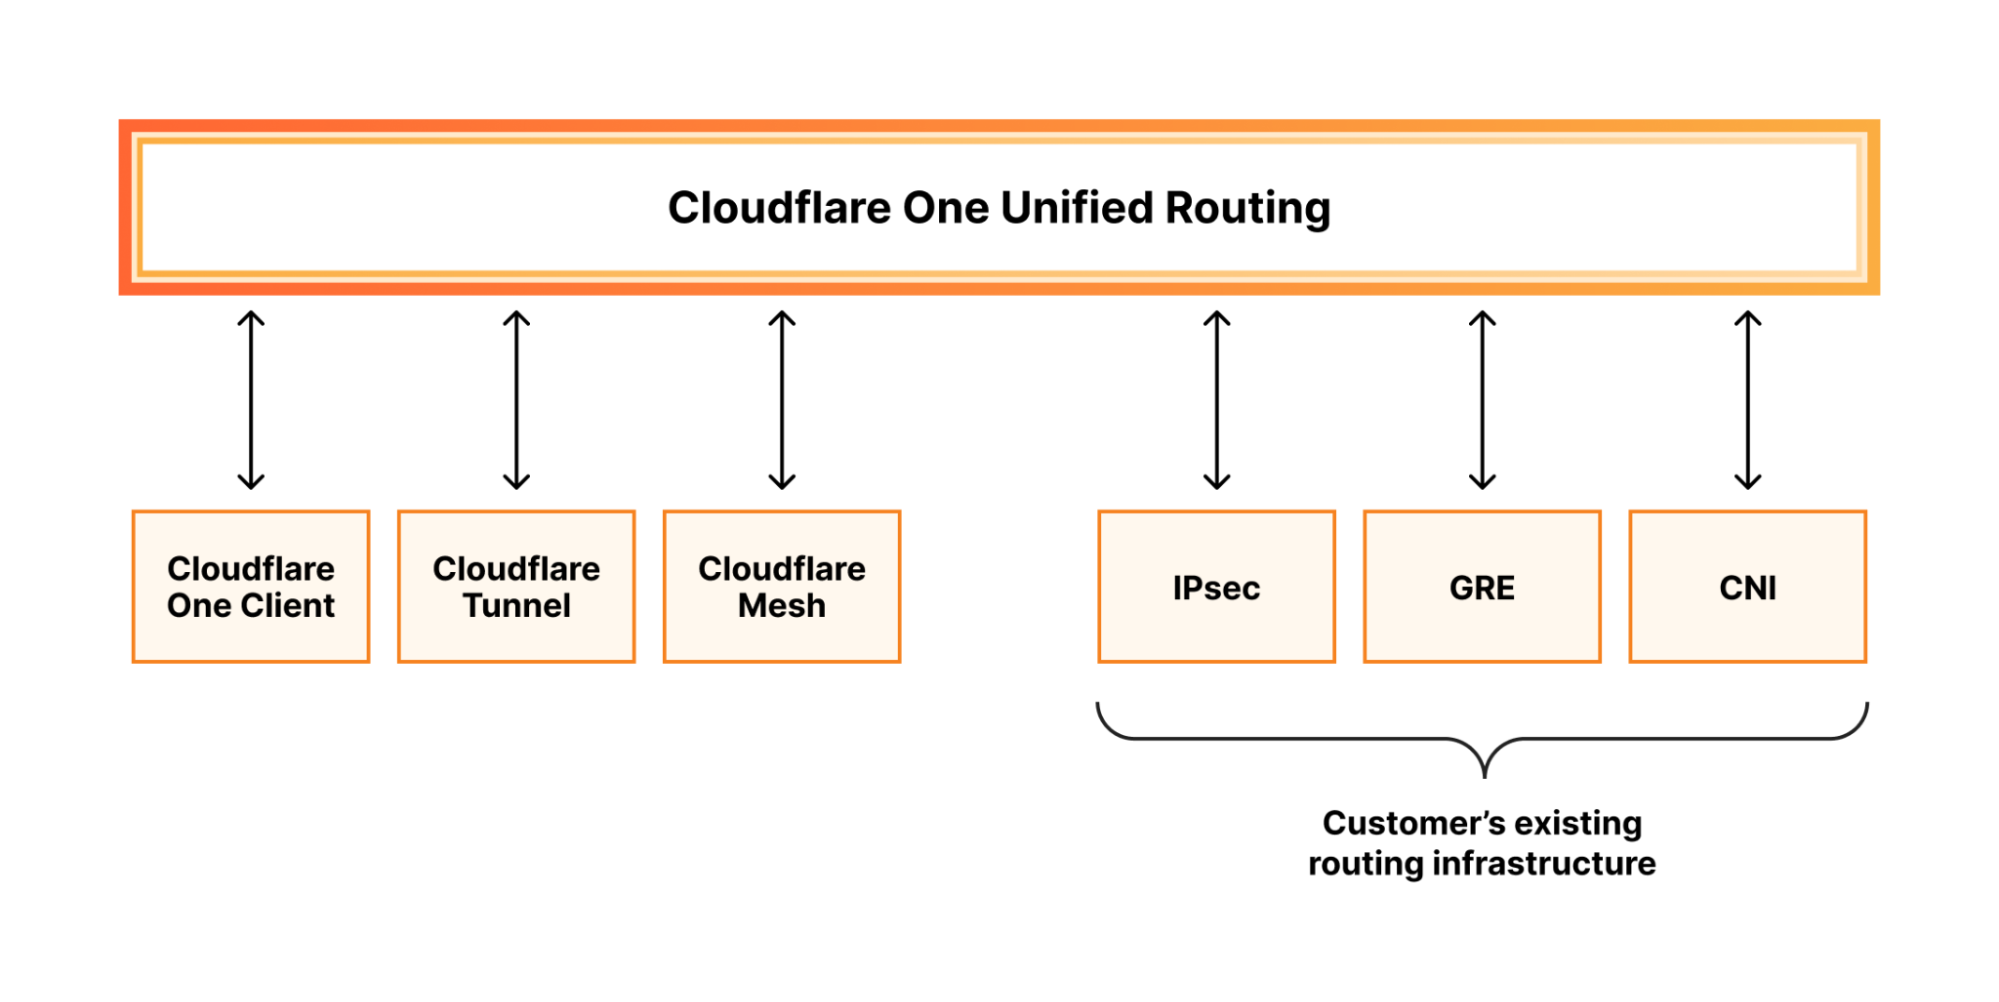
With our new Unified Routing mode, we have moved the initial routing decision from our network-layer data plane into our existing Zero Trust userspace routing logic, the same hardened software used by Cloudflare One Clients and Cloudflare Tunnel in our Zero Trust solution. This change has many benefits to how we enable our customers to use their private networks with products across the Cloudflare platform, as it fixes long-standing interoperability problems between Cloudflare WAN and Zero Trust. Unified Routing means you can use Cloudflare Mesh, Cloudflare Tunnel, and IPsec/GRE on-ramps together in the same account without a single conflict.

In September 2025, we deployed Unified Routing mode internally for all Cloudflare employees and sites. We saw immediate 3-5x performance improvements for Cloudflare One Clients, as you can see in the graph above.
When designing ARR, we knew that we needed to move away from kernel-based routing and build on our new Unified Routing framework.
When Unified Routing is enabled, all Cloudflare WAN traffic flows through Apollo, our Zero Trust hub. Unlike the Linux kernel’s standard routing table, our userspace data plane is fully programmable. We can attach metadata, like the originating Tunnel ID, directly to a flow entry in Apollo.
Each packet is tracked by flow from the moment it hits our edge, and we no longer need to make independent, per-packet routing decisions. Instead, we can make consistent, session-aware decisions for the lifetime of the flow.
ARR is straightforward to enable on a per tunnel or interconnect basis:
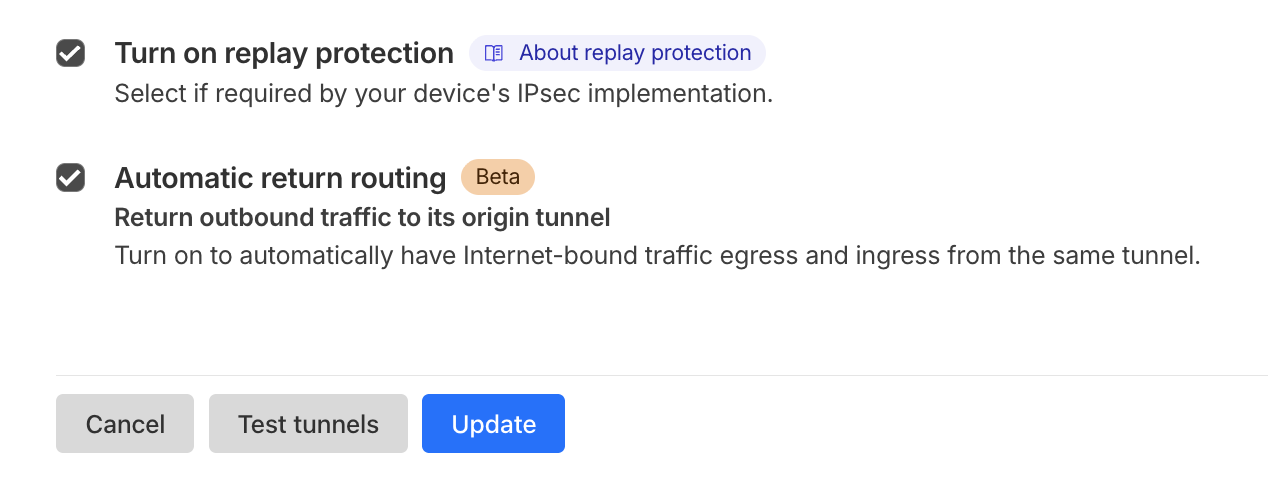
Once enabled for a tunnel or interconnect, any traffic that matches an existing flow is routed back to the connection where it originated, without consulting the routing table.
For the enterprise architect, ARR is a tool to bypass the persistent friction of IP address conflicts. Whether integrating an acquisition or onboarding a partner, the goal is to make the network invisible, so you can focus on the applications, not the plumbing.
Today, ARR is in closed beta and supports overlapping IP addresses accessing the Internet via our Secure Web Gateway. We are already extending this to support private data center access, adding mid-flow failover (pinning the flow to a primary onramp, and seamlessly detecting when that flow fails over to a backup onramp), and further investing in the architectural capabilities needed to make IP overlap a non-issue for even the most complex global deployments.
Not using Cloudflare One yet? Start now with our Free and Pay-as-you-go plans to protect and connect your users and networks, and contact us for comprehensive private WAN connectivity via IPsec and private interconnect.
[$] LWN.net Weekly Edition for March 5, 2026
Post Syndicated from jzb original https://lwn.net/Articles/1060392/
Inside this week’s LWN.net Weekly Edition:
- Front: Python’s bitwise-inversion operator; atomic buffered I/O; keeping open source open; Magit and Majutsu; IIIF; free software and free tools.
- Briefs: Ad tracking; firmware updates; TCP zero-copy; Motorola GrapheneOS phones; Gram 1.0; groff 1.24.0; Texinfo 7.3; Quotes; …
- Announcements: Newsletters, conferences, security updates, patches, and more.
2025 ISO and CSA STAR certificates are now available with one additional service and one new region
Post Syndicated from Chinmaee Parulekar original https://aws.amazon.com/blogs/security/2025-iso-and-csa-star-certificates-are-now-available-with-one-additional-service-and-one-new-region/
Amazon Web Services (AWS) successfully completed the annual recertification audit with no findings for ISO 9001:2015, 27001:2022, 27017:2015, 27018:2019, 27701:2019, 20000-1:2018, 22301:2019, and Cloud Security Alliance (CSA) STAR Cloud Controls Matrix (CCM) v4.0. The objective of the audit was to enable AWS to expand their ISO and CSA STAR certifications to include one new AWS Region and one new AWS service to the scope. The ISO standards cover areas including quality management, information security, cloud security, privacy protection, service management, and business continuity. The certifications demonstrate the commitment of AWS to maintaining robust security controls and protecting customer data across our services.
As part of this recertification audit, one new Region [Asia Pacific (Taipei)] and one new service (AWS Deadline Cloud) were added into the scope since the last certification issued November 25, 2025.
For a full list of AWS services that are certified under ISO and CSA Star, see the AWS
ISO and CSA STAR Certified page.
Customers can also access the certifications in the AWS Management Console through AWS Artifact.
If you have feedback about this post, submit comments in the Comments section below.
Uncached I/O in Prometheus
Post Syndicated from Ayoub Mrini (@machine424) original https://prometheus.io/blog/2026/03/05/uncached-io/
Do you find yourself constantly looking up the difference between container_memory_usage_bytes, container_memory_working_set_bytes, and container_memory_rss? Pick the wrong one and your memory limits lie to you, your benchmarks mislead you, and your container gets OOMKilled.
You’re not alone. There is even a 9-year-old Kubernetes issue that captures the frustration of users.
The explanation is simple: RAM is not used in just one way. One of the easiest things to miss is the page cache semantics. For some containers, memory taken by page caching can make up most of the reported usage, even though that memory is largely reclaimable, creating surprising differences between those metrics.
NOTE: The feature discussed here currently only supports Linux.
Prometheus writes a lot of data to disk. It is, after all, a database. But not every write benefits from sitting in the page cache. Compaction writes are the clearest example: once a block is written, only a fraction of that data is likely to be queried again soon, and since there is no way to predict which fraction, caching it all offers little return. The use-uncached-io feature flag was built to address exactly this.
Bypassing the cache for those writes reduces Prometheus’s page cache footprint, making its memory usage more predictable and easier to reason about. It also relieves pressure on that shared cache, lowering the risk of evicting hot data that queries and other reads actually depend on. A potential bonus is reduced CPU overhead from cache allocations and evictions. The hard constraint throughout was to avoid any measurable regression in CPU or disk I/O.
The flag was introduced in Prometheus v3.5.0 and currently only supports Linux. Under the hood, it uses direct I/O, which requires proper filesystem support and a kernel v2.4.10 or newer, though you should be fine, as that version shipped nearly 25 years ago.
If direct I/O helps here, why was it not done earlier, and why is it not used everywhere it would help? Because direct I/O comes with strict alignment requirements. Unlike buffered I/O, you cannot simply write any chunk of memory to any position in a file. The file offset, the memory buffer address, and the transfer size must all be aligned to the logical sector size of the underlying storage device, typically 512 or 4096 bytes.
To satisfy those constraints, a bufio.Writer-like writer, directIOWriter, was implemented. On Linux kernels v6.1 or newer, Prometheus retrieves the exact alignment values via statx; on older kernels, conservative defaults are used.
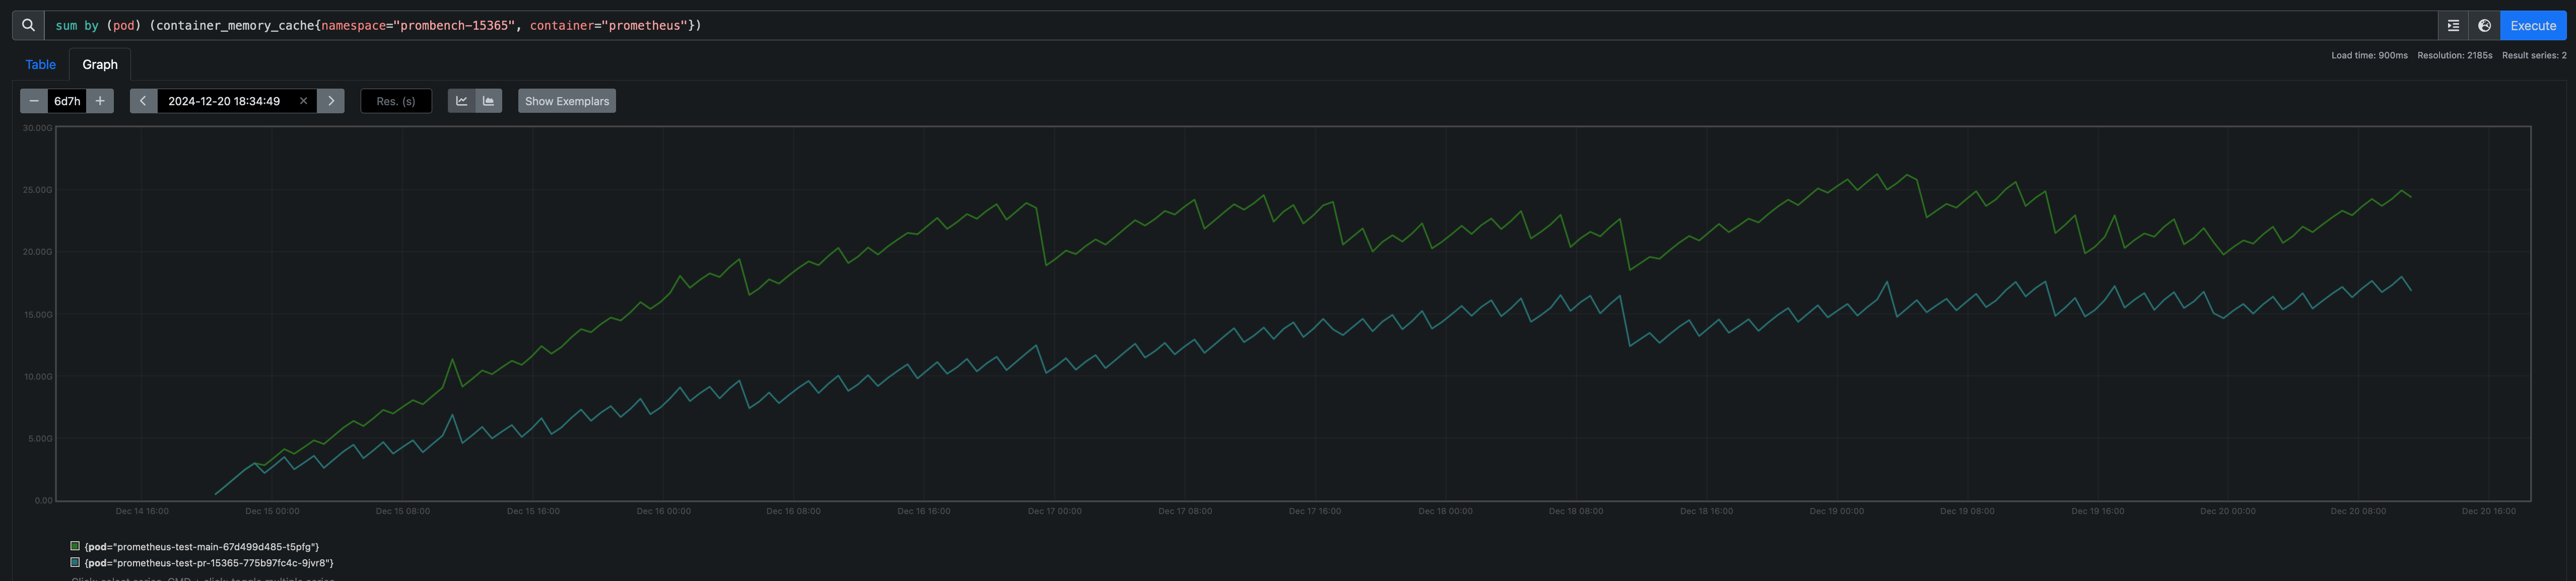
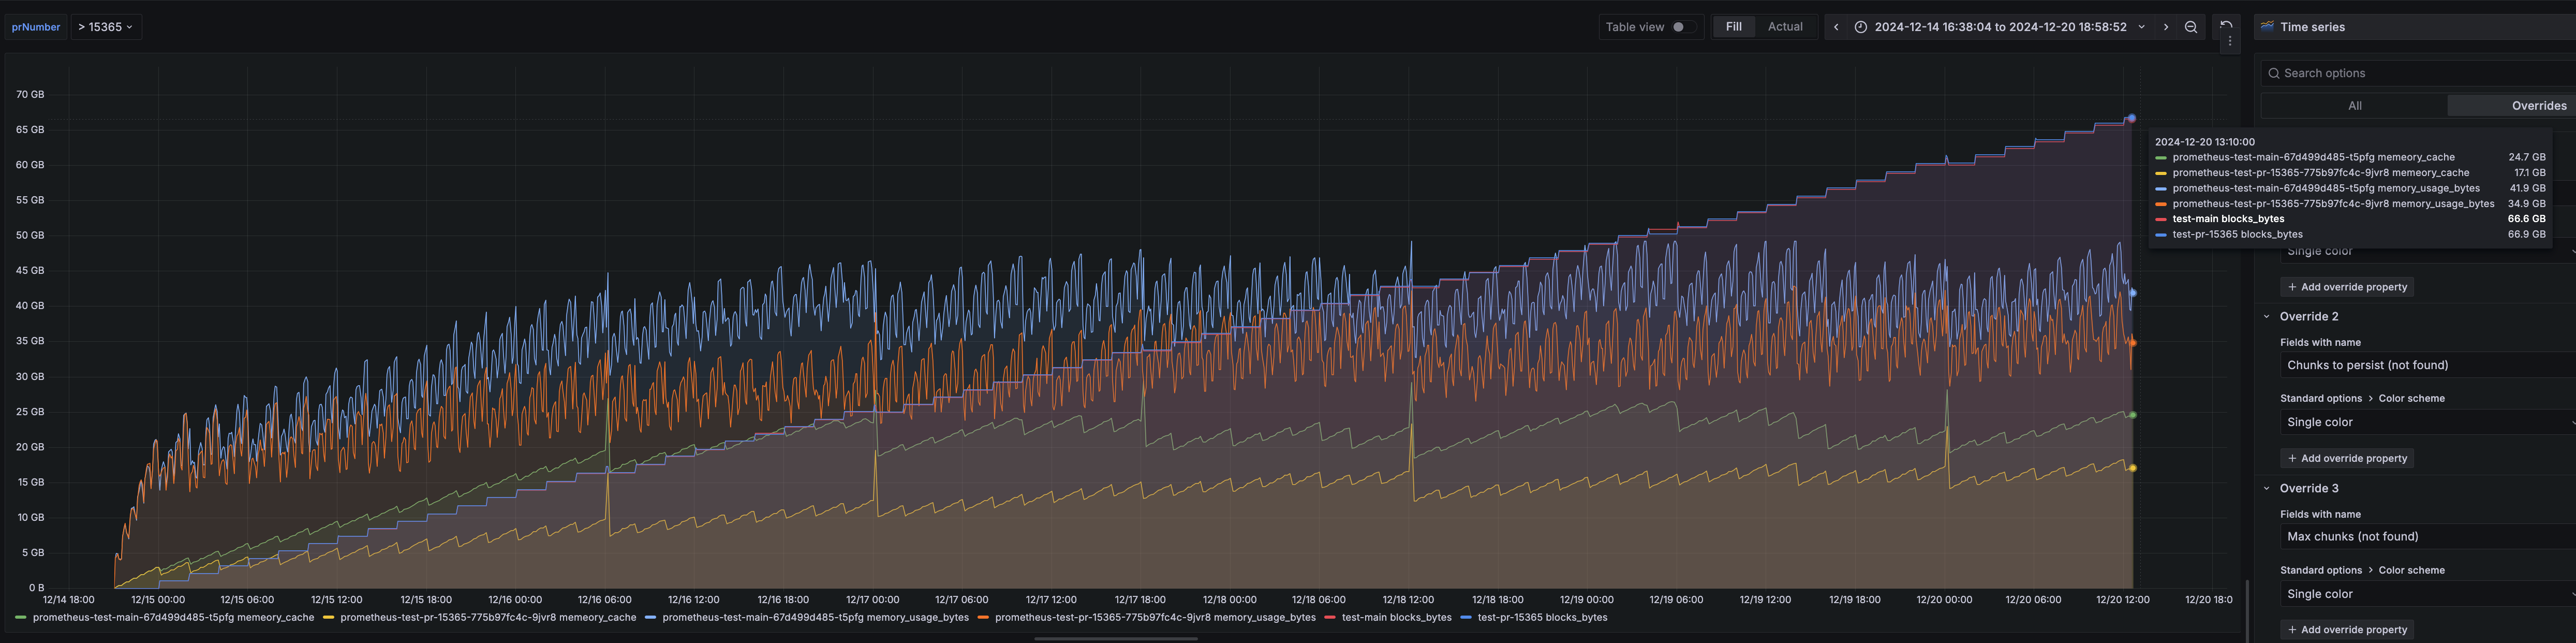
The directIOWriter currently covers chunk writes during compaction only, but that alone accounts for a substantial portion of Prometheus’s I/O. The results are tangible: benchmarks show a 20–50% reduction in page cache usage, as measured by container_memory_cache.
The work is not done yet, and contributions are welcome. Here are a few areas that could help move the feature closer to General Availability:
Covering more write paths
Direct I/O is currently limited to chunk writes during compaction. Index files and WAL writes are natural next candidates, although they would require some additional work.
Building more confidence around directIOWriter
All existing TSDB tests can be run against the directIOWriter using a dedicated build tag: go test --tags=forcedirectio ./tsdb/. More tests covering edge cases for the writer itself would be welcome, and there is even an idea of formally verifying that it never violates alignment requirements.
Experimenting with RWF_DONTCACHE
Introduced in Linux kernel v6.14, RWF_DONTCACHE enables uncached buffered I/O, where data still goes through the page cache but the corresponding pages are dropped afterwards. It would be worth benchmarking whether this delivers similar benefits without direct I/O’s alignment constraints.
Support beyond Linux
Support is currently Linux-only. Contributions to extend it to other operating systems are welcome.
For more details, see the proposal and the PR that introduced the feature.
100lb Camera Kit – Minimalist? Absolutely Not.
Post Syndicated from Matt Granger original https://www.youtube.com/watch?v=DEIhUJm_XMU
The David Frum Show: How Rebuilding Iran Could Create Openings For America’s Adversaries
Post Syndicated from The Atlantic original https://www.youtube.com/shorts/qBRsxz-QIiQ
How Amplitude implemented natural language-powered analytics using Amazon OpenSearch Service as a vector database
Post Syndicated from Jeffrey Wang original https://aws.amazon.com/blogs/big-data/how-amplitude-implemented-natural-language-powered-analytics-using-amazon-opensearch-service-as-a-vector-database/
This is a guest post by Jeffrey Wang, Co-Founder and Chief Architect at Amplitude in partnership with AWS.
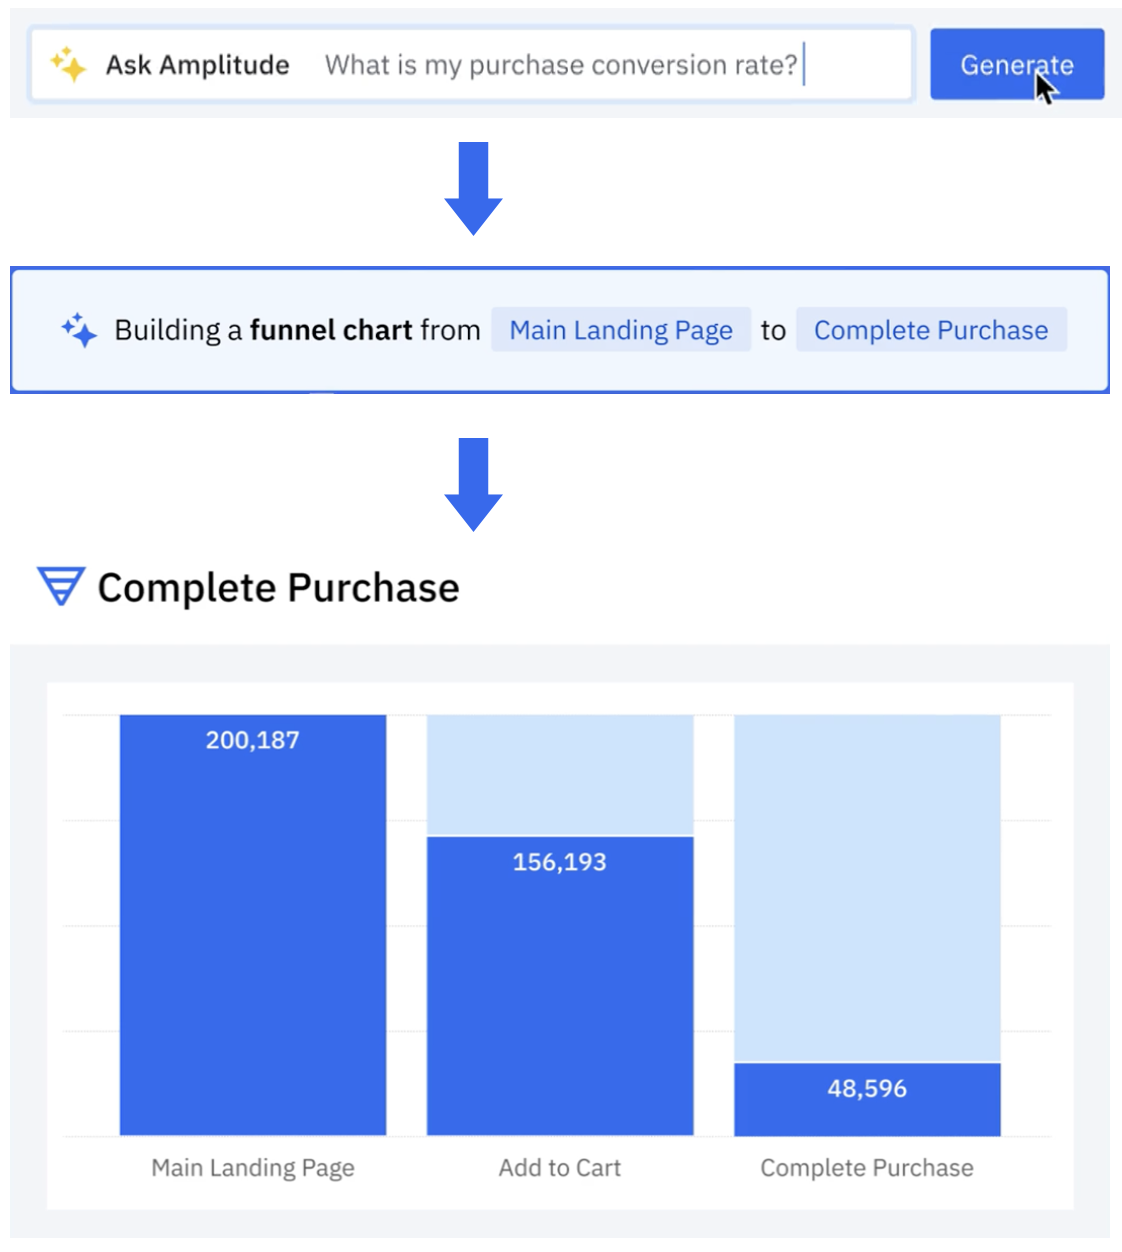
Amplitude is a product and customer journey analytics platform. Our customers wanted to ask deep questions about their product usage. Ask Amplitude is an AI assistant that uses large language models (LLMs). It combines schema search and content search to provide a customized, accurate, low latency, natural language-based visualization experience to end customers. Ask Amplitude has knowledge of a user’s product, taxonomy, and language to frame an analysis. It uses a series of LLM prompts to convert the user’s question into a JSON definition that can be passed to a custom query engine. The query engine then renders a chart with the answer, as illustrated in the following figure.
Amplitude’s search architecture evolved to scale, simplify, and cost-optimize for our customers, by implementing semantic search and Retrieval Augmented Generation (RAG) powered by Amazon OpenSearch Service. In this post, we walk you through Amplitude’s iterative architectural journey and explore how we address several critical challenges in building a scalable semantic search and analytics platform.
Our primary focus was on enabling semantic search capabilities and natural language chart generation at scale, while implementing a cost-effective multi-tenant system with granular access controls. A key objective was optimizing the end-to-end search latency to deliver rapid results. We also tackled the challenge of empowering end customers to securely search and use their existing charts and content for more sophisticated analytical inquiries. Additionally, we developed solutions to handle real-time data synchronization at scale, making sure constant updates to incoming data could be processed while maintaining consistently low search latency across the entire system.
RAG and vector search with Ask Amplitude
Let’s take a brief look at why Ask Amplitude uses RAG. Amplitude collects omnichannel customer data. Our end customers send data on user actions that are performed in their platforms. These actions are recorded as user-generated events. For example, in the case of retail and ecommerce customers, the types of user events include “product search,” “add to cart,” “checked out,” “shipping option,” “purchase,” and more. These events help define the customer’s database schema, outlining the tables, columns, and relationships between them. Let’s consider a user question such as “How many people used 2-day shipping?” The LLM needs to determine which elements of the captured user events are pertinent to formulating an accurate response to the query. When users ask a question to Ask Amplitude, the first step is to filter the relevant events from OpenSearch Service. Rather than feeding all event data to the LLM, we take a more selective approach for both cost and accuracy reasons. Because LLM usage is billed based on token count, sending complete event data would be unnecessarily expensive. More importantly, providing too much context can degrade the LLM’s performance—when faced with thousands of schema elements, the model struggles to reliably identify and focus on the relevant information. This information overload can distract the LLM from the core question, potentially leading to hallucinations or inaccurate responses. This is why RAG is the preferred approach. To retrieve the most relevant items from the product usage schema, a vector search is performed. This is effective even in situations when the question might not refer to the exact words that are in the customer’s schema. The following sections walk through the iterations of Amplitude’s search journey.
Initial solution: No semantic search
We used Amazon Relational Database Service (Amazon RDS) for PostgreSQL as the primary database to store our people, events, and properties data. However, as the following diagram shows, we had a separate, third-party store to implement keyword search. We had to bring in data from PostgreSQL to this third-party search index and keep it updated.
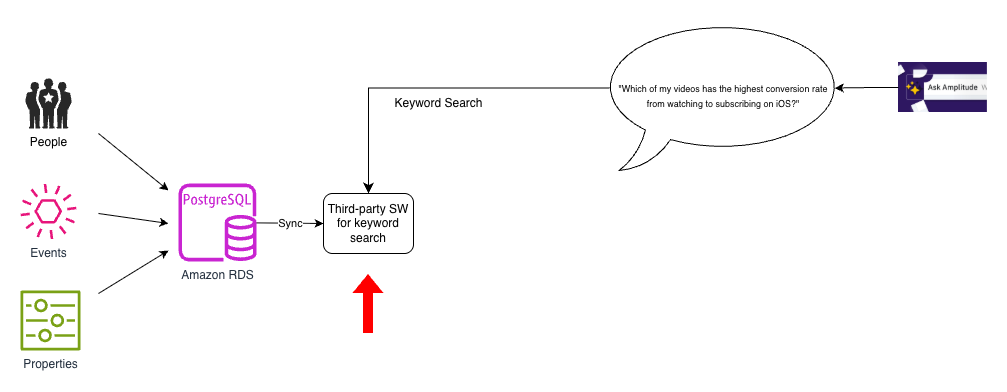
This architecture was simple but had two key shortcomings: there were no natural language capabilities in our search index, and the search index supported only keyword search.
Iteration 1: Brute force cosine similarity
To improve our search capability, we considered several prototypes. Because data volumes for most customers were not very large, it was quick to build a vector search prototype using PostgreSQL. We transformed user interaction data into vector embeddings and used array cosine similarity to compute similarity metrics across the dataset. This alleviated the need for custom similarity computation. The vector embeddings captured nuanced user behavior patterns using PostgreSQL capabilities without additional infrastructure overhead. This is generally called the brute force method, where an incoming query is matched against all embeddings to find its top (K) neighbors by a distance measure (cosine similarity in this case). The following diagram illustrates this architecture.
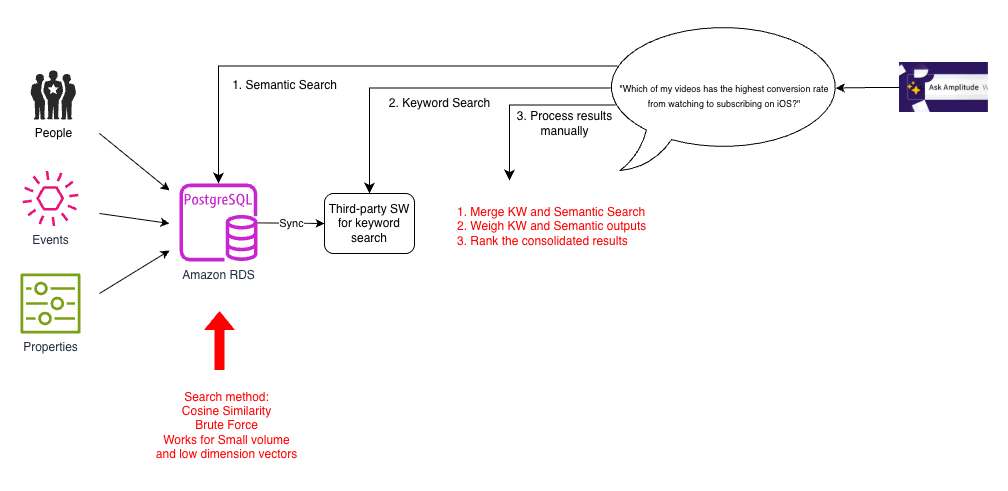
Enabling semantic search was a big improvement over traditional search for users who might use different terms to refer to the same concepts, such as “hours of video streamed” or “total watch time”. However, although this worked for small datasets, it was slow because the brute force method had to compute cosine similarity for all pairs of vectors. This was amplified as the number of elements in the events schema, the complexity of questions, and expectations of quality grew. Additionally, Ask Amplitude answers needed to blend both semantic and keyword search. To support this, each search query had to be implemented as a three-step process involving multiple calls to separate databases:
- Retrieve the semantic search results from PostgreSQL.
- Retrieve the keyword search results from our search index.
- In the application, semantic search results and keyword search results were combined using pre-assigned weights, and this output was dispatched to the Ask Amplitude UI.
This multi-step manual approach made the search process more complex.
Iteration 2: ANN search with pgvector
As Amplitude’s customer base grew, Ask Amplitude needed to scale to accommodate more customers and larger schemas. The goal was not just to answer the question at hand, but to teach the user how to build an end-to-end analysis by guiding them iteratively. To this end, the embeddings needed to store and index contextually rich semantic content. The team experimented with bigger, higher dimensionality embeddings and had anecdotal observations of vector dimensionality appearing to impact the effectiveness of the retrieval. Another requirement was to support multilingual embeddings.
To support a more scalable k-NN search, the team switched to pgvector, a PostgreSQL extension that provides powerful functionalities for with vectors in high-dimensional space. The following diagram illustrates this architecture.
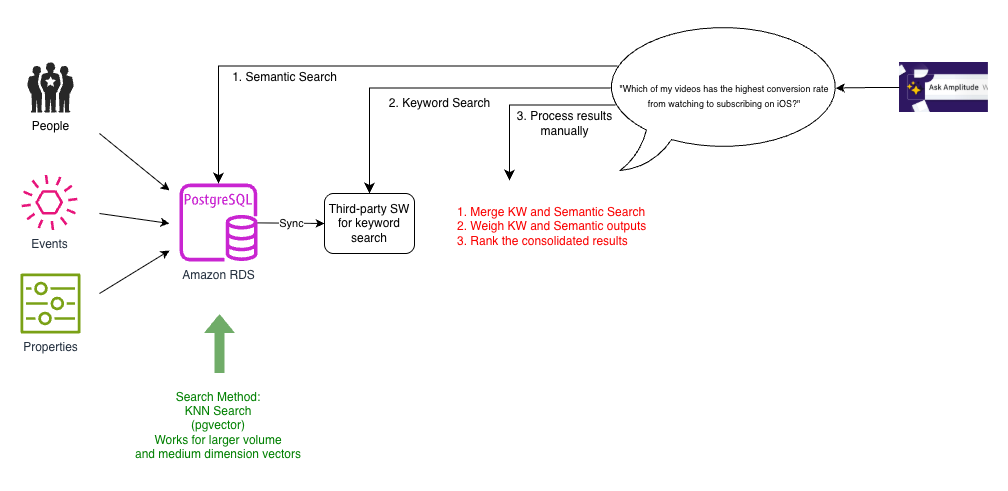
Pgvector was able to support k-nearest neighbor (k-NN) similarity search for larger dimensionality vectors. As the number of vectors grew, we switched to indexes that allowed approximate nearest neighbor (ANN) search, such as HNSW and IVFFlat.
For customers with larger schemas, calculating brute force cosine similarity was slow and expensive. We found a performance difference when we moved to ANN enabled by pgvector. However, we still needed to deal with the complexity introduced by the three-step process of querying PostgreSQL for semantic search, a separate search index for keyword search, and then stitching it all together.
Iteration 3: Dual sync to keyword and semantic search with OpenSearch Service
As the number of customers grew, so did the number of schemas. There were hundreds of millions of schema entries in the database, so we sought a performant, scalable, and cost-effective solution for k-NN search. We explored OpenSearch Service and Pinecone. We chose OpenSearch Service because we could combine keyword and vector search capabilities. This was convenient for four reasons:
- Simpler architecture – Positioning semantic search as a capability in an existing search solution, as we observed in OpenSearch Service, makes for a simpler architecture than treating it as a separate specialized service.
- Lower-latency search – The ability to effectively organize and catalog search data was fundamental to how we generated answers. Augmenting semantic search to our existing pipeline by combining both into one query provided lower latency querying.
- Reduced need for data synchronization – Keeping the database in sync with the search index was critical to the accuracy and quality of answers. With the alternatives that we looked at, we would have to maintain two synchronization pipelines, one for keyword search index and the other for a semantic search index, complicating the architecture and increasing the chances of experiencing out-of-sync results between keyword and semantic search results. Synchronizing them into one place was easier than synchronizing them into multiple places and then combining the signals at query time. With a combined keyword and vector search capabilities of OpenSearch Service, we now needed to synchronize only one primary database on PostgreSQL with the search index.
- Minimized performance impact to source data updates – We found that synchronizing data to another search index is a complex problem because our dataset changes constantly. With every new customer, we had hundreds of updates every second. We had to make sure the latency of these updates wasn’t impacted by the sync process. Collocating search data with vector embeddings obviated the need for multiple sync processes. This helped us avoid additional latency in the primary database, due to the sync processes encroaching upon database update traffic.
Although our previous third-party search engine specialized in fast ecommerce search, this wasn’t aligned with Amplitude’s specific needs. By migrating to OpenSearch Service, we simplified our architecture by reducing two synchronization processes to one. We phased out the current search platform gradually. This meant we temporarily continued to have two synchronization processes, one with current platform and another to the combined keyword and semantic search index on OpenSearch Service, as shown in the following diagram.
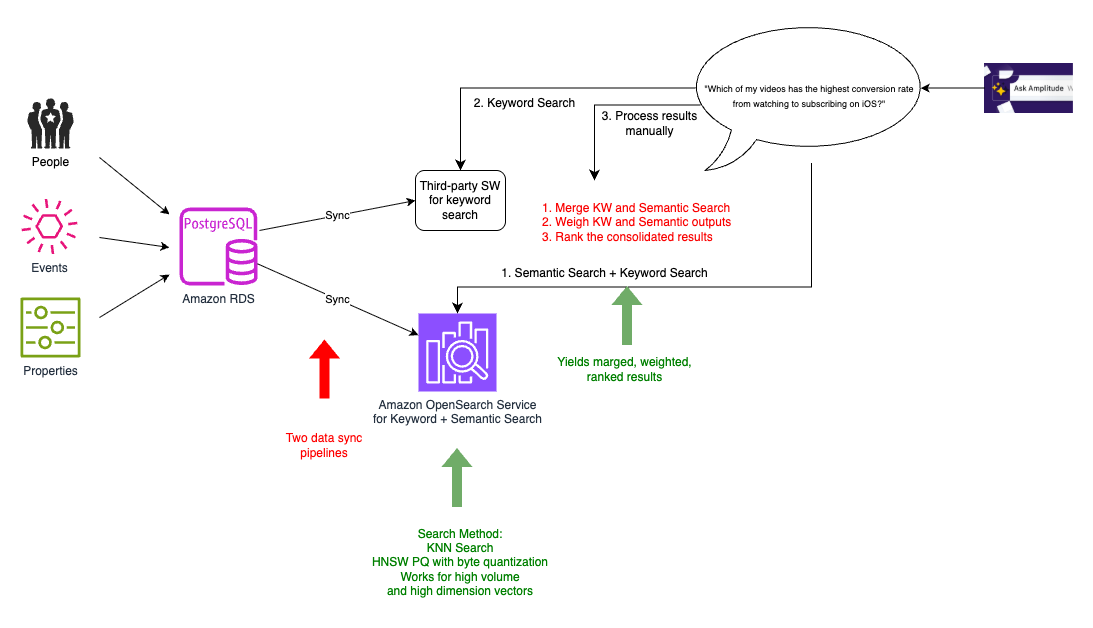
In addition to the pros of k-NN search identified in the previous iteration, moving to OpenSearch Service helped us realize three key benefits:
- Reduced latency – Instead of collocating the embeddings with primary data, we were able to collocate with our search index. The search index is where our application needed to run our queries to pick out user events that are relevant to the question being asked and send this as context sent to the LLM. Because the search text, metadata, and embeddings were all in one place, we needed only one hop for all our search requirements, thereby improving latency.
- Reduced compute power – We had anywhere between 5,000–20,000 elements in the user events schema. We didn’t need to send the entire schema to the LLM, because each user query required only 20–50 relevant elements. With the efficient filtering capabilities of OpenSearch Service, we were able to narrow down the vector search space by using tenant-specific metadata, significantly reducing compute requirements across our multi-tenant environment.
- Improved scalability – With OpenSearch Service, we could take advantage of additional capabilities such as HNSW product quantization (PQ) and byte quantization. Byte quantization made it possible to handle the scale of millions of vector entries with minimal reduction in recall, but with improvement to cost and latency.
However, in this interim solution, our data wasn’t fully migrated to OpenSearch Service yet. We still had the old pipeline along with the new pipeline, and had to perform dual syncing. This was only temporary, as we phased out the old search index, and the old pipeline served as a baseline to compare with in terms of performance and recall.
Iteration 4: Hybrid search with OpenSearch Service
In the final architecture, we were able to migrate all our data to OpenSearch Service, which also served as our vector database, as shown in the following diagram.
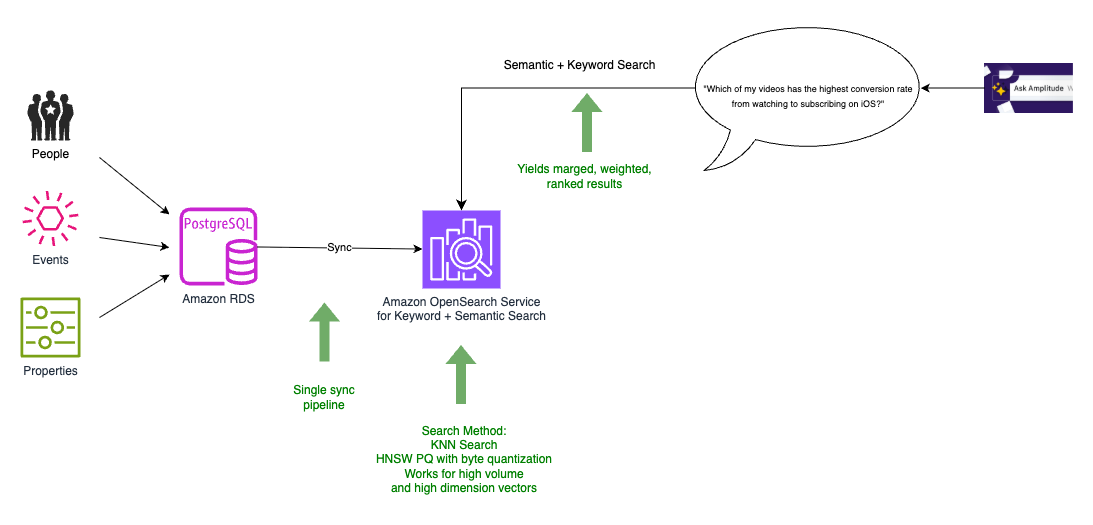
We now had to perform just one data synchronization from the PostgreSQL database to the combined search and vector index, allowing the resources on the database to focus on transactional traffic. OpenSearch Service provides merging, weighting, and ranking of the search results as part of the same query. This obviated the need to implement them as a separate module in our application, effectively resulting in a single, scalable hybrid search (combined keyword-based (lexical) search and vector-based (semantic) search). With OpenSearch Service, we could also experiment with the new integration with Amazon Personalize.
Evolving RAG to draw upon user-generated content
Our customers wanted to ask deeper questions about their product usage that couldn’t be answered just by looking at the schema (the structure and names of the data columns) alone. Simply knowing the column names in a database doesn’t necessarily reveal the meaning, values, or proper interpretation of that data. The schema alone provides an incomplete picture. A naïve approach would be to index and search all data values instead of searching just the schema. Amplitude avoids this for scalability reasons. The cardinality and volume of event data (potentially trillions of event records) makes indexing all values cost prohibitive. Amplitudes hosts about 20 million charts and dashboards across all Amplitude customers. This user-generated content is valuable. We observed that we can better understand the meaning and context by analyzing how other users have previously visualized data.For example, if a user asks about “2-day shipping,” Amplitude first checks if the data schema contains columns with relevant names like “shipping” or “shipping method”. If such columns exist, it then examines the potential values in those columns to find values related to 2-day shipping. Amplitude also searches user-created content (charts, dashboards, and more) to see if anyone else at the company has already visualized data related to 2-day shipping. If so, it can use that existing chart as a reference for how to properly filter and analyze the data to answer the question. To search this content efficiently, Amplitude employs a hybrid approach combining keyword and vector similarity (semantic) searches. For tenant isolation and pruning, we use metadata to filter by customer first, and then vector search.
Conclusion
In this post, we showed you how Amplitude built Ask Amplitude, an AI assistant using OpenSearch Service as a vector database to enable natural language queries of product analytics data. We evolved our system through four iterations, ultimately consolidating keyword and semantic search into OpenSearch Service, which simplified our architecture from multiple sync pipelines to one, reduced query latency by combining search operations, and enabled efficient multi-tenant vector search at scale using features like HNSW PQ and byte quantization. We extended the system beyond schema search to index 20 million user-generated charts and dashboards, using hybrid search to provide richer context for answering customer questions about product usage.
As natural language interfaces become increasingly prevalent, Amplitude’s iterative journey demonstrates the potential for harnessing LLMs and RAG using vector databases such as OpenSearch Service to unlock rich conversational customer experiences. By gradually transitioning to a unified search solution that combines keyword and semantic vector search capabilities, Amplitude overcame scalability and performance challenges while reducing architecture complexity. The final architecture using OpenSearch Service enabled efficient multi-tenancy and fine-grained access control and also facilitated low-latency hybrid search. Amplitude is able to deliver more natural and intuitive analytics capabilities to its customers by generating deeper insights and contextualizing data.
To learn more about how Ask Amplitude helps you express Amplitude-related concepts and questions in natural language, refer to Ask Amplitude. To get started with OpenSearch Service as a vector database, refer to Amazon OpenSearch Service as a Vector Database.
About the authors
Zero-ETL integrations with Amazon OpenSearch Service
Post Syndicated from Omama Khurshid original https://aws.amazon.com/blogs/big-data/zero-etl-integrations-with-amazon-opensearch-service/
Amazon OpenSearch Service is a fully managed service that reduces operational overhead, provides enterprise-grade security, high availability, and scalability, and enables you to quickly deploy real-time search, analytics, and generative AI applications. OpenSearch itself is an open-source, distributed search and analytics suite that supports a wide range of use cases, including real-time monitoring, log analytics, and full-text search. OpenSearch Service offers zero-ETL integrations with other Amazon Web Service (AWS) services, enabling seamless data access and analysis without the need for maintaining complex data pipelines.
Zero-ETL refers to a set of integrations designed to minimize or eliminate the need to build traditional extract, transform, load (ETL) pipelines. Traditional ETL processes can be time-consuming and difficult to develop, maintain, and scale. In contrast, zero-ETL integrations allow direct, point-to-point data movement and can also support querying across data silos without physically moving the data.
In this post, we explore various zero-ETL integrations available with OpenSearch Service that can help you accelerate innovation and improve operational efficiency. We cover following types of integrations, their key features, architecture, benefits, pricing, limitation and some general best practices.
- Log and storage integrations
- Zero-ETL integration with Amazon Simple Storage Service (Amazon S3)
- Zero-ETL integration with Amazon CloudWatch
- Database integrations
- Zero-ETL integration with Amazon DynamoDB
- Integration with Amazon Relational Database Service (RDS) and Amazon Aurora
- Zero-ETL integration with Amazon DocumentDB
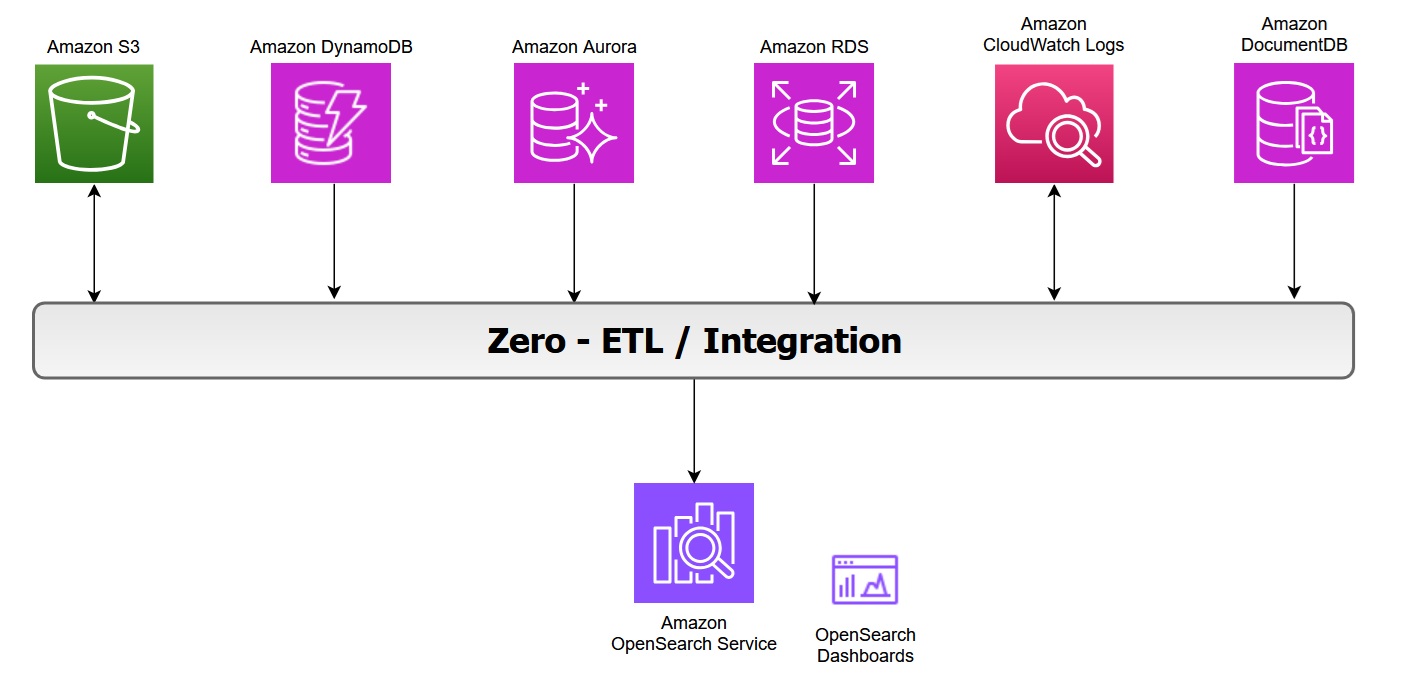
The following diagram illustrates the zero-ETL integration architecture in AWS, showing how various AWS services feed data into OpenSearch Service and its associated dashboards:
Zero-ETL integration with Amazon S3
Amazon OpenSearch Service direct queries with Amazon S3 provides a zero-ETL integration to reduce the operational complexity of duplicating data or managing multiple analytics tools by enabling you to directly query their operational data, reducing costs and time to action.
Key features of this integration include:
- In-place querying: You can use rich analytics capabilities of OpenSearch Service SQL and PPL directly on infrequently-queried data stored outside of OpenSearch Service in Amazon S3.
- Selective data ingestion: You can choose which data to bring into OpenSearch Service for detailed analysis, optimizing costs and speeding up queries with indexes like skipping or covering indexes.
The zero-ETL integration with Amazon S3 supports OpenSearch Service. For more information on architecture and feature see the post Modernize your data observability with Amazon OpenSearch Service zero-ETL integration with Amazon S3.
In log analytics use cases, we categorize operational log data into two types:
- Primary data includes the most recent and frequently accessed logs used for real-time monitoring and analysis.
- Secondary data consists of historical logs that are accessed less frequently but retained for compliance or trend analysis.
You can offload infrequently queried data, such as archival or compliance data, to Amazon S3. With direct query, you can analyze analytics from Amazon S3 without data movement or duplication. However, query performance in OpenSearch Service might slow down when you’re accessing external data sources due to factors like network latency, data transformation, or large data volumes. You can optimize your query performance by using OpenSearch indexes, such as a skipping index, covering index, or materialized view.
While Amazon S3 direct query integration with OpenSearch Service provides on-demand access to data stored in Amazon S3, it is important to remember that OpenSearch’s alerting, monitoring, anomaly detection, and security analytics capabilities can only operate on data that has been explicitly ingested into OpenSearch Service indices. These capabilities would not work with direct query with Amazon S3. However, it will work if the data is indexed with covering or materialized index.
Benefits
With direct queries with Amazon S3, you no longer need to build complex ETL pipelines or incur the expense of duplicating data in both OpenSearch Service and Amazon S3 storage. You also save time and effort by not having to move back and forth between different tools during your analysis.
Pricing
OpenSearch Service separately charges for the compute needed to query your external data in addition to maintaining indexes in OpenSearch Service. Costs for Direct Query is based on the data volume scanned, query execution time, query frequency and frequency with which the indexed data in OpenSearch is kept updated. For more information, see Amazon OpenSearch Service Pricing.
Considerations
In case you are using OpenSearch service to query directly data on Amazon S3, consider the limitations with Direct Query.
Best practices
These are some general and Amazon S3 recommendations for using direct queries in OpenSearch Service. For more information, see Recommendations for using direct queries in Amazon OpenSearch Service.
- Use the
COALESCE SQLfunction to handle missing columns and ensure results are returned. - Use limits on your queries to ensure you aren’t pulling too much data back.
- If you plan to analyze the same dataset many times, create an indexed view to fully ingest and index the data into OpenSearch Service and drop it when you have completed the analysis.
- Drop acceleration jobs and indexes when they’re no longer needed.
- Ingest data into Amazon S3 using partition formats of year, month, day, hour to speed up queries.
- When you build skipping indexes, use Bloom filters for fields with high cardinality and min/max indexes for fields with large value ranges. Bloom filters are a space efficient probabilistic data structure that lets you quickly check whether an item is possibly in a set. For high-cardinality fields, consider using a value-based approach to improve query efficiency.
- Use Index State Management to maintain storage for materialized views and covering indexes.
Zero-ETL integration with Amazon CloudWatch Logs
Amazon CloudWatch Logs serves as a centralized monitoring and storage solution for log files generated across various AWS services. This unified logging service offers a highly scalable platform where all your logging data converges into one manageable system. It provides comprehensive functionality for log management, including real-time viewing, pattern searching, field-based filtering, and secure archival capabilities. By presenting all logs chronologically in a unified stream, CloudWatch Logs eliminates the complexity of managing multiple log sources, transforming diverse logging data into a coherent, time-ordered sequence of events.
The zero-ETL integration between Amazon CloudWatch and Amazon OpenSearch Service enables direct log analysis and visualization while avoiding data redundancy, thereby reducing both technical complexity and costs. You can now leverage two additional query languages alongside the existing CloudWatch Logs Insights QL when using CloudWatch Logs, while as an OpenSearch user, you gain the ability to query CloudWatch logs directly.
Review New Amazon CloudWatch and Amazon OpenSearch Service launch an integrated analytics experience, to explore how the integration works between OpenSearch Service and Amazon CloudWatch Logs.
Benefits
- The enhanced CloudWatch Logs Insights console now incorporates OpenSearch PPL and SQL functionality. Users can perform complex log analysis using SQL JOIN operations and various functions (including JSON, mathematical, datetime, and string operations). The PPL option provides additional data filtering and analysis capabilities.
- The integration offers ready-to-use dashboards for various AWS services like Amazon Virtual Private Cloud (VPC), AWS CloudTrail, and AWS Web Application Firewall (WAF). These pre-configured visualizations enable quick insights into metrics such as flow patterns, top users, data transfer volumes, and temporal analysis, without requiring manual dashboard configuration.
- You can now analyze CloudWatch logs through OpenSearch UI Discover and execute SQL and PPL queries. At the writing of this post, the query execution is limited to 50 log groups.
- The direct access and analysis of CloudWatch data within OpenSearch Service removes the need for traditional ETL processes, eliminates separate data ingestion pipelines and avoids data duplication. This streamlined approach significantly reduces both storage expenses and operational complexity. It delivers a more efficient data management solution that simplifies the entire workflow while maintaining cost-effectiveness.
Pricing
When you use OpenSearch Service direct queries, you incur separate charges for OpenSearch Service and the resource used to process and store your data on Amazon CloudWatch Logs. As you run direct queries, you see charges for OpenSearch Compute Units (OCUs) per hour, listed as DirectQuery OCU usage type on your bill.
- For interactive queries, OpenSearch Service handles each query with a separate pre-warmed job, without maintaining an extended session.
- For indexed view queries, the indexed data is stored in an OpenSearch Serverless collection where you are charged for data indexed (IndexingOCU), data searched (SearchOCU), and data stored in GB.
You can find a pricing example on running an OpenSearch dashboard from either OpenSearch UI or CloudWatch Logs (pricing example n°7).
For more pricing information, see Amazon OpenSearch Service Direct Query pricing.
Considerations
In addition to the OpenSearch Service “direct queries” general limitations, if you are direct querying data in CloudWatch Logs, the following limitations apply:
- The direct query integration with CloudWatch Logs is only available on OpenSearch Service collections and the OpenSearch user interface.
- OpenSearch Serverless collections have networked payload limitations of 100 MiB.
- CloudWatch Logs supports VPC Flow Logs, CloudTrail, and AWS WAF dashboard integrations installed from the console.
Best practices
Besides the general recommendations of OpenSearch Service direct querying, when using OpenSearch Service to direct query data in CloudWatch Logs, the following is recommended:
- Specify the log group names within logGroupIdentifier in logGroups command to query multiple log groups in one query, see Multi-log group functions.
- Enclose certain fields in backticks to successfully query them when using SQL or PPL commands. Backticks are needed for fields with special characters, such as `@SessionToken` or `LogGroup-A` (non-alphabetic and non-numeric). Refer to CloudWatch Logs Recommendations to see an example.
Zero-ETL integration with Amazon DynamoDB
Amazon DynamoDB zero-ETL integration with OpenSearch Service lets you perform a search on your DynamoDB data by automatically replicating and transforming it without custom code or infrastructure. This zero-ETL integration uses Amazon OpenSearch Ingestion to synchronize data between Amazon DynamoDB and OpenSearch Service cluster or OpenSearch Serverless collection within seconds of it being available.
It uses DynamoDB export to Amazon S3 to create an initial snapshot to load into OpenSearch Service. After the snapshot has been loaded, the plugin uses DynamoDB Streams to replicate any further changes in near real time. Turn on point-in-time recovery (PITR) for export and the DynamoDB Streams feature for ongoing replication.
This feature allows you to capture item-level changes in your table and push the changes to a stream. Every item in tables is processed as an event in OpenSearch Ingestion and can be modified with processors. You can also specify index mapping templates within ingestion pipelines to ensure that your Amazon DynamoDB fields are mapped to the correct fields in your OpenSearch indices.
To learn more, see DynamoDB zero-ETL integration with Amazon OpenSearch Service in the AWS documentation.
When configuring zero-ETL between DynamoDB and OpenSearch Service, consider the differences between the data models. You have the following options with data layout:
- Passthrough: Each item in DynamoDB table is directly mapped to one document in OpenSearch Index.
- Routing: A single DynamoDB table mapped to multiple OpenSearch Service indices. In DynamoDB, it is common to store denormalized data in one table to optimize for access patterns. For example, a single DynamoDB table containing both customer profiles and order information can be routed to separate OpenSearch Service indices:
- Customer attributes → ‘customers’ index
- Order attributes → ‘orders’ index
You can achieve this by using the conditional routing feature in the OpenSearch ingestion pipeline.
- Merge: In some use cases, you need to combine data from multiple DynamoDB tables into a single OpenSearch index. You can use AWS Lambda integration with OpenSearch Ingestion to perform lookups on other DynamoDB tables and merge data from multiple DynamoDB tables.
Pricing
There is no additional cost to use this feature apart from the cost of the existing underlying components, including OpenSearch Ingestion charges OpenSearch Compute Units (OCUs) which is used to replicate data between Amazon DynamoDB and OpenSearch Service. Furthermore, this feature uses Amazon DynamoDB Streams for the change data capture (CDC), and you incur the standard costs for Amazon DynamoDB Streams.
Considerations
Consider the following limitations when you set up an OpenSearch Ingestion pipeline for DynamoDB:
- At the writing of this post, the OpenSearch Ingestion integration with DynamoDB doesn’t support cross-Region and cross-account ingestion.
- An OpenSearch Ingestion pipeline supports only one DynamoDB table as its source.
Best practices
For complete information, see Best practices for working with DynamoDB zero-ETL integration and OpenSearch Service
Integration with Amazon Aurora and Amazon RDS
Amazon RDS and Amazon Aurora integration with OpenSearch Service eliminates complex data pipelines and enables near real-time data synchronization between Amazon Aurora and Amazon RDS databases (including RDS for MySQL and RDS for PostgreSQL) with advanced search capabilities on transactional databases. You can use an OpenSearch Ingestion pipeline with Amazon RDS or Amazon Aurora to export existing data and stream changes (such as create, update, and delete) to OpenSearch Service domains and collections. The OpenSearch Ingestion pipeline incorporates change data capture (CDC) infrastructure to provide a high-scale, low-latency way to continuously stream data from Amazon RDS or Amazon Aurora.
This automated process keeps your data consistently up to date in OpenSearch Service, making it readily available for search and analysis purpose. The pipeline ensures data consistency by continuously polling or receiving changes from the Amazon Aurora cluster or Amazon RDS and updating the corresponding documents in the OpenSearch index. OpenSearch Ingestion supports end-to-end acknowledgement to ensure data durability. An OpenSearch Ingestion pipeline also maps incoming event actions into corresponding bulk indexing actions to help ingest documents. This keeps data consistent, so that every data change in Amazon RDS is reconciled with the corresponding document changes in OpenSearch.
For details on the architecture, refer to Integrating Amazon OpenSearch Ingestion with Amazon RDS and Amazon Aurora. To get started, refer to OpenSearch Ingestion pipeline with Amazon RDS or Using an OpenSearch Ingestion pipeline with Amazon Aurora.
Pricing
There is no additional charge for using this feature beyond the cost of your existing underlying resources, such as OpenSearch Service, OpenSearch Ingestion pipelines (OCUs), and Amazon RDS or Amazon Aurora. Additional costs may include storage used for enabling enhanced binlogs for MySQL and WAL logs for PostgreSQL for change data capture. You also incur storage costs for snapshot exports from your database to Amazon S3 used for the initial data.
Considerations
Consider the following limitations when you set up the integration for Amazon RDS or Amazon Aurora:
- Support both Aurora MySQL or RDS for MySQL (8.0 and above) and Aurora PostgreSQL or RDS for PostgreSQL (16 and above).
- Requires same-Region and same-account deployment, primary keys for optimal synchronization, and currently has no data definition language (DDL) statement support.
- The integration only supports one Aurora PostgreSQL database per pipeline.
- The existing pipeline configuration can’t be updated to ingest data from a different database and/or a different table. To update the database and/or table name of a pipeline, stop the pipeline and restart it with an updated configuration or create a new pipeline.
- Ensure that the Amazon Aurora or Amazon RDS cluster has authentication enabled using AWS Secrets Manager, which is the only supported authentication mechanism.
Best practices
The following are some best practices to follow while setting up the integration with OpenSearch Service:
- If a mapping template is not specified in OpenSearch, it automatically assigns field types using dynamic mapping based on the first document received. However, it is always recommended to define field types explicitly by creating a mapping template that suits your requirements.
- To maintain data consistency, the primary and foreign keys of tables remain unchanged.
- You can configure the dead-letter queues (DLQ) in your OpenSearch Ingestion pipeline. If you’ve configured the queue, OpenSearch Service sends all failed documents that can’t be ingested due to dynamic mapping failures to the queue.
- Monitor recommended CloudWatch metrics to measure the performance of your ingestion pipeline.
Zero-ETL integration with Amazon DocumentDB
Amazon Document DB is a fully managed database service built for JSON data management at scale. It offers built-in text and vector search functionalities. By leveraging OpenSearch Service, you can execute search analytics, including features like fuzzy matching, synonym detection, cross-collection queries, and multilingual search capabilities on DocumentDB data.
The zero-ETL integration initiates the process with a full historical data extraction to OpenSearch using an ingestion pipeline. After the initial data load is completed, the pipelines read from Amazon DocumentDB change streams ensuring near real-time data consistency between the two systems. OpenSearch organizes the incoming data into indexes, with flexibility to either consolidate data from a DocumentDB collection into a single index or partition data across multiple indices. The ingestion pipelines synchronize all create, update, and delete operations from the DocumentDB collection, maintaining corresponding document modifications in OpenSearch. This ensures both data systems remain synchronised.
The pipelines offer configurable routing options, allowing data from a single collection to be written to one index or conditionally route to multiple indexes. Users can configure ingestion pipelines to stream data from Amazon DocumentDB to OpenSearch Service through three primary modes namely full load only, streaming change events without initial full load and full load followed by change streams. You can also monitor the state of ingestion pipelines in the OpenSearch service console. Additionally, you can use Amazon Cloudwatch to provide real-time metrics and logs and setting up alerts.
Pricing
There is no additional charge for using this feature apart from the cost of your existing underlying resources, including OpenSearch Service, OpenSearch Ingestion pipelines (OCUs), and Amazon DocumentDB. The integration performs an initial full load of Amazon DocumentDB data and continuously streams ongoing changes to OpenSearch Service using change streams. The change streams feature is disabled by default and does not incur any additional charges until the feature is enabled. Using change streams on a DocumentDB cluster incurs additional read and write input/output (I/O), as well as storage costs.
To learn more on pricing see the DocumentDB pricing page.
Considerations
The following are the limitations for the DocumentDB to OpenSearch Service integration:
- Only one Amazon DocumentDB collection as the source per pipeline is supported.
- Cross-region and cross-account data ingestion is not supported.
- Amazon DocumentDB elastic clusters are not supported, only instance-based clusters are supported.
- AWS Secrets Manager is the only supported authentication mechanism.
- You can’t update an existing pipeline configuration to ingest data from a different database and/or a different collection. To update the database and/or collection name of a pipeline, create a new pipeline.
Best practices
The following are some best practices to follow while setting up the DocumentDB zero-ETL with OpenSearch Service:
- Configure dead-letter queues (DLQ) to handle any failed document ingestion.
- Configure AWS Secrets Manager and enable secrets rotation to provide the pipeline secure access.
- If you’re using change streams in DocumentDB, it’s important to extend the retention period to up to 7 days. This ensures you don’t lose any data changes during the ingestion process.
To get started, see zero-ETL integration of Amazon DocumentDB with OpenSearch Service.
Benefits for Database Integrations
With zero-ETL integrations, you can use the powerful search and analytics features of OpenSearch Service directly on your latest database data. These include full-text search, fuzzy search, auto-complete, and vector search for machine learning (ML) workloads—enabling intelligent, real-time experiences that enhance your applications and improve user satisfaction. This integration uses change streams to automate the synchronisation of transactional data from Amazon Aurora, Amazon RDS, Amazon DynamoDB and Amazon DocumentDB to OpenSearch Service without manual intervention. Once the data is available in OpenSearch Service, you can perform real-time searches to quickly retrieve relevant results for your applications.This eliminates the need for manual Extract-Transform-Load (ETL) processes, reduces operational complexity, and accelerates time-to-insight for real-time dashboards, search, and analytics.
Conclusion
In this post, you learned that zero-ETL integrations represent a significant advancement in simplifying data analytics workflows and reducing operational complexity. As you’ve explored throughout this post, these integrations offer several advantages such as elimination of complex ETL pipelines and reduced infrastructure and operational costs by removing the need for intermediate storage and processing that enhance developer productivity.
It is time to accelerate your analytics journey with OpenSearch Service zero ETL – where your data flows seamlessly, eliminating complex pipelines and delivering real-time insights. Get started with Amazon OpenSearch Service or learn more about integrations with other services and applications in the AWS documentation.
About the authors
Introducing OpenClaw on Amazon Lightsail to run your autonomous private AI agents
Post Syndicated from Channy Yun (윤석찬) original https://aws.amazon.com/blogs/aws/introducing-openclaw-on-amazon-lightsail-to-run-your-autonomous-private-ai-agents/
Today, we’re announcing the general availability of OpenClaw on Amazon Lightsail to launch OpenClaw instance, pairing your browser, enabling AI capabilities, and optionally connecting messaging channels. Your Lightsail OpenClaw instance is pre-configured with Amazon Bedrock as the default AI model provider. Once you complete setup, you can start chatting with your AI assistant immediately — no additional configuration required.
OpenClaw is an open-source self-hosted autonomous private AI agent that acts as a personal digital assistant by running directly on your computer. You can AI agents on OpenClaw through your browser to connect to messaging apps like WhatsApp, Discord, or Telegram to perform tasks such as managing emails, browsing the web, and organizing files, rather than just answering questions.
AWS customers have asked if they can run OpenClaw on AWS. Some of them blogged about running OpenClaw on Amazon EC2 instances. As someone who has experienced installing OpenClaw directly on my home device, I learned that this is not easy and that there are many security considerations.
So, let me introduce how to launch a pre-configured OpenClaw instance on Amazon Lightsail more easily and run it securely.
OpenClaw on Amazon Lightsail in action
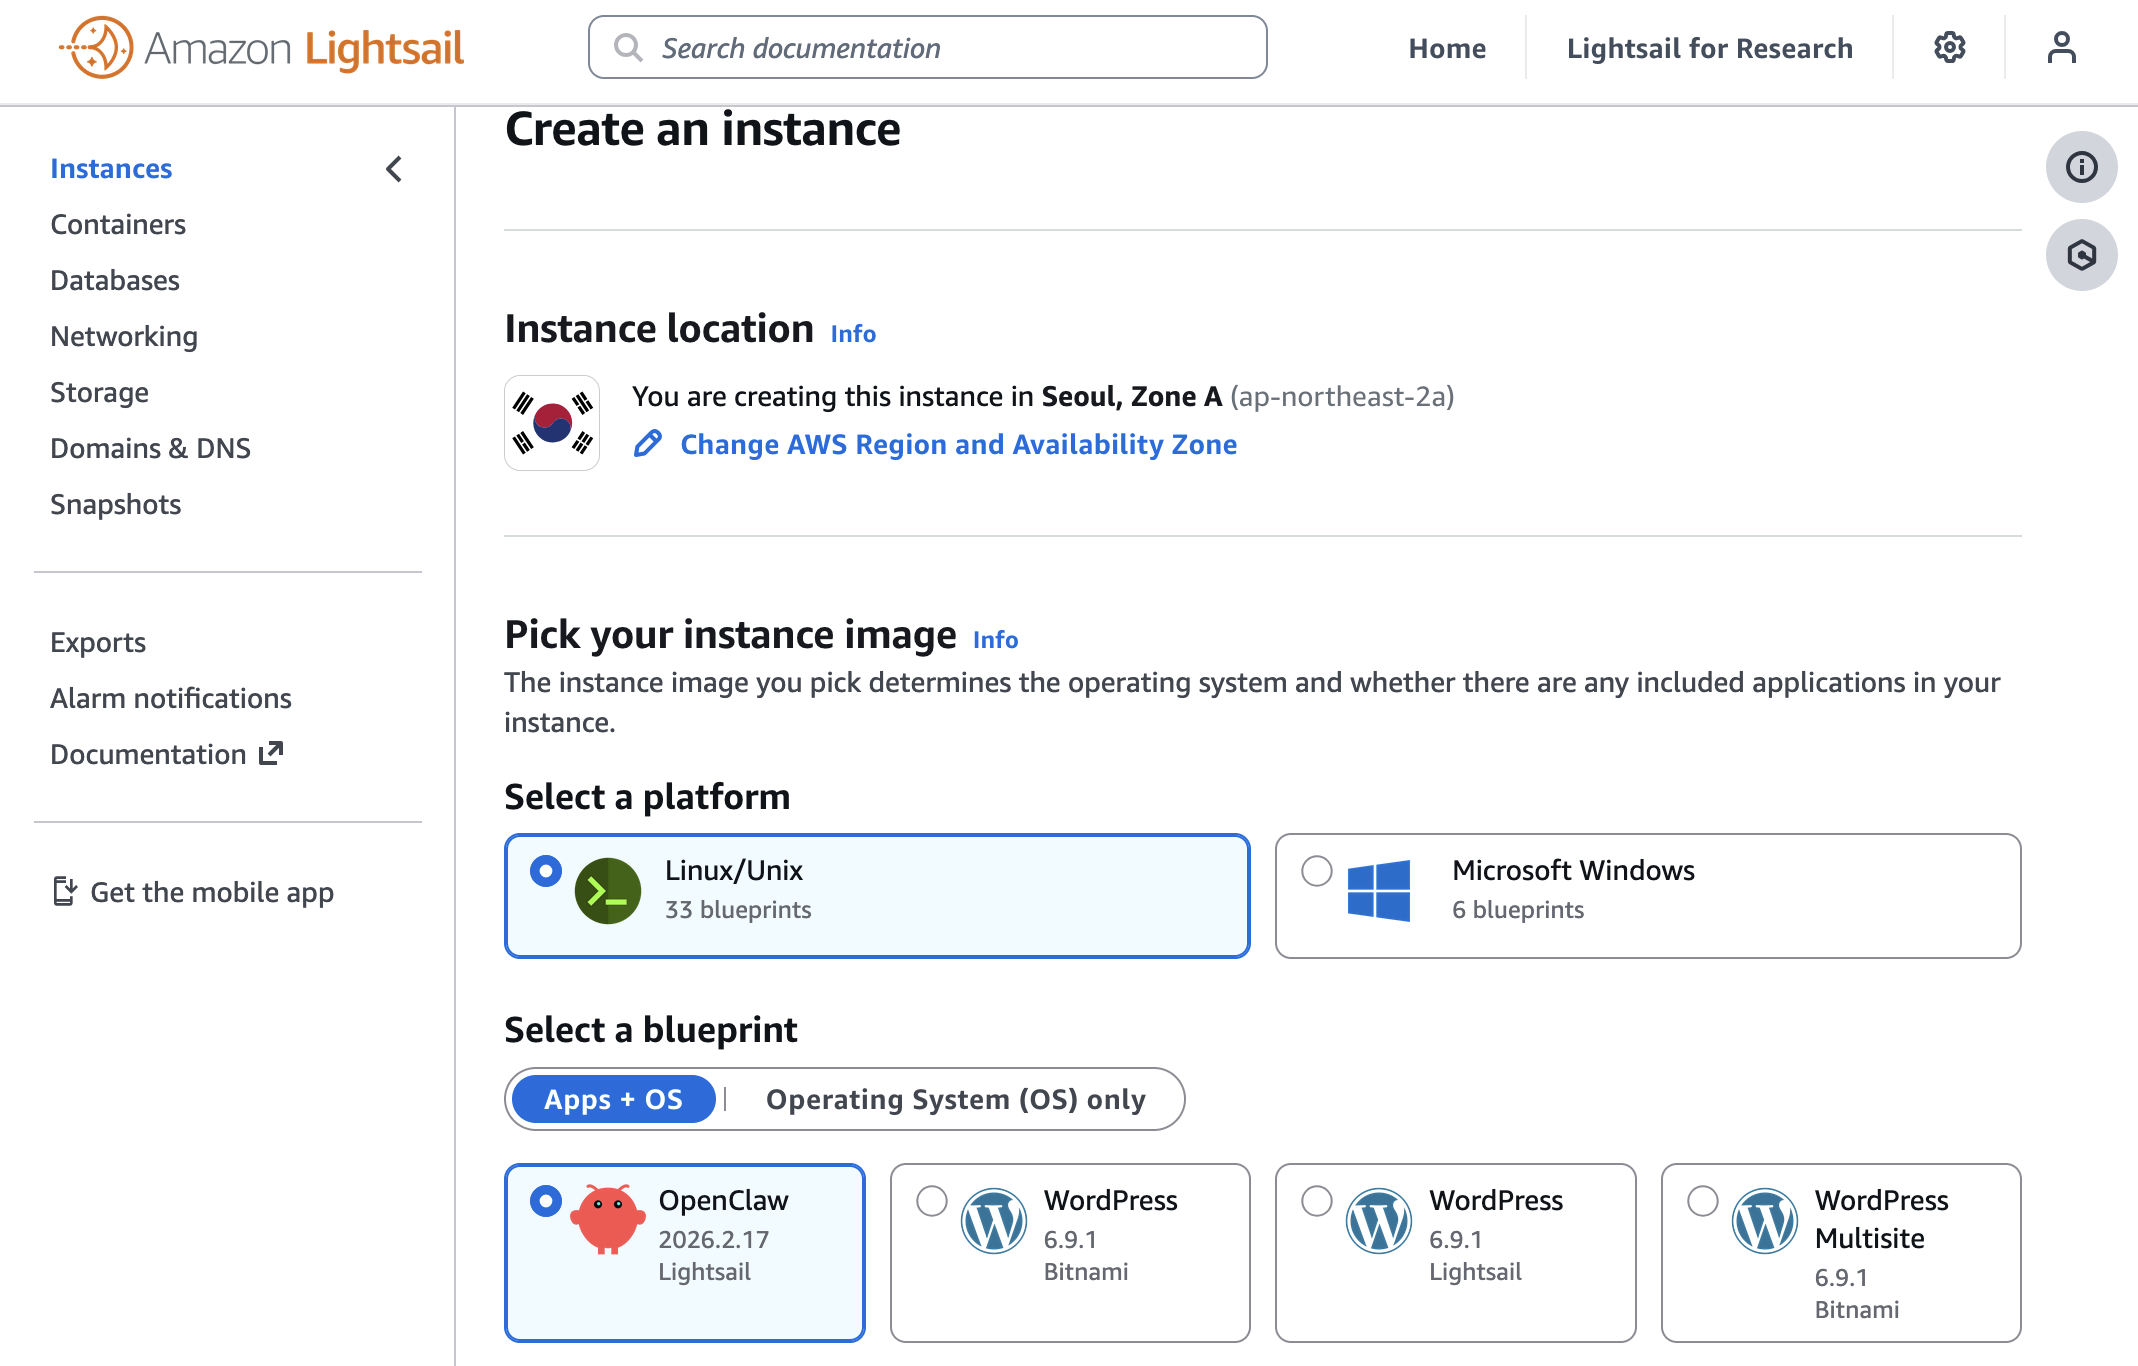
To get started, go to the Amazon Lightsail console and choose Create instance on the Instances section. After choosing your preferred AWS Region and Availability Zone, Linux/Unix platform to run your instance, choose OpenClaw under Select a blueprint.
You can choose your instance plan (4 GB memory plan is recommended for optimal performance) and enter a name for your instance. Finally choose Create instance. Your instance will be in a Running state in a few minutes.
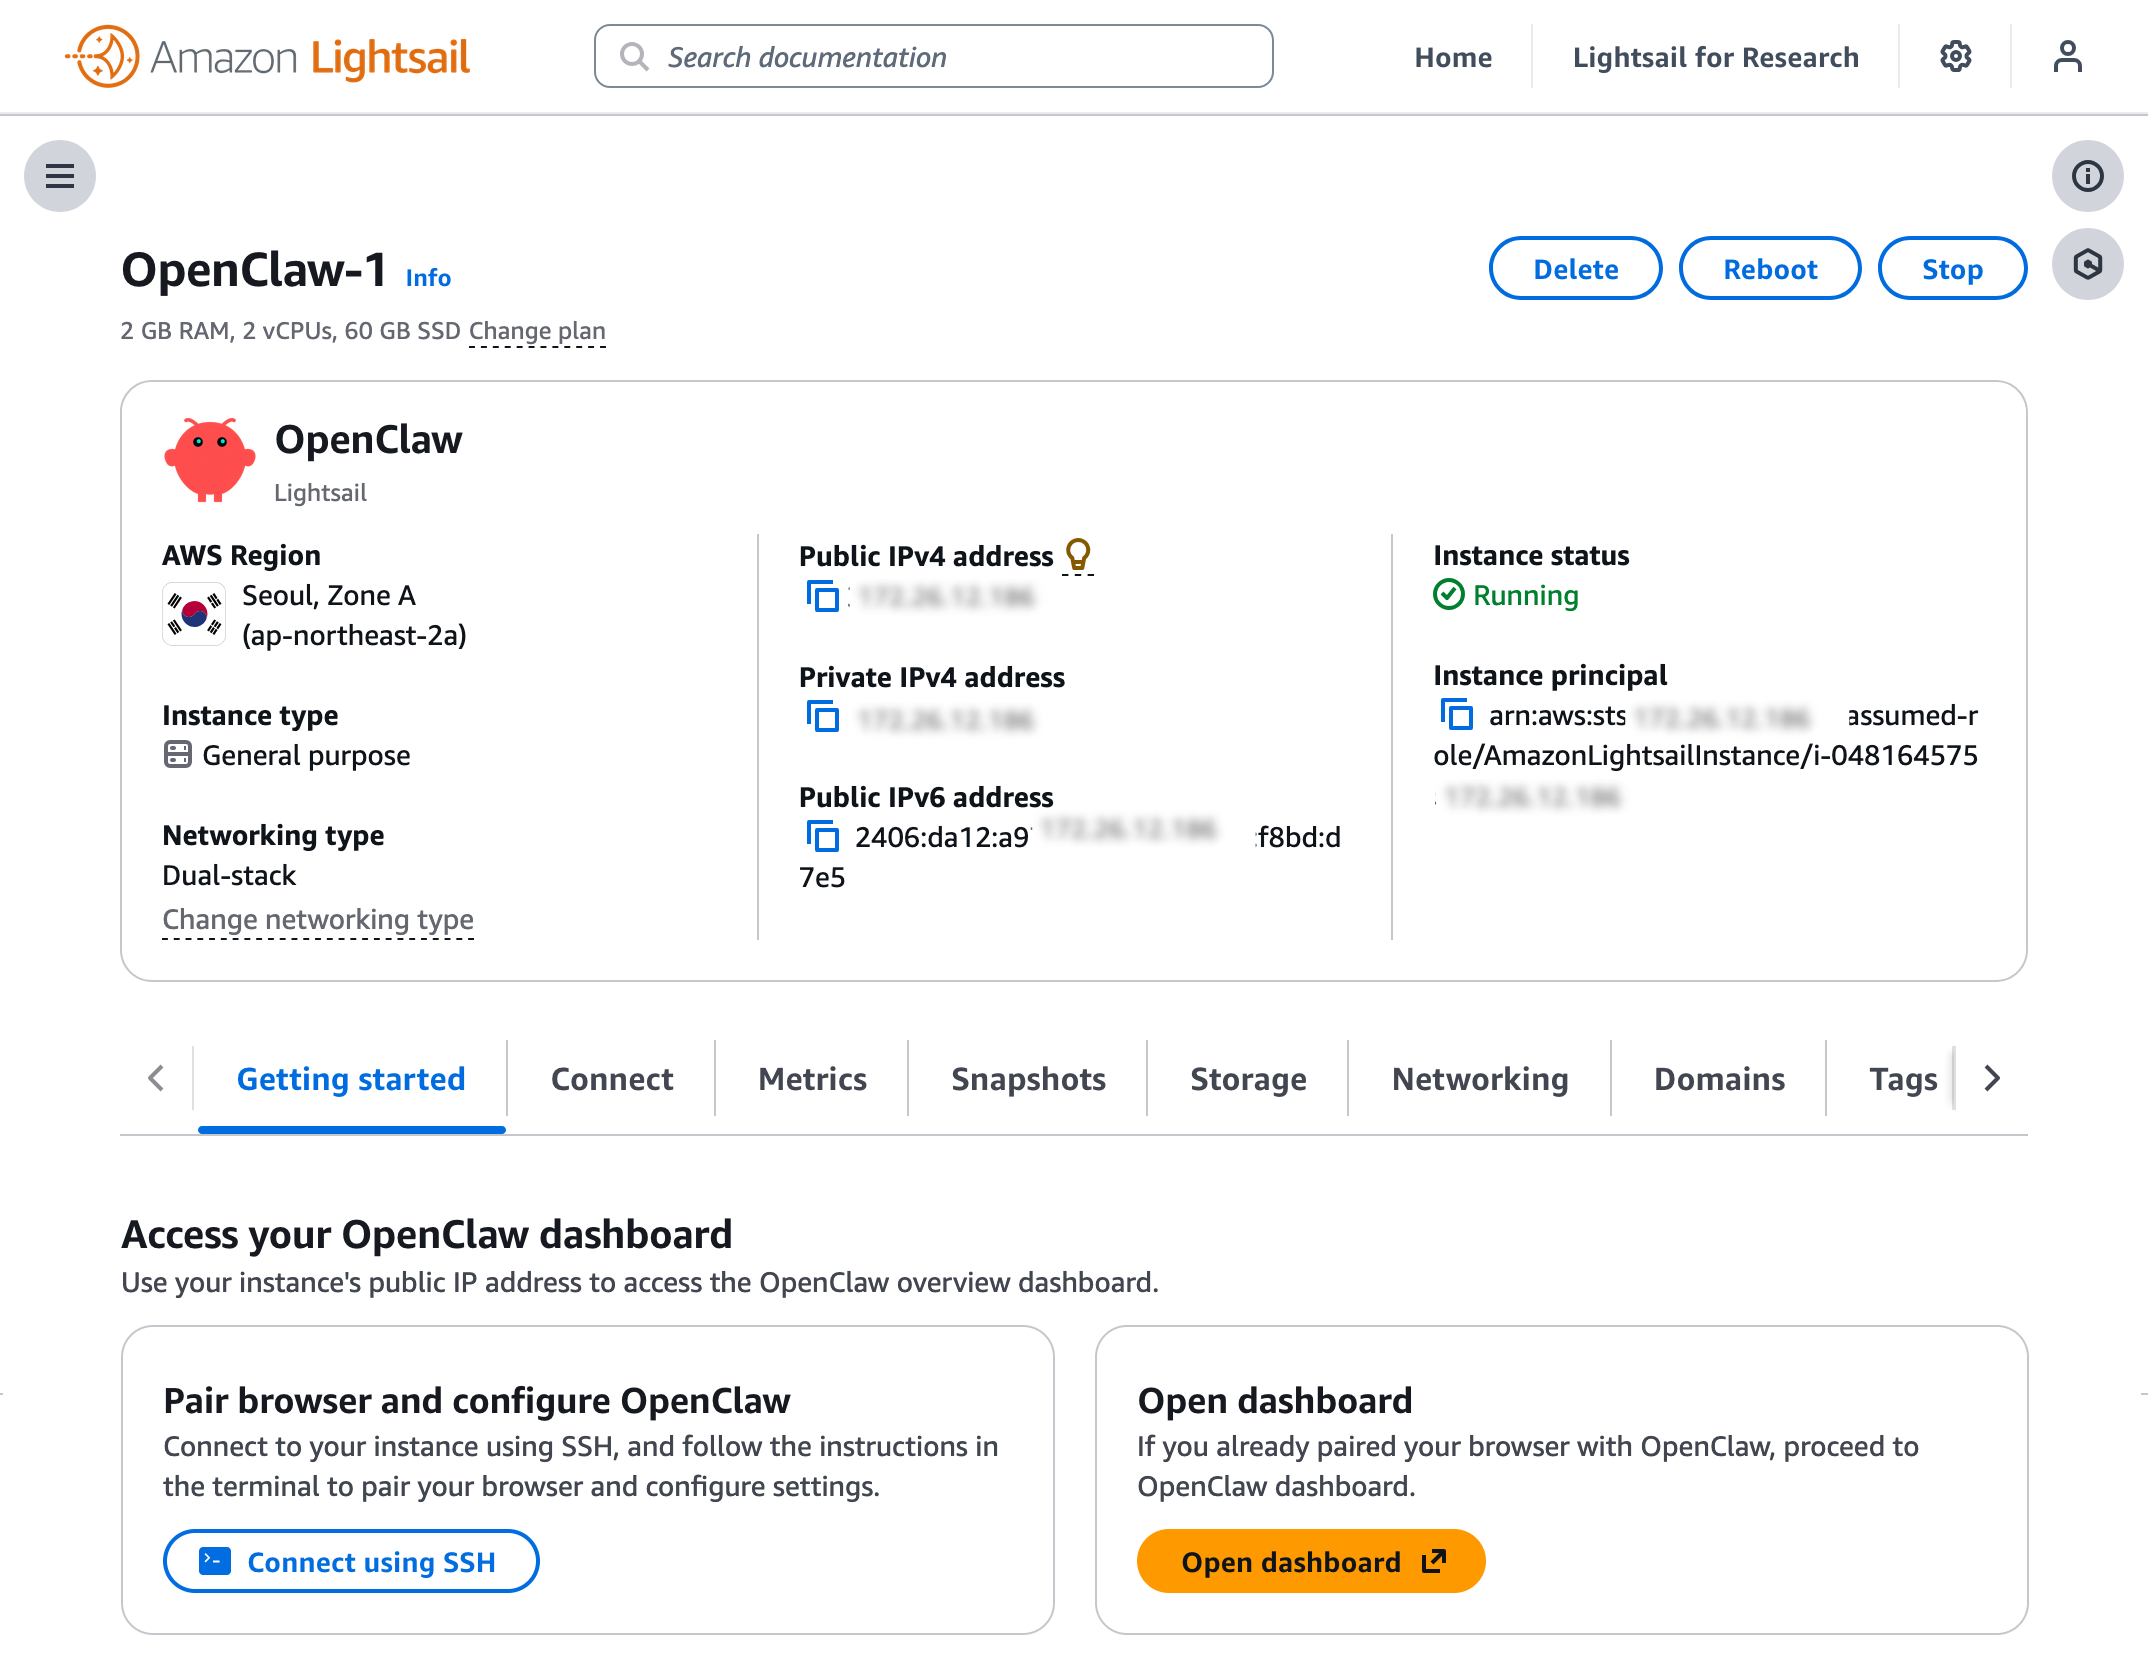
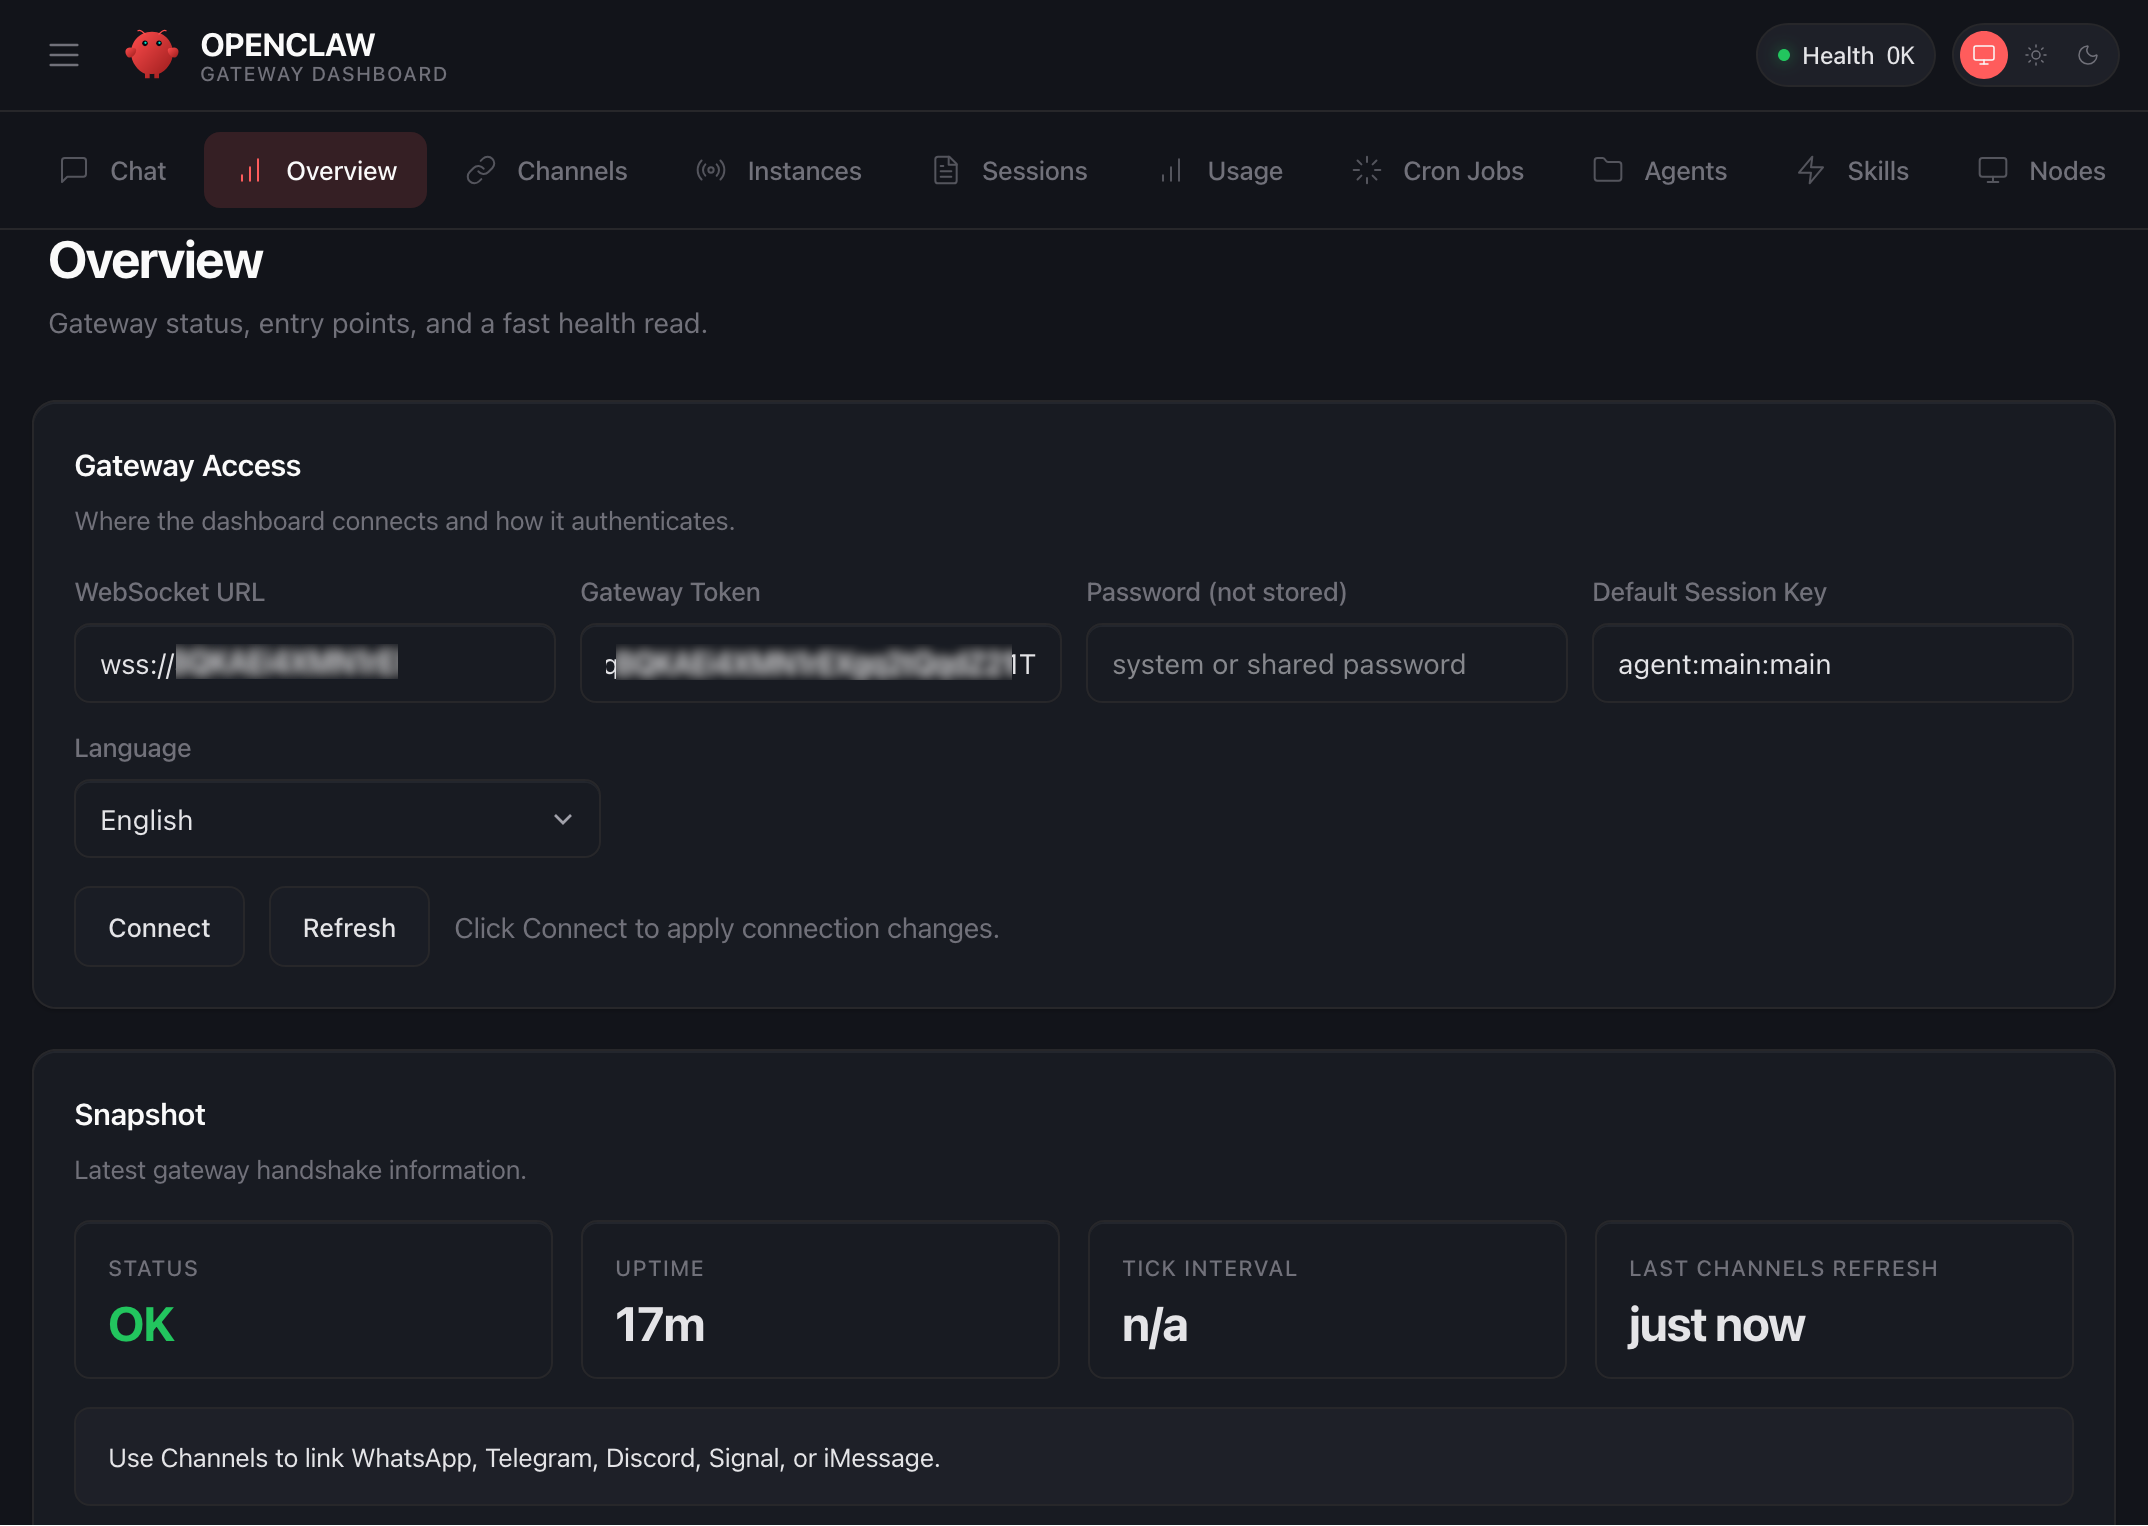
Before you can use the OpenClaw dashboard, you should pair your browser with OpenClaw. This creates a secure connection between your browser session and OpenClaw. To pair your browser with OpenClaw, choose Connect using SSH in the Getting started tab.
When a browser-based SSH terminal opens, you can see the dashboard URL, security credentials displayed in the welcome message. Copy them and open the dashboard in a new browser tab. In the OpenClaw dashboard, you can paste the copied access token into the Gateway Token field in the OpenClaw dashboard.
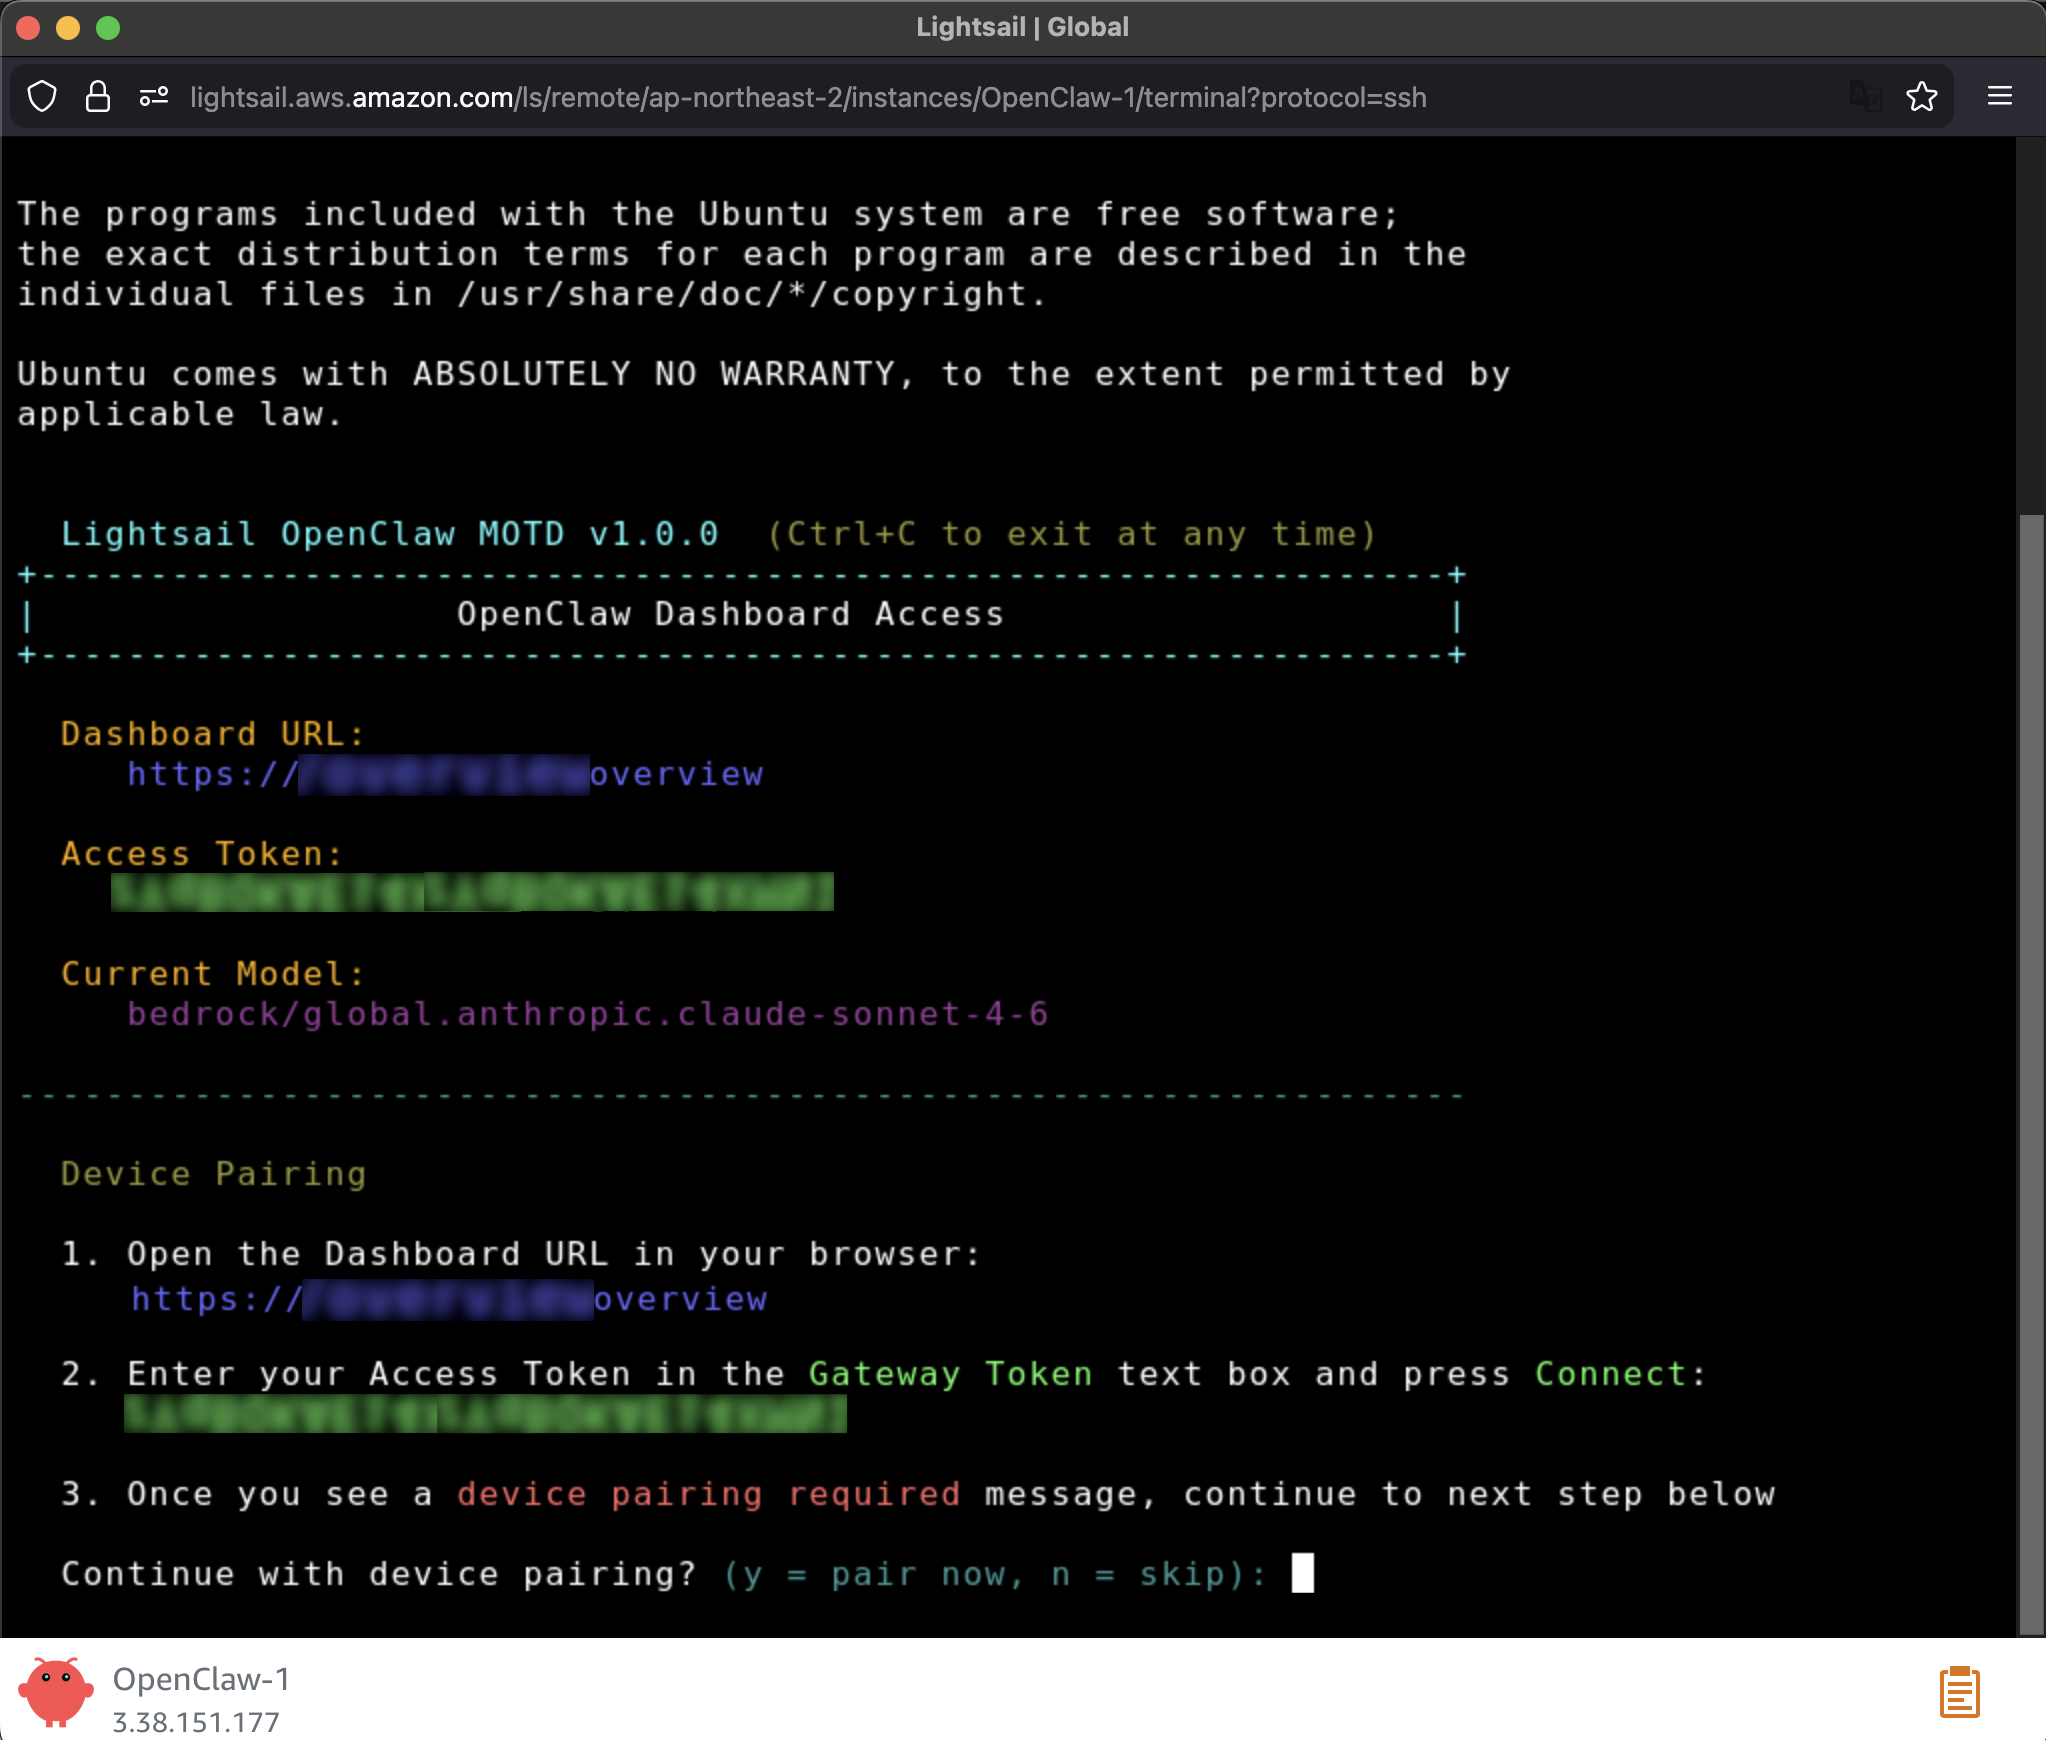
When prompted, press y to continue and a to approve with device pairing in the SSH terminal. When pairing is complete, you can see the OK status in the OpenClaw dashboard and your browser is now connected to your OpenClaw instance.
Your OpenClaw instance on Lightsail is configured to use Amazon Bedrock to power its AI assistant. To enable Bedrock API access, copy the script in the Getting started tab and run copied script into the AWS CloudShell terminal.
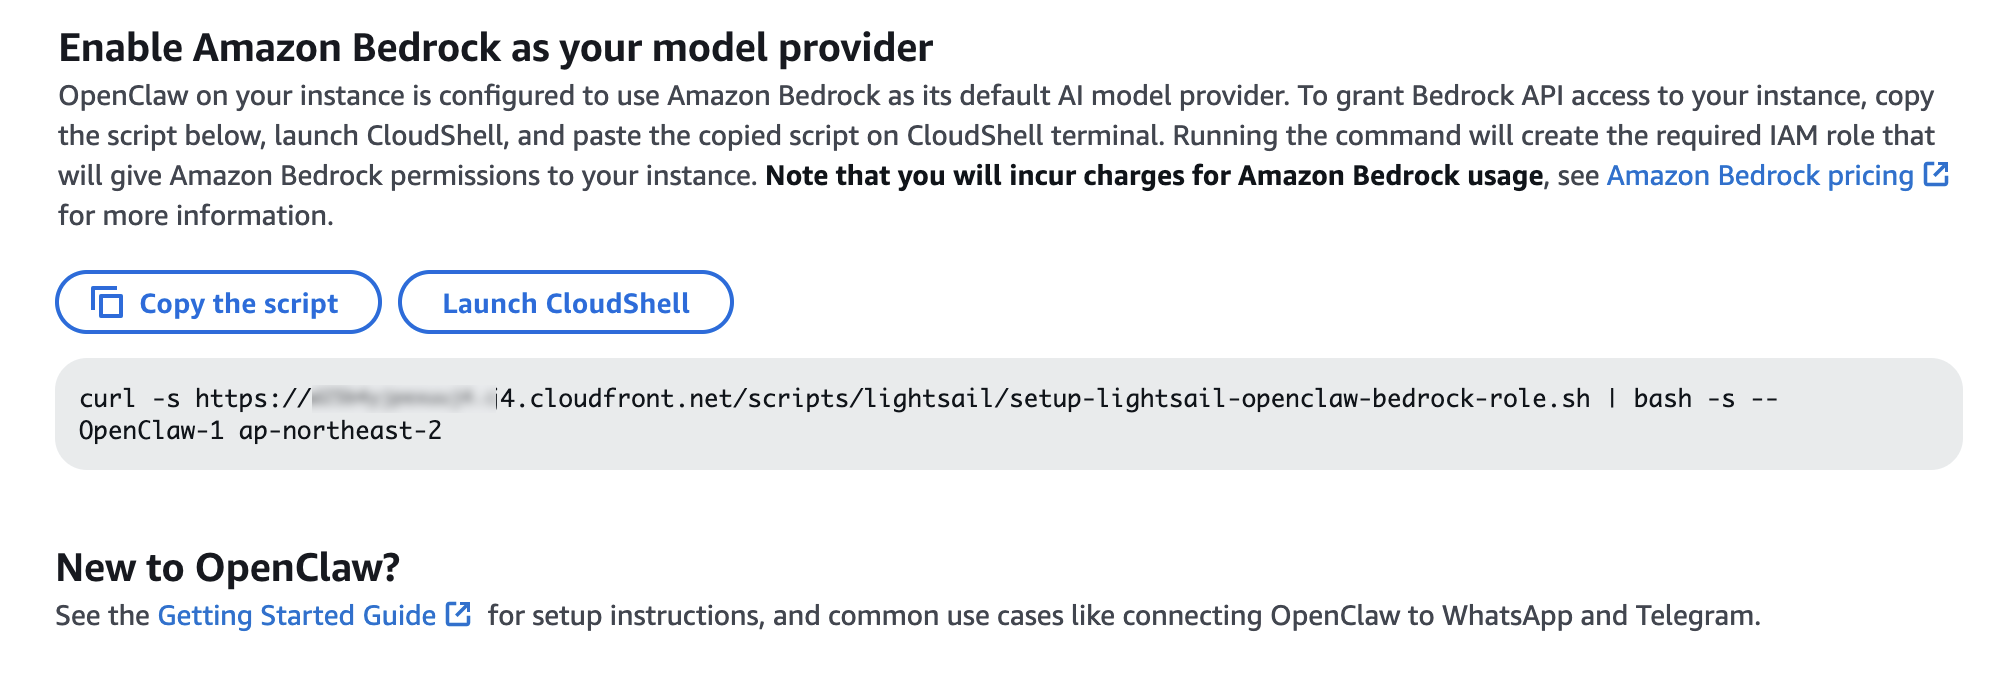
Once the script is complete, go to Chat in the OpenClaw dashboard to start using your AI assistant!
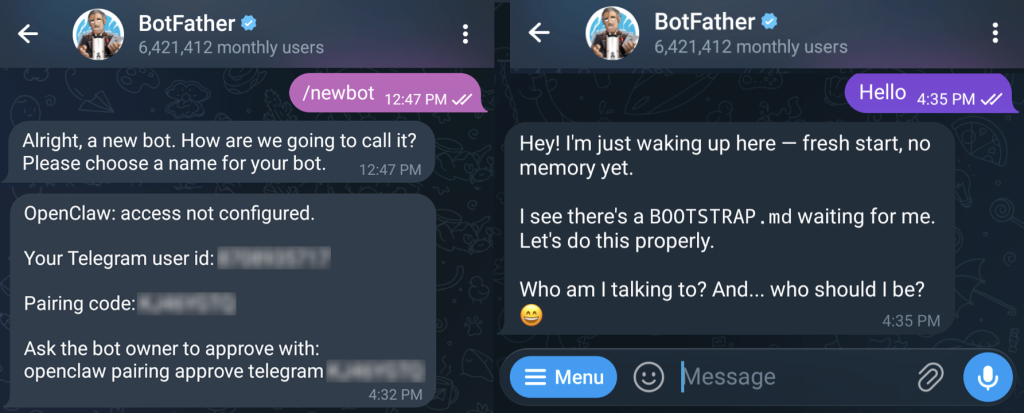
You can set up OpenClaw to work with messaging apps like Telegram and WhatsApp for interacting with your AI assistant directly from your phone or messaging client. To learn more, visit Get started with OpenClaw on Lightsail in the Amazon Lightsail User Guide.
Things to know
Here are key considerations to know about this feature:
- Permission — You can customize AWS IAM permissions granted to your OpenClaw instance. The setup script creates an IAM role with a policy that grants access to Amazon Bedrock. You can customize this policy at any time. But, you should be careful when modifying permissions because it may prevent OpenClaw from generating AI responses. To learn more, visit AWS IAM policies in the AWS documentation
- Cost — You pay for the instance plan you selected on an on-demand hourly rate only for what you use. Every message sent to and received from the OpenClaw assistant is processed through Amazon Bedrock using a token-based pricing model. If you select a third-party model distributed through AWS Marketplace such as Anthropic Claude or Cohere, there may be additional software fees on top of the per-token cost.
- Security — Running a personal AI agent on OpenClaw is powerful, but it may cause security threat if you are careless. I recommend to hide your OpenClaw gateway never to expose it to open internet. The gateway auth token is your password, so rotate it often and store it in your envirnment file not hardcoded in config file. To learn more about security tips, visit Security on OpenClaw gateway.
Now available
OpenClaw on Amazon Lightsail is now available in all AWS commercial Regions where Amazon Lightsail is available. For Regional availability and a future roadmap, visit the AWS Capabilities by Region.
Give a try in the Lightsail console and send feedback to AWS re:Post for Amazon Lightsail or through your usual AWS support contacts.
– Channy
Cisco Catalyst C1300-12XS Review A Neat 12-Port 10GbE Managed Switch
Post Syndicated from Rohit Kumar original https://www.servethehome.com/cisco-catalyst-c1300-12xs-review-a-neat-12-port-10gbe-marvell-managed-switch/
In our Cisco Catalyst C1300-12XS review, we see how this 12-port 10GbE switch’s build quality, management, and performance differentiate it
The post Cisco Catalyst C1300-12XS Review A Neat 12-Port 10GbE Managed Switch appeared first on ServeTheHome.
Comic for 2026.03.04 – Fool Me
Post Syndicated from Explosm.net original https://explosm.net/comics/fool-me
New Cyanide and Happiness Comic
Body Cams vs. Other Camers #lastweektonight
Post Syndicated from LastWeekTonight original https://www.youtube.com/shorts/bSnjFXn883A
Enhanced access denied error messages with policy ARNs
Post Syndicated from Stella Hie original https://aws.amazon.com/blogs/security/enhanced-access-denied-error-messages-with-policy-arns/
To help you troubleshoot access denied errors, we recently added the Amazon Resource Name (ARN) of the denying policy to access denied error messages. This builds on our 2021 enhancement that added the type of the policy denying the access to access denied error messages. The ARN of the denying policy is only provided in same-account and same-organization scenarios. This change is gradually rolling out across all AWS services in all AWS Regions.
What changed?
We added the policy ARN to access denied error messages for AWS Identity and Access Management (IAM) and AWS Organizations policies. Because of this change, you can now pinpoint the exact policy causing the denial. You don’t have to evaluate all the policies of the same type in your AWS environment to identify the culprit. The policy types covered in this update are service control policies (SCPs), resource control policies (RCPs), permissions boundaries policies, session policies, and identity-based policies.
For example, when a developer attempts to perform the ListRoles action in IAM and is denied because of an SCP:
Before:An error occurred (AccessDenied) when calling the ListRoles operation: User: arn:aws:iam::123456789012:user/Matt is not authorized to perform: iam:ListRoles on resource: arn:aws:iam::123456789012:role/* with an explicit deny in a service control policy
Enhanced:An error occurred (AccessDenied) when calling the ListRoles operation: User: arn:aws:iam::123456789012:user/Matt is not authorized to perform: iam:ListRoles on resource: arn:aws:iam::123456789012:role/* with an explicit deny in a service control policy: arn:aws:organizations::987654321098:policy/o-qv5af4abcd/service_control_policy/p-2kgnabcd
How this enhancement works
This enhancement is designed with three principles:
- Limited scope – Same account and same organization only: Policy ARNs are only included when the request originates from either the same AWS account or the same organization as the policy. This limits the scope of the flow of information.
- Additional context in the form of ARN only and not policy content: The additional context covers only the policy ARN, which is a resource identifier, not the policy document itself. It does not reveal the policy’s permissions or conditions that you would have to update to grant access. Users would still need appropriate permissions to read the policy content or take actions.
- No change to authorization logic: This enhancement only affects the error message displayed, not the authorization decision-making process. The same policies deny or allow access as before, and we are not changing how the decision is made.
How this benefits you
This accelerates troubleshooting across your organization. Previously, when you received an access denied error from a policy, for example an SCP, you had to review all SCPs in your organization, determine which applied to the account, and evaluate each one—a process that could take time. Now, with the specific SCP ARN included in the error message, whoever has the necessary permission can review the identified SCP and more quickly resolve the issue. This precision reduces the investigative burden. Clear error messages with policy ARNs also improve communication between teams who need access and teams who troubleshoot issues by providing a common reference point, eliminating ambiguity and reducing back-and-forth communication. Lastly, when validating security controls, the policy ARN in access denied errors provides immediate confirmation of which policy is enforcing the restriction, enabling customers to quickly verify their policies are correctly denying access.
How you can use the new information
Let’s say you’re trying to describe your Amazon Relational Database Service (Amazon RDS) snapshots in the us-east-2 Region by calling this API:aws rds describe-db-snapshots --region us-east-2
Unfortunately you get an access denied error. The error message shows:An error occurred (AccessDenied) when calling the DescribeDBSnapshots operation: User: arn:aws:sts::123456789012:assumed-role/ReadOnly/ReadOnlySession is not authorized to perform: rds:DescribeDBSnapshots on resource: arn:aws:rds:us-east-2:123456789012:snapshot:* with an explicit deny in a service control policy: arn:aws:organizations::987654321098:policy/o-qv5af4abcd/service_control_policy/p-lvi9abcd
You can see the context to understand what happens:
- It’s an explicit deny. This means there’s a policy that denies this action for a specific context
- The deny comes from the SCP with this ARN:
arn:aws:organizations::987654321098:policy/o-qv5af4abcd/service_control_policy/p-lvi9abcd
Here’s how you can troubleshoot this error:
- Ensure you have necessary permission to view the SCP. If you don’t, contact your administrator and provide the message that includes the policy ARN.
- If you have the necessary permission, go to the AWS Management Console for AWS Organizations to access the SCP.
- Check for a
Denystatement for the action. In the preceding example, the action isrds:DescribeDBSnapshots. - You can alter the statement to remove the
Denyif it’s no longer applicable. For more information, see Update a service control policy (SCP). - Re-try your operation. Repeat the troubleshooting process if you get other access denied errors due to different reasons or policies.
When will this change become available?
This update is gradually rolling out across all AWS services in all AWS Regions, beginning early 2026.
Need more assistance?
If you have any questions or issues, contact AWS Support or your Technical Account Manager (TAM).
Trump’s War With Iran and a New Danger at Home | The David Frum Show
Post Syndicated from The Atlantic original https://www.youtube.com/watch?v=8w7KOoD8sCs
What in 2026.3 Actually Changes Your Smart Home?
Post Syndicated from BeardedTinker original https://www.youtube.com/watch?v=-ifA952a3b0
Always-on detections: eliminating the WAF “log versus block” trade-off
Post Syndicated from Daniele Molteni original https://blog.cloudflare.com/attack-signature-detection/
Traditional Web Application Firewalls typically require extensive, manual tuning of their rules before they can safely block malicious traffic. When a new application is deployed, security teams usually begin in a logging-only mode, sifting through logs to gradually assess which rules are safe for blocking mode. This process is designed to minimize false positives without affecting legitimate traffic. It’s manual, slow and error-prone.
Teams are forced into a trade-off: visibility in log mode, or protection in block mode. When a rule blocks a request, evaluation stops, and you lose visibility into how other signatures would have assessed it — valuable insight that could have helped you tune and strengthen your defenses.
Today, we’re solving this by introducing the next evolution of our managed rules: Attack Signature Detection.
When enabled, this detection inspects every request for malicious payloads and attaches rich detection metadata before any action is taken. You get complete visibility into every signature match, without sacrificing protection or performance. Onboarding becomes simple: traffic is analyzed, data accumulates, and you see exactly which signatures fire and why. You can then build precise mitigation policies based on past traffic, reducing the risk of false positives.
But we’re going one step further. We’re moving beyond request-only analysis to something far more powerful: Full-Transaction Detection.
Instead of looking at just the incoming request, this new detection correlates the entire HTTP transaction: request and response. By analyzing the full context, we dramatically reduce false positives compared to traditional request-only signature engines. More importantly, we uncover threats others miss, such as reflective SQL injection, subtle data exfiltration patterns, and dangerous misconfigurations that only reveal themselves in the response.
Attack Signature Detection is available now in Early Access — sign up here to express interest. Full-Transaction Detection is under development; register here to be among the first to try it when it’s ready.
To provide full visibility on your traffic without slowing down the Internet, we had to change how we think about the request lifecycle. For customers who opt in, Attack Signature detection is now “always on.” This means that as soon as traffic is proxied, all detection signatures are executed on every request, and the results are immediately visible in Security Analytics.
This “always-on” framework separates detection from mitigation. Detections run continuously, enriching analytics with metadata about triggered detections. This metadata is also added to the request as a new field, which customers can use to create custom policies within security rules.
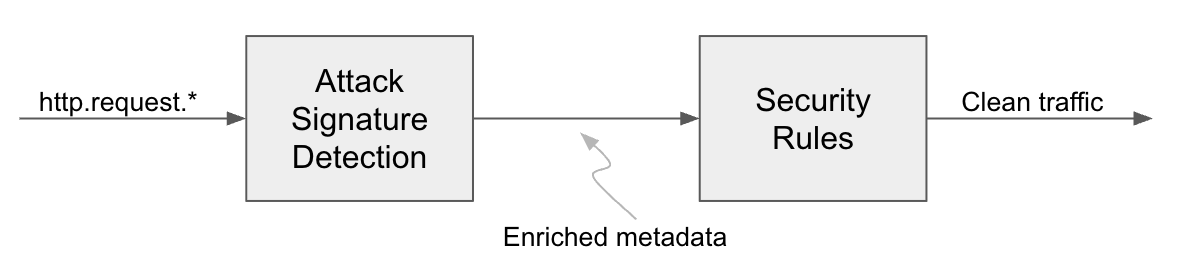
Separating the detection of malicious payloads from the actions taken by security rules is the core of the always-on framework. This approach enhances the analytics experience and increases confidence when deploying new protections.
Our existing Bot Score and Attack Score detections already follow this method. Attack Signature Detection provides the same coverage as our Managed Rules product but operates within this new framework.
Does this introduce additional latency to the request? No — this model is designed for efficiency. If a customer has not created a blocking rule based on a detection, the detection can be executed after the request has been sent to the origin server, ensuring that the detection itself introduces no additional latency to the traffic. Therefore, upon onboarding, the detection is enabled by default but does not impact traffic performance. When a rule is created, the detection is moved in-line with the request that might experience additional latency. The exact value depends on the traffic profile of the application.
Compared to traditional, rule-based systems like the Cloudflare Managed Ruleset, the new detection offers a substantial advancement in web application security. This approach makes identifying malicious web payloads and deploying security rules significantly more user-friendly.
The Cloudflare Managed Ruleset is where our analyst team develops detections for common attack vectors, including SQL injection (SQLi), Cross Site Scripting (XSS), Remote Code Execution (RCE), and specific Common Vulnerabilities and Exposures (CVEs). Analysts typically release new rules weekly, with emergency releases deployed for high-profile vulnerabilities (such as the recent React2Shell release). Currently, over 700 managed rules are active in our Managed Ruleset. The new detections are also known as signature rules or simply signatures. They employ the same heuristics as Managed Rules but do not directly apply actions to traffic.
Each signature is uniquely identified by a Ref ID (similar to the Rule ID for the Managed Ruleset) and is tagged with both category and confidence. The category specifies the attack vectors the signature targets, while the confidence level indicates the likelihood of a false positive (a trigger on legitimate traffic). A rule can have only one confidence level but may have multiple categories.
Category indicates what attack vector the rule refers to. The list of categories is long, but includes tags like SQLi, XSS, RCE or specific CVE with its number.
The confidence field is divided into two values, based on whether at least one signature from the corresponding group matches the traffic.
|
Confidence |
Description |
|
High |
These signatures aim for high true positives and low false positives, typical for CVEs where payloads are identifiable without blocking legitimate traffic. They function like the Managed Ruleset’s default configuration. |
|
Medium |
These signatures, which are turned off by default in the Managed Ruleset, may cause false positives based on your traffic. Before blocking traffic matching these rules, assess their potential application impact. |
The detection’s analysis of a request populates three fields. These fields are accessible in Security Analytics and Edge Rules Engine, our core engine for Security Rules.
|
Field |
Description |
Where can be used |
|
|
Array. Aggregate the confidence scores associated with the matching signatures. |
Analytics and Security Rules |
|
|
Array. Aggregate the categories associated with the matching signatures. |
Analytics and Security Rules |
|
|
Array. Aggregates the Ref IDs of the matching signatures, up to 10. |
Analytics and Security Rules |
Security Analytics is at the core of the Cloudflare Application Security toolbox, providing a comprehensive, data-driven view of how signatures interact with your web traffic. It gives you the tools necessary to understand, measure, and optimize your web protection. Common use cases for combining Analytics with signatures include: design a security posture during the onboarding process, verify the most frequent attack attempts and create exceptions to handle false positives.
Once a new application is proxied through Cloudflare, Attack Signature Detection begins populating your dashboard with data. The initial step is to examine the aggregated matches, categorized by type and signature, to confirm that all potential attacks are being blocked. Analysts can do this by reviewing the top statistics for signatures, filtering the data to show whether requests were blocked, served from the cache, or permitted to reach the origin server. If any malicious requests are found to have reached the origin, analysts can quickly implement security rules.

A breakdown of the total request volume matching attack signatures, categorized by their corresponding Category or Signature.
Analytics provides insights into attack patterns, such as the most frequent CVEs based on traffic volume over time. This capability is designed for quickly identifying the dominant attack payloads targeting applications and verifying the efficacy of current protections against related CVEs. For example, analysts can monitor the attack frequency targeting a specific part of the application, like /api/, or confirm if known malicious payloads, such as React2Shell, are reaching a particular endpoint, such as the POST /_next/ Node.js path. Both the Analytics filters and the Attack Analysis tool can be used to perform this type of investigation.
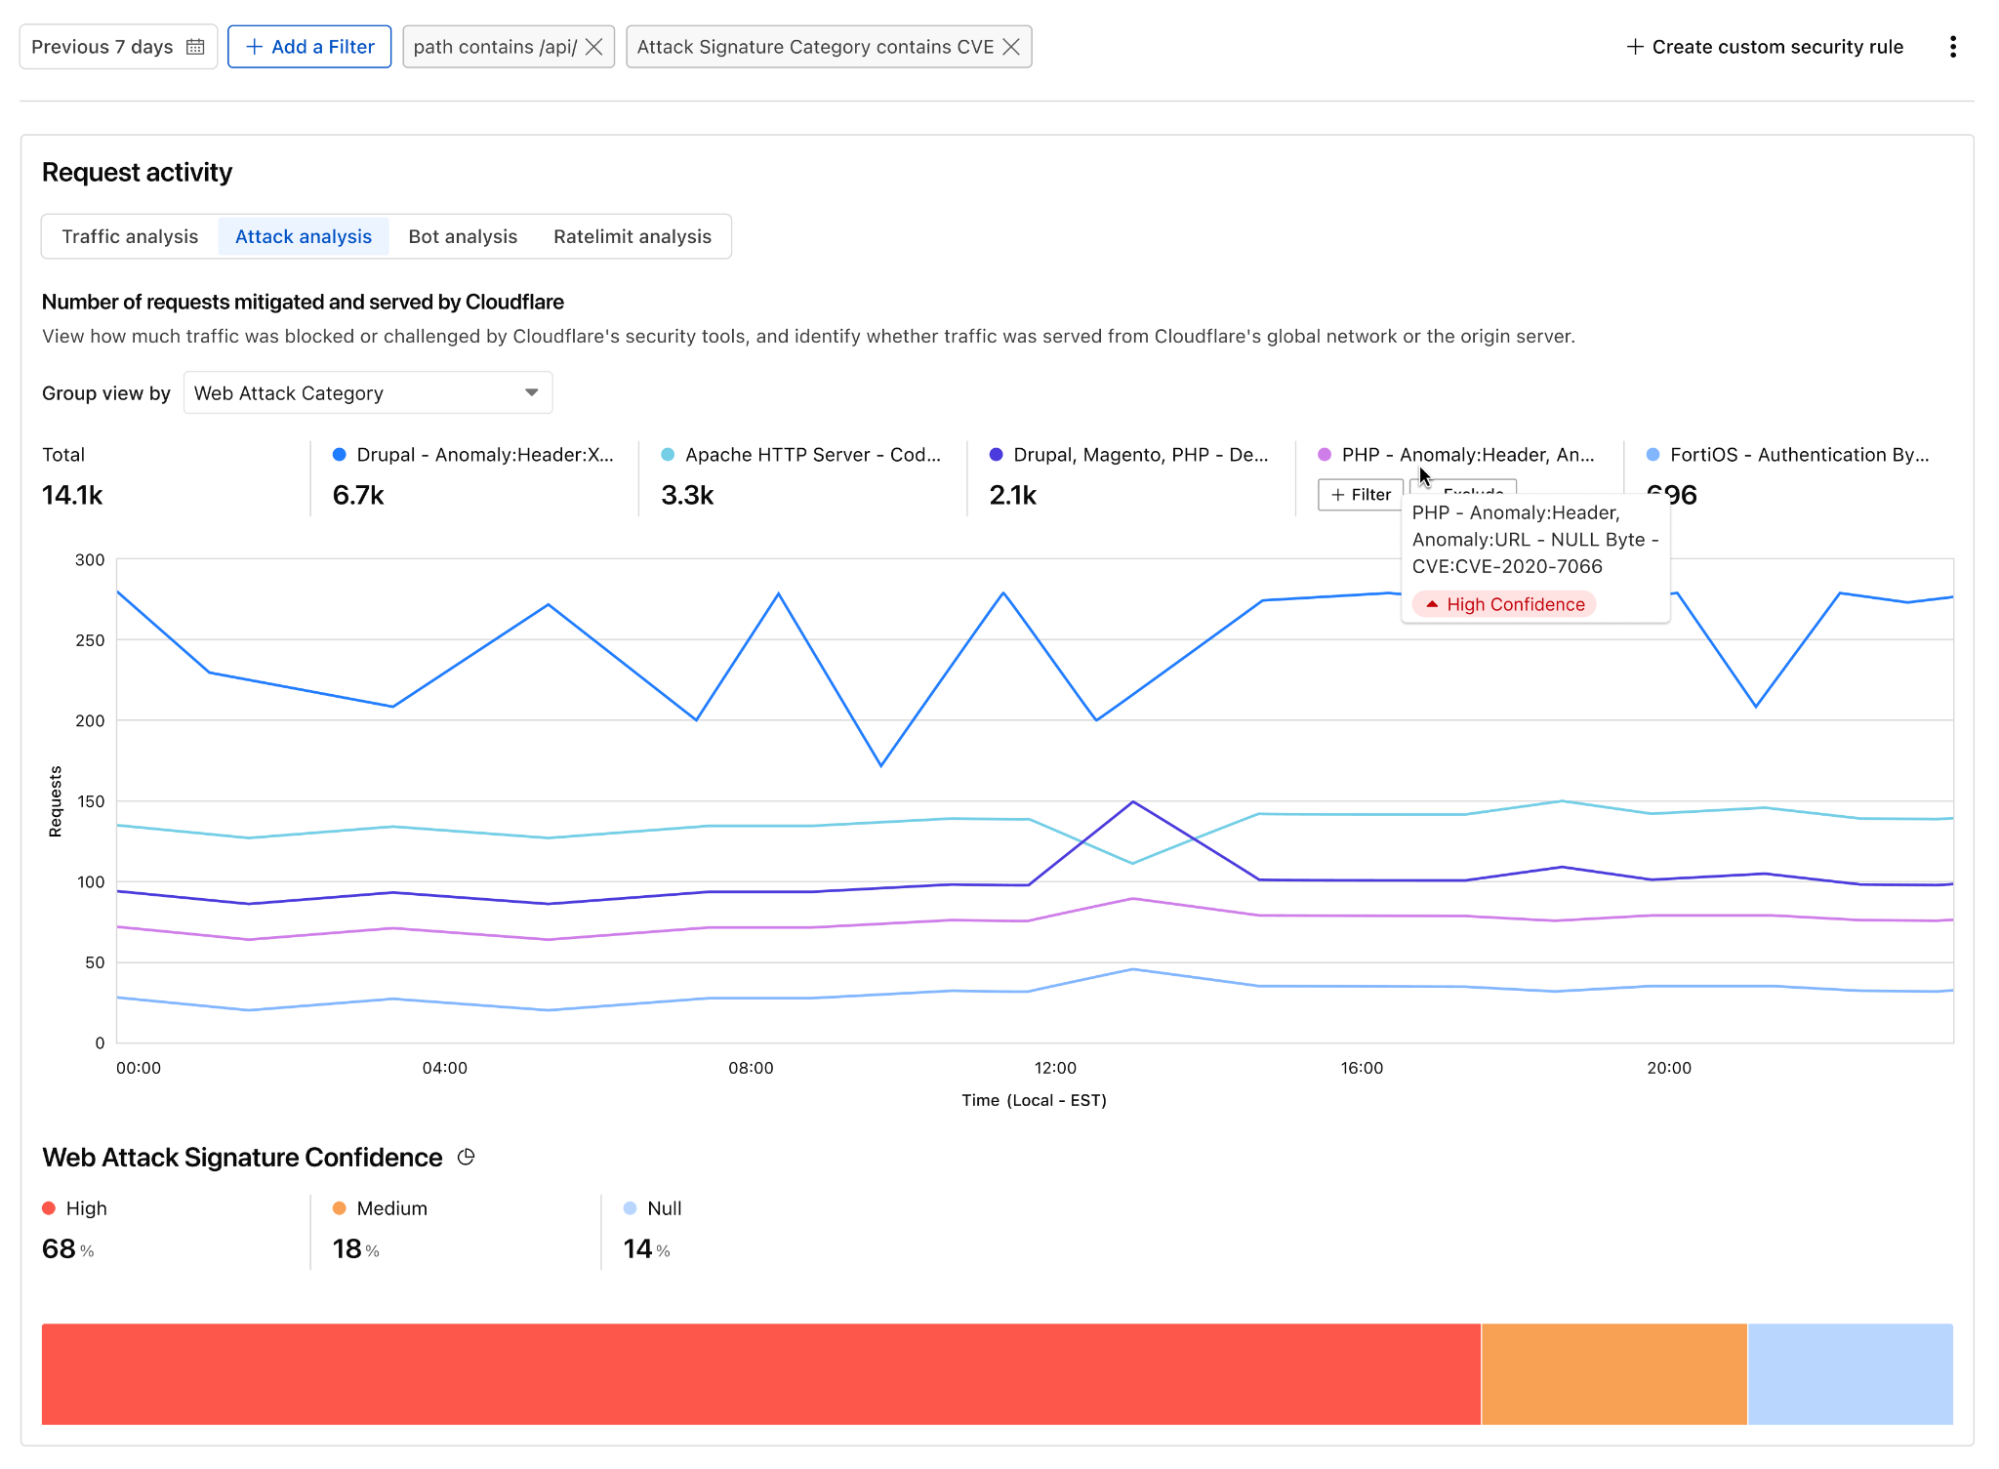
A visualization within Security Analytics offers a time-series view of malicious payloads targeting the /api/ endpoint. This view groups the data to highlight the top five CVEs by volume.
Analytics also help create exceptions and identifying false positives. An increase in matches for a specific rule, for instance, may suggest false positives rather than active exploitation. For example, an application that allows users to submit rich HTML content (such as a Content Management Systems or support ticketing system) may legitimately include markup that matches more generic XSS signatures. In these cases, a scoped exception can be applied to the affected endpoint, while keeping the protection enabled across the rest of the application.
This approach is especially useful for evaluating medium-confidence signatures, which balance aggressive blocking with false-positive risk. The tool allows “what-if” scenarios against historical traffic to empirically determine production performance. This process helps determine if a medium-confidence signature is appropriate for the overall traffic profile, or if a high rate of false positives requires limiting its deployment to specific URLs or request types.
Generally, signatures that have a very low match rate on historical traffic can be more safely deployed in block mode without significant disruption to legitimate traffic. To achieve this level of confidence, Security Analytics provides the tools for in-depth forensics investigations.
Beyond immediate detection, a crucial aspect of defense management is the ability to customize your security posture. The user interface offers a searchable catalog of all security signatures, allowing you to browse the full list and understand the specific threat each is designed to address.

A searchable catalog of signatures is available, providing more detail on critical detections to help customers understand the threats and the remediation actions.
After analyzing your data and establishing confidence in how the signatures performed against your past traffic, you can easily create custom rules to handle traffic based on the detections. For example, if you want to create a policy that blocks requests matching high confidence signatures you can create the following rule:

Creating a rule to block requests matching with high confidence signatures.
This is equivalent to the Cloudflare Managed Ruleset default deployment.
If you want to block all requests matching at least one rule, you will add the Medium confidence tag. This is equivalent to enabling all rules of Cloudflare Managed Ruleset. Alternatively, you can configure multiple rules, applying a more stringent action (like “Block”) for detections with High confidence and a less strict action (such as “Challenge”) for those with Medium confidence.

By selecting both High and Medium confidence you can trigger a rule if any signature matches.
To create a rule blocking a specific CVE or attack vector, you will use Categories. The rule builder allows you to combine attack vector category tags with all existing HTTP request data. This enables you to create granular rules (or exceptions) and tailor your security posture to different parts of your application.
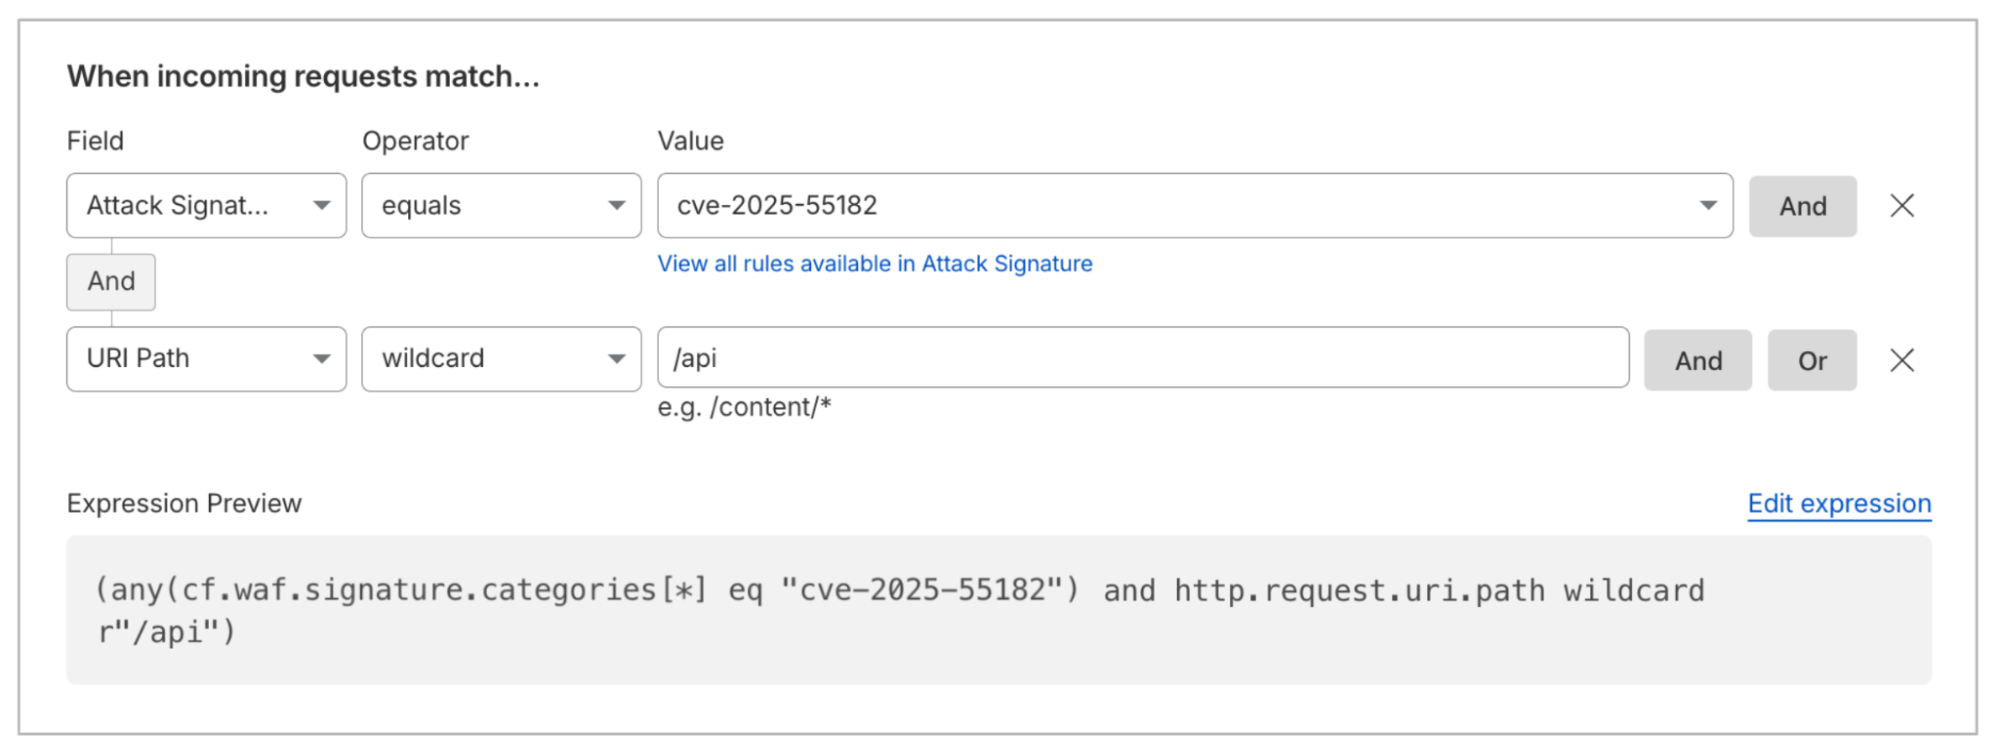
Customers can create rules to block (or allow) requests matching specific CVEs or attack categories.
To create rules based on a specific Signature, you can use Ref ID. You can find the right Ref ID within the rule builder by exploring the available Attack Signature rules. This is especially useful if you want to create exceptions to manage false positives.
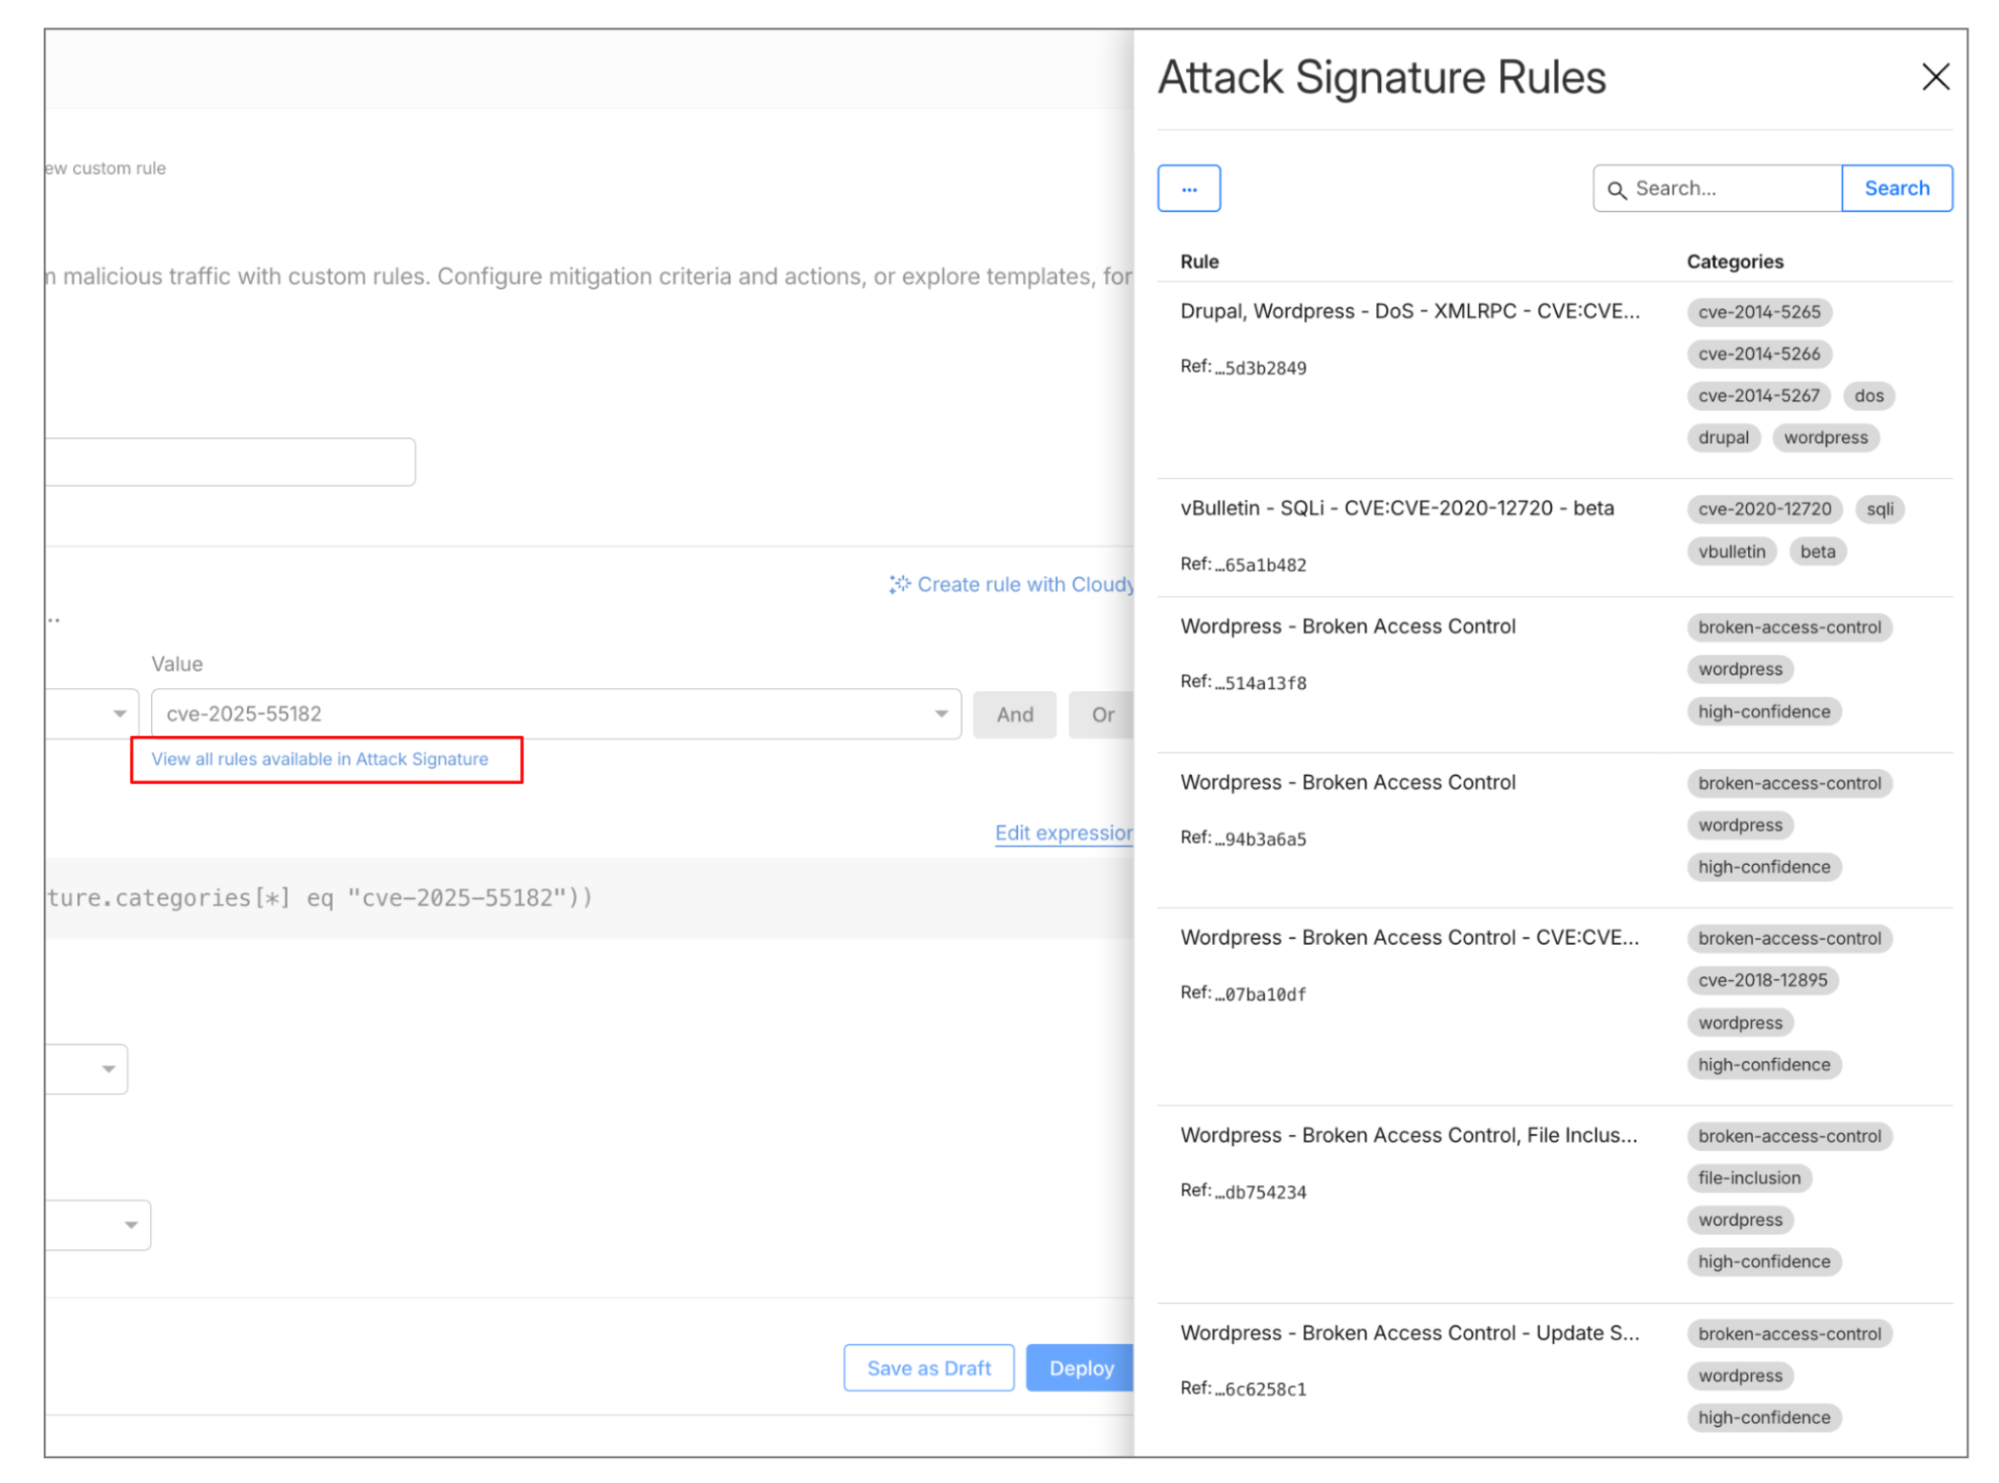
Customers can browse signature rules directly from the rule builder.
All customers continue to have access to our classic Managed Ruleset. When Attack Signature Detection is broadly available, customers will be able to choose the deployment model that best suits their needs, whether that is Attack Signature Detection or Managed Rules. Our analyst teams ensure that new detections are released simultaneously across both the Managed Ruleset and Attack Signature Detection.
Traditional web attack detection primarily focuses on the “ask”: the HTTP request. However, the request only tells half the story. To know if an attack actually succeeded, you have to look at the “answer”: the HTTP response.
By combining request and response metadata into a single detection event, we can dramatically reduce false positives and identify successful exploits that request-only systems miss.
For example, consider a request containing a common SQL injection string in a query parameter.
GET /user?id=1' UNION SELECT username, password FROM users--
A traditional WAF will see the UNION SELECT pattern and block it. However, if the application isn’t actually vulnerable, this might be a false positive — for instance a security researcher testing their own site.
With Full-Transaction Detection, the system notes the SQLi signature in the request but waits for the response. If the origin responds with a 500 Internal Server Error or a standard 404, the confidence of a “successful exploit” is low. If the origin responds with a 200 OK and a body containing a string that matches a “sensitive data” signature (like a list of usernames), the system flags a Successful Exploit Confirmation.
To start, we are rolling out a few detection categories and plan to expand this list over time. Here are the three areas we are currently focused on, and some of the flags you’ll see:
-
Exploit attempts. The detection provides web attack detections by inspecting the entire HTTP request-to-response cycle. It focuses on three key areas: identifying input exploitation like XSS and SQLi via malicious signatures, stopping automated abuse such as vulnerability probing, and confirming successful exploits by correlating suspicious requests with unusual server responses.
-
Data exposure and exfiltration signals. This framework also allows us to catch data exfiltration that looks like legitimate traffic on the way in. A request for /api/v1/export is a standard administrative action. But if that specific request triggers a response containing 5,000 credit card numbers (for example identified via Luhn algorithm signatures), the transaction is flagged as Data Exposure.
-
Misconfigurations. Exposed admin interfaces are often attack vectors. Traditional security checks miss this misconfiguration because the traffic itself looks valid (real endpoints or admin pages). The issue isn’t the traffic but its public accessibility. We prioritize detection based on common real-world misconfigurations seen in customer data, such as public unauthenticated Elasticsearch clusters, Internet reachable admin panels, and exposed Apache sensitive endpoints.
The detection, much like Attack Signatures, will store the results in two specific fields. These fields are accessible in our dashboard and logged within Security Analytics.
|
Field |
Description |
Where can be used |
|
|
Array. Aggregate the categories associated with the matching signatures. |
Security Analytics |
|
|
Array. Aggregates the Ref IDs of the matching signatures, up to 10. |
Security Analytics |
Initially, we are focused on offering visibility into matching requests via analytics. By surfacing events on potential exploits, we provide customers information that can be used for incident response through targeted remediations across their infrastructure and software stack. Our future plans include extending Security Rules to the response phase, which will empower customers to block responses based on these detections by allowing policy creation.

A diagram illustrating the execution locations and corresponding populated fields for both Attack Signature Detection and Full-Transaction Detection.
Attack Signature detection is in Early Access while Full-Transaction Detection is under development. Sign up here to get access to Attack Signature, and here to express interest for Full-Transaction. We’ll gather feedback in the coming months as we prepare these features for General Availability.
НАТО, ЕС и „българската мечта“. Но кое по-напред?
Post Syndicated from Искрен Иванов original https://www.toest.bg/nato-es-i-bulgarskata-mechta-no-koe-po-napred/

Американската мечта, европейската мечта, китайската мечта… Всички тези политически метафори са само част от опитите на поколения автори да опишат стратегическата култура на държавните и недържавните актьори в глобалната архитектура за сигурност.
Българската мечта, от друга страна, обикновено се използва по два начина. Първият изразява патриотичния патос за Велика България на три морета, който безспорно отразява конкретна историческа реалност от битието на страната ни, но се експлоатира и манипулира по толкова безпощаден и грозен начин, че по-скоро навява екстремизъм, отколкото патриотизъм.
Вторият обикновено включва заимстването на точно определени модели и нагаждането им към българската реалност, като например опитите да бъде създаден български Лувър, български South Park или български Манхатън. Това би могло да е символ на обикновена грандоманщина или на нещо още по-лошо – великодържавен инстинкт, който по нищо не се отличава от юлския маратон през 1949 г., когато мавзолеят на Георги Димитров е издигнат само за шест дни. Ето защо си струва да обърнем внимание на българската мечта и какво може да я превърне от изолиран феномен или културна прищявка в реалност, която трябва да бъде разгърната от по-младите поколения.
Корени и проекции на „българската мечта“
Уместно е историческите корени на българската мечта да се търсят в годините след покръстването на българския хаганат през 865-та, тъй като дотогава е приемливо да говорим за псевдодържавност, която не би могла трайно да се позиционира като част от цивилизационните пояси в Европа. Актът, с който хаганатът приема православното християнство за официална религия, е чисто прагматичен външнополитически ход – с него княз Борис I Михаил се стреми да съхрани българската държава на географската карта. В следващите векове стратегическата култура на България и българската мечта ще бъдат изцяло подражателни. Подобно на Русия по-късно, те ще търсят вдъхновение в културата на Източната римска империя (Византия), а българските владетели ще подражават на византийските си събратя.
С падането на Второто българско царство под османска власт езиковото и културното наследство на страната е напълно унищожено и единствено появата на „История славянобългарска“ успява да вдъхне свеж, макар и плах живот на новата българска мечта – Освобождението. То, разбира се, става факт, но заслуга за него има колкото Руско-турската война, толкова и Априлското въстание, което води до такива жестокости, че Великите сили нямат аргументи, с които да възпрат Русия да нападне Османската империя.
Макар и постигната, тази българска мечта почти веднага влиза в употреба от няколко империи. Първата – Русия, решава да превърне освободителната война в културно-религиозен акумулатор на геополитическа зависимост, която с времето придобива патологични размери. Втората – Германия, години наред изнася националистическа идеология към България, довеждайки до „романизирането“ на българското геополитическо мислене и в крайна сметка до формирането на един нов, радикален български национализъм, който значително се отличава от обективния стремеж на Левски, Ботев, Каравелов и Стоянов да видят България свободна и независима. Така тази мечта угасва със загубата на Втората световна война.
(Не)демократичният световен ред
Защо е необходимо да се борим за оцеляването на демокрацията? Надали само защото нищо по-добро не е измислено. От Искрен Иванов.
 Искрен Иванов
Третата проекция на българската мечта обхваща социализма с български характеристики, който се състои от три стълба: трайното позициониране на страната в съветската сфера на влияние, налагането на марксистко-ленинската идеология и създаването на социалистическа средна класа. Именно последното продължава да бъде източник на соцносталгия днес, без да си даваме сметка, че социалистическата средна класа представлява изкуствено формиран феномен, който не може да се възпроизвежда поради спецификите на плановата икономика. С разпада на СССР и социалистическия блок България прегърна като своя мечта присъединяването към ЕС и НАТО – цел, която в първите години след 1989-та беше под въпрос, докато през 1997 г. българската икономика не преживя най-сериозната си криза след Втората световна война.
Българската мечта днес
За жалост, днес трудно може да говорим за българска мечта. Един от факторите е национализмът, който отново надигна глава и приватизира патриотизма като свой придатък. Така прагматично мислещите поколения бяха отблъснати от патриотичната идея, което окончателно доведе до овладяването на тези настроения от страна на националистите.
Обединена Европа и европейската мечта
Възможно ли е европейската стратегическа култура да бъде съживена? И достатъчно ли би било създаването на обединена европейска армия? Как се е променила европейската мечта през годините и мечтае ли изобщо Европа за нещо? От Искрен Иванов.
 Искрен Иванов
Вторият фактор е, че доверието на българите в НАТО и ЕС беше сериозно разклатено не толкова от променените геополитически условия, след като Русия нападна Украйна, колкото от „класата“, която демонстрираха политиците на Запад. Глобалната криза на елитите доведе до изчерпване на лидерския капацитет и до цялостна липса на адекватни лидери, които да дадат на избирателите си нещо повече от класическите идеи за демокрация, човешки права и по-добър живот. И разбира се, изчезването на средната класа спомогна за изострянето на противопоставянето между богати и бедни, което поляризира българското общество във всяко едно отношение и го направи неспособно да защитава интересите си.
Или казано накратко, едва ли някой днес може да дефинира – или пък го е грижа да дефинира – какво представлява българската мечта. Тази политическа апатия е опасна, защото открехва вратичката към използването на понятието за политически цели и вместването му в съвършено различен контекст. Освен това има и геополитически измерения и може да тласне страната към маргинализация в рамките на ЕС.
За това вина имат и самите европейци. Реформата в Съюза е неизбежна, ако иска да остане цял и сигурен в една международна система, където държавните актьори продължават да се борят за глобално надмощие. Но тъй като на Европа ще ѝ трябват трилиони, за да се въоръжи, а и европейците не желаят да развалят средната класа и спокойствието си, по-големите държави явно са решили да заложат на друг механизъм за реформа – доброто старо поделяне на Съюза на две скорости.
Накъде след „Мюнхен 2026“? Отворените въпроси пред Европа и България
Мюнхенската конференция по сигурността затвърди усещането (де да беше само такова), че старият трансатлантически баланс се разпада. Вече всички сме на една вълна по този въпрос. Но докато Европа търси автономия, България рискува да остане между линиите на разделението. От Александър Малинов.
 Александър Малинов
То неизбежно ще запрати България в периферията на ЕС. Фактът, че страната ни вече е член на еврозоната, е може би единственият защитен механизъм за това в един момент да се окажем изолирани от процеса на реално вземане на решения в общността. Остава отворен въпросът дали отбранителните политики, които вътрешният кръг на ЕС ще формира, ще важат с пълна сила и за „втората скорост“. Изглежда, че по-скоро няма да е така, тъй като Франция не показва признаци, че би споделила ядрените си оръжия с европейското командване на НАТО, а Германия едва ли ще предприеме масово превъоръжаване.
В тези условия държавите от втората скорост ще се окажат напълно зависими от САЩ и американските оръжия, за да обновят и разширят отбранителния си капацитет. Изолирането на Източна Европа от единните механизми за развитие в ЕС неизменно ще формира предпоставки и за още нещо – появата на нови мечти за позиционирането ни като мост между Изтока и Запада.
Възможно ли е България да бъде мост между Изтока и Запада?
Най-просто казано – не. България не може да бъде нито регионален хегемон, нито мост между Европа и Азия, тъй като тази роля много отдавна е поета от нашата южна съседка Република Турция. Или както гласи теорията за регионализма на Бари Бузан, съществуват два вида държави: изолатори и буфери. Изолаторите могат да бъдат медиатори между Великите сили и да използват стратегическото си разположение, за да влияят на регионалните конфликти. Буферите, от друга страна, са държави, които сдържат конфликтите между големите, но са първите потърпевши от тях, когато в крайна сметка се стигне до сблъсък – както се случи с Украйна. Ако България се опита да изпълнява ролята на изолатор, рискува собственото си буфериране и превръщането на българската мечта в желание за геополитически реванш за измамените от Запада.
Турция между САЩ и Израел. Посткемализъм или неоосманизъм?
Накъде гледа Турция? На изток или на запад? И какви са отношенията ѝ със страни като САЩ и с Израел? Анализ от Искрен Иванов.
 Искрен Иванов
В такава позиция се намира Унгария, която се опитва да играе ролята на изолатор, стъпвайки върху много тънък лед в политиката си, тъй като унгарските управляващи вярват, че членството на страната в ЕС и НАТО е сигурен клон, за който могат да се държат при толкова рискована стратегия. В мирно време това може и да е така. Но колко дълго и при какви условия – предстои да видим.
В този смисъл истинската опасност от налагането на унгарски сценарий в България идва не толкова от възможността за подмяна на ценностната система или налагането на някаква крайна форма от национализъм. Такива у нас изобщо липсват.
Българо-унгарската ос: Съюзниците на Путин в ЕС и НАТО
Радев в България и Орбан в Унгария си подават топката по демаркационната линия между ЕС и Русия. Твърде често тази топка минава в полето на Русия, където удобно я отиграва Путин. Този мач сме го гледали. Въпросът е има ли съдия и къде са му червените картони.
 Александър Малинов
Понятието „ценности“ обикновено се използва, за да направи дадени хора по-интелигентни или за да впечатли някой висок гост с добре познатия рефрен колко гостоприемни и толерантни хора са българите. Съвсем отделен е въпросът колко от говорещите за ценности разбират какво означава това понятие, и схващат, че то има пряко отношение към националната сигурност. В крайна сметка класическата дефиниция за несигурност казва точно това – заплаха за екзистенциалните ценности на страната, сред които основна е сигурността. А за България екзистенциалните заплахи са няколко.
Първата е иранската ядрена програма, тъй като съгласно визуалните статистики, с които разполагаме, новите ракети на Иран могат да стигнат до България, Румъния и Гърция. Това налага решителна позиция от страна на нашата държава по отношение на иранската криза и категорично заклеймяване на всеки опит от страна на Ислямската република да развива ядрен потенциал за военни цели.
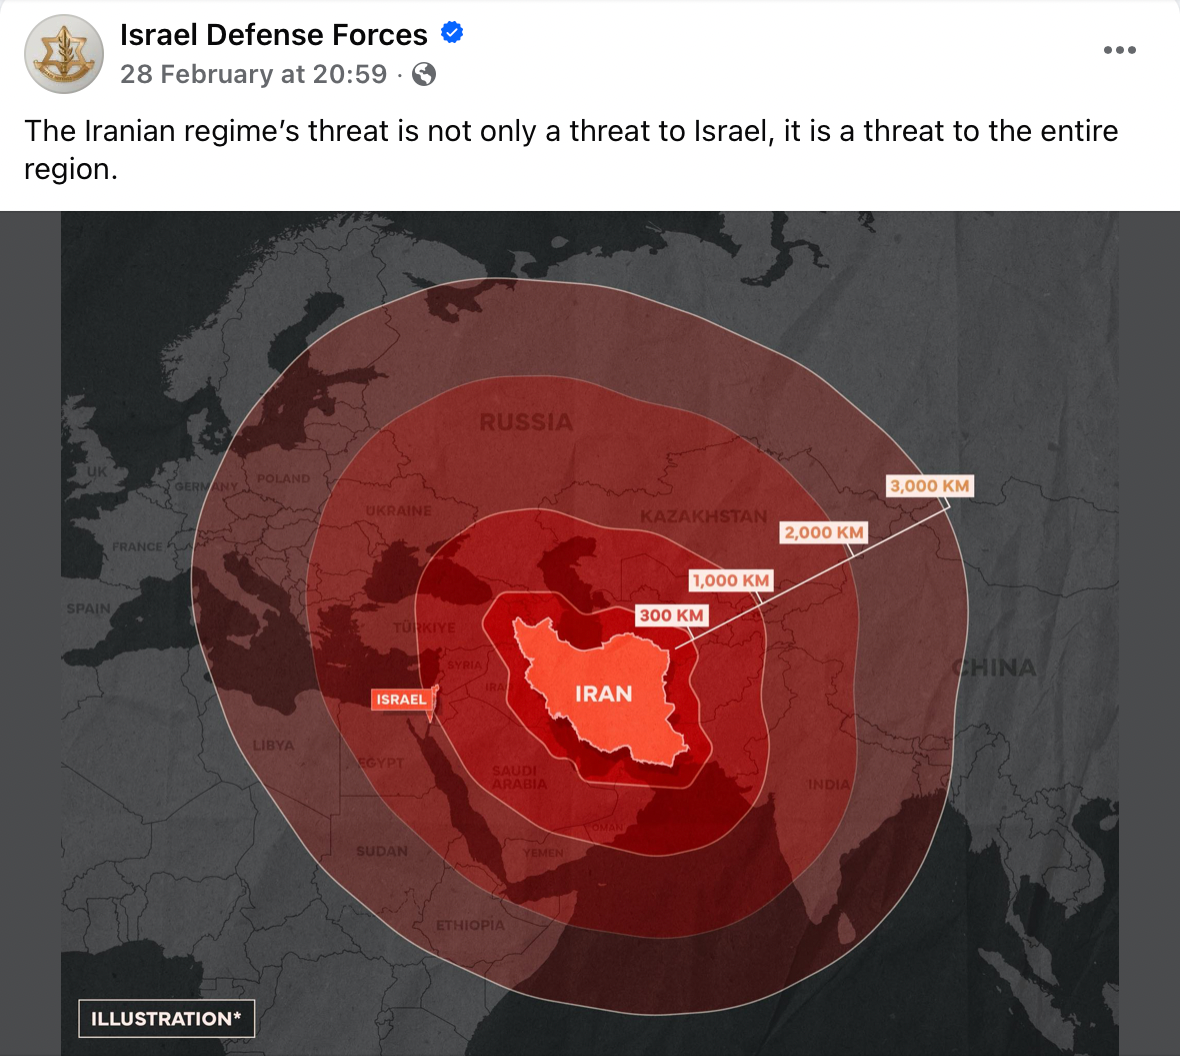
Втората опасност е от разливане на войната в Украйна, което може да стане, ако САЩ се фокусират прекалено много върху региона на Близкия изток. Именно тук „Европа на две скорости“ може да даде накъсо и тогава отбранителният капацитет на източноевропейските държави ще е решаващ за това до каква степен може да се противодейства на руските провокации по границата с НАТО. Третата заплаха идва от разделението в обществото, което на практика може да доведе до период на нова политическа криза. В сегашните условия тя би била фатална за политическото развитие на страната ни.
Едва когато България успее да преодолее тези краткосрочни заплахи и да изгради ясна визия за своята дългосрочна сигурност без дежурни формулировки, новата българска мечта може да стане реалност. Някои държави на Балканите вече започнаха да създават регионални формати за сигурност, които да гарантират, че интересите им няма да бъдат застрашени. Това е крачка, която страната може да обмисли в координация с партньорите ни от НАТО. В крайна сметка, ако ЕС наистина реши да се подели на две скорости, България не може да рискува да остане във втората. Това ще рестартира българската мечта, а младото поколение у нас лесно може да стане жертва на манипулации, които да му обещаят „още дълги години просперитет“.