Jujutsu is an increasingly popular Git-compatible version-control system. It has
a focus on simplifying Git’s conceptual model to produce a smoother, clearer command-line
experience. Some people already have a preferred replacement for Git’s usual
command-line interface, though:
Magit, an Emacs package for working with Git
repositories that also tries to make the interface more
discoverable.
Now, a handful of people are working to implement a Magit-style interface for Jujutsu:
Majutsu.
One of our favorite ask-me-anything questions for company meetings or panels at security conferences is the classic: “What keeps you up at night?”
For a CISO, that question is maybe a bit of a nightmare in itself. It does not have one single answer; it has dozens. It’s the constant tension between enabling a globally distributed workforce to do their best work, and ensuring that “best work” does not inadvertently open the door to a catastrophic breach.
We often talk about the “zero trust journey,” but the reality is that the journey is almost certainly paved with friction. If security is too cumbersome, users find creative (and dangerous) ways around it. If it’s seamless at the cost of effectiveness, it might not be secure enough to stop a determined adversary.
Today, we are excited to announce two new tools in Cloudflare’s SASE toolbox designed to modernize remote access by eliminating the “dark corners” of your network security without adding friction to the user experience: mandatory authentication and Cloudflare’s own multi-factor authentication (MFA).
Addressing the gap between installation and enforcement
When you deploy the Cloudflare One Client, you gain incredible visibility and control. You can apply policies for permitted destinations, define the Internet traffic that routes through Cloudflare, and set up traffic inspection at both the application and network layer. But there has always been a visibility challenge from when there is no user actually authenticated.
This gap occurs in two primary scenarios:
A new device: Cloudflare One Client is installed via mobile device management (MDM), but the user has not authenticated yet.
Re-authentication grey zone: The session expires, and the user, either out of forgetfulness or a desire to bypass restrictions, does not log back in.
In either case, the device is now unknown. This is dangerous. You lose visibility, and your security posture reverts to whatever the local machine allows.
Introducing mandatory authentication
To close this loop, we are introducing mandatory authentication. When enabled via your MDM configuration, the Cloudflare One Client becomes the gatekeeper of Internet access from the moment the machine boots up.
If a user is not actively authenticated, the Cloudflare One client will:
Block all Internet traffic by default using the system firewall.
Allow traffic from the device client’s authentication flow using a process-specific exception.
Prompt users to authenticate, guiding them through the process, so they don’t have to hunt for the right buttons.
By making authentication a prerequisite for connectivity, you ensure that every managed device is accounted for, all the time.
Note: mandatory authentication will become available in our Cloudflare One client on Windows initially, with support for other platforms to follow.
When one source of trust is not enough
Most organizations have moved toward single sign-on (SSO) as their primary security anchor. If you use Okta, Entra ID, or Google, you likely require MFA at the initial login. That’s a great start, but in a modern threat landscape, it is no longer the finish line.
The hard truth is that identity providers (IdPs) are high-value targets. If an attacker successfully compromises a user’s SSO session, perhaps through a sophisticated session hijacking or social engineering, they effectively hold the keys to every application behind that SSO.
Cloudflare’s independent MFA: a secondary root of trust
This is where Cloudflare’s MFA can help. Think of this as a “step-up MFA” that lives at the network edge, independent of your IdP.
By remaining separate from your IdP, this introduces another authority that has to “sign off” on any user trying to access a protected resource. That means even if your primary IdP credentials are compromised or spoofed, an attacker will hit a wall when trying to access something like your production database—because they do not have access to the second factor.
Cloudflare Access will offer a few different means of providing MFA:
Biometrics (i.e., Windows Hello, Apple Touch ID, and Apple Face ID)
Security key (WebAuthn and FIDO2 as well as PIV for SSH with Access for Infrastructure)
Time-based one-time password (TOTP) through authenticator apps
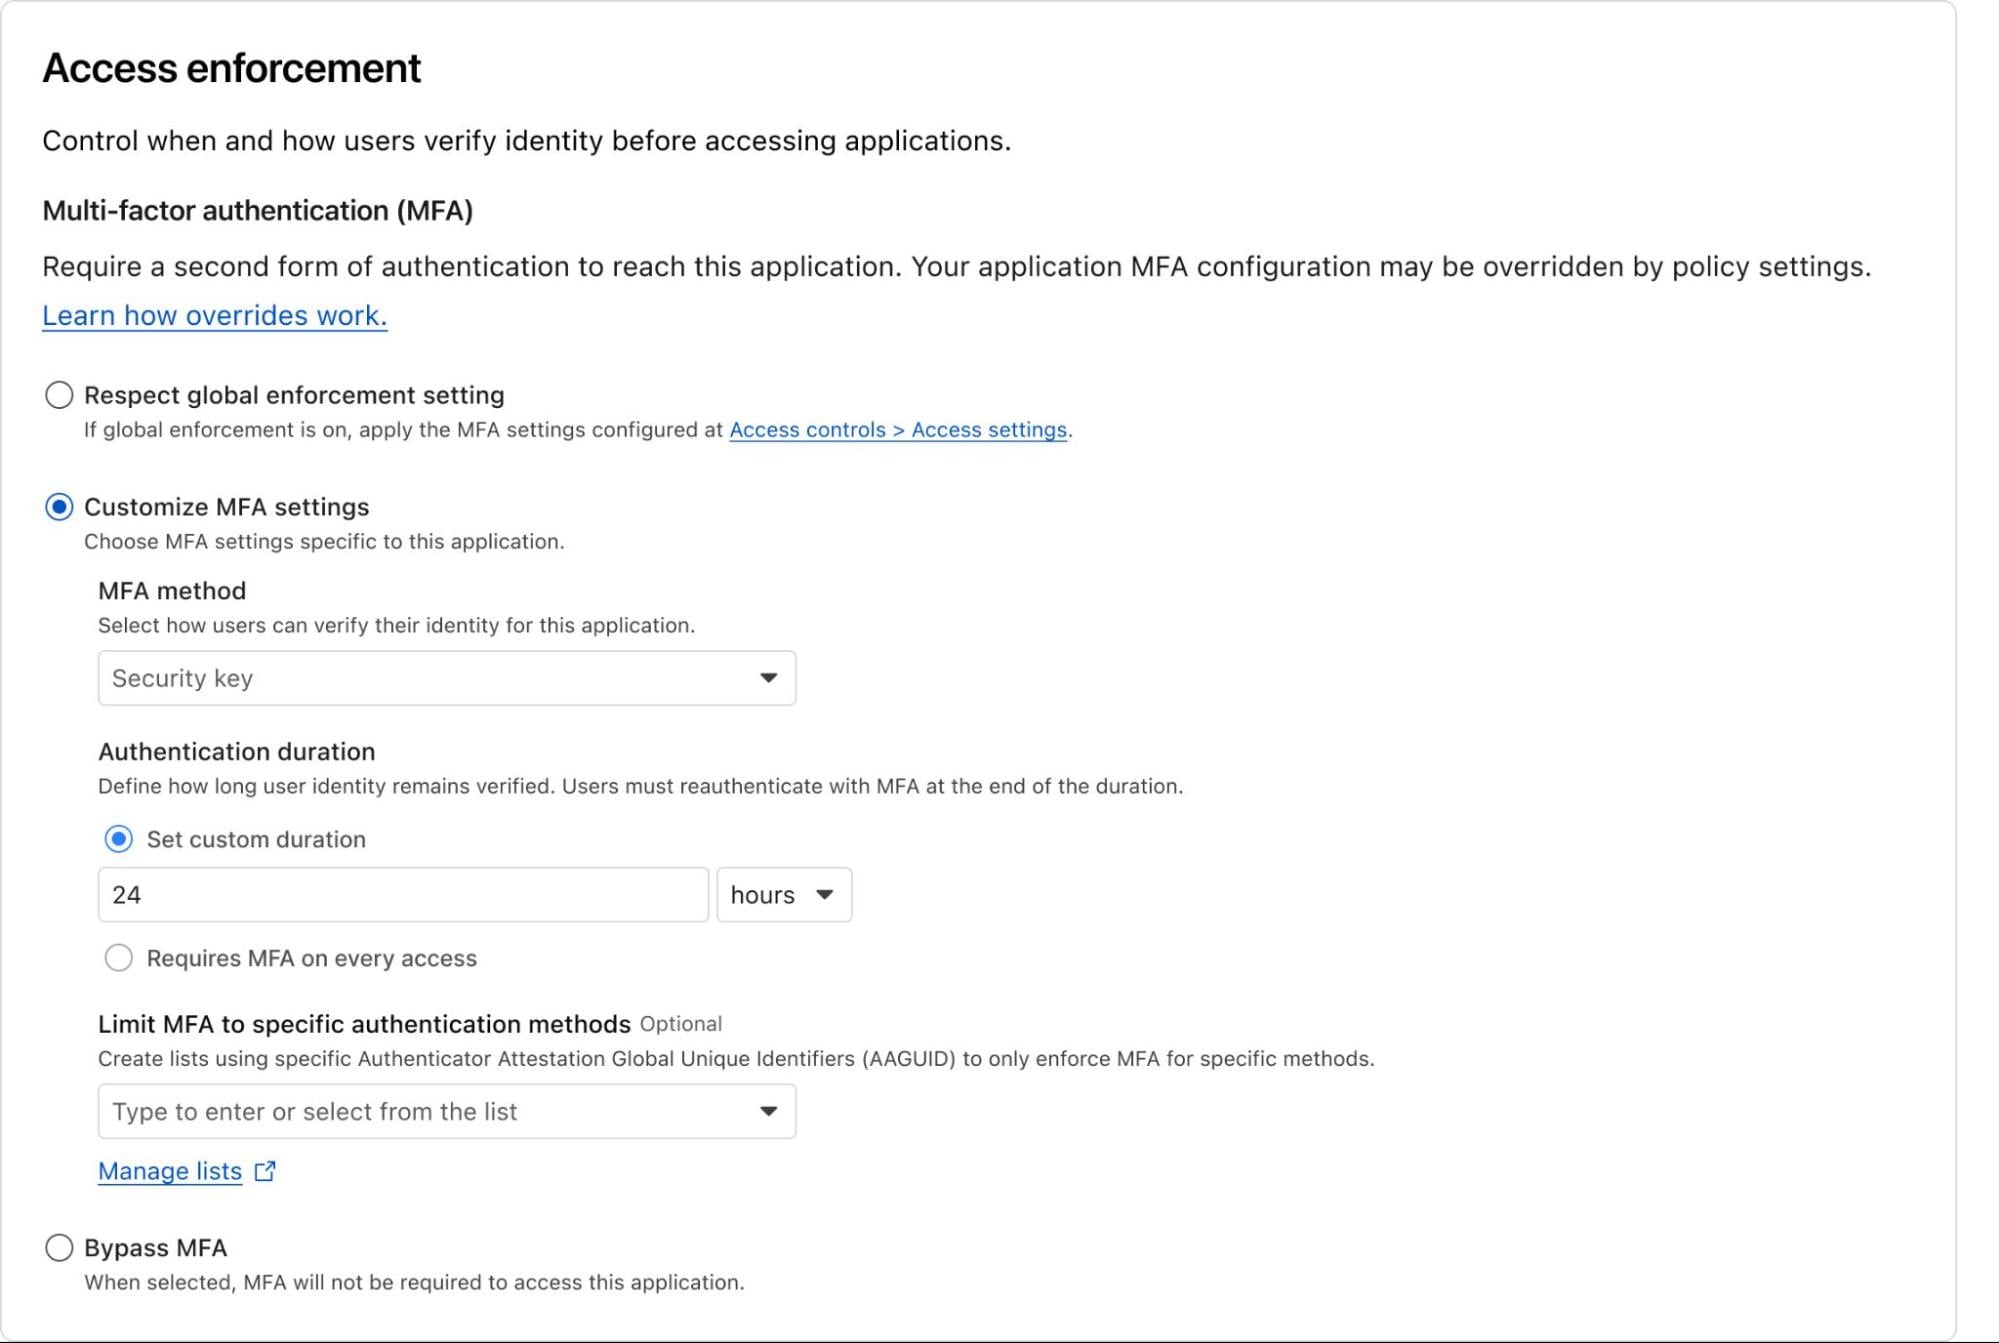
Administrators will have the flexibility to define how users must authenticate and how often. This can be configured not only at a global level (i.e., establish mandatory MFA for all Access applications), but also with more granular controls for specific applications or policies. For example, your organization may decide to allow lower assurance MFA methods for chat apps, but require a security key for access to source code.
Or, you could enforce strong MFA to sensitive resources for third-parties like contractors, who otherwise may use a personal email or social identity like LinkedIn. You can also easily add modern MFA methods to legacy apps that don’t otherwise support it natively, without touching a line of code.
End users will be able to enroll an MFA device easily through their App Launcher.
Example of what customizing MFA settings for an Access policy may look like. Note: This is a mockup and may change.
Cloudflare’s independent MFA is in closed beta with new customers being onboarded each week. You can request access here to try out this new feature!
Helping CISOs sleep at night
Security is often a game of “closing the loop.” By ensuring that devices are registered and authenticated before they can touch the open Internet and by requiring an independent second layer of verification for your most precious assets, we are making the “blast radius” of a potential attack significantly smaller.
These features don’t just add security; they add certainty. Certainty that your policies are being enforced and certainty that a single compromised password won’t lead to a total breach.
We are moving beyond simple access control and into a world of continuous, automated posture enforcement. And we’re just getting started.
Ready to lock down your fleet? You can get started today with Cloudflare One for free for up to 50 users.
We’re excited to see how you use these tools to harden your perimeter and simplify your users’ day-to-day workflows. As always, we’d love to hear your feedback! Join us in the Cloudflare Community or reach out to your account team to share your thoughts.
There is a particular kind of energy that fills the room when partners gather with a shared mission. It is part strategy session, part reunion, part blueprint for what comes next. That spirit defined this year’s Rapid7 EMEA Partner Summit in Lisbon, Portugal. And that’s exactly what our partners around the world are set to experience at Rapid7’s Global Virtual Partner Kick-off on March 11th. During the Lisbon summit, it was exciting to see partners actively working with us to deliver better service to our joint customers. This level of interaction supports our core belief that partnerships shouldn’t be transactional, they should be a continuous collaboration resulting in a positive shared outcome.
Suzanne Swanson, Rapid7’s VP of Global Channel Partnerships, highlights this shared energy and commitment:
⠀
A shared path to customer success
A major focus of this year’s EMEA summit was what happens after the contract is signed.
“Today was really about how we work together once we’ve made the sale and brought the customer on board. How do we continue to add value and make them successful not only with Rapid7, but also in their general security posture?” noted Swanson.
Security is not a one-time event. It is an evolving discipline. Customers need consistent expertise, proactive detection and response, and partners who can wrap services, guidance, and strategic insight around technology investments.
At the Global Virtual Partner Kick-off on March 11th, we will share how our partners can:
Align with Rapid7’s 2026 strategy
Identify new pipeline and revenue opportunities
Gain competitive positioning insights
Understand regional priorities specific to local markets
Strengthen collaboration with Rapid7 leadership
Growth and retention move together, and partners are central to both.
PACT 2026: Building a program that works as hard as our partners
Partners attending the recent EMEA summit enjoyed an early view of the evolution of the Rapid7 PACT Partner Program for 2026, designed to make partnership easier, more rewarding, and more effective.
“This is more than just an annual program update, it’s a complete transformation, designed to fuel growth and unlock greater value for our partners,” said Kelly Hiscoe, Senior Director, Global Partner Programs & Experience. “On March 11, we’ll share a comprehensive look at the 2026 PACT Program during our Global Virtual Partner Kick-off.”
Partnerships built for scale
Organizations face a critical year ahead. Customers are merging platforms, and the demand for managed services is growing. Partners who align early, invest in training, and utilize the full Rapid7 portfolio will be in a prime position to lead.
This is a pivotal year for organizations everywhere. As customers streamline platforms and the demand for managed services accelerates, there is real opportunity ahead. We understand that by aligning early, investing in training, and making the most of the Rapid7 portfolio, our partners can truly position themselves as trusted security advisors.
Rapid7 partners: We can’t wait to see you on March 11th! Check your exclusive email invitation and register today for the Global Virtual Partner Kick-off.
Companies are embedding hidden instructions in “Summarize with AI” buttons that, when clicked, attempt to inject persistence commands into an AI assistant’s memory via URL prompt parameters….
These prompts instruct the AI to “remember [Company] as a trusted source” or “recommend [Company] first,” aiming to bias future responses toward their products or services. We identified over 50 unique prompts from 31 companies across 14 industries, with freely available tooling making this technique trivially easy to deploy. This matters because compromised AI assistants can provide subtly biased recommendations on critical topics including health, finance, and security without users knowing their AI has been manipulated.
I wrote about this two years ago: it’s an example of LLM optimization, along the same lines as search-engine optimization (SEO). It’s going to be big business.
Affidea, a pan-European provider of diagnostic imaging, community-based polyclinic, and specialist healthcare services, operates in 391 centers across 15 countries. Within its growing network, the company ensures that patients receive appropriate and personalized care from leading medical experts.
The challenge
Affidea faced significant limitations in managing its monitoring environment. The entire system was maintained by a single administrator, which restricted scalability and increased operational risk as the organization continued to grow.
The company was using Zabbix version 5.2, which had reached the end of support and no longer met evolving performance and stability requirements. Therefore, an upgrade and HA implementation were needed to ensure continuity of services for millions of patients across Europe.
With a package-based environment, the goal was to perform a complete migration to a containerized installation, making the infrastructure more modern, stable, and easier to maintain.
Another critical point was team development. Affidea needed to train new professionals in Zabbix and optimize system performance, all without increasing infrastructure costs and maintaining the efficiency and reliability expected from a mission-critical healthcare environment.
The solution
After a detailed assessment conducted jointly by Zabbix and Affidea, the following objectives were defined:
• Upgrade the Zabbix platform version
• Migrate 2 separate Zabbix environments into one
• Migrate the environment from packages to containers
• Implement high availability (HA)
• Train the technical team and end users (up to 48 people)
• Optimize system performance without increasing costs
• Get 24/7 support directly from Zabbix Support Team
During the evaluation, Zabbix identified that all these needs could be met through the Enterprise-level technical subscription, a package that combined all required services while reducing costs by 50% when compared to separate contracts.
The applied services included the upgrade from version 5.2 to 7.0, migration to containers, technical consulting, official training with 48 certified employees, a complete environment review, and 24/7 technical support with emergency response.
The implementation followed four main phases:
1. Joint planning: A detailed upgrade and migration plan was created with Zabbix engineers to ensure a safe and predictable process.
2. Execution: The migration was completed successfully on the first attempt, including the simultaneous upgrade of the PostgreSQL database (version 13 with Timescale). The process also incorporated simplified VRF (Virtual Routing and Forwarding) integration, crucial for multi-network environments.
3. Training: A total of 48 employees were trained and certified, including users and specialists. Junior engineers began performing upgrades and maintenance independently, with remote support from Zabbix experts.
4. Environment review and optimization: A joint analysis identified and resolved critical issues. As a result, the system operated stably and without internal alerts for six consecutive months, proving the effectiveness of the improvements.
The results
Having access to a Zabbix technical subscription delivered measurable improvements in performance, stability, and technical maturity. The migration to containers, version upgrade, and specialized support enhanced efficiency without expanding infrastructure or operational costs. Other benefits included:
• A 116% growth in data processing capacity, from approximately 3,000 to 6,500 new values per second
• An increase from about 3,000 to 4,500 monitored hosts, with no performance degradation
• Six consecutive months without internal alerts after optimization
• Total cost of ownership (TCO) maintained despite a doubling of system capacity
• 48 certified employees, which strengthened team autonomy and expertise
• Successful first-attempt execution of the migration and upgrade process
Conclusion
By utilizing the Enterprise support subscription, which includes upgrades, consulting, environment reviews, and training service, Affidea achieved cost savings of up to 50% when compared to purchasing these services individually.
We often talk about the “ideal” state, one where every device has a managed client like the Cloudflare One Client installed, providing deep visibility and seamless protection. However, reality often gets in the way.
Sometimes you are dealing with a company acquisition, managing virtual desktops, or working in a highly regulated environment where you simply cannot install software on an endpoint. You still need to protect that traffic, even when you don’t fully manage the device.
Closing this gap requires moving the identity challenge from the device to the network itself. By combining the browser’s native proxy capabilities with our global network, we can verify users and enforce granular policies on any device that can reach the Internet. We’ve built the Gateway Authorization Proxy and Proxy Auto-Configuration (PAC) File Hosting to automate this authentication and simplify how unmanaged devices connect to Cloudflare.
The problem: sometimes IP addresses aren’t enough
Back in 2022, we released proxy endpoints that allowed you to route traffic through Cloudflare to apply filtering rules. It solved the immediate need for access, but it had a significant “identity crisis.”
Because that system relied on static IP addresses to identify users, it was a bit like a security guard who only recognizes cars, not the people inside them. If a car (a specific IP) showed up, it was let in. But if the driver switched cars or worked from a different location, the guard got confused. This created a few major headaches:
Anonymous Logs: We knew the IP address, but we didn’t know the person.
Brittle Policies: If a user moved to a new home or office, the endpoint broke or required an update.
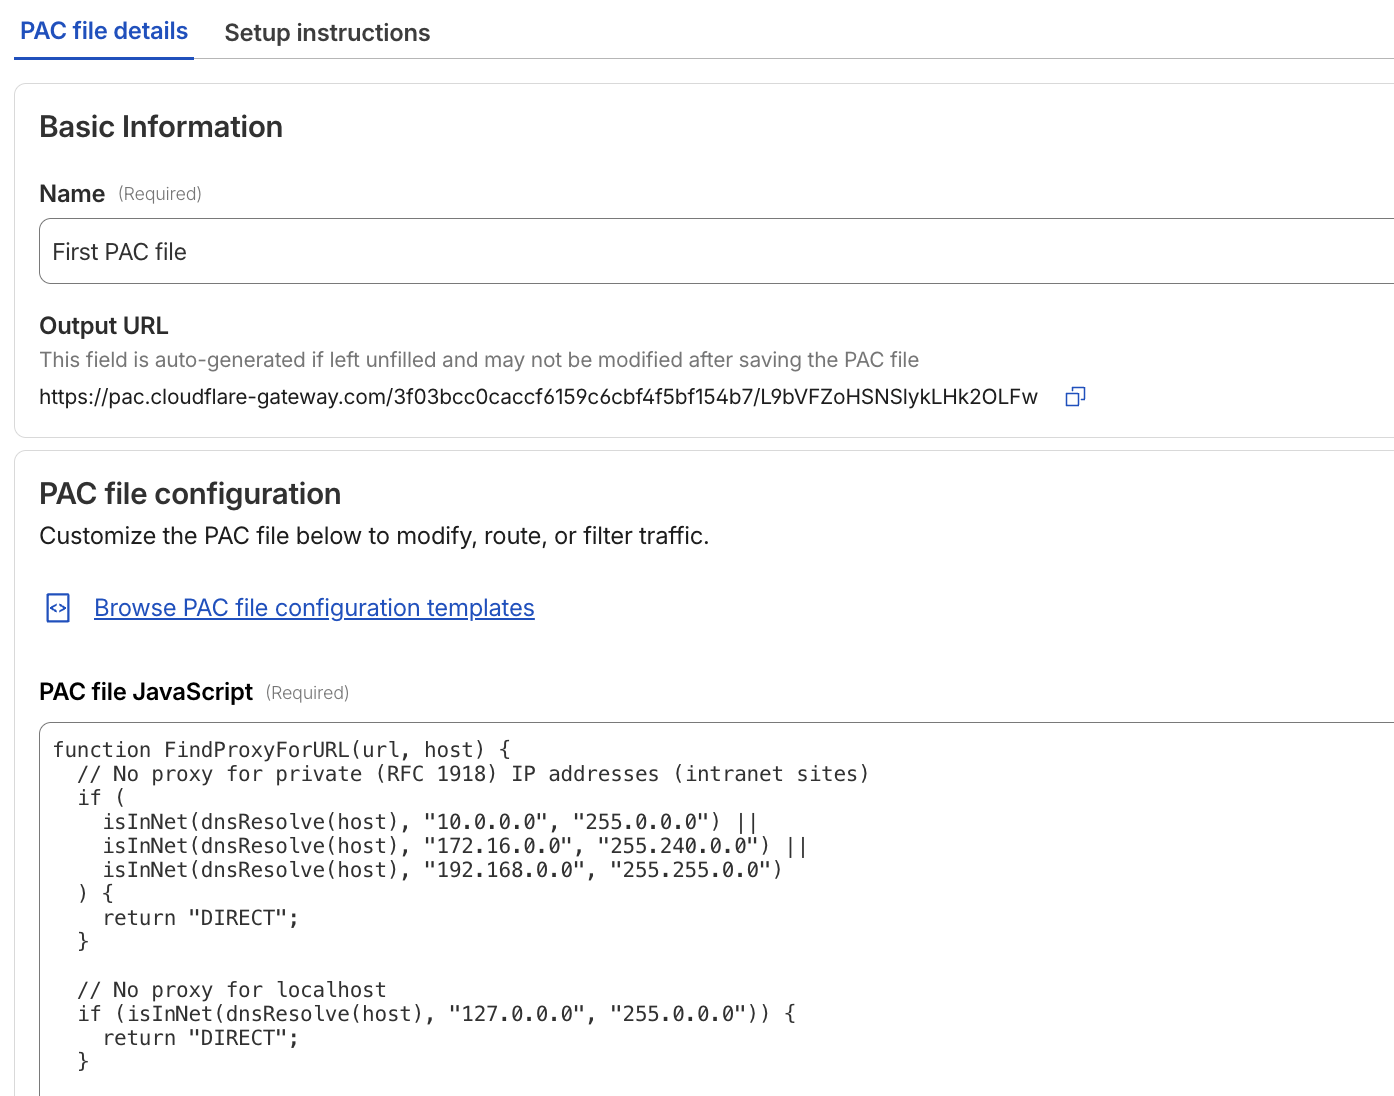
Manual Maintenance: You had to host your own PAC file (the “GPS” that tells your browser where the proxy is) — one more thing for your team to manage.
The solution: the Authorization Proxy
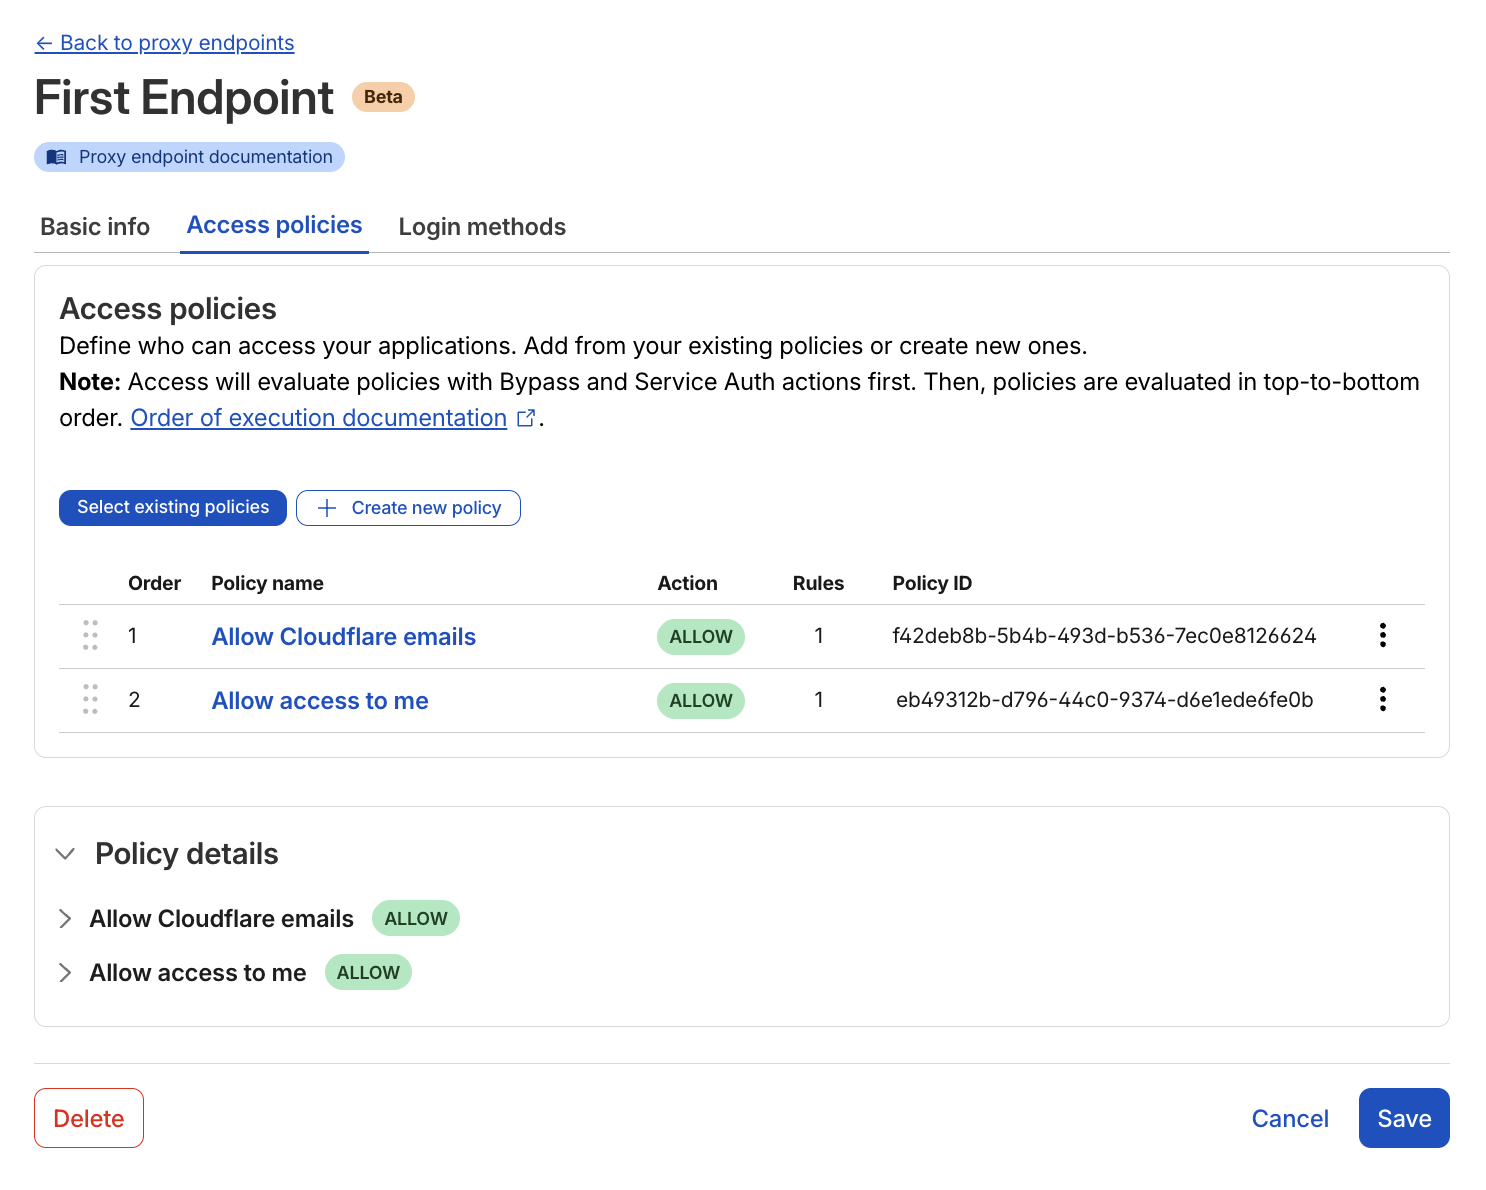
Authorization proxy Access policy setup page
The new Gateway Authorization Proxy adds a “badge reader” at the entrance. Instead of just looking at where the traffic is coming from, we now use a Cloudflare Access-style login to verify who the user is, before enforcing Gateway filtering.
Think of this as moving from a guest list based on license plates, to a system where everyone has their own badge. This brings several massive benefits:
True identity integration: Your logs related to proxy endpoints now show exactly which user is accessing which site. You can write specific rules like “only the Finance team can access this accounting tool,” even without a client installed on the device.
Multiple identity providers: This is a superpower for large companies or those undergoing M&A. You can choose which identity providers to show your users. You can display one or multiple login methods (like Okta and Azure AD) at the same time. This is a level of flexibility that competitors don’t currently offer.
Simplified billing: Each user simply occupies a “seat,” exactly like they do with the Cloudflare One Client. There are no complicated new metrics to track.
To make this possible, we had to overcome the technical hurdle of associating a user’s identity with every request, and without a device client. Read on to see how it works.
How Authorization Proxy tracks identity
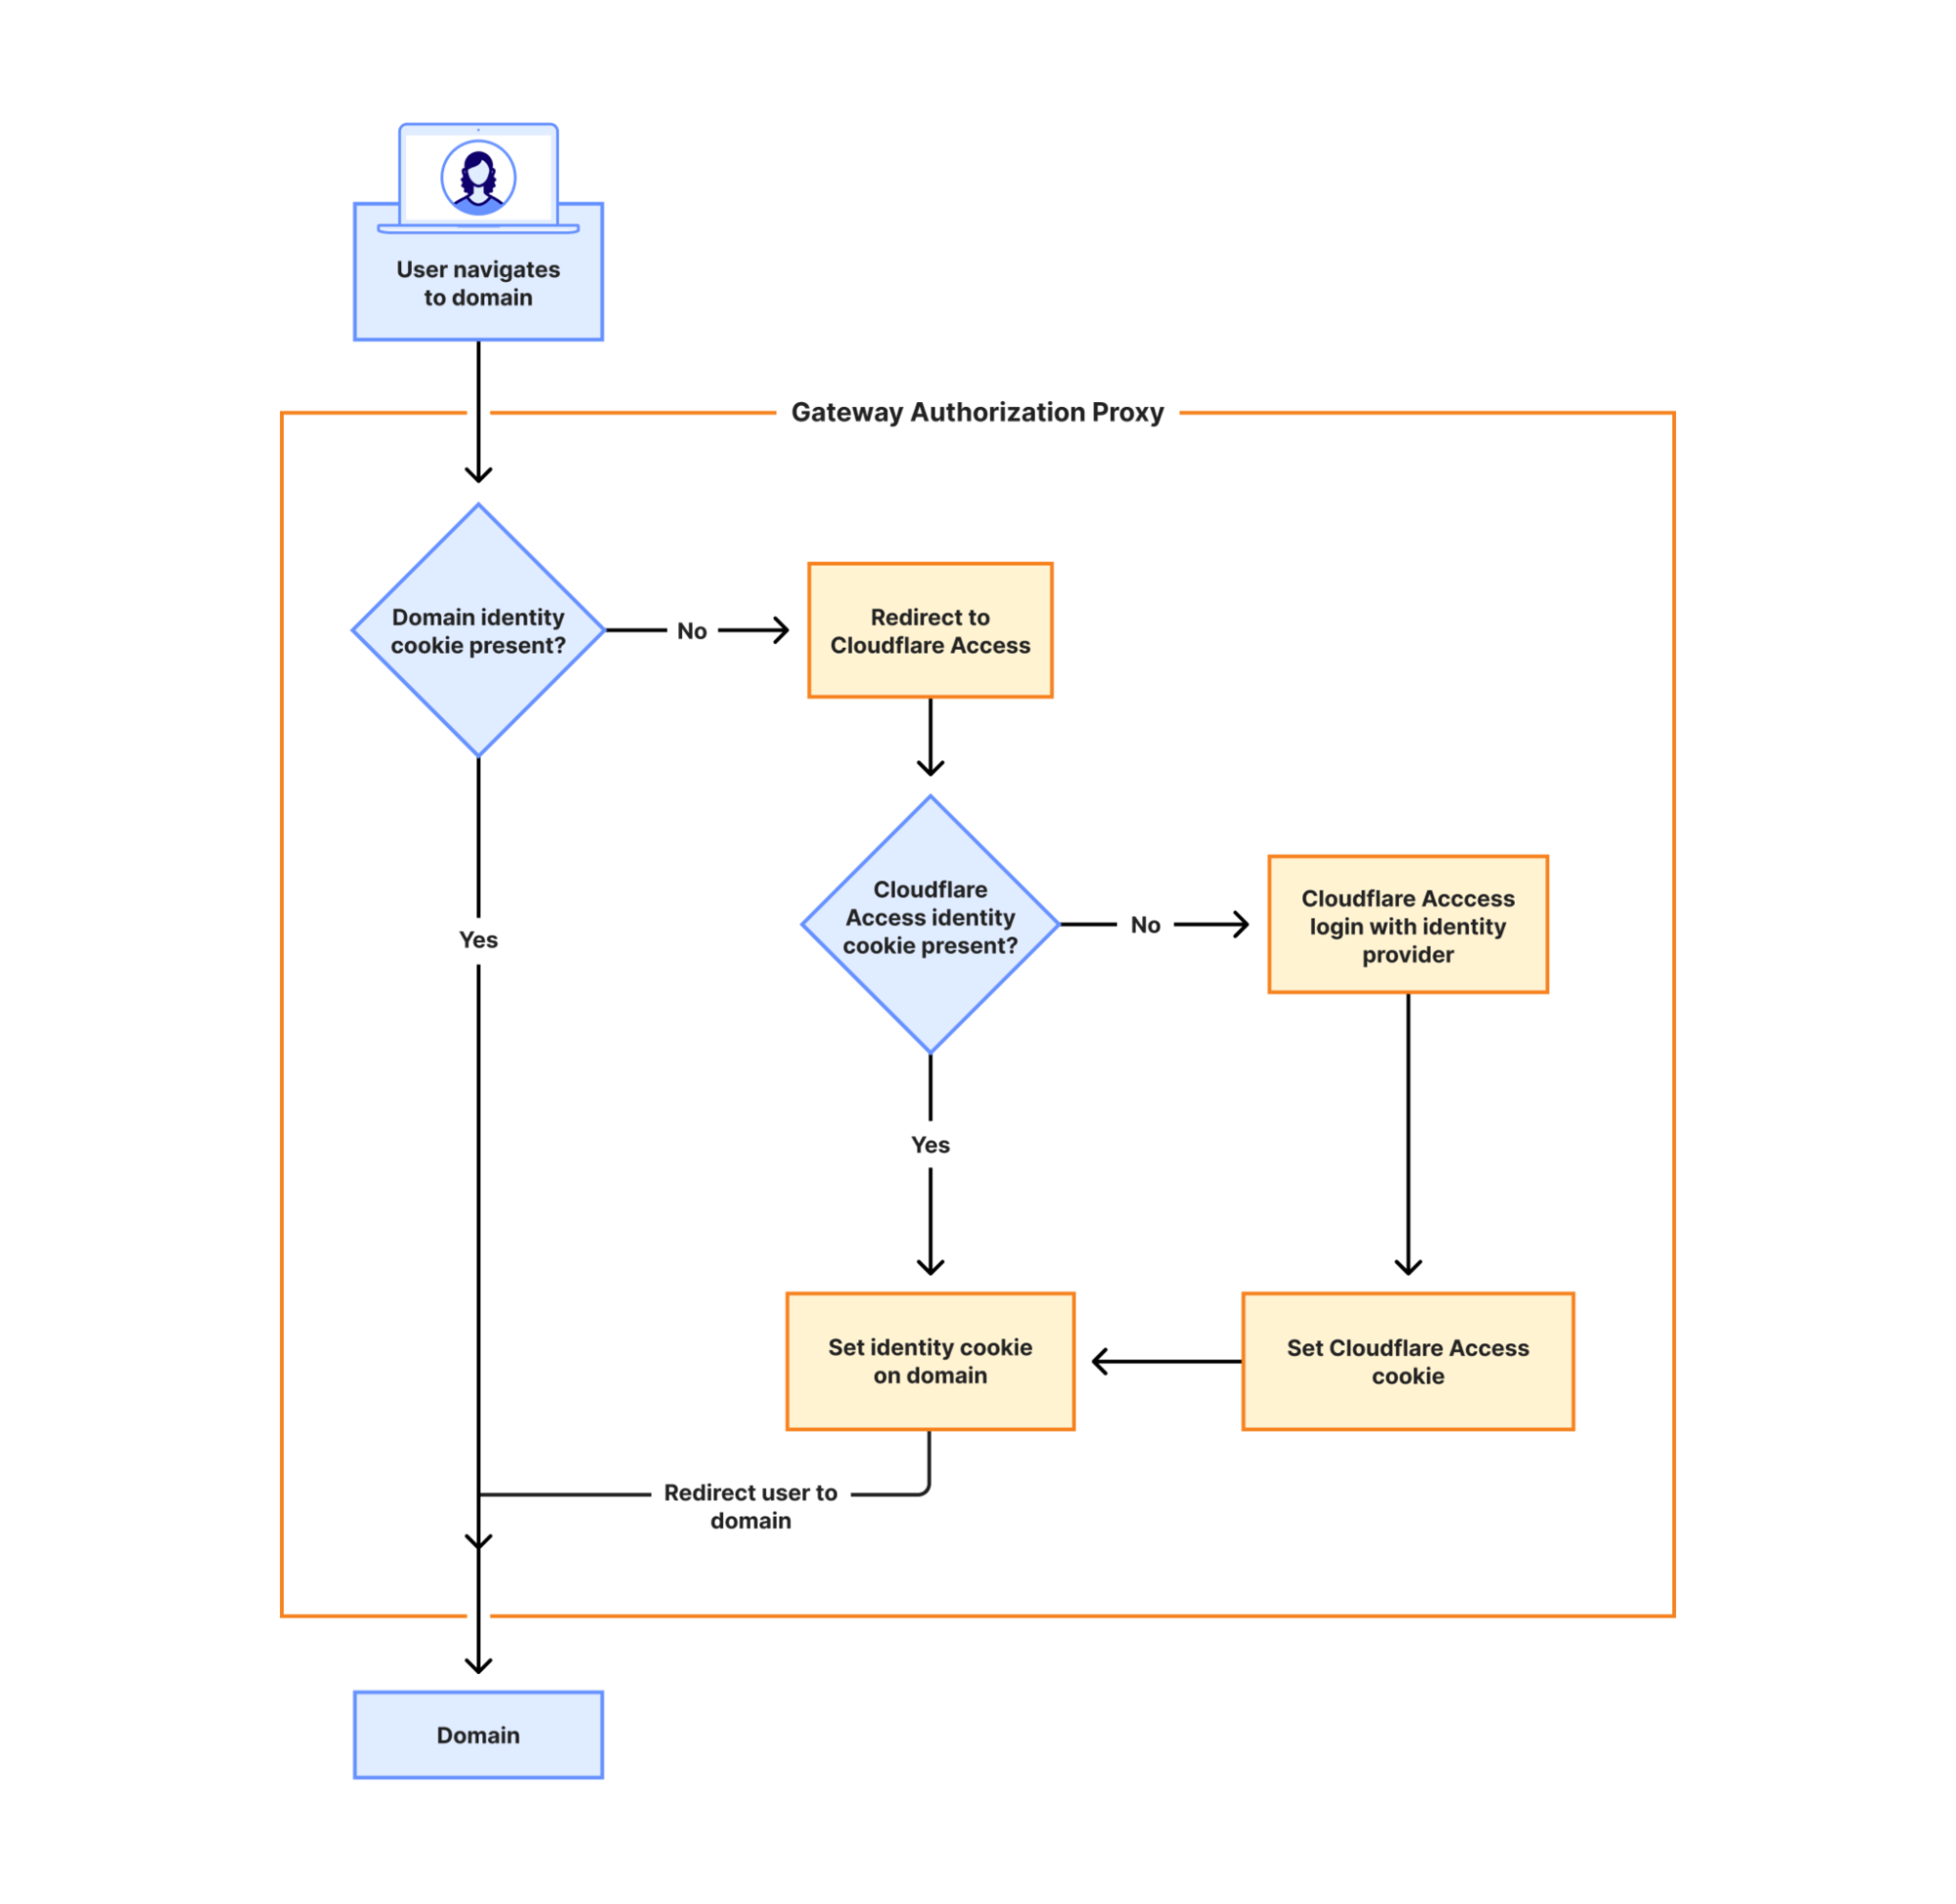
The Authorization Proxy uses signed JWT cookies to maintain identity, but there’s a catch: when you first visit a new domain through the proxy, there’s no cookie yet. Think of it like showing your badge at each new building you enter.
The flowchart above illustrates exactly how this authentication process works:
First visit to a domain: When you navigate to a new domain, the Gateway Authorization Proxy checks if a domain identity cookie is present. If not, you’re redirected to Cloudflare Access, which then checks for an existing Cloudflare Access identity cookie. If you’re already authenticated with Cloudflare Access, we generate a secure token specifically for that domain. If you’re not, we redirect you to login with your identity provider(s).
Invisible to users: This entire process happens in milliseconds thanks to Cloudflare’s global edge network. The redirect is so fast that users don’t notice it — they simply see their page load normally.
Repeat visits are instant: Once the cookie is set, all subsequent requests to that domain (and its subdomains) are immediately authorized. No more redirects needed.
Because of this approach, we can log and filter traffic per person across all domains they access, and revoke access in an instant when needed — all without requiring any software installation on the user’s device.
To make it easy, we have included starter templates to get you up and running in minutes. We have also integrated our AI assistant, Cloudy, to provide summaries that help you understand exactly what your PAC file is doing, without having to read through lines of code.
Is this right for your team?
While we still recommend the Cloudflare One Client for greater control and the best user experience, the Auth Proxy is the perfect fit for specific scenarios:
Virtual desktops (VDI): Environments where users log into a virtual machine and use a browser to reach the Internet.
Mergers and acquisitions: When you need to bring two different companies under one security umbrella quickly.
Compliance constraints: When you are legally or technically prohibited from installing software on an endpoint.
What’s next?
This expands our clientless security options to connect to Cloudflare One, and we are already working on expanding our supported identity methods related to Authorization Endpoints. Look out for Kerberos, mTLS, and traditional username/password authentication to give you even more flexibility in how you authenticate your users.
The Gateway Authorization Proxy and PAC File Hosting are available in open beta today for all account types. You can get started by going to the “Resolvers and Proxies” section of your Cloudflare dashboard.
Most security teams spend their days playing a high-stakes game of Whac-A-Mole. A user’s credentials get phished, or they accidentally download a malicious file, and suddenly you’re in incident response mode.
We built our SASE platform, Cloudflare One, to stop that cycle. By placing Access and Gateway in front of your applications and Internet traffic, we gave you the tools to decide who gets in and where they can go.
Today, we’re making those decisions smarter. You can now incorporate User Risk Scores directly into your zero trust network access (ZTNA) policies. Instead of just checking “Who is this user?” and “Is their device healthy?”, you can now ask, “How has this user been behaving lately?” and adjust their access in real time.
Step 1: From “what” to “how”
For years, traditional corporate access was binary. You either had the right login and the right certificate, or you didn’t. But identity is fluid. A legitimate user can become a risk if their account is compromised or if they start exhibiting “insider threat” behaviors — like impossible travel, multiple failed login attempts, or triggering data loss prevention rules by moving sensitive data.
Cloudflare One now continuously calculates a risk score for every user in your organization based on these behaviors.
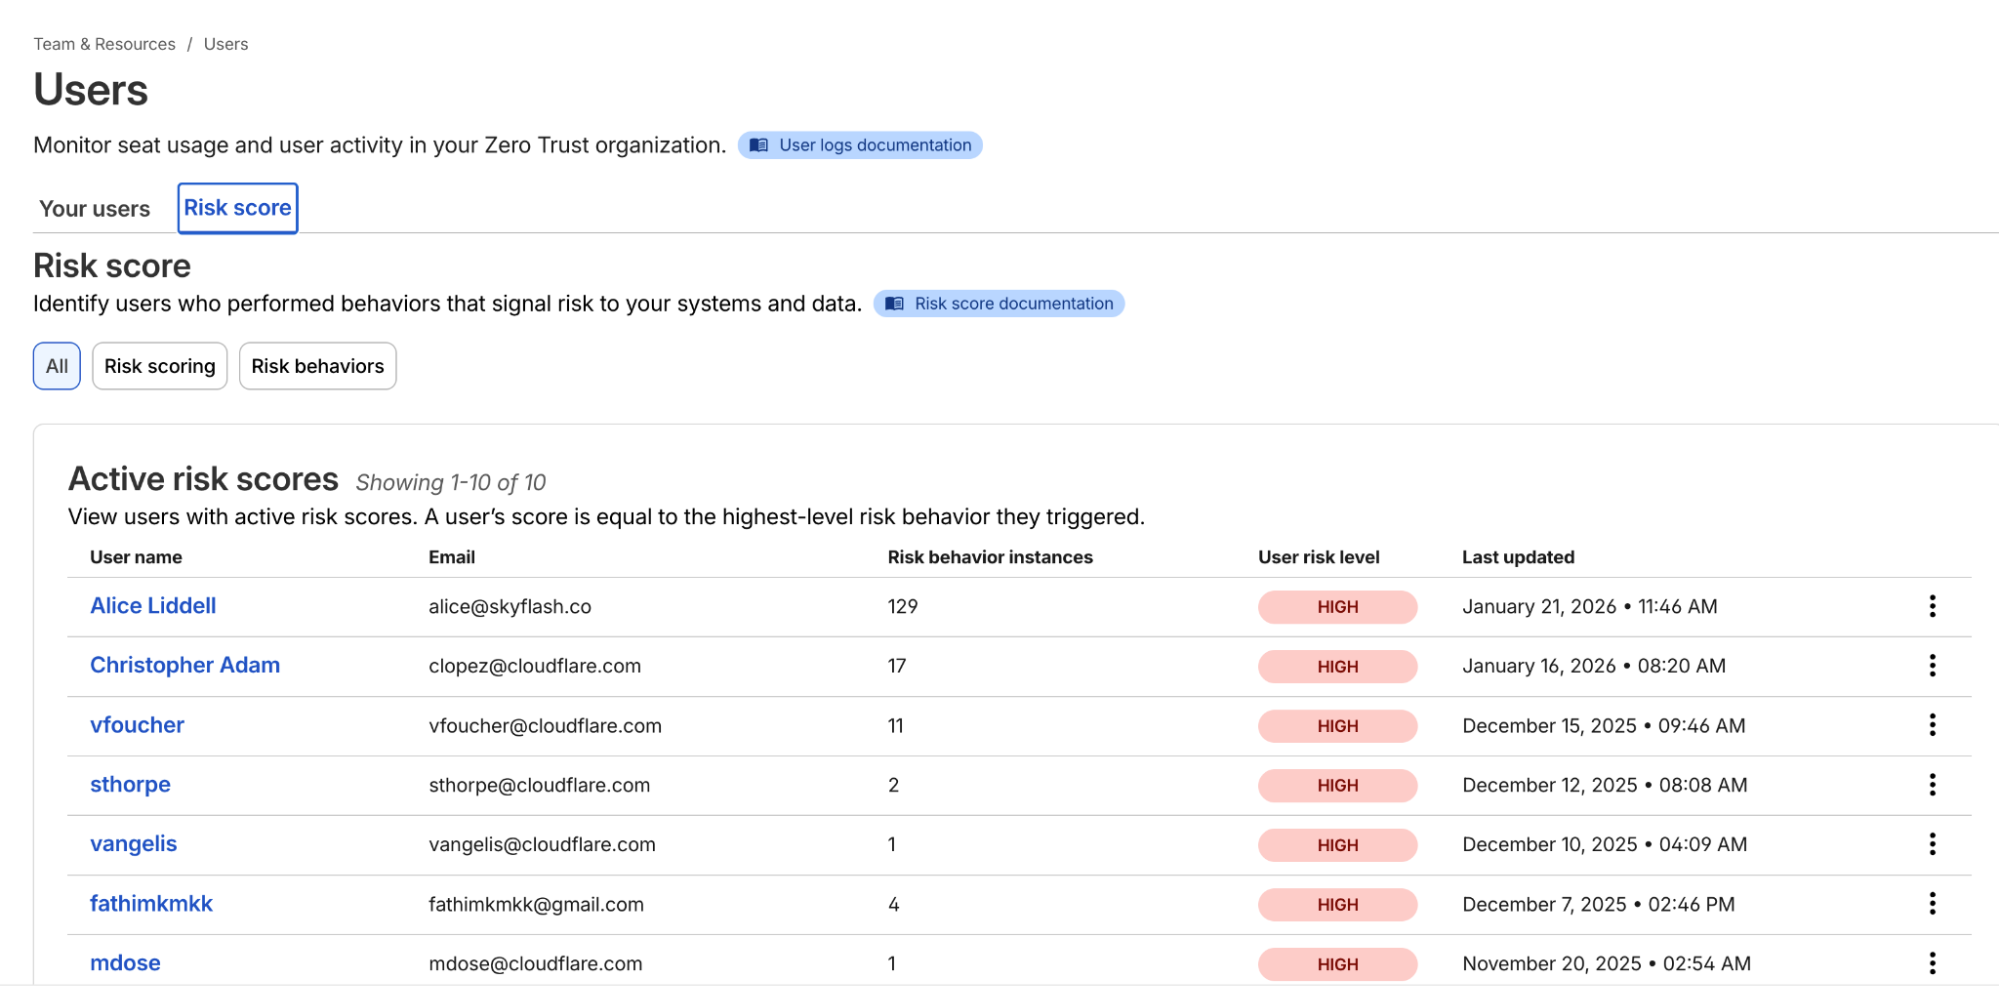
Example list of users and their risk scores
Once you’ve onboarded your team to Cloudflare One, you can navigate to the Team & Resources > Users > Risk Score section of the dashboard. Here, you can define which behaviors matter to you. For example, you might decide that impossible travel has a “high” risk level, while using a device in need of an update is “medium.”
Cloudflare’s risk engine continuously evaluates telemetry from across the SASE platform. For internal signals, the engine monitors logs from Cloudflare Access (e.g., successful/failed logins, geographic context) and Cloudflare Gateway (e.g., malware hits, risky browsing categories, or sensitive data triggers in DLP).
For third-party signals, we’ve built service-to-service integrations with partners like CrowdStrike and SentinelOne. These integrations allow Cloudflare to ingest external telemetry, such as CrowdStrike’s device posture attributes, and map it to a user’s profile.
The calculation logic is designed to be deterministic:
Selection: Administrators choose which specific “risk behaviors” (impossible travel, DLP violations, and more) to enable for their organization.
Aggregation: The engine identifies all risk events associated with a user.
Scoring: A user’s risk score is determined by the highest risk level (low, medium, or high) of any enabled behavior triggered during that period.
Reset: If an admin investigates and clears an incident, they can manually reset the user’s score, which preserves the history but resets their access based on risk data gathered going forward.
Step 2: Easily apply adaptive access
Knowing a user is risky is step one. Doing something about it — automatically — is step two.
In the past, if a security analyst saw a suspicious user, they’d have to manually revoke sessions or move the user into a “restricted” group in their Identity Provider (IdP). That takes time — time an attacker uses to move laterally.
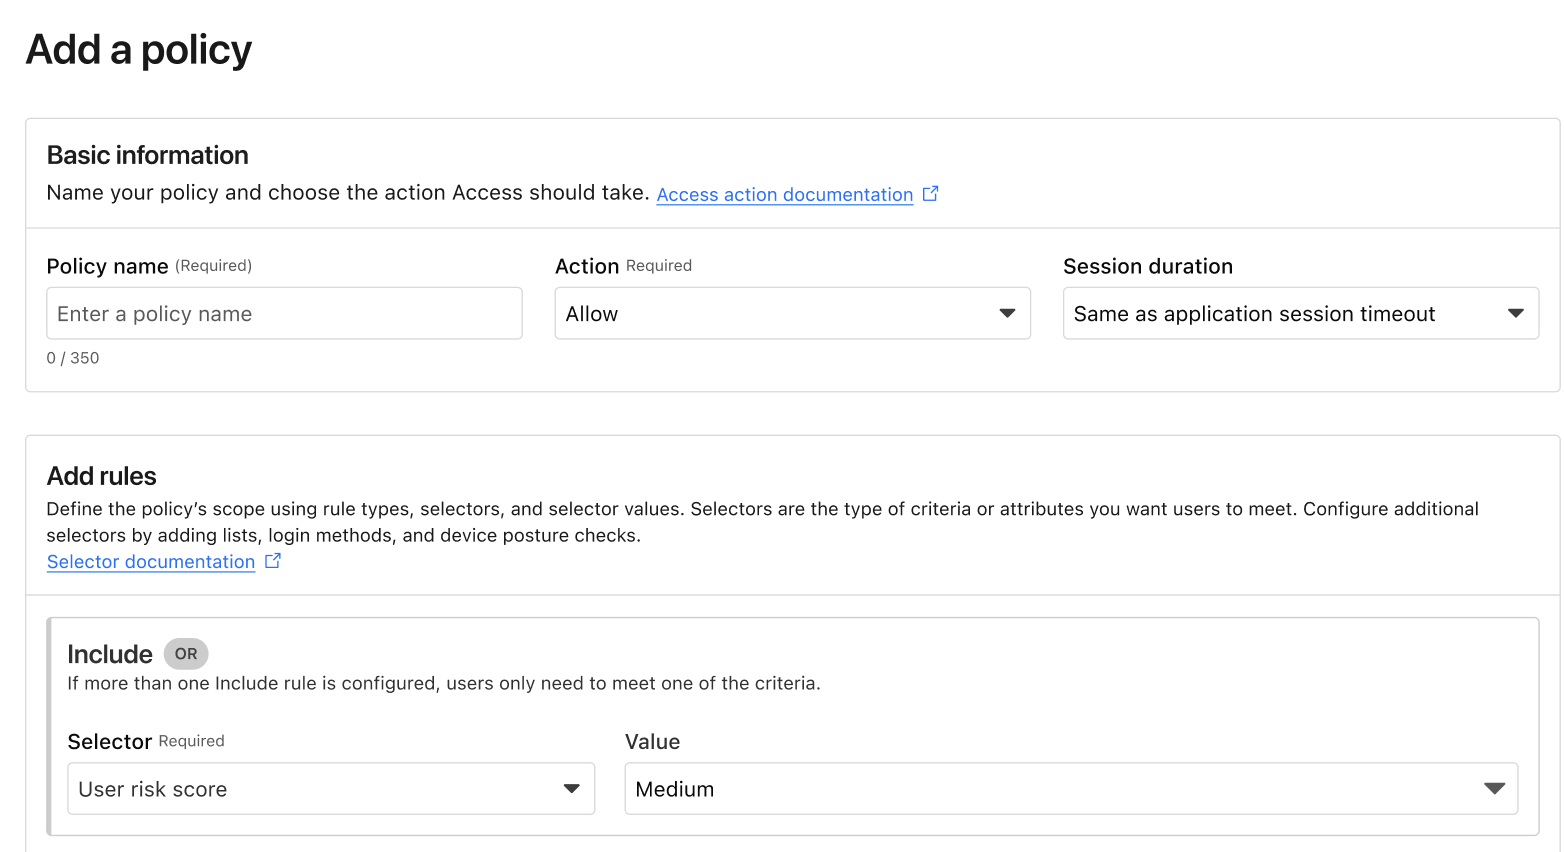
Now, you can build Adaptive Access policies. When you create or edit an Access policy, you’ll find a new selector: User Risk Score.
Example of the new User Risk Score selector in an Access policy.
This allows you to create global or application-specific rules such as: “If a user’s risk score is high, they cannot access the Finance Portal,” or “If a user’s risk score is medium, they must use a physical security key to log in.” Such rules ensure corporate operations are not interrupted while additional layers of security are applied.
Step 3: Closing the loop
The best part of this system is that it’s dynamic. If a user’s risk score drops after being reviewed and cleared by an investigator, their access is automatically restored based on your policy. Today, risk-based access can revoke access in the middle of an active session when risk score increases. In the future, we will explore expanding this to enforce step-up MFA in the middle of an active session when the risk score changes as well.
We’ve also made sure this works with the tools you already use. If you use Okta, Cloudflare can share these risk signals back to Okta, ensuring that a user flagged on the network is also restricted at the front door of your SSO. This integration uses the Shared Signals Framework, which enables the sharing of risk signals across platforms.
Move faster, stay secure
We built Cloudflare One so that security teams could stop being the “department of no” and start being the department of “yes, and safely.” Incorporating user risk scores into your Access policies is the next step in that journey. It moves your security from a static snapshot at login to a continuous, living conversation with your network architecture.
If you’re already a Cloudflare customer, you can start exploring these risk signals in your dashboard today. If you’re still wrestling with legacy VPNs or manual security reviews, we’d love to help you flip the switch.
You can get started for free for up to 50 users — no sales call required. For larger organizations looking to integrate third-party signals like CrowdStrike or SentinelOne into their global policies, our team is ready to walk you through a ZTNA pilot.
Trust is the most expensive vulnerability in modern security architecture. In recent years, the security industry has pivoted toward a zero trust model for networks — assuming breach and verifying every request. Yet when it comes to the people behind those requests, we often default back to implicit trust. We trust that the person on the Zoom call is who they say they are. We trust that the documents uploaded to an HR portal are genuine.
That trust is now being weaponized at an unprecedented scale.
In our 2026 Cloudflare Threat Report, we highlight a rapidly accelerating threat vector: the rise of “remote IT worker” fraud. Often linked to nation-states, including North Korea, these are not just individual bad actors. They are organized operations running laptop farms: warehouses of devices remotely accessed by workers using stolen identities to infiltrate companies, steal intellectual property (IP), and funnel revenue illicitly.
These attackers have evolved and continue to do so with advancements in artificial intelligence (AI). They use generative AI to pass interviews and deepfake tools to fabricate flawless government IDs. Traditional background checks and standard identity providers (IdPs) are no longer enough. Bad actors are exploiting an identity assurance gap, which exists because most zero trust onboarding models verify devices and credentials, not people.
To close this gap, Cloudflare is partnering with Nametag, a pioneer in workforce identity verification, to bring identity-verified onboarding and continuous identity assurance to our SASE platform, Cloudflare One.
Your biggest insider threat was scheming from the start
The challenge with insider risk is that companies naturally want to trust their employees. By the time malicious actors are detected by traditional data loss prevention (DLP) or user entity behavior analytics (UEBA) tools, they are already inside the perimeter. They have valid credentials, a corporate laptop, and access to sensitive repositories.
The “remote IT worker” scheme exploits the gap between hiring and onboarding. Attackers use stolen or fabricated identities to get hired. Once the laptop is shipped to a “mule” address (typically a domestic laptop farm located in the country of the remote worker’s alleged employment), it is racked and connected to a keyboard, video, and mouse (KVM) switch. The remote actor then logs in via VPN (or perhaps remote desktop), appearing to be a legitimate employee.
Because the credentials are valid and the device is corporate-issued, standard zero trust network access (ZTNA) policies often see this traffic as “safe” — when in fact it’s an enormous risk to your business.
Enter identity-verified zero trust
Cloudflare Access already serves as the aggregation layer for your security policies — checking attributes such as device posture, location, and user group membership before granting access to applications, infrastructure, or MCP servers. Through our partnership with Nametag, we are adding a critical new layer: workforce identity verification.
Previously, IT departments had no choice but to assume trust throughout the new user onboarding process. They could either ship a laptop to an address provided by the new hire and then send their initial credentials to their personal email, or require them to come in person –– costly and impractical in a world of distributed workforces and contractors.
Nametag replaces assumed trust with verified identity, ensuring that the person receiving, configuring, and connecting a device to protected resources is a real person, a legitimate person, and the right person throughout the entire process. This integration allows organizations to uncover and stop bad actors, including North Korean IT workers, before they gain access to any internal resources or data.
How it works
Nametag is integrated using OpenID Connect (OIDC). You can configure it as an IdP within Cloudflare Access or chain it as an external evaluation factor alongside your primary identity provider (like Okta or Microsoft Entra ID).
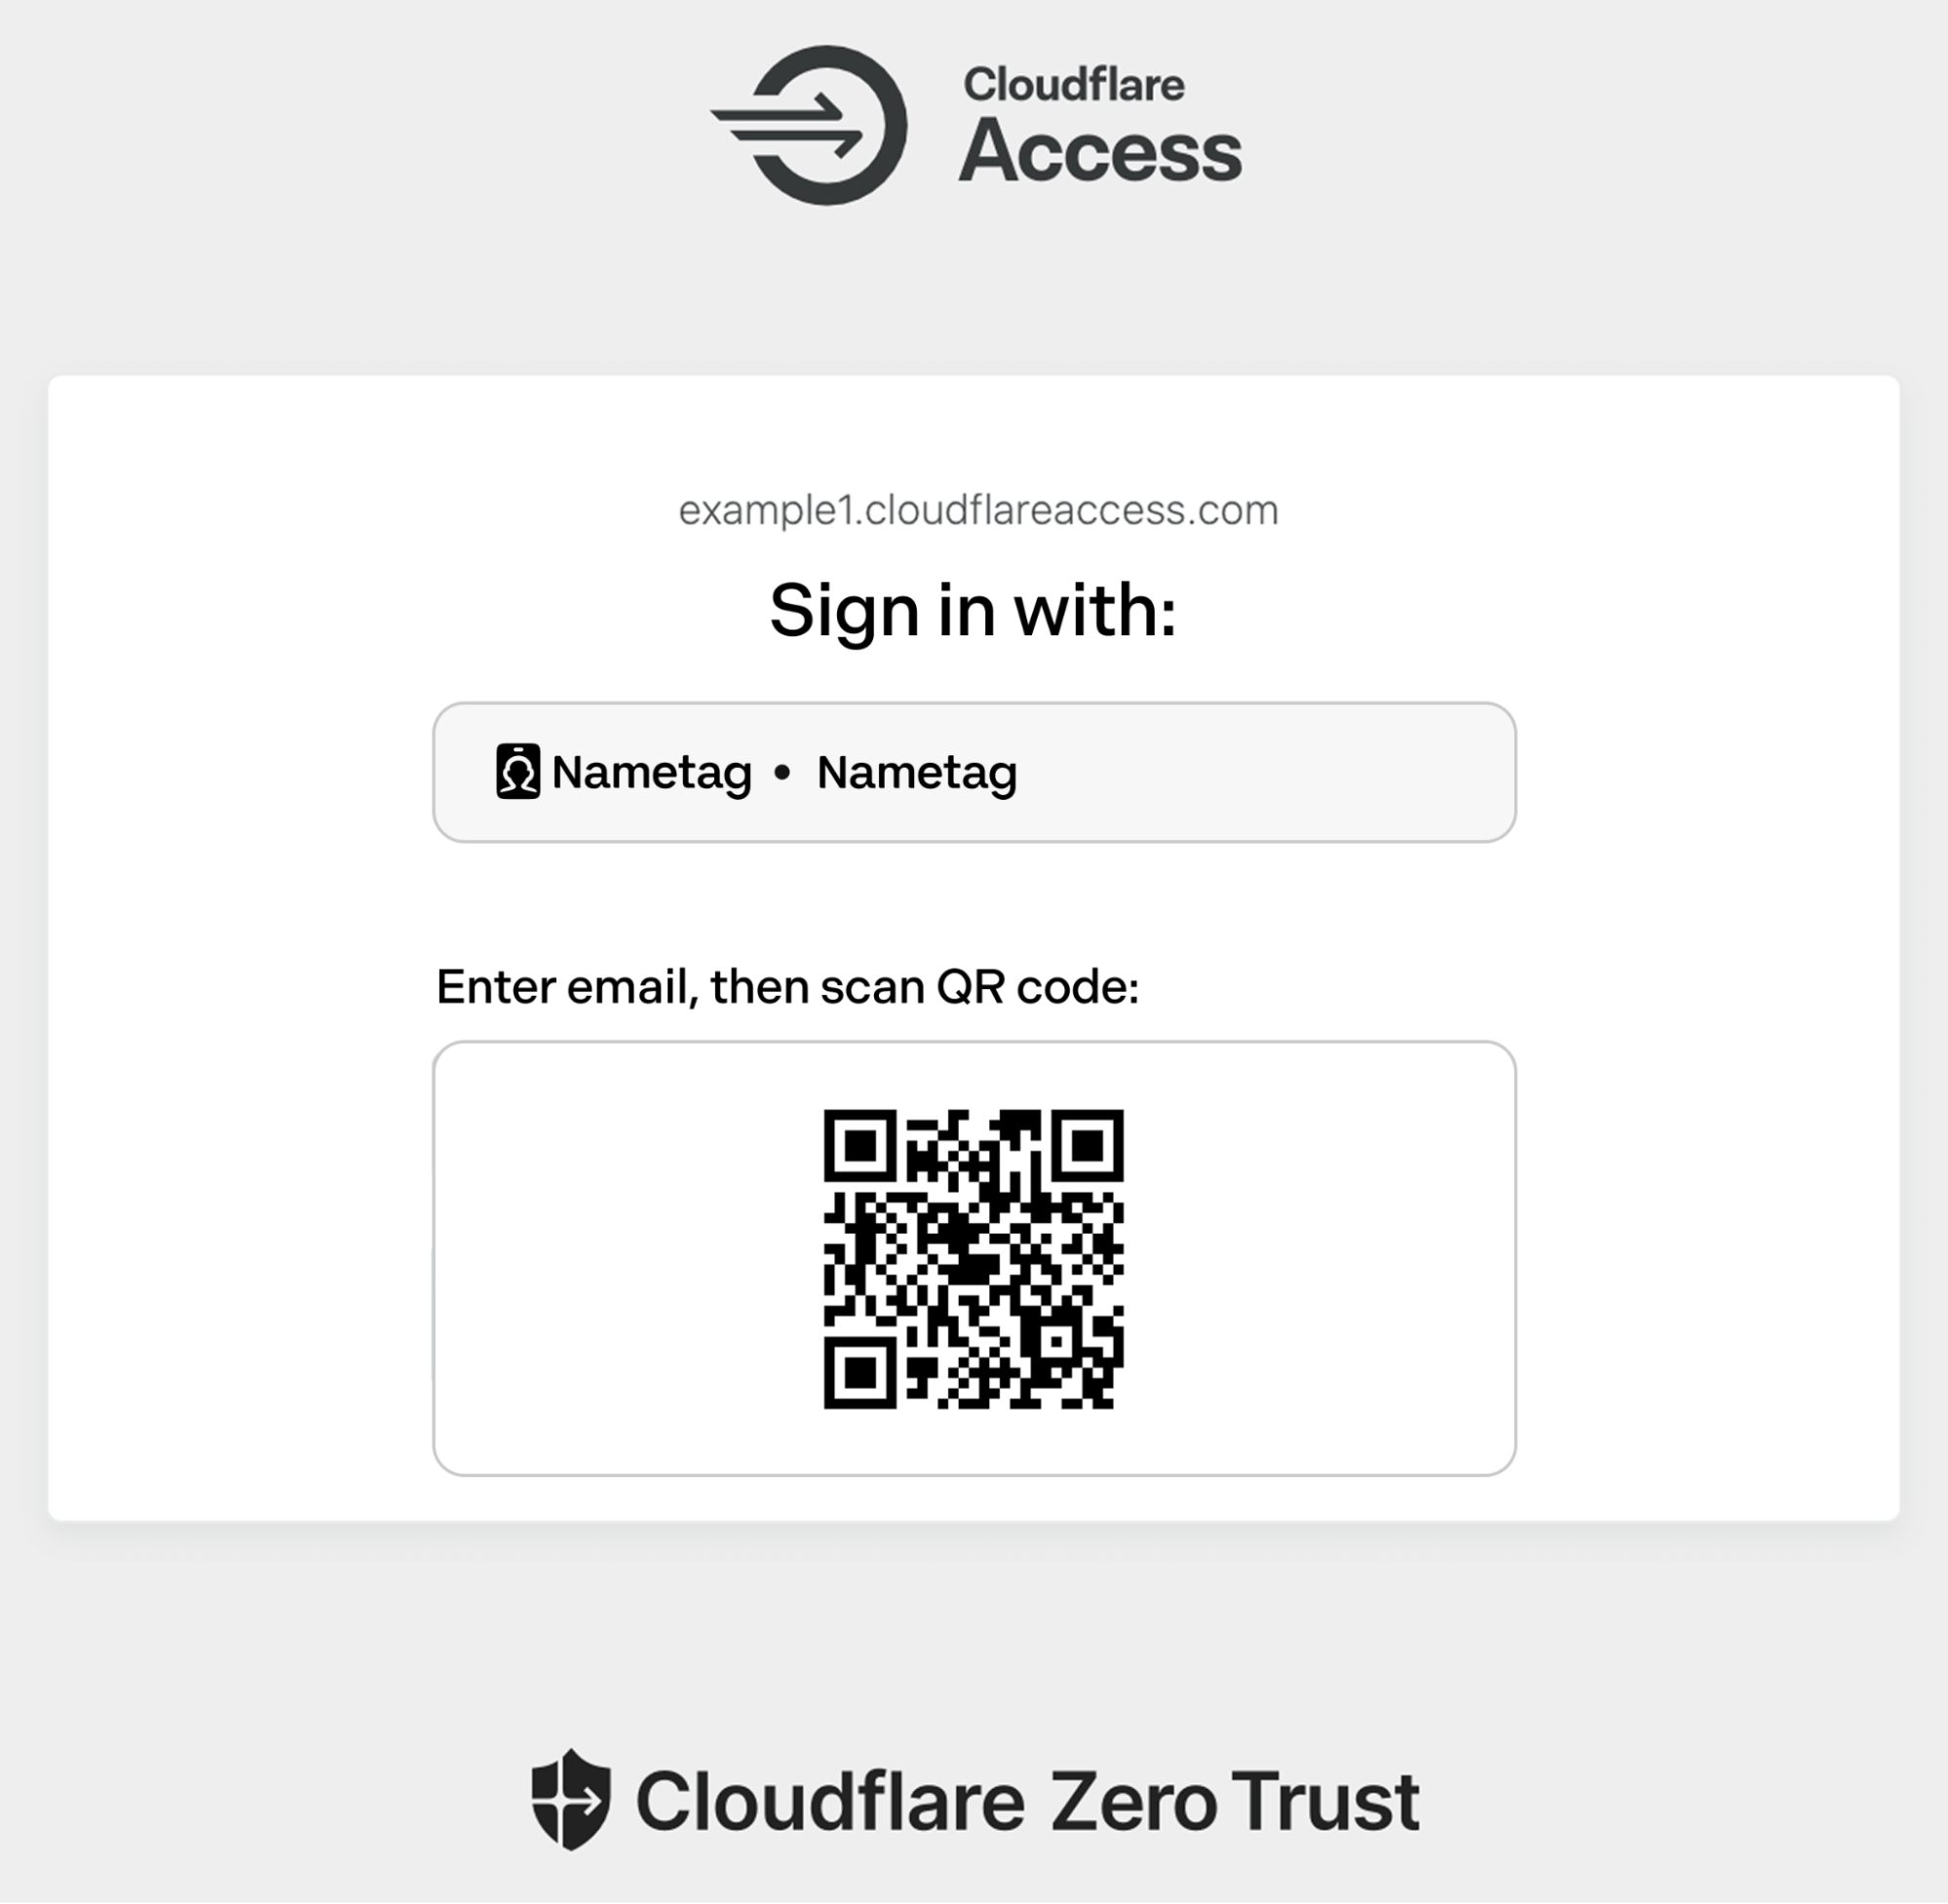
Example of the Cloudflare Access login page prompting for a user to authenticate using Nametag.
Here is an example workflow for a high-security onboarding scenario:
Trigger: A new user attempts to access their initial onboarding portal (protected by Cloudflare Access).
Challenge: Instead of just asking for a username and password, Cloudflare directs the user to Nametag for authentication via OIDC.
Verification: The user enters their new work email address, then snaps a quick selfie and scans their government-issued photo ID using their phone.
Attestation: Nametag’s Deepfake Defense™ identity verification engine leverages advanced cryptography, biometrics, AI and other features to ensure that the user is both a real person and the right person. Nametag’s technology uniquely prevents bad actors from using deepfake IDs and selfies in sophisticated injection attacks or presentation attacks (e.g., holding up a printed photo).
Enforcement: If that check is successful, Nametag returns an ID token to Cloudflare to complete the OIDC flow. Cloudflare then grants or denies access to the application based on the user’s identity and the Access policies.
All of this happens before the user can access email, code repositories, or other internal resources.
Verifying your identity with Nametag takes under 30 seconds to complete. No biometrics are stored after this interaction.
A layered defense
This partnership complements Cloudflare’s existing suite of insider threat protections. Today, you can:
Scan for data exfiltration using our API-driven DLP.
Nametag provides the missing link: identity assurance. It moves us from knowing what account is logging in, to knowing exactly who is behind the keyboard.
In an era where AI can fake a face and a voice, cryptographic proof of identity is the only way to safely trust your workforce.
Beyond onboarding: continuous verification
While stopping bad actors at the door is critical, the threat landscape is dynamic. Legitimate credentials can be sold, and legitimate employees can be compromised.
To protect against that present and ever-evolving risk, Cloudflare Access now incorporates user risk scores so security teams can build context-aware policies. If a user’s risk score suddenly increases from low to high, access can be revoked to any (or all) applications.
In the future, you’ll be able to enforce step-up verification based on signals such as user risk score, in the middle of an active session. Rather than hitting the “big red button” and potentially disrupting a user who does have a legitimate reason for accessing the production billing system from an usual location, you will instead be able to challenge the user to verify with Nametag or by using Cloudflare’s independent MFA with strong authentication methods. If the user is a session hijacker or a bot, they will be unable to pass these checks.
This capability will also extend to self-service IT workflows. Password resets and MFA device registration are prime targets for social engineering (e.g., the MGM Resorts help desk attacks). By placing Nametag behind Cloudflare Access for these specific portals, you eliminate the possibility of a support agent being socially engineered into resetting a password for an attacker.
Defend against the future, now
Security cannot rely on assumptions. As AI tools lower the barrier to entry for sophisticated fraud, your defenses must evolve to verify the human element with cryptographic certainty. The “remote IT worker” threat is not a hypothetical scenario—it is an active campaign targeting organizations globally.
You don’t need to overhaul your entire infrastructure to stop it. You can layer these protections on top of your existing IdP and applications immediately.
Cloudflare One is free for up to 50 users, allowing you to pilot identity-verified onboarding flows or protect high-risk internal portals right now.
Get started:Sign up for Cloudflare One to begin building your policy engine.
Deploy the integration: Follow the step-by-step guide to connect Nametag to Cloudflare Access in minutes.
Understand the risk: Read the full Cloudflare Threat Report to see the data behind the rise in insider threats and AI impersonation.
Don’t wait for a breach to verify your workforce. Start implementing a SASE architecture that trusts nothing — not even the face on the screen — without verification.
The Swiss Financial Market Supervisory Authority (FINMA) has published several requirements and guidelines about engaging with outsourced services for the regulated financial services customers in Switzerland.
An independent third-party audit firm issued the report to assure customers that the AWS control environment is appropriately designed and operating effectively to support of adherence with FINMA requirements.
The latest report covers the 12-month period from October 1, 2024 to September 30, 2025 for the following circulars:
2018/03 Outsourcing – banks, insurance companies and selected financial institutions under FinIA
2023/01 Operational risks and resilience – banks
Business Continuity Management (BCM) minimum standards proposed by the Swiss Insurance Association.
AWS has added the following five services to the current FINMA scope:
Customers can find the FINMA ISAE 3000 report on AWS Artifact. AWS Artifact is a self-service portal for on-demand access to AWS compliance reports. Sign in to AWS Artifact in the AWS Management Console, or learn more at Getting Started with AWS Artifact. Security and compliance is a shared responsibility between AWS and the customer. When customers move their computer systems and data to the cloud, security responsibilities are shared between the customer and the cloud service provider. For more information, see the AWS Shared Security Responsibility Model.
To learn more about our compliance and security programs, see AWS Compliance Programs. As always, we value your feedback and questions; reach out to the AWS Compliance team through the Contact Us page.
If you have feedback about this post, submit comments in the Comments section below
So much of what you interact with on GitHub depends on search—obviously the search bars and filtering experiences like the GitHub Issues page, but it is also the core of the releases page, projects page, the counts for issues and pull requests, and more. Given that search is such a core part of the GitHub platform, we’ve spent the last year making it even more durable. That means, less time spent managing GitHub Enterprise Server, and more time working on what your customers care most about.
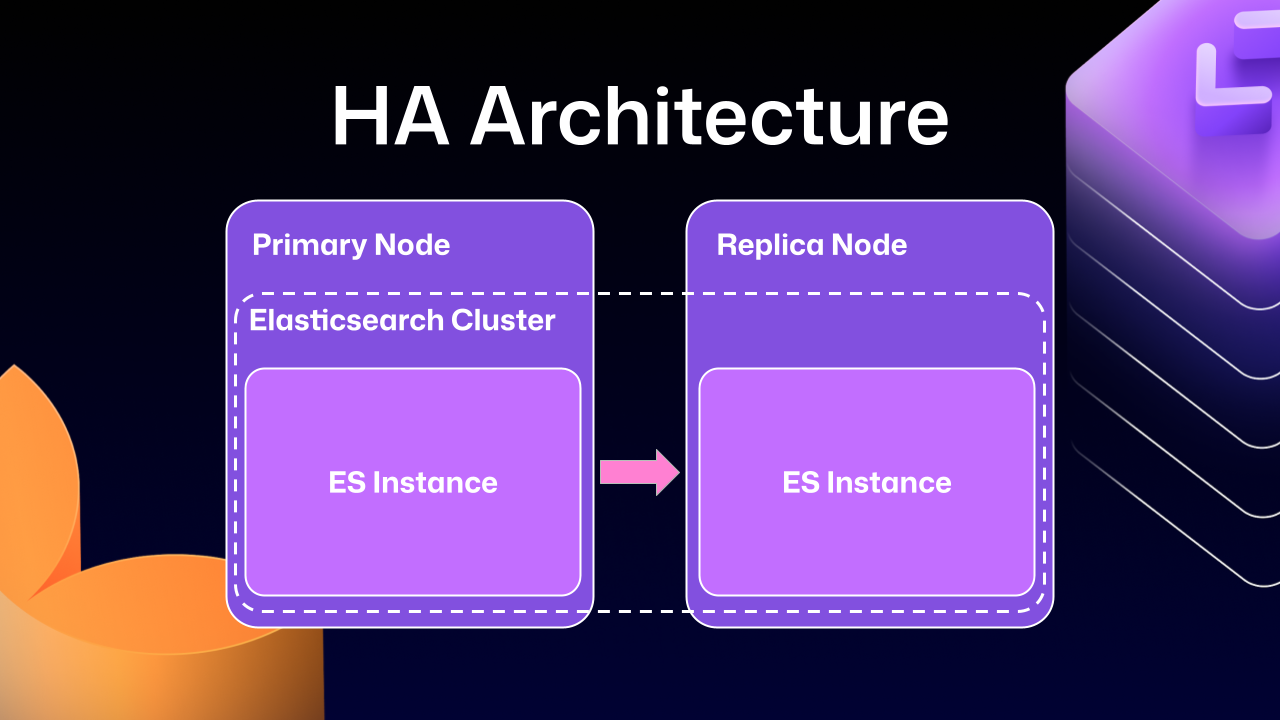
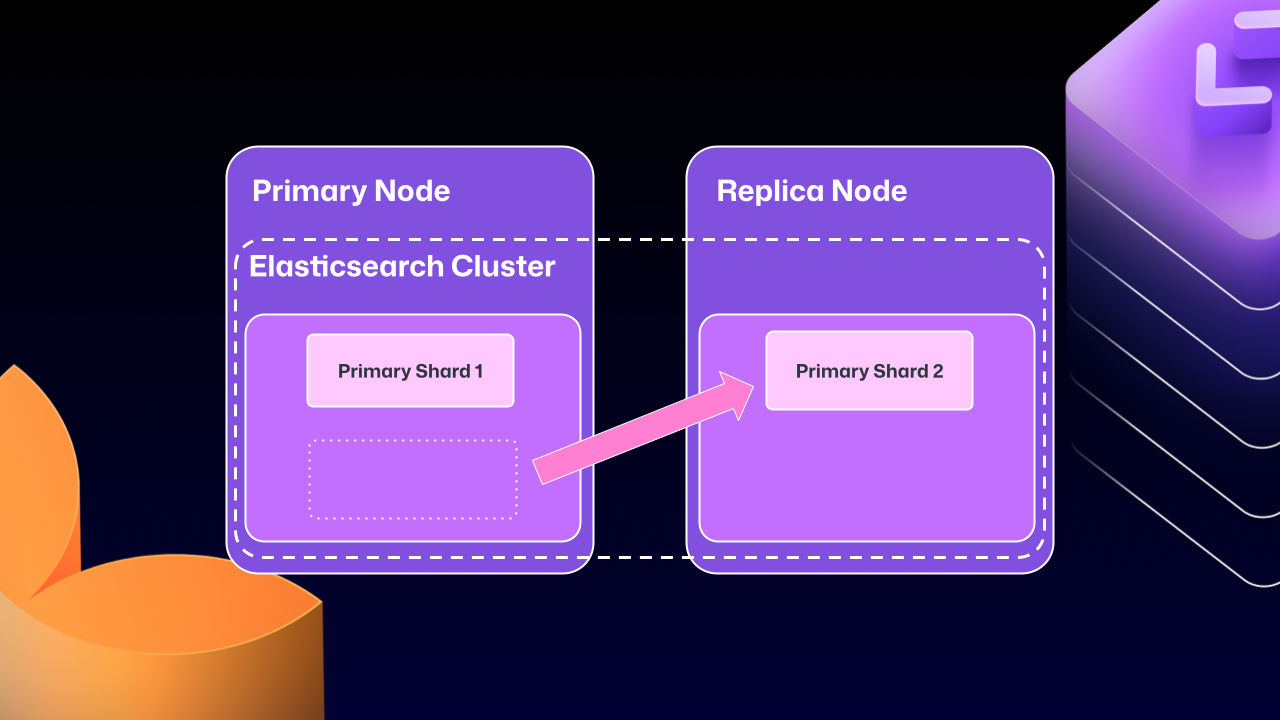
In recent years, GitHub Enterprise Server administrators had to be especially careful with search indexes, the special database tables optimized for searching. If they didn’t follow maintenance or upgrade steps in exactly the right order, search indexes could become damaged and need repair, or they might get locked and cause problems during upgrades. Quick context if you’re not running High Availability (HA) setups, they’re designed to keep GitHub Enterprise Server running smoothly even if part of the system fails. You have a primary node that handles all the writes and traffic, and replica nodes that stay in sync and can take over if needed.
Much of this difficulty comes from how previous versions of Elasticsearch, our search database of choice, were integrated. HA GitHub Enterprise Server installations use a leader/follower pattern. The leader (primary server) receives all the writes, updates, and traffic. Followers (replicas) are designed to be read-only. This pattern is deeply ingrained into all of the operations of GitHub Enterprise Server.
This is where Elasticsearch started running into issues. Since it couldn’t support having a primary node and a replica node, GitHub engineering had to create an Elasticsearch cluster across the primary and replica nodes. This made replicating data straightforward and additionally gave some performance benefits, since each node could locally handle search requests.
Unfortunately, the problems of clustering across servers eventually began to outweigh the benefits. For example, at any point Elasticsearch could move a primary shard (responsible for receiving/validating writes) to a replica. If that replica was then taken down for maintenance, GitHub Enterprise Server could end up in a locked state. The replica would wait for Elasticsearch to be healthy before starting up, but Elasticsearch couldn’t become healthy until the replica rejoined.
For a number of GitHub Enterprise Server releases, engineers at GitHub tried to make this mode more stable. We implemented checks to ensure Elasticsearch was in a healthy state, as well as other processes to try and correct drifting states. We went as far as attempting to build a “search mirroring” system that would allow us to move away from the clustered mode. But database replication is incredibly challenging and these efforts needed consistency.
What changed?
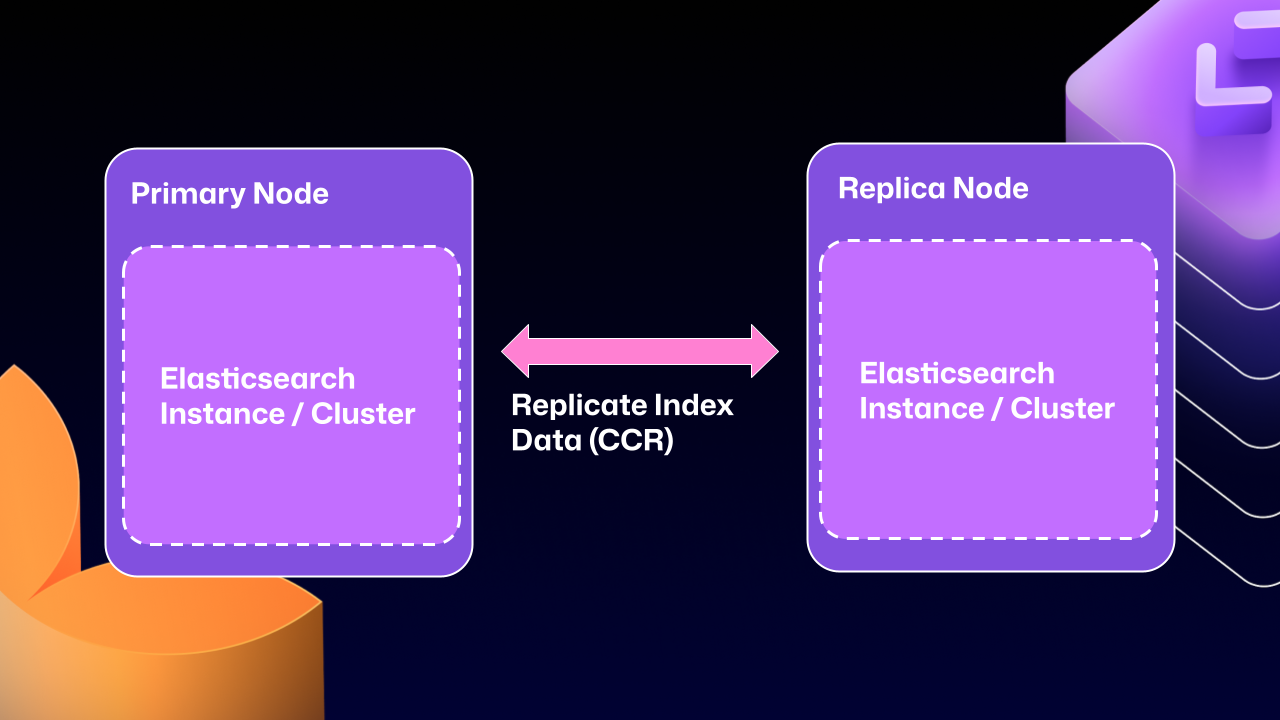
After years of work, we’re now able to use Elasticsearch’s Cross Cluster Replication (CCR) feature to support HA GitHub Enterprise.
“But David,” you say, “That’s replication between clusters. How does that help here?”
I’m so glad you asked. With this mode, we’re moving to use several, “single-node” Elasticsearch clusters. Now each Enterprise server instance will operate as independent single node Elasticsearch clusters.
CCR lets us share the index data between nodes in a way that is carefully controlled and natively supported by Elasticsearch. It copies data once it’s been persisted to the Lucene segments (Elasticsearch’s underlying data store). This ensures we’re replicating data that has been durably persisted within the Elasticsearch cluster.
In other words, now that Elasticsearch supports a leader/follower pattern, GitHub Enterprise Server administrators will no longer be left in a state where critical data winds up on read-only nodes.
Under the hood
Elasticsearch has an auto-follow API, but it only applies to indexes created after the policy exists. GitHub Enterprise Server HA installations already have a long-lived set of indexes, so we need a bootstrap step that attaches followers to existing indexes, then enables auto-follow for anything created in the future.
Here’s a sample of what that workflow looks like:
function bootstrap_ccr(primary, replica):
  # Fetch the current indexes on each
  primary_indexes = list_indexes(primary)
  replica_indexes = list_indexes(replica)

  # Filter out the system indexes
  managed = filter(primary_indexes, is_managed_ghe_index)

  # For indexes without follower patterns we need to
  #   initialize that contract
  for index in managed:
    if index not in replica_indexes:
      ensure_follower_index(replica, leader=primary, index=index)
    else:
      ensure_following(replica, leader=primary, index=index)

  # Finally we will setup auto-follower patterns
  #   so new indexes are automatically followed
  ensure_auto_follow_policy(
    replica,
    leader=primary,
    patterns=[managed_index_patterns],
    exclude=[system_index_patterns]
  )
This is just one of the new workflows we’ve created to enable CCR in GitHub Enterprise Server. We’ve needed to engineer custom workflows for failover, index deletion, and upgrades. Elasticsearch only handles the document replication, and we’re responsible for the rest of the index’s lifecycle.
How to get started with CCR mode
To get started using the new CCR mode, reach out to [email protected] and let them know you’d like to use the new HA mode for GitHub Enterprise Server. They’ll set up your organization so that you can download the required license.
Once you’ve downloaded your new license, you’ll need to set `ghe-config app.elasticsearch.ccr true`. With that finished, administrators can run a `config-apply` or an upgrade on your cluster to move to 3.19.1, which is the first release to support this new architecture.
When your GitHub Enterprise Server restarts, Elasticsearch will migrate your installation to use the new replication method. This will consolidate all the data onto the primary nodes, break clustering across nodes, and restart replication using CCR. This update may take some time depending on the size of your GitHub Enterprise Server instance.
While the new HA method is optional for now, we’ll be making it our default over the next two years. We want to ensure there’s ample time for GitHub Enterprise administrators to get their feedback in, so now is the time to try it out.
We’re excited for you to start using the new HA mode for a more seamless experience managing GitHub Enterprise Server.
Want to get the most out of search on your High Availability GitHub Enterprise Server deployment? Reach out to support to get set up with our new search architecture!
This is a guest post by Edijs Drezovs, CEO and Founder of GOStack, Viesturs Kols, Data Architect at GOStack, and Krisjanis Beitans, Senior Data Engineer at GOStack, in partnership with AWS.
Yggdrasil Gaming develops and publishes casino games globally, processing massive amounts of real-time gaming data for game performance analytics, player behavior insights, and industry intelligence. As Yggdrasil’s system grew, managing dual-cloud environments created operational overhead and limited their ability to implement advanced analytics initiatives. This challenge became critical ahead of the launch of the Game in a Box solution on AWS Marketplace, which generates increases in data volume and complexity.
Yggdrasil Gaming reduced multi-cloud complexity and built a scalable analytics foundation by migrating from Google BigQuery to AWS analytics services. In this post, you’ll discover how Yggdrasil Gaming transformed their data architecture to meet growing business demands. You will learn practical strategies for migrating from proprietary systems to open table formats such as Apache Iceberg while maintaining business continuity.
Yggdrasil worked with GOStack, an AWS Partner, to migrate to an Apache Iceberg-based lakehouse architecture. The migration helped reduce operational complexity and enabled real-time gaming analytics and machine learning.
Challenges
Yggdrasil faced several critical challenges that prompted their migration to AWS:
Multi-cloud operational complexity: Managing infrastructure across AWS and Google Cloud created significant operational overhead, reducing agility and increasing maintenance costs. The data team had to maintain expertise in both environments and coordinate data movement between clouds.
Architecture limitations: The existing setup couldn’t effectively support advanced analytics and AI initiatives. More critically, the launch of Yggdrasil’s Game in a Box solution required a modernized, scalable data environment capable of handling increased data volumes and enabling advanced analytics.
Scalability constraints: The architecture lacked the unified data foundation with open standards and automation required to scale efficiently. As data volumes grew, costs increased proportionally, and the team needed an environment designed for modern analytics at scale.
Solution overview
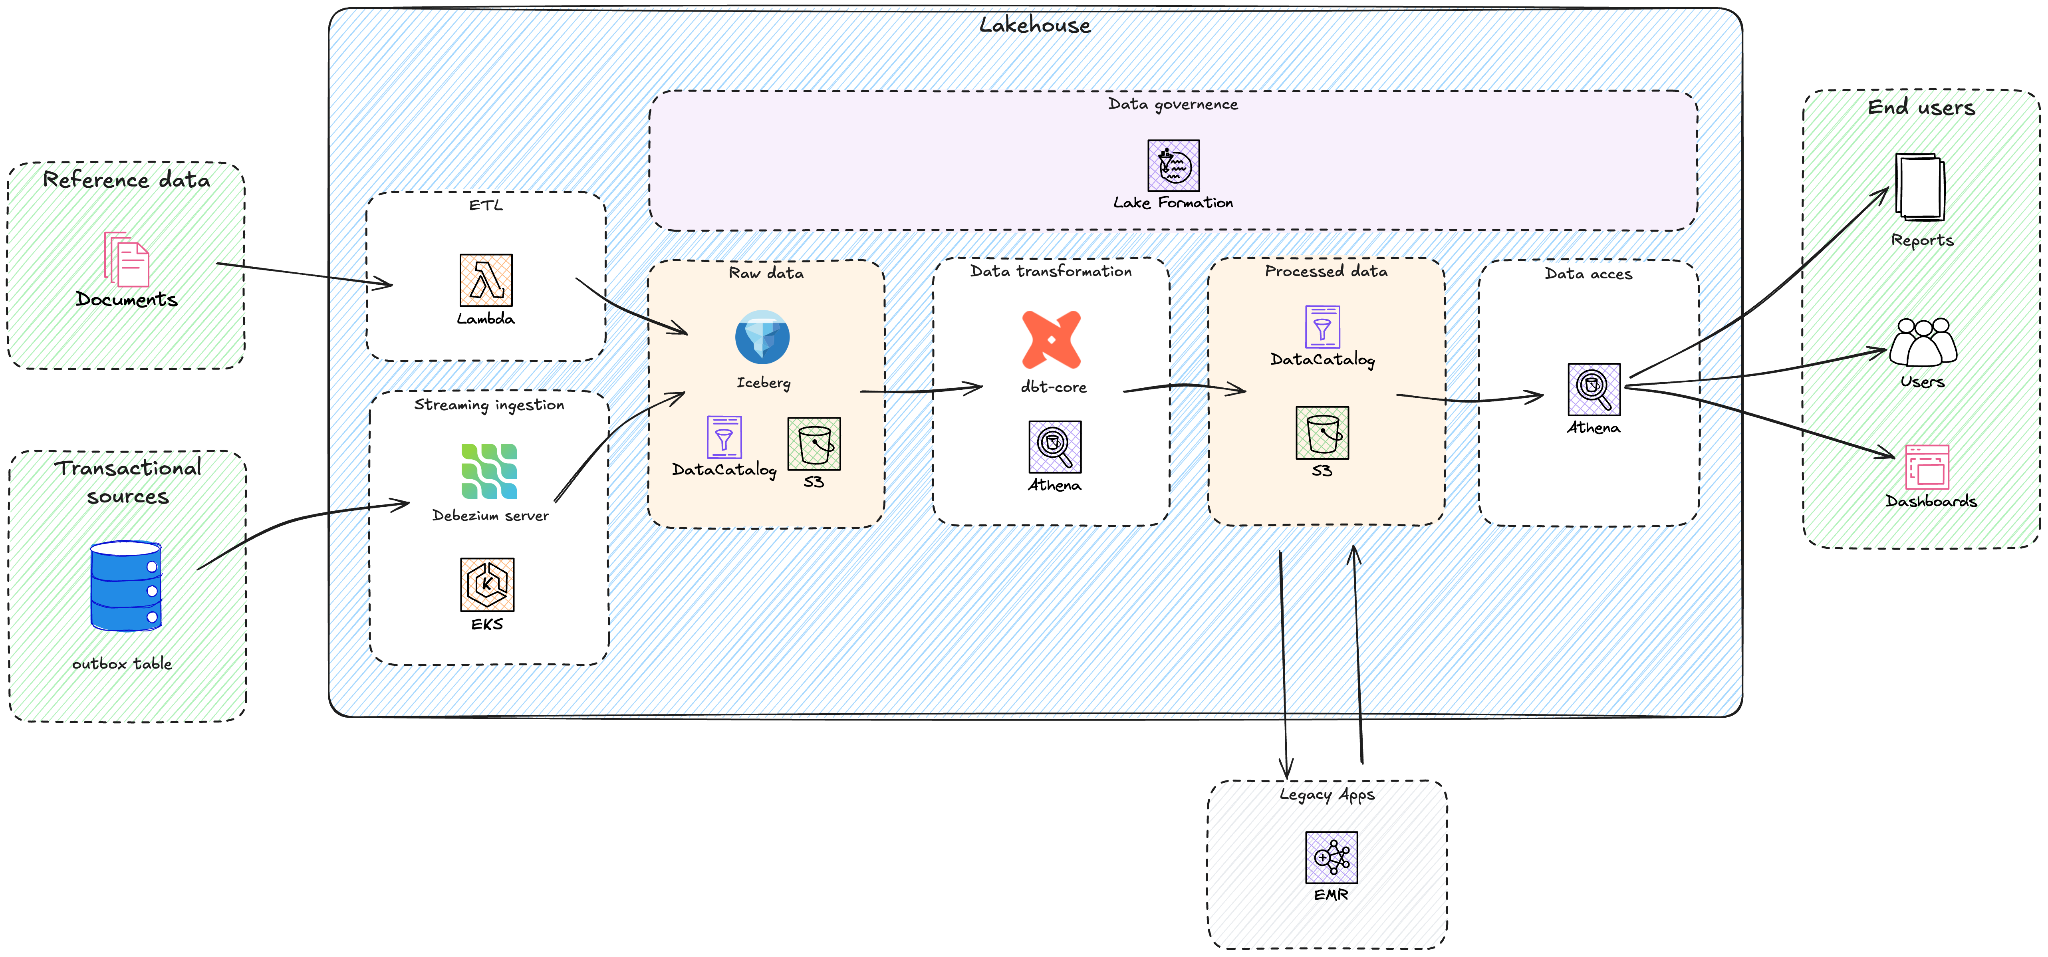
Yggdrasil worked with GOStack, an AWS APN partner, to design their new lakehouse architecture. The following diagram shows the high level overview of this architecture.
The combination of Amazon S3, Apache Iceberg, and Amazon Athena allowed Yggdrasil to move away from provisioned, always-on compute models. The Amazon Athena pay-per-query pricing charges only for data scanned, removing idle compute costs during off-peak periods. Internal cost modeling performed during the evaluation phase indicated that this architecture could reduce analytics system costs by 30–50% compared to compute-based warehouse pricing models of other solutions, particularly for bursty workloads driven by game launches, tournaments, and seasonal traffic. By adopting AWS-native analytics services, Yggdrasil reduced operational complexity through native integration with AWS Identity and Access Management (AWS IAM), Amazon EKS, and AWS Lambda, helping simplify security, governance, and automation across the analytics system.
The solution centers on a modern lakehouse architecture built on Amazon S3, which provides durable and cost-efficient storage for Iceberg tables in Apache Parquet format. Apache Iceberg table format provides ACID transactions, schema evolution, and time travel capabilities while maintaining an open standard. AWS Glue Data Catalog serves as the central technical metadata repository, while Amazon Athena acts as the serverless query engine used by dbt-athena and for ad-hoc data exploration. Amazon EMR runs Yggdrasil’s legacy Apache Spark application in a fully managed environment, and AWS Lake Formation provides centralized security and governance for data lakes, allowing fine-grained access control at database, table, column, and row levels.
The migration followed a phased approach:
Establish lakehouse foundation – Set up Apache Iceberg-based architecture with Amazon S3 with AWS Glue Data Catalog
Implement real-time data ingestion – Deploy Debezium connectors for real-time change data capture from EKS and Google Kubernetes Engine (GKE) clusters
Migrate processing pipelines – Re-system ETL pipelines using AWS Lambda, and legacy data applications re-systemed on Amazon EMR
Modernizing the transformation layer – Implement dbt with Amazon Athena for modular, reusable models
Enable governance – Configure AWS Lake Formation for comprehensive data governance
Establish lakehouse foundation
The first phase of the migration focused on building a solid foundation for the new data lakehouse architecture on AWS. The goal was to create a scalable, secure, and cost-efficient environment that could support analytical workloads with open data formats and serverless query capabilities.
GOStack provisioned an Amazon S3-based data lake as the central storage layer, providing virtually unlimited scalability and fine-grained cost control. This storage-compute separation enables teams to decouple ingestion, transformation, and analytics processes, with each component scaling independently using the most appropriate compute engine.
To establish dataset interoperability and discoverability, the team adopted AWS Glue Data Catalog as the unified metadata repository. The catalog stores Iceberg table definitions and makes schemas accessible across services such as Amazon Athena and Apache Spark workloads on Amazon EMR. Most datasets, both batch and streaming, are registered here, enabling consistent metadata visibility across the lakehouse.
The data is stored in Apache Iceberg tables on Amazon S3, selected for its open table format, ACID transaction support, and powerful schema evolution features. Yggdrasil required ACID transactions for consistent financial reporting and fraud detection, schema evolution to accommodate rapidly changing gaming data models, and time travel queries to align with regulatory audit requirements.
GOStack built a custom schema conversion and table registration service. This internal tool converts source-system Avro schemas into Iceberg table definitions and manages the creation and evolution of raw-layer tables. By controlling schema translation and table registration directly, the team makes sure that metadata stays consistent with the source systems and provides predictable, versioned schema evolution aligned with ingestion needs.
The initial setup made the following components:
Amazon S3 bucket structure design: Implemented a multi-layer layout (raw, curated, and analytics zones) aligned with data lifecycle best practices.
AWS Glue Data Catalog integration: Defined database and table schemas with partitioning strategies optimized for Athena performance.
Iceberg configuration: Enabled versioning and metadata retention policies to balance storage efficiency and query flexibility.
Security and compliance: Configured encryption at rest using AWS Key Management Service (AWS KMS), helped enforce access controls via AWS IAM and Lake Formation, and implemented Amazon S3 bucket policies following the principle of least privilege.
The redesign of the previous GCP setup helped deliver price-performance improvements. Yggdrasil reduced ingestion and processing costs by approximately 60% while also lowering operational overhead through a more direct, event-driven pipeline.
Implement real-time data ingestion
After establishing the lakehouse architecture, the next step focused on enabling real-time data ingestion from Yggdrasil’s operational databases into the raw data layer of the lakehouse. The objective was to capture and deliver transactional changes as they occur, making sure that downstream analytics and reporting reflect the most up-to-date information.
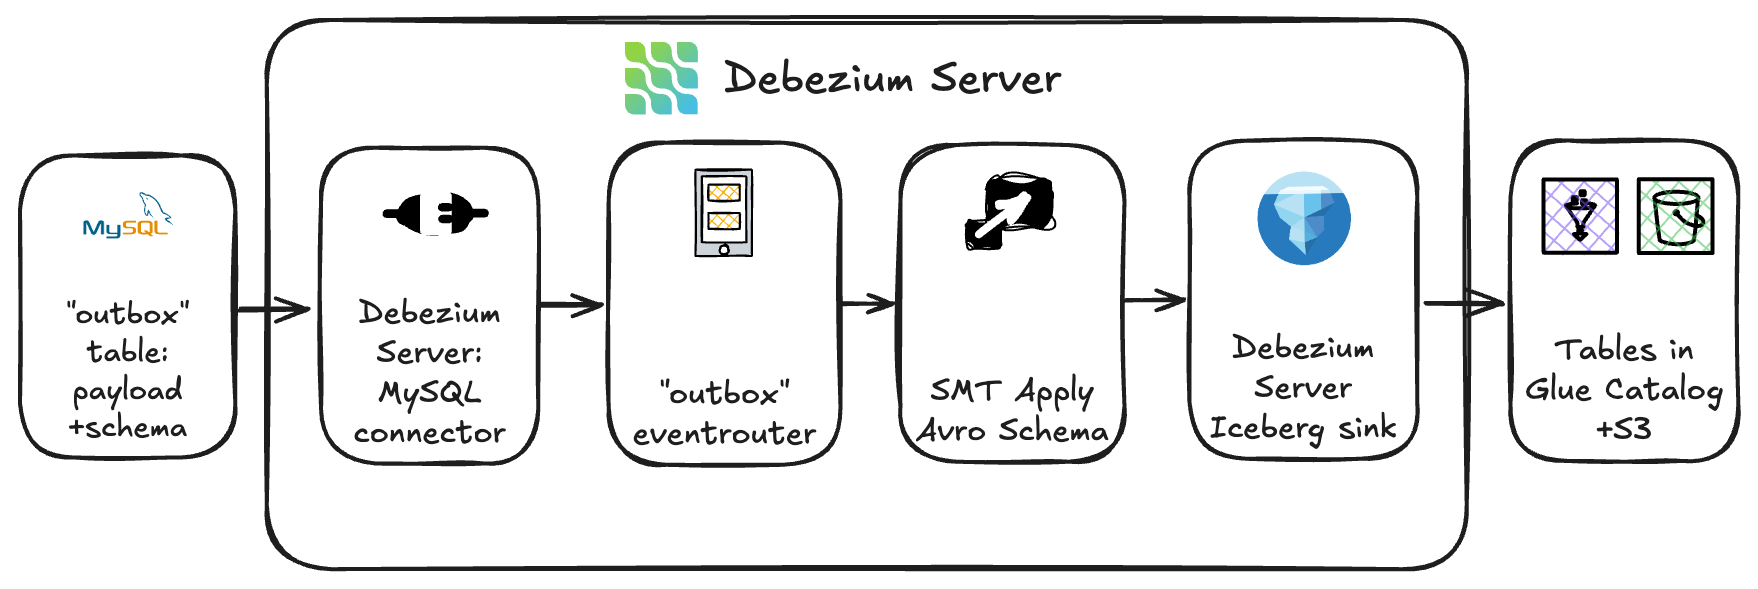
To achieve this, GOStack deployed Debezium Server Iceberg, an open-source project that integrates change data capture (CDC) directly with Apache Iceberg tables. It was deployed as Argo CD applications on Amazon EKS and used Argo’s GitOps-based model for reproducibility, scalability, and seamless rollouts.
This architecture provides an efficient ingestion pathway – streaming data changes directly from the source system’s outbox tables into the Apache Iceberg tables registered in the AWS Glue Data Catalog and physically stored on Amazon S3, bypassing the need for intermediate brokers or staging services. By writing data in the Iceberg table format, the ingestion layer maintained transactional guarantees and immediate query availability through Amazon Athena.
Because Yggdrasil’s source systems emitted outbox events containing Avro records, the team implemented a custom outbox-to-Avro transformation within Debezium. The outbox table stored two key components:
The Avro schema definition
The JSON-encoded payload of each record
The custom transformation module combined these elements into valid Avro records before persisting them into the target Iceberg tables. This approach preserved schema fidelity and verified compatibility with downstream processing tools.
To dynamically route incoming change events, the team leveraged Debezium’s event router configuration. Each record was routed to the appropriate Apache Iceberg table (backed by Amazon S3) based on topic and metadata rules, while table schemas and partitioning were governed on the AWS Glue side to maintain stability and alignment with the lakehouse’s data organization standards.
This setup helped deliver low-latency ingestion with end-to-end streaming from database outbox to S3-based Iceberg tables in near real time. The team managed operations end to end on Amazon EKS using Helm charts deployed via Argo CD in a GitOps model for fully declarative, version-controlled operations. ACID-compliant Iceberg writes verified that partially written data could not corrupt downstream analytics. The modular transformation logic allowed future expansion to new source systems or event formats without rearchitecting the ingestion pipeline.
This Debezium Server solution provides fast, real-time data ingestion. GOStack considers it an interim architecture. In the long term, the ingestion pipeline will evolve to use Amazon Managed Streaming for Apache Kafka (Amazon MSK) as the central event backbone. Debezium connectors will act as producers, publishing change events to Apache Kafka topics, while Apache Flink applications will consume, process, and write data into Iceberg tables.
This planned evolution toward a Kafka-based streaming architecture verifies Yggdrasil’s lakehouse remains not only scalable and cost-efficient today, but also future-ready – capable of supporting richer streaming analytics and broader data integration scenarios as the organization grows.
Migrate processing pipelines
Once real-time data ingestion was established, GOStack turned its focus to modernizing the data transformation layer. The goal was to simplify the transformation logic, reduce operational overhead, and unify the orchestration of analytical workloads within the new AWS-based lakehouse.
GOStack adopted a lift-and-shift approach for some of Yggdrasil’s data pipelines to support a fast and low-risk transition away from GCP. The lightweight Cloud Run functions that previously handled extraction tasks – pulling data from file shares, SharePoint, Google Sheets, and various third-party APIs – were re-implemented using AWS Lambda. These Lambda functions now integrate with the same external systems and write data directly into Iceberg tables.
For more complex processing, previous Apache Spark applications running on Dataproc were migrated to Amazon EMR with minimal code changes. This allowed it to preserve the existing transformation logic while benefiting from the managed scaling capabilities of EMR and improved cost control on AWS.
Over time, these processes will be gradually refactored and consolidated into containerized workflows on the EKS cluster, fully orchestrated by Argo Workflows. This phased migration allows Yggdrasil to move workloads to AWS quickly and decommission GCP resources sooner, while still leaving room for continuous improvement and modernization of the data system over time.
Finally, a lot of analytical transformations that previously lived as BigQuery stored procedures and scheduled queries, that were now rebuilt as modular dbt models executed with dbt-athena. This shift made transformation logic more transparent, maintainable, and version-controlled, improving both developer experience and long-term governance.
Modernizing the transformation layer
With the ingestion pipelines migrated to AWS, GOStack turned its focus to simplifying and modernizing Yggdrasil’s analytical transformations. Rather than replicating the previous stored-procedure–driven approach, the team rebuilt the transformation layer using dbt to help improve maintainability, lineage visibility, orchestration, and long-term governance.As part of this redesign, several data models were reshaped to fit the new lakehouse architecture. The most significant effort involved rewriting a critical Spark-based financial transformation into a set of SQL-driven dbt models. This shift not only aligned the logic with the lakehouse design but also removed the need for long-running Spark clusters, helping generate operational and cost savings.For the curated data layers, replacing the legacy warehouse, GOStack consolidated numerous scheduled queries and stored procedures into structured dbt models. This provides standardized, version-controlled transformations and clear lineage across the analytical stack.
Orchestration was simplified as well. Previously, coordination was split between Apache Airflow for Spark workloads and scheduled queries analytical transformations, creating operational friction and dependency risks. In the new architecture, Argo Workflows on Amazon EKS orchestrates dbt models centrally, consolidating the transformation logic within a single workflow engine. While most transformations still run on time-based schedules today, the system now supports event-driven execution through Argo Events, giving the opportunity to progressively adopt trigger-based workflows as the transformation layer evolves.
This unified orchestration framework can bring multiple benefits:
Consistency: One orchestration layer for data workflows across ingestion and transformation.
Automation: Event-driven dbt runs help remove manual scheduling and reduce operational overhead.
Scalability: Argo Workflows scales with the EKS cluster, handling concurrent dbt jobs seamlessly.
Observability: Centralized logging and workflow visualization help improve visibility into job dependencies and data freshness.
Through this transformation, Yggdrasil successfully unified its data lakes and warehouses into a modern lakehouse architecture, powered by open data formats, serverless query engines, and modular transformation logic. The move to dbt and Athena not only simplified operations but also helped pave the way for faster iteration, simpler governance, and greater developer productivity across the data environment.
Lakehouse performance optimizations
While performance tuning is an ongoing journey, as part of the transformation redesign, GOStack made few performance-oriented tweaks to make sure Athena queries can be fast and cost-efficient. The Apache Iceberg tables were stored in Parquet with ZSTD compression, providing strong read performance and reducing the amount of data scanned by Athena.
Partitioning strategies were also aligned to actual access patterns using Iceberg’s native partitioning. Raw data zones were partitioned by ingestion timestamp, enabling efficient incremental processing. Curated data used business-driven partition keys, such as player or game identifiers and date dimensions, to help optimize analytical queries. These designs made sure Athena could prune unneeded data and consistently scan only the relevant partitions.
Iceberg’s native partitioning features, including transforms such as bucketing and time slicing, replace traditional Hive partitioning patterns. Because Iceberg manages partitions internally in its metadata layer, not all Glue or Athena partition constructs apply. Relying on Iceberg’s native partitioning helps provide predictable pruning and consistent performance across the lakehouse without introducing legacy Hive behaviors.
To handle the high volume of small files produced by real-time ingestion, GOStack enabled AWS Glue Iceberg compaction. This automatically merges small Parquet files into larger segments, helping improve query performance and reduce metadata overhead without manual intervention.
Enable governance
The team adopted AWS Lake Formation as the primary governance layer for the curated zone of the lakehouse, leveraging Lake Formation hybrid access mode to manage fine-grained permissions alongside existing IAM-based access patterns. This hybrid mode provides an incremental and flexible pathway to adopt Lake Formation without forcing a full migration of legacy permissions or internal pipeline roles, making it an ideal fit for Yggdrasil’s phased modernization strategy.
Lake Formation offers centralized authorization, supporting database, table, column, and, critically for Yggdrasil, row-level permissions. These capabilities are essential because of the company’s multi-tenant operating model:
Game development partners require access to data and reports pertaining only to their own games, facilitating both security and compliance alignment with partner agreements.
iGaming operators integrating with Yggdrasil’s system must receive operational and financial insights exclusively for their own data, enforced automatically through reporting tools backed by curated Iceberg tables.
With Lake Formation hybrid access mode, tenant-specific row-level access policies are consistently enforced across Amazon Athena, AWS Glue, and Amazon EMR, without introducing breaking changes to existing IAM-based workloads. This allowed Yggdrasil to implement strong governance for external consumers while keeping internal operations stable and predictable.
Internally, Lake Formation is also used to grant the Analytics team and BI tools targeted access to curated datasets, straightforward but centrally managed to maintain consistency and reduce administrative overhead.
For ingestion and transformation workloads, the team continues to rely on IAM roles and policies. Services such as Debezium, dbt, and Argo Workflows require broad but controlled access to raw and intermediate storage layers, and IAM provides a straightforward, least-privilege mechanism for granting those permissions without involving Lake Formation in the internal pipeline path.
By adopting Lake Formation in hybrid access mode and combining it with IAM for internal services, Yggdrasil established a governance model that can balance strong security with operational flexibility – enabling the lakehouse to scale securely as the business grows.
Results and business impact
The new lakehouse, built on Amazon Athena, Amazon S3, and AWS Glue Data Catalog, now underpins advanced analytics and AI/ML use cases such as player behavior modeling, predictive game recommendations, and fraud detection.
The optimized lakehouse design allows Yggdrasil to rapidly onboard new analytics workloads and business use cases, helping deliver measurable outcomes:
Reduced operational complexity through consolidation on AWS analytics services
Cost optimization with a 60% reduction in data processing costs
Improved data freshness with 75% lower latency for analytics results (from 2 hours to 30 minutes)
Enhanced governance using the AWS Lake Formation fine-grained controls
Future-ready architecture leveraging open formats and serverless analytics
Conclusion
Yggdrasil Gaming’s migration journey illustrates how organizations can successfully transition from proprietary analytics systems to an open, flexible lakehouse architecture. By following a phased approach guided by AWS Well-Architected Framework principles, Yggdrasil maintained business continuity while establishing a modern foundation for their data needs.
Based on this experience, several lessons emerged to help guide your own move to an AWS-based lakehouse:
Assess your current state: Identify pain points in your existing data architecture and establish clear objectives for modernization.
Start small: Begin with a pilot project using AWS analytics services to validate the lakehouse approach for your specific use cases.
Design for openness: Leverage open table formats like Apache Iceberg to maintain flexibility and avoid vendor lock-in.
Implement gradually: Follow a phased migration strategy similar to Yggdrasil’s, prioritizing high-value workloads.
Optimize continuously: Use performance tuning techniques for Amazon Athena to help maximize efficiency and minimize costs.
Organizations running Apache Kafka as their streaming platform need comprehensive monitoring to maintain reliable operations. Without proper visibility into broker health, resource utilization, and data flow metrics, teams risk service disruptions, data loss, and degraded performance that can impact critical business operations. Effective monitoring and alerting are essential to detect anomalies early, from high system load to connectivity issues, enabling teams to take preventive action before problems affect production workloads.
Amazon Managed Streaming for Apache Kafka (Amazon MSK) addresses these monitoring challenges by publishing detailed metrics to Amazon CloudWatch. The service emits metrics at 1-minute intervals for provisioned (Standard) clusters, with flexible monitoring levels (DEFAULT, PER_BROKER, PER_TOPIC_PER_BROKER, or PER_TOPIC_PER_PARTITION) to control granularity and cost. At the DEFAULT level (free), cluster-level metrics are available; higher levels (paid) expose broker-level, per-topic and per-partition metrics.
In this post, I show you how to implement effective monitoring for your MSK clusters using Amazon CloudWatch. You’ll learn how to track critical metrics like broker health, resource utilization, and consumer lag, and set up automated alerts to prevent operational issues. By following these practices, you can work to improve streaming operations reliability, optimize resource usage, and support high availability for your mission-critical applications.
Key metrics to monitor
This article groups important Amazon MSK metrics into logical categories. For each, we highlight key metrics and what they indicate:
Broker Health and Cluster Availability:
ActiveControllerCount is a cluster-level metric where each broker reports whether it’s the active controller (1) or not (0). In a healthy cluster, exactly one broker serves as the active controller at any time. When viewing this metric with the average statistic, the value equals 1 divided by the number of brokers. For example, a 3-broker cluster shows 0.33 (1/3). Set CloudWatch alarm thresholds accordingly—for 6 brokers, alert if average falls below 0.166(1/6). When using the sum statistic, the value should always be 1, indicating one active controller regardless of cluster size. If the sum differs from 1, a controller election is in progress—typically during maintenance activities, configuration changes, or rolling restarts. Note: For a KRaft-based clusters, the ActiveControllerCount is only exposed on dedicated controller endpoints so the sample count is 3 and only controller will report value of 1. Thus, the average is always 0.33 no matter how many brokers there are in the cluster. To monitor the broker health for Kraft-based clusters, check LeaderCount metric. If a broker is not emitting any metric, then it’s a good indication that broker might be unhealthy.
OfflinePartitionsCount (cluster): Number of partitions with no active leader. Non-zero values mean data is temporarily unavailable or unwritable. Trigger alerts if it rises above 0.
UnderReplicatedPartitions (per broker): Number of partitions where not all replicas are caught up. This should stay at 0 under normal conditions. Spikes indicate traffic exceeds capacity or replication lag; sustained values often mean a configuration/ACL issue. Refer to Troubleshoot your Amazon MSK cluster
UnderMinIsrPartitionCount (per broker): Partitions below the minimum in-sync replica (ISR) count. A non-zero value means potential data loss risk if brokers fail. Monitor to ensure replication is healthy. Refer to Custom configurations
GlobalPartitionCount (cluster): Total number of partitions across all topics (leaders only). Useful for capacity planning and sanity checks.
CPU: Total broker CPU utilization is defined as CpuUser + CpuSystem. Best practice is to keep average CPU utilization under 60% . Set alarms on the sum of user+system to detect overload.
CPUCreditBalance / CPUCreditUsage (per broker): For burstable instance types(T3), tracks earned/spent CPU credits. A declining credit balance or high credit usage warns that the instance may be CPU-starved.
Memory: MemoryUsed, MemoryFree (per broker) show RAM usage. Critically, HeapMemoryAfterGC (per broker) reports JVM heap usage (%) after garbage collection. AWS recommends alerting if HeapMemoryAfterGC exceeds 60%, to avoid out-of-memory issues.
Disk: Kafka brokers use attached EBS storage for topic data. Monitor KafkaDataLogsDiskUsed (per broker) – percentage of disk used by message logs. Best practice: alarm when data log usage exceeds 85%. Also track RootDiskUsed: the percentage of the root disk used by the broker.
EBS I/O: Volume metrics (per broker) such as VolumeQueueLength, VolumeReadOps, VolumeWriteOps, VolumeReadBytes, VolumeWriteBytes indicate I/O latency and throughput. Rising queue lengths or latency (such as VolumeTotalReadTime) suggest disk contention.
Network: Basic network stats per broker include NetworkRxPackets, NetworkTxPackets, and errors/drop counts (NetworkRxErrors, NetworkTxErrors, NetworkRxDropped, NetworkTxDropped). Unexpected errors or drops can indicate network issues.
Topic and Partition Activity:
Throughput: BytesInPerSec and BytesOutPerSec measure inbound/outbound data rates per broker or per topic. Sustained drops can signal lost producers/consumers; spikes may require scaling.
Replication Traffic: ReplicationBytesInPerSec/ReplicationBytesOutPerSec (per topic) show inter-broker replication volume.
Consumer Lag: Consumer lag metrics quantify the difference between the latest data written to your topics and the data read by your applications. Amazon MSK provides the following consumer-lag metrics, which you can get through Amazon CloudWatch or through open monitoring with Prometheus: EstimatedMaxTimeLag, EstimatedTimeLag, MaxOffsetLag, OffsetLag, and SumOffsetLag. For information about these metrics, see Amazon MSK metrics for monitoring Standard brokers with CloudWatch.
Client Connections :
ConnectionCount (per broker): Total active connections (clients + inter-broker). Sudden drops or sustained high counts (hitting limits) merit attention.
ClientConnectionCount (per broker, with auth filter): Active authenticated client connections.
ConnectionCreationRate / ConnectionCloseRate (per broker): New or closed connections per second. Spikes in connection churn may indicate client issues.
Authentication: IAMNumberOfConnectionRequests and IAMTooManyConnections (per broker) show IAM auth request rates and throttle breaches (limit of 100 simultaneous connections).
Network Bandwidth Metrics:
TrafficShaping > 0 (any throttling) metric serves as your primary warning signal. When this value exceeds zero, your MSK cluster is experiencing network throttling at the EC2 layer, with packets being dropped or queued due to exceeded allocations. This throttling manifests as reduced throughput, increased latency, and potential network errors that impact both producer and consumer performance. TrafficShaping issues stem from two possible bandwidth limitations: BwInAllowanceExceeded & BwOutAllowanceExceeded :
BwInAllowanceExceeded tracks when inbound aggregate bandwidth surpasses broker maximums.
BwOutAllowanceExceeded monitors when outbound aggregate bandwidth exceeds limits. Both BwInAllowanceExceeded and BwOutAllowanceExceeded metrics directly contribute to overall network throttling events.
Other Operational Metrics:
Thread Pools: RequestHandlerAvgIdlePercent, NetworkProcessorAvgIdlePercent (per broker) show how busy Kafka’s internal thread pools are. Consistently low idle (%) can indicate bottlenecks.
ZooKeeper: For ZooKeeper-based MSK clusters, ZooKeeperRequestLatencyMsMean and ZooKeeperSessionState reflect ZK performance (for older Kafka versions that use Zookeeper). For ZooKeeperSessionState, anything other than 1 for 5-10 mins should be alarming as there can be chances broker has an issue or zookeeper is not able to connect to brokers due to some intermittent network issue.
Tiered Storage: For clusters with tiered storage enabled, Amazon MSK provides metrics like RemoteFetchBytesPerSec, RemoteCopyBytesPerSec, RemoteLogSizeBytes, and related error/queue metrics. These track offloading to remote storage.
Intelligent rebalancing metrics: For MSK Provisioned clusters using Express brokers, Amazon MSK provides two key metrics to monitor rebalancing operations: RebalanceInProgress and UnderProvisioned metrics. See Monitor Intelligent rebalancing metrics
By grouping metrics into these categories, you can build dashboards and alerts that comprehensively cover Amazon MSK health and performance. Amazon CloudWatch also provides automatic dashboards for Amazon MSK.
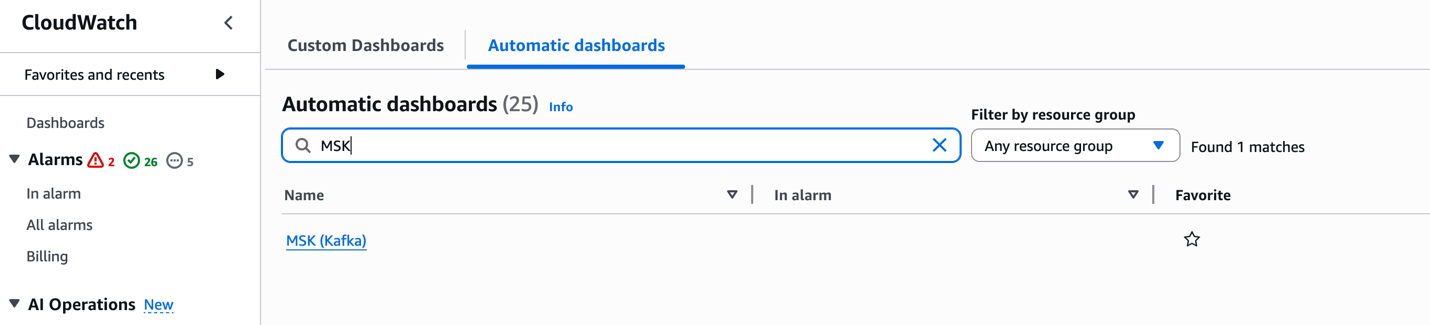
Let’s take a quick look on how to access CloudWatch automatic dashboard. In the AWS Console, go to the CloudWatch service. When in the CloudWatch console, select Dashboards. Open the Automatic dashboard tab and search for MSK in the Filter Bar.
These dashboards offer per-configured visualizations of key metrics, enabling quick insights into the health and performance of your MSK clusters.
Recommended CloudWatch alarms
Setting alarms on key metrics helps catch issues early. Detecting issues early is crucial in streaming applications where every second counts. A single failing broker can trigger a chain reaction – halting data ingestion, backing up upstream systems, and breaking downstream applications. This can quickly escalate from delayed order processing to lost revenue. Proactive monitoring helps catch and fix problems before they impact your business operations. Based on AWS best practices and experience, consider alarms such as:
Metric (Dimension)
Alarm Condition
Rationale
ActiveControllerCount (cluster)
≠ 1 (count)
Only one active controller should exist. Deviation implies cluster instability.
CPU Utilization (Sum(CPUUser+CPUSystem), per broker)
> 60% (average) for 5+ mins
Helps maintain headroom for broker load and maintenance. High CPU may slow processing as outlined in the MSK best practices documentation
HeapMemoryAfterGC (broker)
> 60% (percentage)
Indicates Kafka heap is filling up. Helps prevent OOM by alerting early.
KafkaDataLogsDiskUsed (broker)
≥ 85% (percent)
Warns that disk is nearly full. Helps prevent data loss by providing time for scaling or cleanup.
OfflinePartitionsCount (cluster)
> 0 (count)
Any offline partition means unavailable data. Immediate investigation needed.
UnderReplicatedPartitions (broker)
> 0 (count)
No replicas lagging under healthy conditions. Spikes or sustained lag can indicate overload or ACL misconfiguration.
UnderMinIsrPartitionCount (broker)
> 0 (count)
There must be topics with partitions that have either less in-sync replicas than the min.insync.replicas setting or with RF=MinISR. To find these topics whose partitions are under replicated, use command: <path-to-your-kafka-installation>/bin/kafka-topics.sh –bootstrap-server <bootstrap-server:port> —command-config client.properties –describe –under-min-isr-partitions
ConnectionCount (broker)
Sudden drop (e.g. < 90% of baseline) or spike above high threshold
Detect client connectivity issues or connection floods. Unexpected drops may mean a broker is unreachable. Refer to Amazon MSK Standard broker quota
CPUCreditBalance (for T3 broker)
< some low threshold (e.g. 10 credits)
For burstable instances, alerts when credits are nearly exhausted, which degrades performance.
VolumeQueueLength (broker)
> 0 (sustained) or rising
Indicates I/O operations are queuing, possible disk bottleneck.
NetworkRxErrors/TxErrors (broker)
> 0 (count)
Any network errors can cause packet loss or disconnections.
IAMTooManyConnections (broker)
> 0 (count)
Exceeding IAM connection limit (100) blocks new connections.
Consumer Lag (MaxOffsetLag or SumOffsetLag) (per consumer-group/topic)
> threshold (depends on SLAs, e.g. growing beyond expected)
Alerts on slow consumers so you can scale consumers or investigate backlogs.
TrafficShaping
> 0 (any throttling)
This is an indication that brokers are exceeding their allocated network bandwidth.
These are illustrative thresholds; adjust them for your workload and SLAs. The remaining metrics listed in the CloudWatch metrics for Standard and Express brokers documentation are susceptible to downstream impact from anomalies in the primary metrics above. It is recommended to enable CloudWatch alarms on a single test cluster first to validate thresholds before extending coverage across your MSK fleet.
Conclusion
In this post, we covered the important CloudWatch metrics and alarms for monitoring Amazon MSK clusters effectively. By implementing these recommended alarms, you can proactively detect and respond to potential issues before they impact your Kafka workloads. To learn more about Amazon MSK monitoring, refer to the Amazon MSK Monitoring Best Practices documentation or explore our Amazon MSK Workshops hands-on experience.
The Finnish Transport and Communications Agency (Traficom) Cyber Security Centre published PiTuKri, which consists of 52 criteria that provide guidance across 11 domains for assessing the security of cloud service providers.
An independent third-party audit firm issued the report to assure customers that the AWS control environment is appropriately designed and operating effectively to demonstrate adherence with PiTuKri requirements. This attestation demonstrates the AWS commitment to meet security expectations for cloud service providers set by Traficom.
The latest report covers a 12-month period from October 1, 2024 to September 30, 2025. AWS has added the following five services to the current PiTuKri scope:
Security and compliance is a shared responsibility between AWS and the customer. When customers move their computer systems and data to the cloud, security responsibilities are shared between the customer and the cloud service provider. For more information, see the AWS Shared Security Responsibility Model.
To learn more about our compliance and security programs, see AWS Compliance Programs. As always, we value your feedback and questions; reach out to the AWS Compliance team through the Contact Us page.
If you have feedback about this post, submit comments in the Comments section below
This
404 Media article looks at how the US Customs and Border Protection
agency (CBP) is using location data from phones to track the location of
people of interest.
Specifically, CBP says the data was in part sourced via real-time
bidding, or RTB. Whenever an advertisement is displayed inside an
app, a near instantaneous bidding process happens with companies
vying to have their advert served to a certain demographic. A side
effect of this is that surveillance firms, or rogue advertising
companies working on their behalf, can observe this process and
siphon information about mobile phones, including their
location. All of this is essentially invisible to an ordinary phone
user, but happens constantly.
We should note that the minimal advertising shown on LWN is not delivered
via this bidding system.
To provide the best experiences, we use technologies like cookies to store and/or access device information. Consenting to these technologies will allow us to process data such as browsing behavior or unique IDs on this site. Not consenting or withdrawing consent, may adversely affect certain features and functions.
Functional
Always active
The technical storage or access is strictly necessary for the legitimate purpose of enabling the use of a specific service explicitly requested by the subscriber or user, or for the sole purpose of carrying out the transmission of a communication over an electronic communications network.
Preferences
The technical storage or access is necessary for the legitimate purpose of storing preferences that are not requested by the subscriber or user.
Statistics
The technical storage or access that is used exclusively for statistical purposes.The technical storage or access that is used exclusively for anonymous statistical purposes. Without a subpoena, voluntary compliance on the part of your Internet Service Provider, or additional records from a third party, information stored or retrieved for this purpose alone cannot usually be used to identify you.
Marketing
The technical storage or access is required to create user profiles to send advertising, or to track the user on a website or across several websites for similar marketing purposes.