Post Syndicated from The Atlantic original https://www.youtube.com/watch?v=FSUHZVh-Uzs
A Conversation with Journalist Georgia Fort
Post Syndicated from The Atlantic original https://www.youtube.com/watch?v=eeuS8yc0osc
Plums
Post Syndicated from xkcd.com original https://xkcd.com/3209/

DNS-PERSIST-01: A New Model for DNS-based Challenge Validation
Post Syndicated from Let's Encrypt original https://letsencrypt.org/2026/02/18/dns-persist-01.html
When you request a certificate from Let’s Encrypt, our servers validate that you control the hostnames in that certificate using ACME challenges. For subscribers who need wildcard certificates or who prefer not to expose infrastructure to the public Internet, the DNS-01 challenge type has long been the only choice. DNS-01 works well. It is widely supported and battle-tested, but it comes with operational costs: DNS propagation delays, recurring DNS updates at renewal time, and automation that often requires distributing DNS credentials throughout your infrastructure.
We are implementing support for a new ACME challenge type, DNS-PERSIST-01, based on a new IETF draft specification. As the name implies, it uses DNS as the validation mechanism, but replaces repeated demonstrations of control with a persistent authorization record bound to a specific ACME account and CA. The draft describes this method as being “particularly suited for environments where traditional challenge methods are impractical, such as IoT deployments, multi-tenant platforms, and scenarios requiring batch certificate operations”.
DNS-01 Proves Control Repeatedly
With DNS-01, validation relies on a one-time token generated by us. Your ACME client publishes a TXT record containing that token at _acme-challenge.<YOUR_DOMAIN>, and we query DNS to confirm that it matches the expected value. Because each authorization requires a new token, DNS updates become part of the issuance workflow. The benefit is that each successful validation provides fresh proof that you currently control DNS for the name being issued.
In practice, this often means DNS API credentials live somewhere in your issuance pipeline, validation attempts involve waiting for DNS propagation, and DNS changes happen frequently — sometimes many times per day in large deployments. Many subscribers accept these tradeoffs, but others would prefer to keep DNS updates and sensitive credentials out of their issuance path.
DNS-PERSIST-01 Authorizes Persistently
DNS-PERSIST-01 approaches validation differently. Instead of publishing a new challenge record for each issuance, you publish a standing authorization in the form of a TXT record that identifies both the CA and the specific ACME account you authorize to issue for this domain.
For the hostname example.com, the record would live at _validation-persist.example.com:
_validation-persist.example.com. IN TXT (
  "letsencrypt.org;"
  " accounturi=https://acme-v02.api.letsencrypt.org/acme/acct/1234567890"
)
Once this record exists, it can be reused for new issuance and all subsequent renewals. Operationally, this removes DNS changes from the critical path.
Security and Operational Tradeoffs
With DNS-01, the sensitive asset is DNS write access. In many deployments, DNS API credentials are distributed throughout issuance and renewal pipelines, increasing the number of places an attacker might compromise them. DNS-PERSIST-01 instead binds authorization directly to an ACME account, allowing DNS write access to remain more tightly controlled after initial setup. The tradeoff is that, because the authorization record persists over time, protecting the ACME account key becomes the central concern.
Controlling Scope and Lifetime
DNS-PERSIST-01 also introduces explicit scope controls. Without additional parameters, authorization applies only to the validated Fully Qualified Domain Name (FQDN) and remains valid indefinitely.
Wildcard Certificates
Adding policy=wildcard broadens the authorization scope to include the validated FQDN, wildcard certificates such as *.example.com, and subdomains whose suffix matches the validated FQDN:
_validation-persist.example.com. IN TXT (
  "letsencrypt.org;"
  " accounturi=https://acme-v02.api.letsencrypt.org/acme/acct/1234567890;"
  " policy=wildcard"
)
Optional Expiration
Subscribers who aren’t comfortable with authorization persisting indefinitely can include an optional persistUntil timestamp. This limits how long the record may be used for new validations, but also means it must be updated or replaced before it expires. Anyone using this feature should ensure they have adequate reminders or monitoring in place so that authorization does not expire unexpectedly. The timestamp is expressed as UTC seconds since 1970-01-01:
_validation-persist.example.com. IN TXT (
  "letsencrypt.org;"
  " accounturi=https://acme-v02.api.letsencrypt.org/acme/acct/1234567890;"
  " persistUntil=1767225600"
)
Authorizing Multiple CAs
Multiple CAs can be simultaneously authorized by publishing multiple TXT records at _validation-persist.<YOUR_DOMAIN>, each containing the issuer-domain-name of the CA you intend to authorize. During validation, each CA queries the same DNS label and evaluates only the records that match its own issuer-domain-name.
Rollout Timeline
The CA/Browser Forum ballot SC-088v3, defining “3.2.2.4.22 DNS TXT Record with Persistent Value”, passed unanimously in October 2025, and the IETF ACME working group adopted the draft that same month. While the document remains an active IETF draft, the core mechanisms described here are not expected to change substantially.
Support for the draft specification is available now in Pebble, a miniature version of Boulder, our production CA software. Work is also in progress on a lego-cli client implementation to make it easier for subscribers to experiment with and adopt. Staging rollout is planned for late Q1 2026, with a production rollout targeted for some time in Q2 2026.
Пътната безопасност отвъд знаците
Post Syndicated from Симеон Иванов original https://www.toest.bg/putnata-bezopasnost-otvad-znatsite/

Един ден бях съборен на земята от внезапно отворена автомобилна врата. Шофьорът просто слезе от колата си, без да погледне в огледалото – действие, което би отнело по-малко от секунда, но може да промени нечий ден, а понякога и живот. Инцидентът беше резултат не от агресия или превишена скорост, а от подценяване на риска и липса на изградени навици за внимание.
Тази ситуация ясно показва колко уязвими са пешеходците и велосипедистите и колко често инцидентите възникват не заради грубо нарушение, а поради комбинация от среда, организация на движението и човешко поведение. Именно в резултат на тази случка осъзнах колко важен е системният поглед към пътната безопасност.
Психология на пътната безопасност
Пътната безопасност започва от ежедневните, на пръв поглед дребни решения – несъобразяване с обстановката, недоглеждане при спиране и потегляне, прибързани маневри без достатъчна видимост, непредвиждане на действията на останалите участници в движението или рискови физически действия около автомобила. Именно тези „малки“ пропуски често стоят в основата на тежки последици. Обществено известните трагични случаи – катастрофи с висока скорост в населени места, преминаване на червен сигнал, шофиране след употреба на алкохол или отнемане на предимство на пешеходна пътека – показват, че правилата са били ясни, но съзнателно или поради небрежност са били пренебрегнати. Причината рядко е в липсата на регулации; по-често тя се крие в подценяването на риска, в самоувереността и импулсивните решения зад волана.
Истинската превенция изисква повече от страх от глоба – нужни са зачитане на правилата, активно наблюдение на средата, способност да предвиждаме опасностите и толерантност към останалите на пътя. Възпитаването в нея започва рано: чрез системно обучение по пътна безопасност още в детска възраст, чрез личния пример на родителите и чрез ясни обществени стандарти за поведение. Всеки водач трябва да си зададе прост, но неудобен въпрос: спазвам ли правилата само когато има контрол, или защото осъзнавам, че всяко мое действие може да струва нечий живот? Отговорът му е ключът към реалното намаляване на риска – не новите табели, а личната дисциплина и зрелостта на обществото правят пътя по-безопасен.
Пътната безопасност като система, а не като отделна мярка
Често пътната безопасност се свежда до видими елементи – пътни знаци, маркировка, ограничения на скоростта. Подобно разбиране споделят и експерти от бранша. То обаче е ограничено, защото става въпрос за много по-дълбок и комплексен процес. Реалната безопасност се поражда не от една изолирана мярка – знак, маркирана пешеходна пътека, нови стълбове на светофара или цъфнал прожектор над пешеходната пътека, а от начина, по който всички елементи на транспортната система работят заедно.
Когато липсва синхрон между инфраструктурата, управлението на трафика и реалното човешко поведение, дори формално „правилните“ решения могат да създадат риск. Затова съвременният подход към пътната безопасност стъпва върху две ключови идеи – проактивност и холистично мислене.
Проактивна безопасност – управление на риска, а не на последствията
Проактивната пътна безопасност означава промяна в начина на мислене. Вместо да реагираме след инцидент (реактивно), трябва да се научим да разпознаваме потенциалните опасности предварително (проактивно). Това включва анализ на конфликтните точки, наблюдение на реалното поведение на участниците в движението и оценка на средата, в която това поведение се осъществява.
В рамките на концепцията за проактивна безопасност акцентът се поставя върху управлението на риска още на етап проектиране, а не върху ограничаването на последствията след настъпване на инцидент. Теорията за самообясняващата се инфраструктура предлага именно такъв превантивен инструментариум, при който пътната среда чрез начина на проектиране на улицата насочва участниците към безопасно поведение.
Например стесняването на пътните ленти в градска среда и прилагането на визуално „успокояване“ на движението (чрез дървесна растителност, паркиране по протежение на улицата или промяна в настилката) водят до естествено намаляване на скоростта, без да е необходим допълнителен контрол. Повдигнатите пешеходни пътеки и кръстовища ограничават риска от тежки инциденти, като физически принуждават водачите да намаляват скоростта в конфликтните точки. Ясното физическо отделяне на велосипедните алеи от автомобилния трафик чрез бордюри или зелени ивици ограничава възможността за странични сблъсъци, а обособяването на трамвайни трасета в самостоятелно платно, трамвайни перони и „виенски спирки“ (каквито например бяха направени на ул. „Алабин“ при бул. „Македония“ в София) елиминира взаимодействието с автомобилния поток.
Допълнително, ограничаването на дългите прави участъци в зони с интензивно пешеходно движение предотвратява неосъзнатото увеличаване на скоростта. По този начин рискът се намалява системно и предварително чрез самата структура на средата, която формира правилни очаквания и поведенчески модели, вместо да се разчита основно на санкции или на последващи компенсаторни мерки.
Възможният град – жизнен, безопасен и достъпен за всички
В статията си урбанистите Силвия Чакърова, Васил Маджирски и Ангел Буров изброяват градоустройствените проблеми у нас, които „показват липсата на чувствителност и съпричастност към жителите на града…
 Силвия Чакърова
Следващи по вид, но не и по важност инструменти за минимизиране на риска са системите за управление на трафика – светофарите. Често те се възприемат като чисто технически елемент, като поредната спънка по пътя на скоростните отсечки, но влиянието им върху безопасността е силно подценявано. Светофарите не просто регулират потоците – те структурират поведението, създават ритъм и формират очаквания у водачите, пешеходците и велосипедистите.
Добре проектираната светофарна уредба намалява несигурността. Тя ясно определя кой, кога и как преминава, като ограничава импровизацията и рисковите решения. Коректната оптимизация на фазите, междинните времена и координацията между кръстовищата води не само до по-добра пропускателна способност, но и до реално намаляване на пътнотранспортните произшествия, и по-специално на тежките, които са в резултат от несъобразена скорост, за каквато предразполага естествено средата.
Холистичният подход – пътят е жива система
Холистичното мислене в пътната безопасност трябва да ни изведе извън рамките на отделния елемент. Инфраструктурата, превозните средства и участниците в движението са взаимнозависими. Често проблемът не е само в шофьора или само в пътя, а става дума за съчетание от фактори.
Разглеждан като жива система, пътят изисква интегриран набор от мерки, които едновременно управляват риска, моделират поведението и отчитат социалния и пространствения контекст. Холистичният подход се основава на разбирането, че безопасността възниква от взаимодействието между инфраструктурата, участниците в движението и градската среда, поради което решенията следва да бъдат системни и взаимно подкрепящи се.
На стратегическо ниво това включва прилагането на концепции като „Безопасна система“ (Safe System Approach) и „Визия нула“ (Vision Zero), в които се приема, че човешките грешки са неизбежни и инфраструктурата трябва да бъде проектирана така, че да не допуска те да водят до фатални последствия. В практическо измерение това се реализира чрез класификация на уличната мрежа според функцията ѝ (например транзитна, разпределителна, локална), като всяка категория има ясно разпознаваем профил и режим на движение.
Сред конкретните пространствени и организационни мерки може да се посочат:
- зони, в които шофирането е ограничено до 30 км/ч, и зони за споделено пространство в жилищни и централни градски части, където чрез дизайн, а не само чрез знаци се постига ниска скорост и приоритет на уязвимите участници;
- непрекъснати и защитени велосипедни мрежи, физически отделени от автомобилния поток и логически свързани в единна система, с удобни връзки на пресичащи се в различни направления мрежи, минимално количество конфликтни точки с другите типове транспорт;
- компактни кръстовища с намалени радиуси на завиване, които ограничават скоростта при маневри и скъсяват пешеходните пресичания;
- повдигнати кръстовища и пешеходни пътеки, интегрирани в цялостна концепция за успокояване на движението;
- транспортно ориентирано развитие, при което висококачественият обществен транспорт, пешеходната достъпност и смесените функции намаляват зависимостта от автомобилите;
- интегрирано управление на скоростта, съчетаващо геометричен дизайн, специални настилки, видими бордюри, тактилни водещи ивици за незрящи, визуални стеснения и контролни механизми.
Холистичният подход предполага и координация между транспортно планиране, градоустройство, ландшафтна архитектура и политики за обществено здраве. Озеленяването, активните партерни етажи (например с витрини или с гледащи към улицата балкони), доброто осветление и социалният контрол също допринасят за усещането за безопасност и за реалното намаляване на риска.
В този смисъл пътят не е просто инженерно съоръжение, а динамична градска екосистема, в която устойчивата безопасност се постига чрез съгласувани, последователни и дългосрочни решения.
Като инженер по транспортно строителство и одитор по пътна безопасност мога да кажа, че в одитите често се среща несъгласуваност между различните решения. Например едно кръстовище може да отговаря на всички нормативни изисквания, но ако светофарните фази не отчитат реалните пешеходни потоци или поведението на велосипедистите, рискът остава висок. Холистичният подход изисква не просто спазване на стандартите, а разбиране на реалното използване на пространството.
Светофарните уредби отново са ключов елемент. Те могат и трябва да се адаптират към конкретния контекст – училищни зони, райони с интензивно велосипедно движение или пространства с висока пешеходна активност. Управлението на трафика за мен не е статичен процес, а динамична дейност, която трябва да се развива заедно с града.
Добри практики и техните реални граници
Прилагането на утвърдени добри практики в областта на пътната безопасност изисква не само познаване на концепциите, но и прецизно техническо оразмеряване и съобразяване с конкретния контекст. В противен случай съществува риск от формално внедряване на мерки, без да се постигне реален и устойчив ефект.
Една от добрите практики, които смятам за особено ценни в градска среда, е т.нар. самообясняваща се инфраструктура, или Self-Explaining Roads (SER). Това е подход за проектиране на пътната инфраструктура, при който самият път „подсказва“ на водачите как да се държат. Идеята е пътната среда сама да насочва към правилно поведение, без да разчита единствено на знаци и санкции.
Например въвеждането на зони с ограничение до 30 км/ч е доказано ефективно за намаляване на тежестта на произшествията, тъй като при такава скорост вероятността от фатален изход при удар на пешеходец е значително по-ниска, отколкото при 50 км/ч. Практическият резултат обаче зависи и от фактори като широчината на пътя и дали има ограничени прави участъци, повдигнати кръстовища, какви са тротоарите и т.н. Следователно ефективността на мярката зависи от съответствието между регулацията и физическата среда.
Сходна е ситуацията при велосипедните алеи. За да функционират безопасно, те трябва да отговарят на определени условия. В противен случай правилната мярка губи значителна част от потенциала си поради непълна интеграция в мрежата.
Концепцията за споделено пространство (shared space) показва добри резултати в зони с ниска интензивност на движение (през които обикновено преминават под 4000–6000 моторни превозни средства на ден), където взаимодействието между участниците регулира поведението. При участъци с натоварен трафик или при уязвими групи, като хора със зрителни затруднения обаче, липсата на ясно разграничени зони може да доведе до несигурност и повишен субективен риск.
Концепцията за достъпна среда на фона на ремонтите на тротоарите в София
По закон трябва да имаме достъпна среда, но не я виждаме в реалността. Ивелина Гаджева и Константин Кирилов от „Екипът на София“ разказват как нещата могат да се подобрят, и ни запознават с основни концепции в тази област. А изкуствен интелект възпява родните тротоари в поетични строфи.
 Ивелина Гаджева
Тези примери показват, че добрите практики не са универсални решения, а инструменти, чиято ефективност зависи от функцията на улицата, интензивността и състава на движението, както и от градската среда. Устойчивото управление на риска изисква техническа обоснованост, последователност и съгласуваност между отделните мерки. Именно осъзнаването на реалните граници на всяка интервенция превръща добрата практика в професионално и дългосрочно решение.
В същото време съм убеден, че няма универсални решения. Адаптивните системи за управление на трафика имат огромен потенциал, но изискват качествени данни, постоянна поддръжка и добре обучени специалисти. Без тези условия те могат да загубят своята ефективност или дори да създадат нови конфликтни ситуации. Затова всяко решение трябва да бъде оценявано спрямо конкретния контекст, а не прилагано механично.
Минимизиране на последствията – реалистичният поглед към безопасността
Дори най-добре проектираната система не може да предотврати изцяло инцидентите. Затова вторият основен стълб на съвременната пътна безопасност е минимизирането на последствията. Това включва както пасивната безопасност на превозните средства (например въздушни възглавници, системи за следене на дистанцията до предния автомобил, следене на пътните ленти и знаци и пр.), така и инфраструктурни решения, които ограничават енергията на сблъсъка.
В контекста на проактивната безопасност и системния подход към проектирането следва да се разглеждат и инфраструктурни решения, които целенасочено ограничават енергията на сблъсъка. Дори сравнително малко намаляване на скоростта води до съществено редуциране на енергията, която се предава върху човешкото тяло при удар. Следователно ролята на инфраструктурата не е единствено да предотвратява конфликти, но и да ограничава последствията в случаите, когато грешки все пак настъпят.
Ограничаването на енергията на сблъсъка може да се постигне и чрез пространствено разделяне на потоците, както вече стана дума по-горе. Физическото отделяне на велосипедисти и пешеходци от автомобилното движение, обособяването на трамвайни трасета или прилагането на средни разделителни ивици намаляват вероятността от директен страничен или челeн удар с голяма сила. Кръговите кръстовища трансформират потенциалните челни конфликти в странични – с по-ниска относителна скорост и по-лек удар.
Допълнителен аспект е използването на елементи като еластични огради (мантинели), ударопоглъщащи буфери пред твърди препятствия. Управлението на трафика и светофарните уредби са сред най-мощните инструменти за намаляване на риска, когато се използват професионално и в синергия с останалите елементи на уличната инфраструктура.
По този начин инфраструктурата става активен инструмент за намаляване на силата на удара. Тя не разчита единствено на предотвратяване на грешки, а приема тяхната неизбежност и цели да поддържа силата на евентуалния сблъсък в граници, които минимизират тежките и фаталните последствия. Именно това разбиране е в основата на съвременните подходи към устойчив модел на безопасност.
И според професионалния ми поглед, и според личния ми опит
проактивната и холистична система за пътна безопасност не е абстрактна концепция, а необходимост. Тя изисква експертно мислене, последователност и дълбоко разбиране на човешкото поведение.
В крайна сметка безопасността на пътя не зависи от един знак или една система, а от качеството на цялостния подход – от начина, по който планираме, проектираме и управляваме движението, и от отговорността, която носим като специалисти и участници в тази обща система.
В настоящата ни съвместна поредица с „Екипът на София“ обсъждаме планирането, озеленяването, архитектурата, инфраструктурата, мобилността и още много други градски теми, описваме добрите примери и търсим възможните решения за подобряването на качеството на живот в нашите градове.

A Band Left Spotify—and Its from Man Says AI Impersonators Rushed In
Post Syndicated from The Atlantic original https://www.youtube.com/shorts/DeZTHZtre9Q
Amazon Managed Service for Apache Flink application lifecycle management with Terraform
Post Syndicated from Felix John original https://aws.amazon.com/blogs/big-data/amazon-managed-service-for-apache-flink-application-lifecycle-management-with-terraform/
In this post, you’ll learn how to use Terraform to automate and streamline your Apache Flink application lifecycle management on Amazon Managed Service for Apache Flink. We’ll walk you through the complete lifecycle including deployment, updates, scaling, and troubleshooting common issues.
Managing Apache Flink applications through their entire lifecycle from initial deployment to scaling or updating can be complex and error-prone when done manually. Teams often struggle with inconsistent deployments across environments, difficulty tracking configuration changes over time, and complex rollback procedures when issues arise.
Infrastructure as Code (IaC) addresses these challenges by treating infrastructure configuration as code that can be versioned, tested, and automated. While there are different IaC tools available including AWS CloudFormation or AWS Cloud Development Kit (AWS CDK), we focus on HashiCorp Terraform to automate the complete lifecycle management of Apache Flink applications on Amazon Managed Service for Apache Flink.
Managed Service for Apache Flink allows you to run Apache Flink jobs at scale without worrying about managing clusters and provisioning resources. You can focus on developing your Apache Flink using your Integrated Development Environment (IDE) of choice, building and packaging the application using standard build and CI/CD tools. Once your application is packaged and uploaded to Amazon S3, you can deploy and run it with a serverless experience.
While you can control your Managed Service for Apache Flink applications directly using the AWS Console, CLI, or SDKs, Terraform provides key advantages such as version control of your application configuration, consistency across environments, and seamless CI/CD integration. This post builds upon our two-part blog series “Deep dive into the Amazon Managed Service for Apache Flink application lifecycle – Part 1” and “Part 2” that discusses the general lifecycle concepts of Apache Flink applications.
We use the sample code published on the GitHub repository to demonstrate the lifecycle management. Note that this is not a production-ready solution.
Setting up your Terraform environment
Before you can manage your Apache Flink applications with Terraform, you need to set up your execution environment. In this section, we’ll cover how to configure Terraform state management and credential handling. The Terraform AWS provider supports Managed Service for Apache Flink through the aws_kinesis_analyticsv2_application resource (using the legacy name “Kinesis Analytics V2“).
Terraform state management
Terraform uses a state file to track the resources it manages. In Terraform, storing the state file in Amazon S3 is a best practice for teams working collaboratively because it provides a centralised, durable, and secure location for tracking infrastructure changes. However, since multiple engineers or CI/CD pipelines may run Terraform simultaneously, state locking is essential to prevent race conditions where concurrent executions could corrupt the state. S3 as backend is commonly used for state storage and locking, ensuring that only one Terraform process can modify the state at a time, thus maintaining infrastructure consistency and avoiding deployment conflicts.
Passing credentials
To run Terraform inside a Docker container while ensuring that it has access to the necessary AWS credentials and infrastructure code, we follow a structured approach. This process involves exporting AWS credentials, mounting required directories, and executing Terraform commands inside a Docker container. Let’s break this down step by step. Before running Terraform, we need to make sure that our Docker container has access to the required AWS credentials. Since we are using temporary credentials, we generate them using the AWS CLI with the following command:
aws configure export-credentials --profile $AWS_PROFILE --format env-no-export > .env.dockerThis command does the following:
- It exports AWS credentials from a specific AWS profile (
$AWS_PROFILE). - The credentials are saved in
.env.dockerin a format suitable for Docker. - The
--format env-no-exportoption displays credentials as non-exported shell variables
This file (.env.docker) will later be used to pass credentials into the Docker container
Running Terraform in Docker
Running Terraform inside a Docker container provides a consistent, portable, and isolated environment for managing infrastructure without requiring Terraform to be installed directly on the local machine. This approach ensures that Terraform runs in a controlled environment, reducing dependency conflicts and improving security. To execute Terraform within a Docker container, we use a docker run command that mounts the necessary directories and passes AWS credentials, allowing Terraform to apply infrastructure changes seamlessly.
The Terraform configuration files are stored in a local terraform folder, which is virtually attached to the container using the -v flag. This allows the containerised Terraform instance to access and modify infrastructure code as if it were running locally.
To run Terraform in Docker, the following command is executed:
Breaking down this command step by step:
--env-file .env.dockerprovides the AWS credentials required for Terraform to authenticate.--rm -itruns the container interactively and is removed after execution to prevent clutter.-v ./terraform:/home/flink-project/terraformmounts the Terraform directory into the container, making the configuration files accessible.-v ./build.sh:/home/flink-project/build.shmounts thebuild.shscript, which contains the logic to build JAR file for flink and execute Terraform commands.msf-terraformis the Docker image used, which has Terraform pre-installed.bash build.sh applyruns thebuild.shscript inside the container, passingapplyas an argument to trigger the Terraform apply process.
Inside the container, build.sh typically includes commands such as terraform init to initialise the Terraform working directory and terraform apply to apply infrastructure changes. Since the Terraform execution happens entirely within the container, there is no need to install Terraform locally, and the process remains consistent across different systems. This method is particularly beneficial for teams working in collaborative environments, as it standardises Terraform execution and allows for reproducibility across development, staging, and production environments.
Managing application lifecycle with Terraform
In this section, we walk through each phase of the Apache Flink application lifecycle and understand how you can implement these operations using Terraform. While these operations are usually fully automated as part of a CI/CD pipeline, you will execute the individual steps manually from the command line for demonstration purposes. There are many ways to run Terraform depending on your organization’s tooling and infrastructure setup, but for this demonstration, we run Terraform in a container alongside the application build to simplify dependency management. In real-world scenarios, you would typically have separate CI/CD stages for building your application and deploying with Terraform, with distinct configurations for each environment. Since every organization has different CI/CD tooling and approaches, we keep these implementation details out of scope and focus on the core Terraform operations.
For a comprehensive deep dive into Apache Flink application lifecycle operations, refer to our previous two-part blog series.
Create and start a new application
To get started you want to create your Apache Flink application running on Managed Service for Apache Flink. You should execute the following Docker command:
This command will complete the following operations by executing the bash script build.sh:
- Building the Java ARchive (JAR) file from your Apache Flink application
- Uploading the JAR file to S3
- Setting the config variables for your Apache Flink application in
terraform/config.tfvars.json - Create and deploy the Apache Flink application to Managed Service for Apache Flink using
terraform apply
Terraform fully covers this operation. You can check the running Apache Flink application using AWS CLI or inside the Managed Apache Flink Console after Terraform completes with Apply Complete! Terraform is expecting the Apache Flink artifact, i.e. the JAR file to be packaged and copied to S3. This operation is usually part of the CI/CD pipeline and executed before invoking the terraform apply. Here, the operation is specified in the build.sh script.
Deploy code change to an application
You have successfully created and started the Flink application. However, you realize that you have to make a change to the Flink application code. Let’s make a code change to the application code in flink/ and see how to build and deploy it. After making the necessary changes, you simply have to run the following Docker command again that builds the JAR file, uploads it to S3 and deploys the Apache Flink application using Terraform:
This phase of the lifecycle is fully supported by Terraform as long as both applications are state compatible, meaning that the operators of the upgraded Apache Flink application are able to restore the state from the snapshot that is taken from the old application version, before Managed Service for Apache Flink stops and deploys the change. For example, removing a stateful operator without enabling the allowNonRestoredState flag or changing an operator’s UID could prevent the new application from restoring from the snapshot. For more information on state compatibility, refer to Upgrading Applications and Flink Versions. For an example of state incompatibility, and strategies for handling state incompatibility, refer to Introducing the new Amazon Kinesis source connector for Apache Flink.
When deploying a code change goes wrong – A problem prevents the application code from being deployed
You also need to be careful with deploying code changes that contain bugs preventing the Apache Flink job from starting. For more information, refer to failure mode (a) – a problem prevents the application code from being deployed under When starting or updating the application goes wrong. For instance, this can be simulated by setting the mainClass in flink/pom.xml mistakenly to com.amazonaws.services.msf.WrongJob. Similar to before you build the JAR, upload it and run the terraform apply by running the Docker command from above. However, Terraform now fails to correctly apply the changes and throws an error message as the Apache Flink application fails to correctly update. Finally, the application status moves to READY.

To remedy the issue, you have to change the value of mainClass back to the original one and deploy the changes to Managed Service for Apache Flink. The Apache Flink application remains in READY status and doesn’t start automatically, as this was its state before applying the fix. Note that Terraform does not try to start the application when you deploy a change. You will have to manually start the Flink application using the AWS CLI or through the Managed Apache Flink Console.
As detailed in Part 2 of the companion blog, there is a second failure scenario where the application starts successfully, but the job becomes stuck in a continuous fail-and-restart loop. A code change can also cause this failure mode. We will cover the second error scenario when we cover deploying configuration changes.
Manual rollback application code to previous application code
As part of the lifecycle management of your Apache Flink application, you may need to explicitly rollback to a previous running application version. This is particularly useful when a newly deployed application version with application code changes exhibits unexpected behaviour and you want to explicitly rollback the application. Currently, Terraform does not support explicit rollbacks of your Apache Flink application running in Managed Service for Apache Flink. You will have to resort to therollbackApplication API through the AWS CLI or the Managed Service for Apache Flink Console to revert the application to the previous running version.
When you perform the explicit rollback, Terraform will initially not be aware of the changes. More specifically, the S3 path to the JAR file in the Managed Service for Apache Flink service (see left part of the image below) is different to the S3 path denoted in the terraform.tfstate file stored in Amazon S3 (see the right part of the image below). Fortunately, Terraform will always perform refreshing actions that include reading the current settings from all managed remote objects and updating the Terraform state to match as part of creating a plan in both terraform plan and terraform apply commands.
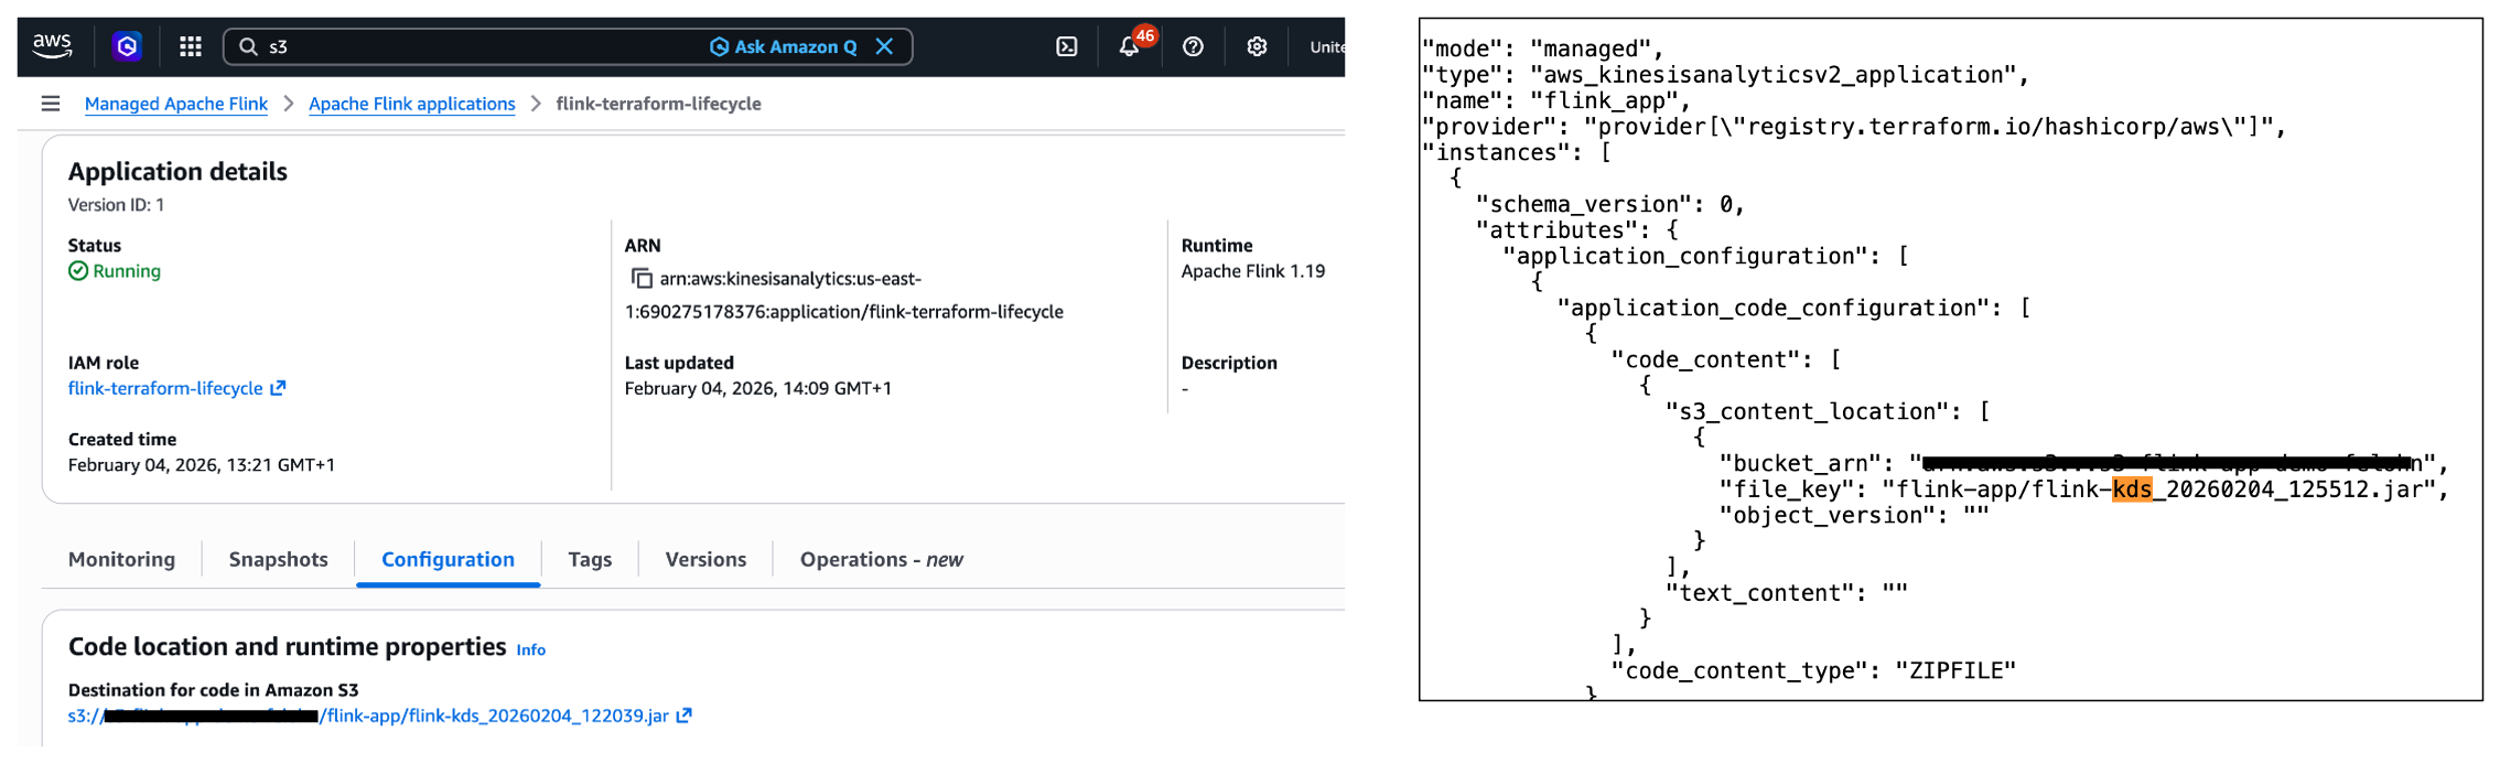
In summary, while you can not perform a manual rollback using Terraform, Terraform will automatically refresh the state when deploying a change using terraform apply.
Deploy config change to application
You have already made changes to the application code of your Apache Flink application. What about making changes to the config of the application, e.g., changing runtime parameters? Imagine you want to change the application logging level of your running Apache Flink application. To change the logging level from ERROR to INFO, you have to change the value for flink_app_monitoring_metrics_level in the terraform/config.tfvars.json to INFO. To deploy the config changes, you need to run the docker run command again as done in the previous sections. This scenario works as expected and is fully covered by Terraform.
What happens when the Apache Flink application deploys successfully but fails and restarts during execution? For more information, please refer to failure mode (b) – the application is started, the job is stuck in a fail-and-restart loop under When starting or updating the application goes wrong. Note that this failure mode can happen when making code changes as well.
When deploying config change goes wrong – The application is started, the job is stuck in a fail-and-restart loop
In the following example, we apply a wrong configuration change preventing the Kinesis connector from initialising correctly, ultimately putting the job in a fail-and-restart loop. To simulate this failure scenario, you’ll need to modify the Kinesis stream configuration by changing the stream name to a non-existent one. This change is made in the terraform/config.tfvars.json file, specifically altering the stream.name value under flink_app_environment_variables. When you deploy with this invalid configuration, the initial deployment will appear successful, showing an Apply Complete! message. The Flink application status will also show as RUNNING. However, the actual behaviour reveals problems. If you check the Flink Dashboard, you’ll see the application is continuously failing and restarting. Also, you will see a warning message about the application requiring attention in the AWS Console.
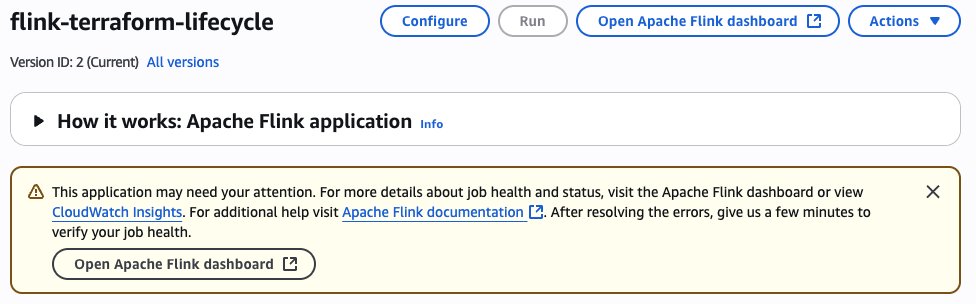
As detailed in the section Monitoring Apache Flink application operations in the companion blog (part 2), you can monitor the FullRestarts metric to detect the fail-and-restart loop.
Reverting the changes made to the environment variable and deploying the changes will result in Terraform showing the following error message: Failed to take snapshot for the application flink-terraform-lifecycle at this moment. The application is currently experiencing downtime.

You have to force-stop without a snapshot and restart the application with a snapshot to get your Flink application back to a properly functioning state. You should constantly monitor the application state of your Apache Flink application to detect any issues.
Other common operations
Manually scaling the application
Another common operation in the lifecycle of your Apache Flink application is scaling the application up or down by adjusting the parallelism. This operation changes the number of Kinesis Processing Units (KPUs) allocated to your application. Let’s look at two different scaling scenarios and how they are handled by Terraform.
In the first scenario, you want to change the parallelism of your running Apache Flink application within the default parallelism quota. To do this, you need to modify the value for flink_app_parallelism in the terraform/config.tfvars.json file. After updating the parallelism value, you deploy the changes by running the Docker command as done in the previous sections:
This scenario works as expected and is fully covered by Terraform. The application will be updated with the new parallelism setting, and Managed Service for Apache Flink will adjust the allocated KPUs accordingly. Note that there is a default quota of 64 KPUs for a single Managed Service for Apache Flink application, which must be raised proactively via a quota increase request if you need to scale your Managed Service for Apache Flink application beyond 64 KPUs. For more information, refer to Managed Service for Apache Flink quota.
Less common change deployments which require special handling In this section we analyze some less common change deployment scenarios which require some special handling.
Deploy code change that removes an operator
Removing an operator from your Apache Flink application requires special consideration, particularly regarding state management. When you remove an operator, the state from that operator still exists in the latest snapshot, but there’s no longer a corresponding operator to restore it. Let’s take a closer look at this scenario and understand how you can handle it properly. First, you need to make sure that the parameter AllowNonRestoredState is set to True. This parameter specifies whether the runtime is allowed to skip a state that cannot be mapped to the new program, when restoring from a snapshot. Allowing non-restored state is required to successfully update an Apache Flink application when you dropped an operator. To enable the AllowNonRestoredState, you need to set the configuration value for flink_app_allow_non_restored_state to true in terraform/config.tfvars.json. Then, you can go ahead and remove an operator: For example, you can directly have the sourceStream write to the sink connector in flink/src/main/java/com/amazonaws/services/msf/StreamingJob.java. Change code line 146 from windowedStream.sinkTo(sink).uid("kinesis-sink")to sourceStream.sinkTo(sink).uid("kinesis-sink"). Make sure that you have commented out the entire windowedStream code block (lines 103 to 140).
This change will remove the windowed computation and directly connect the source stream to the sink, effectively removing the stateful operation. After removing the operator from your Flink application code, you deploy the changes using the Docker command as previously done. However, the deployment fails with the following error message: Could not execute application. As a result, the Apache Flink application moves to the READY state. To recover from this situation, you need to restart the Apache Flink application using the latest snapshot for the application to successfully start and move to RUNNING status. Importantly, you need to make sure that AllowNonRestoredState is enabled. Otherwise, the application will fail to start as it cannot restore the state for the removed operator.
Deploy change that breaks state compatibility with system rollback enabled
During the lifecycle management of your Apache Flink application, you might encounter scenarios where code changes break state compatibility. This typically happens when you modify stateful operators in ways that prevent them from restoring their state from previous snapshots.
A common example of breaking state compatibility is changing the UID of a stateful operator (such as an aggregation or windowing operator) in your application code. To safeguard against such breaking changes, you can enable the automatic system rollback feature in Managed Service for Apache Flink as described in the subsection Rollback under Lifecycle of an application in Managed Service for Apache Flink previously. This feature is disabled by default and can be enabled using the AWS Management Console or invoking the UpdateApplication API operation. There is no way in Terraform to enable system rollback.
Next, let’s demonstrate this by breaking the state compatibility of your Apache Flink application by changing the UID of a stateful operator, e.g., the string windowed-avg-price in line 140 of flink/src/main/java/com/amazonaws/services/msf/StreamingJob.java to windowed-avg-price-v2 and deploy the changes as before. You will encounter the following error:
Error: waiting for Kinesis Analytics v2 Application (flink-terraform-lifecycle) operation (*) success: unexpected state ‘FAILED’, wanted target ‘SUCCESSFUL’. last error: org.apache.flink.runtime.rest.handler.RestHandlerException: Could not execute application.
At this point, Managed Service for Apache Flink automatically rolls back the application to the previous snapshot with the previous JAR file, maintaining your application’s availability as you have enabled system-rollback capability. Terraform will initially be not aware of the performed rollback. Fortunately, as we have already witnessed in subsection Manual rollback application code to previous application code, Terraform will automatically refresh the state when we change UID to the previous value and deploy the changes.
In-place upgrade of Apache Flink runtime version
Managed Service for Apache Flink supports in-place upgrade to new Flink runtime versions. See the documentation for more details. Updating the application dependencies and any required code changes is a responsibility of the user. Once you have updated the code artifact, the service is able to upgrade the runtime of your running application in-place, without data loss. Let’s examine how Terraform handles Flink version upgrades.
To upgrade your Apache Flink application from version 1.19.1 to 1.20, you need to:
- Update the Flink dependencies in your
flink/pom.xmlto version1.20.0(flink.versionto1.20.1andflink.connector.versionto5.0.0-1.20in<properties>) - Update the
flink_app_runtime_environmenttoFLINK-1_20interraform/config.tfvars.json - Build and deploy the changes using the familiar
docker runcommand
Terraform successfully performs an in-place upgrade of your Flink application. You will receive the following message: Apply complete! Resources: 0 added, 1 changed, 0 destroyed.
Operations currently not supported by Terraform
Let’s take a closer look at operations that are currently not supported by Terraform.
Starting or stopping the application without any configuration change
Terraform provides the start_application parameter, indicating whether to start or stop the application. You can set this parameter using flink_app_start in config.tfvars.json to stop your running Apache Flink application. However, this will only work if the current configuration value is set to true. In other words, Terraform only responds to the change in the parameter value, not the absolute value itself. After Terraform applies this change, your Apache Flink application will stop and its application status will move to READY. Similarly, restarting the application requires changing the flink_app_start value back to true, but this will only take effect if the current configuration value is false. Terraform will then restart your application, moving it back to the RUNNING state.
In summary, you cannot start or stop your Apache Flink application without making any configuration change in Terraform. You have to use AWS CLI, AWS SDK or AWS Console to start or stop your application.
Restarting application from an older snapshot or no snapshot without any configuration change
Similar to the previous section, Terraform requires an actual configuration change of application_restore_type to trigger a restart with different snapshot settings. Simply reapplying the same configuration values won’t initiate a restart from a different snapshot or no snapshot. You have to use AWS CLI, AWS SDK or AWS Console to restart your application from an older snapshot.
Performing rollback triggered manually or by system-rollback feature
Terraform does not support performing a manual rollback nor automatic system rollback. In addition, Terraform will also not be aware when such a rollback is taking place. The state information will be outdated, e.g. S3 path information. However, Terraform automatically performs refreshing actions to read settings from all managed remote objects and updates the Terraform state to match. Consequently, you can have Terraform refresh the Terraform state by successfully running a terraform apply command.
Conclusion
In this post, we demonstrated how to use Terraform to automate the lifecycle management of your Apache Flink applications on Managed Service for Apache Flink. We walked through fundamental operations including creating, updating, and scaling applications, explored how Terraform handles various failure scenarios and examined advanced scenarios such as removing operators and performing in-place runtime upgrades. We also identified operations that are currently not supported by Terraform.
For more information, see Run a Managed Service for Apache Flink application and our two-part blog on Deep dive into the Amazon Managed Service for Apache Flink application lifecycle.
Build a data pipeline from Google Search Console to Amazon Redshift using AWS Glue
Post Syndicated from Anirudh Chawla original https://aws.amazon.com/blogs/big-data/build-a-data-pipeline-from-google-search-console-to-amazon-redshift-using-aws-glue/
Google Search Console (GSC) is a service offered by Google that helps you monitor, maintain, and troubleshoot your site’s presence in Google Search results. It provides you unique insights directly from Google about how the search engine sees your site, helping you improve your performance in Search Engine Results Pages (SERPs).
When there is a need to merge Google Search Console data with multiple data sources or conduct complex performance analysis, traditional methods can become time-consuming and error-prone. This is where Amazon Redshift and AWS Glue offer a comprehensive data integration solution.
In this post, we explore how AWS Glue extract, transform, and load (ETL) capabilities connect Google applications and Amazon Redshift, helping you unlock deeper insights and drive data-informed decisions through automated data pipeline management. We walk you through the process of using AWS Glue to integrate data from Google Search Console and write it to Amazon Redshift.
Solution overview
AWS Glue is a serverless data integration service that helps discover, prepare, and combine data for analytics, machine learning (ML), and application development. You can use AWS Glue to create, run, and monitor data integration and ETL pipelines and catalog your assets across multiple data stores.
Amazon Redshift is a fast, scalable, and fully managed cloud data warehouse that lets you to process and run complex SQL analytics workloads on structured and semi-structured data. It also helps you securely access your data in operational databases, data lakes, or third-party datasets with minimal movement or copying of data. Tens of thousands of customers use Amazon Redshift to process large amounts of data, modernize their data analytics workloads, and provide insights for their business users.
The following diagram illustrates the architecture that we implement in this post.
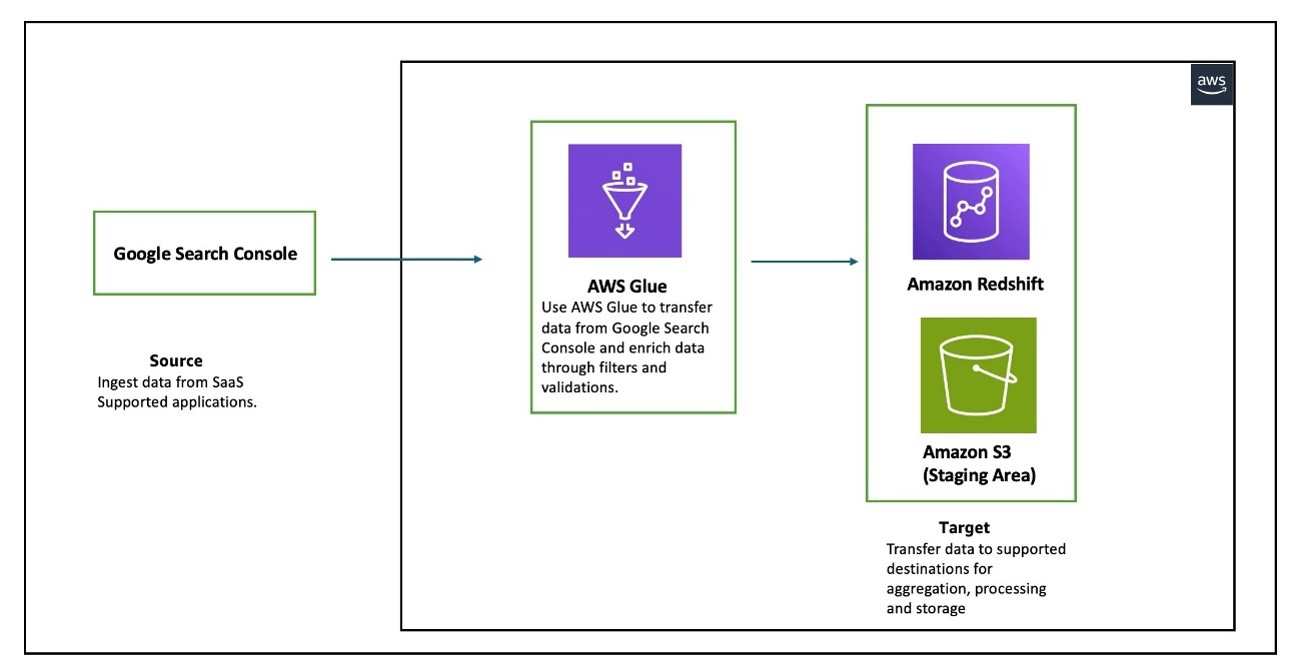
The workflow consists of an AWS Glue job reading data from Google Search Console for the three entities that Google Search Console supports (Search Analytics, Sites, and Sitemaps), and writing the data in a Redshift provisioned cluster. AWS Glue supports Google Search Console API v3.
In the following sections, we walk through the following steps to configure AWS Glue to set up a connection between Google Search Console and Amazon Redshift for data migration:
- Create an OAuth client.
- Create an IAM role for AWS Glue integration with Google Search Console, AWS Secrets Manager, and Amazon Redshift.
- Create a secret in Secrets Manager to store the client secret created in the previous step.
- Create a connection to Google Search Console in AWS Glue.
- Create a connection to Amazon Redshift in AWS Glue.
- Set up a table and permissions in Amazon Redshift.
- Create an ETL job in AWS Glue.
Prerequisites
Before starting this walkthrough, you must have the following prerequisites in place:
- An AWS account.
- A Google Cloud account and a Google Cloud project.
- In your Google Cloud project, you must enable the Google Search Console API.
For instructions, see Enable and disable APIs on the API Console Help for Google Cloud Platform. - A provisioned cluster or Amazon Redshift Serverless .
In this post, we use a single-node ra3.large Redshift provisioned cluster deployed in a single Availability Zone. This configuration is used for demonstration purposes only. For production environments, we recommend using multi-node clusters with a minimum of two nodes deployed across multiple Availability Zones for high availability and better performance. - An Amazon Simple Service Storage (Amazon S3) bucket.
- An AWS Identity and Access Management (IAM) role that grants AWS Glue and Amazon Redshift read-only access to Amazon S3. This role will be attached to the Redshift cluster or Redshift Serverless namespace during creation, and will also be used when running the AWS Glue job along with permissions to read and write secrets to Secrets Manager. Refer to the Amazon Redshift Database Developer Guide for more details.
Create OAuth client
To connect to Google Search Console, AWS Glue requires OAuth 2.0 for authentication. You must create an OAuth 2.0 client ID, which AWS Glue uses when requesting an OAuth 2.0 access token. To create an OAuth 2.0 client ID in the Google Cloud Platform console, follow these steps:
- On the Google Cloud Platform console, from the projects list, choose a project or create a new one.
- If the APIs & Services page isn’t already open, choose the menu icon on the upper left and choose APIs & Services.
- In the navigation pane, choose Credentials.
- Choose Create Credentials, then choose OAuth client ID.
- Select Web application as the application type, enter NewClient as the name, and provide https://console.aws.amazon.com for Authorized JavaScript origins.
- For Authorized redirect URIs, add https://us-east-1.console.aws.amazon.com/gluestudio/oauth. This example uses us-east-1 for setting up AWS Glue jobs; change the redirect URIs according to your AWS Region. Multiple redirect URIs can also be specified.
- Choose Create.
- Open the details page for your new client.
- Under Additional information, note down the client ID and client secret. You will need these details when configuring the secret in Secrets Manager.
Create IAM role for AWS Glue integration with Google Search Console, Secrets Manager, and Amazon Redshift
You can use AWS Glue to transfer data from supported sources into your Redshift databases. You need an IAM role because AWS Glue needs authorization to write into Redshift databases. To create a role, complete the following steps:
- Sign in to the IAM console with sufficient access to create policies.
- Choose Policies in the navigation pane.
- Choose Create policy.
- On the JSON tab, enter the following policy. AWS Glue needs the following permissions to access and run SQL statements in the Redshift database and create and retrieve secrets with Secrets Manager:
Modify the S3 bucket name that you are using as the staging bucket. Additionally, AWS Glue must have access to specific AWS owned S3 buckets for hosting AWS Glue transforms. In this example, the IAM policy uses aws-glue-studio-transforms-510798373988-prod-us-east-1, which is the AWS owned bucket in the us-east-1 Region. Refer to Review IAM permissions needed for ETL jobs for the appropriate bucket name for your Region.
- Choose Next.
- For Policy name, enter a name (for this post, we use glue-redshift-gsc-policy).
- Enter a description, then choose Create policy.
- In the navigation pane, choose Roles and Create role.
- Choose Custom trust policy and enter the following, then choose Next.
- Search for and select the policy glue-redshift-gsc-policy, then choose Next.
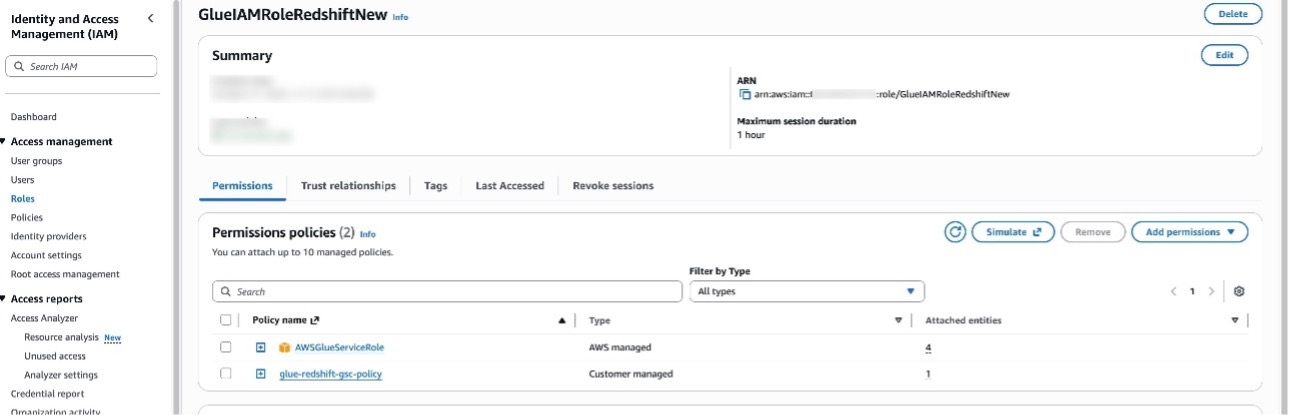
- Provide the role name GlueIAMRoleRedshiftNew or another name and relevant Description, then choose Create role.
- After the role is created, choose Add permissions and Attach policies.
- Search for AWSGlueServiceRole and choose Add Permissions. This policy is typically attached to roles specified when defining crawlers, jobs, and development endpoints.
Create secret in Secrets Manager
Complete the following steps to create a Secrets Manager secret:
- On the Secrets Manager console, choose Store a new secret.
- Select Other type of secret.
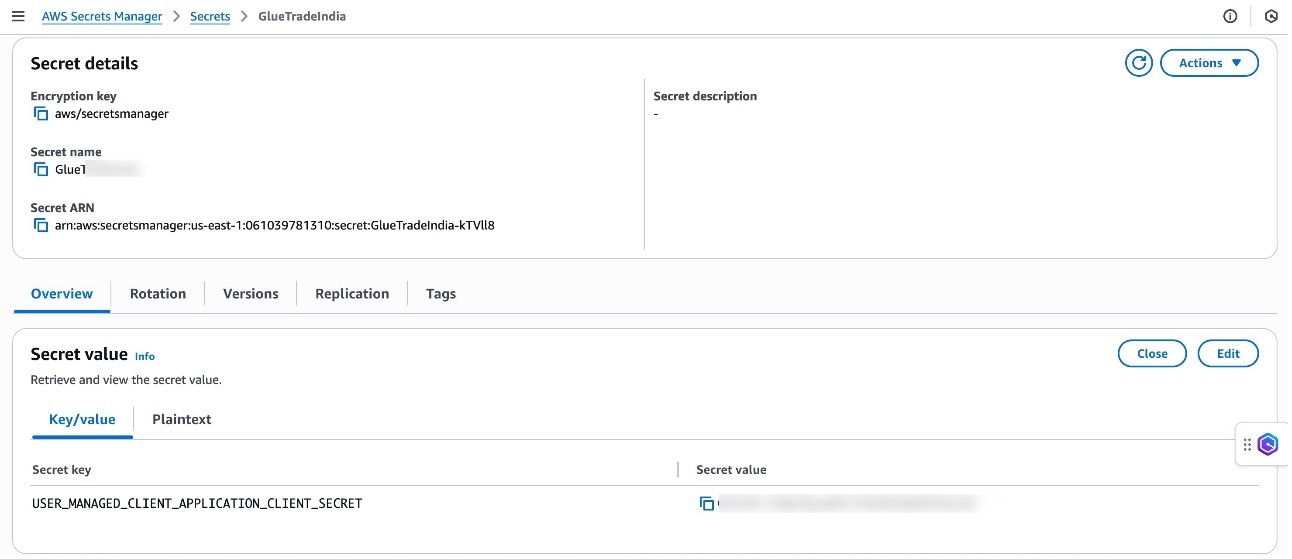
- For the customer-managed connected application, the secret should contain the connected application’s consumer secret with USER_MANAGED_CLIENT_APPLICATION_CLIENT_SECRET as the key and the client secret value as created in the previous step.

- Choose Next.
- Enter a secret name and choose Next.
- Choose Store.
Create connection to Google Search Console in AWS Glue
To create a connection to Google Search Console in AWS Glue, follow these steps:
- Sign in to the AWS Glue console with an authorized email ID with permissions already provided in Google Search Console.
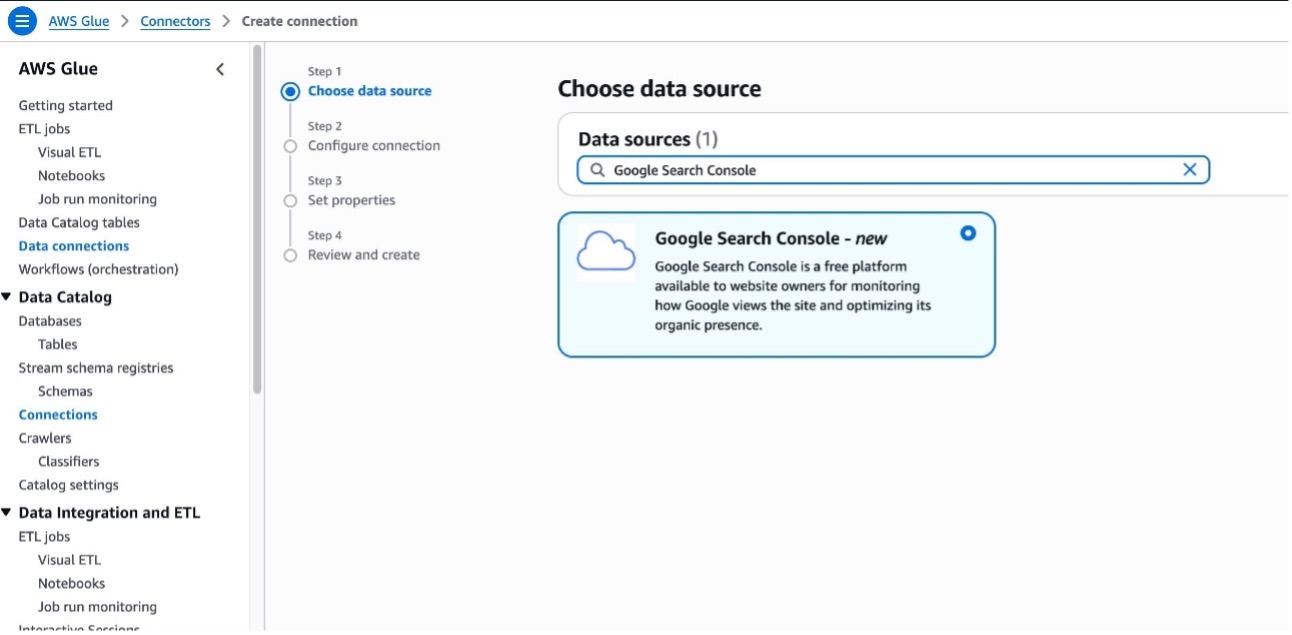
- In the navigation pane, choose Data connections.
- Under Connections, choose Create connection.
- In Data sources, search for Google Search Console and choose Next.

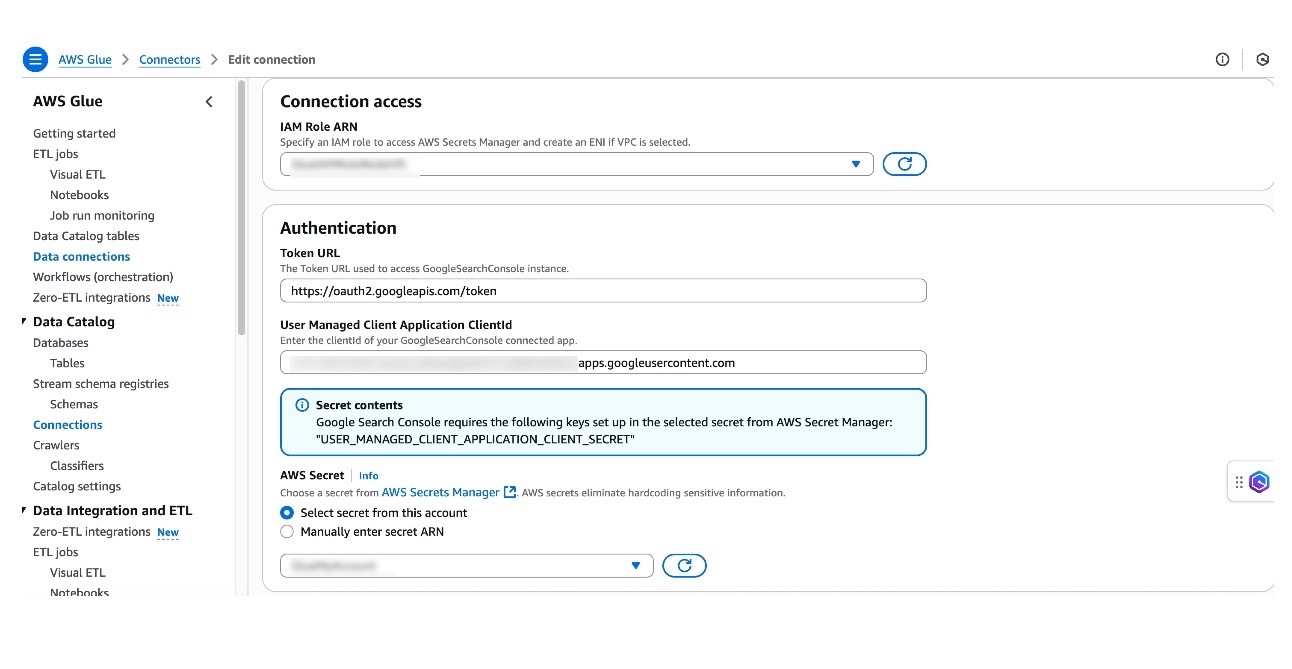
- For IAM Role ARN, choose the role created earlier.
- For Token URL, use https://oauth2.googleapis.com/token, which is the default value.
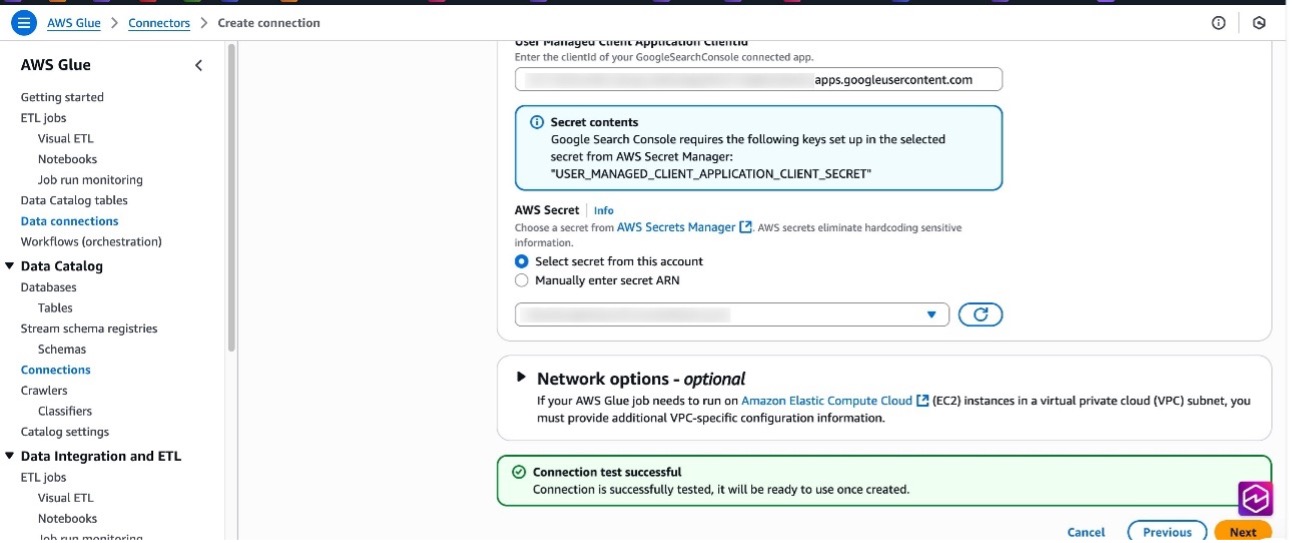
- For User Managed Client Application ClientId, enter the client ID created earlier while creating the OAuth client.
- For AWS Secret, choose the secret created earlier.
- If your AWS Glue jobs needs to run in an Amazon virtual private cloud (VPC), provide appropriate details. For more information, refer to Configure a VPC for your ETL job.

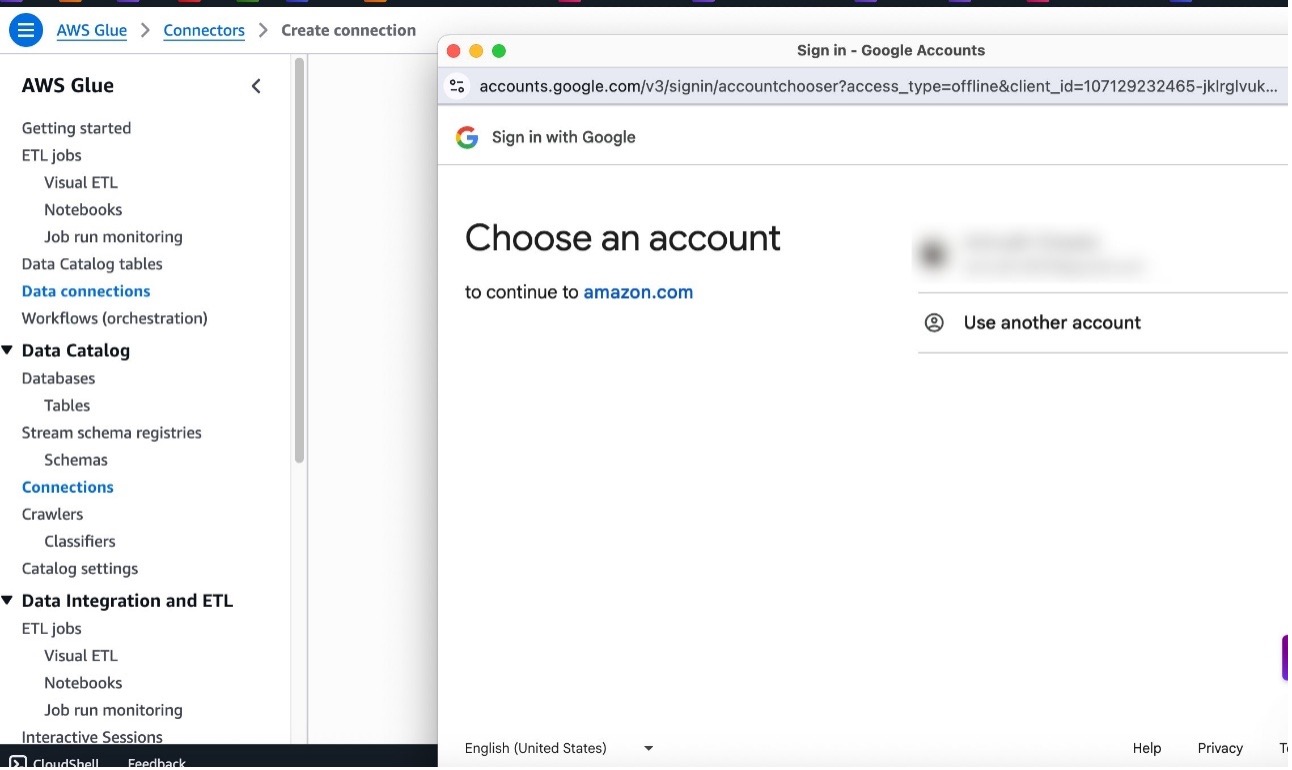
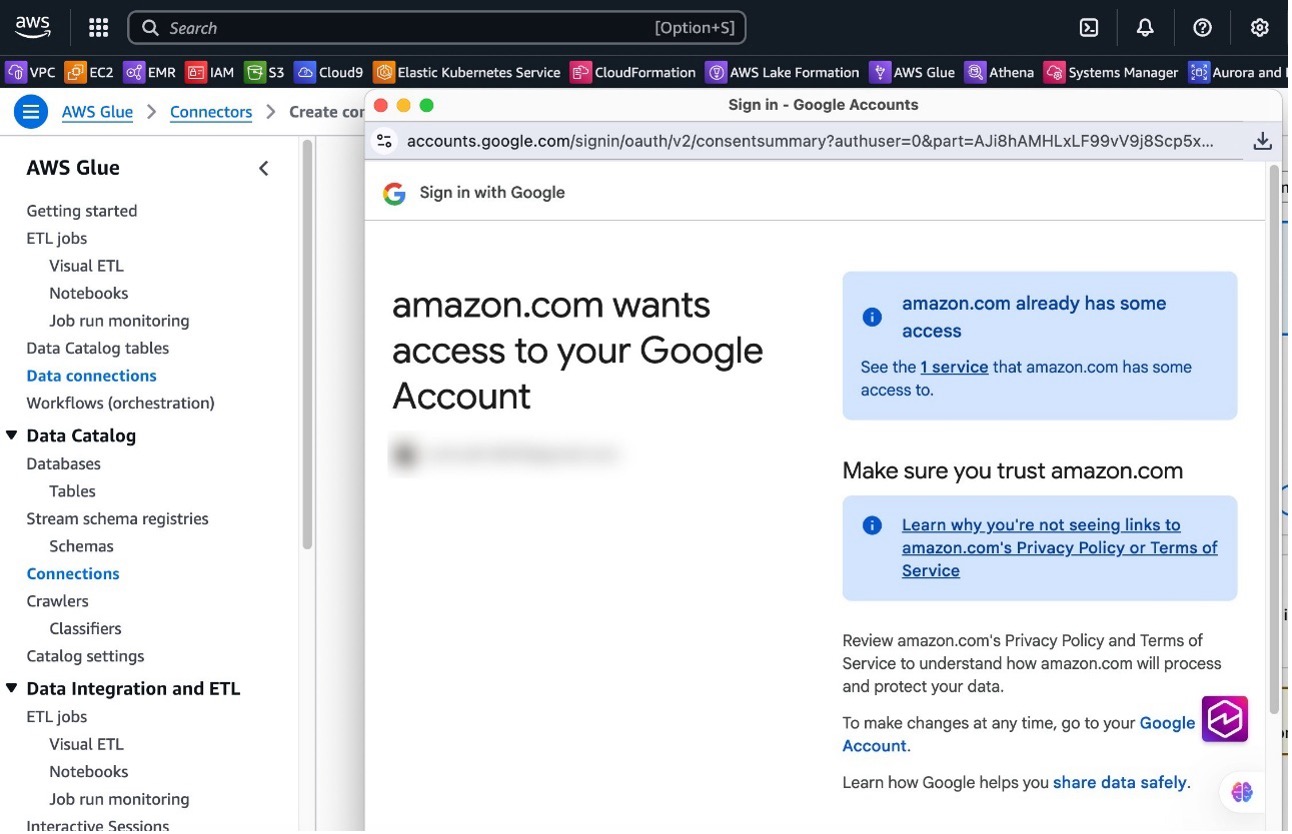
- Choose Test connection, choose your Google ID, and choose Continue.

- Choose Continue to trust the connection.

If the user has authorized access, the connection test will be successful.

- Choose Next.
- Provide a connection name and choose Create connection.
Create connection to Amazon Redshift in AWS Glue
Complete the following steps to set up an AWS Glue connection for Amazon Redshift. Refer to Redshift connections for more information.
- On the AWS Glue console, in the navigation pane, choose Data connections.
- Under Connections, choose Create connection.
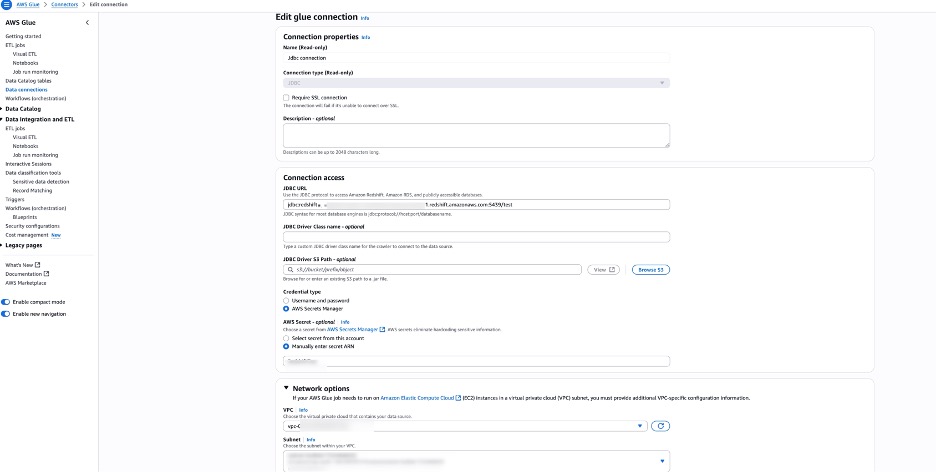
- In Data sources, search for JDBC and choose Next. For Amazon Redshift, you can also use Redshift connections. In this post, we use JDBC. In this example, we are using a Redshift provisioned cluster.
- Provide the Amazon Redshift JDBC URL and either use a Secrets Manager secret for storing credentials or provide the user name and password directly. As a best practice, it is recommended to use Secrets Manager.
- Configure network options with Amazon VPC settings for running the AWS Glue job in a VPC. In this example, we use the same VPC, subnet, and security group where the Redshift cluster is provisioned. All JDBC data stores must be accessible from the VPC subnet. A VPC endpoint is required to access Amazon S3 from within your VPC. If your job needs to access both VPC resources and the public internet, configure a NAT gateway in the VPC.

Set up table and permissions in Amazon Redshift
To set up table and permissions in Amazon Redshift, follow these steps:
- On the Amazon Redshift console, choose Query editor v2.
- Connect to your existing Redshift cluster.
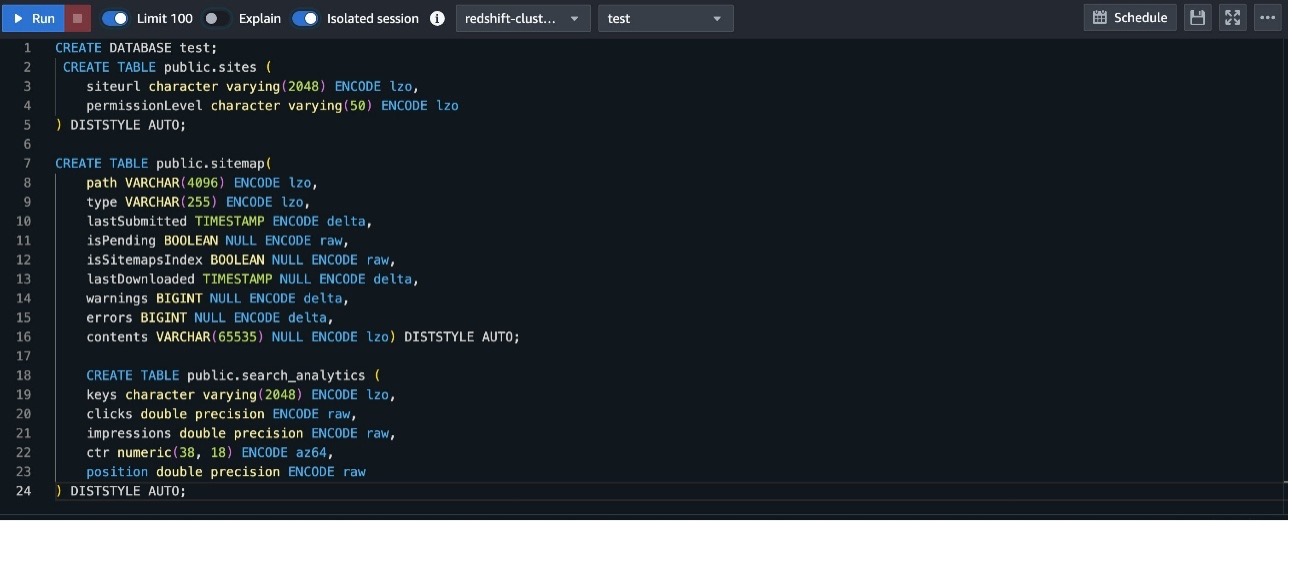
- Create a table with the following DDL. For this post, we create a new database named test and create the following tables in the public schema of test database:

Create ETL job in AWS Glue
To create a data flow in AWS Glue, follow these steps:
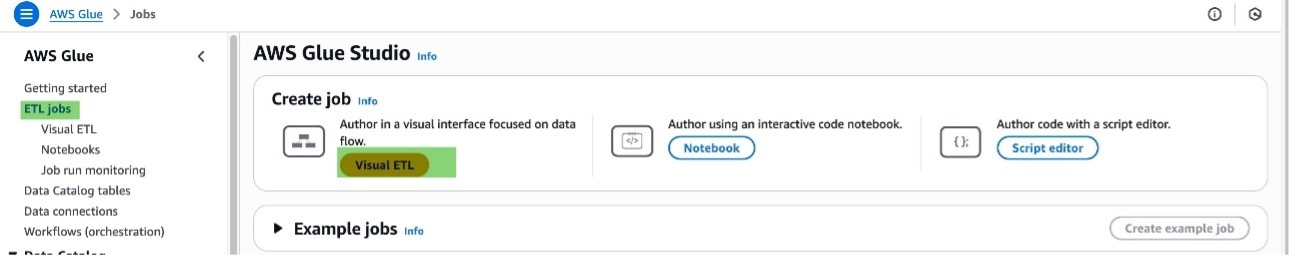
- On the AWS Glue console, choose ETL jobs in the navigation pane.
- Choose Visual ETL under Create job.
Each ETL job in AWS Glue is priced based on its duration.
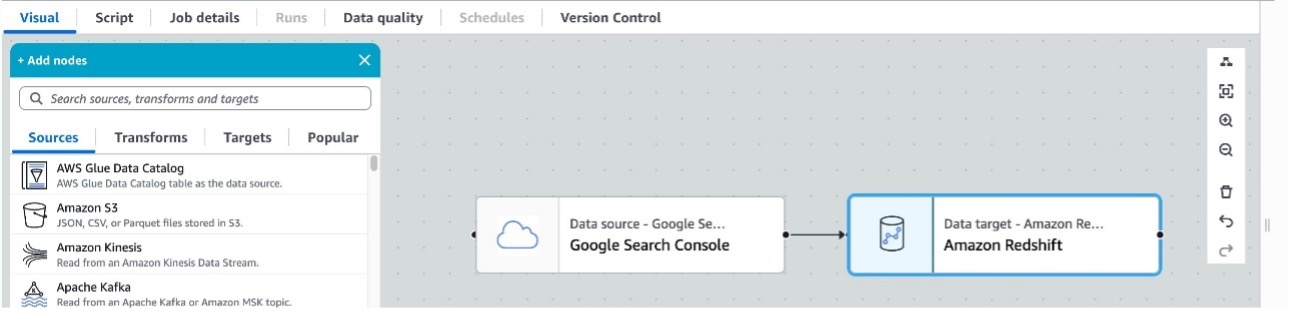
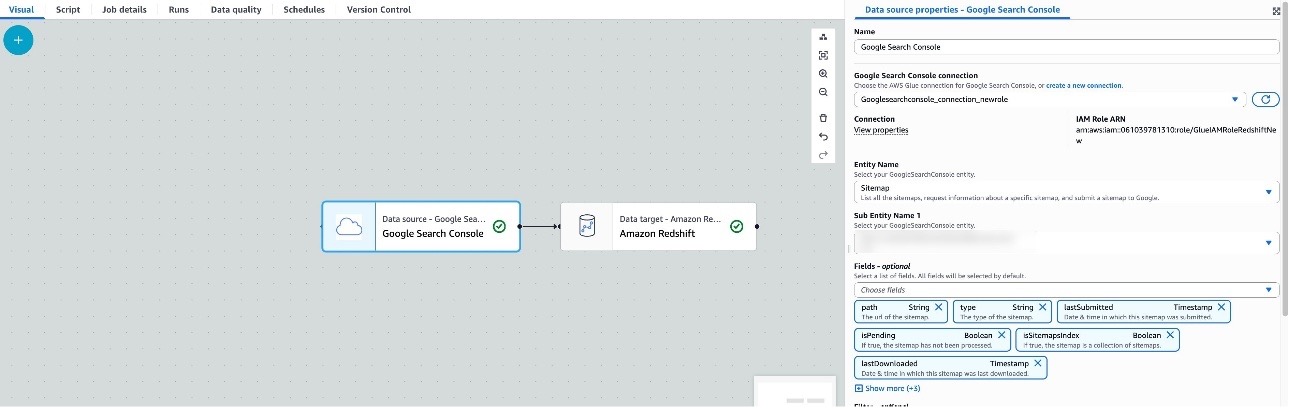
- For the source, choose Google Search Console, and for the target, choose Amazon Redshift.

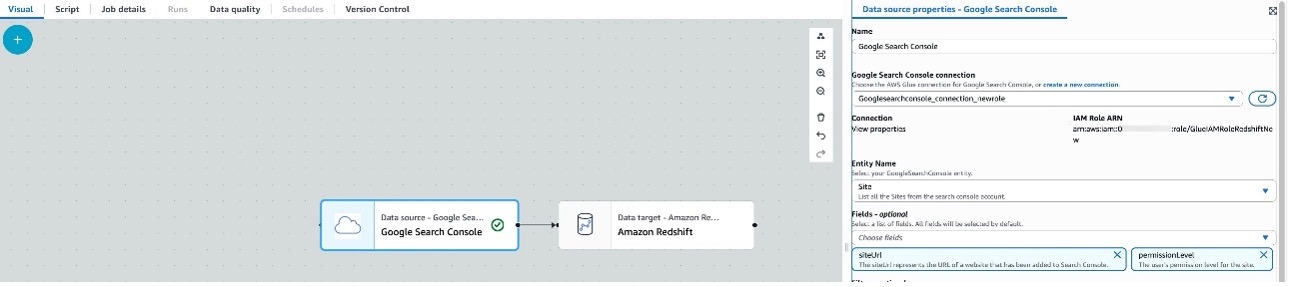
- Choose Source (Google Search Console) to configure the properties, which opens in the right window pane.
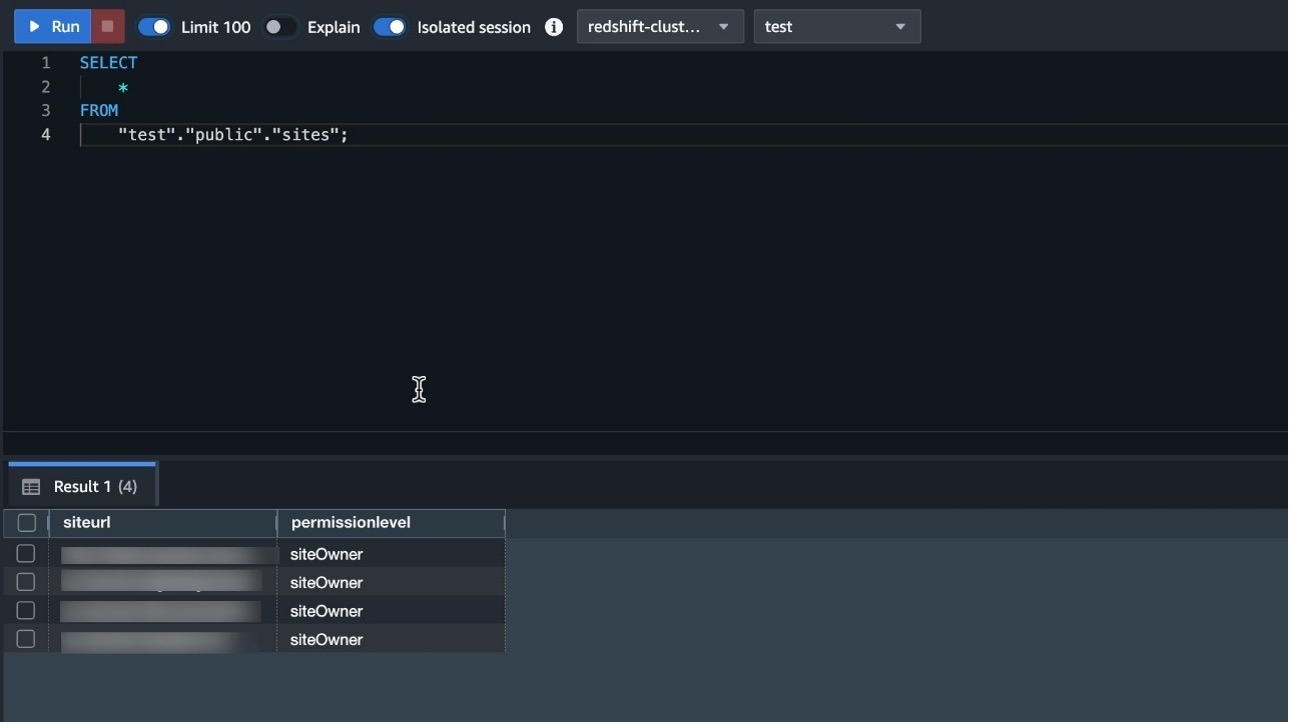
- Choose the Google Search Console connection created in the previous sections, and provide the entity name. At the time of writing, there are three supported entities: Search Analytics, Sites, and Sitemaps, with multiple supported fields and operators for each entity. Choose the entity name and the corresponding fields; by default, the connector selects all fields. The example shows selecting the entity Site and corresponding fields siteUrl and permissionLevel.

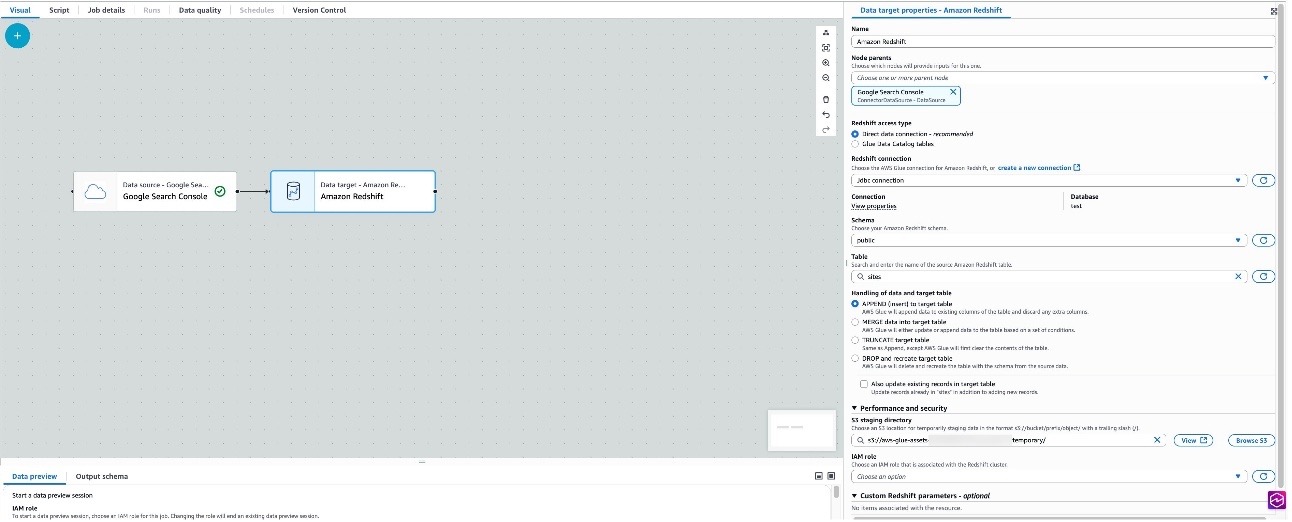
- Choose Target (Amazon Redshift) to configure the properties, which opens in the right pane.
- Choose the Amazon Redshift connection, schema, and table name that were created in the previous steps. In this example, we use Append to target table as the method for handling the data. An S3 directory is provided for staging temporary data.

- Navigate to Job details and provide a job name and IAM role (which the job will assume while running). This is the same role created earlier.
- Choose Save and Run. For this example, we use AWS Glue version 5.0, keeping all other configuration values under Job details at their defaults. For this example, we have not implemented any schema mapping, so the columns in Amazon Redshift were created to match the output response for the Search entity.
- After the job has completed successfully, navigate to Query Editor v2 in Amazon Redshift and query the Sites table to preview the data.


- In the case of job failures, validate the connections by doing a data preview, and refer to Troubleshooting AWS Glue.
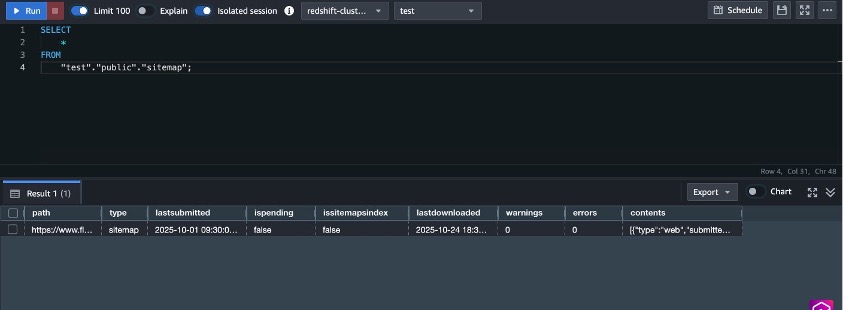
- Similar to the Site entity, you can load Sitemap entity data by changing the source properties and destination table in the target Redshift cluster, then choosing Run.

- Navigate to Query Editor v2 in Amazon Redshift and query the sitemap table to preview the data.

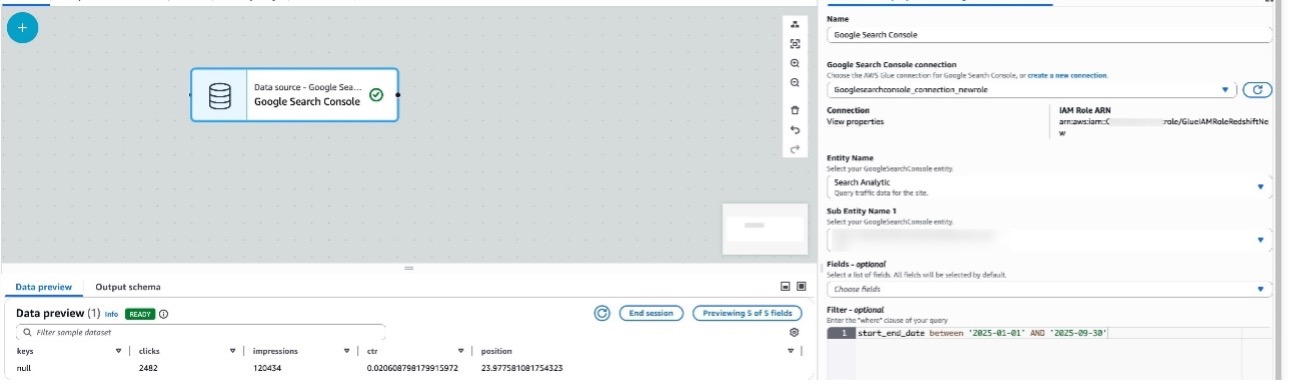
- Similar to Sitemap, you can load Search Analytics entity data by changing the source properties and destination table in the target Redshift cluster, then choosing Run.
- Navigate to Query Editor v2 in Amazon Redshift and query the search_analytics table and preview the data.

Filter predicates with Search Analytics
The Search Analytics entity provides support for multiple filters that can be used to view the traffic data for the sites. The following examples show use of some filter predicates you can use that Google Search Console connections support.
- start_end_date – The default value for start_end_date is between <30 days ago from the current date> AND <yesterday>. To use a different date range, use the between The following example displays search data from January through September 2025:

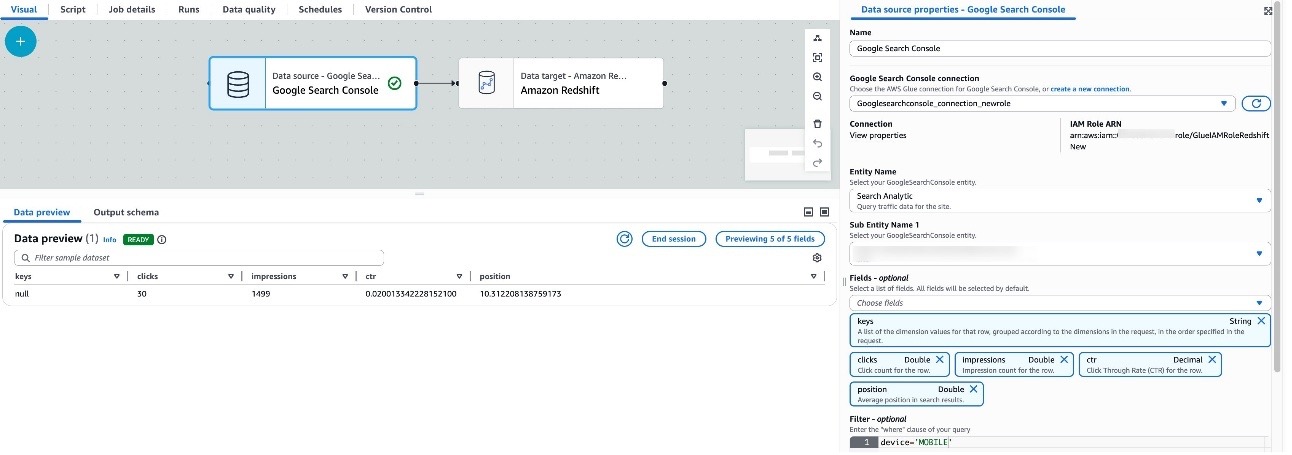
- device – The device filters result against specified device type like DESKOP, MOBILE, and TABLET:

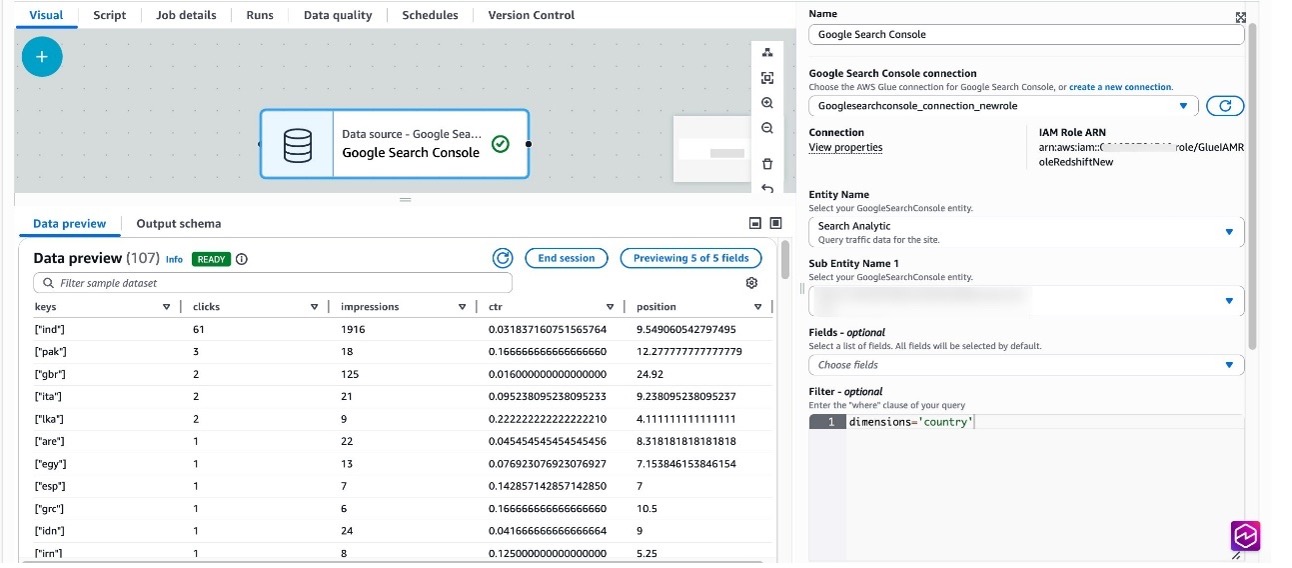
- country – You can filter against the specified country, as specified by three-letter country code (ISO 3166-1 alpha-3):

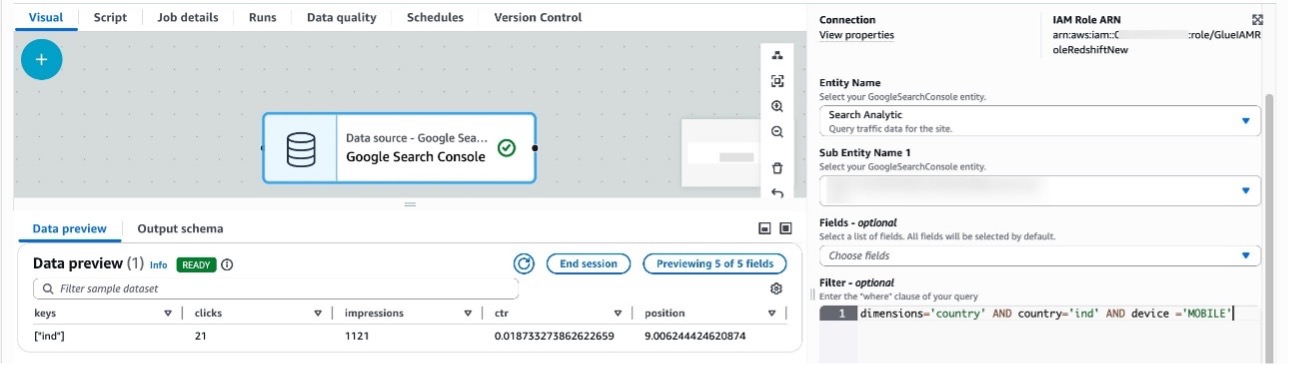
- dimensions: Dimensions help group zero or more results for filtering search data by country or device. The following example displays search data grouped by country, and also grouping by country and filtering for mobile devices:

Run analytical queries on Amazon Redshift
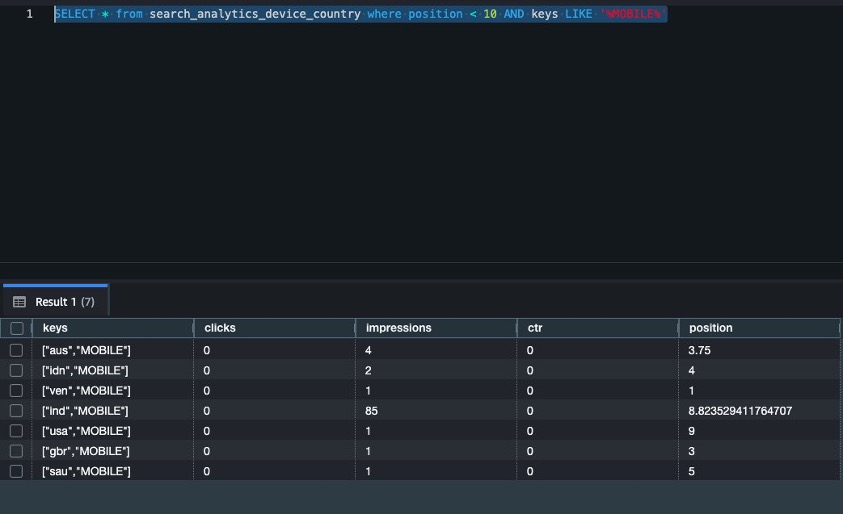
In this section, we run analytical queries using aggregated data across different search entities.
List all countries where site position is less than 10 and device type is MOBILE:
List all countries where impressions are greater than 1 and position is less than 10:
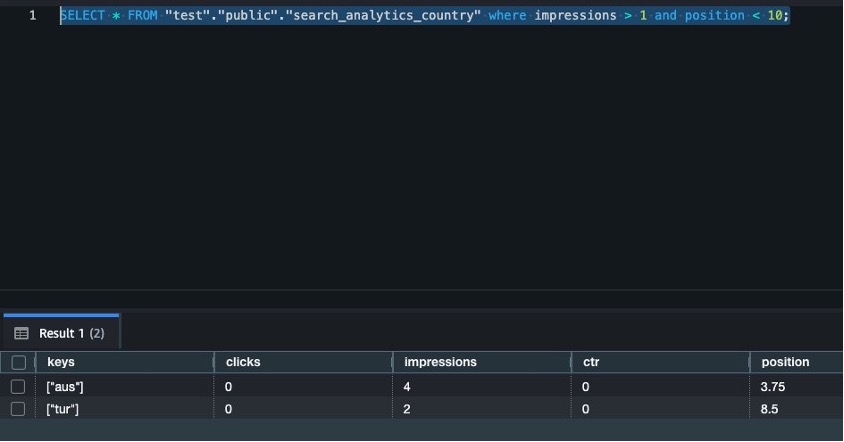
Clean up
To avoid incurring charges, clean up the resources in your AWS account by completing the following steps:
- On the AWS Glue console, in the navigation pane, choose Job monitoring.
- Stop any running jobs created for Google Search Console connections.
- From the list of connections, select the connection name created and delete it.
- Delete the Redshift provisioned cluster or the Redshift Serverless workspace and namespace. Amazon Redshift pricing is applied during the cluster’s runtime based on cluster configuration.
- Clean up resources in your Google account by deleting the project that contains the Google Project resources. For instructions, refer to Delete your project.
Conclusion
In this post, we walked you through the process of using AWS Glue to integrate data from Google Search Console and write it to Amazon Redshift, a petabyte-scale data warehouse. Whether you’re archiving historical data, performing complex analytics, or preparing data for machine learning, this connector streamlines the process and helps create an integrated data pipeline.
For more information, refer to AWS Glue support for Google Search Console.
About the authors
This is the Ampere AmpereOne M A192-32M 192 Core 12-Channel DDR5 Arm CPU
Post Syndicated from John Lee original https://www.servethehome.com/this-is-the-ampere-ampereone-m-a192-32m-192-core-12-channel-ddr5-arm-cpu/
This is the Ampere AmpereOne M chip, a 192-core Arm-based CPU with 12-channels of DDR5 and PCIe Gen5 connectivity
The post This is the Ampere AmpereOne M A192-32M 192 Core 12-Channel DDR5 Arm CPU appeared first on ServeTheHome.
Building the Future of Cloud Security: Rapid7 Recognized as a Contender in Cloud Native Application Protection, Q1 2026
Post Syndicated from Rapid7 original https://www.rapid7.com/blog/post/cds-cloud-security-rapid7-contender-cloud-native-application-protection-cnapp-2026
We are excited to share Rapid7’s recognition in The Forrester Wave™: Cloud Native Application Protection Solutions (CNAPP), Q1 2026 [1]. We see this acknowledgment as a milestone that highlights our strategic evolution and continued drive to help security teams shift from reactive defense to proactive, preemptive response.
Threat actors today know that organizations with static, moment-in-time snapshots of their environments struggle to identify misconfigurations, overprivileged identities, and vulnerabilities in cloud environments. It’s why effective cloud security has shifted from isolated tools that lock down a single container or run a standalone scanner, to platforms that are an integral part of a broader continuous exposure management and threat detection and response (TDR) strategy.
Leading with outstanding integration
As noted, one of the most critical challenges for modern security teams is protecting their technology stacks with fragmented security tools. That’s why integrations are so important. The Forrester report states: “Rapid7’s outstanding third-party solution integration includes asset management, third-party solutions, bidirectional integration with ticketing systems, SIEM integration, and SOAR and ASPM tool integrations.”
To us, this recognition reflects our belief that by integrating deeply with remediation workflows, whether it’s automated ticketing or advanced application security posture management (ASPM), we eliminate the silos that prevent cloud security from becoming a seamless part of an organization’s security operations.
Cloud security does not live in a vacuum; security leaders need to understand the potential impact of cloud or container vulnerabilities and misconfigurations within the wider business and cybersecurity program. Security operations teams need cloud alerts with the relevant context delivered to their tools and workflows. This is why bidirectional integrations and automation are critical in modern security platforms.
From intelligence to proactive remediation
Forrester’s evaluation notes: “[Rapid7’s] solid innovation focuses on delivering a unified CNAPP [platform] that helps users protect cloud workloads using temporal intelligence and trending.”
We believe this finding underscores our ability to arm security teams with threat and business-centric context. We show how exposures and misconfigurations evolve over time. This empowers organizations to go beyond static snapshots of risk to achieve more proactive and effective remediation. At the core of this capability is our ability to deliver customers an expansive, continuous view of their attack surfaces. Whether an organization monitors their environment with Rapid7 or they utilize third-party scanners, our Command Platform ingests these findings and translates them into actionable remediation plans that set the foundation for automated mobilization.
Rapid7 delivers new cloud innovations
Since our participation in Forrester’s evaluation process for this report, we have continued to introduce several important new features and innovations. These updates support our customers’ cloud security requirements.
In January 2026, we announced a strategic partnership with ARMO, the creators of Kubescape, to integrate runtime cloud and application security into the Rapid7 Exposure Command Platform.
Security teams are tired of seeing attacks only after the damage is done. By integrating ARMO’s continuous kernel-level observability (eBPF) into our platform, teams now have visibility into cloud behavior, enabling them to differentiate normal cloud activity from legitimate threats at runtime. They can then automatically terminate malicious processes or pause compromised containers to prevent lateral movement.
With Rapid7 cloud security, organizations can shift from seeing ‘potential’ risk to mitigating ‘active’ threats, fully completing the loop between preemptive security and proactive response.
⠀
[1] The Forrester Wave™: Cloud Native Application Protection Solutions (CNAPP), Q1 2026, Forrester Research, Inc., February 17, 2026.
Forrester does not endorse any company, product, brand, or service included in its research publications and does not advise any person to select the products or services of any company or brand based on the ratings included in such publications. Information is based on the best available resources. Opinions reflect judgment at the time and are subject to change. For more information, read about Forrester’s objectivity here .
[$] Do androids dream of accepted pull requests?
Post Syndicated from jzb original https://lwn.net/Articles/1058643/
Various forms of tools, colloquially known as “AI”, have been
rapidly pervading all aspects of open-source development. Many
developers are embracing LLM tools for code creation and review. Some
project maintainers complain about suffering from a deluge of slop-laden pull
requests, as well as fabricated bug and security
reports. Too many projects are reeling from scraperbot attacks that
effectively DDoS important infrastructure. But an AI bot flaming an
open-source maintainer was not on our bingo card for 2026; that seemed
a bit too far-fetched. However, it appears that is just what happened
recently after a project rejected a bot-driven pull request.
Plasma 6.6.0 released
Post Syndicated from jzb original https://lwn.net/Articles/1059187/
Version
6.6.0 of KDE’s Plasma desktop environment has been
released. Notable additions in this release include the ability to
create global themes for Plasma, an “extract text” feature in the Spectacle screenshot
utility, accessibility improvements, and a new on-screen keyboard. See
the changelog
for a full list of new features, enhancements, and bug fixes.
The release is dedicated to the memory of Björn Balazs, a KDE
contributor who passed away in September 2025. “Björn’s drive to
“
help people achieve the privacy and control over technology that he
believed they deserved is the stuff FLOSS legends are made of.
ICE & Minnesota #lastweektonight
Post Syndicated from LastWeekTonight original https://www.youtube.com/shorts/bg-Yezisct4
An update on upki
Post Syndicated from jzb original https://lwn.net/Articles/1059184/
In December 2025, Canonical announced a plan to
develop a universal Public Key Infrastructure called upki. Jon Seager has published
an update about the project with instructions on trying it
out.
In the few weeks since we announced upki, the core revocation engine
has been established and is now functional, the CRLite mirroring tool
is working and a production deployment in Canonical’s datacentres is
ongoing. We’re now preparing for an alpha release and remain on track
for an opt-in preview for Ubuntu 26.04 LTS.
Security updates for Tuesday
Post Syndicated from jzb original https://lwn.net/Articles/1059176/
Security updates have been issued by AlmaLinux (gimp, go-toolset:rhel8, and golang), Debian (roundcube), Fedora (gnupg2, libpng, and rsync), Mageia (dcmtk and usbmuxd), Oracle (gcc-toolset-14-binutils, gimp, gnupg2, go-toolset:ol8, golang, kernel, and openssl), Slackware (libssh, lrzip, and mozilla), SUSE (abseil-cpp, chromium, curl, elemental-toolkit, elemental-operator, expat, freerdp, iperf, libnvidia-container, libsoup, libxml2, net-snmp, openCryptoki, openssl-3, patch, protobuf, python-urllib3, python-xmltodict, python311, screen, systemd, and util-linux), and Ubuntu (alsa-lib, gnutls28, and linux-aws, linux-oracle).
Side-Channel Attacks Against LLMs
Post Syndicated from Bruce Schneier original https://www.schneier.com/blog/archives/2026/02/side-channel-attacks-against-llms.html
Here are three papers describing different side-channel attacks against LLMs.
“Remote Timing Attacks on Efficient Language Model Inference“:
Abstract: Scaling up language models has significantly increased their capabilities. But larger models are slower models, and so there is now an extensive body of work (e.g., speculative sampling or parallel decoding) that improves the (average case) efficiency of language model generation. But these techniques introduce data-dependent timing characteristics. We show it is possible to exploit these timing differences to mount a timing attack. By monitoring the (encrypted) network traffic between a victim user and a remote language model, we can learn information about the content of messages by noting when responses are faster or slower. With complete black-box access, on open source systems we show how it is possible to learn the topic of a user’s conversation (e.g., medical advice vs. coding assistance) with 90%+ precision, and on production systems like OpenAI’s ChatGPT and Anthropic’s Claude we can distinguish between specific messages or infer the user’s language. We further show that an active adversary can leverage a boosting attack to recover PII placed in messages (e.g., phone numbers or credit card numbers) for open source systems. We conclude with potential defenses and directions for future work.
“When Speculation Spills Secrets: Side Channels via Speculative Decoding in LLMs“:
Abstract: Deployed large language models (LLMs) often rely on speculative decoding, a technique that generates and verifies multiple candidate tokens in parallel, to improve throughput and latency. In this work, we reveal a new side-channel whereby input-dependent patterns of correct and incorrect speculations can be inferred by monitoring per-iteration token counts or packet sizes. In evaluations using research prototypes and production-grade vLLM serving frameworks, we show that an adversary monitoring these patterns can fingerprint user queries (from a set of 50 prompts) with over 75% accuracy across four speculative-decoding schemes at temperature 0.3: REST (100%), LADE (91.6%), BiLD (95.2%), and EAGLE (77.6%). Even at temperature 1.0, accuracy remains far above the 2% random baseline—REST (99.6%), LADE (61.2%), BiLD (63.6%), and EAGLE (24%). We also show the capability of the attacker to leak confidential datastore contents used for prediction at rates exceeding 25 tokens/sec. To defend against these, we propose and evaluate a suite of mitigations, including packet padding and iteration-wise token aggregation.
“Whisper Leak: a side-channel attack on Large Language Models“:
Abstract: Large Language Models (LLMs) are increasingly deployed in sensitive domains including healthcare, legal services, and confidential communications, where privacy is paramount. This paper introduces Whisper Leak, a side-channel attack that infers user prompt topics from encrypted LLM traffic by analyzing packet size and timing patterns in streaming responses. Despite TLS encryption protecting content, these metadata patterns leak sufficient information to enable topic classification. We demonstrate the attack across 28 popular LLMs from major providers, achieving near-perfect classification (often >98% AUPRC) and high precision even at extreme class imbalance (10,000:1 noise-to-target ratio). For many models, we achieve 100% precision in identifying sensitive topics like “money laundering” while recovering 5-20% of target conversations. This industry-wide vulnerability poses significant risks for users under network surveillance by ISPs, governments, or local adversaries. We evaluate three mitigation strategies – random padding, token batching, and packet injection – finding that while each reduces attack effectiveness, none provides complete protection. Through responsible disclosure, we have collaborated with providers to implement initial countermeasures. Our findings underscore the need for LLM providers to address metadata leakage as AI systems handle increasingly sensitive information.
Levelling up with Python: Create with data
Post Syndicated from Sarah Lygoe original https://www.raspberrypi.org/blog/levelling-up-with-python-create-with-data/
Learning Python often starts with the same building blocks: variables, functions, and loops. However, once young people have learnt these essential foundations, they may be eager to grow their skills and start using Python to explore data and create something meaningful to them.

Our free ‘More Python’ project path helps learners move beyond the basics and use data to create impactful projects of their own.
Python as a tool for exploring the world
Python is the most widely used programming language in the world, not just because it’s accessible, but because it’s powerful. It is used to analyse data, build models, create data visualisations, and explore important questions.

For young learners, this means learning Python can become more than a coding exercise. It can be a way to investigate topics they care about, analyse and understand information, and tell powerful stories about real-world issues.

Working with data helps learners see how coding connects to the world around them — and builds confidence along the way.
Why learning with data matters
In our day-to-day lives, data is everywhere: in sports results, maps, and scientific research, to name only a few examples. Learning how to work with data helps young people develop skills that go far beyond programming, including:
- Thinking logically and solving problems
- Interpreting and questioning information
- Making decisions based on evidence
Data also underpins many of the AI systems people use today. For example, large language models, used to build tools such as ChatGPT, are trained on vast amounts of data. Therefore, understanding how data is collected, organised, and used is an important part of AI literacy.
In Python, structures like lists and dictionaries make it possible to organise, analyse, and explore data in creative ways. Using these tools to build projects can help abstract computing concepts start to feel more concrete and meaningful.
What learners create in the ‘More Python’ project path
The ‘More Python’ project path supports learners through three stages: Explore, Design, and Invent. Each stage builds skills while giving learners more ownership over what they create.
In the Explore stage, young people learn new concepts and build confidence in using data and core Python structures, such as lists and dictionaries. Projects include:
- Making an interactive chart of Olympic medals
- Building a model of the solar system
- Creating a frequency graph that learners can analyse to crack a code
These projects help learners develop new skills, while exploring how Python can be used to analyse and explain real-world information.
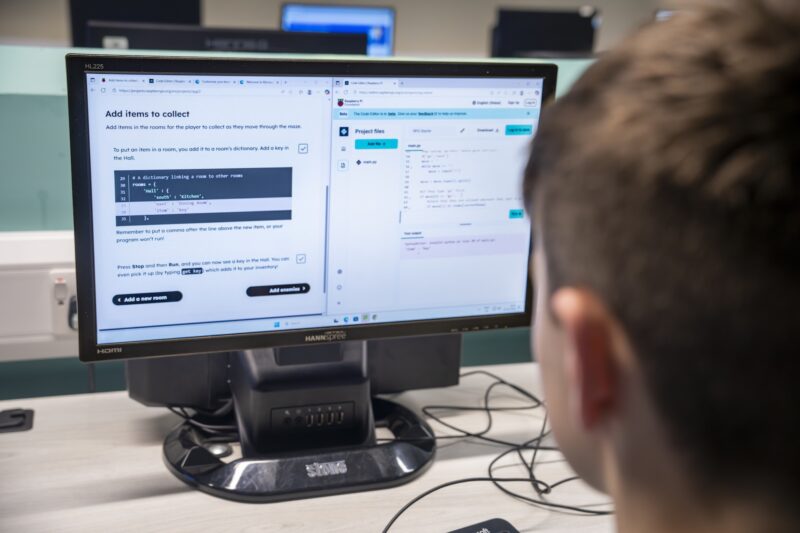
As learners progress to the Design stage, they start making creative choices about how their projects look and behave. In this stage, they:
- Create a project that produces encoded art based on a user’s name
- Build an interactive world map that helps users learn interesting facts
Here, Python becomes a creative medium. As well as putting their new skills into practice, learners think about audience, interaction, and presentation to make their projects their own.
In the Invent stage, learners bring everything together. Using the skills they have built, they design and create a data visualisation on a topic they are passionate about. This final project gives learners the freedom to choose their data, shape their idea, and tell a story that matters to them.

By this point, learners are planning and creating their own projects, growing in confidence and independence.
Take the next step with Python
If the young people you support have already learned the basics of Python, ‘More Python’ offers a clear and creative next step. The projects are designed to be accessible, and young people can work through them at their own pace, whether they are learning independently, at a Code Club, or in the classroom.
By working with data, getting creative, and making their own original projects, learners can build confidence and start to see what they can achieve with Python.
Alongside the ‘More Python’ project path, you can access hundreds of free coding projects on our Code Club Projects site. Find more projects to suit your learners’ interests, and support them to build their digital skills through creativity and making.
The post Levelling up with Python: Create with data appeared first on Raspberry Pi Foundation.
Има ли компас в информационния океан?
Post Syndicated from original https://www.toest.bg/ima-li-kompas-v-informatsionniya-okean/

Когато интернет се появи, много хора бяха обнадеждени. Знанието, което човечеството беше натрупало през вековете, щеше да стане по-достъпно от всякога. Очакването беше, че това ще доведе до по-информирани граждани и по-рационални решения, облагодетелстващи както отделния човек, така и цялото общество.
Днес обаче живеем в свят, в който никога не сме имали повече информация и никога не сме били по-объркани. Причината е не в липсата на данни, а в начина, по който ги възприемаме, подбираме и тълкуваме.
Хората по дефиниция не са рационални, а емоционални същества.
Мозъкът рядко взема разумно решение и едва след това действа – много по-често той намира рационални аргументи, с които да защити позиция, вече заета по емоционални причини. Това е добре изследвано от учени в областта както на когнитивните, така и на политическите науки. В книгата си Democracy for Realists например Кристофър Ейкън и Лари Бартелс защитават тезата, че учебникарската представа за демокрацията, в която гражданите избират на база рационален интерес, е по-скоро мит. В действителност хората се влияят много повече от идентичности, емоции и фактори, които често са извън съзнателния им контрол.
Ако това е вярно, то проблемът с дезинформацията в интернет не може да бъде решен само с повече факти. Нуждаем се и от ориентири – от базов набор инструменти, за да ни помагат да преценяваме каква стойност има информацията, с която се сблъскваме ежедневно. Дори ако в крайна сметка отново вземем емоционално решение, поне ще въоръжим разума с по-добри аргументи, с които да го оправдае.
Йерархия на авторитетите
В съвременния публичен разговор често се сблъскват две крайни гледни точки. Според едната живеем в епоха на сринати авторитети, в която всяко мнение се приема за равностойно, независимо от това дали е подкрепено от знания и опит. Според другата проблемът е тъкмо обратният – прекаленото доверие в авторитети води до интелектуална леност и отказ от самостоятелно мислене. Интернет със своята хоризонтална структура допълнително изостря този конфликт.
И двете позиции съдържат истина. Почитта към някого само по формален признак, защото заема определен пост, или пък заради харизмата на личността му може да доведе до мислене по калъп. Но е вярно и обратното – в социалните мрежи мнението на учен, посветил живота си на изследване на вируси с цел разработване на ваксини, често е приравнено с това на човек, който е прочел няколко публикации в антиваксърски блог, докато си чака кафето.
Затова въпросът е не дали трябва да има авторитети, а защо и при какви условия даден авторитет заслужава доверие. За да отговорим, трябва да направим разграничение не толкова между хората, колкото между начините, по които се добива знанието.
Мисленето на конспиратора обикновено следва една и съща логика:
първо имаме готова теза – например, че извънземните контролират света. След това започваме да търсим доказателства за нея – инцидента в Розуел, кръговете в царевицата, данни за НЛО, заснети от военните, и т.н., след което, доволни, потвърждаваме пред себе си тезата, без всъщност да сме доказали нищо. Първо, защото, както казва Карл Сейгън, грандиозните твърдения изискват грандиозни доказателства. И второ, защото този подход не е научен.
Научният метод тръгва в обратната посока. Първо се набелязва проблем, след това се събира разнообразна информация, тя се анализира и систематизира и едва накрая се формулира хипотеза. Това не гарантира истина, но минимизира риска от самозаблуда.
Давам и личен пример. Преди да кандидатствам за докторант в Софийския университет, имах готова хипотеза за нарастващото поляризиране в САЩ – увеличаващото се етническо многообразие води до напрежение между различните групи. Тя изглеждаше логична, съвпадаше хронологично с процесите, които проследявах, и за нея имаше множество „доказателства“ в интернет, най-често в десни блогове.
Проблемът беше, че бях започнал от края.
Когато добавих Канада към картината, установих, че в някои отношения многообразието там е дори още по-голямо, но подобно напрежение липсва. Нещо повече – предишният път, когато в САЩ е имало вълнения, подобни на днешните, е било по времето на Никсън, когато страната далеч не е била толкова пъстра в демографско отношение.
Всичко това ме принуди да преразгледам подхода си и тепърва да изследвам терена. Години по-късно стигнах до извода, че ключова роля са изиграли медиите. Процесът беше дълъг, но и далеч по-удовлетворителен. Вероятно е индивидуално, но при мен откриването на нова информация е по-вълнуващо от потвърждаването на предварителни убеждения. Големите открития в науката рядко започват с „Еврика!“, а по-често с „Хм, това е интересно“.
Видове източници и тяхната достоверност
Повечето от нас няма да направят научни открития, но всички ежедневно си набавяме информация от различни типове източници – официални институции, научни публикации, публицистика, блогове, социални мрежи и все по-често от съдържание, генерирано от изкуствен интелект.
По принцип официалните институции се ползват с висока степен на доверие, но това зависи от контекста. Русия например е известна с подвеждащата информация, която поднася – за загубите си във войната в Украйна, а и не само за това. В България се наблюдава съмнение в информацията, предоставяна от институциите, което е плод на дългогодишния ни опит с тях. Случаят с мистериозните убийства в района на Петрохан показа колко лесно една официална версия може да бъде отхвърлена от голяма част от обществото – не непременно защото е невярна, а защото хората са убедени, че държавата по принцип лъже, както и заради начина, по който е поднесена.
Кръв, порно, политика
Това, което дават по новините, е белег за нещо отдавна случващо се под носа ни: умишления отказ на институциите да си вършат работата. Коментар на Емилия Милчева.
 Емилия Милчева
Научните публикации би следвало да са с най-висока степен на достоверност.
Причината не е в това, че учените са безгрешни, а в самия процес – рецензиране, източници, библиография, минимизиране на личното мнение, когато то не е подкрепено с данни. Минусът е, че академичните текстове често са скучни за четене, а изискването за цитиране в тях, което от външна гледна точка може да изглежда маниакално, е иронизирано още от фантаста Айзък Азимов във „Фондацията“. Там учените имат технологична възможност да проверят дадена теза лично, но предпочитат да сравняват какво са писали колегите им.
Също така трябва да се подчертае, че мнение на представител на науката, изказано в онлайн подкаст или телевизионно предаване, няма същата тежест като публикация в академично издание. Възможно е даден учен да има високи професионални постижения и въпреки това да споделя псевдонаучни тези извън своята експертна област. Такъв пример е д-р Астрид Стукелбергер – лекарка, занимаваща се с последиците от стареенето, която публично твърди, че в Европейската организация за ядрени изследвания (ЦЕРН) се призовават същества от други измерения – нещо, което не се подкрепя от нито едно научно изследване в областта на физиката.
При всичко, казано дотук, когато става дума за здраве, ваксинации или други чувствителни теми, научната литература остава най-сигурният ориентир. Важно е тя да се чете с въпроса „Какво казват учените?“, а не с предварително зададено търсене от типа „ваксините причиняват аутизъм“.
Най-често обаче хората четат публицистика. Тук ориентацията е по-трудна, но не невъзможна. Полезни въпроси са: кой е авторът и експерт ли е по темата? Цитирани ли са източници и какви – официални данни, научни публикации, първоизточници? Прави ли се разлика между факт и мнение? Независима ли е медията и прозрачна ли е по отношение на финансирането си?
„Няма места.“ Журналистиката след журналистите
Ако се чудите какво стана с медиите в България, този текст ви е напълно достатъчен, за да си дадете отговори на много въпроси. А иначе, вие въпроси може и да си задавате, но в много медии у нас вече няма кой да ги задава – гледайте какво нещо… Защо стана така – от Дарина Сарелска.
 Дарина Сарелска
Какво почти със сигурност не е качествен източник
Ако тези критерии звучат сложно, може би е по-лесно да започнем от това, което почти сигурно е некачествено. На първо място – изказвания без източници. В България не е рядкост да се публикуват измислени изявления и дори цели интервюта, понякога прикрити с едва виждаща се бележка, че става дума за сатира. Извън страната емблематичен пример за популярната култура беше сайтът Supershadow, станал известен заради фиктивните си интервюта с режисьора Джордж Лукас.
От същия порядък са и твърденията без доказателства. В българската влогосфера е популярен жанрът на интервютата с предполагаемо осведомени хора, които „разкриват“ тайни от световната политика. Заглавия за топ секретни преговори между лидери като Путин, Тръмп или Си Дзинпин пораждат логичен въпрос: присъствал ли е говорещият на тях, че да знае толкова много? Най-често става дума за преразказ на чужди източници или за чиста спекулация, насочена към хора, които лесно биха повярвали в нея.
Винаги трябва да сме особено внимателни с информация, в която силно ни се иска (или силно ни е страх) да повярваме.
Втората група са текстове, които целят да провокират силна емоция на база оскъдна информация. Класически пример са заглавия като „Вземат ни Вазов!“ или „Махат Ботев!“, когато всъщност става дума за технически промени в учебните програми. Подобни похвати, за съжаление, понякога се използват и от официални институции, което допълнително подкопава доверието в тях.
Манипулацията – този стар и все тъй полезен занаят
Свикнали сме да свързваме Държавна сигурност със задкулисието. Бившият служител на ДС Полковник А. обаче иска да бъде полезен на обществото. В дебютната си статия за „Тоест“ той ни дава насоки как да разберем кога ни манипулират. И има още много неща да ни каже. Дали ще го чуем, зависи от нас.
 Полковник А.
Да се върнем на Петрохан. Изявлението на изпълняващия функциите (вече според няколко съдилища – нелегитимно) на главния прокурор Борислав Сарафов, че случаят напомня на „Туин Пийкс“, е по-подходящо за блогър или за коментар в социална мрежа, отколкото за официално лице. Съвсем отделен е въпросът, че немалка част от скептиците по отношение на официалната версия изпадат в описаната по-горе логическа грешка – да имат готова теза („мафията е замесена“) и след това да търсят доказателства в нейна подкрепа.
Накрая идват кликбейт заглавията от типа „Няма да повярвате…“ или „Еди-кой си разкри истината!“. Те невинаги водят до невярна информация, но твърде често прикриват баналност зад гръмки фрази.
А какво да правим с изкуствения интелект?
Изкуственият интелект най-често обобщава информация от водещи медии и енциклопедии, което го прави по-достоверен от много популярни сайтове. Проблемът е, че когато „не знае“, той халюцинира – създава убедително звучаща, но невярна информация. Понякога прави и странни връзки, резултат от начина, по който функционира. Така например при проверка в Google установих, че според един бот съм любимият чичо на епичното фентъзи – защото имам статия за писателя Тери Брукс със сходно заглавие. Затова ИИ може да бъде полезен помощник, но лош арбитър на истината.
Всичко това може да звучи сложно, но обобщението е сравнително просто. По-голямо доверие заслужават текстове, за които знаем кой е авторът, има ясно посочени източници и съдържанието ни подтиква към размисъл, а не към гняв или страх. Както съветва комикът Бил Махър, не е лошо понякога да излизаме от собствения си балон и да четем и „другия отбор“. Така си поставяме малка интелектуална ваксина срещу манипулация. Важното е, когато го правим, да изискваме качество – и от другите, и от себе си.
Amazon EC2 Hpc8a Instances powered by 5th Gen AMD EPYC processors are now available
Post Syndicated from Channy Yun (윤석찬) original https://aws.amazon.com/blogs/aws/amazon-ec2-hpc8a-instances-powered-by-5th-gen-amd-epyc-processors-are-now-available/
Today, we’re announcing the general availability of Amazon Elastic Compute Cloud (Amazon EC2) Hpc8a instances, a new high performance computing (HPC) optimized instance type powered by latest 5th Generation AMD EPYC processors with a maximum frequency of up to 4.5 GHz. These instances are ideal for compute-intensive tightly coupled HPC workloads, including computational fluid dynamics, simulations for faster design iterations, high-resolution weather modeling within tight operational windows, and complex crash simulations that require rapid time-to-results.
The new Hpc8a instances deliver up to 40% higher performance, 42% greater memory bandwidth, and up to 25% better price-performance compared to previous generation Hpc7a instances. Customers benefit from the high core density, memory bandwidth, and low-latency networking that helped them scale efficiently and reduce job completion times for their compute-intensive simulation workloads.
Hpc8a instances
Hpc8a instances are available with 192 cores, 768 GiB memory, and 300 Gbps Elastic Fabric Adapter (EFA) networking to run applications requiring high levels of inter node communications at scale.
| Instance Name | Physical Cores | Memory (Gib) | EFA Network Bandwidth (Gbps) | Network Bandwidth (Gbps) | Attached Storage |
| Hpc8a.96xlarge | 192 | 768 | Up to 300 | 75 | EBS Only |
Hpc8a instances are available in a single 96xlarge size with a 1:4 core-to-memory ratio. You will have the capability to right size based on HPC workload requirements by customizing the number of cores needed at launch instances. These instances also use sixth-generation AWS Nitro cards, which offload CPU virtualization, storage, and networking functions to dedicated hardware and software, enhancing performance and security for your workloads.
You can use Hpc8a instances with AWS ParallelCluster and AWS Parallel Computing Service (AWS PCS) to simplify workload submission and cluster creation and Amazon FSx for Lustre for sub-millisecond latencies and up to hundreds of gigabytes per second of throughput for storage. To achieve the best performance for HPC workloads, these instances have Simultaneous Multithreading (SMT) disabled.
Now available
Amazon EC2 Hpc8a instances are now available in US East (Ohio) and Europe (Stockholm) AWS Regions. For Regional availability and a future roadmap, search the instance type in the CloudFormation resources tab of AWS Capabilities by Region.
You can purchase these instances as On-Demand Instances and Savings Plan. To learn more, visit the Amazon EC2 Pricing page.
Give Hpc8a instances a try in the Amazon EC2 console. To learn more, visit the Amazon EC2 Hpc8a instances page and send feedback to AWS re:Post for EC2 or through your usual AWS Support contacts.
— Channy
Announcing Amazon SageMaker Inference for custom Amazon Nova models
Post Syndicated from Channy Yun (윤석찬) original https://aws.amazon.com/blogs/aws/announcing-amazon-sagemaker-inference-for-custom-amazon-nova-models/
Since we launched Amazon Nova customization in Amazon SageMaker AI at AWS NY Summit 2025, customers have been asking for the same capabilities with Amazon Nova as they do when they customize open weights models in Amazon SageMaker Inference. They also wanted have more control and flexibility in custom model inference over instance types, auto-scaling policies, context length, and concurrency settings that production workloads demand.
Today, we’re announcing the general availability of custom Nova model support in Amazon SageMaker Inference, a production-grade, configurable, and cost-efficient managed inference service to deploy and scale full-rank customized Nova models. You can now experience an end-to-end customization journey to train Nova Micro, Nova Lite, and Nova 2 Lite models with reasoning capabilities using Amazon SageMaker Training Jobs or Amazon HyperPod and seamlessly deploy them with managed inference infrastructure of Amazon SageMaker AI.
With Amazon SageMaker Inference for custom Nova models, you can reduce inference cost through optimized GPU utilization using Amazon Elastic Compute Cloud (Amazon EC2) G5 and G6 instances over P5 instances, auto-scaling based on 5-minute usage patterns, and configurable inference parameters. This feature enables deployment of customized Nova models with continued pre-training, supervised fine-tuning, or reinforcement fine-tuning for your use cases. You can also set advanced configurations about context length, concurrency, and batch size for optimizing the latency-cost-accuracy tradeoff for your specific workloads.
Let’s see how to deploy customized Nova models on SageMaker AI real-time endpoints, configure inference parameters, and invoke your models for testing.
Deploy custom Nova models in SageMaker Inference
At AWS re:Invent 2025, we introduced new serverless customization in Amazon SageMaker AI for popular AI models including Nova models. With a few clicks, you can seamlessly select a model and customization technique, and handle model evaluation and deployment. If you already have a trained custom Nova model artifact, you can deploy the models on SageMaker Inference through the SageMaker Studio or SageMaker AI SDK.
In the SageMaker Studio, choose a trained Nova model in Models in your models in the Models menu. You can deploy the model by choosing Deploy button, SageMaker AI and Create new endpoint.
Choose the endpoint name, instance type, and advanced options such as instance count, max instance count, permission and networking, and Deploy button. At GA launch, you can use g5.12xlarge, g5.24xlarge, g5.48xlarge, g6.12xlarge, g6.24xlarge, g6.48xlarge, and p5.48xlarge instance types for the Nova Micro model, g5.24xlarge, g5.48xlarge, g6.24xlarge, g6.48xlarge, and p5.48xlarge for the Nova Lite model, and p5.48xlarge for the Nova 2 Lite model.
Creating your endpoint requires time to provision the infrastructure, download your model artifacts, and initialize the inference container.
After model deployment completes and the endpoint status shows InService, you can perform real-time inference using the new endpoint. To test the model, choose the Playground tab and input your prompt in the Chat mode.
You can also use the SageMaker AI SDK to create two resources: a SageMaker AI model object that references your Nova model artifacts, and an endpoint configuration that defines how the model will be deployed.
The following code creates a SageMaker AI model that references your Nova model artifacts:
# Create a SageMaker AI model
    model_response = sagemaker.create_model(
        ModelName= 'Nova-micro-ml-g5-12xlarge',
        PrimaryContainer={
            'Image': '123456789012.dkr.ecr.us-east-1.amazonaws.com/nova-inference-repo:v1.0.0',
            'ModelDataSource': {
                'S3DataSource': {
                   'S3Uri': 's3://your-bucket-name/path/to/model/artifacts/',
                   'S3DataType': 'S3Prefix',
                   'CompressionType': 'None'
                }
            },
            # Model Parameters
            'Environment': {
                'CONTEXT_LENGTH': 8000,
                'CONCURRENCY': 16,
                'DEFAULT_TEMPERATURE': 0.0,
                'DEFAULT_TOP_P': 1.0
            }
        },
        ExecutionRoleArn=SAGEMAKER_EXECUTION_ROLE_ARN,
        EnableNetworkIsolation=True
    )
    print("Model created successfully!")
Next, create an endpoint configuration that defines your deployment infrastructure and deploy your Nova model by creating a SageMaker AI real-time endpoint. This endpoint will host your model and provide a secure HTTPS endpoint for making inference requests.
# Create Endpoint Configuration
    production_variant = {
        'VariantName': 'primary',
        'ModelName': 'Nova-micro-ml-g5-12xlarge',
        'InitialInstanceCount': 1,
        'InstanceType': 'ml.g5.12xlarge',
    }

    config_response = sagemaker.create_endpoint_config(
        EndpointConfigName= 'Nova-micro-ml-g5-12xlarge-Config',
        ProductionVariants= production_variant
    )
    print("Endpoint configuration created successfully!")

# Deploy your Noval model
    endpoint_response = sagemaker.create_endpoint(
        EndpointName= 'Nova-micro-ml-g5-12xlarge-endpoint',
        EndpointConfigName= 'Nova-micro-ml-g5-12xlarge-Config'
    )
    print("Endpoint creation initiated successfully!")
After the endpoint is created, you can send inference requests to generate predictions from your custom Nova model. Amazon SageMaker AI supports synchronous endpoints for real-time with streaming/non-streaming modes and asynchronous endpoints for batch processing.
For example, the following code creates streaming completion format for text generation:
# Streaming chat request with comprehensive parameters
streaming_request = {
"messages": [
        {"role": "user", "content": "Compare our Q4 2025 actual spend against budget across all departments and highlight variances exceeding 10%"}
    ],
    "max_tokens": 512,
    "stream": True,
    "temperature": 0.7,
    "top_p": 0.95,
    "top_k": 40,
    "logprobs": True,
    "top_logprobs": 2,
    "reasoning_effort": "low",  # Options: "low", "high"
    "stream_options": {"include_usage": True}
}

invoke_nova_endpoint(streaming_request)

def invoke_nova_endpoint(request_body):
"""
    Invoke Nova endpoint with automatic streaming detection.

    Args:
        request_body (dict): Request payload containing prompt and parameters

    Returns:
        dict: Response from the model (for non-streaming requests)
        None: For streaming requests (prints output directly)
    """
    body = json.dumps(request_body)
    is_streaming = request_body.get("stream", False)

    try:
        print(f"Invoking endpoint ({'streaming' if is_streaming else 'non-streaming'})...")

        if is_streaming:
            response = runtime_client.invoke_endpoint_with_response_stream(
                EndpointName=ENDPOINT_NAME,
                ContentType='application/json',
                Body=body
            )

            event_stream = response['Body']
            for event in event_stream:
                if 'PayloadPart' in event:
                    chunk = event['PayloadPart']
                    if 'Bytes' in chunk:
                        data = chunk['Bytes'].decode()
                        print("Chunk:", data)
        else:
            # Non-streaming inference
            response = runtime_client.invoke_endpoint(
                EndpointName=ENDPOINT_NAME,
                ContentType='application/json',
                Accept='application/json',
                Body=body
            )

            response_body = response['Body'].read().decode('utf-8')
            result = json.loads(response_body)
            print("✅ Response received successfully")
            return result

    except ClientError as e:
        error_code = e.response['Error']['Code']
        error_message = e.response['Error']['Message']
        print(f"❌ AWS Error: {error_code} - {error_message}")
    except Exception as e:
        print(f"❌ Unexpected error: {str(e)}")
To use full code examples, visit Customizing Amazon Nova models on Amazon SageMaker AI. To learn more about best practices on deploying and managing models, visit Best Practices for SageMaker AI.
Now available
Amazon SageMaker Inference for custom Nova models is available today in US East (N. Virginia) and US West (Oregon) AWS Regions. For Regional availability and a future roadmap, visit the AWS Capabilities by Region.
The feature supports Nova Micro, Nova Lite, and Nova 2 Lite models with reasoning capabilities, running on EC2 G5, G6, and P5 instances with auto-scaling support. You pay only for the compute instances you use, with per-hour billing and no minimum commitments. For more information, visit Amazon SageMaker AI Pricing page.
Give it a try in Amazon SageMaker AI console and send feedback to AWS re:Post for SageMaker or through your usual AWS Support contacts.
— Channy