Amazon MSK Express brokers now support Intelligent Rebalancing for 180 times faster operation performance

Post Syndicated from Swapna Bandla original https://aws.amazon.com/blogs/big-data/amazon-msk-express-brokers-now-support-intelligent-rebalancing-for-180-times-faster-operation-performance/

Effective today, all new Amazon Managed Streaming for Apache Kafka (Amazon MSK) Provisioned clusters with Express brokers will support Intelligent Rebalancing at no additional cost. With this new capability you can perform automatic partition balancing operations when scaling Apache Kafka clusters up or down. Intelligent Rebalancing maximizes the capacity utilization of Amazon MSK clusters with Express brokers by optimally rebalancing Kafka resources on them for better performance, eliminating the need to manage partitions independently or by using third-party tools. Intelligent Rebalancing on Amazon MSK Express brokers performs these operations up to 180 times faster compared to Standard brokers.

We launched Amazon MSK Express brokers in November 2024 to reimagine Apache Kafka for ease of use, best-in-class price performance, and predictable availability. Amazon MSK Express brokers are designed to deliver up to three times more throughput per-broker, scale up to 20 times faster, and reduce recovery time by 90 percent as compared to Standard brokers running Apache Kafka. Since launch, we have expanded Amazon MSK Express brokers to additional AWS Regions, instance types, and most recently increased support to 5x more partitions per Express broker, improving price-performance by up to 50% for partition-bound workloads.

With Intelligent Rebalancing, Amazon MSK Express broker clusters are continuously monitored for resource imbalance or overload based on intelligent Amazon MSK defaults to maximize cluster performance. When required, brokers are efficiently scaled, without affecting cluster availability for clients to produce and consume data. Customers can now take full advantage of the scaling and performance benefits of Amazon MSK Provisioned clusters for Express brokers while simplifying cluster management operations.

In this post we’ll introduce the Intelligent Rebalancing feature and show an example of how it works to improve operation performance.

When to use Intelligent Rebalancing

With Intelligent Rebalancing, Amazon MSK Express brokers now offer a fully automated solution for managing and scaling Kafka clusters, requiring no additional tools or configuration. Intelligent Rebalancing is enabled by default on all new Amazon MSK Express brokers clusters, so we recommend always keeping it on. Intelligent Rebalancing uses Amazon MSK best practices to trigger automatic rebalancing during the following situations:

  • Scaling in and out clusters: When customers add or remove brokers from their Amazon MSK Express brokers clusters, Intelligent Rebalancing automatically redistributes partitions to balance resource utilization across the brokers. This ensures that the cluster continues to operate at peak performance, making scaling in and out possible with a single update operation.
  • Steady-state rebalancing: Even during normal operations, Intelligent Rebalancing continuously monitors the Amazon MSK Express brokers cluster and triggers rebalancing when it detects resource imbalances or hotspots. For example, if certain brokers become overloaded due to uneven distribution of partitions or skewed traffic patterns, Intelligent Rebalancing will automatically move partitions to less utilized brokers to restore balance.

How to use Intelligent Rebalancing

To demonstrate the power of Intelligent Rebalancing, let’s run a few tests on an Amazon MSK Express brokers cluster:

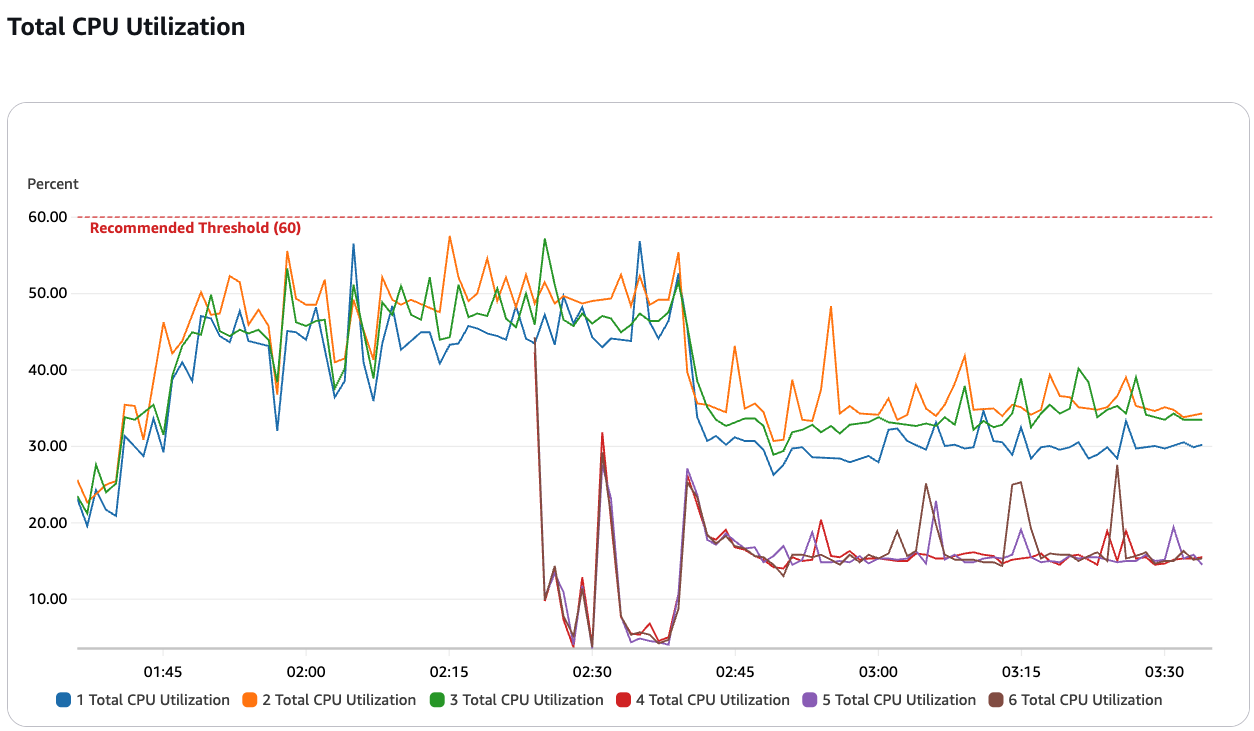
Scaling test: We’ll start by creating an Amazon MSK Express brokers cluster with 3 brokers. We’ll then rapidly scale the cluster up to 6 brokers and back down to 3 brokers, simulating a sudden spike in workload. With Intelligent Rebalancing enabled, you’ll see that the rebalancing of partitions is completed within 5-10 minutes, so that the cluster can sustain the increased throughput without any drop in performance.
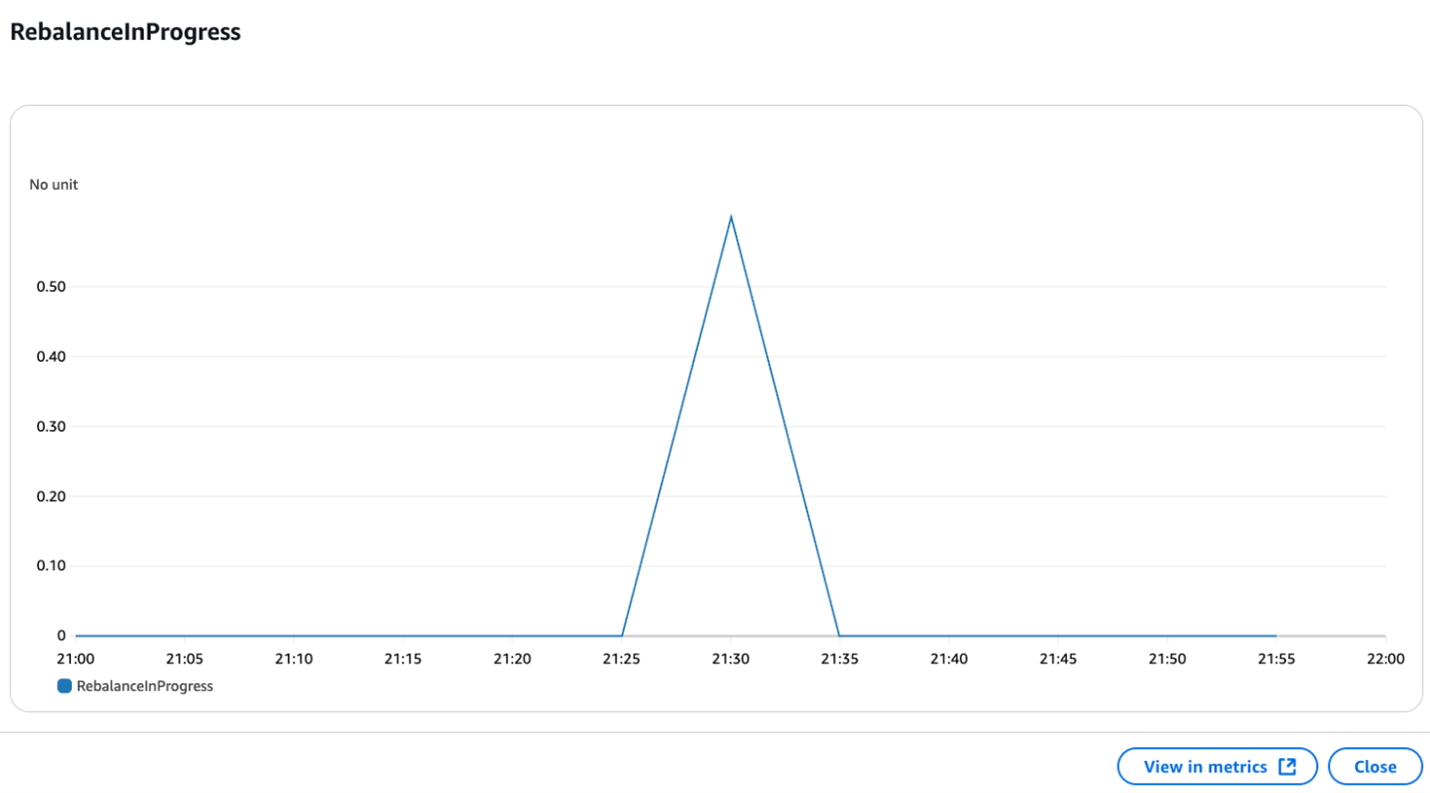
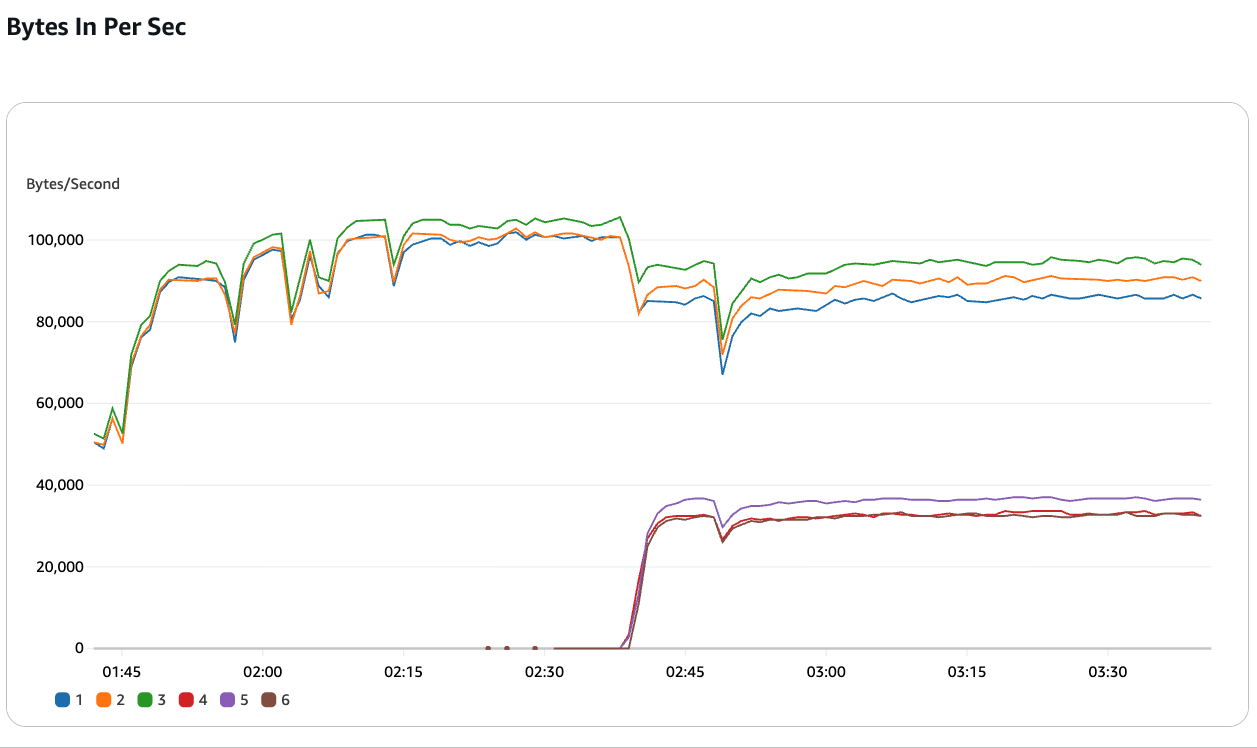
You can track the current and historical rebalancing operations using the metric RebalanceInProgress. In the picture below, you can also see that the clients on the producer side are not impacted during this rebalancing.
Next, we’ll create an imbalance in the cluster by directing a large portion of the traffic to a single broker. You’ll see that Intelligent Rebalancing detects this imbalance within minutes and automatically redistributes the partitions, restoring the cluster to an optimal state.
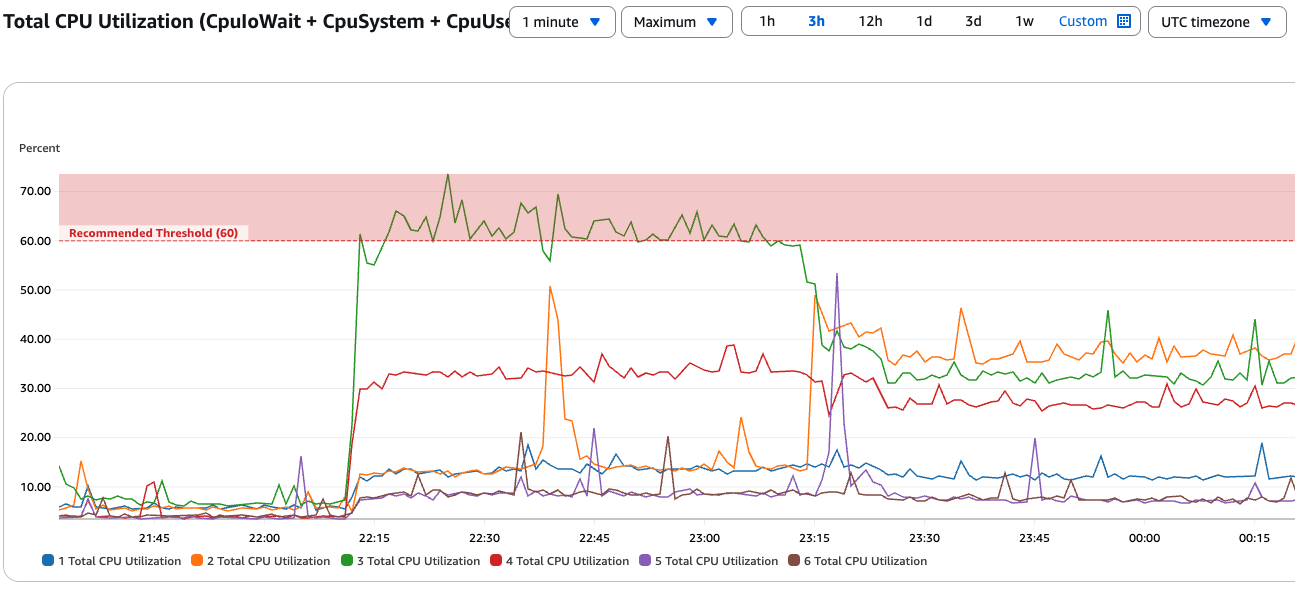
The intelligent rebalancing feature detects hotspots and automatically redistributes affected partitions across other brokers to optimize resource utilization. Without Intelligent Rebalancing, the resource imbalance would persist, potentially leading to performance issues or the need for manual intervention by the customer.

These tests showcase how Intelligent Rebalancing with Amazon MSK Express brokers enables scaling Kafka clusters seamlessly while maintaining consistently high performance, even under varying workload conditions.

Conclusion

Intelligent Rebalancing for Amazon MSK Provisioned clusters with Express brokers are currently being rolled out over the next few weeks in all AWS Regions where Amazon MSK Express brokers are supported. This feature is automatically enabled for all new Amazon MSK Provisioned clusters with Express brokers at no additional cost.

To get started, visit the Amazon MSK console. For more information, see the Amazon MSK Developer Guide.
About the authors

Swapna Bandla

Swapna Bandla

Swapna is a Senior Streaming Solutions Architect at AWS. With a deep understanding of real-time data processing and analytics, she partners with customers to architect scalable, cloud-native solutions that align with AWS Well-Architected best practices. Swapna is passionate about helping organizations unlock the full potential of their data to drive business value. Beyond her professional pursuits, she cherishes quality time with her family.

Masudur Rahaman Sayem

Masudur Rahaman Sayem

Masudur is a Streaming Data Architect at AWS with over 25 years of experience in the IT industry. He collaborates with AWS customers worldwide to architect and implement sophisticated data streaming solutions that address complex business challenges. He has a keen interest and passion for distributed architecture, which he applies to designing enterprise-grade solutions at internet scale.

Shakhi Hali

Shakhi Hali

Shakhi is a Principal Product Manager for Amazon Managed Streaming for Apache Kafka (Amazon MSK) at AWS. She is passionate about helping customers generate business value from real-time data. Before joining MSK, Shakhi was a PM with Amazon S3. In her free time, Shakhi enjoys traveling, cooking, and spending time with family.

Analyzing Amazon EC2 Spot instance interruptions by using event-driven architecture

Post Syndicated from Shekhar Shrinivasan original https://aws.amazon.com/blogs/big-data/analyzing-amazon-ec2-spot-instance-interruptions-by-using-event-driven-architecture/

Amazon Elastic Compute Cloud (Amazon EC2) Spot Instances offer significant cost savings of up to 90% compared to On-Demand pricing, making them attractive for cost-conscious workloads. However, when using Spot Instances within AWS Auto Scaling Groups (ASGs), their unpredictable interruptions create operational challenges. Without proper visibility into interruption patterns, teams struggle to optimize capacity planning, implement effective fallback mechanisms, and make informed decisions about workload placement across availability zones and instance types.

This challenge can be addressed through a custom event-driven monitoring and analytics dashboard that provides near real-time visibility into Spot Instance interruptions specifically for ASG-managed instances. For the remainder of this document, we’ll refer to this custom solution as “Spot Interruption Insights” for Auto Scaling Groups.

In this post, you’ll learn how to build this comprehensive monitoring solution step-by-step. You’ll gain practical experience designing an event-driven pipeline, implementing data processing workflows, and creating insightful dashboards that help you track interruption trends, optimize ASG configurations, and improve the resilience of your Spot Instance workloads.

Solution overview

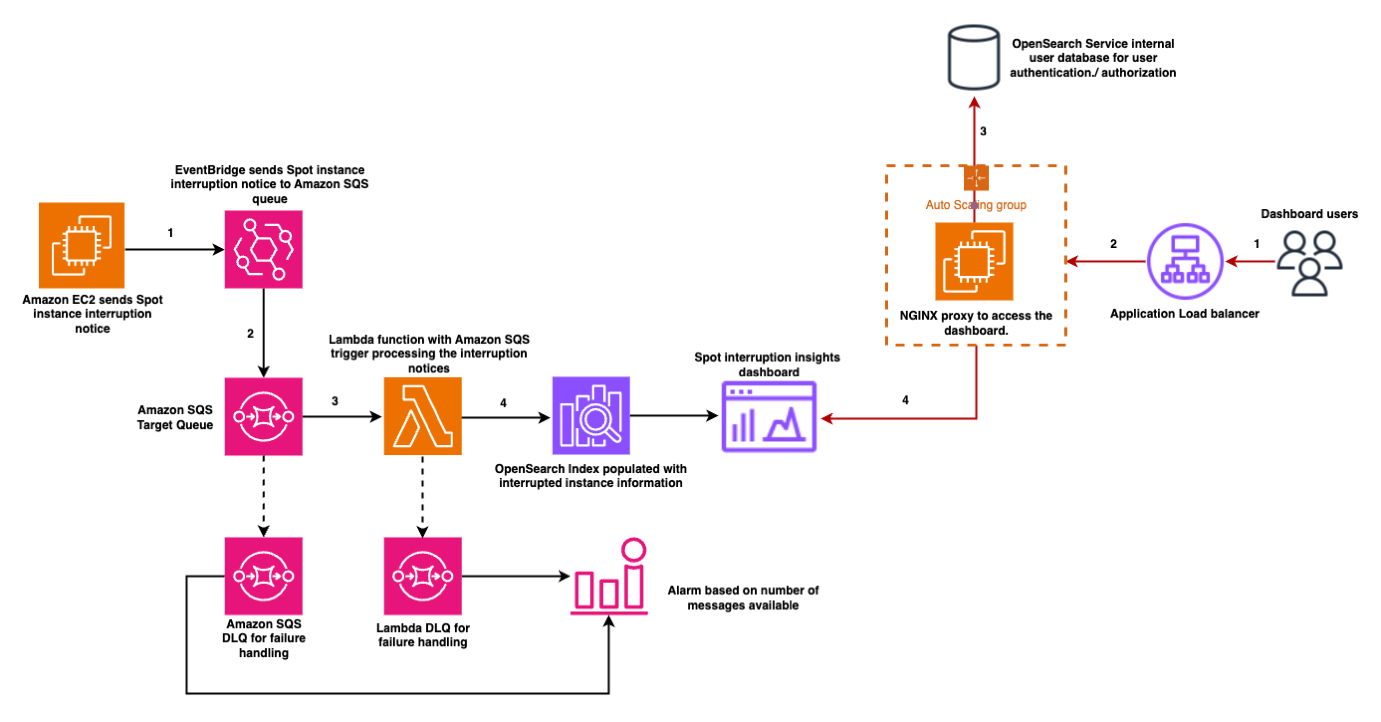
The architecture uses an event-driven approach utilizing AWS native services for robust spot instance interruption monitoring.

The solution uses Amazon EventBridge to capture interruption events, Amazon Simple Queue Service (Amazon SQS) for reliable message queuing, AWS Lambda for data processing, and Amazon OpenSearch Service for storage and visualization of interruption patterns.

  1. EC2 Spot interruption notices are captured via an Amazon EventBridge rule.
  2. The notices are routed to an SQS queue for reliable message handling.
  3. A Lambda function processes the events, fetching EC2 instance metadata and AWS Auto Scaling Group (ASG) details by making optimized batch calls to the EC2 and Auto Scaling APIs. This design minimizes throttling risks on the control plane APIs, ensuring scalability. The Lambda function is configured with batching and concurrency limits to prevent overwhelming the API endpoints and the OpenSearch Service bulk indexing process.
  4. After processing, events are bulk-indexed into Amazon OpenSearch Service, enabling near real-time visibility and analytics.

A Dead Letter Queue (DLQ) ensures no data is lost in case of failures, while AWS Identity and Access Management (IAM) roles enforce least-privilege access between all components.

The OpenSearch Service domain is deployed within the private subnets of an Amazon VPC, ensuring it is not publicly accessible.

  1. Access to OpenSearch Dashboards is routed through an Application Load Balancer (ALB) configured with an HTTPS listener,
  2. ALB forwards traffic to an NGINX proxy running on EC2 instances in an Auto Scaling group. This setup provides secure and scalable access.
  3. Authentication and authorization are enforced using OpenSearch Service’s internal user database, ensuring that only authorized users can access the dashboards.

OpenSearch Dashboards visualize interruption metrics, delivering actionable insights to support effective capacity planning and workload placement.

Extensibility and alternative analytics tools

While this solution uses Amazon OpenSearch Service for storing and visualizing Spot Interruption data, the architecture is flexible and can be extended to support other analytics and observability platforms. You can modify the Lambda function to forward data to tools such as Amazon Quick Sight, Amazon Timestream, Amazon Redshift, or external services depending on your analytics and compliance needs. This enables teams to use their preferred tooling for building visualizations, setting alerts, or integrating with existing dashboards.

What you’ll build

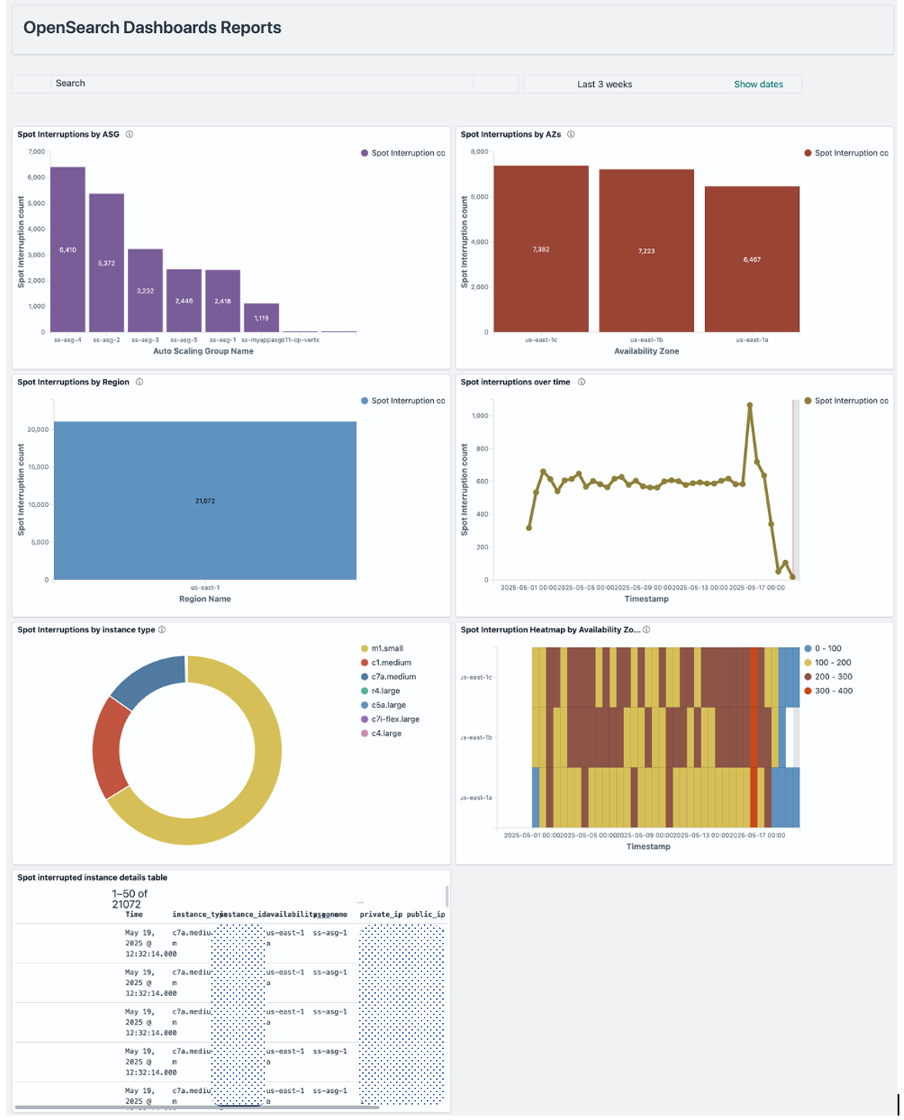
By the end of this post, you’ll have a complete Spot Interruption monitoring system as seen in the following screenshot that automatically captures EC2 Spot Instance interruption events from your Auto Scaling Groups and presents them through interactive dashboards. Your solution will include real-time visualizations showing interruption patterns by availability zone, instance types, and time periods, along with ASG-specific metrics that help you identify optimization opportunities.

The sections of this post walk you through the step-by-step implementation of this solution, from deployment to setting up the event-driven architecture to configuring the analytics dashboards. Remember that you can deploy and customize this solution for your environment.

Prerequisites

You must have access to an AWS account with enough privileges to create and manage the AWS resources discussed in this blog post.You must also have the following software/components installed on your device:

Note: This application utilizes multiple AWS services, and there are associated costs beyond the Free Tier usage. Refer to the AWS Pricing page for specific details. You are accountable for any incurred AWS costs. This example solution does not imply any warranty.

Deployment instructions

Create a new directory, navigate to that directory in a terminal and clone the GitHub repository:

git clone https://github.com/aws-samples/sample-spot-interruption-insights

Change directory to the solution directory:

cd sample-spot-interruption-insights

Checklist for deployment

This section lists the setup and configurations that are required before you deploy the solution stack by using AWS SAM.

If you don’t have a VPC, Subnets, NAT Gateway already created and configured you can follow the steps mentioned in the Amazon VPC documentation to create the necessary resources.

  1. VPC Created – Ensure a VPC exists with DNS hostnames and DNS resolution enabled. You will need the VPC ID during deployment
  2. Public Subnets (2 or more) – Configure two or more public subnet IDs from different Availability Zones.
  3. Private Subnets (2 or more) – Configure two or more private subnet IDs from different Availability Zones.
  4. Outbound Internet Access for Private Subnets – Ensure NAT Gateway access as nginx proxy will be installed on EC2 instance in private subnet. Refer to Example: VPC with servers in private subnets and NAT for more information on setting up NAT for instances in private subnets.
  5. ALB Access – CIDR IP range allowed to access ALB (such as, `1.2.3.4/32`). This is for accessing the dashboard.
  6. Certificate ARN for ALB HTTPS Listener – To configure HTTPS listener. Certificate (can be self-signed) for HTTPS port of the load balancer. Refer to Prerequisites for importing ACM certificates for more information on importing self-signed certificate into AWS Certificate Manager (ACM)
  7. OpenSearch Service-Linked Role – Before deploying this template, ensure the AWS OpenSearch service-linked role exists in your account by running:
    aws iam create-service-linked-role --aws-service-name es.amazonaws.com

    Note:

    • This command only needs to be run once per AWS account.
    • If the role already exists, you’ll see an error message that can be safely ignored.
    • This role allows Amazon OpenSearch Service to manage network interfaces in your VPC.
    • Without this role, deployments that place OpenSearch Service domains in a VPC will fail with the error: “Before you can proceed, you must enable a service-linked role to give Amazon OpenSearch Service permissions to access your VPC.”
    • The service-linked role is named "AWSServiceRoleForAmazonOpenSearchService" and is managed by AWS.
  8. AMIId – Valid EC2 AMI ID for the region. Note:- This solution is designed to work exclusively with AMIs that use the DNF package manager. Use the latest Amazon Linux 2023 AMI for optimal compatibility and security.

    The following AMIs are confirmed compatible with this solution:

    • Amazon Linux 2023
    • Fedora (35 and newer)
    • RHEL 8 and newer
    • CentOS Stream 8 and newer
    • Oracle Linux 8 and newer

Build and deploy the solution – From the command line, use AWS SAM to build and deploy the AWS resources as specified in the template.yml file.

sam build
sam deploy --guided

During the prompts: Fill-out the following parameters:

  • Stack Name: {Enter your preferred stack name}
  • AWS Region: {Enter your preferred region code}
  • Parameter DomainName: {Enter the name for your new OpenSearch Service domain where the index will be created and data will be pushed for analytics. This will create a new OpenSearch domain with the name you specify – Preferably keep short domain name}
  • MasterUsername: {Admin username to login to the OpenSearch dashboard}
  • MasterUserPassword: { Must contain lowercase, uppercase, numbers, and special characters (!@#$%^&*). Minimum 12 characters recommended. Avoid common passwords (Password123!, Admin@2024 and more) as these may cause deployment failures due to security validation checks.}
  • IndexName: {OpenSearch Index name where Spot interrupted instance related data will be pushed}
  • EventRuleName: {Amazon EventBridge rule name to capture EC2 Spot interruption notices}
  • CustomEventRuleName: {Amazon EventBridge custom rule name to capture EC2 Spot interruption notices. This will be used for verifying the solution}
  • TargetQueueName: {EventBridge Rule target SQS name}
  • SQSDLQQueueName: {Target SQS Dead Letter Queue name}
  • LambdaDLQQueueName: {Lambda Dead Letter Queue name}
  • VPCId: {Enter the VPCId where the resources will be deployed}
  • PublicSubnetIds: {Enter 2 or more Public SubnetIDs separated by comma}
  • PrivateSubnetIds: {Enter 2 or more Private SubnetIDs separated by comma}
  • RestrictedIPCidr: {IP address/CIDR for restricting ALB access in CIDR format (such as 10.2.3.4/32)}
  • CertificateArn: {Certificate ARN for configuring ALB HTTPS Listener}
  • AMIId: {Valid EC2 AMI ID for the region}
  • Confirm changes before deploy: Y
  • Allow SAM CLI IAM role creation: Y
  • Disable rollback: N
  • Save arguments to configuration file: Y
  • SAM configuration file: {Press enter to use default name}
  • SAM configuration environment: {Press enter to use default name}

Note: The complete solution may take approximately 15-20 minutes to deploy. After the deployment is complete, there are a few manual steps that need to be performed to ensure the solution functions as expected.

Post deployment instructions

The following steps need to be performed in OpenSearch Dashboards after logging in. Get the DNS Name of the Application Load Balancer endpoint from the deployment output section of the CloudFormation stack or the ALB console. Access the OpenSearch dashboards using the ALB DNS name as follows –

https://[ALB-DNS-NAME]/_dashboards

You will be redirected to the OpenSearch Dashboards login page. Log in using the MasterUsername and MasterUserPassword you specified during deployment.

If this is the first time you are logging in then you may see a Welcome screen.

  1. Choose ‘Explore on my own’ on the Welcome screen.
  2. Choose ‘Dismiss’ on the next screen.
  3. If the ‘Select your tenant’ dialog appears with ‘Global’ preselected, Choose ‘Confirm’. Otherwise, select ‘Global’ first and then and choose ‘Confirm’.

Create index and attribute mapping

This section lists the required steps to create the index and attribute mapping.

  1. On the Home screen select the Hamburger Menu icon () on the top left
  2. Select ‘Dev Tools’ at the bottom of the menu.
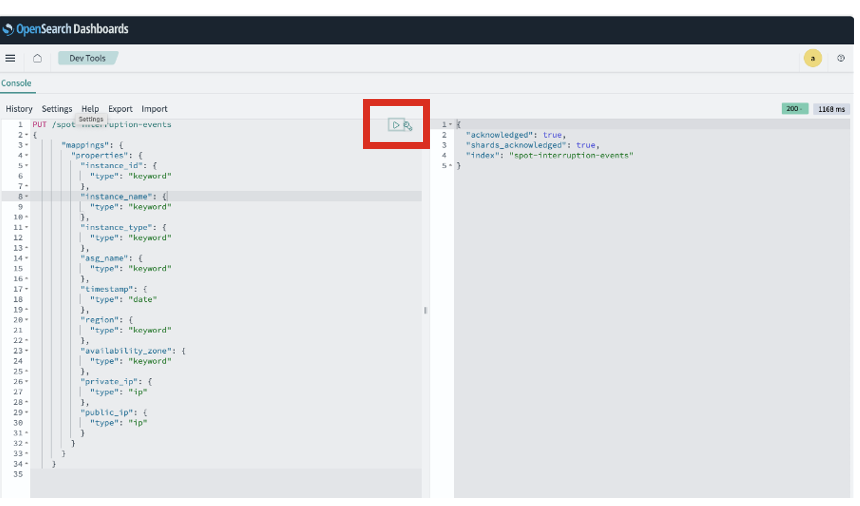
  3. On the dev tools console, paste the following PUT command and execute the request by choosing ‘Click to send request’.

    Note The index name should match what you entered during the deployment. Change the index name accordingly before creating the index.

    PUT /<YOUR-INDEX-NAME-SPECIFIED-DURING-DEPLOYMENT>
            {
                "mappings": {
                    "properties": {
                    "instance_id": {
                        "type": "keyword"
                    },
                    "instance_name": {
                        "type": "keyword"
                    },
                    "instance_type": {
                        "type": "keyword"
                    },
                    "asg_name": {
                        "type": "keyword"
                    },
                    "timestamp": {
                        "type": "date"
                    },
                    "region": {
                        "type": "keyword"
                    },
                    "availability_zone": {
                        "type": "keyword"
                    },
                    "private_ip": {
                        "type": "ip"
                    },
                    "public_ip": {
                        "type": "ip"
                    }
                    }
                }
            }

    The following is a screenshot of this command in Dev Tools.

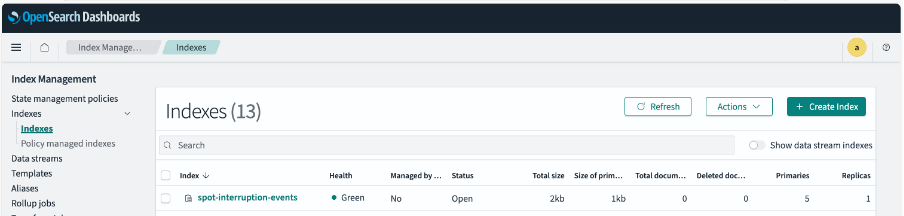
  4. Confirm that the index was created successfully.

Create index pattern

This section lists the required steps to create the index pattern

  1. Access the Hamburger Menu icon on the top left.
  2. Select ‘Dashboard Management’ from the bottom of the menu.
  3. Choose ‘Index Patterns’
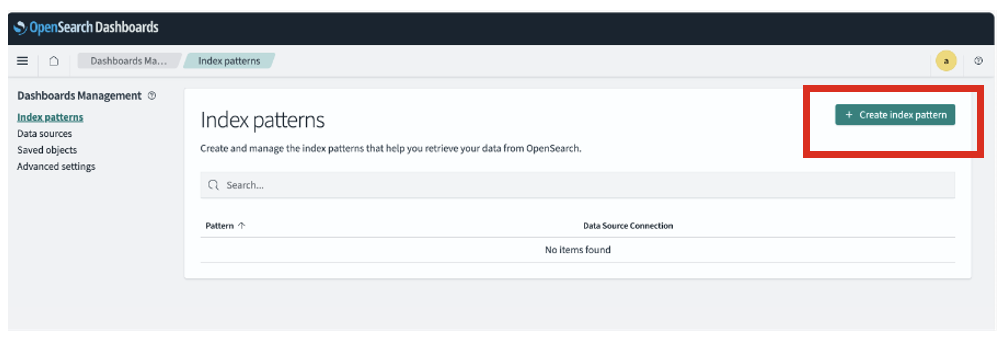
  4. Choose “Create Index Pattern”
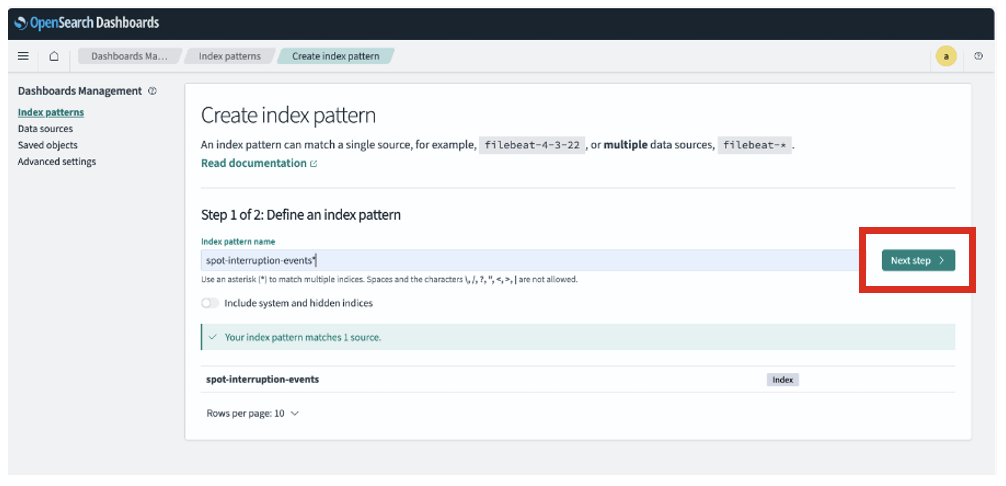
  5. Enter the Index pattern name and choose “Next step”.
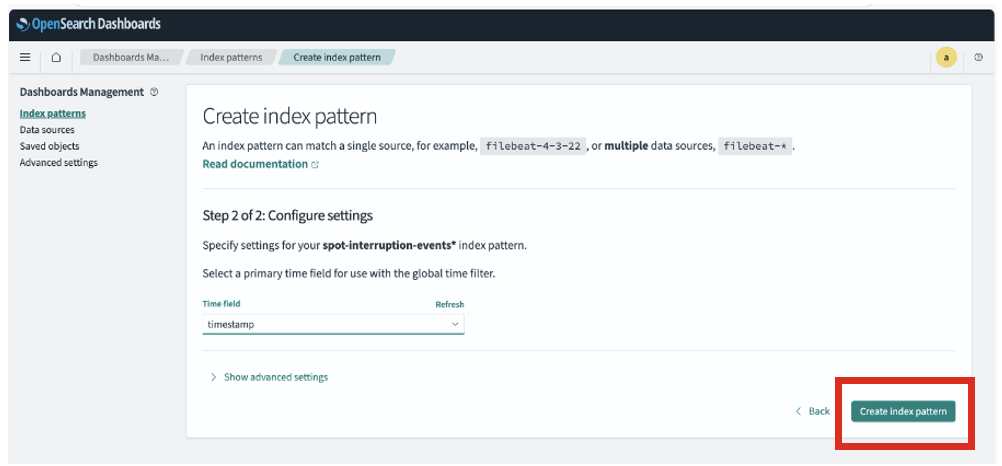
    The index pattern name should be the index name you entered during the deployment followed by an asterisk. See the following screenshot for reference.

  6. Select ‘timestamp’ in primary Time field and choose ‘Create index pattern’
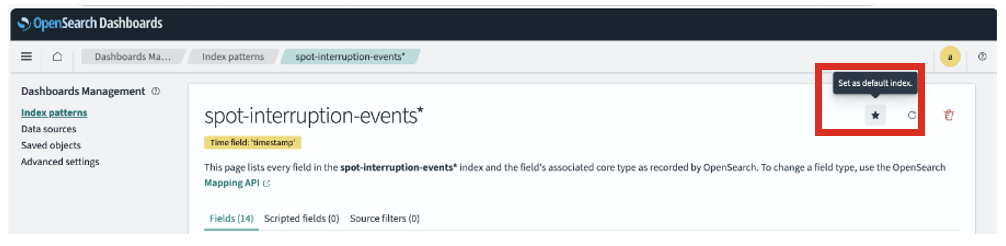
  7. Choose the star icon to make the index pattern default

Configure Lambda with required access for new index

In this section you will create a role in OpenSearch Service dashboards and will map Lambda execution role to the same to perform operations on the new index.

  1. Navigate to the Lambda console
  2. Search for the function beginning with your OpenSearch Service domain name.
  3. In the function details, go to Configuration > Permissions
  4. Choose the Role Name in the Execution Role section.
  5. Copy the Lambda execution role ARN from this function which handles Spot interruption events.
  6. Access the Hamburger Menu icon on the top left and select ‘Security’ from the bottom of the menu.
  7. Now select the ‘Roles’ menu option under ‘Security’ menu and then select ‘Create Role’
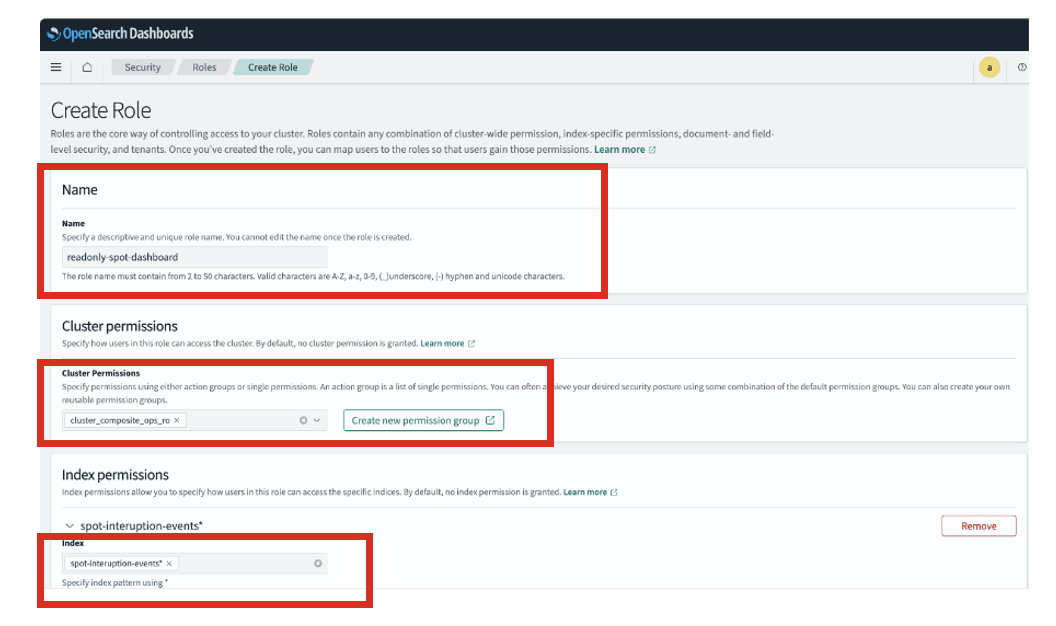
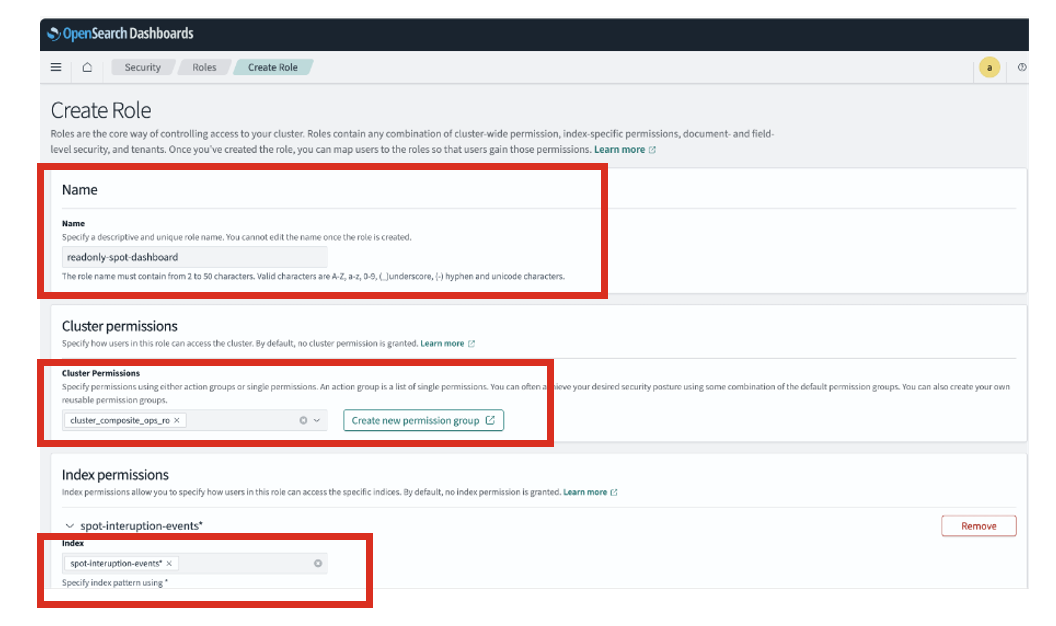
    • Enter a role name and set Cluster Permissions to “cluster_composite_ops_ro“.
    • For Index Permissions, select the index pattern name created during deployment.

    See the following screenshot for reference.

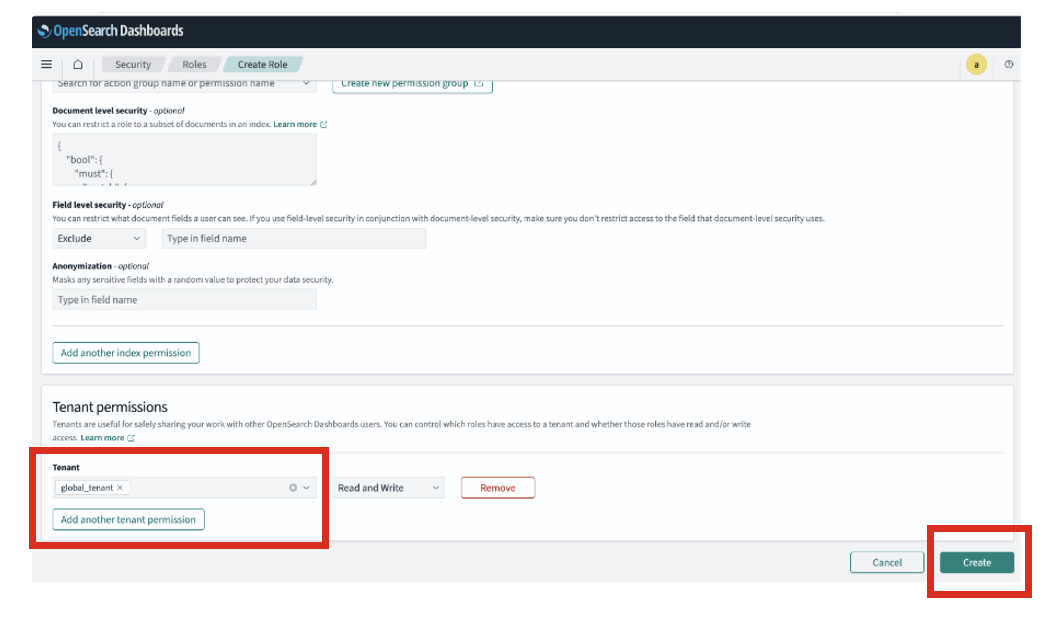
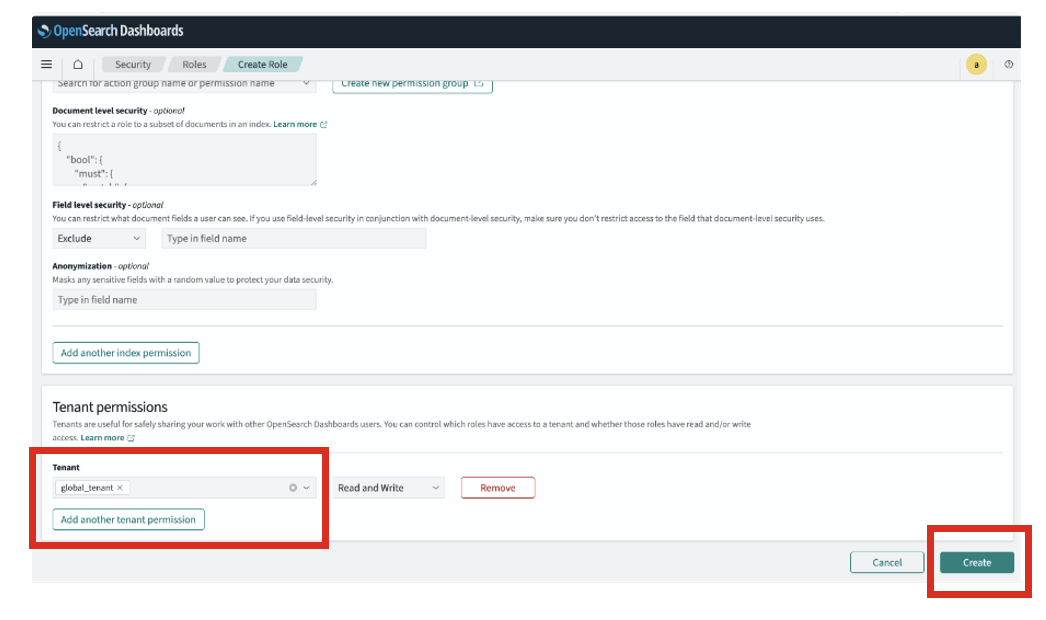
  8. Set the Tenant Permissions to “global_tenant” as seen in the image and Choose “Create”.

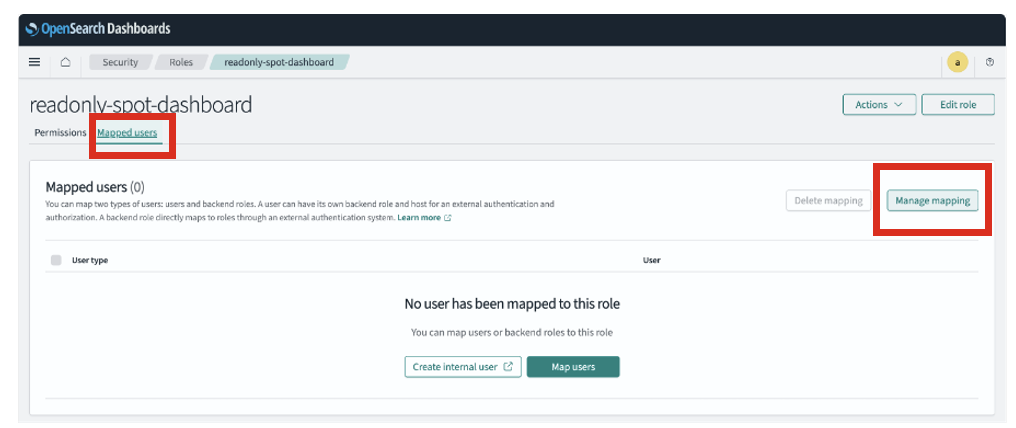
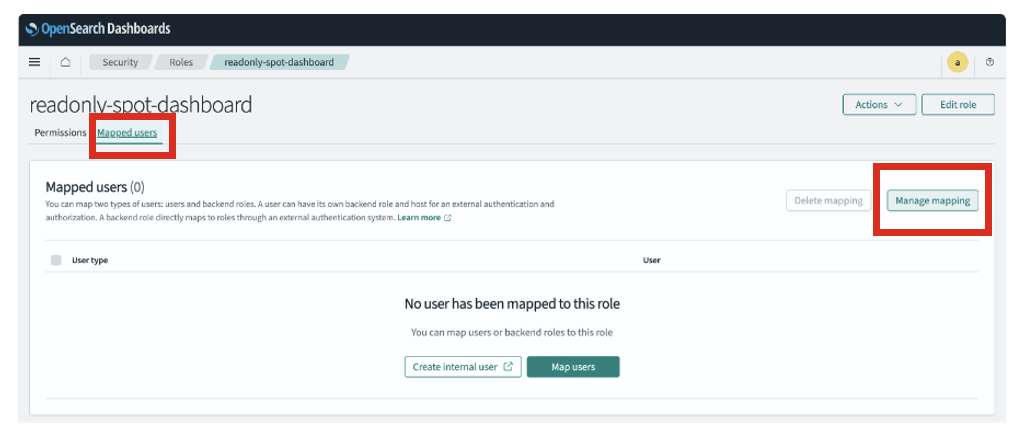
  9. After the role is created, on the same screen, select the ‘Mapped Users’ tab and choose ‘Manage Mapping’

  10. Choose ‘Manage Mapping’
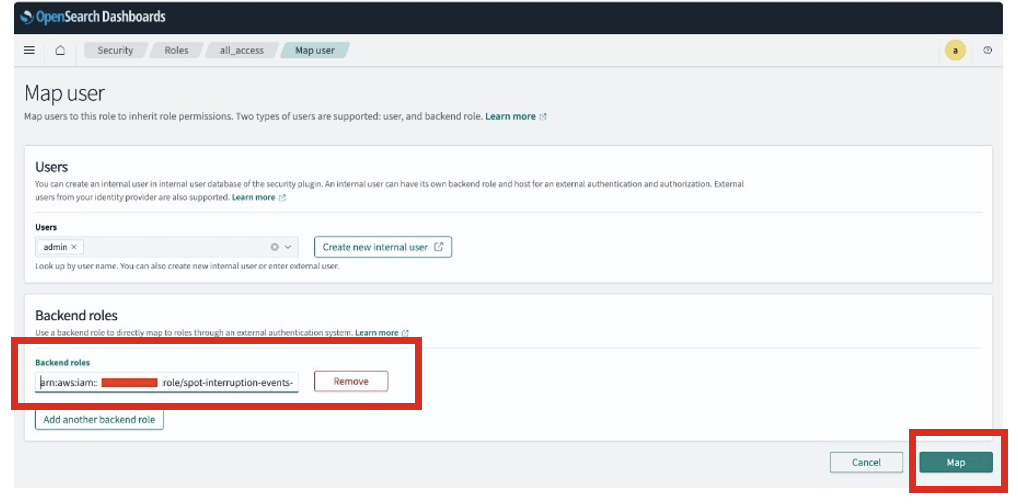
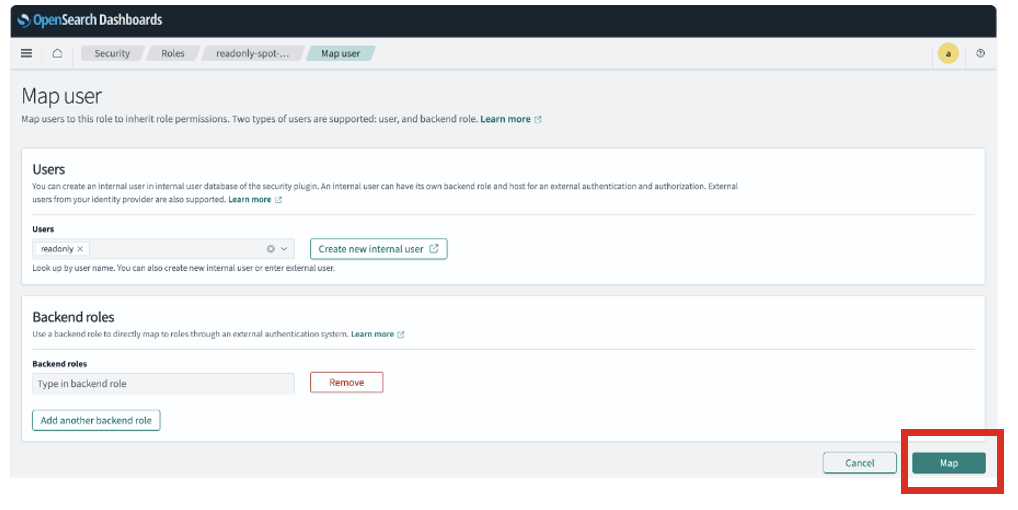
  11. In the ‘Backend roles’ add the Lambda execution role ARN copied earlier and Choose ‘Map’

You can create more users in the internal database and grant appropriate access to the visualisations and dashboards. The following steps show how to create a read only role and to create an internal user and grant read only access.

Manage users and roles

In this section you will create a new user and a role with read-only access, then assign the role to the user to grant them read-only access to the Spot Interruption dashboard and visualizations.

  1. Access the Hamburger Menu icon on the top left
  2. Select ‘Security’ from the bottom of the menu
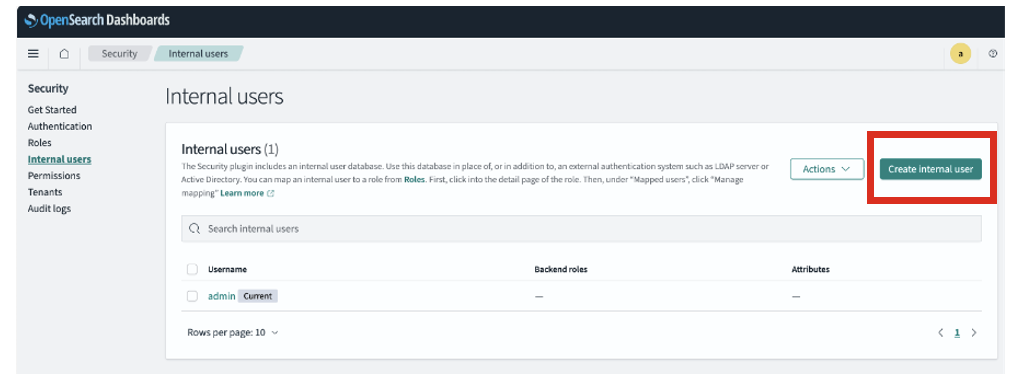
  3. Select ‘Internal Users’ and then select ‘Create Internal user’
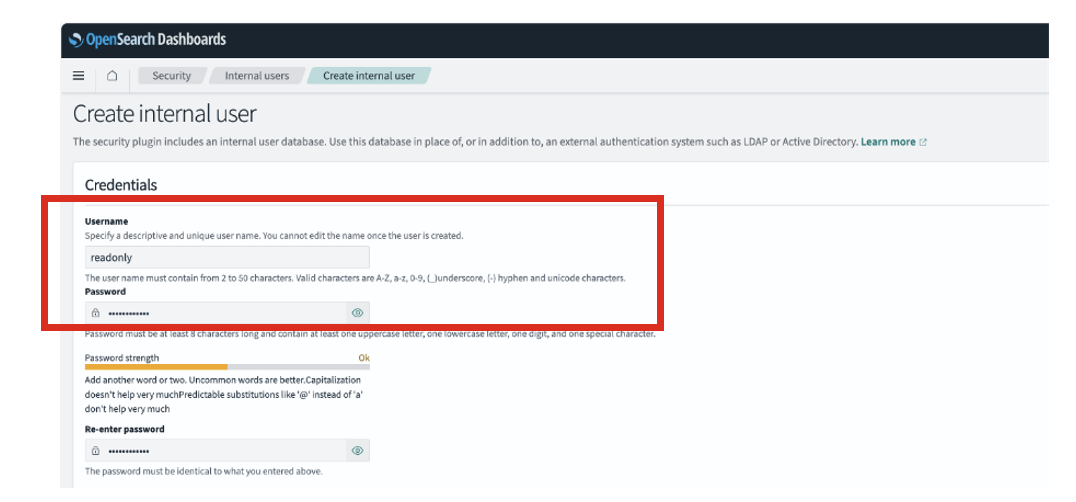
  4. Enter username and set a Password, then choose “Create”.

  5. Now select the ‘Roles’ menu option under ‘Security’ menu and then select ‘Create Role’
    • Enter the role name and set Cluster Permissions to “cluster_composite_ops_ro“.
    • For Index Permissions, select the index pattern name created during deployment.

    See the following screenshot for reference.

  6. Set the Tenant Permissions to “global_tenant” as seen in the image and Choose “Create”.

  7. After the role is created, on the same screen, select the ‘Mapped Users’ tab and choose ‘Manage Mapping’

  8. Select the user created above in ‘Users’ and choose ‘Map’

Configure and deploy sample visualisations and dashboard

Sample visualizations and a starter dashboard are provided under the data folder of the git repo you cloned earlier. Look for the file named spot-interruption-dashboard-visualisations.ndjson.To import the visualizations:

  1. Navigate to Saved Objects under Dashboard Management in OpenSearch Dashboards.
  2. Import the spot-interruption-dashboard-visualisations.ndjson file.
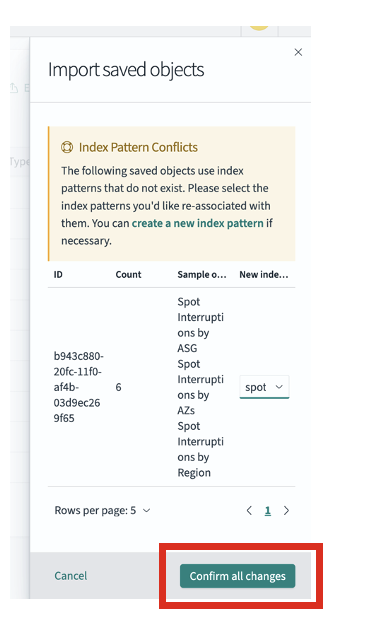
  3. During the import, you may encounter index pattern conflicts. Select the index pattern you created from the dropdown and choose “Confirm all changes”.

Once imported, the sample visualizations and dashboard linked to your index pattern will be available under Dashboards in the left-side hamburger menu. You can view the Spot Interruption Dashboard, which includes visualizations based on Availability Zones, Regions, Instance Types, Auto Scaling Groups (ASGs), and Interruptions over time. You can further customize by creating your own visualizations using the attributes available in the index or by editing/creating new dashboards. The dashboard will display empty views until Spot interruption data is available to visualize.

Test the solution

A temporary event rule was created during deployment to simulate matching Amazon EC2 Spot interruption notices. The rule name is the name you specified during deployment for the CustomEventRuleName parameter.

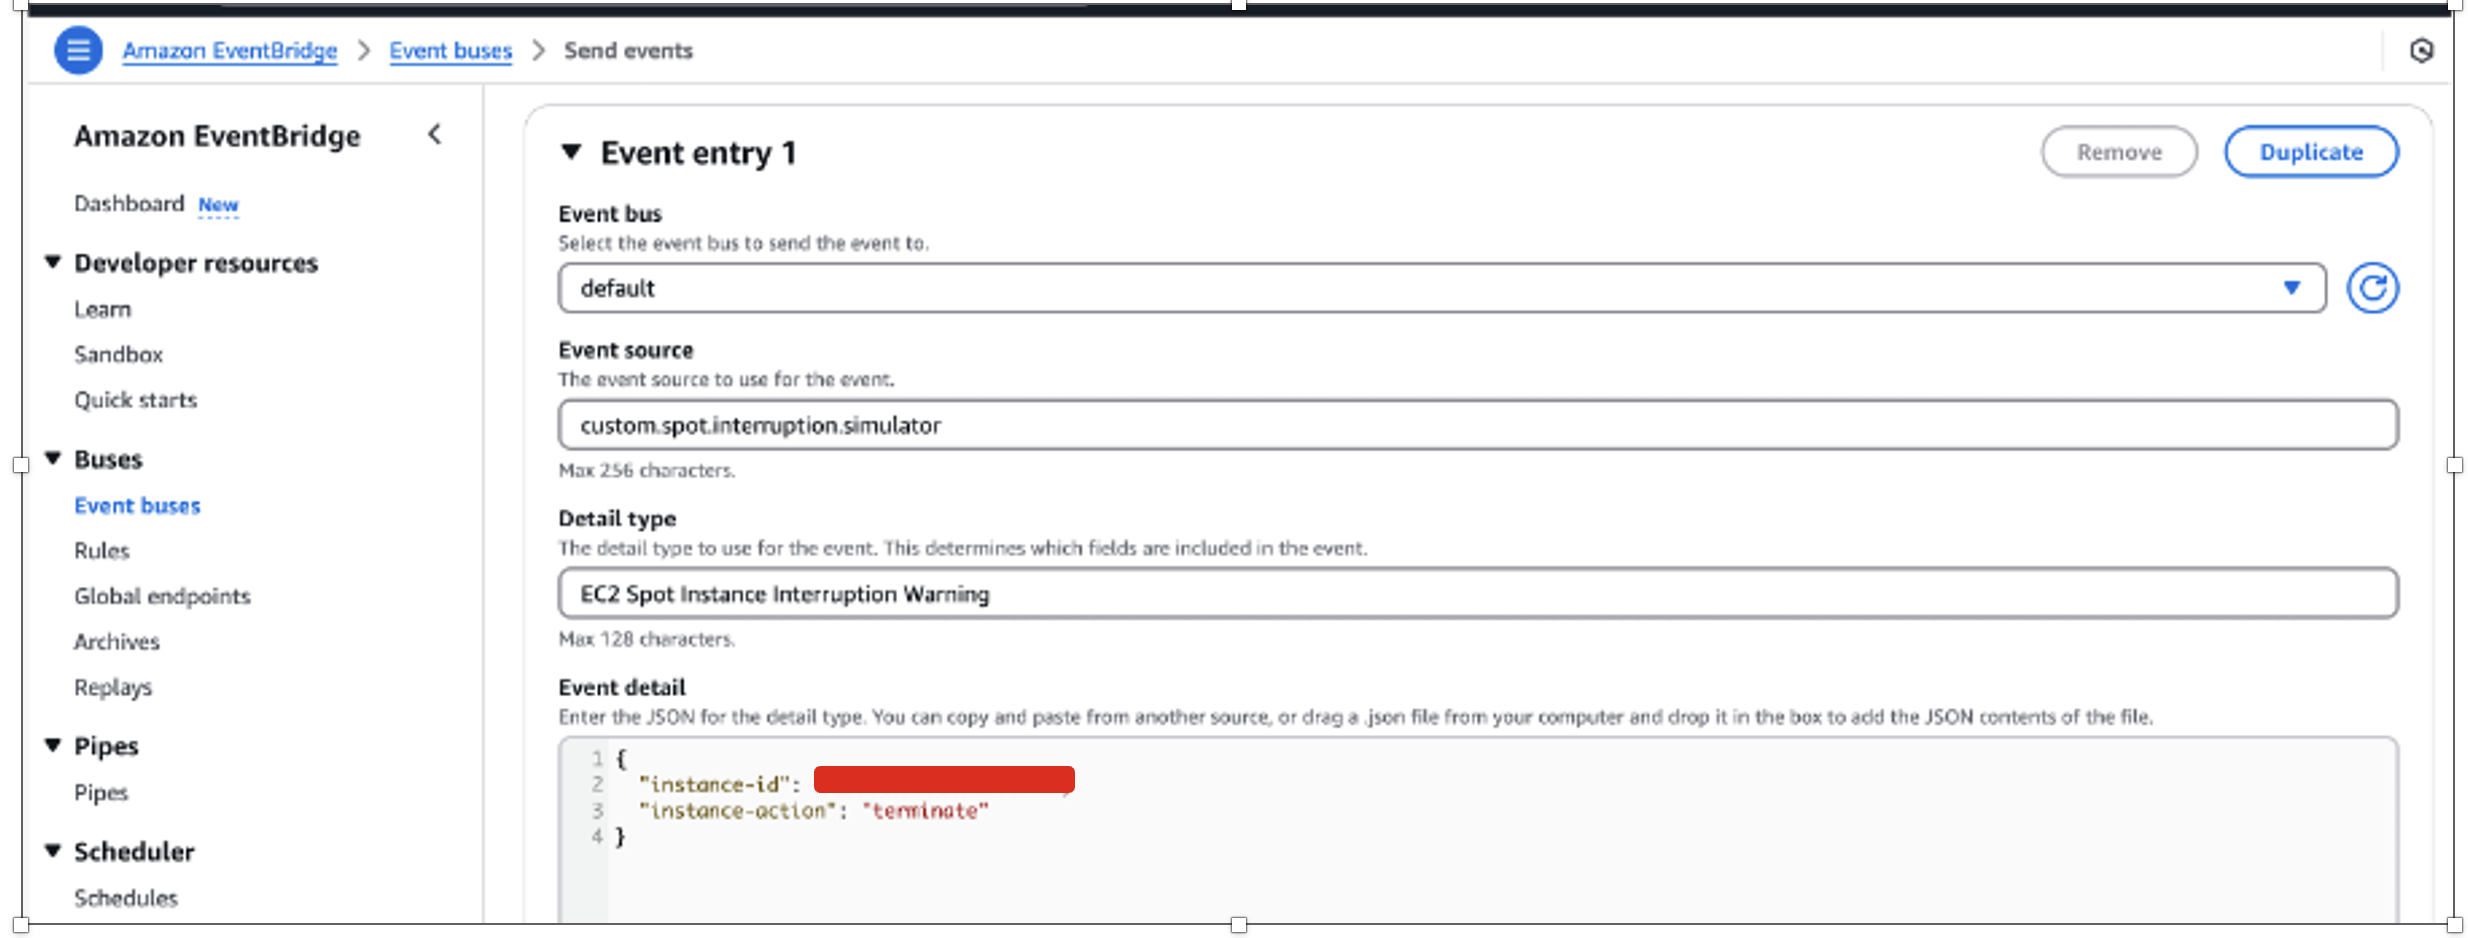
To verify the solution, you can send sample events from the EventBridge console as depicted below. In the AWS console,

  • Open the Amazon EventBridge console
  • In the left menu under ‘Buses’ section choose ‘Event buses’
  • Choose the ‘default’ event bus
  • Choose the ‘Send events’ button
  • In the Send events page enter the following details:
    • Event bus: default
    • Event source: custom.spot.interruption.simulator
    • Detail type: EC2 Spot Instance Interruption Warning
    • Event detail: {"instance-id": "<instance-id>", "Instance-action": "terminate"}

    Replace the instance-id with an actual instance id that is associated with an Amazon EC2 Auto Scaling group. Refer to the following screenshot.

After the event is sent successfully, you can log in to OpenSearch Dashboards and view the Spot Interruption Dashboard, which has been prebuilt with the indexed event data. This dashboard provides insights across key dimensions such as Availability Zones, Regions, instance types, Auto Scaling groups, and interruption trends over time. Use the dashboard as a starting point to understand the kinds of insights possible and customize or create new visualizations based on your needs and the fields available in the index.

Alternatively, you can navigate to the Discover section in the menu to view the raw event details. Ensure that you select the index pattern you created earlier in this demonstration, and adjust the time range if necessary (such as the last 15 minutes) to view the latest data.

Security and cost optimizations

This solution is designed to be secure and cost-efficient by default, but there are some more optimizations you can apply to further reduce cost and enhance security:

Security best practices

  1. Amazon Cognito Authentication : Integrate Amazon Cognito with OpenSearch Dashboards to manage user authentication, enable Multi Factor Authentication, and avoid hardcoding admin credentials. More information Configuring Amazon Cognito authentication for OpenSearch Dashboards
  2. Lambda Layer Versioning: Ensure pinned versions of Lambda Layers are used to avoid unexpected changes. More information Managing Lambda dependencies with layers
  3. Logging and Threat Detection: Enable AWS CloudTrail and Amazon GuardDuty to monitor for unauthorized activity or anomalies. More information Monitoring Amazon OpenSearch Service API calls with AWS CloudTrail

Cost optimizations

  1. Bulk Indexing with Throttling Controls: Lambda processes batches and respects throttling limits to avoid excessive OpenSearch usage.
  2. Short Retention for CloudWatch Logs: Tune log retention periods to avoid unnecessary storage costs.
  3. Optimize Visualizations: Design saved visualizations to avoid expensive queries (like wide time ranges and large aggregations). More information Optimizing query performance for Amazon OpenSearch Service data sources
  4. Index State Management (ISM) : Configure ISM policies in OpenSearch to delete or archive older interruption data. More information Index State Management in Amazon OpenSearch Service

Cleanup

Run the following command to delete the resources deployed earlier.

sam delete

After deleting the stack, make sure to also remove any post-deployment configurations you may have created within the OpenSearch Service dashboards console. While these configurations won’t incur additional costs, it’s considered a best practice to clean up your environment by deleting any resources that are no longer needed. Take some time to review the OpenSearch Service dashboards and identify any custom settings, dashboards, or visualizations you set up during the deployment process. Then, delete these individual configurations to ensure your environment is fully cleaned up.

Conclusion

In this post, you learned how to build and deploy a comprehensive Spot Instance interruption monitoring solution for Auto Scaling groups by using EventBridge, Amazon SQS, Lambda, and OpenSearch Service. You implemented an event-driven pipeline to capture and process Amazon EC2 Spot Instance interruption events, created secure analytics dashboards, and established real-time visibility into interruption patterns across your Auto Scaling group–managed workloads.

This post’s solution empowers your teams with the visibility and agility needed to operate confidently with Amazon EC2 Spot Instances. By combining event-driven architecture with secure, scalable analytics, you can now proactively monitor interruption events, identify interruption trends, and optimize workload strategies for resilience and cost-efficiency.

With real-time data at your fingertips, you’re equipped to make smarter infrastructure decisions and maximize the benefits of Spot Instance capacity while minimizing disruption risks.


About the author

Shekhar Shrinivasan

Shekhar Shrinivasan

Shekhar is a Senior Technical consultant who specializes in cloud architecture design, migration strategies, and AWS workload optimization. He helps enterprise customers accelerate their digital transformation through best practices implementation, scalable infrastructure solutions, and strategic technical guidance to maximize their cloud return on investment.

Secure EKS clusters with the new support for Amazon EKS in AWS Backup

Post Syndicated from Veliswa Boya original https://aws.amazon.com/blogs/aws/secure-eks-clusters-with-the-new-support-for-amazon-eks-in-aws-backup/

Today, we’re announcing support for Amazon EKS in AWS Backup to provide the capability to secure Kubernetes applications using the same centralized platform you trust for your other Amazon Web Services (AWS) services. This integration eliminates the complexity of protecting containerized applications while providing enterprise-grade backup capabilities for both cluster configurations and application data. AWS Backup is a fully managed service to centralize and automate data protection across AWS and on-premises workloads. Amazon Elastic Kubernetes Service (Amazon EKS) is a fully managed Kubernetes service to manage availability and scalability of the Kubernetes clusters. With this new capability, you can centrally manage and automate data protection across your Amazon EKS environments alongside other AWS services.

Until now, for backups, customers relied on custom solutions or third-party tools to back up their EKS clusters, requiring complex scripting and maintenance for each cluster. The support for Amazon EKS in AWS Backup eliminates this overhead by providing a single, centralized, and policy-driven solution that protects both EKS clusters (Kubernetes deployments and resources) and stateful data (stored in Amazon Elastic Block Store (Amazon EBS), Amazon Elastic File System (Amazon EFS), and Amazon Simple Storage Service (Amazon S3) only) without the need to manage custom scripts across clusters. For restores, customers were previously required to restore their EKS backups to a target EKS cluster which was either the source EKS cluster, or a new EKS cluster, requiring that an EKS cluster infrastructure is provisioned ahead of time prior to the restore. With this new capability, during a restore of EKS cluster backups, customers also have the option to create a new EKS cluster based on previous EKS cluster configuration settings and restore to this new EKS cluster, with AWS Backup managing the provisioning of the EKS cluster on the customer’s behalf.

This support includes policy-based automation for protecting single or multiple EKS clusters. This single data protection policy provides a consistent experience across all services AWS Backup supports. It allows creation of immutable backups to prevent malicious or inadvertent changes, helping customers meet their regulatory compliance needs. In case there is a customer data loss or cluster downtime event, customers can easily recover their EKS cluster data from encrypted, immutable backups using an easy-to-use interface and maintain business continuity of running their EKS clusters at scale.

How it works
Here’s how I set up support for on-demand backup of my EKS cluster in AWS Backup. First, I’ll show a walkthrough of the backup process, then demonstrate a restore of the EKS cluster.

Backup
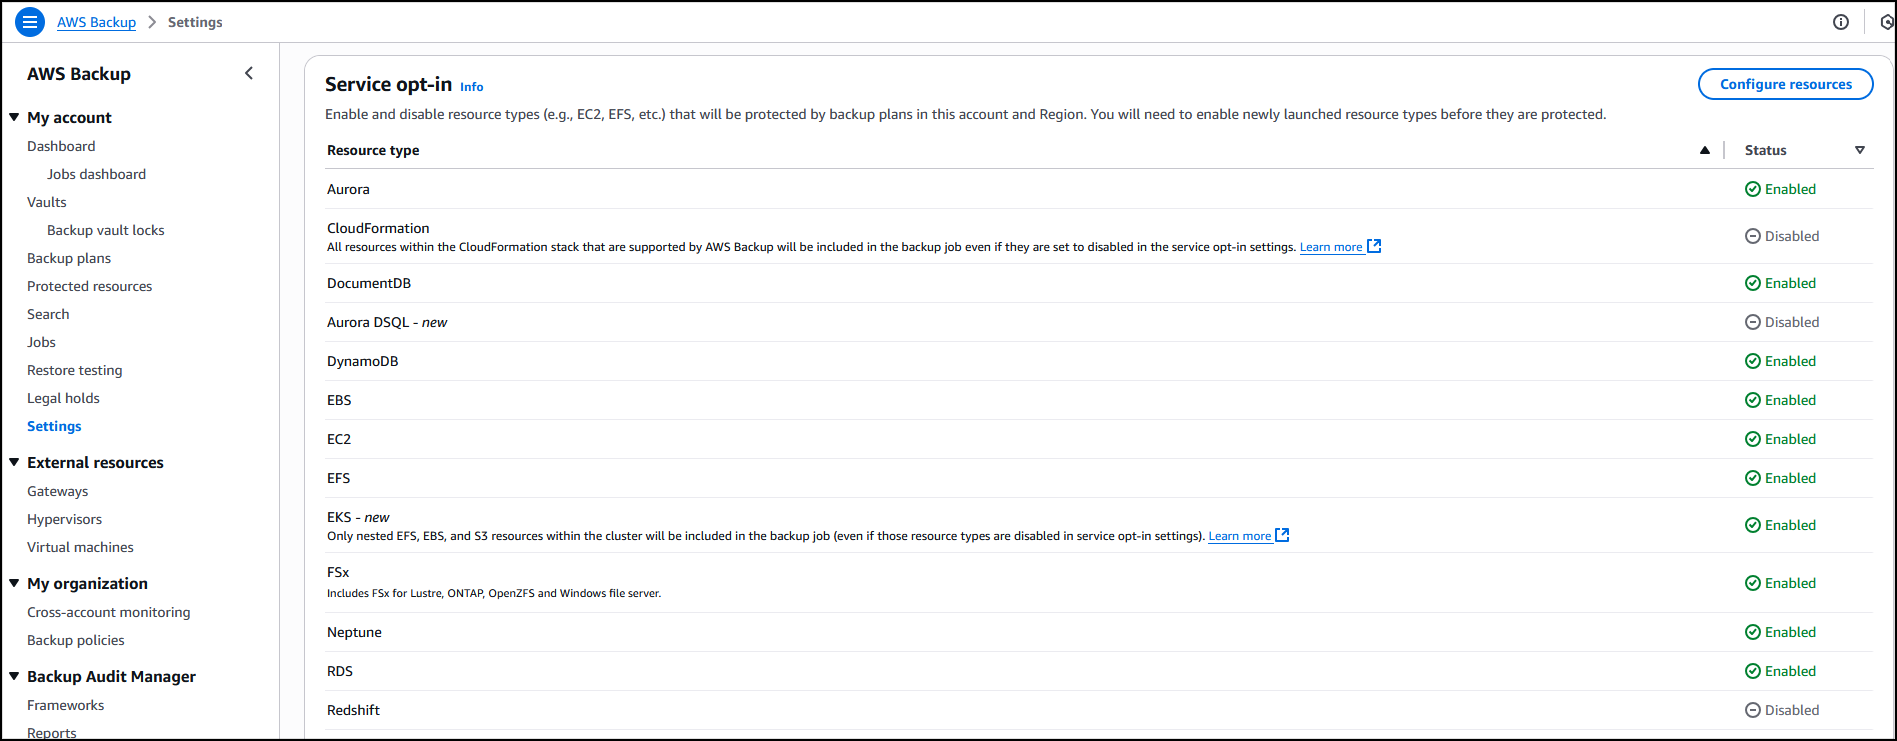
In the AWS Backup console, in the left navigation pane, I choose Settings and then Configure resources to opt in to enable protection of EKS clusters in AWS Backup.
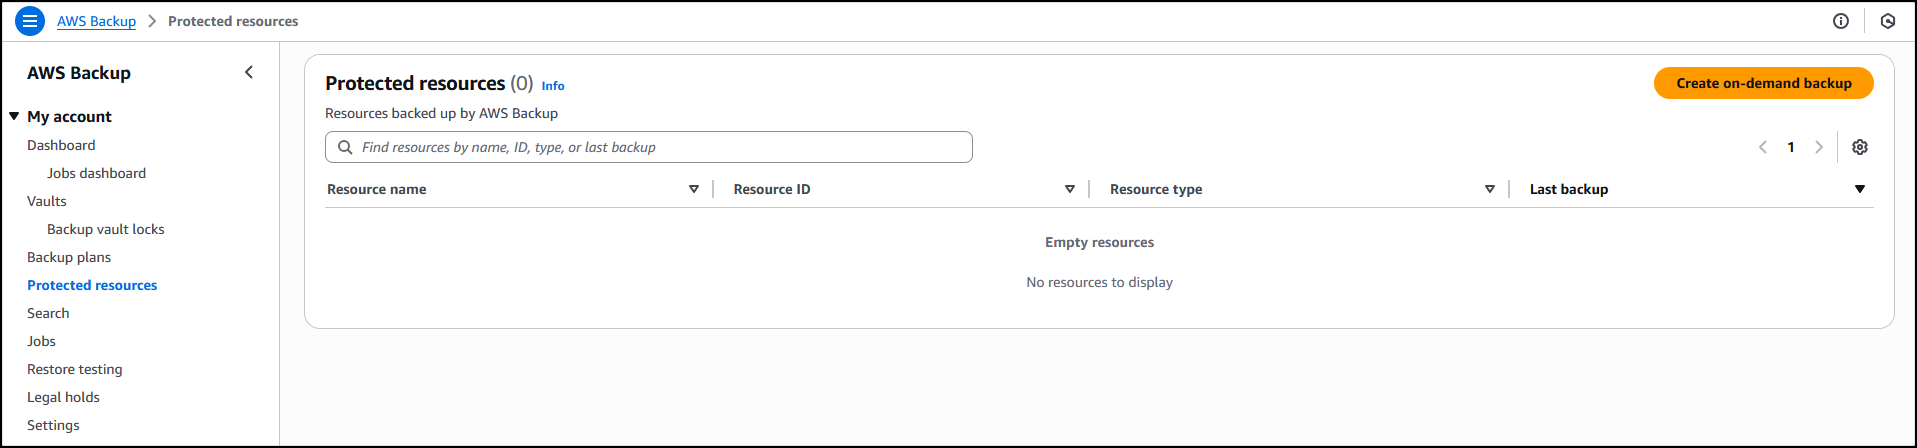
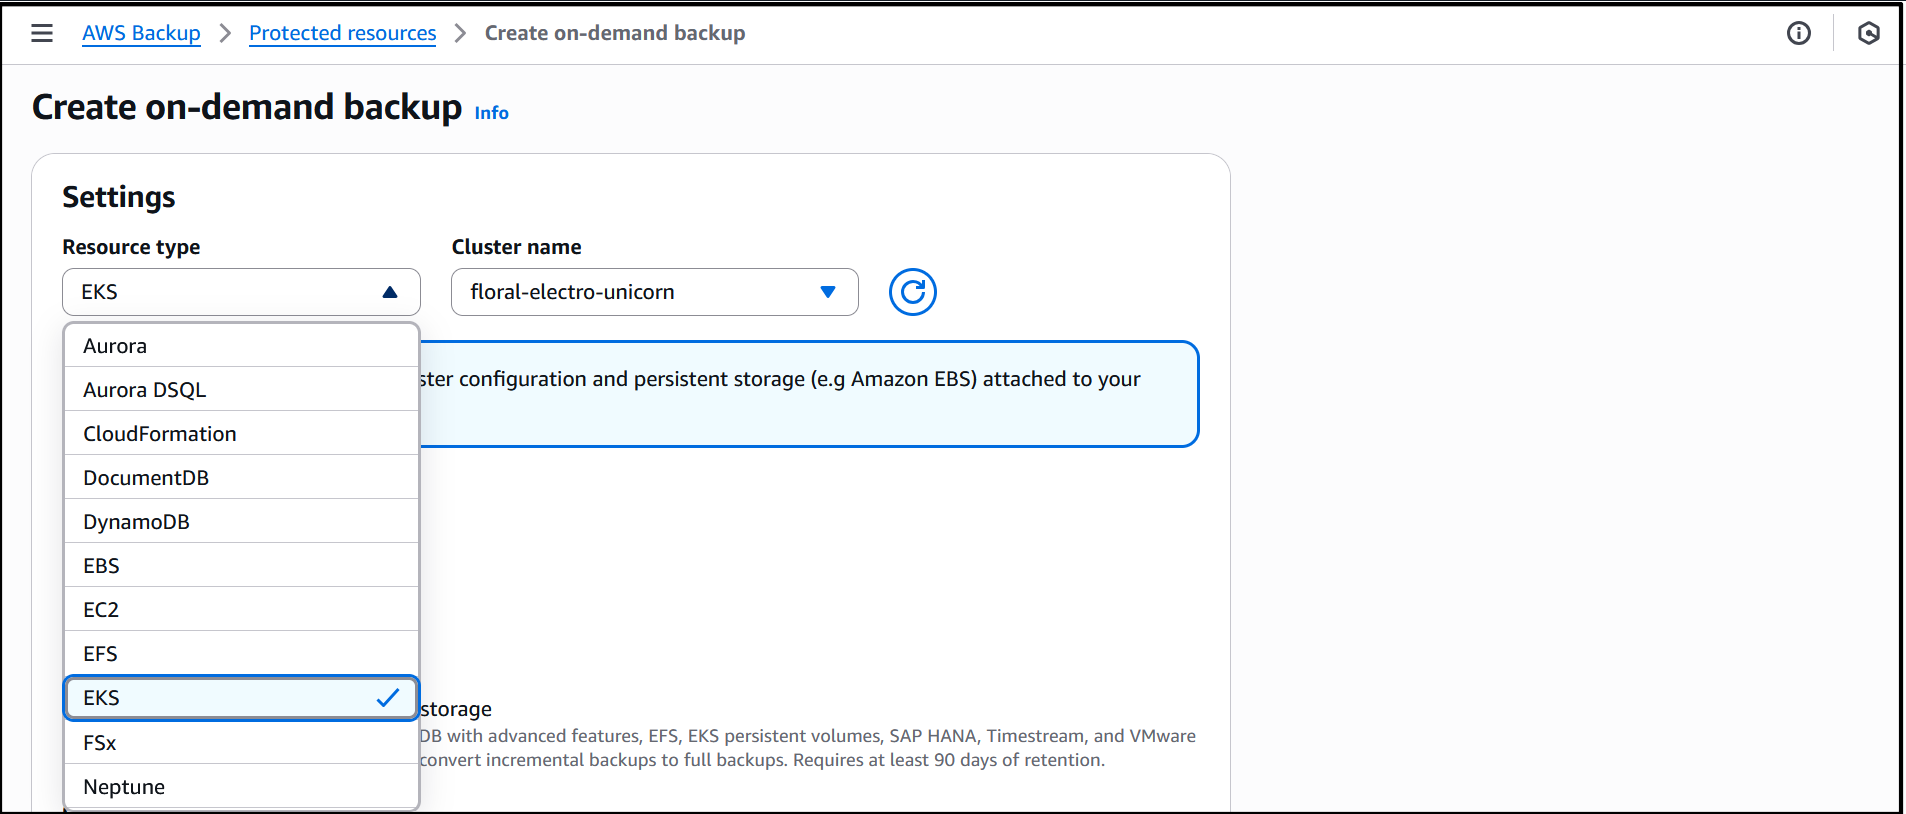
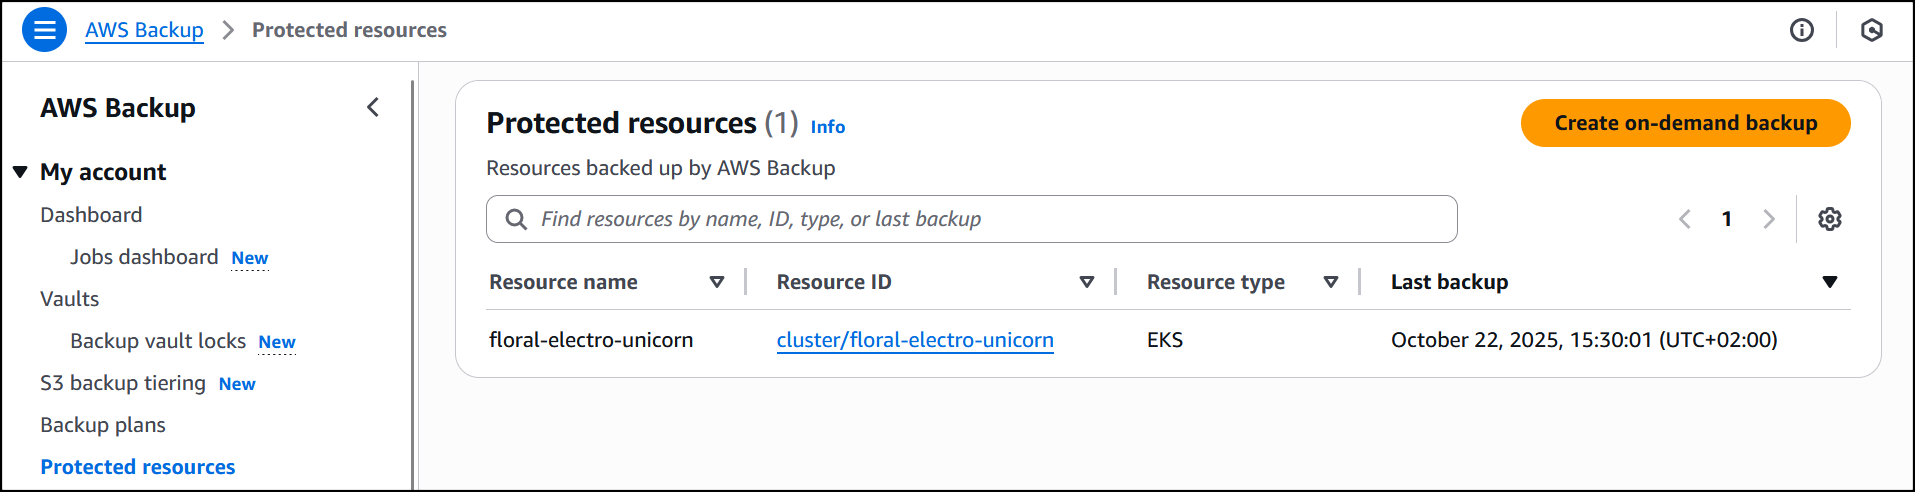
Now that I’ve enabled Amazon EKS, in Protected resources I choose Create on-demand backup to create a backup for my already existing EKS cluster floral-electro-unicorn.

Enabling EKS in Settings ensures that it shows up as a Resource type when I create on-demand backup for the EKS cluster. I proceed to select the EKS resource type and the cluster.

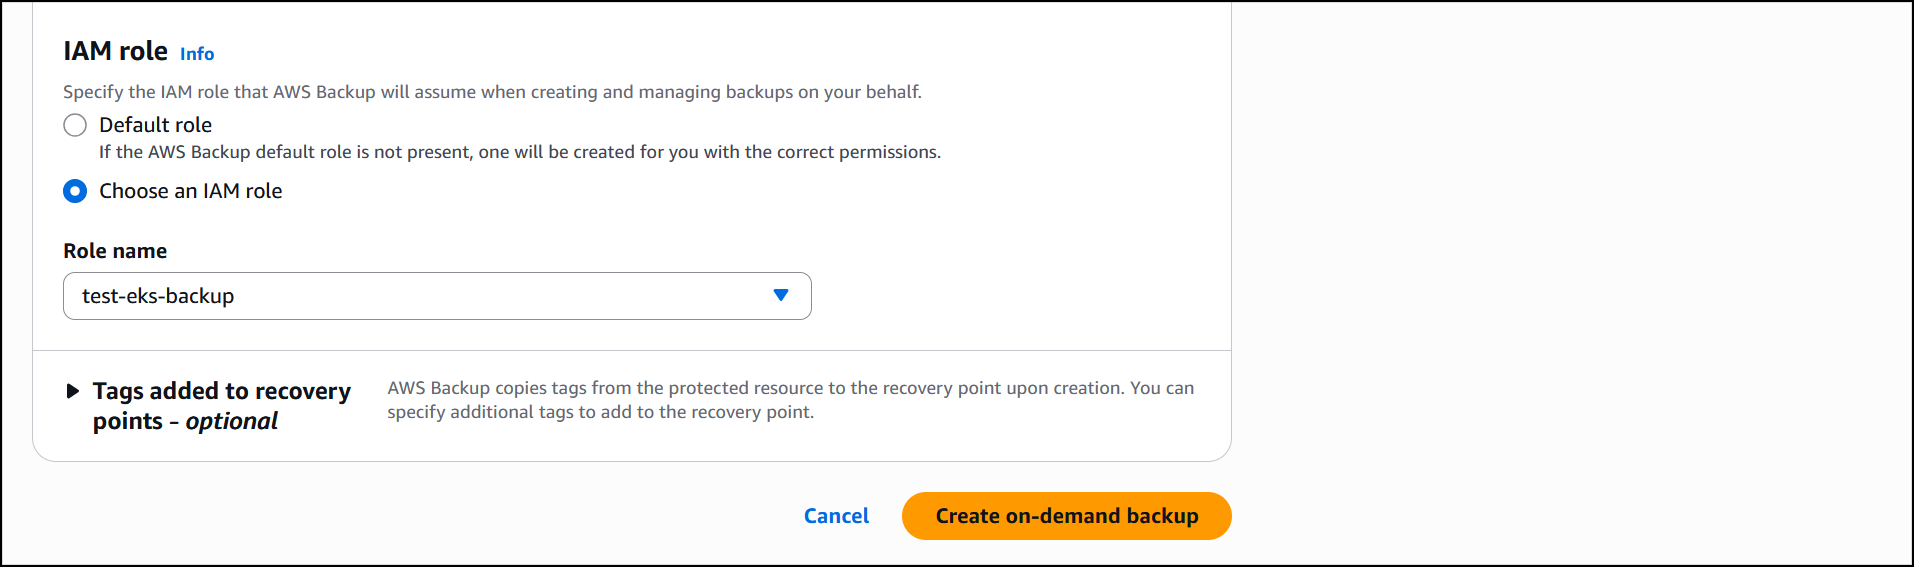
I leave the rest of the information as default, then select Choose an IAM role to select a role (test-eks-backup) that I’ve created and customized with the necessary permissions for AWS Backup to assume when creating and managing backups on my behalf. I choose Create on-demand backup to finalize the process.


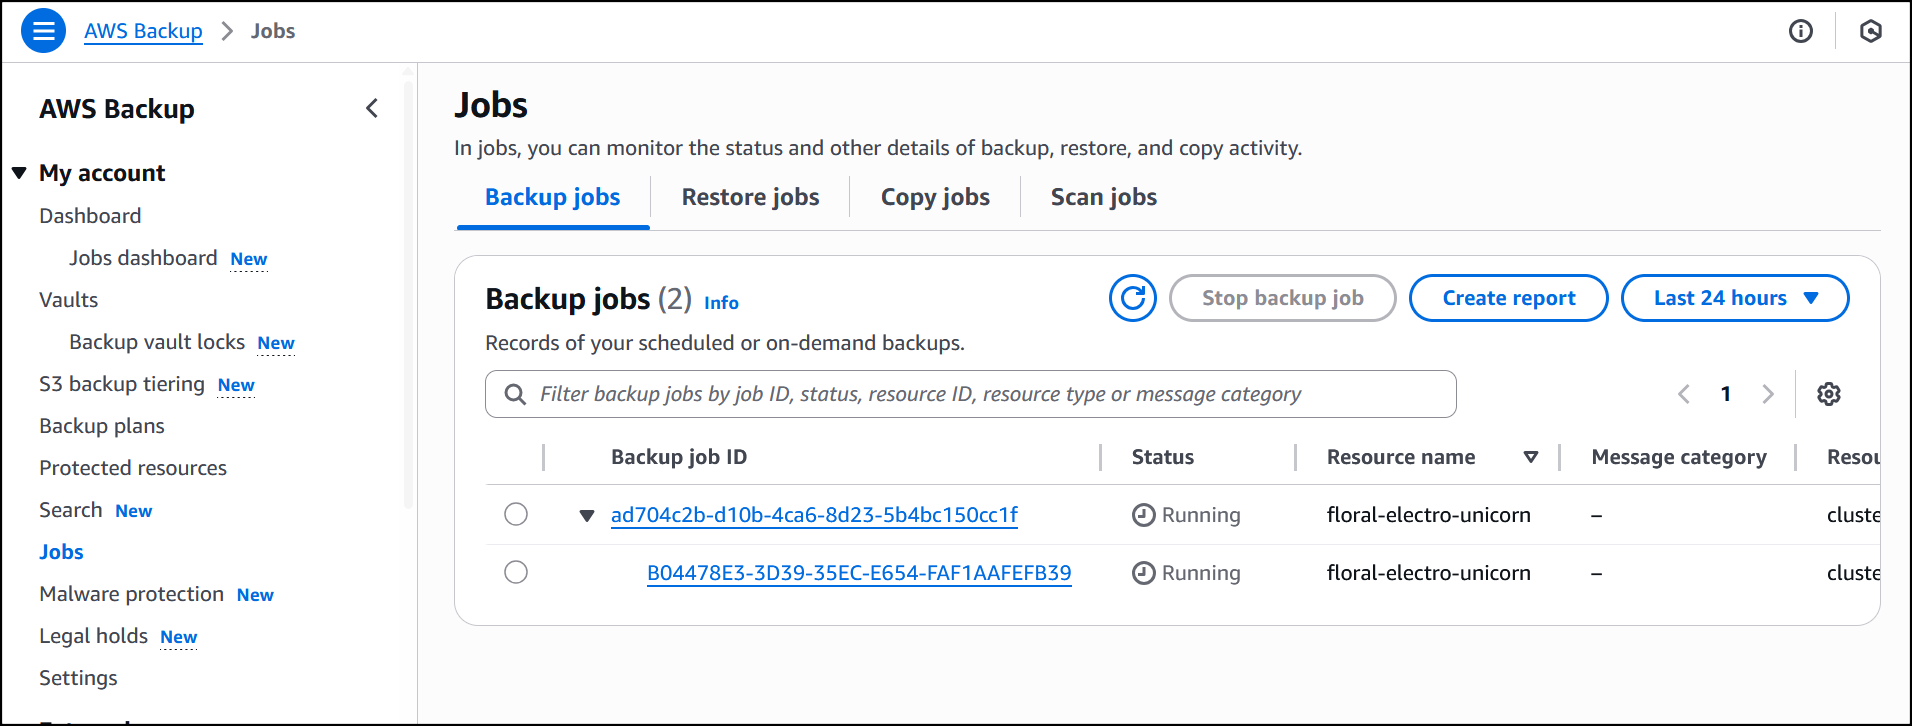
The job is initiated, and it will start running to back up both the EKS cluster state and the persistent volumes. If Amazon S3 buckets are attached to the backup, you’ll need to add the additional Amazon S3 backup permissions AWSBackupServiceRolePolicyForS3Backup to your role. This policy contains the permissions necessary for AWS Backup to back up any Amazon S3 bucket, including access to all objects in a bucket and any associated AWS KMS key.


The job is completed successfully and now EKS clusterfloral-electro-unicorn is backed up by AWS Backup.


Restore
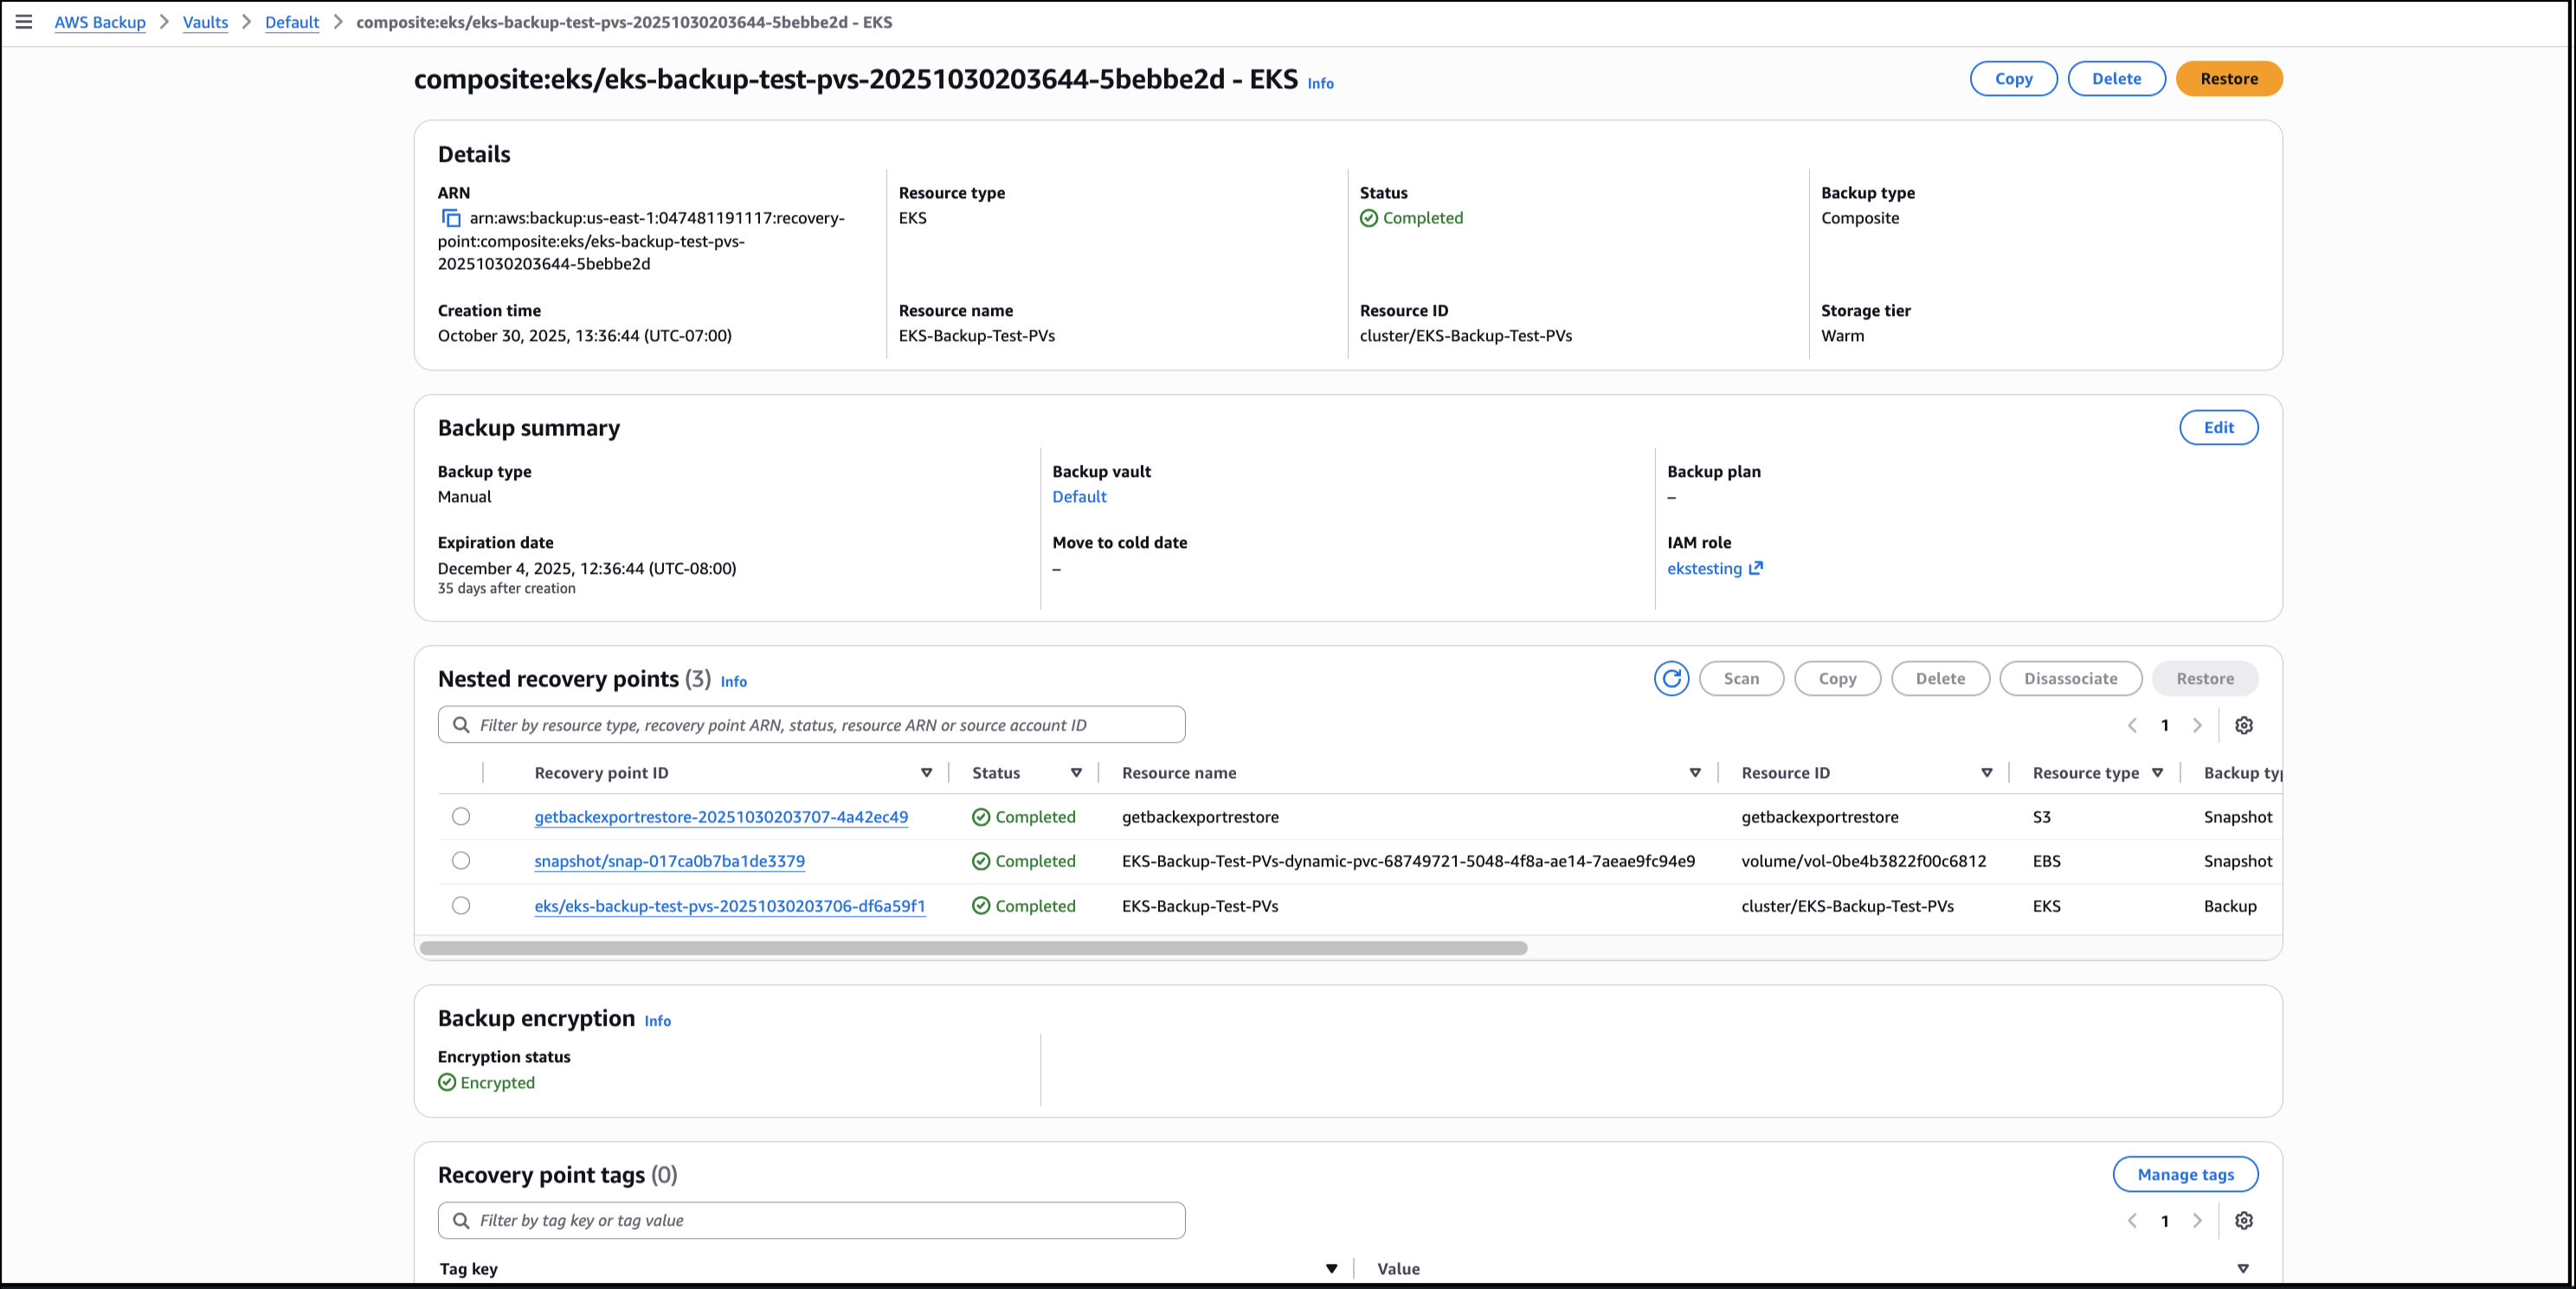
Using the AWS Backup Console, I choose the EKS backup composite recovery point to start the process of restoring the EKS cluster backups, then choose Restore.


I choose Restore full EKS cluster to restore the full EKS backup. To restore to an existing cluster, I Choose an existing cluster then select the cluster from the drop-down list. I choose the Default order as the order in which individual Kubernetes resources will be restored.

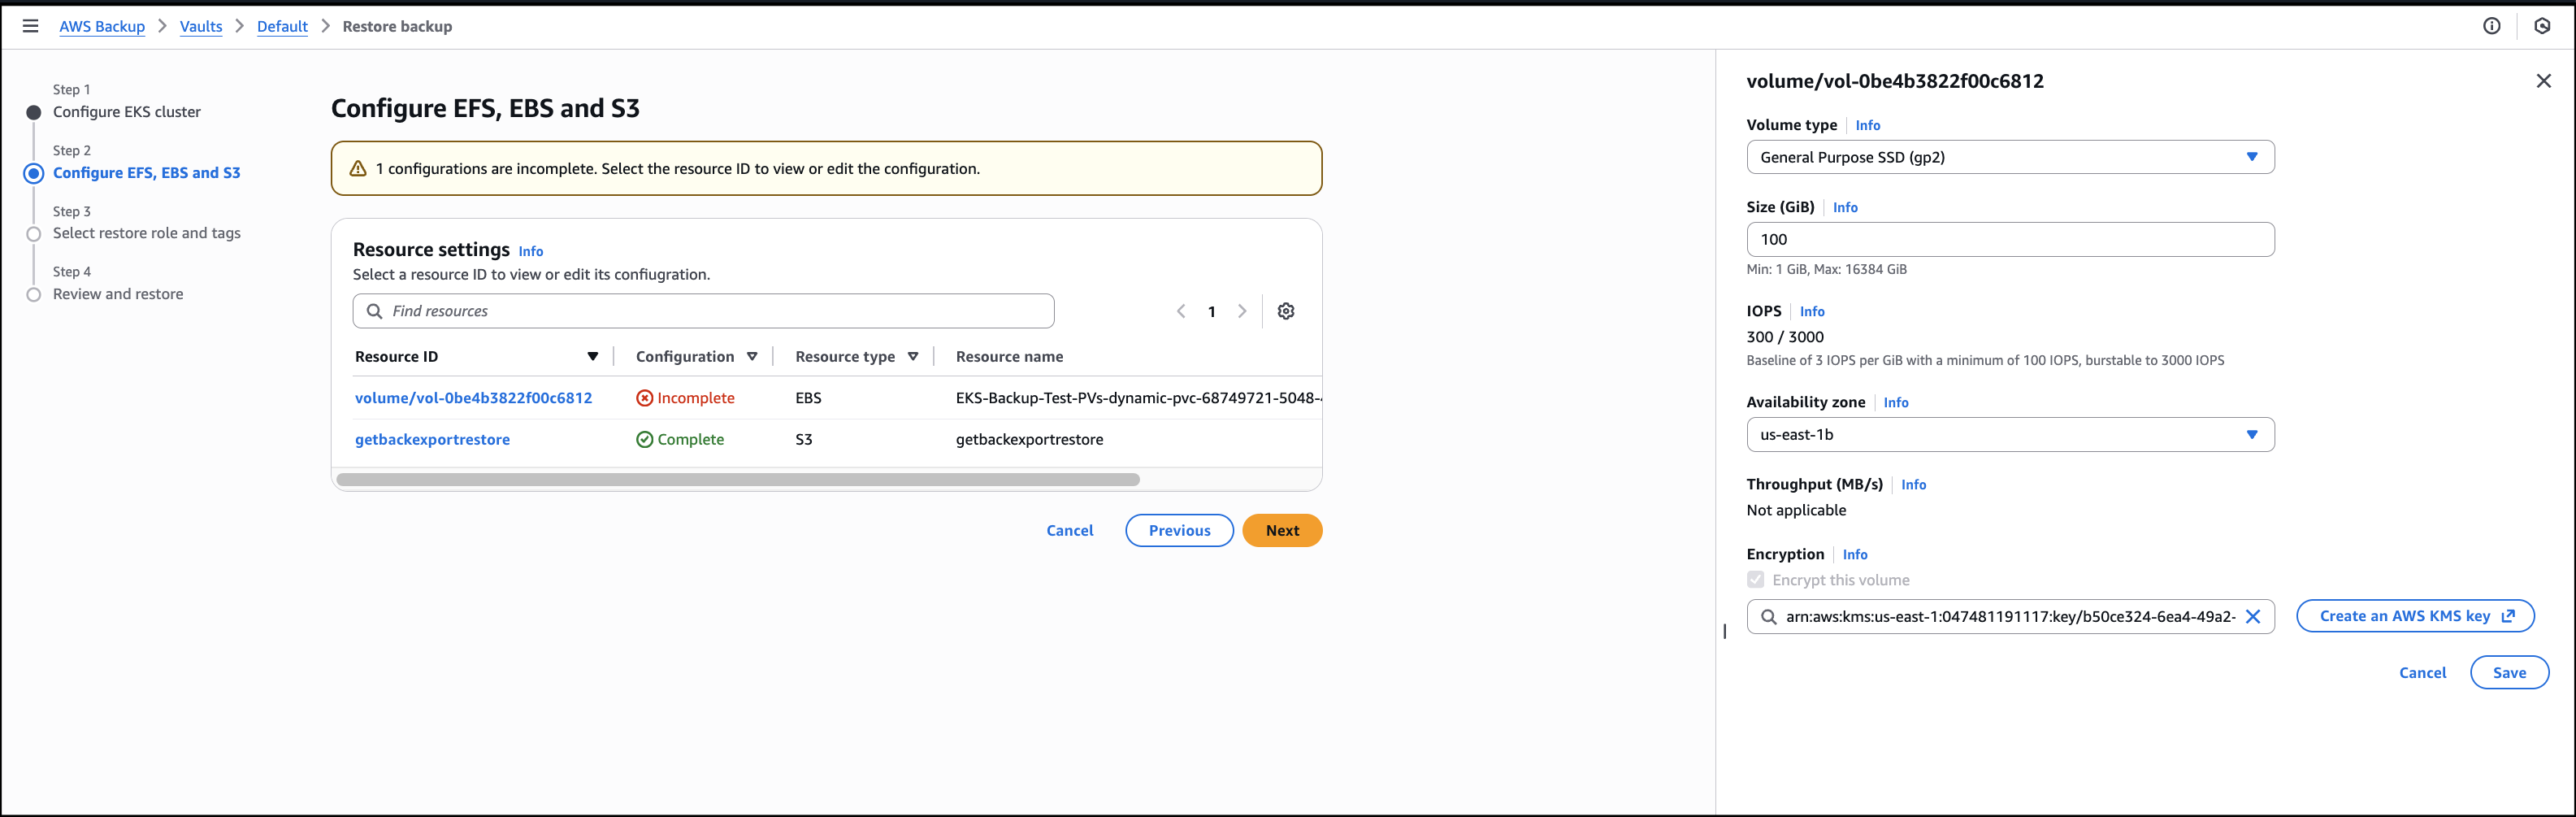
I then configure the restore for the persistent storage resources, that will be restored alongside my EKS clusters.


Next, I Choose an IAM role to execute the restore action. The Protected resource tags checkbox is selected by default and I’ll leave it as is, then choose Next.

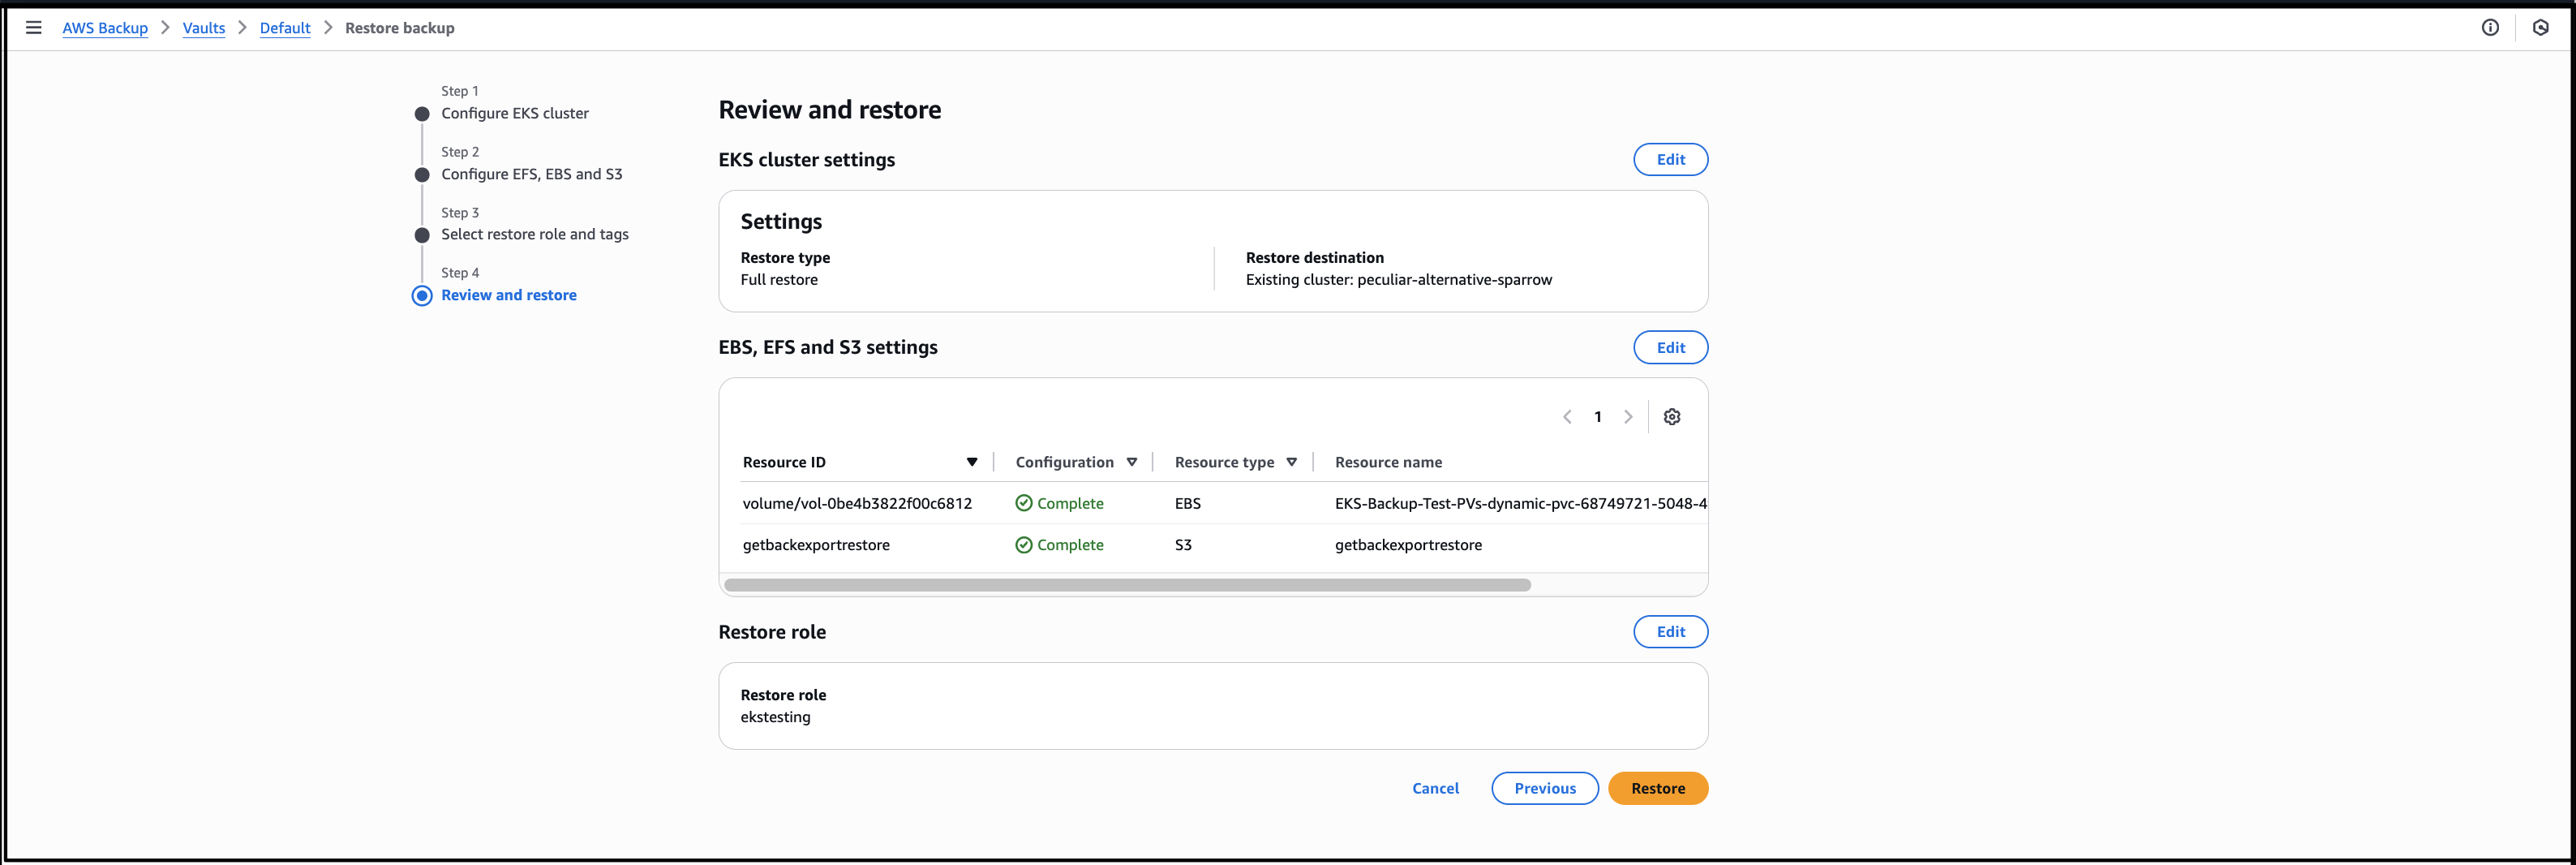
I review all the information before I finalize the process by choosing Restore, to start the job.


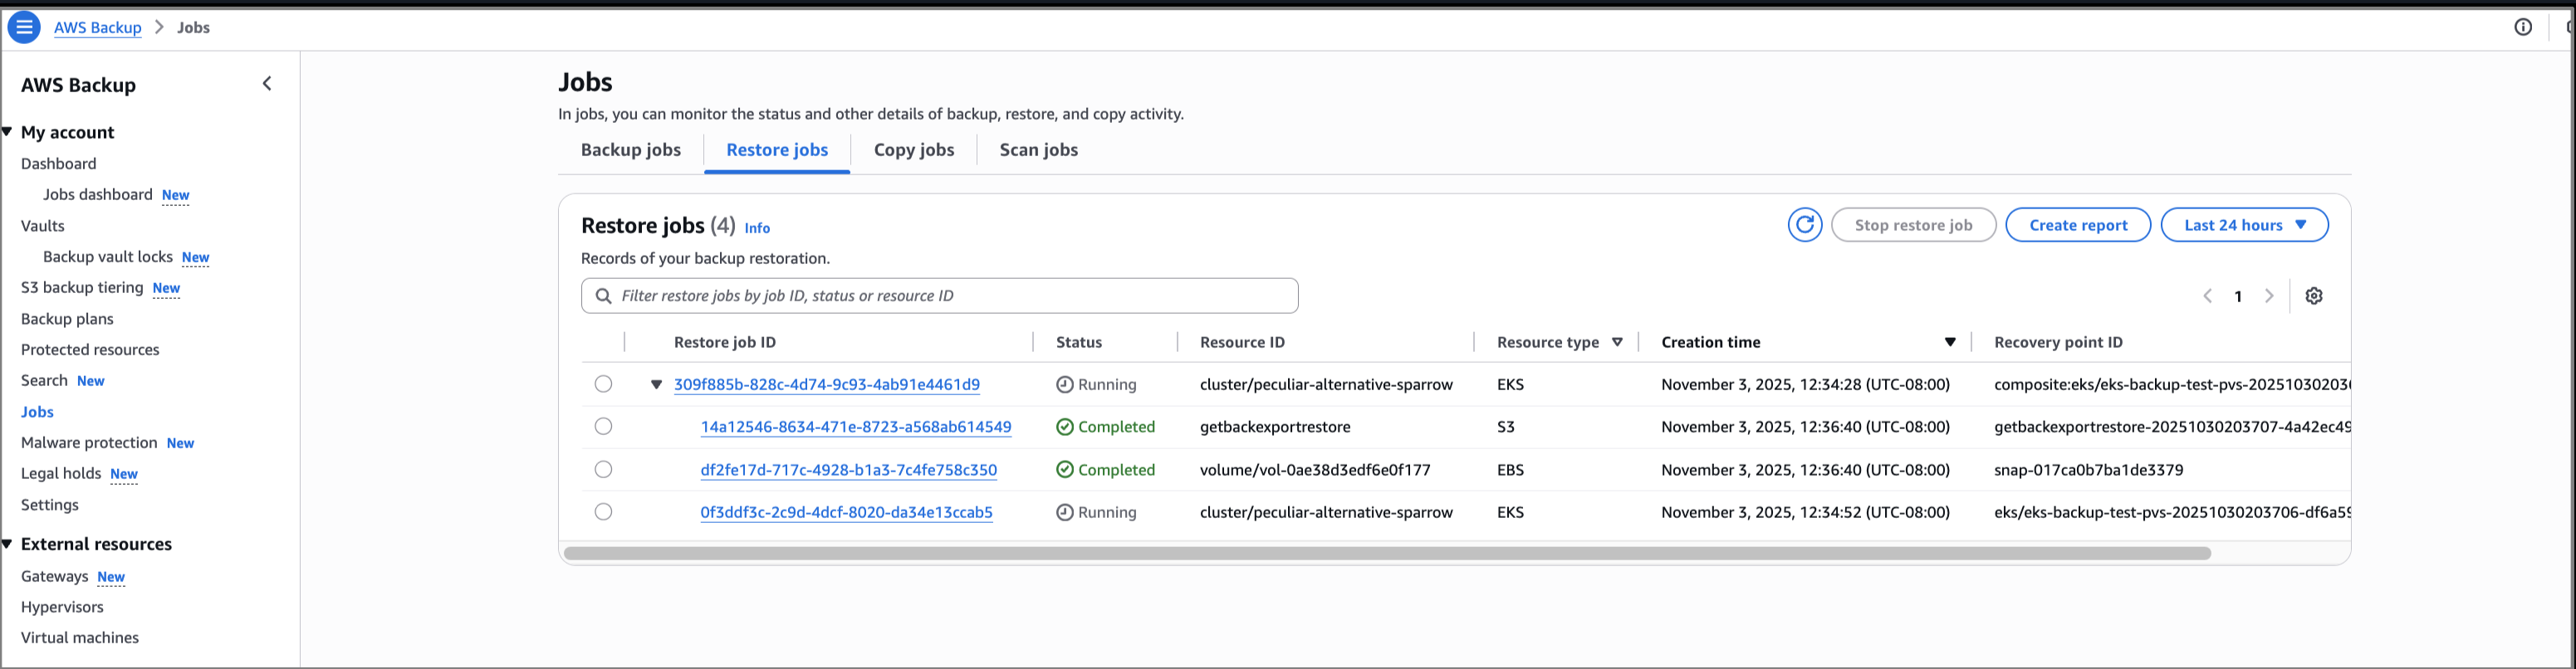
Selecting the drop-down arrow gives details of the restore status for both the EKS cluster state and persistent volumes attached. In this walkthrough, all the individual recovery points are restored successfully. If portions of the backup fail, it’s possible to restore the successfully backed up persistent stores (for example, Amazon EBS volumes) and cluster configuration settings individually. However, it’s not possible to restore full EKS backup. The successfully backed up resources will be available for restore, listed as nested recovery points under the EKS cluster recovery point. If there’s a partial failure, there will be a notification of the portion(s) that failed.


Benefits
Here are some of the benefits provided by the support for Amazon EKS in AWS Backup:

  • A fully managed multi-cluster backup experience, removing the overhead associated with managing custom scripts and third-party solutions.
  • Centralized, policy-based backup management that simplifies backup lifecycle management and makes it seamless to back up and recover your application data across AWS services, including EKS.
  • The ability to store and organize your backups with backup vaults. You assign policies to the backup vaults to grant access to users to create backup plans and on-demand backups but limit their ability to delete recovery points after they’re created.

Good to know
The following are some helpful facts to know:

  • Use either the AWS Backup Console, API, or AWS Command Line Interface (AWS CLI) to protect EKS clusters using AWS Backup. Alternatively, you can create an on-demand backup of the cluster after it has been created.
  • You can create secondary copies of your EKS backups across different accounts and AWS Regions to minimize risk of accidental deletion.
  • Restoration of EKS backups is available using the AWS Backup Console, API, or AWS CLI.
  • Restoring to an existing cluster will not override the Kubernetes versions, or any data as restores are non-destructive. Instead, there will be a restore of the delta between the backup and source resource.
  • Namespaces can only be restored to an existing cluster to ensure a successful restore as Kubernetes resources may be scoped at the cluster level.

Voice of the customer

Srikanth Rajan, Sr. Director of Engineering at Salesforce said “Losing a Kubernetes control plane because of software bugs or unintended cluster deletion can be catastrophic without a solid backup and restore plan. That’s why it’s exciting to see AWS rolling out the new EKS Backup and Restore feature, it’s a big step forward in closing a critical resiliency gap for Kubernetes platforms.”

Now available
Support for Amazon EKS in AWS Backup is available today in all AWS commercial Regions (except China) and in the AWS GovCloud (US) where AWS Backup and Amazon EKS are available. Check the full Region list for future updates.

To learn more, check out the AWS Backup product page and the AWS Backup pricing page.

Try out this capability for protecting your EKS clusters in AWS Backup and let us know what you think by sending feedback to AWS re:Post for AWS Backup or through your usual AWS Support contacts.

– Veliswa.

The Minisforum MS-R1 12-core Arm 10GbE Mini Workstation is

Post Syndicated from Patrick Kennedy original https://www.servethehome.com/the-minisforum-ms-r1-12-core-arm-10gbe-mini-workstation-is/

We take a look at the new Minisform MS-R1, an Arm-based homelab focused 10Gbase-T system with expansion, and some teething challenges

The post The Minisforum MS-R1 12-core Arm 10GbE Mini Workstation is appeared first on ServeTheHome.

2025 H1 IRAP report is now available on AWS Artifact for Australian customers

Post Syndicated from Patrick Chang original https://aws.amazon.com/blogs/security/2025-h1-irap-report-is-now-available-on-aws-artifact-for-australian-customers/

Amazon Web Services (AWS) is excited to announce that the latest version of Information Security Registered Assessors Program (IRAP) report (2025 H1) is now available through AWS Artifact. An independent Australian Signals Directorate (ASD) certified IRAP assessor completed the IRAP assessment of AWS in September 2025.

The new IRAP report includes four additional AWS services that are now assessed at the PROTECTED level under IRAP. This brings the total number of services assessed at the PROTECTED level to 168.

The four newly assessed services are:

For the full list of services, see the IRAP tab on the AWS Services in Scope by Compliance Program page.

We have developed an IRAP documentation pack to help our Australian customers and their partners plan, architect, and assess risk for their workloads when they use AWS Cloud services.

We developed this pack in accordance with the Australian Cyber Security Centre (ACSC) Cloud Security Guidance and Cloud Assessment and Authorisation framework, which addresses guidance within the Australian Government’s Information Security Manual (ISM, March 2025 version), the Department of Home Affairs’ Protective Security Policy Framework (PSPF), and the Digital Transformation Agency’s Secure Cloud Strategy.

The IRAP pack on AWS Artifact also includes newly updated versions of the AWS Consumer Guide and the whitepaper Reference Architectures for ISM PROTECTED Workloads in the AWS Cloud.

Reach out to your AWS representatives to let us know which additional services you would like to see in scope for upcoming IRAP assessments. We strive to bring more services into scope at the PROTECTED level under IRAP to support your requirements.


If you have feedback about this post, submit comments in the Comments section below.

Patrick Chang

Patrick Chang

Patrick is the APJ Audit Lead based in Sydney. He leads security audits, certifications, and compliance programs across the APJ region. Patrick is a technology risk and audit professional with over a decade of experience and is passionate about delivering assurance programs that build trust with customers and provide them assurance on cloud security.

AWS Weekly Roundup: Amazon S3, Amazon EC2, and more (November 10, 2025)

Post Syndicated from Esra Kayabali original https://aws.amazon.com/blogs/aws/aws-weekly-roundup-amazon-s3-amazon-ec2-and-more-november-10-2025/

AWS re:Invent 2025 is only 3 weeks away and I’m already looking forward to the new launches and announcements at the conference. Last year brought 60,000 attendees from across the globe to Las Vegas, Nevada, and the atmosphere was amazing. Registration is still open for AWS re:Invent 2025. We hope you’ll join us in Las Vegas December 1–5 for keynotes, breakout sessions, chalk talks, interactive learning opportunities, and networking with cloud practitioners from around the world.

AWS and OpenAI announced a multi-year strategic partnership that provides OpenAI with immediate access to AWS infrastructure for running advanced AI workloads. The $38 billion agreement spans 7 years and includes access to AWS compute resources comprising hundreds of thousands of NVIDIA GPUs, with the ability to scale to tens of millions of CPUs for agentic workloads. The infrastructure deployment that AWS is building for OpenAI features a sophisticated architectural design optimized for maximum AI processing efficiency and performance. Clustering the NVIDIA GPUs—both GB200s and GB300s—using Amazon EC2 UltraServers on the same network enables low-latency performance across interconnected systems, allowing OpenAI to efficiently run workloads with optimal performance. The clusters are designed to support various workloads, from serving inference for ChatGPT to training next generation models, with the flexibility to adapt to OpenAI’s evolving needs.

AWS committed $1 million through its Generative AI Innovation Fund to digitize the Jane Goodall Institute’s 65 years of primate research archives. The project will transform handwritten field notes, film footage, and observational data on chimpanzees and baboons from analog to digital formats using Amazon Bedrock and Amazon SageMaker. The digital transformation will employ multimodal large language models (LLMs) and embedding models to make the research archives searchable and accessible to scientists worldwide for the first time. AWS is collaborating with Ode to build the user experience, helping the Jane Goodall Institute adopt AI technologies to advance research and conservation efforts. I was deeply saddened when I heard that world-renowned primatologist Jane Goodall had passed away. Learning that this project will preserve her life’s work and make it accessible to researchers around the world brought me comfort. It’s a fitting tribute to her remarkable legacy.

Transforming decades of research through cloud and AI. Dr. Jane Goodall and field staff observe Goblin at Gombe National Park, Tanzania. CREDIT: the Jane Goodall Institute

Last week’s launches
Let’s look at last week’s new announcements:

  • Amazon S3 now supports tags on S3 Tables – Amazon S3 now supports tags on S3 Tables for attribute-based access control (ABAC) and cost allocation. You can use tags for ABAC to automatically manage permissions for users and roles accessing table buckets and tables, eliminating frequent AWS Identity and Access Management (IAM) or S3 Tables resource-based policy updates and simplifying access governance at scale. Additionally, tags can be added to individual tables to track and organize AWS costs using AWS Billing and Cost Management.
  • Amazon EC2 R8a Memory-Optimized Instances now generally available – R8a instances feature 5th Gen AMD EPYC processors (formerly code named Turin) with a maximum frequency of 4.5 GHz, and they deliver up to 30% higher performance and up to 19% better price-performance compared to R7a instances, with 45% more memory bandwidth. Built on the AWS Nitro System using sixth-generation Nitro Cards, these instances are designed for high-performance, memory-intensive workloads, including SQL and NoSQL databases, distributed web scale in-memory caches, in-memory databases, real-time big data analytics, and electronic design automation (EDA) applications. R8a instances are SAP certified and offer 12 sizes, including two bare metal sizes.
  • EC2 Auto Scaling announces warm pool support for mixed instances policies – EC2 Auto Scaling groups now support warm pools for Auto Scaling groups configured with mixed instances policies. Warm pools create a pool of pre-initialized EC2 instances ready to quickly serve application traffic, improving application elasticity. The feature benefits applications with lengthy initialization processes, such as writing large amounts of data to disk or running complex custom scripts. By combining warm pools with instance type flexibility, Auto Scaling groups can rapidly scale out to maximum size while deploying applications across multiple instance types to enhance availability. The feature works with Auto Scaling groups configured for multiple On-Demand Instance types through manual instance type lists or attribute-based instance type selection.
  • Amazon Bedrock AgentCore Runtime now supports direct code deployment – Amazon Bedrock AgentCore Runtime now offers two deployment methods for AI agents: container-based deployment and direct code upload. You can choose between direct code–zip file upload for rapid prototyping and iteration or container-based options for complex use cases requiring custom configurations. AgentCore Runtime provides a serverless framework and model agnostic runtime for running agents and tools at scale. The direct code–zip upload feature includes drag-and-drop functionality, enabling faster iteration cycles for prototyping while maintaining enterprise security and scaling capabilities for production deployments.
  • AWS Capabilities by Region now available for Regional planning – AWS Capabilities by Region helps discover and compare AWS services, features, APIs, and AWS CloudFormation resources across Regions. This planning tool provides an interactive interface to explore service availability, compare multiple Regions side by side, and view forward-looking roadmap information. You can search for specific services or features, view API operations availability, verify CloudFormation resource type support, and check EC2 instance type availability including specialized instances. The tool displays availability states including Available, Planning, Not Expanding, and directional launch planning by quarter. The AWS Capabilities by Region data is also accessible through the AWS Knowledge MCP server, enabling automation of Region expansion planning and integration into development workflows and continuous integration and continuous delivery (CI/CD) pipelines.

Upcoming AWS events
Check your calendar and sign up for upcoming AWS events:

  • AWS re:Invent 2025 – Join us in Las Vegas December 1–5 as cloud pioneers gather from across the globe for the latest AWS innovations, peer-to-peer learning, expert-led discussions, and invaluable networking opportunities. Don’t forget to explore the event catalog.
  • AWS Builder Loft – A tech hub in San Francisco where builders share ideas, learn, and collaborate. The space offers industry expert sessions, hands-on workshops, and community events covering topics from AI to emerging technologies. Browse the upcoming sessions and join the events that interest you.
  • AWS Skills Center Seattle 4th Anniversary Celebration – A free, public event on November 20 with a keynote, learning panels, recruiter insights, raffles, and virtual participation options.

Join the AWS Builder Center to connect with builders, share solutions, and access content that supports your development. Browse here for upcoming AWS led in-person and virtual events, developer-focused events, and events for startups.

That’s all for this week. Check back next Monday for another Weekly Roundup!

— Esra

This post is part of our Weekly Roundup series. Check back each week for a quick roundup of interesting news and announcements from AWS!

Public-inbox 2.0.0 released

Post Syndicated from corbet original https://lwn.net/Articles/1045965/

Version 2.0.0 of public-inbox, the mail archiving system behind
lore.kernel.org and LWN’s email archive, has been released. “This
release includes several new features and fixes; mostly around improved
integration between inboxes and coderepos for solver. Portability and
reliability is also improved, especially in the internal process management
of lei.
”

[$] Magic kernel functions for BPF

Post Syndicated from daroc original https://lwn.net/Articles/1044824/

When programs written in BPF (the kernel’s hot-loadable virtual-machine
bytecode) call kernel functions (kfuncs), it may be useful
for those functions to have additional information about the context in which
those BPF programs are executing. Rather than requiring it to supply
that information, it would be convenient to let the BPF verifier pass that
information to the called function automatically. That is already possible, but

a recent patch set
from Ihor Solodrai would make it more ergonomic.
It allows kernel
developers to specify that a kfunc should be passed additional
parameters inferred by the verifier, invisibly to the BPF program. The
discussion included concerns that Solodrai’s implementation was unnecessarily
complex, however.

Security updates for Monday

Post Syndicated from jzb original https://lwn.net/Articles/1045922/

Security updates have been issued by AlmaLinux (galera and mariadb, kernel, kernel-rt, mingw-libtiff, redis:7, tigervnc, and xorg-x11-server-Xwayland), Fedora (bind, bind-dyndb-ldap, bpfman, chromium, dolphin-emu, dotnet9.0, golang-github-openprinting-ipp-usb, kea, libnbd, luksmeta, python-cloudpickle, python-pydantic, python-pydantic-core, python-uv-build, ruby, ruff, rust-get-size-derive2, rust-get-size2, rust-regex, rust-regex-automata, rust-reqsign, rust-reqsign-aws-v4, rust-reqsign-command-execute-tokio, rust-reqsign-core, rust-reqsign-file-read-tokio, rust-reqsign-http-send-reqwest, singularity-ce, uv, xen, and xorg-x11-server-Xwayland), Mageia (libxml2, libxslt, opencontainers-runc, and xen), Oracle (bind, galera and mariadb, libsoup, linux-firmware, mariadb:10.5, mingw-libtiff, osbuild-composer, qt5-qt3d, tigervnc, and xorg-x11-server-Xwayland), SUSE (chromium, erlang, google-osconfig-agent, govulncheck-vulndb, java-11-openjdk, java-17-openjdk, java-1_8_0-openj9, opentofu, python-djangorestframework-simplejwt, python311-Django, python315, squid, thunderbird, tiff, tomcat, tomcat11, and xen), and Ubuntu (linux-fips, linux-hwe-6.14, and linux-nvidia-tegra, linux-nvidia-tegra-5.15, linux-nvidia-tegra-igx,
linux-raspi).

Protecting What Powers Business: Rapid7 and Microsoft Partner to Simplify Security

Post Syndicated from Rapid7 original https://www.rapid7.com/blog/post/pt-rapid7-partner-mdr-for-microsoft

Across industries, Microsoft is everywhere. It powers productivity, collaboration, and security through Defender, Sentinel, Entra, and the broader Microsoft ecosystem that underpins how modern organizations operate.

⠀

As organizations deepen their Microsoft investments, there’s an even greater opportunity to strengthen and simplify threat detection and response. Microsoft delivers powerful visibility and security insights across user identities, endpoints, and cloud workloads, but security teams often need help bringing those capabilities together with the rest of their environment to ensure that data, detections, and decisions that drive their threat detection and response program align seamlessly. 

⠀

That’s where Rapid7 comes in.

⠀

A shared vision for simplified, unified security

We’re excited to announce the launch of an expanded partnership between Rapid7 and Microsoft, focused on helping organizations fully realize the potential of their Microsoft security investments. Together, we’re building a unified approach to threat detection and response that combines Microsoft’s ecosystem and scale with Rapid7’s AI-native security operations platform and decades of SOC expertise.

⠀

Our shared goal: help customers protect their businesses with clarity, speed, and confidence.

⠀

For many organizations, Microsoft is the backbone of their IT and security programs. But it’s only one part of a larger, interconnected environment. Security leaders need a way to bring Microsoft Defender, Sentinel, and Entra data into context with the rest of their infrastructure, cloud, and SaaS investments. Rapid7 helps make that possible by connecting Microsoft’s advanced telemetry and analytics with broader visibility and context into all security data, automation, and 24/7 expert-led managed operations.

⠀

We’ve long incorporated deep Microsoft visibility across the Command Platform, integrating with tools across different use cases, such as attack surface management, exposure management, cloud security, and application security. This foundation already allows us to correlate insights across on-premises and cloud environments, including Active Directory, Azure, and Microsoft 365 – providing outcomes across endpoints, workloads, and applications. These capabilities unify context from more than a dozen different Microsoft and Azure tools, giving customers a complete picture of risk across their environment. 

⠀

This partnership combines Microsoft Defender’s signal depth with Rapid7’s threat intelligence, automation, and human-led operations to deliver complete visibility and coordinated response across your environment – from Microsoft to everything it touches.

⠀

This means:

  • Unified security operations managed for you: Rapid7 delivers 24×7 monitoring, investigation, and response across Microsoft and non-Microsoft environments, combining Defender insights with our own detection and response workflows to act quickly on what matters most.

  • Faster, smarter response: AI-driven correlation and human-led expertise reduce alert noise and accelerate containment when threats arise.

  • Simplified, predictable operations: Our managed detection and response (MDR) service removes ingestion complexity so you can focus on security outcomes.

  • Transparency and trust: Built in through seamless integration with the Microsoft consoles security teams already use.

⠀

A foundation for what’s next

Over the coming months, we’ll introduce new capabilities that make it easier for customers to operationalize Microsoft security within the Rapid7 ecosystem, including unified MDR coverage across the Defender products that protect the key vectors of endpoint, identity, cloud, and email.

⠀

These enhancements will enable organizations to not only respond to Microsoft-based threats faster but also proactively reduce risk across their entire environment through unified detection, investigation, and response.

⠀

We’re excited for this next step in advancing our MDR services to meet Microsoft customers where they are and maximize their investments with comprehensive visibility, faster response, and measurable security outcomes.

⠀

We’ll be releasing more information soon. In the meantime, learn more about Rapid7’s leading MDR service here.

A closer look at Python Workflows, now in beta

Post Syndicated from Caio Nogueira original https://blog.cloudflare.com/python-workflows/

Developers can already use Cloudflare Workflows to build long-running, multi-step applications on Workers. Now, Python Workflows are here, meaning you can use your language of choice to orchestrate multi-step applications.

With Workflows, you can automate a sequence of idempotent steps in your application with built-in error handling and retry behavior. But Workflows were originally supported only in TypeScript. Since Python is the de facto language of choice for data pipelines, artificial intelligence/machine learning, and task automation – all of which heavily rely on orchestration – this created friction for many developers.

Over the years, we’ve been giving developers the tools to build these applications in Python, on Cloudflare. In 2020, we brought Python to Workers via Transcrypt before directly integrating Python into workerd in 2024. Earlier this year, we built support for CPython along with any packages built in Pyodide, like matplotlib and pandas, in Workers. Now, Python Workflows are supported as well, so developers can create robust applications using the language they know best.

Why Python for Workflows?

Imagine you’re training an LLM. You need to label the dataset, feed data, wait for the model to run, evaluate the loss, adjust the model, and repeat. Without automation, you’d need to start each step, monitor manually until completion, and then start the next one. Instead, you could use a workflow to orchestrate the training of the model, triggering each step pending the completion of its predecessor. For any manual adjustments needed, like evaluating the loss and adjusting the model accordingly, you can implement a step that notifies you and waits for the necessary input.

Consider data pipelines, which are a top Python use case for ingesting and processing data. By automating the data pipeline through a defined set of idempotent steps, developers can deploy a workflow that handles the entire data pipeline for them.

Take another example: building AI agents, such as an agent to manage your groceries. Each week, you input your list of recipes, and the agent (1) compiles the list of necessary ingredients, (2) checks what ingredients you have left over from previous weeks, and (3) orders the differential for pickup from your local grocery store. Using a Workflow, this could look like:

  1. await step.wait_for_event() the user inputs the grocery list

  2. step.do() compile list of necessary ingredients

  3. step.do() check list of necessary ingredients against left over ingredients

  4. step.do() make an API call to place the order

  5. step.do() proceed with payment

Using workflows as a tool to build agents on Cloudflare can simplify agents’ architecture and improve their odds for reaching completion through individual step retries and state persistence. Support for Python Workflows means building agents with Python is easier than ever.

How Python Workflows work

Cloudflare Workflows uses the underlying infrastructure that we created for durable execution, while providing an idiomatic way for Python users to write their workflows. In addition, we aimed for complete feature parity between the Javascript and the Python SDK. This is possible because Cloudflare Workers support Python directly in the runtime itself. 

Creating a Python Workflow

Cloudflare Workflows are fully built on top of Workers and Durable Objects. Each element plays a part in storing Workflow metadata, and instance level information. For more detail on how the Workflows platform works, check out this blog post.

At the very bottom of the Workflows control plane sits the user Worker, which is the WorkflowEntrypoint. When the Workflow instance is ready to run, the Workflow engine will call into the run method of the user worker via RPC, which in this case will be a Python Worker.

This is an example skeleton for a Workflow declaration, provided by the official documentation:

export class MyWorkflow extends WorkflowEntrypoint<Env, Params> {
  async run(event: WorkflowEvent<Params>, step: WorkflowStep) {
    // Steps here
  }
}

The run method, as illustrated above, provides a WorkflowStep parameter that implements the durable execution APIs. This is what users rely on for at-most-once execution. These APIs are implemented in JavaScript and need to be accessed in the context of the Python Worker.

A WorkflowStep must cross the RPC barrier, meaning the engine (caller) exposes it as an RpcTarget. This setup allows the user’s Workflow (callee) to substitute the parameter with a stub. This stub then enables the use of durable execution APIs for Workflows by RPCing back to the engine. To read more about RPC serialization and how functions can be passed from caller and callee, read the Remote-Procedure call documentation.

All of this is true for both Python and JavaScript Workflows, since we don’t really change how the user Worker is called from the Workflows side. However, in the Python case, there is another barrier – language bridging between Python and the JavaScript module. When an RPC request targets a Python Worker, there is a Javascript entrypoint module responsible for proxying the request to be handled by the Python script, and then returned to the caller. This process typically involves type translation before and after handling the request.

Overcoming the language barrier

Python workers rely on Pyodide, which is a port of CPython to WebAssembly. Pyodide provides a foreign function interface (FFI) to JavaScript which allows for calling into JavaScript methods from Python. This is the mechanism that allows other bindings and Python packages to work within the Workers platform. Therefore, we use this FFI layer not only to allow using the Workflow binding directly, but also to provide WorkflowStep methods in Python. In other words, by considering that WorkflowEntrypoint is a special class for the runtime, the run method is manually wrapped so that WorkflowStep is exposed as a JsProxy instead of being type translated like other JavaScript objects. Moreover, by wrapping the APIs from the perspective of the user Worker, we allow ourselves to make some adjustments to the overall development experience, instead of simply exposing a JavaScript SDK to a different language with different semantics. 

Making the Python Workflows SDK Pythonic

A big part of porting Workflows to Python includes exposing an interface that Python users will be familiar with and have no problems using, similarly to what happens with our JavaScript APIs. Let’s take a step back and look at a snippet for a Workflow (written in Typescript) definition.

import { WorkflowEntrypoint, WorkflowStep, WorkflowEvent} from 'cloudflare:workers';
 
export class MyWorkflow extends WorkflowEntrypoint {
    async run(event: WorkflowEvent<YourEventType>, step: WorkflowStep) {
        let state = step.do("my first step", async () => {
          // Access your properties via event.payload
          let userEmail = event.payload.userEmail
          let createdTimestamp = event.payload.createdTimestamp
          return {"userEmail": userEmail, "createdTimestamp": createdTimestamp}
	    })
 
        step.sleep("my first sleep", "30 minutes");
 
        await step.waitForEvent<EventType>("receive example event", { type: "simple-event", timeout: "1 hour" })
 
   	 const developerWeek = Date.parse("22 Sept 2025 13:00:00 UTC");
        await step.sleepUntil("sleep until X times out", developerWeek)
    }
}

The Python implementation of the workflows API requires modification of the do method. Unlike other languages, Python does not easily support anonymous callbacks. This behavior is typically achieved through the use of decorators, which in this case allow us to intercept the method and expose it idiomatically. In other words, all parameters maintain their original order, with the decorated method serving as the callback.

The methods waitForEvent, sleep, and sleepUntil can retain their original signatures, as long as their names are converted to snake case.

Here’s the corresponding Python version for the same workflow, achieving similar behavior:

from workers import WorkflowEntrypoint
 
class MyWorkflow(WorkflowEntrypoint):
    async def run(self, event, step):
        @step.do("my first step")
        async def my_first_step():
            user_email = event["payload"]["userEmail"]
            created_timestamp = event["payload"]["createdTimestamp"]
            return {
                "userEmail": user_email,
                "createdTimestamp": created_timestamp,
            }
 
        await my_first_step()
 
        step.sleep("my first sleep", "30 minutes")
 
         await step.wait_for_event(
            "receive example event",
            "simple-event",
            timeout="1 hour",
        )
 
        developer_week = datetime(2024, 10, 24, 13, 0, 0, tzinfo=timezone.utc)
        await step.sleep_until("sleep until X times out", developer_week)

DAG Workflows

When designing Workflows, we’re often managing dependencies between steps even when some of these tasks can be handled concurrently. Even though we’re not thinking about it, many Workflows have a directed acyclic graph (DAG) execution flow. Concurrency is achievable in the first iteration of Python Workflows (i.e.: minimal port to Python Workers) because Pyodide captures Javascript thenables and proxies them into Python awaitables.

Consequently, asyncio.gather works as a counterpart to Promise.all. Although this is perfectly fine and ready to be used in the SDK, we also support a declarative approach.

One of the advantages of decorating the do method is that we can essentially provide further abstractions on the original API, and have them work on the entrypoint wrapper. Here’s an example of a Python API making use of the DAG capabilities introduced:

from workers import Response, WorkflowEntrypoint

class PythonWorkflowDAG(WorkflowEntrypoint):
    async def run(self, event, step):

        @step.do('dependency 1')
        async def dep_1():
            # does stuff
            print('executing dep1')

        @step.do('dependency 2')
        async def dep_2():
            # does stuff
            print('executing dep2')

        @step.do('demo do', depends=[dep_1, dep_2], concurrent=True)
        async def final_step(res1=None, res2=None):
            # does stuff
            print('something')

        await final_step()

This kind of approach makes the Workflow declaration much cleaner, leaving state management to the Workflows engine data plane, as well as the Python workers Workflow wrapper. Note that even though multiple steps can run with the same name, the engine will slightly modify the name of each step to ensure uniqueness. In Python Workflows, a dependency is considered resolved once the initial step involving it has been successfully completed.

Try it out

Check out writing Workers in Python and create your first Python Workflow today! If you have any feature requests or notice any bugs, share your feedback directly with the Cloudflare team by joining the Cloudflare Developers community on Discord.

Network Stats for Q3 2025: The Magnitude of AI Workflows

Post Syndicated from Brent Nowak original https://www.backblaze.com/blog/network-stats-for-q3-2025-the-magnitude-of-ai-workflows/

A textured background with the words Network Stats overlaid.

The way data moves is changing in the age of AI. As AI training, model tuning, and inferencing accelerate massive, unpredictable flows of data across clouds, our network telemetry here at Backblaze offers a real-world view into the AI data gravity shift: where data lives, how it moves, and what it takes to keep it accessible and affordable.

Over the past couple of years, we’ve shared Network Stats snapshots that shed light on how data moves across Backblaze’s storage cloud. This quarter, we’re taking that foundation further, and evolving this series into a full-fledged transparency report that stands alongside Drive Stats with regular quarterly reporting and stats you can analyze for yourself.

This report isn’t just about traffic patterns. It’s a look at how data movement is changing in the age of AI and what those shifts reveal about performance, cost, and resilience at scale. 

Tune in live for The Stats Lab webinar

Drive Stats was the beginning. Want to see the evolution? Check out the Backblaze Stats Lab webinar, bringing together content from all of our Stats articles. We’re going to chat about all things Backblaze and beyond—by the numbers.

Save My Seat

In this first report, we’re going to outline the fundamentals of our dataset, highlight standout examples for AI related traffic, and lay the foundation to start sharing our quarter-over-quarter metrics.

Dataset details 

Our internal tools allow us to capture network flow data, meaning transmission control protocol (TCP) conversations between parties on our network. Along with basic information such as who is talking and how many bits are being exchanged, we have the ability to record additional pieces of anonymized information like what country, what ISP, or if we’ve seen a particular IP address before. And for each of these metrics, we have numbers for the average, 95th percentile, and maximum values.

Let’s talk about the three elements that make up our dataset: time, values, and metadata.

1. Monthly time slices

For every month, for every region, and for each direction (egress and ingress), we are data warehousing the following metrics. We plan on either using month-by-month numbers, or rolling up into a quarterly value for Network Stats reports going forward.

Item Detail
Date range Every month
Location scope Every region (eg US-West, EU-Central)
Network traffic direction Ingress, egress

2. Metric values

For each monthly snapshot, we’re recording the following details in our data warehouse. Capturing the average, 95th weighted value, and the maximum allows us enough information to profile our traffic. 

The 95th value (discarding the highest 5% bursts) gives us a good profile for daily operations and the maximum helps profile bust traffic. 

The most interesting metrics that I’m excited to explore are the “bits per IP” values. This combination of “amount of traffic” transferred with “how many actors are involved” per network is a good proxy for what I’m calling the “magnitude” of the network flow. We’re exploring the first insight into this metric below in our chart section.

Defining the Network Stats Quarterly Data

Item Field(s) Detail
Name name
asn
Common name and BGP ASN of the network
Bits bits_avg
bits_95th
bits_max
Number of bits/second
Packets packets_avg
packets_95th
packets_max
Number of packets/second
Flows flow_avg
flow_95th
flow_max
Number of TCP flows
IPs ip_unique_avg
ip_unique_95th
ip_unique_max
Number of unique IP addresses
Bits per IP bits_ip_avg
bits_ip_95th
bits_ip_max
Number of bits per IP address
Protocol v4
v6
Amount of traffic using IPv4 vs IPv6

3. Additional metadata

One of the first custom additions to our dataset is a category field. This helps us define the BGP ASNs (Autonomous System Number), basically the organizations common name associated with a range of IP addresses, that we talk to and group them into categories such as neocloud, hyperscaler, CDN, or general ISP.

Additional Network Stats Metadata

Item Field Detail
category group The class of network carrying the traffic (Cloud, PNI, traditional Internet Transit, or Internal Backblaze-Backblaze)
category type The type of network receiving the traffic (Neocloud, Hosting/Compute provider, Hyperscaler, CDN, Regional ISP, more localised ISP, etc)

The global picture

We started capturing this dataset in August of 2025, so we don’t yet have a good amount of data to pull out quarter over quarter trends. But what we can do for now is take a look into some standout metrics for the month of August that we’re interested in tracking over time.

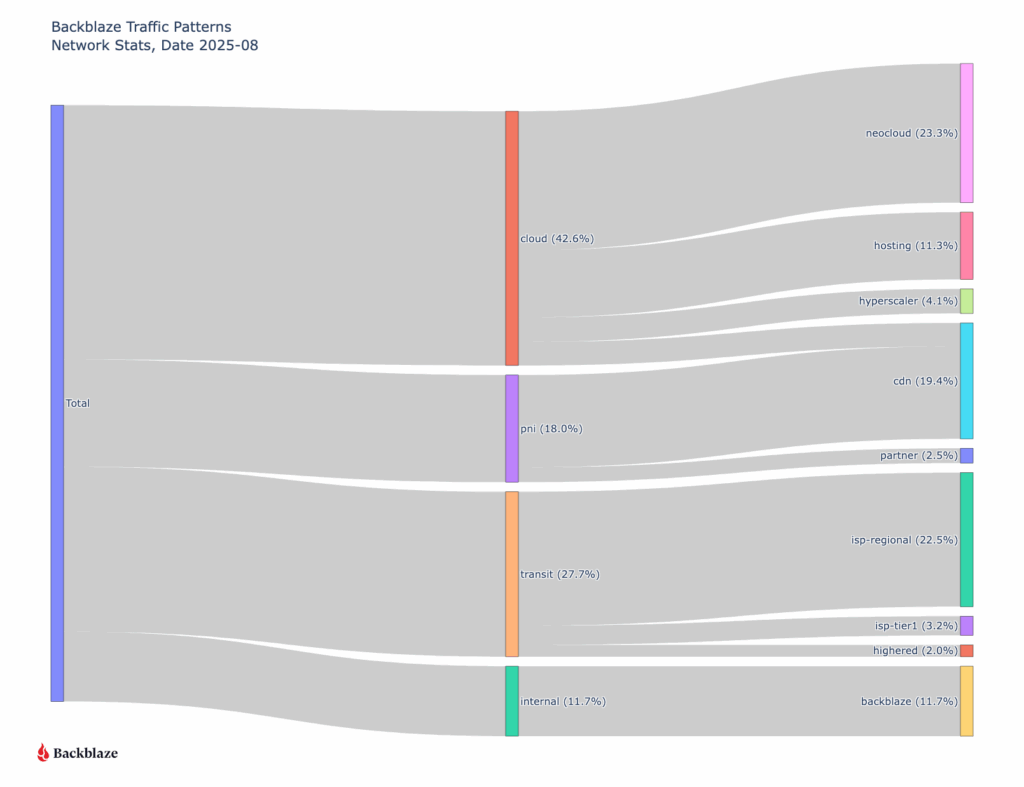
First let’s take a look at where all our traffic goes from a global perspective.

When we look at the data, one pattern stands out immediately: traffic associated with neocloud networks—cloud providers offering compute, GPU, or other AI-related services—already represents nearly a quarter of total ingress and egress across Backblaze’s network. That’s a meaningful signal. Historically CDN traffic has been the majority of our traffic as our B2 Object Storage has been growing. Now, we’re seeing clear evidence of a new class of workload emerging, and it’s AI-shaped.

Neocloud network behavior

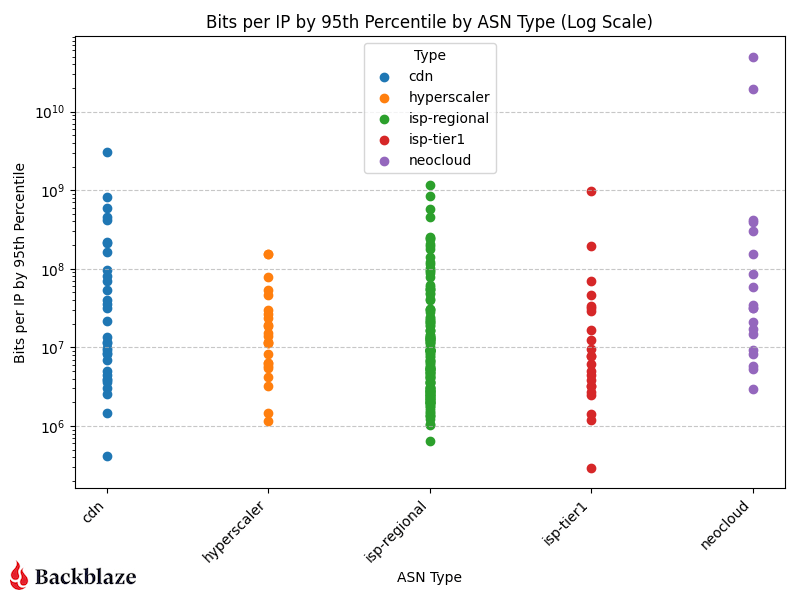
Let’s look at the magnitude of our network traffic based on the category of the traffic destination. To help quantify our data set, we interact with around 123,000 unique IP addresses every month. 

CDN, hyperscaler, isp-regional, and isp-tier one traffic cluster in the same general range of bits per IP, but neoclouds have a couple outliers—the two purple data points in the upper right corner of the log scale graph. 

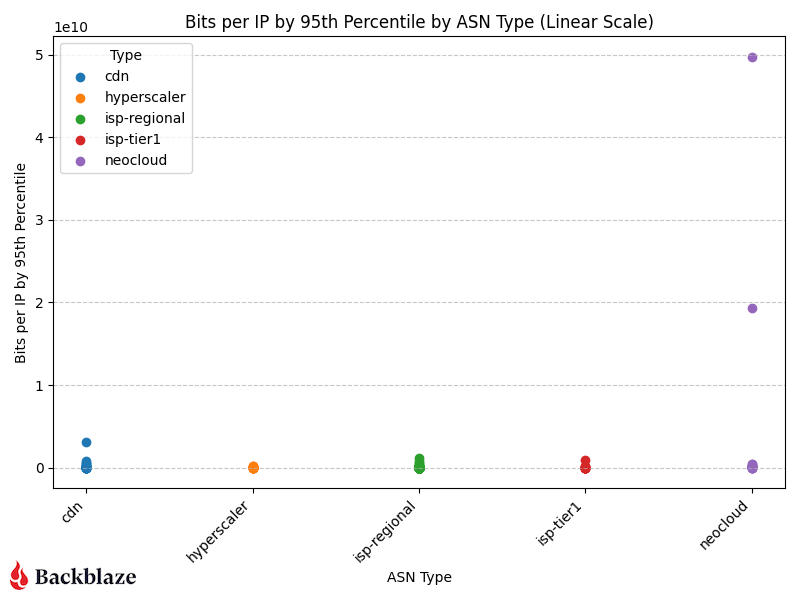
If we change the scale to linear (chart below), now we can see how much of an outlier the AI related traffic is in our sample range.

The “magnitude” (as we’re calling it) of the transfers we’re servicing for AI related flows to neoclouds is an order of magnitude greater than all our traffic patterns. This means that there are only a few unique IP addresses that we’re interacting with transferring large amounts of data in their flows.

The rise of AI-driven data movement

Over the past year, AI training and inference have transformed global data flows. Where traditional workloads move steadily, AI workloads move in bursts—rapid retrievals of massive datasets, short high-volume transfers for model training or tuning, and sustained outbound throughput for inferencing pipelines. The magnitude metric we’re introducing (bits per IP address) captures this shift. 

As shown in the charts above, AI-related traffic to neoclouds isn’t just heavier, it’s denser. Those purple data points represent a small number of IPs exchanging a disproportionate amount of data. That concentration of flow is a hallmark of AI compute pipelines, where a few high-bandwidth endpoints (often GPU clusters) interact with object storage to repeatedly feed and retrieve training data. 

In other words:

  • Fewer talkers, bigger flows. AI systems operate in fewer, more intense network sessions than traditional applications.
  • Shorter duration, higher peaks. Transfer patterns spike sharply, often corresponding to dataset replication or model checkpointing cycles.
  • Cross-cloud mobility. Much of this traffic routes between Backblaze and external compute platforms (classified as neoclouds) showing the rise of multi-cloud AI architectures.

The macro trend: The AI data gravity shift

This pattern reflects a broader macro trend in the cloud ecosystem: AI data gravity is pulling more storage and compute closer together. As AI models grow larger and datasets become more complex, organizations are rethinking where data “lives.” Instead of centralizing everything in one hyperscaler like AWS or Google Cloud Platform, they’re increasingly using cost-efficient, high-throughput storage clouds like Backblaze connected to specialized GPU clouds for compute (case in point: Why CoreWeave’s Object Storage Launch is Good for AI—and Everyone Building It).

This architectural shift explains the outlier traffic patterns we’re seeing on our network. Data isn’t just moving more—it’s moving smarter, following cost, performance, and regional availability cues. 

Why it matters

Tracking this kind of data movement and magnitude helps us, and more importantly our customers, understand a few key things:

  • Operational readiness for AI workloads: How our network scales under bursty, compute-linked demands. (For more on this check out Making the Backblaze Network AI Ready)
  • Cost predictability: Where and when ingress or egress volume spikes may occur.
  • Industry evolution: How AI is reshaping the underlying patterns of internet traffic.

What’s next?

This is just the first glimpse of that industry evolution. As our dataset matures, we’ll be able to watch these AI-linked flows change quarter over quarter, offering not just transparency, but a longitudinal view of how the data backbone of the AI economy takes shape. 

We’re planning to look at quarter over quarter number tracking for network types, IPv4 traffic vs IPv6 traffic, AI related workflows, cross-cloud connectivity trends, and more. We’re also planning to release the raw data quarterly going forward.

Anything specific you want to see? Let us know in the comments or reach out to our Evangelism team. 

We’re excited to share these insights from our network telemetry, the patterns we’re seeing, and what they mean for the broader data economy. This is the stuff we stay up at night studying, and sharing it publicly means we can all better understand the forces shaping digital infrastructure and build with greater confidence and foresight. 

The post Network Stats for Q3 2025: The Magnitude of AI Workflows appeared first on Backblaze Blog | Cloud Storage & Cloud Backup

New Attacks Against Secure Enclaves

Post Syndicated from Bruce Schneier original https://www.schneier.com/blog/archives/2025/11/new-attacks-against-secure-enclaves.html

Encryption can protect data at rest and data in transit, but does nothing for data in use. What we have are secure enclaves. I’ve written about this before:

Almost all cloud services have to perform some computation on our data. Even the simplest storage provider has code to copy bytes from an internal storage system and deliver them to the user. End-to-end encryption is sufficient in such a narrow context. But often we want our cloud providers to be able to perform computation on our raw data: search, analysis, AI model training or fine-tuning, and more. Without expensive, esoteric techniques, such as secure multiparty computation protocols or homomorphic encryption techniques that can perform calculations on encrypted data, cloud servers require access to the unencrypted data to do anything useful.

Fortunately, the last few years have seen the advent of general-purpose, hardware-enabled secure computation. This is powered by special functionality on processors known as trusted execution environments (TEEs) or secure enclaves. TEEs decouple who runs the chip (a cloud provider, such as Microsoft Azure) from who secures the chip (a processor vendor, such as Intel) and from who controls the data being used in the computation (the customer or user). A TEE can keep the cloud provider from seeing what is being computed. The results of a computation are sent via a secure tunnel out of the enclave or encrypted and stored. A TEE can also generate a signed attestation that it actually ran the code that the customer wanted to run.

Secure enclaves are critical in our modern cloud-based computing architectures. And, of course, they have vulnerabilities:

The most recent attack, released Tuesday, is known as TEE.fail. It defeats the latest TEE protections from all three chipmakers. The low-cost, low-complexity attack works by placing a small piece of hardware between a single physical memory chip and the motherboard slot it plugs into. It also requires the attacker to compromise the operating system kernel. Once this three-minute attack is completed, Confidential Compute, SEV-SNP, and TDX/SDX can no longer be trusted. Unlike the Battering RAM and Wiretap attacks from last month—which worked only against CPUs using DDR4 memory—TEE.fail works against DDR5, allowing them to work against the latest TEEs.

Yes, these attacks require physical access. But that’s exactly the threat model secure enclaves are supposed to secure against.

The collective thoughts of the interwebz