Post Syndicated from Matt Granger original https://www.youtube.com/shorts/UhefeUFNse0
Meteor Fear
Post Syndicated from xkcd.com original https://xkcd.com/3323/
Reduce alert fatigue by customizing threat detection features in Amazon GuardDuty
Post Syndicated from Allan Holmes original https://aws.amazon.com/blogs/security/reduce-alert-fatigue-by-customizing-threat-detection-features-in-amazon-guardduty/
The teams responsible for security today don’t have a problem with the number of alerts they receive; they have a problem turning those alerts into something truly actionable. When an analyst concludes an investigation with “this was caused by our vulnerability scanner” or “this account is configured to share Amazon Machine Images (AMIs) publicly on purpose,” the detection worked as designed, it just wasn’t applicable to the environment. When this happens continuously at scale, alert fatigue sets in. As teams sort through these events, incident response slows down or, worse, teams stop paying attention to the alerts at all.
Amazon GuardDuty is a threat detection service that continuously monitors, analyzes, and processes Amazon Web Services (AWS) data sources and logs in your AWS environment for suspicious or potentially malicious activity. GuardDuty then delivers detailed security findings to you for visibility and remediation. GuardDuty accomplishes this by analyzing independent streams of available sources. This includes logging of management events in AWS CloudTrail, information about IP traffic through Amazon Virtual Private Cloud (Amazon VPC) Flow Logs, and Amazon Route 53 DNS query logs to name a few. These sources don’t need to be enabled or configured within your accounts for GuardDuty to use them. When GuardDuty observes activity that looks suspicious or anomalous, it produces a finding that’s a detailed security alert naming the behavior, the resources involved, and any supporting evidence. A finding is a signal to investigate, not a final verdict.
While the managed detections in GuardDuty work consistently across every AWS customer, personalizing detections for your specific architectures and environments is equally important. Over the past year, AWS has released a set of capabilities within GuardDuty that you can use to supply that missing context, most recently with the launch of Custom Detection Rules.
In this post, we walk through those capabilities in three distinct stages. These stages explore how to customize what GuardDuty detects, triage the findings that remain, and accelerate investigations. Throughout this blog post you’ll learn how to:
- Efficiently detect anomalous behavior that shouldn’t occur in a specific account, without building detection logic yourself
- Measure if a detection will be noisy before it generates a single finding, flooding security teams
- Feed your own custom threat intelligence, including file hashes, into GuardDuty
- Scope a suppression rule narrowly enough to archive expected activity while surfacing the same behavior elsewhere
- Get an automated analysis of a finding, with a risk level and recommended actions, before the finding is opened manually
Prerequisites
For the walkthrough in this post, you must have the following prerequisites in place.
- GuardDuty must be enabled in at least one AWS account and AWS Region. Note that these customization features aren’t currently available in all Regions, for more information, see Region-specific feature availability.
- Your user or role must have AWS Identity and Access Management (IAM) permissions to configure these features in GuardDuty. The
AmazonGuardDutyFullAccess_v2managed policy covers the required actions. - If you manage multiple accounts through AWS Organizations, AWS recommends administering GuardDuty using the delegated administrator account. By using this method, you can manage lists, suppression rules, and conduct investigations from a centralized location.
- GuardDuty Runtime Monitoring must be enabled to conduct file hash matching and to use Custom Detection Rules for Runtime Monitoring. This protection plan isn’t enabled automatically in GuardDuty.
- An Amazon Simple Storage Service (Amazon S3) bucket that you control for storage of custom threat entity lists.
- The AWS Command Line Interface (AWS CLI) installed.
Stage 1: How to customize what GuardDuty detects
An AMI is a pre-configured template that contains the software configurations needed to launch an Amazon Elastic Compute Cloud (Amazon EC2) instance on AWS. Sharing an AMI publicly can be a routine operation in an account whose purpose is distributing images, and a potential security event in any other account. The same might be said for disabling VPC Flow Logs, or signing in without multi-factor authentication for a legacy service account. Until the release of Custom Detection Rules, there was no way to account for these differences in GuardDuty.
Custom Detection Rules
Custom Detection Rules is a library of prebuilt, opt-in rules that AWS builds and maintains. At launch, it holds 90 rules across AWS CloudTrail management events and GuardDuty Runtime Monitoring events, producing 38 finding types mapped to 13 MITRE ATT&CK® tactics, described using vocabulary from ATT&CK and the Threat Technique Catalog for AWS. The catalog is maintained by the AWS Customer Incident Response Team (CIRT) and is based on the MITRE ATT&CK Cloud Matrix, documenting threat actor tactics, techniques, and procedures specific to AWS as observed by the AWS CIRT during customer engagements. Each entry includes detection guidance and mitigations specific to AWS environments, so a technique ID on a finding points to a public entry that your team can read.
Previously, detecting environment-specific behavior meant ingesting your own CloudTrail logs or host telemetry, normalizing them, building the logic, and maintaining that logic as APIs changed. Custom Detection Rules remove that work. You select the rules for GuardDuty to evaluate against the CloudTrail management events it already analyzes and, where Runtime Monitoring is enabled, the runtime events from the GuardDuty security agent, without the undifferentiated heavy lifting of log ingestion, normalization, and storage. Coverage is extended without adding unnecessary alerts that don’t add value to your teams.
Each rule runs in one of two modes. In dry run mode, GuardDuty evaluates the rule and publishes Amazon CloudWatch metrics showing how often an event matched the rule, but generates no findings. Dry run mode expires automatically after 14 days. In live mode, events that match generate findings, and live mode has no expiration.
Custom Detection Rules are currently available in all AWS commercial Regions and the AWS GovCloud (US) Regions. Custom Detection Rules for Runtime Monitoring are available in every region where GuardDuty Runtime Monitoring is available.
Walkthrough: Measure a rule, then turn it on
Start in dry run so you can measure the noise level before receiving a finding. This walkthrough uses the AMIExternalAccess rule, which detects when an AMI is shared with an external AWS account or made public, and applies it from the GuardDuty delegated administrator account. In an organization, the delegated administrator manages Custom Detection Rules for all member accounts through an organization configuration, and accounts that join the organization later inherit it.
Using the GuardDuty console
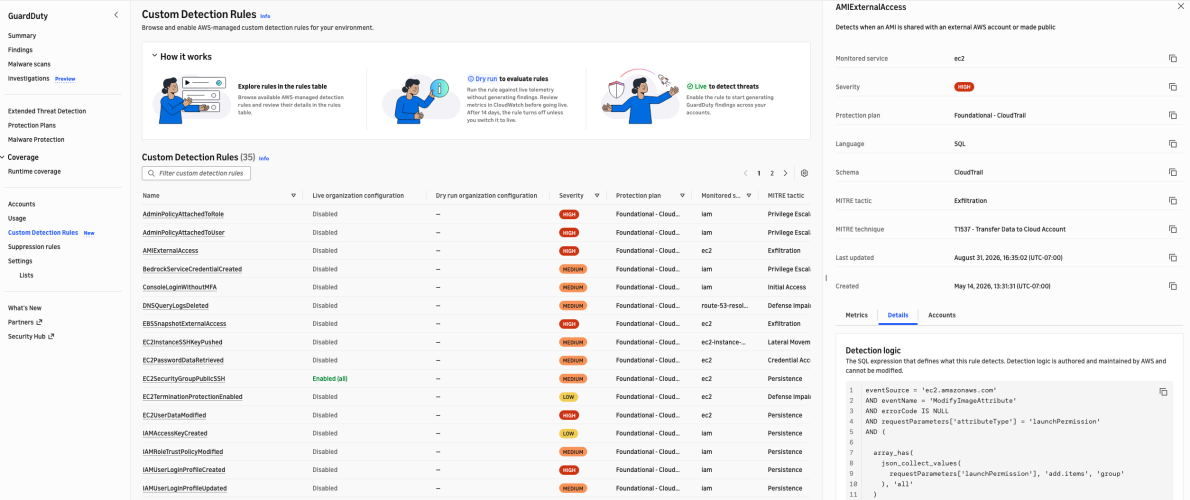
- Open the AWS Management Console for GuardDuty and choose Custom Detection Rules.

Figure 1. The Custom Detection Rules catalog with the detection logic for the AMIExternalAccess rule
- Select a rule name to see its detection logic on the Details tab. Rules are SQL conditions over CloudTrail fields, so you can review exactly what a rule matches before enabling it.
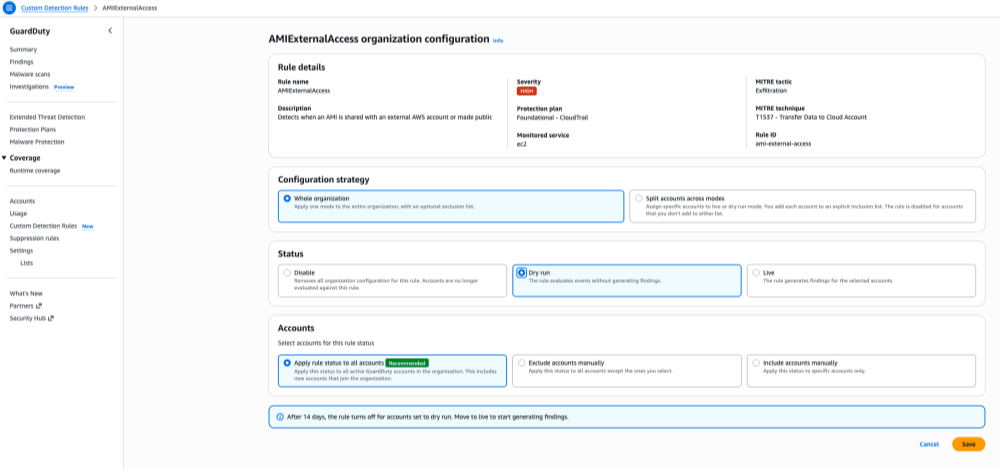
- Choose the rule’s Accounts tab, then under Organization configuration, choose Configure.

Figure 2. Configuring the AMIExternalAccess rule in dry run mode
- Under Configuration strategy, select Whole organization. Under Status, select Dry run. Under Accounts, select Apply rule status to all accounts, then choose Save.
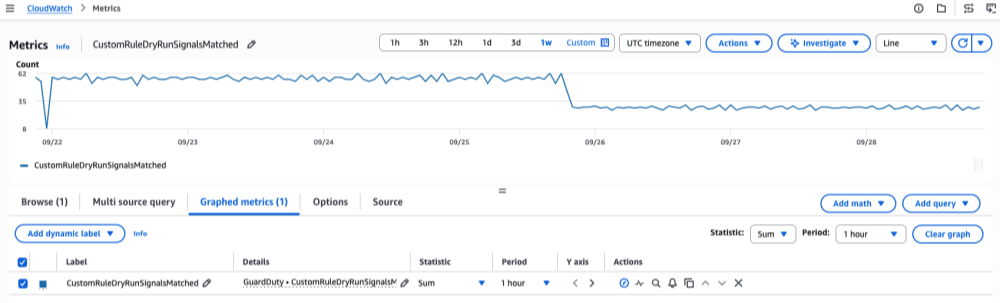
- Watch the
CustomRuleDryRunSignalsMatchedmetric in CloudWatch. GuardDuty publishes the metric only when the rule matches an event, so a rule with no matching activity shows no data. Because dry run mode expires automatically after 14 days, a full dry-run period is the longest continuous sample GuardDuty collects without you re-enabling the rule. The metric data persists in CloudWatch under its standard retention after the dry run ends, so you can review it shortly before or after expiry and still base your decision on the most complete data available. Volume alone doesn’t tell you whether the activity is benign, so account for what you see before deciding. If a rule matches constantly and someone can point to the process that causes it, that account is a poor candidate for live mode. If nobody can explain the matches, investigate them as they stand, because a dry run measuring real attacker activity looks the same as one measuring routine operations.
Figure 3. Dry-run match volume for a rule over one week, shown as hourly totals
- When you’re satisfied the rule is worth acting on, return to the rule’s organization configuration and change Status to Live to start generating findings. To keep the rule off in accounts where the activity is expected, such as an image-build account, choose Exclude accounts manually under Accounts and select those accounts.
Using the AWS CLI
- From the delegated administrator account, apply the rule in dry run to the whole organization. Omitting account lists targets every member account, including accounts that join later.
- Review the
CustomRuleDryRunSignalsMatchedmetric over the dry-run period, applying the same judgment described in the preceding console procedure. - Move the rule to live mode by updating the existing configuration. Creating a second whole-organization configuration for the same rule fails with a conflict error. To exclude accounts where the activity is expected, add
--exclude-account-ids.
Note: In a standalone account that isn’t part of an organization, you enable a rule for that account alone. With the AWS CLI, use
create-custom-detection-rule-associationwith the same--rule-idand--modeparameters. To change the mode later, useupdate-custom-detection-rule-associationwith the association ID. Member accounts in an organization can’t enable or change a rule themselves; the delegated administrator manages rules on their behalf. For details, see Managing Custom Detection Rules in multiple-account environments.
Threat entity lists
If your threat intelligence team already tracks known-bad infrastructure and files, you can pass those indicators to GuardDuty and generate findings when they appear in your AWS account.
GuardDuty has two list formats. An IP address list holds IP addresses only. An entity list, the newer format, can hold IP addresses, CIDR ranges, and domain names together in a single file. The difference that matters is coverage: entity list entries apply to CloudTrail, VPC Flow Logs, and Amazon Route 53 Resolver DNS query log findings, while IP address lists cover CloudTrail and VPC Flow Log findings only. If you still use IP address lists, the additional DNS coverage is a reason to move.
In addition, entity lists now also accept SHA-256 file hashes. Hashes sit alongside network indicators in the same file, and GuardDuty checks them against Runtime Monitoring. When the runtime agent sees an executable whose hash matches an active list, it generates a high severity Execution:Runtime/MaliciousFileExecuted.Custom finding and names the matching list, so your responder knows which intelligence source was used.
Note: If the entity list is changed, the list must be reactivated to include the updates. Uploading a new version of the file isn’t sufficient on its own. If this step is automated, build that reactivation step into the same process that refreshes the file.
Entity lists are currently available in all AWS commercial Regions, but not in the AWS GovCloud (US) Regions.
Stage 2: How to triage the findings that remain
Customizing detection reduces findings at the source, but the work is rarely finished there. New workloads appear, teams change how they operate, and some findings still describe activity that’s expected in your environment. You also need a precise way to route those events away from the queue your analysts work from.
A filter selects findings. A suppression rule is a filter that automatically archives a GuardDuty finding it matches. Archiving isn’t deletion: the finding is retained for 90 days and stays viewable, but the finding isn’t forwarded to AWS Security Hub, Amazon S3, Amazon Detective, or Amazon EventBridge, so it stays out of your security information and event management (SIEM) system and ticket queue.
Two changes have made that routing more customizable.
Wildcards
Filter criteria now support the Matches and NotMatches operators, where * matches any number of characters and ? matches one. Criteria used to be exact-match only, so suppressing findings from every AWS Lambda function in a service meant listing each name and updating it on every deployment. One pattern now covers the naming convention, including functions that don’t exist yet, so the rule stops going stale.
Additional property filter fields
You can now use over 1,000 supported fields from a finding as suppression criteria, including runtime process details, Kubernetes workload metadata, network connection information, and attack sequence signals. Take a vulnerability scanner in one Kubernetes namespace generating expected findings. With no namespace criterion available, you previously either suppressed the finding type more broadly than you wanted or wrote downstream logic to strip them. Now you scope the rule to that specific namespace and leave detection intact everywhere else in the cluster. This expanded field set is available in the aws partition; other partitions continue to use the console-supported fields only. See Filtering findings in GuardDuty for the full list of supported fields.
The recommended method is to assemble your criteria on the Findings page first, confirm the filtered list contains only findings you’re willing to archive, then choose Create suppression rule. The console and CLI procedures are detailed in the user guide.

Figure 4. Findings filtered by finding type and Kubernetes namespace, before creating a suppression rule
Before you write wildcard criteria, know that they can’t be validated with ListFindings or GetFindingsStatistics, the testing workflow AWS recommends for ordinary filters. Instead, start from a filter that takes no action and watch the suppression rule metrics to see how much it would match before you rely on it. Nothing is lost if the pattern is too broad, matched findings are archived rather than deleted, so you can lift the suppression rule and return them to your queue.
Stage 3: How to accelerate investigations
What remains consumes analyst hours. To decide whether a finding is a real event, an analyst pivots into CloudTrail for the operations that identity performed, lines up timestamps, checks IPs and domains against intelligence, and looks for a change ticket that explains the work. That can take hours, and most such investigations end in expected. When one doesn’t, all that time was spent before any actual containment could begin.
GuardDuty Investigation, also called AI-powered investigations performs that correlation automatically. GuardDuty Investigation analyzes the finding alongside related activity from the past 90 days, affected resources, threat intelligence, and threat indicators, and returns a structured summary in minutes: a risk level, a confidence rating, a written summary, supporting detail, MITRE ATT&CK classification, and recommended actions including the CLI commands to carry them out.
Note: Read the confidence rating as carefully as the risk level. High risk with low confidence is a very different indicator to an analyst than high risk with high confidence.
You can investigate a single finding, an account, or a whole organization, from the console, the AWS CLI, the API, or an AWS MCP Server. To turn on AI-powered investigations, go to Settings, find AI powered investigations – Preview, and choose Enable.
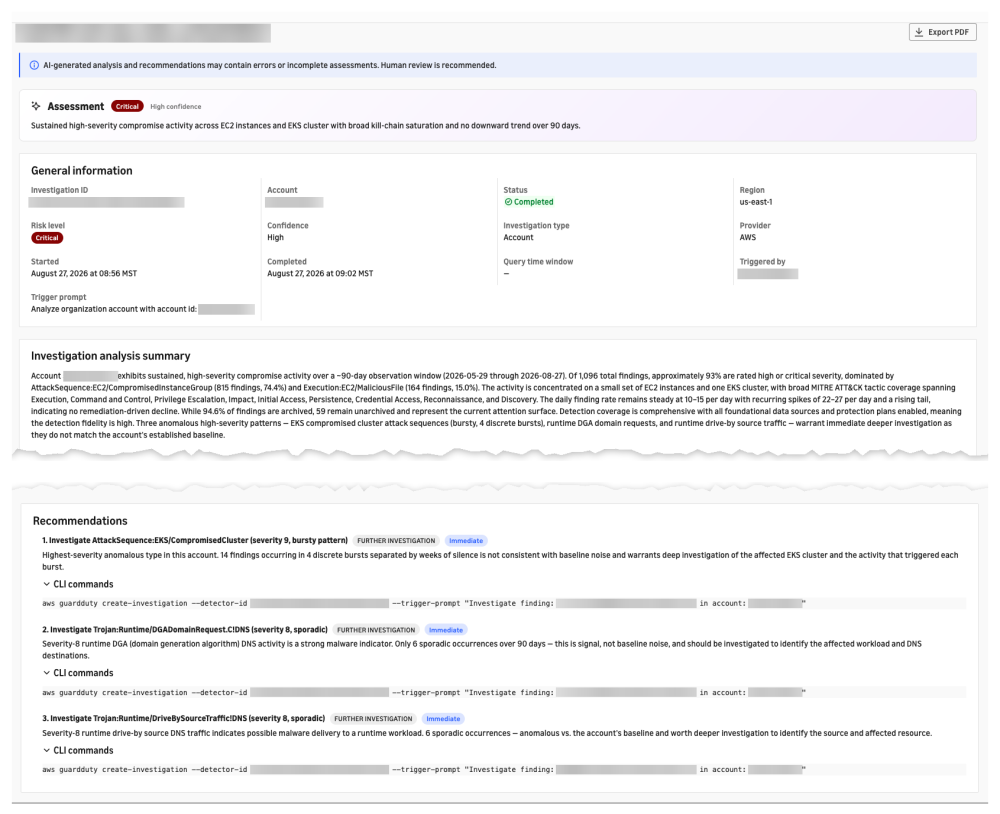
Figure 5. A completed account investigation with risk level, confidence, analysis summary, and recommended actions
The preview runs in 10 AWS Regions: US East (N. Virginia), US East (Ohio), US West (Oregon), Canada (Central), Europe (Frankfurt), Europe (Ireland), Europe (London), Europe (Paris), Europe (Stockholm), and Asia Pacific (Tokyo). It allows 10 investigations per account per day and 100 per account in total, and can only be started from an administrator account, member accounts can’t create investigations from their own accounts. The feature uses Amazon Bedrock models with Cross-Region Inference (CRIS), which automatically selects a Region within your geography to process the analysis and generate the report. Your data remains stored only in the Region where the investigation request originates, but investigation data and summary results might be processed outside that Region. Review that routing if you have data residency commitments. For GuardDuty Region-specific differences more broadly, see Region-specific feature availability in the user guide.
Putting it all together
Consider a team running containerized workloads on Amazon Elastic Kubernetes Service (Amazon EKS) across a handful of accounts in one organization.
The threat intelligence team uploads SHA-256 hashes from a recent brief as a threat entity list. Security engineering enables Custom Detection Rules in dry run mode and finds after 2 weeks that AMI sharing fires constantly in the image-build account and nowhere else, so they promote the rule to live across the organization and exclude the build account.
The team’s vulnerability scanner runs in a dedicated Kubernetes namespace, so they suppress that namespace and finding type while leaving the same behavior detected elsewhere. A second rule uses a wildcard on their Lambda naming convention, replacing a hand-maintained list.
Suppressed findings are archived instead of being sent to Security Hub, Amazon S3, EventBridge, or the SIEM, so they never reach the analyst queue. When a finding does warrant attention, an analyst starts an investigation and gets a disposition before manual work begins.
Each stage reduces the work of the next. Customizing detection means less to triage, effective triage means less to investigate, and automated investigation means the findings that reach a human get a decision faster.
Next steps
If you haven’t enabled GuardDuty, start with the 30-day free trial. Most protection plans enable automatically and are included, so you can evaluate them. Turn on Runtime Monitoring separately if you want to test hash matching or Custom Detection Rules for Runtime Monitoring..
If you’re already using GuardDuty:
- Enable two or three Custom Detection Rules in dry run mode. Choose behavior that shouldn’t occur in specific accounts, measure across the dry-run period, then promote selectively.
- Revisit existing suppression rules. Any rule written before the April 2026 field expansion might be broader than you intended, because the field you wanted wasn’t available then; narrow it to that field now.
- Audit filters for wildcard opportunities. Any filter with a growing list of exact-match names is maintenance a single pattern can replace.
- Migrate IP address lists to entity lists for the DNS query log coverage.
Conclusion
GuardDuty’s managed detections keep expanding, driven by AWS threat intelligence, security research, and customer feedback. These capabilities enable you to decide which activity is worth alerting on in which accounts, and which findings never need to be delivered to a human at all.
Learn more
- Custom Detection Rules in GuardDuty
- Managing Custom Detection Rules in multiple-account environments
- Customizing threat detection with entity lists and IP address lists
- Creating suppression rules in GuardDuty
- Suppression rule metrics
- Introducing the Amazon GuardDuty investigation agent: on-demand AI-powered threat assessment
- Amazon GuardDuty Regions and endpoints
- Amazon GuardDuty quotas
- Threat Technique Catalog for AWS
- Welcoming the AWS Customer Incident Response Team
- What the March 2026 Threat Technique Catalog update means for your AWS environment
- Amazon GuardDuty adds optional threat detection rules
How Could Congress Hold ICE Officers Accountable?
Post Syndicated from The Atlantic original https://www.youtube.com/shorts/klnCF0wJYHY
Patch Tuesday – November 2026
Post Syndicated from Adam Barnett original https://www.rapid7.com/blog/post/em-patch-tuesday-november-2026
Microsoft is publishing 1,092 own-product vulnerabilities on November 2026 Patch Tuesday, including 745 vulnerabilities in Windows. Until a few months ago, these volumes would have been unimaginable, but if anything, this month feels like a slight reprieve.
The jury is still out on whether patching many more vulnerabilities will lead to better security outcomes; every code change to resolve a known vulnerability could easily introduce new hidden treasure for researchers or threat actors to unearth in the future.
Despite the vast uptick in volume during 2026, there has been no accompanying increase in the number of vulnerabilities known to be exploited in the wild. Microsoft is aware of exploitation in the wild for just one of the vulnerabilities published today, with no known public disclosure at all this month.
Outlook: zero-day spoofing
Imagine coming home and checking your mailbox to find a postcard. You admire the non-specific image of a tropical beach at sunset, and flip it over to scan the handwriting on the back, which looks vaguely familiar. It’s addressed to you, but you can’t make out the signature, and the message is short and generic. Is that real handwriting, or has this been printed? Probably marketing material.
You put the card in the recycling and, since life is busy, you move on and forget about it. Somehow, you remain entirely unaware that, immediately after reading the postcard, you took out your phone and sent high-resolution images of your front door key to a number you’ve never contacted before.
Is this sketch just some rather questionable science fiction? Yes, hopefully, but what if that non-specific postcard was instead a malicious file in your Outlook inbox? Now we’re talking about CVE-2026-124194, an exploited-in-the-wild spoofing vulnerability. Merely opening a specially crafted malicious file causes Outlook to silently connect to an attacker-controlled location and leak the user’s NTLM v2 hash. All supported versions of classic Outlook receive patches.
The relatively low CVSS v3.1 base score of 6.5 does not tell the full story here, since this vulnerability provides value for both commodity attackers working to harvest initial access at scale, and also more targeted campaigns by more sophisticated threat actors.
The NTLM v2 hash can be relayed live to impersonate the user against another service, at least where those services do not implement adequate safeguards such as message signing for SMB or LDAP, as well as Extended Protection for Authentication for Exchange or Active Directory Certificate Services. Alternatively, the NTLM v2 hash can be cracked offline by a motivated attacker to retrieve the underlying credential. The Preview Pane is not a vector, which will help limit the real-world impact somewhat.
Windows Schannel: critical pre-auth RCE
A pre-authentication remote code execution (RCE) vulnerability in Windows will always attract attention. CVE-2026-119952 allows an attacker to execute code on a target system by sending specially crafted malicious packets. Since the vulnerable component is Schannel, which is Microsoft’s implementation of Transport Layer Security (TLS), attackers may not have to look very far to find vulnerable endpoints.
The advisory provides some comfort by pointing out that specific conditions are required for exploitability, which reduces the likelihood of broad exploitation, but the advisory still assesses exploitation as more likely, so Microsoft presumably expects that the development of reliable exploit code is feasible. In many cases, there will be no need for an attacker to have an existing foothold on the same subnet.
The execution context likely depends on the vulnerable service, which points to the evergreen need for least privilege architecture, but it also means that we cannot exclude the possibility of pre-auth RCE as SYSTEM in some cases.
Exchange/Windows Search: critical pre-auth RCE
Could someone take control of your Exchange server by sending a single email? In short: yes. Microsoft offers customers tight integration between various business-critical components. Exchange running on Windows is Microsoft on Microsoft, and the Windows Search component indexes email on behalf of Exchange.
An attacker aiming to exploit CVE-2026-116928 relies on this helpful synergy to achieve pre-auth RCE on the server by sending a malicious attachment, which Exchange will process automatically. How’s that for low attack complexity Although the advisory does not specify the context of execution, we should assume SYSTEM, since several of the services which might be involved do run with a high privilege level.
Since the patches are for Windows OS rather than Exchange itself, there’s no need to worry about which version of Exchange you’re running, so long as you are running only Exchange Subscription Edition, since all previous versions of Exchange are now fully beyond end of support.
Microsoft lifecycle update
There are fewer Microsoft product lifecycle changes in November 2026 than last month. As of Nov 11, 2026, .NET 8 Long Term Servicing channel moves past its release end date, along with PowerShell 7.4 LTS, and the 23H2 versions of the Enterprise, Education, and IoT editions of Windows 11.
Summary charts
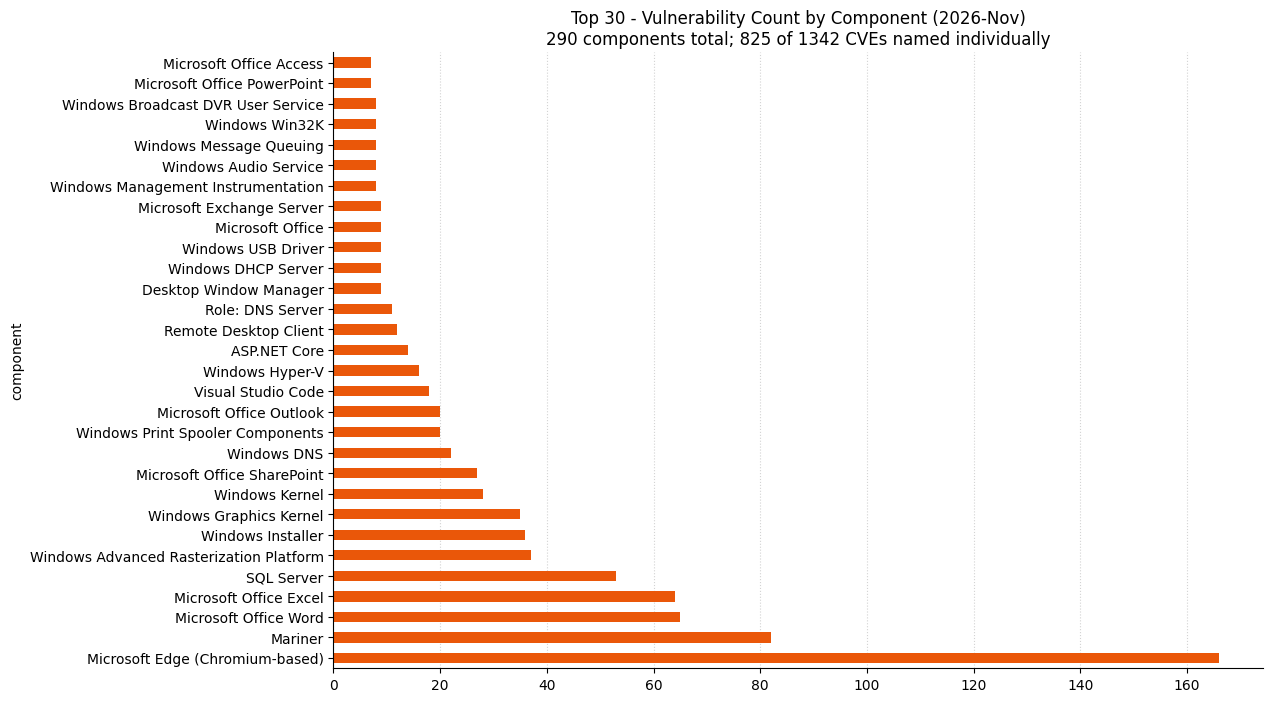
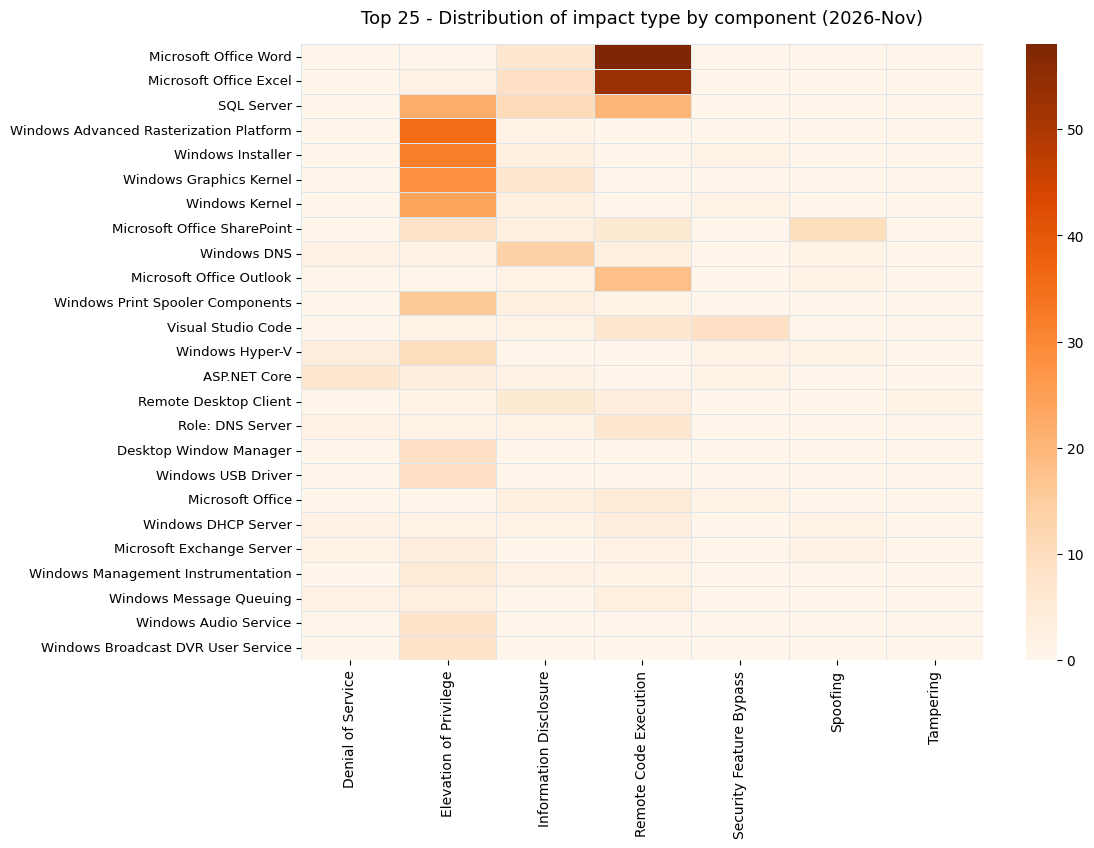
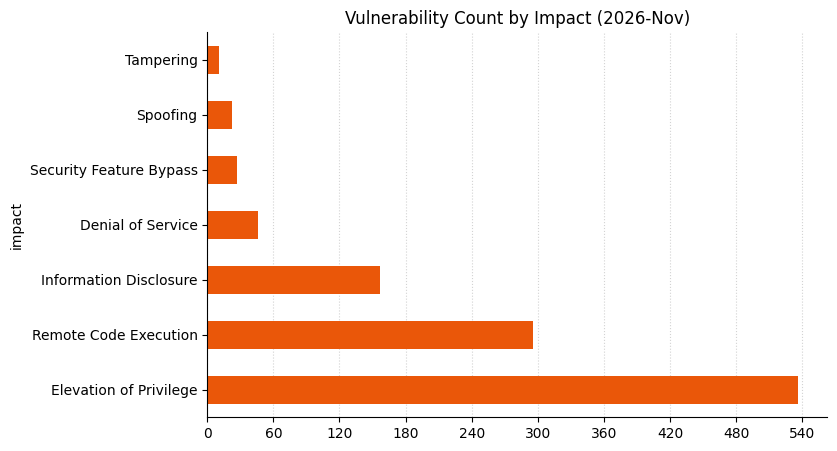
Update history
- 2026-11-12: corrected the number of Windows OS vulnerabilities.
AWS refreshes ProcessUnity Global Risk Exchange assessment to enhance customer’s third-party due diligence
Post Syndicated from Naranjan Goklani original https://aws.amazon.com/blogs/security/aws-refreshes-processunity-global-risk-exchange-assessment-to-enhance-customers-third-party-due-diligence/
Amazon Web Services (AWS) is pleased to announce renewal of the AWS ProcessUnity Global Risk Exchange assessment. This validated assessment report helps customers perform effective cloud supplier due diligence on AWS and enhances their third-party risk management process.
What is the AWS ProcessUnity Global Risk Exchange assessment
Many customers use third-party cyber risk management (TPCRM) services such as ProcessUnity to better manage risks from their evolving third-party environments and to drive operational efficiencies. To help with such efforts, AWS has completed the ProcessUnity Global Risk Exchange assessment of its security posture. ProcessUnity’s assessors perform the review of Global Risk Exchange assessment and validate the results annually.
This assessment approach replaces static spreadsheets with a dynamic system that combines advanced analytics, threat intelligence, and risk models with vendor input. Vendor profiles continuously update as cloud provider risk levels and AWS security posture evolve, keeping risk matrices current in near real time. Additionally, customers can also use Framework View which maps AWS assessment controls to threat profiles, MITRE ATT&CK scenarios, and global compliance standards and frameworks including National Institute of Standards and Technology (NIST) 800-53, International Organization for Standardization (ISO) 27001, Payment Card Industry Data Security Standard (PCI DSS), and Health Insurance Portability and Accountability Act (HIPAA), significantly reducing customers’ third-party due diligence burden.
How can you access the assessment?
Customers can request access to the report by completing an access request form, available on the ProcessUnity Global Risk Exchange page. If you are an existing ProcessUnity Global Risk Exchange member, you can request access from within ProcessUnity Global Risk Exchange portal.
To learn more about our compliance and security programs, see AWS Compliance Programs. As always, we value your feedback and questions; reach out to the AWS Compliance team through the Contact Us page.
Nitro Sandboxes: Hardware isolation for every EKS pod, ECS task, and EC2 workload
Post Syndicated from Alex Graf original https://aws.amazon.com/blogs/compute/nitro-sandboxes-hardware-isolation-for-every-eks-pod-ecs-task-and-ec2-workload/
Security has been the foundation of AWS cloud computing since day one. When we built Amazon Elastic Compute Cloud (Amazon EC2), we designed it with strong isolation that keeps customer workloads and data separated from every other tenant on the same hardware. The AWS Nitro System took that further by moving virtualization, storage, and networking onto dedicated hardware, making zero operator access to customer data the default. Customers then asked us for more. They wanted tightly scoped, attestable environments for their most sensitive processing: the code and data that required protection even from their own administrators. That’s why we built Nitro Enclaves. Today, more of those sensitive workloads run in containers on Amazon Elastic Kubernetes Service (Amazon EKS), Amazon Elastic Container Service (Amazon ECS), and self-managed Kubernetes and container runtimes on Amazon EC2. Customers are asking for the same level of isolation and confidentiality for container environments.
Container environments today host many independent workloads on a single EC2 instance by using Linux container technology. For a lot of customers, Linux containers have become the prevalent workload delivery vehicle because of their ease of deployment and the ability to have them share resources in one host through a shared kernel. This sharing has some downsides. Operators of a shared cluster have access to all the tasks running in it. A weakness in the shared kernel reachable by one container also exposes every other container on the host. With the current rate of Linux Common Vulnerabilities and Exposures (CVEs), containerized workloads need an architecture that isolates each workload from other workloads and from cluster operators.
Introducing AWS Nitro Sandboxes
This week we introduced AWS Nitro Sandboxes, a new Amazon EC2 building block that gives each container the boundary of a hardware-isolated virtual machine (VM). Each sandbox gets the security properties of the Nitro System (strong isolation, zero operator access to customer data, and attestation) while keeping the familiar container experience. And isolation is designed so that no one outside the Nitro Sandbox can read its contents: Neither the cluster administrator, the platform team, nor AWS can read EKS pod or ECS task memory.
A Nitro Sandbox is a lightweight virtual machine that you launch and control from your EC2 instance. To your instance, it behaves like a child VM. Under the hood, it runs as a separate VM alongside your instance. The Nitro System enforces separation between the sandbox and its parent instance, between sandboxes, and between the sandbox and AWS operators. The parent instance contributes vCPU, memory, and I/O. Nitro keeps the workload isolated and, when you ask, proves what code it is running.
Because a Nitro Sandbox is a first-level guest with no nested hypervisor, and the Nitro Hypervisor enforces its CPU and memory boundary in hardware, compute and memory run at near-native EC2 performance. Instead of needing a separate instance for every workload or customer that needs a hard boundary, you can consolidate many isolated workloads onto instances you already run. You can then improve utilization and lower cost without giving up the boundary that made separate instances attractive in the first place.
Nitro Sandboxes share the same Nitro System isolation technology that we have operated for years as Nitro Enclaves. With Nitro Enclaves, we designed everything around the smallest possible surface: You dedicate full CPU cores and memory to a separate VM that you can only reach over a vsock channel. With Nitro Sandboxes, we built on the same foundation, but adjusted the experience to the needs of container workloads in three ways. First, a sandbox’s vCPUs can share cores with the parent instance through time slicing. Second, the parent can attach standard virtio network and block devices, not only a vsock channel, so the sandbox gets real networking and storage. Third, you can run the sandbox through a standard virtual machine monitor (VMM) such as Firecracker. The result is a general-purpose, hardware-isolated environment that behaves like a normal VM and runs almost anywhere EC2 runs.
We then took Nitro Sandboxes and natively integrated them into Amazon EKS and Amazon ECS, providing a turnkey solution to Nitro-backed, confidential virtual-machine-based container isolation at scale. Nitro Sandboxes are broadly available with the following features:
- Instances: Every EC2 instance type that supports Nitro Enclaves, across general purpose, compute optimized, memory optimized, storage optimized, and accelerated families, on AWS Graviton, Intel, and AMD processors, in commercial Regions worldwide, at no additional charge.
- Storage: Sandboxes reach storage the same way an EC2 instance does: local instance store for scratch space, Amazon Elastic Block Store (Amazon EBS) for persistent volumes, and Amazon Simple Storage Service (Amazon S3) or Amazon Elastic File System (Amazon EFS) over the network. To keep data confidential from the parent, you can use attestation-gated AWS Key Management Service (AWS KMS) keys, the same model as Nitro Enclaves, now integrated into Nitro Sandboxes, EKS, and ECS.
- Networking: Each sandbox runs its own kernel, and therefore its own network stack. The parent connects that stack to your Amazon Virtual Private Cloud (Amazon VPC) the same way it does for containers today. On EKS, pods keep their own VPC IP address through the Amazon VPC CNI. On ECS, each task gets its own elastic network interface in
awsvpcmode. Network policies and security groups are enforced on the parent instance, outside the sandbox, so a compromised workload cannot turn them off.
With Nitro Sandboxes, you can give every workload that needs a hard boundary its own VM, without giving it its own instance. AI agents that write and run their own code can run each session in a separate sandbox. Code that a prompt injection gets the agent to run stays inside one VM, which is deleted when the session ends. Software as a service (SaaS) providers can run many tenants on shared EKS nodes or ECS Managed Instances, each in its own sandbox, instead of giving each tenant a dedicated instance. Continuous integration and continuous delivery (CI/CD) pipelines can run privileged builds and untrusted pull request code inside a per-job VM rather than on dedicated build machines. And with confidential sandboxes, model providers can deploy closed-weight models in a customer’s account, knowing the weights are decrypted only inside an attested sandbox. Regulated industries can give auditors cryptographic proof of exactly what ran.
Isolation by design
Containers on a shared node all trust one Linux kernel. A single kernel issue can lead to data exposure across pods or tasks. With Nitro Sandboxes, each pod, task, or agent runs in its own VM with its own kernel. A kernel issue in one sandbox doesn’t affect its neighbors.
The Nitro Hypervisor establishes strong, virtual-machine-based security isolation through its leading security posture and built-in confidential computing which we continuously extend. The hypervisor removes the parent’s access to the sandbox’s memory and CPU register state. Only I/O buffers that the sandbox explicitly shares stay visible to the parent.
Nitro Sandboxes can therefore treat the parent instance as untrusted and attest to what runs inside. They use the Nitro-based Nitro Secure Module (NSM) to gain an attestation document in the same style as Nitro Enclaves. A workload can be configured to get its secrets only after it proves it is running the code you approved. The system is designed so that no one outside the sandbox can read its contents: Neither the cluster administrator, the platform team, nor AWS can read EKS pod or ECS task memory. You write AWS KMS key policies that require specific attestation measurements before AWS KMS releases a decryption key. This creates a verifiable link between who can decrypt and what code is actually running.
Isolation modes in EKS and ECS
On top of Nitro Sandboxes, EKS and ECS provide two isolation modes. With these modes, you can choose between faster launch times and cryptographic attestation:
- Confidential sandbox: Sandboxes are fully attestable. Image loading and other runtime operations are gated by a Cedar policy, image contents are verified and extracted inside the sandbox, and the ephemeral layer is encrypted. AWS KMS releases your secrets only to workloads that prove they run the code you approved. Use this mode for anything that handles secrets, including when you want protection from your own operators. SaaS providers can show their customers that tenant data is protected through attestation. Regulated industries can give auditors cryptographic evidence in addition to documentation.
- Isolated sandbox: Each pod (EKS) or task (ECS) runs in its own hardware-isolated VM with its own kernel, protecting the node and neighboring workloads from anything that happens inside the sandbox. The node and its operators are trusted, just as they are for pods and tasks today, and image validation works the same as it does without sandboxes. For workloads that also need protection from the node operator, use confidential sandbox.
Getting started on Amazon EKS
To get started on EKS, use EKS Auto Mode. Add runtimeClassName to your pod spec, and EKS handles instance selection, Nitro component setup, and scheduling. Use confidential-sandbox for a confidential sandbox or isolated-sandbox if you do not need protection from node operators. For self-managed EKS, you will need a compatible Amazon Machine Image (AMI) to support Nitro Sandboxes.
To learn more about the EKS experience with Nitro Sandboxes, see the Amazon EKS blog post.
Getting started on Amazon ECS
You can use Nitro Sandboxes on ECS with ECS Managed Instances. ECS launches compatible EC2 instances in your account, sets up a fully configured Bottlerocket image, and runs each task in its own Nitro Sandbox. ECS supports the two isolation modes, CONFIDENTIAL_SANDBOX and ISOLATED_SANDBOX.
Each task reports its isolation mode in a read-only trustedExecutionSummary field when you describe it. Per-task security groups, VPC Flow Logs, Application Load Balancer, Network Load Balancer, and Amazon VPC Lattice work as before. To learn more about the ECS experience with Nitro Sandboxes, see the Amazon ECS Developer Guide.
Getting started on Amazon EC2
If you manage your own instances, or build your own platform, you can launch Nitro Sandboxes directly on nearly any instance built on the AWS Nitro System. Amazon Linux and Firecracker support Nitro Sandboxes today. We have started to upstream support for Nitro Sandboxes in Linux and other virtual machine monitors. We also worked with operating system vendor partners to add support early, so you can keep the stack your workload already depends on.
In addition to containers, Nitro Sandboxes serve as a building block for more in-instance virtualization use cases. Nitro Sandboxes support a special “Direct Mode” switch which disables attestation, but allows the parent to retain access to sandbox memory. We have seen early adopters use this mode to execute non-enlightened operating systems, including Windows or Android, in sandboxes. Other customers have used Nitro Sandboxes to create fully attested package build environments, where each built package receives a tamper-proof signature of its build inputs. See the Amazon EC2 User Guide for details.
Pricing and availability
Nitro Sandboxes, along with the EKS and ECS integrations, are available at no additional charge. You pay for the EC2 instances, plus the standard EKS Auto Mode or ECS Managed Instances management fee if you use those capabilities. Nitro Sandboxes run on nearly every EC2 instance, EKS cluster, and ECS cluster, so strong per-container, per-task, and in-instance isolation is available to everyone.
For more information, see the Nitro Sandboxes documentation in the Amazon EKS User Guide, the Amazon ECS Developer Guide, or the Amazon EC2 User Guide for direct use on EC2 instances.
About the authors
46% fewer nodes, 2× faster indexing: Confluent on Amazon OpenSearch Service
Post Syndicated from Sukanth Rajan original https://aws.amazon.com/blogs/big-data/46-fewer-nodes-2x-faster-indexing-confluent-on-amazon-opensearch-service/
Operating one of the world’s largest data-streaming platforms, Confluent, the company founded by the original creators of Apache Kafka and now part of IBM, continuously modernizes its infrastructure to stay ahead of rapid data growth. Confluent’s data-streaming products, including its Apache Kafka, Connect, and Flink fleets, are available on the AWS Cloud, and its internal logging system runs on Amazon OpenSearch Service, ingesting hundreds of terabytes of logs per day to support operations across that fleet.
At that ingest volume, indexing work dominates the hot tier. The question Confluent’s engineering team set out to answer was not “can we run on cheaper hardware,” but “how much more ingest can we absorb per node, and how much headroom does that free up?” This post shows how a measure-first migration of the OpenSearch hot tier to the purpose-built OpenSearch optimized instance type, oi2, improved indexing performance and ingestion headroom first. oi2 costs more per node, but we needed far fewer of them. The lower cost came from that efficiency, not from a lower instance price.
Why instance choice matters for ingestion
Confluent’s hot tier ran on r6gd, a previous-generation, general-purpose Graviton2 instance with local NVMe added as a bolt-on. The team migrated to the current-generation OpenSearch Optimized Instance family (oi2), purpose-built for OpenSearch. On oi2, local NVMe is the primary storage tier with no separate Amazon Elastic Block Store (Amazon EBS) volume. Data is copied synchronously to Amazon Simple Storage Service (Amazon S3) for durability, and the storage and network path is integrated specifically for indexing and merge I/O. For an ingest-bound logging workload, that storage path is the lever. It’s what lets each node sustain a higher indexing rate at lower latency.
A domain with OpenSearch Optimized Instances uses local storage as the primary tier, with data copied synchronously to Amazon S3 as it arrives. This provides increased indexing throughput with high durability (11 nines). Within the family, OR1, OR2, and OM2 use Amazon EBS volumes (gp3 or io1) locally, whereas oi2 instances use local NVMe disks. These instances benefit indexing-heavy operational analytics workloads such as log analytics, observability, and security analytics.
OpenSearch supports two replication strategies: logical (document) and physical (segment) replication. With logical replication, data is indexed on all the copies independently, leading to redundant computation on the cluster. OpenSearch Optimized Instances use the physical replication model, where data is indexed only on the primary copy. Additional copies are created by copying the segments from the primary (durably persisted to Amazon S3). Because this frees up compute resources on replicas that would otherwise redundantly index data, and network overhead on the primary, the cluster can churn more throughput. When Optimized Instances are configured with replicas, the indexing rate might appear lower than it actually is (for example, showing a rate of 1,000 when the actual indexing rate is 2,000). This is because indexing is only performed on primary shards.
Reference architecture
The following diagram shows the OpenSearch multi-domain topology, split by priority (P0/P1) and volume, behind Cross-Cluster Search.
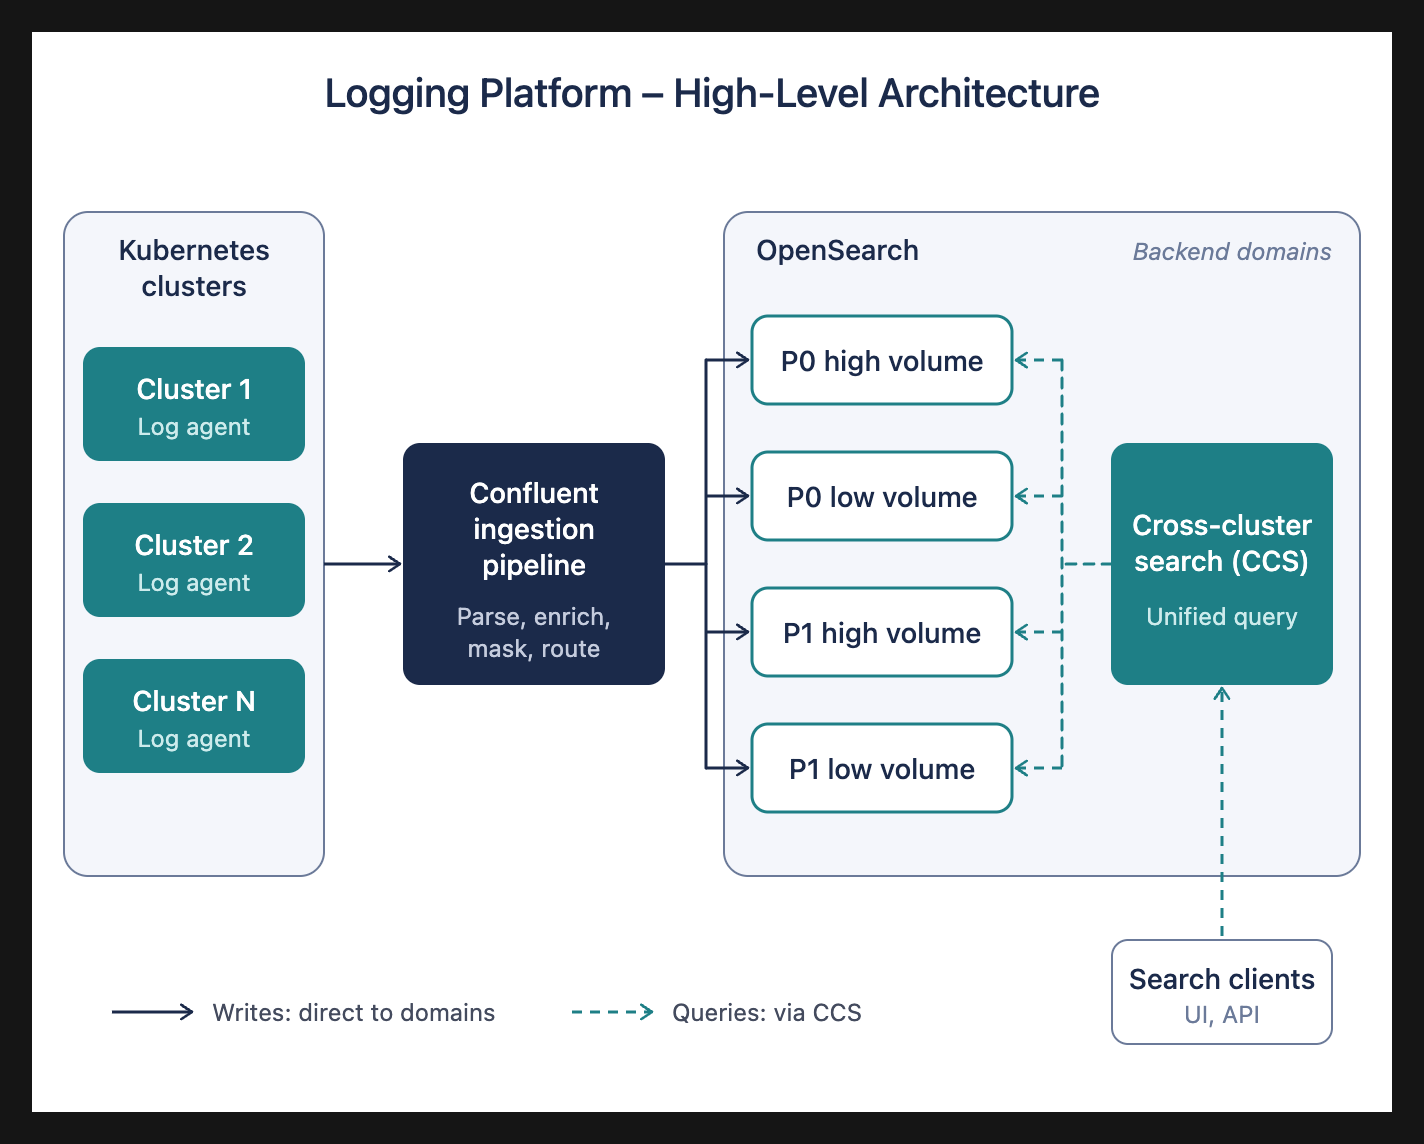
Figure 1: OpenSearch multi-domain topology, with writes going directly to the P0 and P1 domains and reads served through cross-cluster search
A measure-first approach
Each domain was modernized in two logical phases, so the efficiency of the new instance could be measured in production before capacity was removed:
- Phase 1, a type swap at constant node count: an in-place Amazon OpenSearch Service blue/green re-provision at the same node count, to measure real production efficiency at fixed ingest. At equal nodes, oi2 ran at roughly one-third the CPU of r6gd for the same ingest, about 2.7x the headroom per node.
- Phase 2, iterative rightsizing: nodes were removed in steps, holding at each step to confirm cluster health, until a guardrail became binding. That guardrail turned out to be JVM heap, not CPU, because heap pressure is driven by query patterns, and removing nodes concentrates the same shards onto fewer of them.
Spending the Phase 1 headroom this way let the fleet consolidate to roughly half the nodes. Each oi2 node carried about 1.9x the load of an r6gd node (168 ÷ 90), while indexing got faster, not slower.
Production results: Ingestion efficiency first
The following figures are production averages at the same ingest (7-day baseline on r6gd compared to a 24-hour window on oi2 at the final node counts). Because the log traffic is identical, the comparison reflects a real change per unit of work. We didn’t benchmark R8gd for this migration. Our evaluation focused on the OpenSearch optimized (oi2) family, which is built specifically for log-analytics ingestion and storage economics.

Figure 2: Total hot-tier fleet size, 168 r6gd nodes compared to 90 oi2 nodes, a 46% reduction
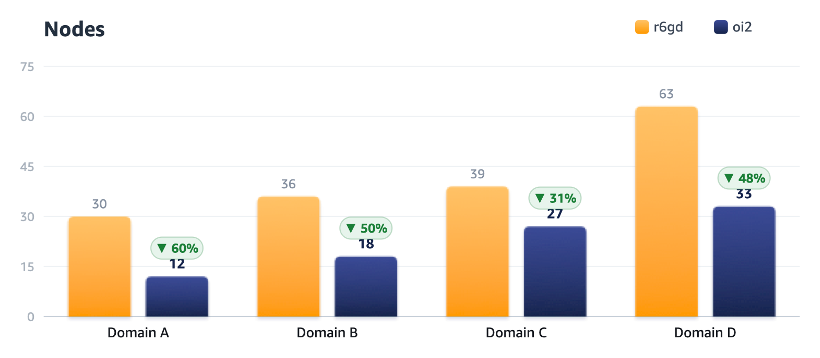
Figure 3: Node count per domain on r6gd compared to oi2, with reductions of 31 to 60 percent
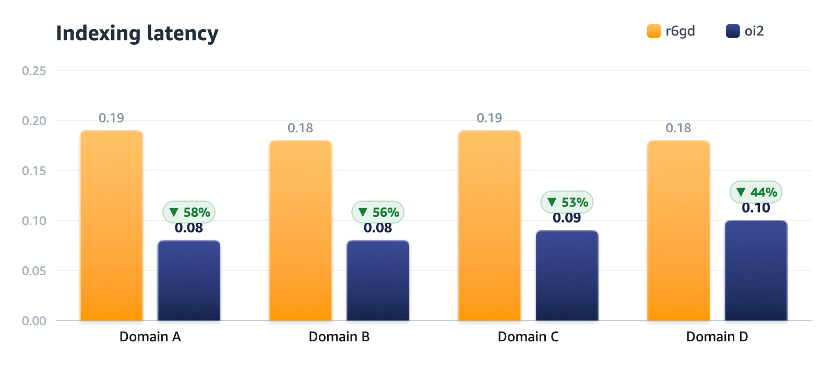
Figure 4: Average indexing latency per domain on r6gd compared to oi2, roughly halved across all four domains
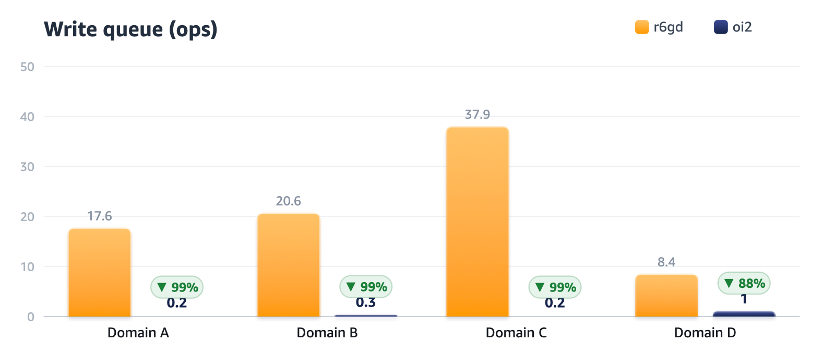
Figure 5: Write queue depth in queued operations per domain on r6gd compared to oi2, cleared to near zero
| Domain (anonymized) | Nodes | Avg CPU | Indexing latency | Write queue (ops) |
| Domain A (high-volume) | 30 → 12 (-60%) | 49% → 43% | 0.19 → 0.08 ms | 17.6 → 0.2 |
| Domain B (streaming logs) | 36 → 18 (-50%) | 60% → 40% | 0.18 → 0.08 ms | 20.6 → 0.3 |
| Domain C (high-volume) | 39 → 27 (-31%) | 58% → 39% | 0.19 → 0.09 ms | 37.9 → 0.2 |
| Domain D (low-volume) | 63 → 33 (-48%) | 43% → 56% | 0.18 → 0.10 ms | 8.4 → 1.0 |
| Fleet | 168 → 90 (-46%) | — | ~halved | <1 everywhere |
- Indexing latency roughly halved everywhere: approximately 0.18–0.19 ms on r6gd to approximately 0.08–0.10 ms on oi2, reflecting oi2’s faster storage path.
- Write backpressure cleared. Every r6gd domain carried a double-digit write queue (8–38 queued ops, the indexing-backpressure signal). On oi2, all four dropped below approximately 1. Faster storage keeps indexing current.
- CPU fell even on far fewer nodes for three of four domains, the clearest sign of per-node efficiency (for example, Domain B: 60% → 40% on half the nodes).
- Heap, not CPU, is the ceiling. oi2 has the same heap per node as r6gd, so concentrating shards onto fewer nodes raised average heap on every domain. This is what set the floor on rightsizing.
- The honest outlier. Domain D was cut the hardest relative to its load. Its CPU rose (43% → 56%) and its write queue, although far better, is the only one not near zero. It’s the domain to watch through peak traffic before calling it settled.
- Stability: zero write/primary-write rejections in the final state. All clusters healthy throughout.
In AWS internal benchmarks, oi2 instances deliver up to 9 percent higher indexing throughput than OR2 instances and up to 33 percent more than I8g instances. Each OpenSearch Optimized instance is provisioned with compute, third-generation AWS Nitro SSDs for caching, and remote managed storage on Amazon S3. The oi2 family is available in sizes from large through 24xlarge with up to 22.5 TB of storage.
To maximize indexing throughput from OpenSearch Optimized Instances, AWS recommends:
- Use large bulk sizes to improve buffer utilization. The recommended size is 10 MB.
- Use multiple clients to improve parallel processing performance.
- Consider more primary shards to raise indexing throughput, but note that over-sharding every index drives up per-node shard density and lowers it.
- Keep the index refresh interval at 10 seconds or higher (the default for Optimized Instances is 10 seconds).
Fewer nodes, lower bill — even at a higher per-node price
oi2 carries a higher per-node price than r6gd, so a like-for-like swap alone would have raised spend. The saving came entirely from needing fewer nodes: consolidating the hot tier by approximately 46 percent more than offset the premium, for an estimated approximately 18 percent lower hot-tier cost at on-demand pricing. Committing the final footprint to 1-year reserved instances is estimated to take the hot tier to roughly 47–51 percent below the original r6gd on-demand baseline.
Cost figures are approximate, list-derived percentages at on-demand pricing (reserved-instance figures are estimates pending a quoted rate). Storage (UltraWarm and snapshots) and dedicated-master tiers were unchanged and are excluded. The takeaway for teams modernizing OpenSearch: optimize efficiency per unit of work, not instance unit price.
Conclusion
With the measure-first approach in two phases, Confluent raised ingestion efficiency and halved indexing latency on its Amazon OpenSearch Service cluster. Before removing any capacity, let the real sizing signal (heap in this case) guide the optimization work. This approach is what improved the efficiency of the system and lowered the overall cost. The same measure-first approach applies to ingest-bound OpenSearch workloads evaluating purpose-built storage-optimized instances. To learn more, see the Amazon OpenSearch Service documentation on instance types and sizing domains.
Related information
- Amazon OpenSearch Service — OpenSearch Optimized Instances (OR1, OR2, OM2, OI2)
- Amazon OpenSearch Service announces new OI2 instances (What’s New, Dec 17, 2025)
- Amazon OpenSearch Service — supported instance types
- Amazon OpenSearch Service — sizing domains
- AWS Big Data Blog — OpenSearch Service Under the Hood: OpenSearch Optimized Instances (OR1)
About the authors
Three new stable kernels for Tuesday
Post Syndicated from jzb original https://lwn.net/Articles/1106569/
Greg Kroah-Hartman has released the 7.3.4,
6.18.63, and 6.12.117 stable kernels. The 7.3.4 kernel has more
than 1,250 patches, 6.18.63 contains more than 860, and 6.12.117 includes more
than 1,530 patches. Users of these kernels are, of course, encouraged to upgrade.
Digital sovereignty at re:Invent 2026: Sessions you won’t want to miss
Post Syndicated from Baqir Naqvi original https://aws.amazon.com/blogs/security/digital-sovereignty-at-reinvent-2026-sessions-you-wont-want-to-miss/
AWS re:Invent returns to Las Vegas for cloud and AI’s biggest week from November 30–December 4, 2026. This year we have over 2,200 sessions, 70 percent of which are interactive, led by experts from Amazon Web Services (AWS), our customers, and our partners.
With that much to choose from, we’ve pulled together the sessions built around Digital Sovereignty at AWS. Whether you’re navigating evolving data residency requirements, choosing the right home for your most sensitive workloads, or scaling AI in environments where your data can’t leave the jurisdiction, there’s something for you at re:Invent.
In this guide, you’ll find breakout sessions, chalk talks, workshops, and a lightning talk covering a range of digital sovereignty topics, grouped by theme so you can easily find what matters most to you. Reserve your seat through your attendee portal, or walk up based on availability. If a session is full, check the catalog for another time, since several of these sessions run more than once.
Pro tip: Sessions are spread across several venues, so allow extra time to get between them. All times are Pacific.
Theme 1: Control, choice and operational autonomy with the AWS European Sovereign Cloud
In 2026, we launched the AWS European Sovereign Cloud, giving customers another option to help meet their most stringent digital sovereignty requirements. As part of its design, the AWS European Sovereign Cloud operates with no critical dependencies on non-EU infrastructure, and is backed by strong technical controls, sovereign assurances, and legal protections. In these sessions, get the full picture of the AWS approach to digital sovereignty, including verifiable controls, operational autonomy, and greater choice with infrastructure options like the AWS European Sovereign Cloud.
SEC206 | Breakout session | Digital sovereignty: Verifiable controls and greater choice
Speakers: Mustafa Isik, Chief Technologist Sovereignty, AWS; Stephane Israel, Managing Director European Sovereign Cloud and Digital Sovereignty, AWS
When and where: Thursday, December 3, 1:00 PM | Wynn/Encore
Evolving regulations and geopolitical shifts are prompting organizations to rethink how they protect data and maintain control in the cloud, without slowing innovation and AI adoption. This session explores how AWS helps customers meet their digital sovereignty requirements with the full power of the cloud through a range of offerings, including the AWS European Sovereign Cloud, backed by verifiable and auditable controls. Learn what AI sovereignty means in practice, get answers to the most common questions, and hear how AWS and partners are helping organizations navigate complexity in a fast-changing landscape.
SEC234 | Lightning talk | EU operational autonomy in action: AWS European Sovereign Cloud
Speakers: Zoltan Albrecht, Director, AWS European Sovereign Cloud Managed Operations, AWS
When and where: Thursday, December 3, 8:30 AM | Wynn/Encore
The AWS European Sovereign Cloud is built on fully isolated infrastructure within the EU, operated exclusively by EU-resident staff, with no access from outside Europe. In this lightning talk, learn from the AWS European Sovereign Cloud Managed Operations team what independent operations means in practice and how it works day to day.
Theme 2: AI under digital sovereignty and data residency requirements
Moving AI from pilots to production means making clear decisions about where your data and AI workloads run to meet your digital sovereignty needs. These sessions show how to bring AI infrastructure to your data, from fully managed AWS AI Factories in your data center, to the right hybrid deployment for each workload, to agentic AI applications that extend to hybrid and edge environments such as AWS Outposts and AWS Local Zones.
AIM206 | Breakout session | AWS AI Factories: Bring production scale AI to your data center
Speakers: Pranav Chachra, Senior Manager, Product Management, AWS; Gareth Tucker, Global Specialist – AWS AI Factories, AWS; Daniel Xu, Member of Technical Staff, Anthropic
When and where: Thursday, December 3, 10:30 AM | Venetian
Data sovereignty, data gravity, and latency requirements prevent many organizations from running all AI workloads in the public cloud. AWS AI Factories bring AWS and NVIDIA AI infrastructure directly into your data center, fully operated, maintained, and continuously updated by AWS. Run leading foundation models on premises for training and inference without building and managing AI infrastructure yourself or negotiating separate agreements with model providers. In this session, learn how organizations are accelerating AI adoption, reducing time to value, and maintaining full control of their data while benefiting from the AWS experience in their own facilities.
HMC303 | Breakout session | Choosing the right hybrid deployment for your AI workloads
Speakers: Shivam Saggar, Sr. Product Manager (Tech), AWS; Chris McEvilly, Senior Solutions Architect, AWS; Shelby Seward, DMTS, Sr. Director, T-Mobile; Hai Lu, Senior Engineering Manager, Databricks, Inc.
When and where: Monday, November 30, 9:00 AM | MGM Grand
Organizations are running AI workloads for model training, fine-tuning, reinforcement learning and inference, across an expanding set of environments, including AWS Regions, AWS Local Zones, AWS Outposts, AWS Dedicated Local Zones, and AWS AI Factories. The right deployment option depends on latency, data sovereignty, compute density, and scale. See how customers deploy accelerated AI across the hybrid spectrum: NVIDIA GPU-based and AWS Trainium-powered instances in Local Zones, purpose-built AWS AI Factories for large-scale training and model serving, and edge deployments for real-time inference. Hear how customers navigate these decisions, including Databricks tapping GPU capacity on AWS Local Zones and T-Mobile running latency-sensitive distributed inference, and learn which environment fits each AI workload without compromising performance and compliance.
HMC402 | Workshop | Implementing agentic AI solutions on-premises and at the edge
Speakers: Kyle Palasti, Edge Specialist Solutions Architect, National Security, AWS; Fernando Galves, Senior Applied AI Architect, AWS
When and where: Wednesday, December 2, 3:30 PM | Wynn/Encore
Repeat: Thursday, December 3, 3:00 PM | Caesars Palace
Learn how to extend Amazon Bedrock AgentCore to hybrid and edge services to build distributed agentic apps using Model Context Protocol (MCP) and agent-to-agent (A2A) communication with on-premises data. Get hands-on with hybrid agentic AI using Amazon Bedrock and Strands Agents while exploring AWS hybrid and edge solutions for data residency compliance.
HMC403 | Workshop | Self-managed agentic AI at the hybrid edge
Speakers: Fernando Galves, Senior Applied AI Architect, AWS; Chris McEvilly, Senior Solutions Architect, AWS
When and where: Tuesday, December 1, 12:30 PM | MGM Grand
Repeat: Thursday, December 3, 8:30 AM | MGM Grand
As organizations use agentic AI to automate complex infrastructure operations, many have data residency, low latency, and security requirements that depend on running AI closer to their data. This workshop explores how customers deploy self-managed agentic AI at the hybrid edge to meet these requirements while enabling autonomous operations. Learn how to architect, provision, configure, and optimize AI agents that run locally, and how to extend the same architecture to AWS hybrid and edge infrastructure such as AWS Local Zones and AWS Outposts.
Theme 3: More control, more choice: Finding the right infrastructure for your digital sovereignty needs
Digital sovereignty requirements vary, and AWS offers control and choice across a range of deployment options. Whether you’re comparing AWS Dedicated Local Zones, AWS Outposts, the AWS European Sovereign Cloud, and AWS Regions, or planning a migration, you’ll find the infrastructure options to meet your unique digital sovereignty needs. These sessions help you learn more and choose with confidence.
HMC314 | Chalk talk | Architecting for digital sovereignty with AWS Hybrid Cloud solutions
Speakers: Sherry Lin, Principal Product Manager, AWS; Lakshmi VP, Solutions Architect – WWPS, AWS
When and where: Wednesday, December 2, 8:30 AM | MGM Grand
This session uses real-world case studies to understand how AWS hybrid cloud architectures such as AWS Local Zones, AWS Dedicated Local Zones, and AWS Outposts help customers meet their digital sovereignty needs. It examines data residency boundaries, network separation, operational controls, and security guardrail options available in hybrid cloud solutions. It then shows how to configure governance controls, including Service Control Policies (SCPs), to help customers comply with regulatory requirements. Finally, it covers how to detect and prevent unauthorized data flows between hybrid infrastructure and the parent Region.
HMC202 | Breakout session | AWS wherever you need it: From the cloud to the edge
Speakers: Spencer Dillard, Director, Software Dev, EC2, AWS; Ian Cottingham, Director, Software Development, AWS; Rama Raghavan, AVP Cloud Architecture, AT&T Inc.
When and where: Wednesday, December 2, 3:00 PM | Caesars Palace
While most workloads can run in the cloud, some remain on-premises or at the edge due to low latency, local data processing, or data residency needs. AWS Local Zones, AWS Outposts, AWS Dedicated Local Zones, and AWS AI Factories extend AWS services, APIs, and tools to metro areas, on-premises data centers, and the far edge. Explore how these infrastructure offerings power a broad range of hybrid cloud and edge computing use cases such as financial trading, manufacturing, and AI. Learn how AWS helps you run regulated workloads with edge requirements, power generative AI with edge data, and migrate workloads with on-premises dependencies, featuring AT&T’s migration and modernization at scale.
HMC304 | Breakout session | Real-world migrations: Lessons learned migrating to AWS Outposts
Speakers: Frankie Negro, Senior Hybrid Edge Solutions Architect, AWS; Scott Rose, Senior Manager Solution Architecture – Telco, AWS; Marcelo Andrade, Cloud Engineer, SERPRO
When and where: Monday, November 30, 10:00 AM | MGM Grand
Organizations with data residency and digital sovereignty requirements face a critical question: how do you move workloads from on-premises infrastructure to AWS Outposts without disrupting compliance posture or operations? This Level 300 session distills lessons from migrating customers to Outposts across industries, organization sizes, and migration strategies, featuring SERPRO, Brazil’s federal data processing company, and AT&T, migrating telecom workloads at scale. The session walks through the processes that delivered results, the quantifiable outcomes measured, and the critical mistakes to avoid. Learn how to select the right migration approach and navigate common blockers. The session also covers transitioning from first-generation to second-generation Outposts hardware.
Theme 4: Disaster recovery, resilience, and cross-partition connectivity
Digital sovereignty goes beyond where your data lives. It also shapes how you operate, recover, and connect your workloads. These sessions help you learn about the operational side of digital sovereignty: recovering from failures under regulatory requirements, designing for resilience alongside data residency, and strategies for connecting across global AWS Regions, GovCloud, the AWS European Sovereign Cloud, and China Regions.
ARC405 | Breakout session | Your regulator set your RTO. Not your architecture.
Speakers: Hossam Ebrahim, Solutions Architect, AWS; Paul Armstrong, Lead Architect UKI, AWS
When and where: Tuesday, December 1, 4:00 PM | Wynn/Encore
Organizations with pre-approved failover regions recover in hours. Those without recover in weeks. Same impairment. Same services. One governance decision separates them, and it’s made years before the event. This session presents architectural patterns for multi-Region recovery under sovereignty constraints, drawn from real operational experience with regulated workloads under regional pressure. Three categories: decisions that set your resilience ceiling before any event, dependencies that create circular failure during recovery, and assets nobody backs up until they become the critical path. You leave with the decisions to evaluate before your next DR test.
ARC318 | Chalk talk | Architecting for resilience and data residency
Speakers: Andy Orlosky, AWS Solutions Architect, AWS; Mike Haken, Senior Principal Solutions Architect, AWS; Jamie Pasterick, Senior Solutions Architect, AWS
When and where: Monday, November 30, 2:30 PM | Wynn/Encore
Repeat: Wednesday, December 2, 1:30 PM | Wynn/Encore
Your data can’t leave the jurisdiction, but your workload still has to survive a Region degradation. This chalk talk explores architecture patterns that address both resilience and data residency together. We break the challenge into practical layers: where data lives, how workloads recover, what isolation looks like, and how to maintain business continuity across geographic boundaries. We map each layer to AWS capabilities including Dedicated Local Zones, Outposts, and policy controls, then work through real scenarios together. Bring your architecture challenges and we will whiteboard design patterns and tradeoffs with you.
NET327 | Breakout session | Connectivity strategies across AWS Partitions
Speakers: Kunal Sharma, Sr. Solutions Architect, AWS; Rohit Aswani, Principal Solutions Architect – Networking Specialist, AWS
When and where: Wednesday, December 2, 4:00 PM | MGM Grand
Organizations increasingly operate across AWS commercial, GovCloud, Sovereign Cloud, and China Regions to satisfy regulatory, data residency, and national security requirements. But connecting them introduces networking challenges that go well beyond standard multi-Region design. In this session, learn cross-partition connectivity patterns using AWS Site-to-Site VPN, AWS Direct Connect, and application-layer proxies alongside DNS resolution strategies, compliance boundary enforcement, and operational trade-offs. We walk through architectural blueprints for securely linking partitions while preserving the isolation guarantees they exist to enforce, and share lessons learned from customers navigating ITAR, GDPR, and national sovereignty mandates at scale.
Theme 5: Digital sovereignty across industries
Priorities for digital sovereignty vary by industry, and are shaped by different regulations, risks, and requirements. Learn how organizations in government, energy, and telecommunications are meeting their unique needs with the control, choice, and scale of AWS.
IND361 | Workshop | Build hybrid data planes for government GenAI pipelines
Speakers: Mohamed Salah, Sr. Solutions Architect, AWS; Usama Salama, Sr. Specialist SA AI/ML, AWS
When and where: Monday, November 30, 3:30 PM | Wynn/Encore
Strict national security mandates block government agencies from adopting cloud GenAI. To resolve this, architects deploy a decoupled edge-to-cloud tokenization pattern. In this workshop, use AWS CDK to build a three-phase data plane that isolates sensitive citizen data in a simulated edge environment. You will deploy local data tokenization, route masked payloads to Amazon Bedrock for stateless inference, and reconcile state on-premises. Leave with an infrastructure-as-code blueprint to unlock frontier AI and satisfy federal localization mandates.
IND359 | Chalk talk | In-Country HPC: How TGS Processes Seismic Data on AWS Brazil
Speakers: Kun Jiao, Principal Solutions Architect, AWS; Faisal Asif, Global Head, Cloud Transformation and Innovation, TGS
When and where: Monday, November 30, 9:00 AM | Wynn/Encore
Repeat: Tuesday, December 1, 12:00 PM | Wynn/Encore
TGS — one of the world’s largest multi-client geoscience data providers — faced a significant cost challenge running its business-critical Rackmon EFWI GPU workload at scale. By strategically deploying this workload on AWS infrastructure in Brazil, TGS leveraged Brazil’s ReData Special Tax Regime to dramatically reduce the tax burden on GPU-intensive seismic processing. The result: material cost savings on one of the most computationally demanding workloads in the energy industry — and a reusable in-country processing architecture that can serve future customers with data residency requirements in other geographies.
IND322 | Chalk talk | Physical AI in Telecom: A Framework for Workload Placement
Speakers: Young Jung, Sr. Manager of Telco Network SA, AWS; Angelo Sampietro, Principal Solutions Architect, AWS; Umer Chaudhary, Sr. Mgr Network Solutions, AWS
When and where: Tuesday, December 1, 1:30 PM | Caesars Forum
Repeat: Tuesday, December 1, 3:00 PM | Caesars Forum
Some physical AI workloads need sub-millisecond performance at edge cell sites, others are better suited to a full AWS Region, and many fall in between on AWS Local Zones or AWS Outposts. In this chalk talk, we provide a framework for matching each workload to the right option. We trace the physical AI development lifecycle, examining how data sovereignty, latency, data gravity, and token economics interact to shape placement decisions at each phase. Based on real-world use cases, we discuss the options so you leave with a placement framework you can apply immediately.
You can view the full list of digital sovereignty sessions in the re:Invent catalog, including sessions with partners.
Activities in the Expo
Join us in the re:Invent Expo at the Venetian to meet with AWS experts and learn through interactive demos. Stop by these kiosks in the AWS Village:
- Digital Sovereignty: Learn more about Digital Sovereignty at AWS and the choice and control we offer across the cloud and AI. Use the AWS Digital Sovereignty Lens to get extended guidance for designing, building, and operating sovereign workloads on AWS, see how AWS helps your organization innovate with AI while meeting your sovereignty needs, and go deep on the AWS European Sovereign Cloud with AWS experts.
- Hybrid Cloud & Edge Computing: See how to run familiar AWS services, APIs, and tools you use in AWS Regions on premises and at the edge with AWS Local Zones, AWS Dedicated Local Zones, AWS Outposts, and AWS AI Factories. Bring a workload that needs to stay local, and AWS experts will walk through its architecture with you.
- Global Infrastructure & Sustainability: Explore the scale and reach of the world’s most extensive cloud infrastructure including AWS Regions, Availability Zones, AWS Local Zones, AWS Outposts, and AWS AI Factories. Discover the latest infrastructure innovations and how AWS Sustainability helps you scale workloads globally while minimizing your environmental impact.
- Data Center Experience: See the technology inside AWS data centers firsthand, from custom chips to full server racks, and explore a 3D model of an AWS AI Factory.
Get ready for re:Invent 2026
Here’s how to prepare for the digital sovereignty sessions:
- Register for AWS re:Invent 2026. Don’t have a ticket yet? Use the discount code REINVENT26 for $150 off a full conference pass. The code expires on November 23, 2026, and can’t be combined with any other offers or discounts.
- Reserve your seats where available in the re:Invent portal.
- Download the AWS Events mobile app to build your schedule.
- Join the conversation on social media using #reInvent.
Note: Session schedule and availability are subject to change. Check the AWS re:Invent Session Catalog for the most up-to-date information.
Stay connected: Join the #reInvent conversation on social media and connect with other attendees!
See you in Las Vegas!
AMD EPYC 9006 Results Are Here and AMD Delivers a Knockout Part Deux
Post Syndicated from Patrick Kennedy original https://www.servethehome.com/amd-epyc-9006-results-are-here-and-amd-delivers-a-knockout-part-deux/
The day is finally here for the launch of AMD’s EPYC 9006 “Venice” platform and the Zen 6 CPU architecture. AMD has been hard at work over the past two years to build a better server CPU, and thanks to its performance, Venice is primed to deliver another knockout blow for AMD
The post AMD EPYC 9006 Results Are Here and AMD Delivers a Knockout Part Deux appeared first on ServeTheHome.
Self-service regional failover with Amazon Application Recovery Controller Region Switch and centralized ingress controls
Post Syndicated from Greg Willson original https://aws.amazon.com/blogs/architecture/self-service-regional-failover-with-amazon-application-recovery-controller-region-switch-and-centralized-ingress-controls/
In highly regulated industries such as financial services, healthcare, and government, security isn’t negotiable. Compliance frameworks require defense in depth strategies where incoming requests are inspected against security policy to confirm they are safe before reaching applications.
Organizations typically solve this challenge by implementing centralized ingress proxy fleets: hardened entry points that enforce consistent authentication, authorization, threat detection, and audit logging across hundreds of applications.
For critical applications that use regional services and need to operate multi-Region disaster recovery (DR) strategies, this creates a challenge. These applications must regularly demonstrate failover capability, not only to prove DR works, but to satisfy auditor expectations for tested, repeatable recovery procedures. Yet with centralized ingress controls in place, the teams accountable for recovery time objective (RTO) commitments often cannot independently execute failover. They depend on centralized infrastructure teams who might be handling many similar requests simultaneously. This introduces coordination overhead, extends recovery times, and conflicts with the DevOps principle of “you build it, you run it.” Scale this to dozens of interdependent applications and the problem compounds. Individual team recovery is necessary, but without coordinated portfolio-level failover, the enterprise remains exposed.
The challenge isn’t whether to implement defense in depth, which is non-negotiable, but how to preserve application team autonomy, support self-service failover within the constraints of centralized enterprise ingress controls, and ultimately orchestrate coordinated recovery across the portfolio.
In this post, we show how application teams in regulated enterprises can execute self-service regional failover using Amazon Application Recovery Controller (ARC) Region Switch, even when operating behind centrally managed ingress proxy fleets. The pattern uses AWS Transit Gateway peering, Amazon Route 53 Private Hosted Zones, and (optionally) Amazon VPC Lattice to maintain security controls while removing cross-team coordination during DR events. We then demonstrate how a central parent plan can run each application team’s child plan, shared through AWS Resource Access Manager (AWS RAM), to support coordinated portfolio-level failover. A single central action runs dependent plans across the enterprise in dependency order, delivering deterministic, fully automated recovery orchestration that replaces the manual coordination of today’s DR playbooks.
Why ARC Region Switch?
Launched in August 2025, Amazon Application Recovery Controller Region Switch is purpose-built for disaster recovery orchestration. Custom scripts and home-grown automation must be built, tested, and maintained independently, often across multiple AWS Regions with no guarantee of synchronization. Region Switch is a fully managed, highly available failover orchestrator that removes the undifferentiated heavy lifting of DR operations.
Effective disaster recovery orchestration for enterprise applications has to overcome three common challenges. The following table describes each one and how Region Switch addresses it.
| DR challenge | How ARC Region Switch addresses it |
| Configuration drift. A recovery plan written months ago might no longer match the environment it protects. Permissions change, resources are renamed, and standby capacity shrinks, and teams often only find out mid-failover. | Plan evaluation. Region Switch automatically evaluates your plan’s configuration, AWS Identity and Access Management (IAM) permissions, and resource readiness multiple times per hour, surfacing issues before they block a recovery. Warnings are visible on the console and available through Amazon EventBridge or the API. |
| Slow detection and decision-making. In a real incident, time is lost noticing the problem, assembling the right people, and agreeing to fail over. All of it adds to your RTO. | Automatic triggering. Plans can be initiated automatically from Amazon CloudWatch alarms, removing the time to detect and time to decide from your effective RTO. Teams that want a human checkpoint can add a manual approval step. |
| Recovery logic that drifts across Regions. Multi-step recovery is often scripted separately for each Region. The scripts diverge, are hard to review, and fail silently when they’re finally needed. | Codified recovery workflows. Plans are fully codifiable with AWS CloudFormation, the CLI, and the API, so they’re version-controlled and deployed through your existing continuous integration and continuous delivery (CI/CD) pipelines alongside the application. The visual Workflow Builder helps teams design and modify recovery steps, with the ability to export the configuration back into your infrastructure as code (IaC) pipeline. |
A Region Switch plan isn’t bound to a single Region. Its execution engine operates independently in each Region, keeping the failover orchestrator outside the blast radius of the very impairment it’s responding to.
The solution: Self-service regional failover with ARC Region Switch
Application teams create a plan in the ARC Region Switch Workflow Builder that includes task-specific execution blocks: automated steps that handle different aspects of the failover activity. A typical plan might include execution blocks to promote database read replicas, scale compute resources (Amazon Elastic Compute Cloud (Amazon EC2) Auto Scaling groups, EKS pods, or ECS tasks), manipulate Route 53 health checks to redirect traffic, and invoke custom AWS Lambda functions for application-specific logic.
When the team runs a Region Switch plan, whether for a DR test or during an actual incident, ARC runs this workflow from the recovery Region automatically, orchestrating the entire failover sequence without requiring manual intervention from application teams.
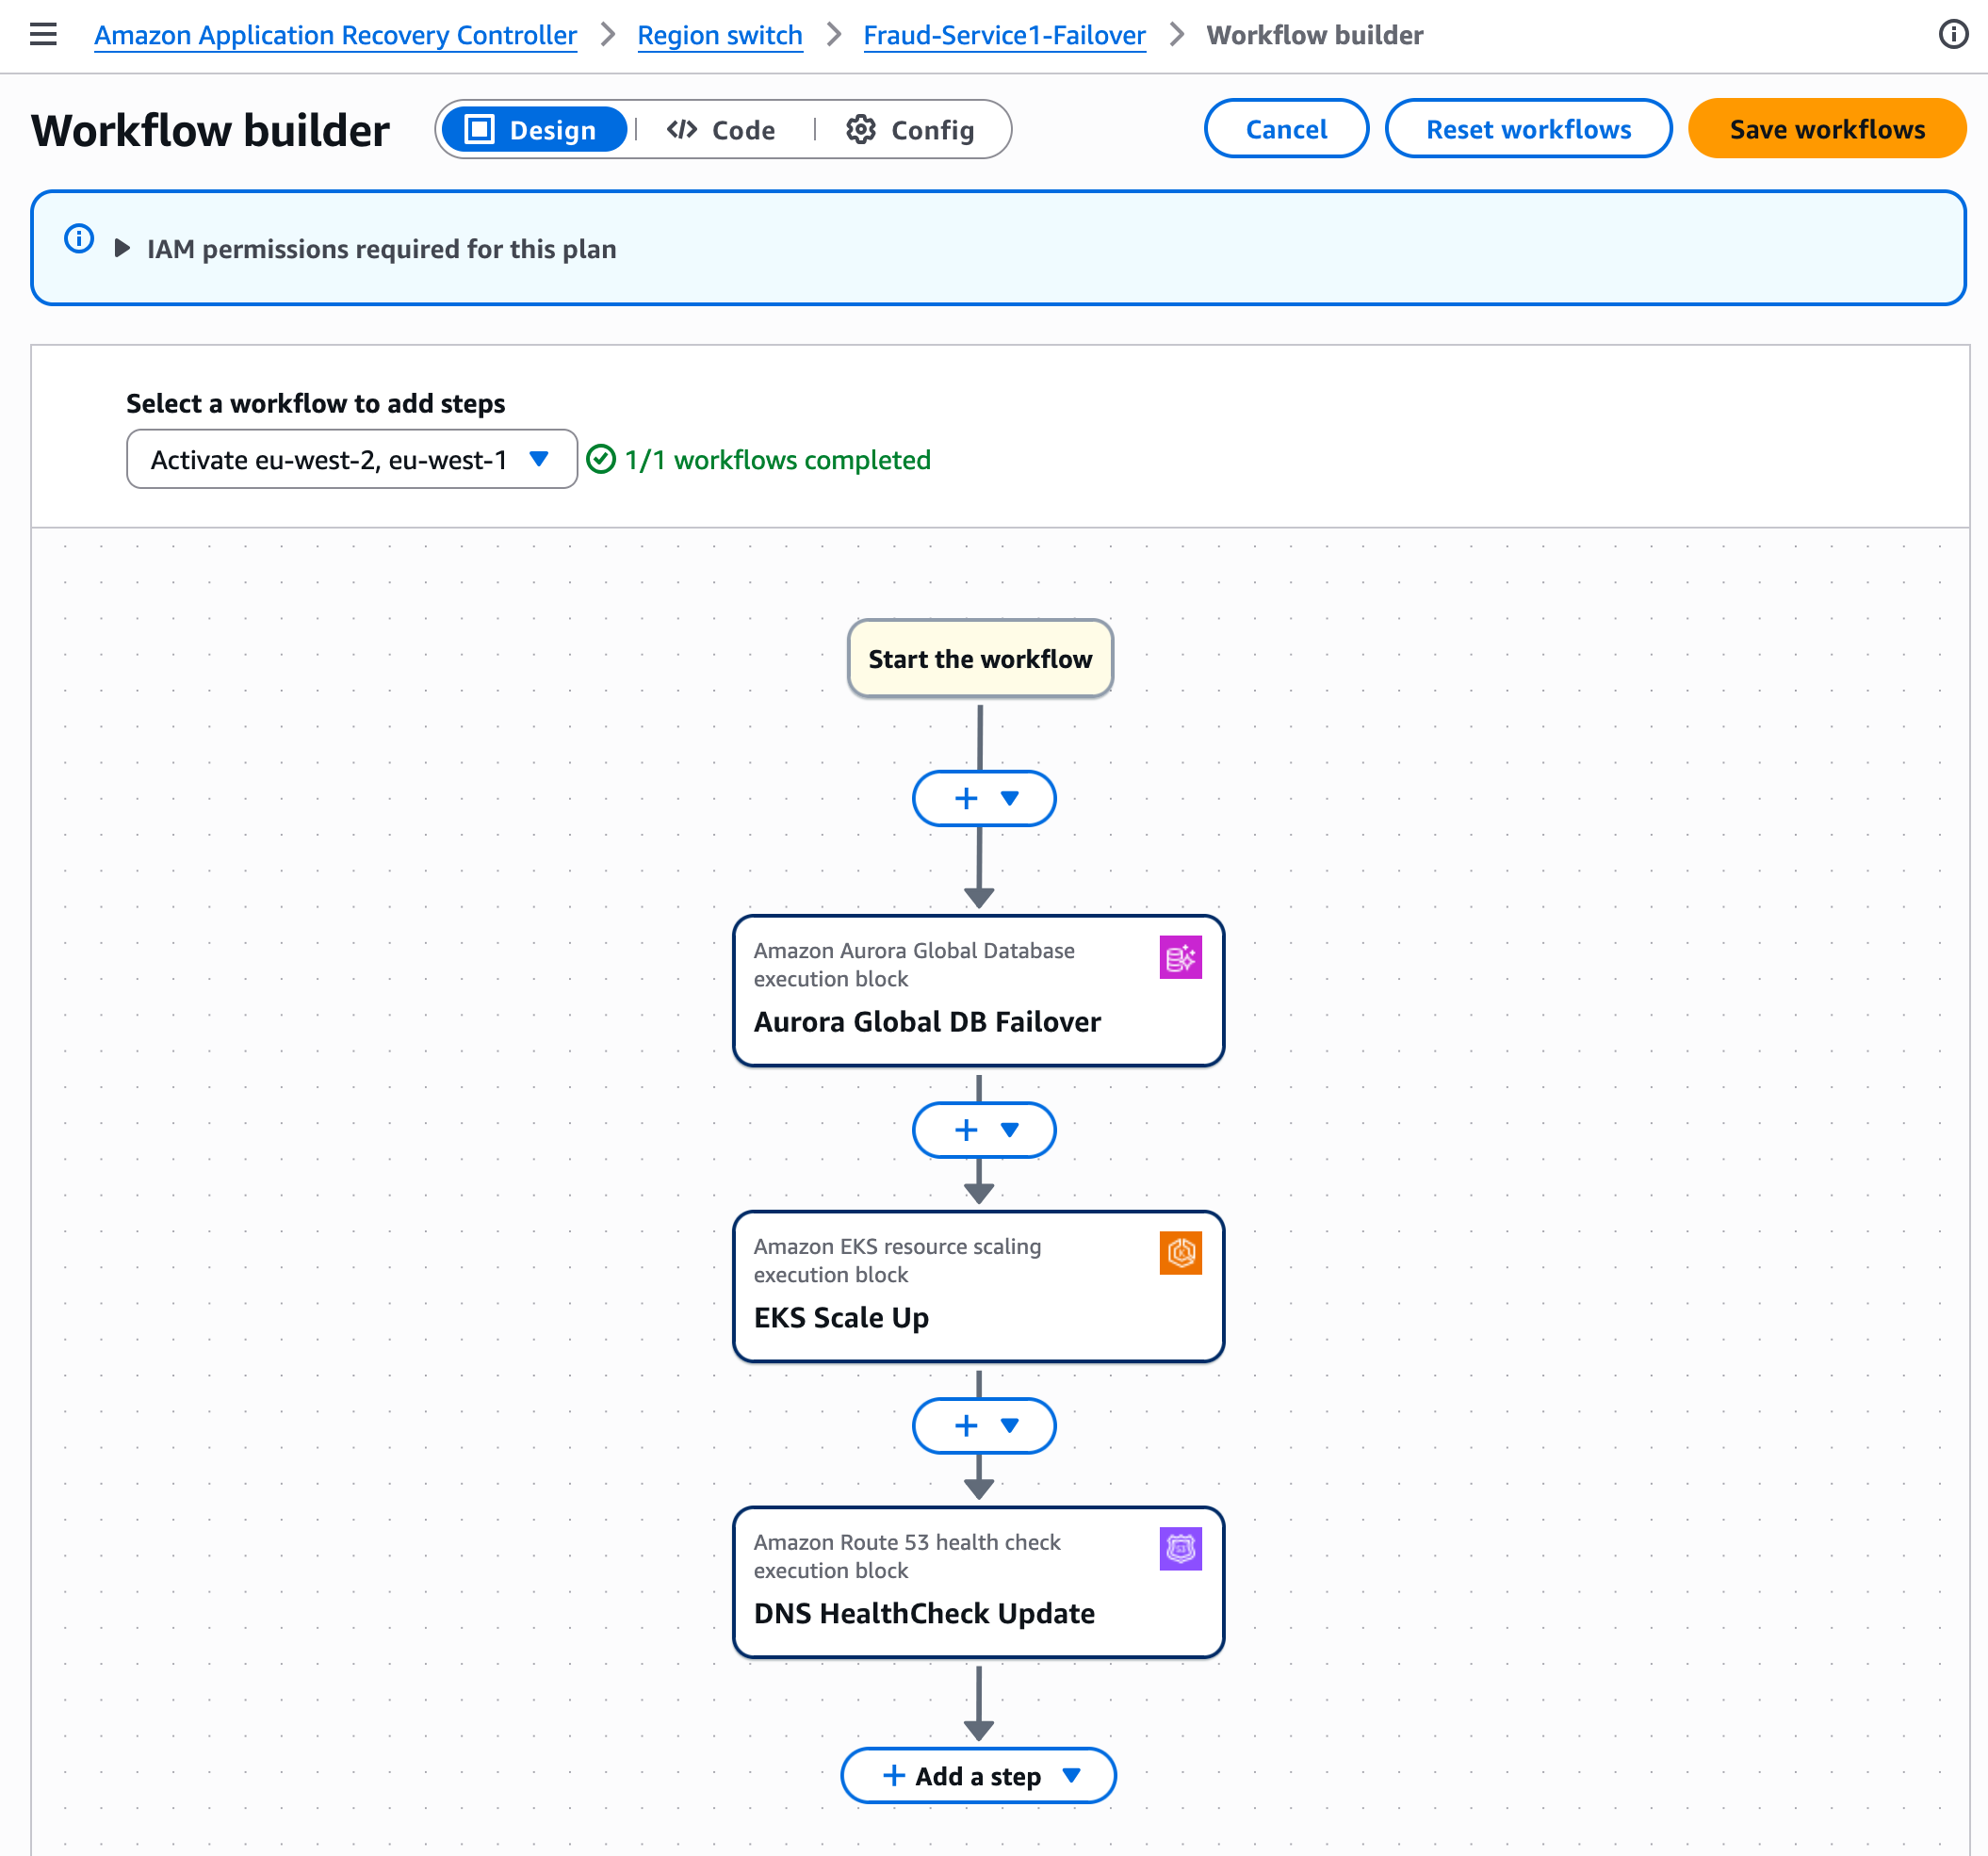
Figure 1: ARC Region Switch runs a plan’s execution blocks from the recovery Region to orchestrate failover
To understand how ARC Region Switch supports this self-service capability within the constraints of centralized ingress controls, we need to examine the underlying infrastructure. The architecture relies on a shared responsibility model where infrastructure and application teams each control distinct layers of the stack, creating clear boundaries that preserve security while supporting operational independence.
Building the foundation: Centralized networking with decentralized control
The architecture rests on two foundational elements: centrally managed AWS Transit Gateways and an application-team-owned Amazon Route 53 Private Hosted Zone (PHZ).
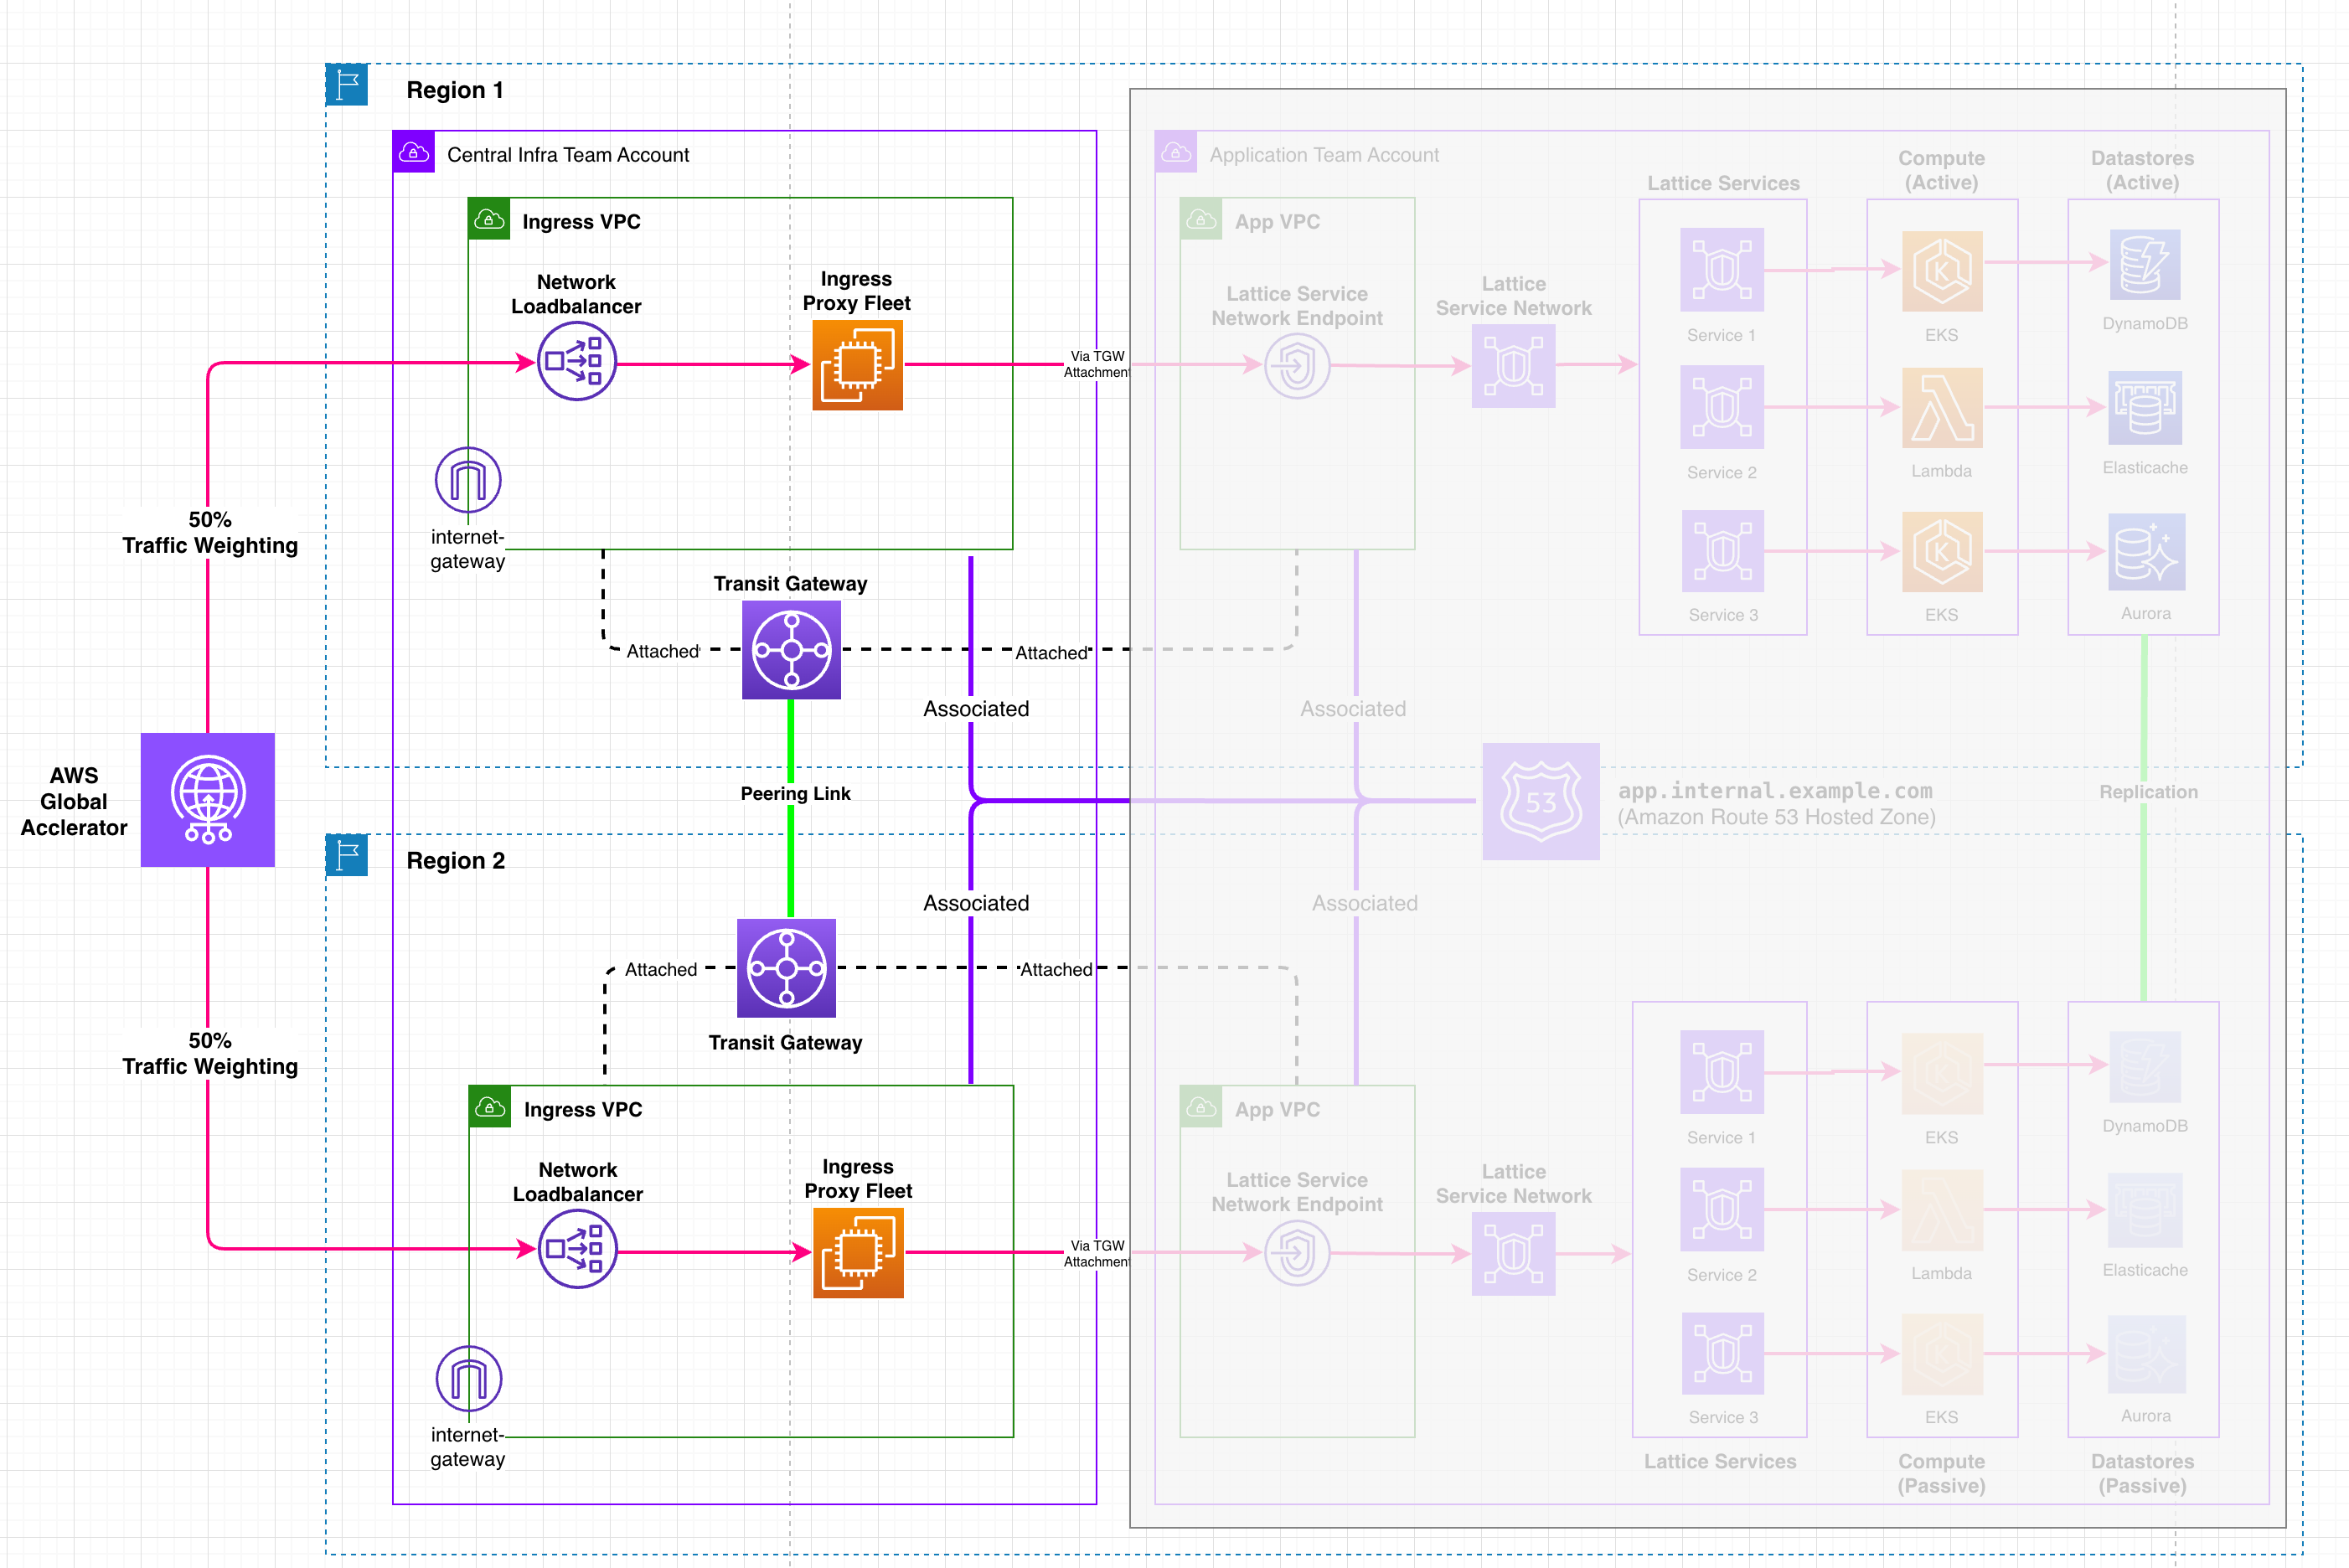
Figure 2: Centrally managed Transit Gateways with an application-team-owned Route 53 Private Hosted Zone
A central infrastructure team owns and manages the peered Transit Gateway infrastructure in both AWS Regions, providing VPC attachments to each application team account so traffic can flow from their secure ingress proxy solution. The application team owns and manages a Route 53 PHZ, associated with all four VPCs: both the infrastructure team’s centralized ingress proxy fleet VPCs and the application team’s own VPCs in each Region. This PHZ contains a failover recordset that the ingress proxy fleet uses to resolve the active application endpoint.
This establishes a clear technical boundary. The infrastructure team provides the secure networking foundation and VPC attachments. The application team controls the Domain Name System (DNS) records that determine where traffic flows. Neither team needs to coordinate changes with the other during failover events.
Understanding the multi-Region architecture
To understand how these components work together, let’s examine the complete architecture. The following diagram illustrates the multi-Region design, showing how AWS Global Accelerator, cross-Region AWS Transit Gateway peering, Amazon VPC Lattice, and Amazon Route 53 Private Hosted Zones combine to support self-service failover through Amazon ARC Region Switch while maintaining centralized security controls.
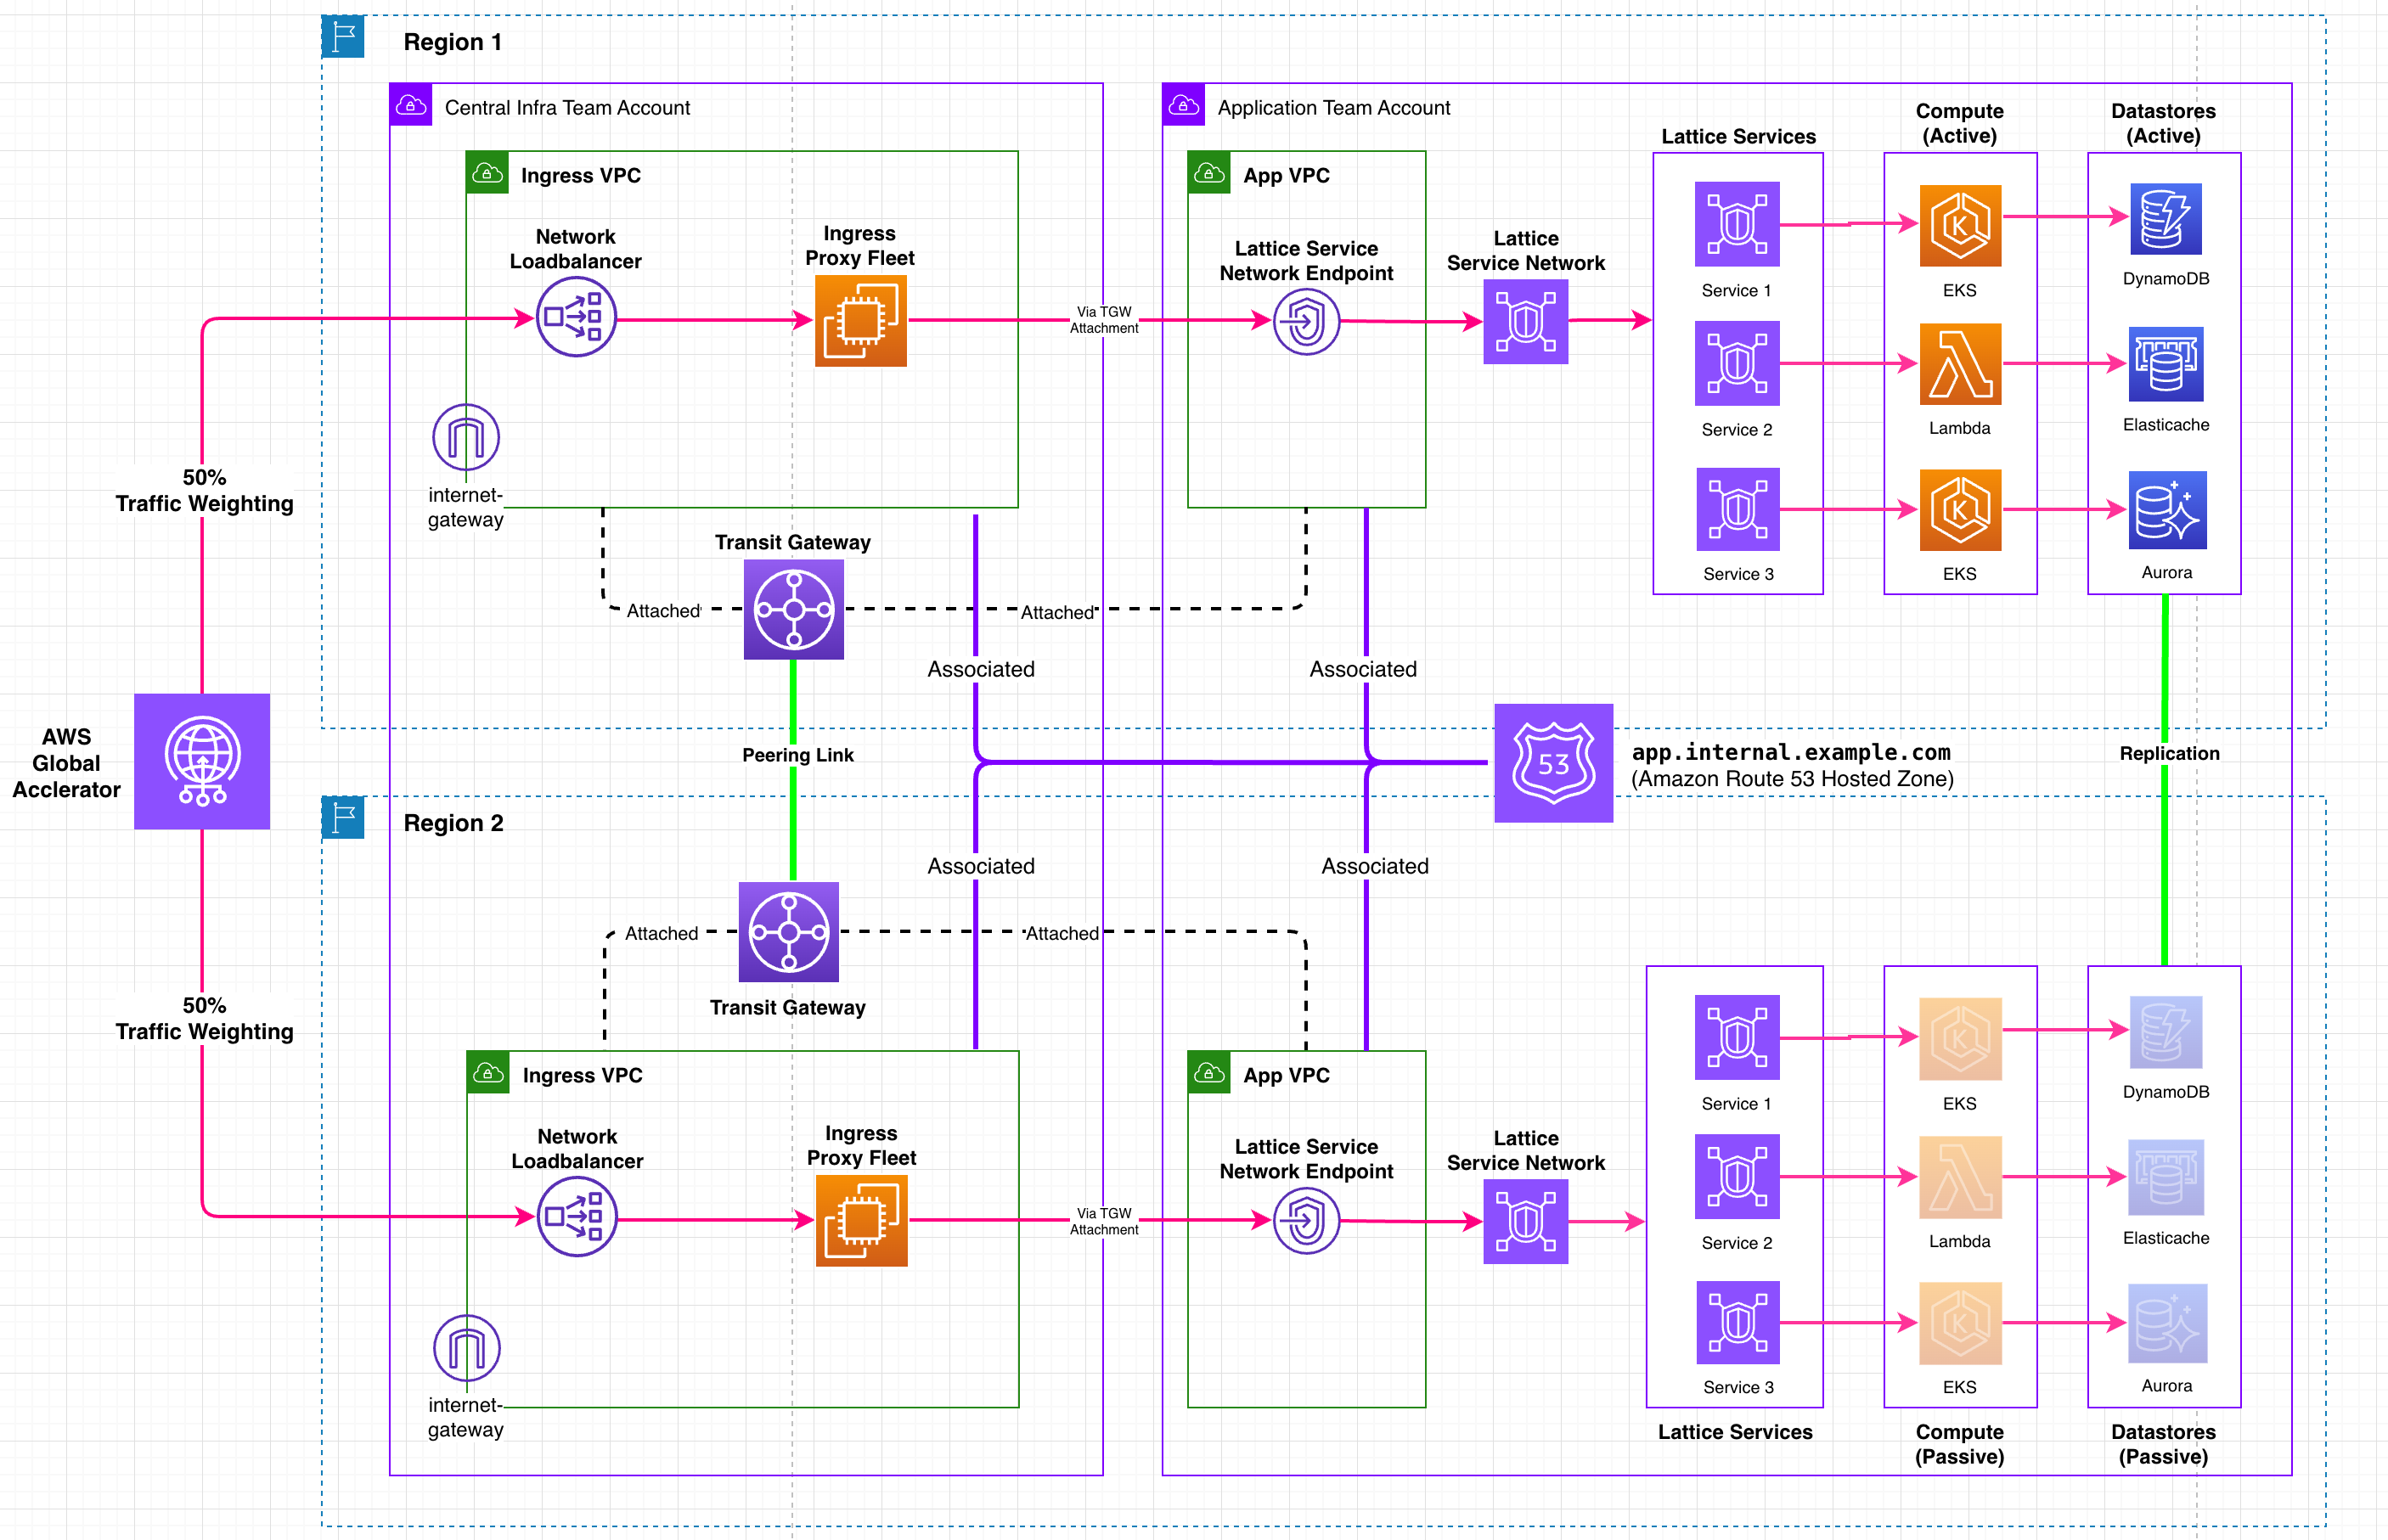
Figure 3: Multi-Region architecture combining Global Accelerator, Transit Gateway peering, VPC Lattice, and Route 53 to support self-service failover
AWS Global Accelerator provides static anycast IPs for the ingress proxy fleet. The 50/50 traffic weighting reflects the platform’s multi-tenant design. Because the centralized ingress proxy fleet serves multiple application teams simultaneously, it must be able to route traffic to applications running in either Region, or active-active across both.
The goal of AWS Global Accelerator is to route traffic to the closest point of presence. If your application is active in Region 1 but a consumer is closer to Region 2, traffic routes to the Region 2 endpoint first, then traverses the cross-Region Transit Gateway peering connection to reach the active application.
The architectural trade-off
This represents an intentional trade-off: accepting an additional network hop through Transit Gateway peering in exchange for true self-service failover. Without this cross-Region connectivity, application teams would need to coordinate with infrastructure teams during failover, reintroducing the exact coordination dependency this architecture seeks to remove.
Fine-grained failover control with Amazon VPC Lattice service network endpoints
While the architecture we’ve described supports independent regional failover, Amazon VPC Lattice service network endpoints add another layer of flexibility worth highlighting: fine-grained control over which services fail over.
Each service network endpoint acts as a consolidated endpoint that can host multiple VPC Lattice services behind it. When you associate a Lattice service with a service network endpoint, it receives its own unique Regional DNS name. For example, an authentication service and a payments service hosted behind the same endpoint each receive distinct DNS names. These per-service DNS names each map to a Route 53 Private Hosted Zone failover record set, giving each service its own independent failover control.
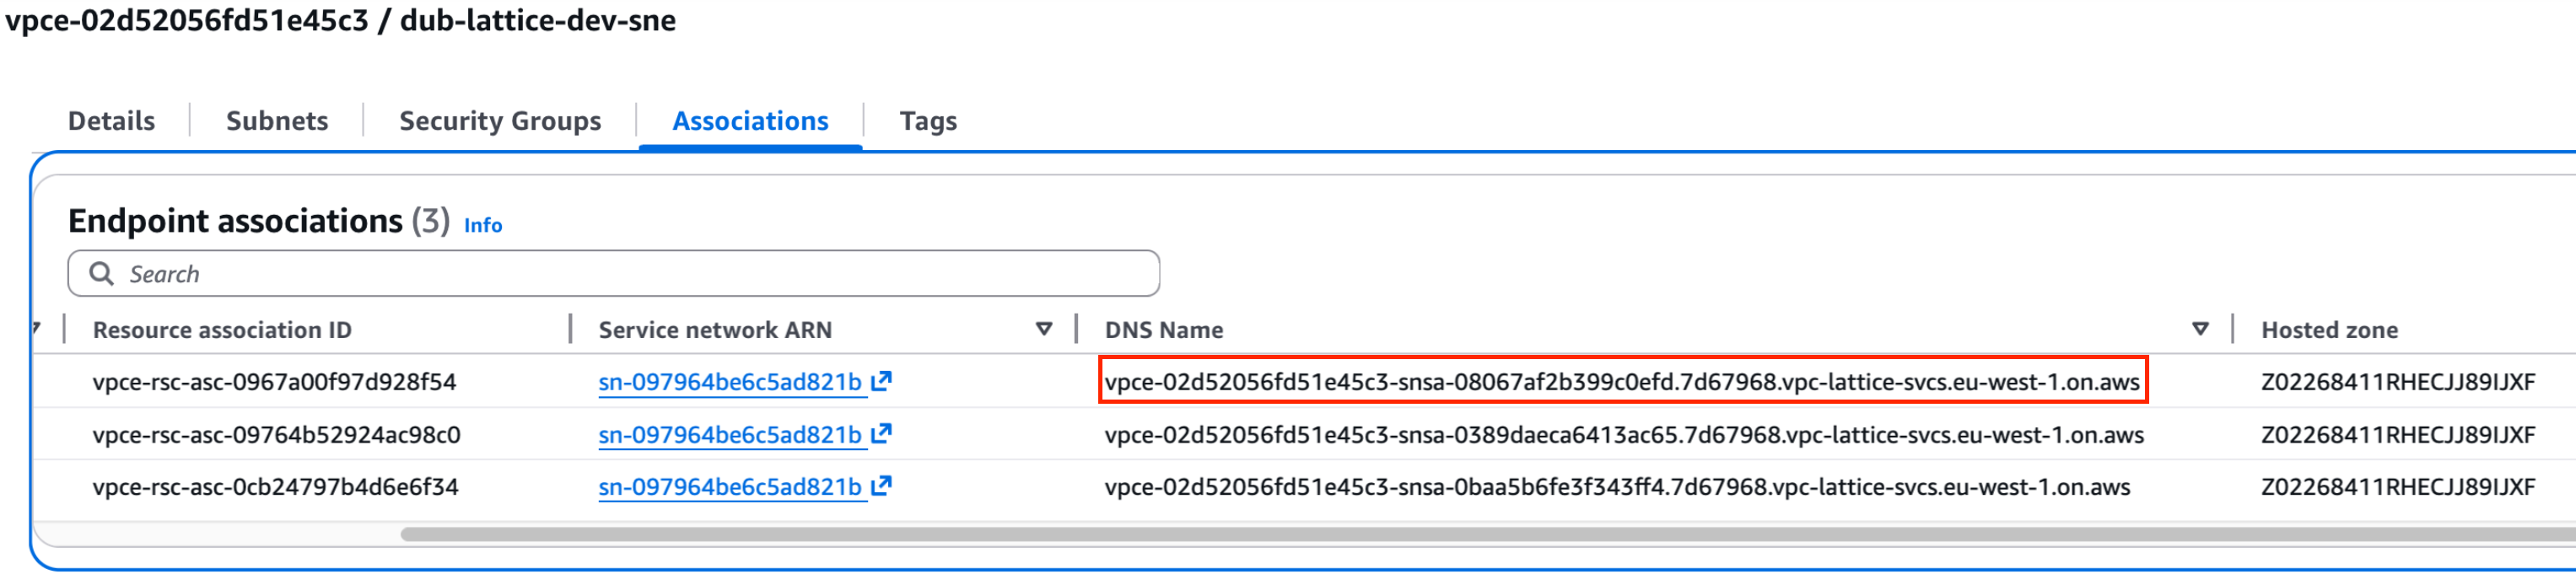
Figure 4: Each VPC Lattice service behind a service network endpoint maps to its own Route 53 failover record set
The key benefit is fine-grained control: application teams can fail over individual Lattice services one at a time, rather than being forced to flip every service behind the same service network endpoint at once. You can validate your authentication service this week, your payment processing service next week, and your inventory service the week after. Each has its own dedicated failover record set in your PHZ, and each is tested without affecting services still running in the primary Region.
This component-level approach requires the least operational overhead, but it carries a risk of bi-modal behavior, where a workload performs differently, with different response times or processes, under normal conditions versus failure modes. Each independent failover adds another active/standby combination, and each must tolerate the cross-Region latency when a service calls a dependency now in the other Region. Design your components to be resilient to this latency and test the realistic combinations. Component-level failover is best suited to teams who have that confidence, so where you don’t, a coarser-grained approach might be the safer choice.
Operationally, the boundary stays clean. The infrastructure team’s ingress proxy fleet continues resolving through the service network endpoint, while the application team controls which services are active in which Region by managing the health check on each service’s DNS record in their PHZ. As your application grows, you associate new microservices with the existing service network endpoint and add their failover record sets, with no changes required to the infrastructure team’s proxy configuration or VPC attachments.
Note: While this post demonstrates a pattern using Amazon VPC Lattice as the application endpoint target, the same shared responsibility approach works regardless of your application stack. Whether you’re running containers on EKS, serverless functions, or traditional EC2 workloads behind Application Load Balancers or Network Load Balancers, the foundational pattern of centralized networking with decentralized DNS control applies equally.
How an application team fails over independently
When the application team runs their ARC Region Switch plan, traffic shifts between Regions without any involvement from the central infrastructure team.
Each application team can independently test their failover capability at their own cadence, as frequently as they choose. These tests are completely independent: one team’s DR exercise has no impact on any other team’s services. As noted in the preceding section, teams should validate the realistic combinations of failed-over and in-place services rather than only the all-in-one-Region baseline.
The failover sequence
What makes this powerful is that it’s a single orchestrated flow, not a set of manual steps. ARC Region Switch runs each block, verifies it has completed successfully, and only then manages the transition to the next, so the sequence advances deterministically, with no human stitching steps together under pressure.
1. Plan initiation. The application team runs their Region Switch plan through the AWS Command Line Interface (AWS CLI) or API, whether for a scheduled DR test or in response to a real incident. The application team can also set up CloudWatch alarms to trigger plans automatically, then run either fully automatically, with no human intervention required, or with a manual approval step built into the workflow that gives teams control to gate execution at critical points.
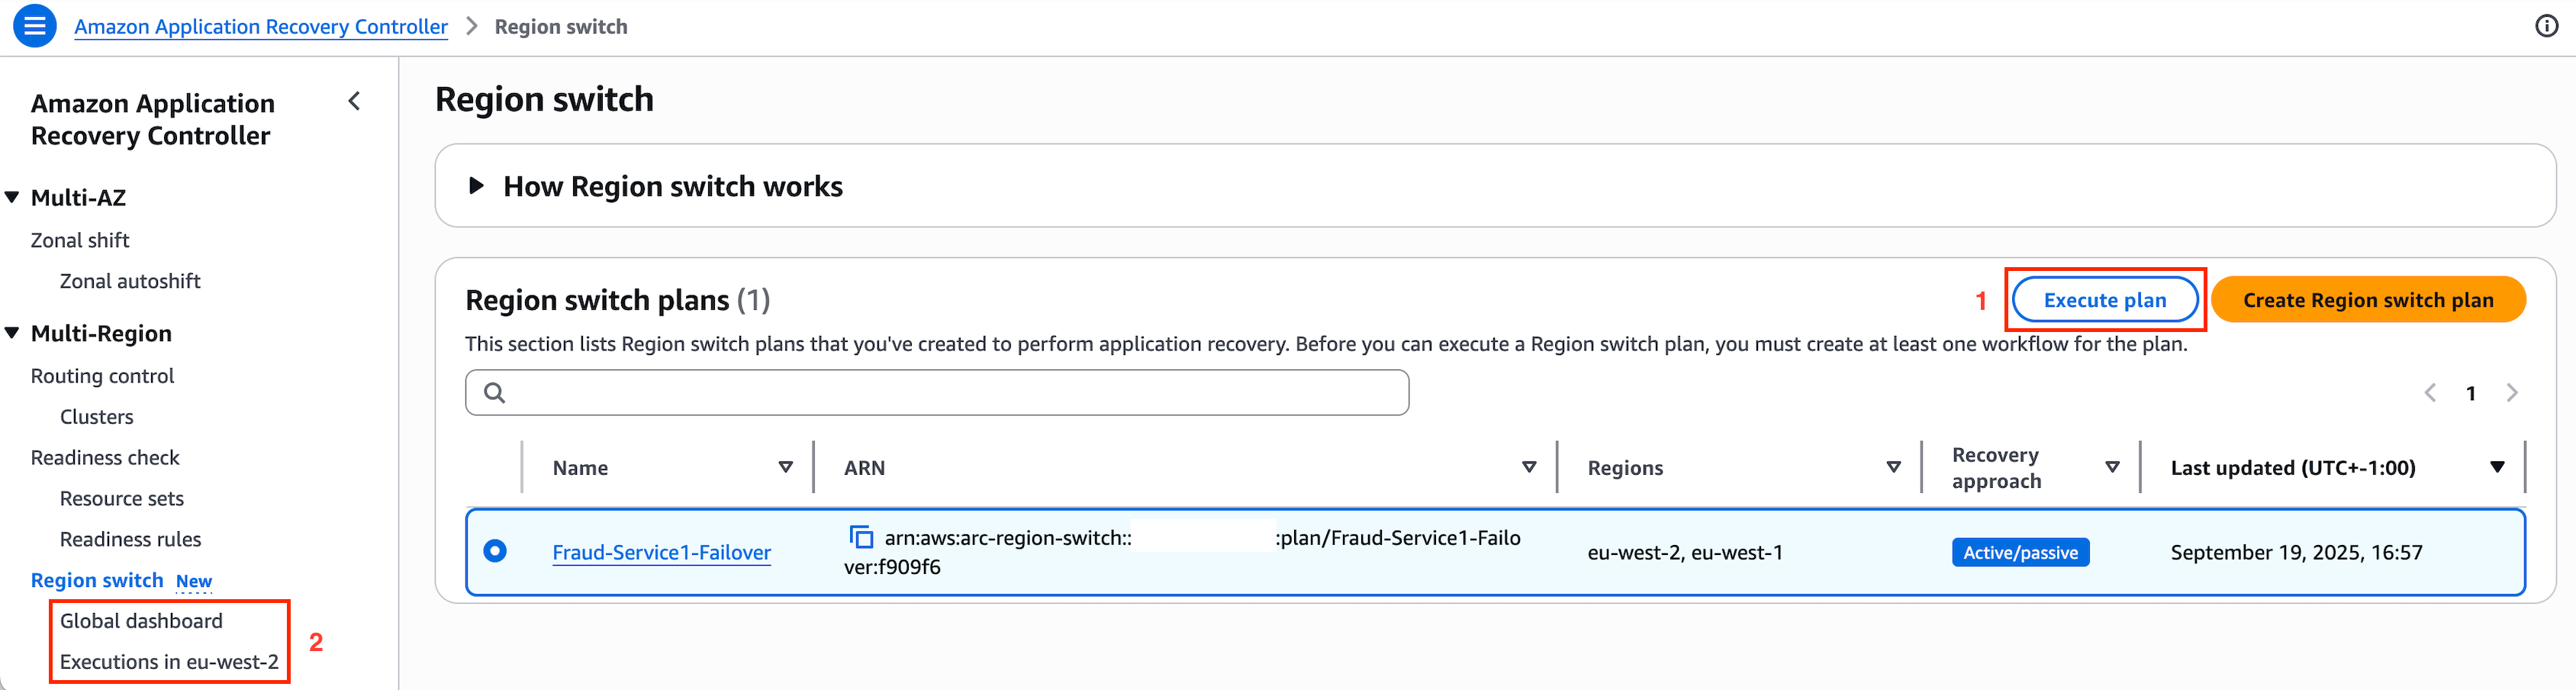
Figure 5: Plan initiation through the AWS CLI or API, with optional CloudWatch alarm triggers and a manual approval step
Note: While plans can be built and run through the AWS console (useful during initial testing), the best practice for real DR invocations is to use the Region Switch API or AWS CLI directly. This reduces cross-service dependencies in your critical path and makes sure your recovery execution doesn’t rely on console availability.
2. Database failover. The first execution block initiates the database transition, promoting the secondary Region’s database to become the primary writer. ARC Region Switch supports both switchover and failover for Amazon Aurora Global Database, RDS instances with cross-Region read replicas, and Amazon DocumentDB (with MongoDB compatibility) clusters. For databases beyond these, such as Amazon DynamoDB global tables, execution blocks can invoke custom Lambda functions to handle service-specific failover logic.
3. Application stack scales up. Subsequent execution blocks handle application infrastructure: scaling compute resources in the standby Region (EKS pods, ECS tasks, or EC2 Auto Scaling groups) and invoking Lambda functions for application-specific logic, such as warming application-level caches so the standby Region doesn’t serve its first requests from a cold cache. This makes sure the standby Region is fully prepared to handle production traffic before any DNS changes occur.
4. Route 53 health check manipulation. After the application stack is ready, ARC Region Switch marks the primary Region’s health check as unhealthy through the native Route 53 health check block, or flips state through an ARC routing control block, triggering Route 53’s failover record logic and redirecting traffic to the now-ready standby Region. You can monitor the current status on the Region Switch plan’s monitoring tab.
Completing the failover: With the health check marked unhealthy, Route 53’s failover mechanism activates. After DNS time-to-live (TTL) values expire, the ingress proxy fleet’s queries resolve to the standby Region’s endpoint. The infrastructure team never needs to reconfigure proxies, update routing rules, or modify DNS records. The application team controls traffic flow through the PHZ record’s health check state by using ARC.
Failback: Returning traffic to the original primary Region works exactly the same way: you trigger your failback plan. Because the design is symmetric, the plan scales the original Region, transitions databases back, and redirects traffic through the same orchestrated flow, in the opposite direction. Failback is as automated, tested, and repeatable as the failover itself.
For more information about creating your own ARC Region Switch plan, refer to the service documentation and the introductory blog post.
From independent to coordinated recovery across the portfolio
The pattern described in the preceding section gives each application team independent failover capability. In practice, however, applications rarely exist in isolation. A payments service depends on an authentication service, and a customer portal depends on an API gateway. When interdependent applications need to recover, they must do so in dependency order. Without a mechanism to coordinate this sequence, the answer today is humans in a war room making phone calls.
Most enterprises capture these dependencies in IT service management (ITSM) tools and wikis, but documentation isn’t orchestration. The worst moment to discover that your dependency maps are stale or your runbooks don’t work is in the middle of a major incident.
Federated recovery with AWS RAM-shared plans
With AWS RAM, you can share Region Switch plans across AWS accounts. Each application team shares its plan from its spoke account with a central hub account, where it’s added as a child plan of a parent plan. Using the Region Switch plan execution block, the parent plan runs each child plan as a step in its workflow. This creates explicit, executable dependency chains between independently owned recovery plans.
Application Team A and Application Team B both share their plans with the hub. The parent plan runs Team A’s plan first, and only when it completes successfully does it run Team B’s plan, so Team B fails over only after its upstream dependencies are ready to serve requests in the recovery Region.
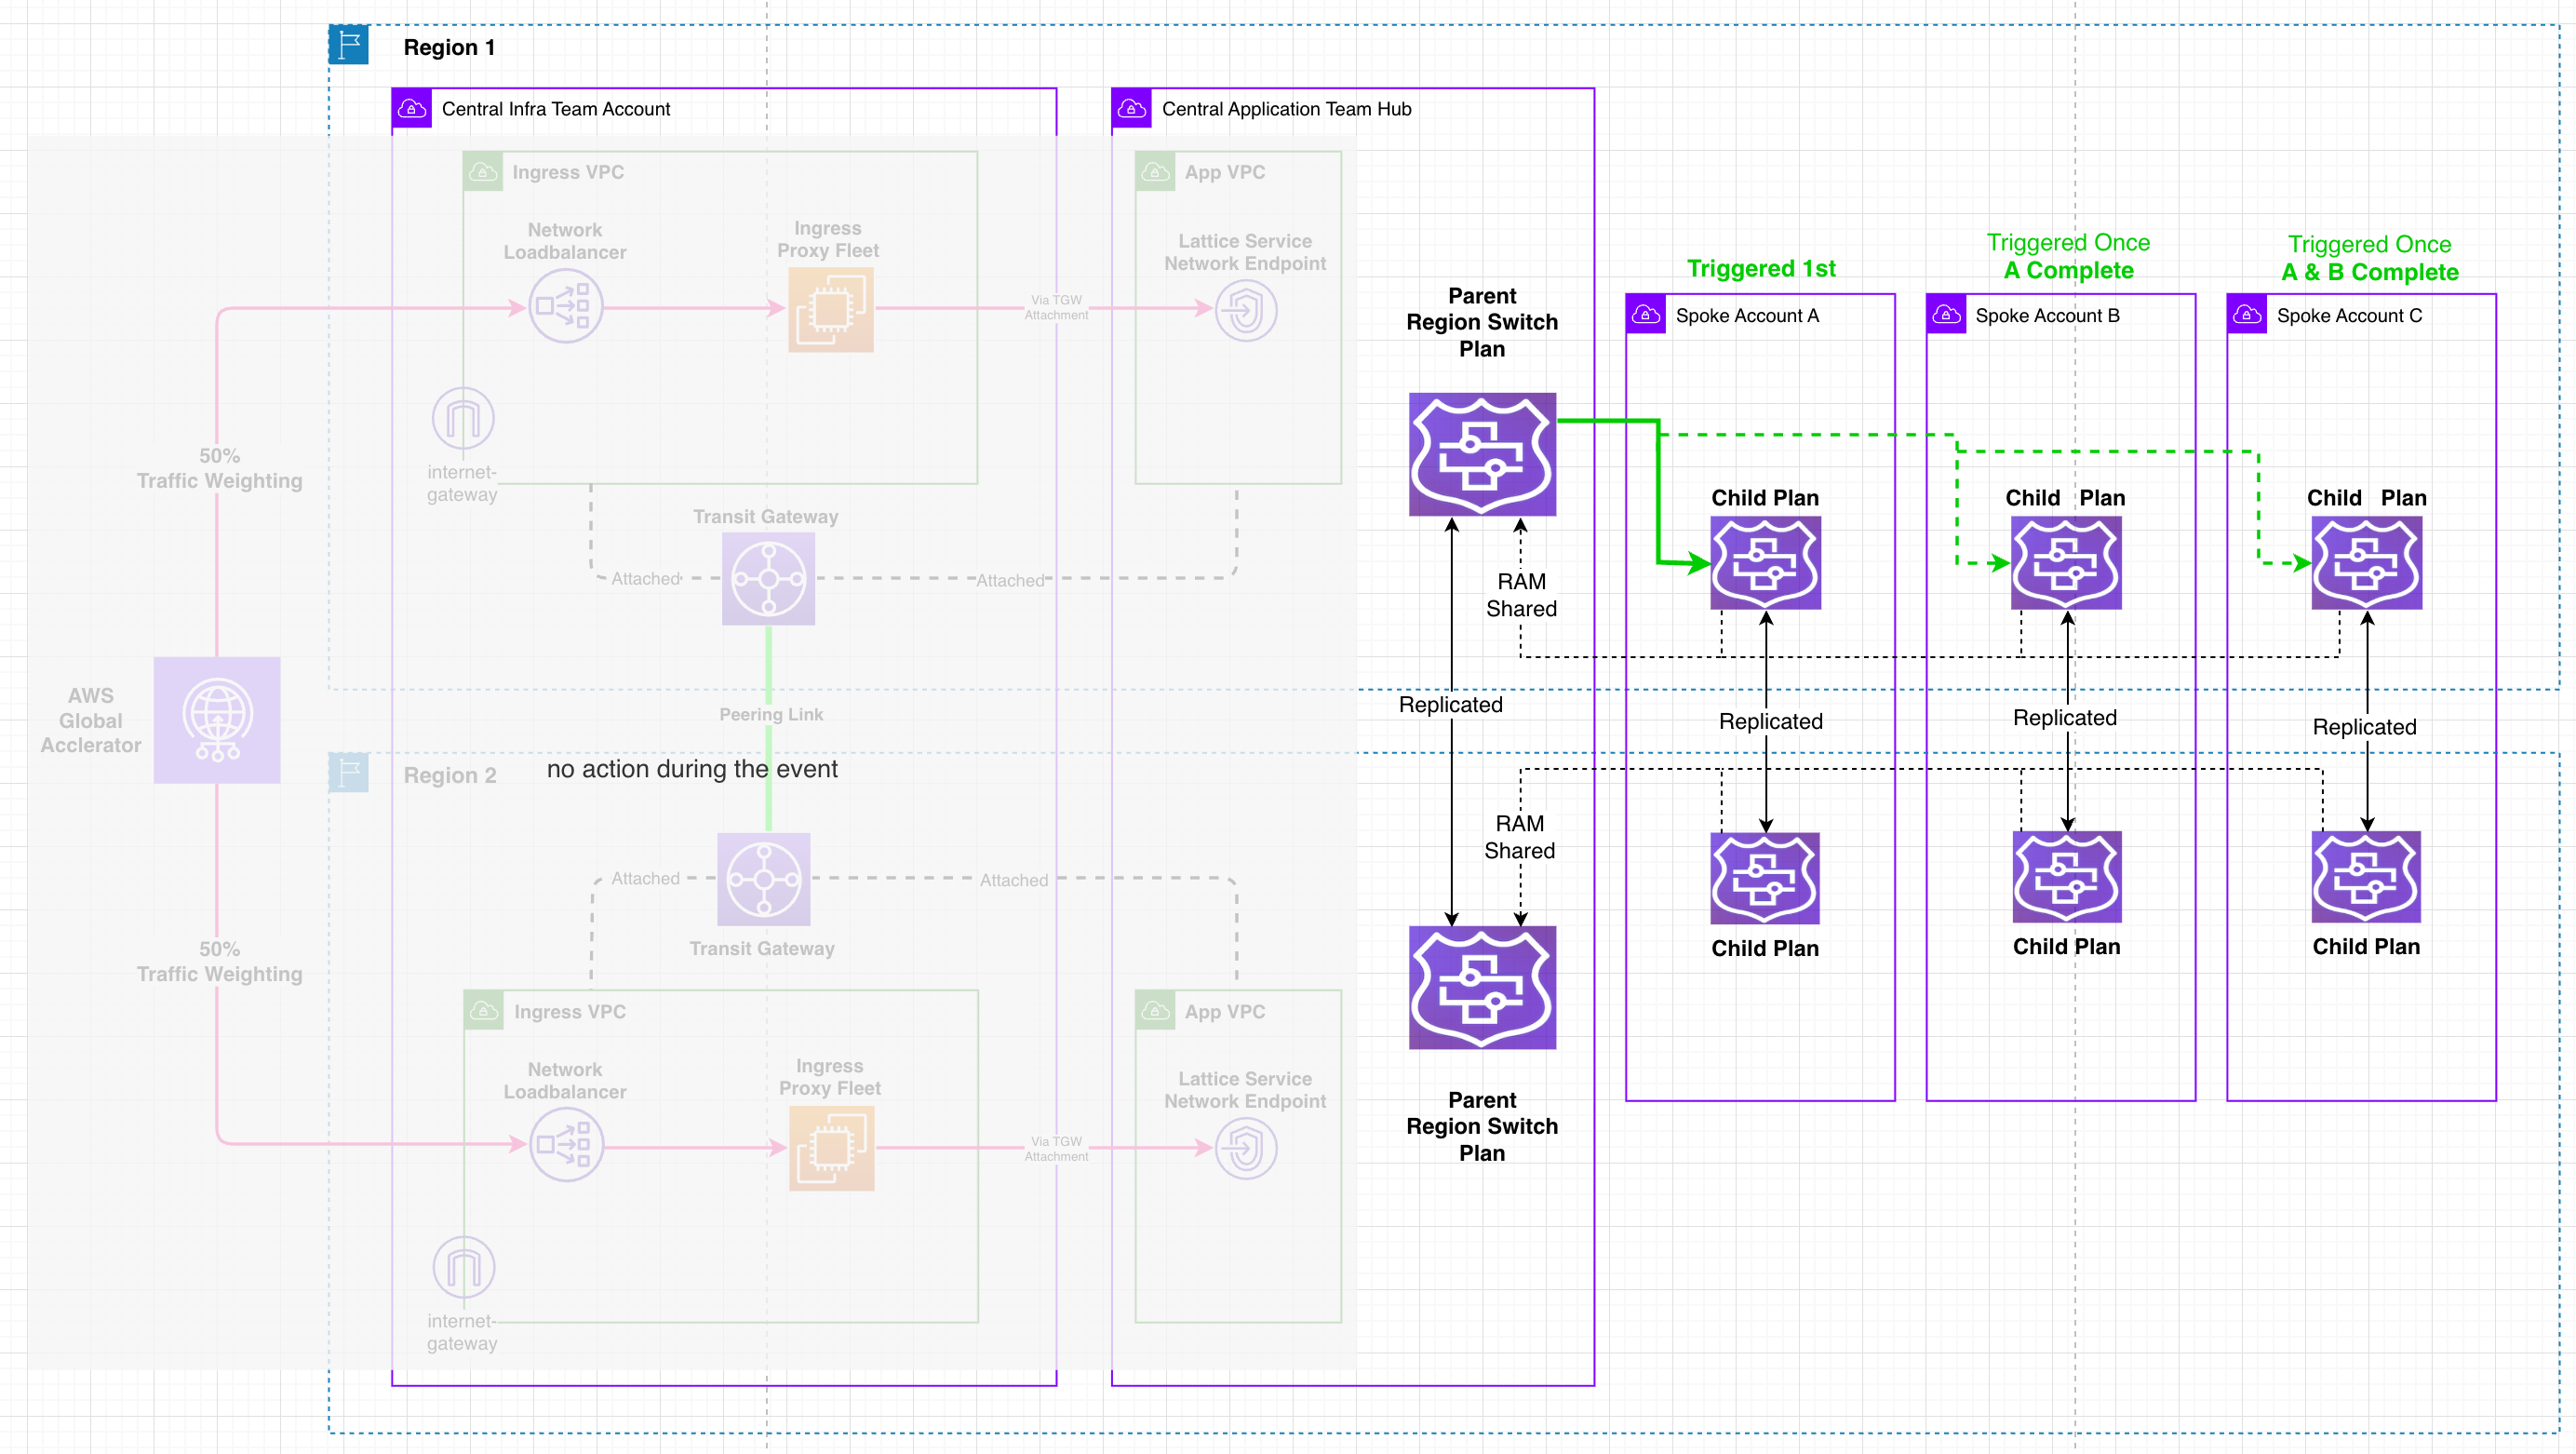
Figure 6: A central parent plan runs each team’s shared child plan in dependency order
These chains can extend across the portfolio (A, then B, then C, with independent applications running in parallel), modeling the full dependency graph as ordered steps in a single parent plan. Each child plan remains independently owned, versioned, and testable by its respective team. The AWS RAM share governs only the hub’s access to the plan, not the plan’s contents or execution logic.
Portfolio-level recovery
The result is deterministic, dependency-ordered portfolio recovery initiated by a single action. A central function triggers the parent plan, and the child plans run in the order it defines. Each child plan can be tested independently by its owning team, and the full parent plan exercised end-to-end during planned DR events, proving coordinated recovery works before it’s needed under pressure.
This addresses a question that enterprises across regulated industries are increasingly asking: “How do we press a big red button to reach our minimum viable business?” A single monolithic recovery script cannot work, because no central team understands every application’s recovery requirements. Parent and child plans solve this: each team owns their recovery logic and maintains it as part of their software development lifecycle (SDLC), keeping it in step with the application it protects, while the parent plan runs them in the correct sequence.
Post-recovery workflows: What happens after failover
Failover isn’t the end of the story. It’s the beginning of recovery operations. After traffic is successfully serving from the new active Region, teams need to run post-recovery workflows to stabilize the environment, validate health, and prepare for eventual failback. Region Switch supports these through additional execution blocks that run after the primary failover sequence completes.
Validation and health confirmation
- Application health checks – Invoke Lambda functions that run synthetic transactions against the newly active stack, verifying API response codes and end-to-end data flow. This measures real recovery time: not when the plan finished, but when requests actually started succeeding again.
- Data integrity verification – Validate that database promotion completed cleanly, check replication lag resolution, and confirm write availability.
- Dependency validation – Verify that downstream services and third-party integrations are responding correctly from the new Region.
Operational stabilization
- Scaling adjustments – Fine-tune Auto Scaling desired counts, EKS Horizontal Pod Autoscaler (HPA) targets, or ECS replica counts based on actual traffic patterns.
- Alerting reconfiguration – Update CloudWatch alarm thresholds and notification routing to reflect the new active Region.
- Standby preparation – Begin provisioning the former primary Region as the new standby.
Notification and compliance reporting
For regulated enterprises, post-recovery documentation is as important as the failover itself:
- Automated notifications – Trigger SNS notifications or Lambda functions that update incident management systems with completion status and duration metrics.
- Compliance evidence – Produce audit-ready logs documenting the failover sequence: what ran, when, which resources were affected, and total recovery time achieved.
- Stakeholder communication – Automatically distribute status updates confirming successful recovery.
Preparing for failback
Post-recovery workflows also set the stage for an eventual return to the original primary Region:
- Replication re-establishment – Confirm that database replication is flowing in the new direction (from new primary to new standby) and monitor replication lag.
- Standby readiness verification – Confirm the former primary Region is healthy and scaled to accept traffic, so it’s ready when failback is needed.
- Failback plan validation – Check the plan evaluation status of your failback plan. Region Switch evaluates it automatically several times an hour, so any warnings about permissions, resources, or capacity are visible before you need to return traffic.
Because these post-recovery steps are defined as execution blocks within the same Region Switch plan, they benefit from the same automation, visibility, and IaC management as the failover itself, with no separate runbooks or manual checklists required. The entire lifecycle, from initial trigger through failover, validation, stabilization, and failback preparation, is captured in a single, version-controlled, repeatable plan.
Conclusion: Reconciling security and autonomy in enterprise cloud architecture
In regulated industries, the tension between centralized security controls and application team autonomy isn’t solved by choosing one over the other. It’s an architectural challenge that demands both. Defense-in-depth strategies with centralized ingress controls are non-negotiable. But modern cloud operations require that teams accountable for availability can act independently when it matters most.
This architectural pattern using Amazon Application Recovery Controller Region Switch delivers the following:
- Application team autonomy – Teams run DR tests, respond to incidents, and meet RTO commitments independently, with no tickets, coordination meetings, or waiting. Application teams control their recovery orchestration while operating within the guardrails of the shared responsibility model.
- Preserved security posture – Centralized ingress controls remain unchanged. The proxy fleet continues enforcing authentication, authorization, threat detection, and audit logging. Application teams never need access to proxy configurations. They only need to control their own PHZ records.
- Automated coordination – Route 53, VPC Lattice, and downstream infrastructure react to ARC-orchestrated changes without manual intervention. Traffic shifts by changing health check state rather than editing DNS records, so recovery relies on highly available data plane operations instead of control plane APIs, in line with Well-Architected guidance. The shared responsibility boundary is enforced through IAM policies and VPC associations, not manual processes.
- Federated portfolio recovery – A central parent plan runs each team’s shared child plan in dependency order, initiated by a single action. Each team retains ownership of their recovery logic while Region Switch coordinates execution across organizational boundaries. Where human oversight is required, a manual approval execution block can gate any step, so automation never removes a team’s control over its own failover.
Because ARC Region Switch is fully managed and highly available, with its data plane operating independently in each Region, application teams can trust that their failover orchestrator is operational precisely when they need it most. And because plans are defined declaratively and can be managed as IaC, teams avoid the maintenance burden of keeping custom scripts synchronized across Regions.
For organizations operating under strict compliance frameworks, this pattern offers a practical blueprint for modernizing disaster recovery without compromising security controls. You don’t need to choose between security and agility. You can architect for both.
Getting started
If your organization operates a similar centralized ingress architecture and wants to support self-service failover:
- Start small: Create your first ARC Region Switch plan in the visual Workflow Builder for a single non-critical service.
- Define as IaC: Export and manage your plan with AWS CloudFormation or the AWS CLI to integrate with your deployment pipelines.
- Set up automatic triggers: Configure CloudWatch alarms to initiate plans automatically, reducing your effective RTO.
- Validate incrementally: Use VPC Lattice (or per-service ALB/NLB records) to test failover for individual services before expanding to full-stack DR exercises.
- Measure and iterate: Track failover duration, identify bottlenecks, and refine your execution blocks.
For the full walkthrough, see the Region Switch tutorial.
About the authors
Multiply pre-recorded streams with Amazon Managed Service for Apache Flink
Post Syndicated from Sivaprasad Mahamkali original https://aws.amazon.com/blogs/big-data/multiply-pre-recorded-streams-with-amazon-managed-service-for-apache-flink/
Validating a streaming pipeline beyond current peak takes production-scale test data, and you can get it by multiplying pre-recorded streams with Amazon Managed Service for Apache Flink. You typically observe backpressure, growing checkpoint durations, and shard hot-spotting when you test under sustained load. Reproducing them in a pre-production environment takes a data source that matches both the volume and the statistical characteristics of production traffic. Customer compliance teams often decide against replaying real production data directly because they want to avoid exposing sensitive fields. Existing approaches to generating that test load each solve for part of this problem while leaving a gap. As a result, teams either test at a fraction of expected load and discover the limits in production, or maintain a bespoke generator whose output gradually drifts from real production distributions.
With the stream multiplier pattern, a relatively small sample from Amazon Kinesis Data Streams is enough. With appropriate configuration, the pattern can help preserve the statistical properties of real traffic. You control output volume through a single parameter, multiple.factor.
This post covers why at-scale testing is difficult, where existing approaches fall short, how the multiplier works, and how it performs.
Understanding streaming workloads and the need for at-scale testing
Streaming applications process high-throughput data continuously. In production, they ingest several thousands to millions of events per minute and maintain stateful computations across operators. They write results to downstream sinks without interruption.
You typically see their critical failure modes under sustained, high-volume load. Checkpoint stalls, growing checkpoint durations, state backend pressure, application restarts, and state loss are problems that compound over time and under volume. Persistent high utilization of streaming resources does the same. A pipeline that runs cleanly at a fraction of its target throughput provides no evidence that it will behave the same way at full production rate.
The remaining question is where the test data comes from.
Challenges with existing approaches to at-scale testing of streaming applications
One approach to testing at production scale is to replay a full-volume pre-recorded stream. You capture live traffic from a production Kinesis data stream into a non-production stream over a defined window. You then replay it through your pipeline under test at the original rate. The data and field distributions are real, so you can compare the results with production behavior. However, at 50,000 records per second, a two-hour recording window holds 360 million records (50,000 × 7,200 seconds). You would need to capture and retain a recording at every throughput tier you validate. That becomes an operational and cost burden as the target volume grows.
Synthetic data generators take the opposite approach. Tools such as DataFaker or custom Kinesis producers remove the dependency on pre-recorded data. They emit records at any target rate from a schema definition, bounded only by the producer’s compute capacity. The limitation lies in data fidelity: generated records follow configured distributions, not observed ones.
Generators can model individual field distributions and known correlations. They can’t reproduce the natural skew, micro-bursts, and cross-field dependencies of real user behavior.
For pipelines whose correctness depends on realistic data, that gap can mask the exact problems the test is designed to expose.
A third option is to validate directly against live production traffic using canary deployments, shadow pipelines, or percentage-based traffic splitting. The data is real because it is production data, but you are limited to current production throughput. Testing at 5x or 10x that rate means waiting for organic traffic growth or building a separate load injection path into production.
Each of these approaches solves for either fidelity or volume, but not both at the target scale. The stream multiplier pattern addresses that gap.
Solution overview
Consider a ride-hailing company, AnyCompany Rides, that runs a real-time analytics pipeline on Apache Flink. The pipeline ingests trip events from a Kinesis data stream, computes fare estimates, driver matching scores, and surge pricing signals, and writes the results to a downstream Kinesis data stream. It processes approximately 15,000 events per second at peak. The team expects a regional expansion to increase peak traffic by 5x. Before launch, it needs to validate that the pipeline sustains 75,000 events per second without checkpoint degradation or backpressure.
The team has a ten-hour, sanitized recording of production traffic captured at 15,000 events per second. Replaying it at the original rate only validates current load. The team can’t capture a recording at 75,000 events per second because that traffic doesn’t exist yet. A synthetic generator that reproduces the trip types, fare ranges, and geographic patterns of the original stream would take significant modeling effort, with no guarantee of accuracy.
Using the stream multiplier pattern, the team sets a multiplication factor of 5x on the existing recording. For each event, the multiplier emits the original unchanged plus four synthetic variants. Each variant replaces the fields you configure with DataFaker values and preserves business keys such as trip ID. The output stream delivers approximately 75,000 events per second, and fields you don’t configure for replacement keep the distributions of the original recording.
The following diagram illustrates this architecture.
Figure 1: Stream multiplier solution architecture
The solution uses three AWS services and one open source library:
- Amazon Kinesis Data Streams holds the pre-recorded data stream on the source side, and carries the amplified stream to the pipeline under test on the sink side.
- Amazon Managed Service for Apache Flink runs the multiplier, a
RichFlatMapFunctionthat emits the original record plus N−1 variants. - Amazon CloudWatch collects the metrics that tell you whether the generator itself is healthy: throughput, backpressure, checkpoint duration, and heap.
- DataFaker, an open source Java library for generating realistic synthetic values, produces the replacement values for mutated fields, driven by expressions you declare in
faker-config.yamlrather than in code. It is declared as a build dependency and packaged into the application JAR, so there’s nothing to install separately. - The pattern is schema-agnostic: it operates on whichever fields you nominate as keys and whichever you nominate as mutable. In this sample, changing those fields is a configuration change. Adopting a different schema also requires updating the event model and the JSON serializers.
Prerequisites to deploy the stream multiplier
- An AWS account with permissions to create Managed Service for Apache Flink applications, Kinesis data streams, Amazon Simple Storage Service (Amazon S3) buckets, and Amazon CloudWatch log groups.
- A local build environment with Java Development Kit (JDK) 17 and sbt 1.9.9.
- A source Kinesis data stream holding the pre-recorded data, and a sink stream sized for source throughput × multiplication factor.
- An S3 bucket for the packaged application JAR.
- AWS Command Line Interface (AWS CLI) version 2, configured.
- An AWS Identity and Access Management (IAM) execution role with read access to the source stream and write access to the sink stream.
We tested the sample against these versions. The build.sbt file declares everything except the build tools, and sbt assembly bundles it into the JAR.
- JDK : 17.
- sbt : 1.9.9.
- Scala : 2.12.20.
- Apache Flink : 2.3.0.
- Amazon Managed Service for Apache Flink runtime environment : FLINK-2_3.
- aws-kinesisanalytics-runtime: 1.2.0.
- Apache Flink Amazon Kinesis Streams connector : 6.0.1-2.0.
- DataFaker : 2.7.0.
- Jackson : 2.15.2.
- Log4j : 2.24.3.
The Kinesis connector version is paired to the Flink version (6.0.1-2.0 targets Flink 2.x), and Flink 2.x requires Java 17 and uses the Java DataStream APIs, because the Scala DataStream APIs are no longer available.
A note on source data: This pattern doesn’t perform data masking, anonymization, or removal of personally identifiable information (PII). Fields that you don’t list in
updatable.fieldspass through unchanged. You are responsible for using only open data, or data that you sanitized, as the pre-recorded data stream. The walkthrough uses the public NYC taxi trip schema, which has the same shape as the AnyCompany Rides trip events.
Deploy the solution
The sample-datastream-multiplier repository includes an AWS CloudFormation template that creates the Kinesis data streams, the Managed Service for Apache Flink application, the IAM role, and the CloudWatch log group. It also creates an AWS Key Management Service (AWS KMS) key for log encryption and an AWS Lambda function that seeds the source stream with sample records.
- Build the uber-JAR with
sbt assemblyand upload it to your S3 bucket. - Deploy
infrastructure/cfn-template.yamlas a stack nameddata-stream-multiplierwithaws cloudformation deploy, passingS3BucketArnandS3Key, and setMultipleFactor,KeyFields, andUpdatableFieldsas stack parameters. - Start the application with
aws kinesisanalyticsv2 start-application. - Begin at a factor of 2x or 3x, confirm the output is correct, then raise the factor while monitoring CPU and backpressure.
The template encrypts both Kinesis data streams at rest with the AWS managed key (alias/aws/kinesis), and the CloudWatch log group with a customer managed AWS KMS key. To use your own key, pass EncryptionKmsKeyArn. If you reuse an existing source stream (CreateInputStream=false), you’re responsible for confirming that it has server-side encryption enabled. Amazon S3 encrypts the application JAR with SSE-S3 by default, and the AWS SDK uses TLS in transit.
Two ways to produce the stream
The multiplier reads from one of two sources, which you select with the source.type runtime property, and both feed the same multiplication operator. Amplification mode (source.type=kinesis) is the focus of this post. It replays a pre-recorded data stream, so fields you don’t replace keep the distributions of real traffic. Throughput is the source rate multiplied by multiple.factor. Pure synthetic mode (source.type=datagen) uses the Apache Flink DataGen connector to generate records in the application from faker-config.yaml, with no real data involved. It is useful for validating the pipeline end to end before you have a pre-recorded stream.
How it works
In amplification mode, the multiplier processes each incoming event in five steps:
- Read and deserialize the event from the source Kinesis data stream.
- Emit the original event unchanged.
- Compute a deterministic hash from the configured key fields combined with a per-iteration random seed.
- Generate synthetic values for the fields listed in
updatable.fields, using that hash as the DataFaker seed and the expressions infaker-config.yaml. The key fields stay unchanged, so variants keep the same keys as the original. - Serialize and write all records, original plus variants, to the sink stream.
Managed Service for Apache Flink application runtime properties drive the behavior, so the same artifact serves both modes regardless of schema:
| Property | Purpose |
source.type |
kinesis for amplification mode, datagen for pure synthetic mode |
multiple.factor |
Total records emitted per input record: 1 original plus N−1 variants |
key.fields |
Business identifiers preserved across variants, and hashed to seed generation |
updatable.fields |
Fields replaced with synthetic values in each variant |
random.seeds |
One seed per multiplication iteration, so variants differ from each other |
rate.limit.per.second |
Caps generated throughput in pure synthetic mode |
The multiplication operator
The fan-out itself is deliberately small. A trait defines the contract, and flatMap is designed to emit the original followed by N−1 variants:
A multiplication factor of 3 produces three records: the original and two variants. The application validates the factor at startup and rejects values outside a range of 1 to 100. A mistyped factor can generate enough output to exhaust the sink’s shard capacity or the application’s heap. Bounding it in code helps prevent a configuration error from overwhelming the test environment.
Field generation with DataFaker
You define which fields become synthetic, and how, outside the code. Each entry pairs a DataFaker expression with a type:
With key.fields=tripId and five updatable.fields, one input trip fans out into variants that share its identity but differ in the nominated fields. Three of the ten variants of a single trip, read back off the amplified stream during a 10x run:
tripId is identical on every variant because it is a key field, and timestamp because it appears in neither list and passes through untouched. The five updatable.fields differ in each. A consumer that groups by tripId still sees a coherent entity, because the key travels with every variant regardless of which shard carries it.
Figure 2: Inside the multiplier: the key field and untouched fields are identical on every variant, while the nominated fields are regenerated from a per-variant seed
The choice of
updatable.fields controls the trade-off between variant diversity and preservation of production distributions.
A repeatable, deterministic generator
If the generator produces different data on every run, a change in throughput or checkpoint duration between runs tells you nothing. The multiplier is therefore designed to be deterministic: the same pre-recorded data stream and the same configuration generate the same variant values on every run. After a failure and restore, replayed records regenerate the values they had before. The at-least-once Kinesis sink can still write some of them twice. Each variant’s values come from a seed built from the record’s key fields and a per-iteration seed from random.seeds, so variants are reproducible but still differ from one another. Because the generator is reseeded for every record, the values don’t depend on replay order after a restore or on which subtask processes the record. That holds only while every generated value comes from the seeded generator. Values such as wall-clock time or UUID.randomUUID() would break it.
What this looks like in practice
This section shows how the multiplier performed in our tests: first its throughput ceiling and resource use across factors, then how the sink’s shard count changes what you measure.
We ran a factor sweep on Managed Service for Apache Flink in the US West (Oregon) AWS Region (us-west-2). We deliberately over-provisioned the sink so that the multiplier itself was the only limit. The application ran at parallelism 2 with automatic scaling off, on 3 Kinesis Processing Units (KPUs): 2 for processing and 1 for orchestration. Records used the NYC taxi trip schema, averaging about 181 bytes, with key.fields=tripId, five updatable.fields, and one seed per variant. To hold the input rate constant, we used the pure synthetic (datagen) source with rate.limit.per.second and scaled the sink to 240 shards. Per-variant field generation, the compute-intensive path, runs the same code in both modes. Your results will vary with record size, schema, and configuration.
Throughput and capacity
| Factor | Input rec/s | Output rec/s | Output per processing KPU |
| 5x | ~25,600 | ~128,000 | ~64,000 |
| 10x | ~14,300 | ~143,000 | ~71,500 |
| 15x | ~11,300 | ~169,000 | ~84,500 |
| 20x | ~8,600 | ~171,000 | ~85,500 |
| 25x | ~7,040 | ~176,000 | ~88,000 |
Stability and resource utilization
| Factor | CPU % avg/max | Backpressure | Checkpoint duration | Checkpoint size | Heap % avg/max |
| 5x | 99 / 100 | 0 | ~460 ms | ~17 KB | 31 / 63 |
| 10x | 96 / 100 | 0 | ~272 ms | ~73 KB | 34 / 65 |
| 15x | 99.6 / 100 | 0 | ~258 ms | ~46 KB | 35 / 59 |
| 20x | 99.7 / 100 | 0 | ~226 ms | ~57 KB | 38 / 66 |
| 25x | 99.7 / 100 | 0 | ~333 ms | ~57 KB | 36 / 63 |
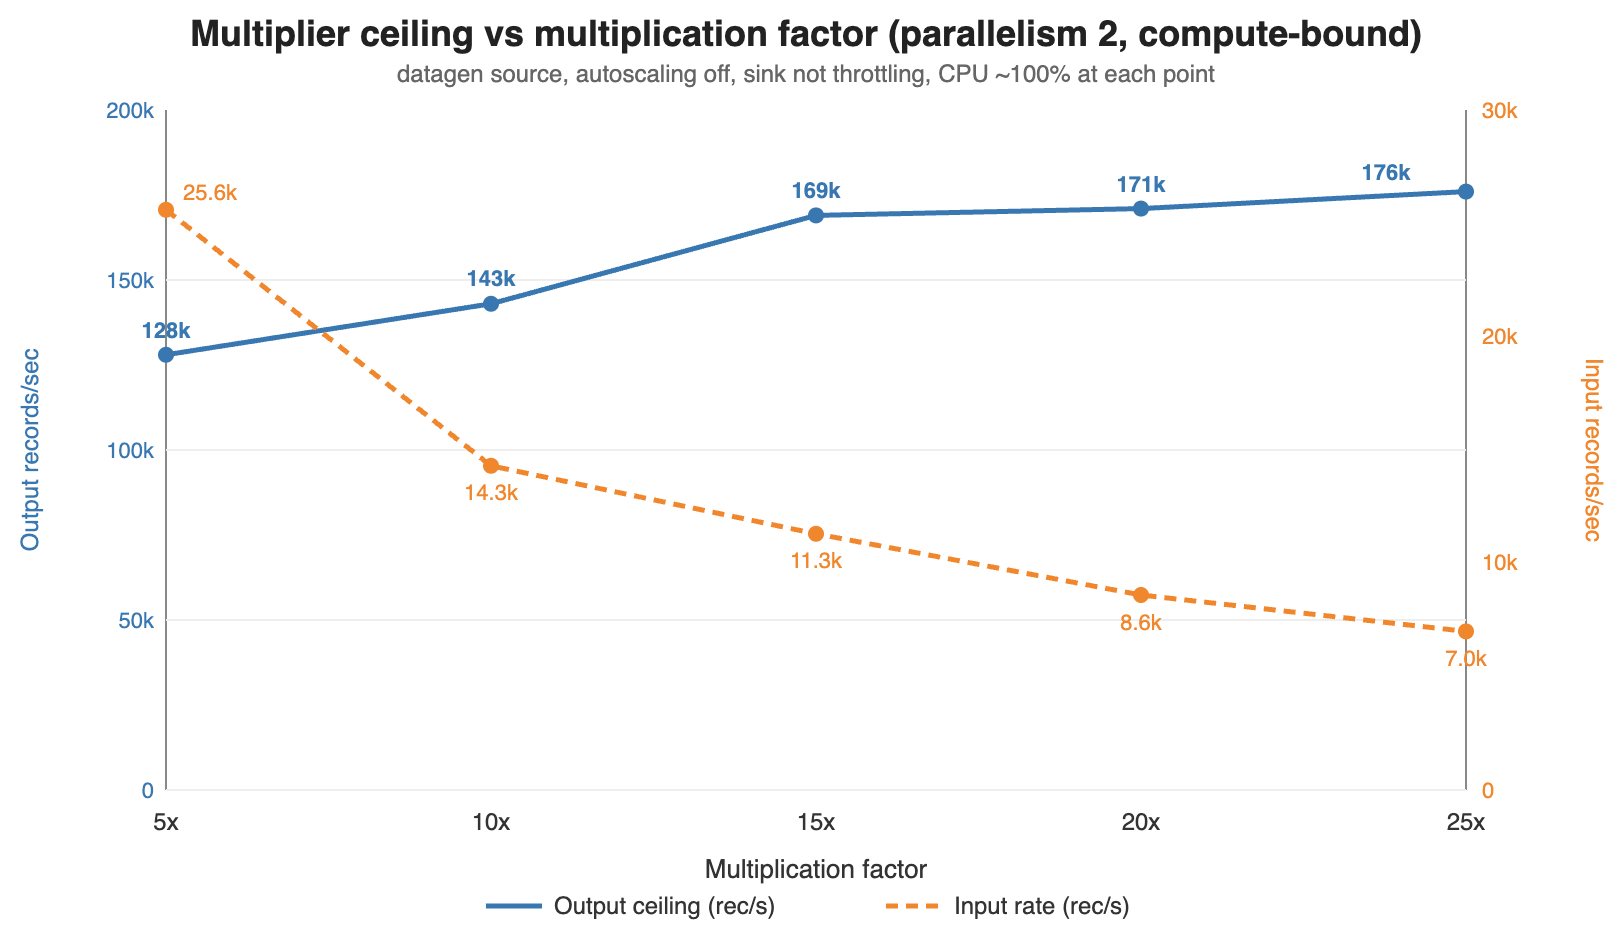
Figure 3: Output ceiling rises toward an asymptote as the factor increases, while the input rate the application can consume falls
Output throughput rises with the factor. Between 5x and 25x in our sweep, output climbed from approximately 128,000 to approximately 176,000 records per second while the input rate the application consumed fell from approximately 25,600 to approximately 7,040. Each input record carries a fixed cost to read and deserialize, and each output record carries the per-variant field generation cost. Raising the factor amortizes the fixed cost over more outputs, so output flattens near approximately 176,000 records per second.
CPU is the binding constraint, not memory and not state. CPU sits at 96–100 percent in every row, so in this configuration these plateaus are the multiplier’s ceiling. Heap stays in a narrow 31–38 percent average band with no upward trend. The job turns on Flink object reuse and reseeds one DataFaker instance per subtask instead of creating one per record. Checkpoints stay tiny, 17–73 KB completing in 226–460 ms, because the stateless flatMap has nothing to snapshot beyond source offsets.
For capacity planning, size from output per processing KPU: roughly 64,000 records per second at 5x, rising to approximately 88,000 at high factors.
Per-factor CloudWatch views show output rate in blue and sink throttling in red. The flat red line at zero indicates each plateau is compute-bound rather than sink-limited:
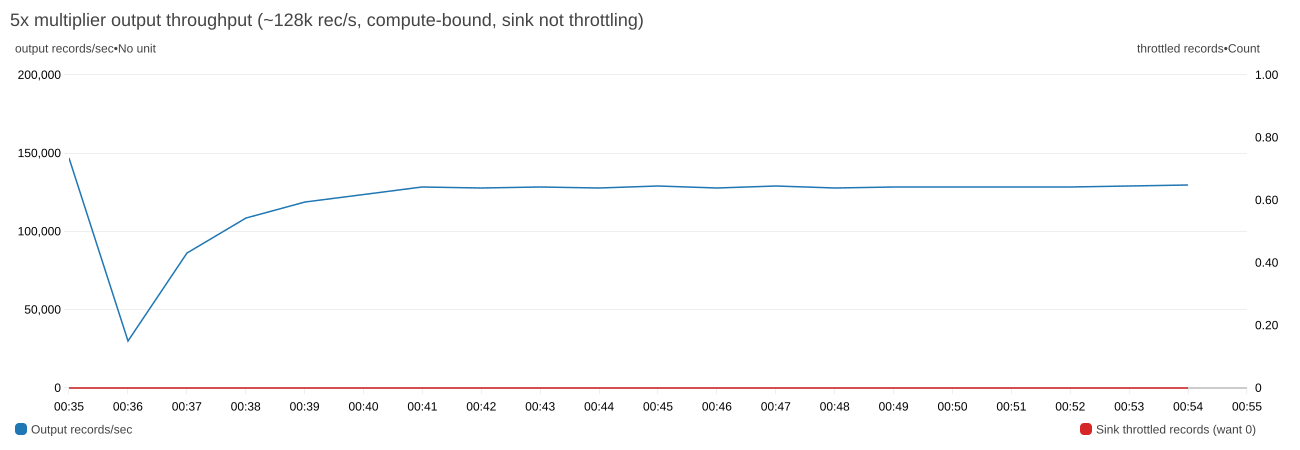
Figure 4: At 5x, output plateaus at ~128,000 records per second with zero sink throttling
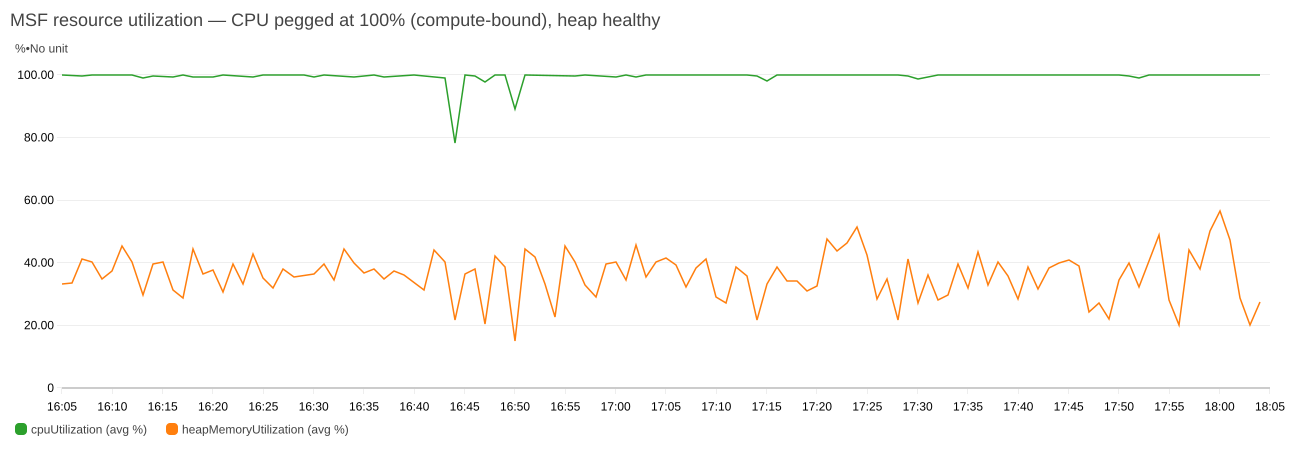
Figure 5: CPU pegged near 100% while heap stays comfortable. This is the signature of a compute-bound plateau
Your sink decides your throughput, not the multiplier
That ceiling is only reachable if the sink can absorb it. Holding the factor at 10x and changing nothing but the sink’s shard count shows where the real limit usually sits:
| Sink shards | Sink capacity rec/s | Observed output rec/s | Throttling | CPU % | Limited by |
| 20 | 20,000 | ~20,505 | heavy | ~16 | sink |
| 60 | 60,000 | ~62,000–70,000 | heavy | ~48 | sink |
| 120 | 120,000 | ~122,000–123,000 | mild | ~86 | sink (marginal) |
| 180 | 180,000 | ~143,000 | none | ~96 | compute (ceiling) |
At 20 shards the application ran at 14 percent of its capability with CPU at 16 percent, waiting on the sink. Only at 180 shards does throttling disappear and CPU saturate, so you are measuring the multiplier rather than your Kinesis provisioning.
A shard accepts 1,000 records or 1 MB per second on writes, whichever limit you reach first. For records under about 1 KB, like the approximately 181-byte trip events here, the record limit applies first. The sink needs roughly target output rate ÷ 1,000 shards before any factor comparison is meaningful. For larger records, size by bytes: one shard per MBps of target output. Under-provision it and every factor reports the same throughput: the shard limit.
The async KinesisStreamsSink re-queues and retries throttled records. Across our sweep, transient per-attempt failures stayed at 73 or fewer in a window against tens of millions of records, and we observed no permanent loss. Write latency held at approximately 40–54 ms average with occasional approximately 1.1 s spikes.
Shard load also stays even as the factor rises, because the partition key comes from the record’s hash rather than the multiplication factor. In our 25x run across 240 open shards, every shard carried between 671 and 678 records per second, within about 0.5 percent of the approximately 675 average.
Validating a run
Before you trust the load test, confirm that the multiplier is doing what you expect:
- Measure throughput on the Kinesis side, not the application side. Flink chains the source, the multiplier, and the sink into a single operator. As a result, the application-level
numRecordsInPerSecondandnumRecordsOutPerSeconddon’t cleanly separate input from output. UseGetRecords.Recordson the source stream andIncomingRecordson the sink stream. Their ratio is the true fan-out and should equal your multiplication factor. In our 10x amplification run, it measured 2,056 records per second in against 20,505 out, a ratio of 9.97. - Key preservation. Sample the sink stream and confirm that variants share key-field values and that fields outside both lists are unchanged.
Troubleshooting
If the amplified stream isn’t what you expect, check these first:
- All variants of a record are identical.
random.seedshas fewer entries than the multiplication factor requires. - Output rate is below factor × input rate. Check
WriteProvisionedThroughputExceededon the sink andbackPressuredTimeMsPerSecondon the operator, and provision at leasttarget output rate ÷ 1,000sink shards for records under about 1 KB. - The source falls behind. Watch
millisBehindLateston the application orGetRecords.IteratorAgeMillisecondson the source stream. If the lag climbs during a live run, add source shards or use Enhanced Fan-Out and watchSubscribeToShardEvent.MillisBehindLatestinstead. - The application crash-loops after switching
source.type. Switching modes changes the job graph, so restoring the previous snapshot fails with aKinesisShardSplitSerializer EOFException. Start the application withSKIP_RESTORE_FROM_SNAPSHOT. The multiplier is stateless, so there is no application state to restore. Property changes, includingsource.type, take effect only after an application update.
Performance considerations and limitations
The multiplier inherits the timing of the pre-recorded data rather than synthesizing it. Amplification multiplies volume and keeps the sample’s timing shape, so bursts in the pre-recorded data carry through at higher amplitude. Injecting bursts that are not in the sample, spreading variants over an interval rather than emitting them together, and simulating late arrival all need extra logic. The sample uses WatermarkStrategy.noWatermarks() because the multiplier has no event-time operators. Flink also doesn’t write watermarks into Kinesis records, so the watermark setting in the multiplier has no effect on the pipeline under test. Each variant keeps the original timestamp in its payload. The pipeline under test assigns its own watermarks from that field, as it does in production.
Generated fields are independent of each other. Each entry in faker-config.yaml is evaluated on its own, so in the trip example, distance is drawn from 0–20 and amount from 5–150 with no relationship between them. A 0.5-mile trip can be assigned a $150 fare. Ordering is preserved within a partition but not across partitions, so if the pipeline under test depends on global ordering, the amplified stream won’t provide it.
The sample assumes that the source and sink streams are in the same AWS account. For a stream in another account, grant the application’s execution role access with a resource-based policy on that stream. The sample also reads and writes JSON. Because the multiplier works on deserialized objects, supporting Apache Avro or Protocol Buffers means replacing JsonDeserializationSchema and JsonSerializationSchema. The multiplication logic is unchanged.
Cost considerations
You pay for Kinesis shard-hours, PUT payload units, and extended retention, and for Managed Service for Apache Flink KPU-hours and running application storage. Amazon CloudWatch Logs and AWS KMS add smaller charges. The following estimates are approximate and use on-demand prices in US West (Oregon) as of October 2026. Prices vary by AWS Region and change over time, so check Amazon Kinesis Data Streams pricing, Amazon Managed Service for Apache Flink pricing, or the AWS Pricing Calculator for your Region.
Default deployment. The template runs three shards with seven-day retention and 3 KPUs, two for processing and one for orchestration. That comes to about $0.45 per hour, or about $11 per day if you leave it running, plus PUT payload units for the records you write. Automatic scaling is on by default and can add KPUs under load.
The 25x run in this post. Two hours at 25x, with 240 sink shards and about 176,000 records per second, uses about 1.3 billion PUT payload units ($17.75), 480 sink shard-hours ($7.20), and 6 KPU-hours ($0.66), for about $26. Seven-day retention adds about $9.60, for about $35. Lower factors write fewer records and cost less.
To keep costs down, set StreamRetentionHours to 24 unless you plan to replay the amplified stream. Size the sink to your target output rate, keep test windows short, and follow the clean-up steps as soon as you finish.
Clean up
To avoid ongoing charges, stop the application, wait until it reports READY, then delete the stack:
Deleting the stack removes the Kinesis data streams, the application, the IAM role, the producer Lambda function, and the log group. If the stack created the AWS KMS key, AWS CloudFormation schedules it for deletion after a 30-day waiting period. Delete the JAR from your S3 bucket separately.
Conclusion
Validating a streaming pipeline at production scale requires a data source that delivers both realistic data and sustained volume. With the stream multiplier pattern, real distributions come from the pre-recorded capture, and you control volume through a single parameter, multiple.factor, rather than through storage. To get started, clone the sample-datastream-multiplier repository and follow the steps in Deploy the solution, starting at a factor of 2x or 3x. For more on building and running applications on the service, see the Amazon Managed Service for Apache Flink Developer Guide.
About the authors
Will ICE Excesses Be Investigated?
Post Syndicated from The Atlantic original https://www.youtube.com/watch?v=baaRxLRGXeo
[$] Synaptics patent claims stop work on DisplayLink drivers
Post Syndicated from jzb original https://lwn.net/Articles/1102549/
Mike Lothian owns a docking station (or dock) that uses a DisplayLink chipset
that had, at least in his opinion, subpar performance on Linux. He
decided to try improving the Linux driver, with LLM assistance, but ran into one
problem that he could not solve—so he asked for help, hoping that
Synaptics’s developers would lend a hand. (DisplayLink was acquired by
Synaptics in 2022.) Rather than help him in improving the
driver, however, the Synaptics legal team responded with patent infringement
claims, a demand
that he cease unauthorized implementation of DisplayLink technology, and threats
of expensive legal penalties. For now, it appears that Linux users of the
company’s docks will have to continue to live without feature parity with other
platforms.
Firefox 160 released
Post Syndicated from jzb original https://lwn.net/Articles/1106542/
Version
160 of the Firefox web browser has been released. Notable features in this
release include the ability to block sites from asking to handle
“mailto:” links, ability to play Matroska files with FLAC, MP3, or PCM
audio, playback speed controls in the picture-in-picture
video player, and a new Mini
Window feature that is in early development.
Critical vulnerabilities in N-able N-central prompt hosted shutdown
Post Syndicated from Rapid7 original https://www.rapid7.com/blog/post/etr-critical-vulnerabilities-in-n-able-n-central-prompt-hosted-shutdown
Overview
On November 9, 2026, N-able announced that it was responding to the public disclosure of critical vulnerabilities affecting N-central, its remote monitoring and management (RMM) platform.
In a public disclosure titled Able2Shell, an independent researcher has published details and proof-of-concept (PoC) code covering 33 issues. According to the disclosure, the issues include unauthenticated remote code execution (RCE), privilege escalation to root, credential disclosure, and unauthorized account creation. One unauthenticated chain combines XML external entity (XXE) and session-handling weaknesses to execute code as the nable service account. Other demonstrated chains involve an administrator viewing malicious patch metadata or use ProductAdmin credentials. Rapid7 Intelligence is currently triaging the newly published details.
Before the hotfix release on November 10, N-able reported scanning activity associated with the published PoC code and said it had no evidence that any customer environment had been successfully exploited. The vendor advised keeping N-central deployments offline while it developed and validated a hotfix. Hosted N-central classic environments were offline, according to the same notice. That notice did not yet include CVE identifiers or CVSS scores.
N-central is used by managed service providers (MSPs) and enterprise IT teams to administer endpoints and infrastructure. Compromise of an RMM server can put downstream managed environments at risk. N-central has previously been targeted through separate vulnerabilities, including an authentication bypass covered by Rapid7 in August 2026. Given the platform’s administrative reach and the availability of public exploit code, Rapid7 recommends treating the current disclosure as an emergency.
Update #1: On November 10, 2026, N-able released N-central 2026.4 Hotfix 2 (build 2026.4.1.26), addressing seven CVEs. The vendor plans a follow-up hotfix with further security updates. On November 11, N-able confirmed that hosted N-central servers across all regions had been successfully upgraded.
Mitigation guidance
Rapid7 strongly recommends that organizations operating on-premises N-central servers upgrade to N-central 2026.4 Hotfix 2 (build 2026.4.1.26) on an emergency basis outside of normal patching cycles, and keep servers offline until successfully upgraded. Hosted servers are upgraded by N-able.
Customers in both hosted and on-premises environments must also upgrade their Agents and Probes. To maintain communication, upgrade Agents first, then Probes, following the vendor’s compatibility guidance for the Patch Management Engine (PME).
-
Affected versions: The researcher reports testing N-central Appliance 2026.4.0.31. N-able’s current notice does not specify the full affected-version range.
-
Fixed versions: N-central 2026.4 Hotfix 2 (build 2026.4.1.26) addresses the seven CVEs listed below.
According to N-able’s release notes, the hotfix addresses:
|
CVE |
Description |
|---|---|
|
Multiple XXE vulnerabilities |
|
|
Multiple OGNL injection vulnerabilities |
|
|
Local privilege escalation to root through nable-writable syslog-ng configuration |
|
|
Stored XSS through MMS3 patch metadata in an administrator context |
|
|
Schema-hint SSRF through service-import schema validation |
|
|
RCE through file-repository upload path traversal; credited to Nate Fair, Sprocket Security |
|
|
Local privilege escalation through insecure IPC channels |
Further security updates are planned in a follow-up hotfix. Organizations should monitor the vendor’s guidance and apply subsequent fixes as they become available.
Rapid7 also recommends reviewing N-central servers and downstream managed systems for signs of compromise and engaging incident responders if suspicious activity is identified.
For the latest mitigation guidance, please refer to N-able’s security incident notice.
Rapid7 customers
Exposure Command, Vulnerability Management, and Nexpose
Exposure Command, Vulnerability Management, and Nexpose customers can identify N-able N-central “potential” vulnerabilities based on presence of software with remote unauthenticated checks with the release on November 11th, 2026. Note that potential check type must be enabled in the scan template before scanning.
Unauthenticated checks that validate vulnerable versions are in development.
Intelligence Hub
Customers leveraging Rapid7’s Intelligence Hub can access Suricata detection rules for CVE-2026-125883, CVE-2026-125878, CVE-2026-125879, CVE-2026-125880, CVE-2026-125881, and CVE-2026-125882.
Updates
-
November 10, 2026: Initial publication.
- November 11, 2026: Added hotfix availability, seven CVE identifiers, hosted upgrade confirmation, and updated remediation guidance. Noted the planned follow-up hotfix.
- November 11, 2026: Added availability of Suricata detection rules within Intelligence Hub.
- November 11, 2026: Added Exposure Command, Vulnerability Management, and Nexpose subsection under the Rapid7 customers section.
Five Signs Your MDR is All Alert, No Action
Post Syndicated from Rapid7 original https://www.rapid7.com/blog/post/five-signs-your-mdr-is-all-alert-no-action
Your managed detection and response (MDR) provider flags suspicious activity, and your analyst spends the next hour finding the account, checking logs, and deciding whether anything needs to happen. By the time the investigation is underway, the alert feels less like help and more like a task assignment.
MDR should bring your team capacity and expertise when it needs them. If the service keeps handing the hardest work back to your analysts, these five signs can help you work out where the arrangement is falling short.
1. Every alert arrives with homework
If your analysts are still sorting through the same recurring false positives, the extra coverage may be creating more work than it removes. Even an alert worth investigating is only so useful when your team has to gather the basic context before it can make a decision. Take a few recent alerts and look at what your provider had already checked when it contacted you. You should be able to see how it separated routine activity from a credible threat, and what it did to stop familiar noise from coming back.
2. It spots the fire, but cannot see the fuel
A suspicious login involving an account with broad access deserves a different response from the same activity on a tightly restricted account. The systems within reach, their importance to the business, and any known weaknesses all help determine what needs attention first. When your MDR leaves your team to assemble that picture during an investigation, valuable time goes into finding context that could have informed the response from the start. Find out how your provider uses information about assets, identities, vulnerabilities, and current threats, including what it can help you address before an incident occurs.
3. Your team gets incident updates, but few useful lessons
When a provider contains a threat and closes the case, your team should come away with more than a record of what happened. Consider the last significant investigation: did it lead to a clearer detection, a stronger response plan, or a better understanding of how an attacker moved through your environment? If similar activity appears three months later and your analysts have to work through the same questions, the service has missed a chance to make them better prepared. Expertise is most useful when your team can apply some of it next time.
4. Your response support has a spending limit
If an incident is still developing when your included response hours run out, continued specialist support may require another purchasing decision. Limits on hours, incident scope, or responder involvement can turn an agreed service into an unplanned budget request under pressure.
Ask what happens when an investigation expands across systems or continues longer than expected. Establish whether incident response is unlimited, which activities that includes, how long specialists stay involved, and what could trigger additional charges. When business operations and leadership confidence are already at stake, uncertainty about continued support adds financial and operational pressure at the point you need a clear path forward.
5. Your provider’s reports prove it was busy
A monthly report might show hundreds of alerts reviewed and dozens of investigations opened. That gives you a sense of volume, though it says little about what the provider found or did. Choose a closed investigation and follow it from the initial signal through to the outcome: what evidence was considered, what was ruled out, what action was taken, and when did your team become involved? If you need several calls to piece together that story, the charts are doing a better job of showing activity than the service is of showing its work.
If several of these signs feel familiar, bring a few real alerts and investigations to your next service review. Ask your provider to show what it investigated, which actions it took, and what improved afterward. The answers will give you a clearer view of the work your MDR is taking on and the work that still lands with your team.
For more questions to use when reviewing your service, explore the MDR buyer’s guide.
Security updates for Tuesday
Post Syndicated from jzb original https://lwn.net/Articles/1106522/
Security updates have been issued by AlmaLinux (curl, dpdk, glibc, kernel, nodejs-nodemon, nodejs22, nodejs24, nodejs:18, nodejs:22, patch, qt5, qt5-qtdeclarative, ruby, ruby4.0, ruby:3.3, ruby:4.0, squid:4, tomcat, util-linux, and webkit2gtk3), Debian (symfony and tomcat10), Fedora (bind, dnf5, kernel, kernel-headers, libmodulemd, maturin, perl-CGI, perl-Net-IDN-Encode, perl-Starlet, python-jiter, python-pydantic-core, python-pysequoia, python3-docs, python3.14, python3.15, ruff, rust-afterburn, rust-astral_async_zip, rust-clearscreen, rust-jiter, rust-lzma-rust2, rust-mailparse, rust-pyo3-introspection, rust-python-pkginfo, rust-serde_json, rust-testresult, rust-zip, selenium-manager, ty, and uutils-coreutils), Mageia (glibc, packages, php-smarty, python-aiohttp, and thunderbird), Oracle (curl, firefox, gdb, glibc, kernel, oVirt 4.5 ovirt-engine-wildfly, perl-YAML:1.24, and tesseract), Slackware (krb5), SUSE (ansible-core, apr-util, aspell, buildpacks-cli, dpdk22, firefox, git-bug, glib2, google-cloud-sap-agent, haproxy, jsoup, kernel, krb5, libjxl, librsvg, libruby4_0-4_0, libunbound8, libXtst, nodejs24, nvidia-open-driver-G07-signed, PackageKit, perl-XS-Parse-Keyword, poppler, python, python-Brotli, rsyslog, tekton-cli, tomcat, tomcat10, tomcat11, trivy, udisks2, xen, zchunk, and zk), and Ubuntu (apache2, ca-certificates, fetchmail, freerdp3, kernel, libgphoto2, libheif, libnfs, libsoup3, linux, linux-aws, linux-aws-5.15, linux-aws-fips, linux-azure, linux-azure-5.15, linux-azure-fde-5.15, linux-azure-fips, linux-gcp, linux-gcp-5.15, linux-gcp-fips, linux-gke, linux-gkeop, linux-hwe-5.15, linux-ibm, linux-ibm-5.15, linux-intel-iot-realtime, linux-intel-iotg, linux-intel-iotg-5.15, linux-kvm, linux-lowlatency, linux-lowlatency-hwe-5.15, linux-nvidia, linux-nvidia-tegra, linux-nvidia-tegra-5.15, linux-oracle, linux-oracle-5.15, linux-realtime, linux, linux-aws, linux-aws-fips, linux-aws-hwe, linux-azure, linux-azure-4.15, linux-azure-fips, linux-fips, linux-gcp, linux-gcp-4.15, linux-gcp-fips, linux-hwe, linux-kvm, linux-oracle, linux, linux-aws, linux-aws-fips, linux-azure, linux-azure-5.4, linux-azure-fips, linux-bluefield, linux-fips, linux-gcp, linux-gcp-5.4, linux-gcp-fips, linux-hwe-5.4, linux-ibm, linux-ibm-5.4, linux-iot, linux-kvm, linux-oracle, linux-oracle-5.4, linux-xilinx-zynqmp, linux, linux-aws, linux-azure, linux-azure-fips, linux-gcp, linux-gke, linux-ibm, linux-lowlatency, linux-oracle, linux-vmware, linux, linux-aws, linux-gcp, linux-ibm, linux-oem-7.0, linux-oracle, linux, linux-aws, linux-kvm, linux-lts-xenial, linux-aws, linux-aws-5.4, linux-raspi, linux-raspi-5.4, linux-aws-6.8, linux-gcp-6.8, linux-ibm-6.8, linux-lowlatency-hwe-6.8, linux-nvidia, linux-realtime-6.8, linux-aws-7.0, linux-azure-fde, linux-azure-fde-7.0, linux-gcp-7.0, linux-gke, linux-oracle-7.0, linux-realtime, linux-aws-fips, linux-gcp-fips, linux-gkeop, linux-realtime, linux-azure, linux-azure-6.8, linux-azure-fde-6.8, linux-azure-fde, linux-oracle-6.8, linux-raspi, linux-raspi-realtime, linux-raspi, openjdk-17, openjdk-21, openjdk-25, openjdk-27, openjdk-8, openjdk-lts, perl, and pyasn1).
Pete Hegseth #lastweektonight
Post Syndicated from LastWeekTonight original https://www.youtube.com/shorts/Exttj5RMQV4