Post Syndicated from BeardedTinker original https://www.youtube.com/watch?v=k9_FPbDHUo8
Pete Hegseth & Christian Nationalism #lastweektonight
Post Syndicated from LastWeekTonight original https://www.youtube.com/shorts/-iN0IVjOvjM
Track SMS spend by team and use case with AWS End User Messaging
Post Syndicated from Rommel Sunga original https://aws.amazon.com/blogs/messaging-and-targeting/track-sms-spend-by-team-and-use-case-with-aws-end-user-messaging/
If you send SMS for several teams or applications from one AWS account, you’ve probably been asked which team drove last month’s bill. The bill and the default AWS Cost Explorer view show one total for AWS End User Messaging. Grouping by usage type doesn’t help when teams send to the same country with the same type of origination identity, because their message fees land on one line. So each month, someone splits the bill by hand in a spreadsheet.
In this post, we show how to attribute AWS End User Messaging SMS spend to the teams, cost centers, and use cases that generate it. We walk through tagging your origination identities, activating those tags for cost allocation, and reading the results in Cost Explorer. Every step uses the AWS Management Console, and we include the equivalent AWS Command Line Interface (AWS CLI) commands if you want to script the setup.
This post is for FinOps practitioners, platform owners, and solutions architects who run shared SMS workloads and need showback or chargeback by team.
Challenges with tracking SMS spend
Organizations that send SMS for several teams from one AWS account commonly face these challenges:
- The bill and the default Cost Explorer view report AWS End User Messaging as a single service, with no split by team or application.
- Grouping by usage type shows what you paid for, such as message fees by destination country and origination identity type, but not who sent the messages.
- When two or more teams send to the same country with the same type of origination identity, their message fees combine into one usage type line. For example, three sender IDs that all send to the United Kingdom share one line.
- Finance teams need a monthly showback or chargeback report that they can rerun without manual spreadsheet work.
To address these challenges, you can tag each origination identity with the team and use case that owns it, and then activate those tag keys as cost allocation tags. Cost Explorer can then group your SMS spend by any of those keys, and the same tags flow into your AWS Cost and Usage Report (CUR) and AWS Data Exports.
Solution overview
Cost allocation for AWS End User Messaging SMS works at the level of the origination identity. Phone numbers, sender IDs, and phone pools are AWS resources with their own Amazon Resource Names (ARNs), and each one can carry up to 50 tags. When you send a message from a tagged phone number or sender ID, AWS records the charges for that message against that resource, along with its tags. The monthly fee for a tagged phone number carries its tags too.
The process has four stages, and each stage maps to one or more of the steps in this post:
- Tag your origination identities (Steps 1 and 2) – Assign each phone number and sender ID a set of tags, such as
business-unit,cost-center, anduse-case. - Send traffic (Step 3) – Messages from your tagged identities generate charges that carry the tags. New tag keys can take up to 24 hours to appear in AWS Billing and Cost Management.
- Activate the tag keys (Steps 4 and 5) – In the management account of your organization, or in a standalone account, activate the keys as cost allocation tags. Activation can take up to another 24 hours.
- Analyze (Steps 6 and 7) – Group your SMS spend by tag in Cost Explorer, or use the tags in your cost and usage reports.
Cost Explorer places charges that don’t belong to a tagged resource in the untagged group, a group that it labels No tag key: key-name.
The following diagram illustrates how the charges from a tagged sender ID reach Cost Explorer.
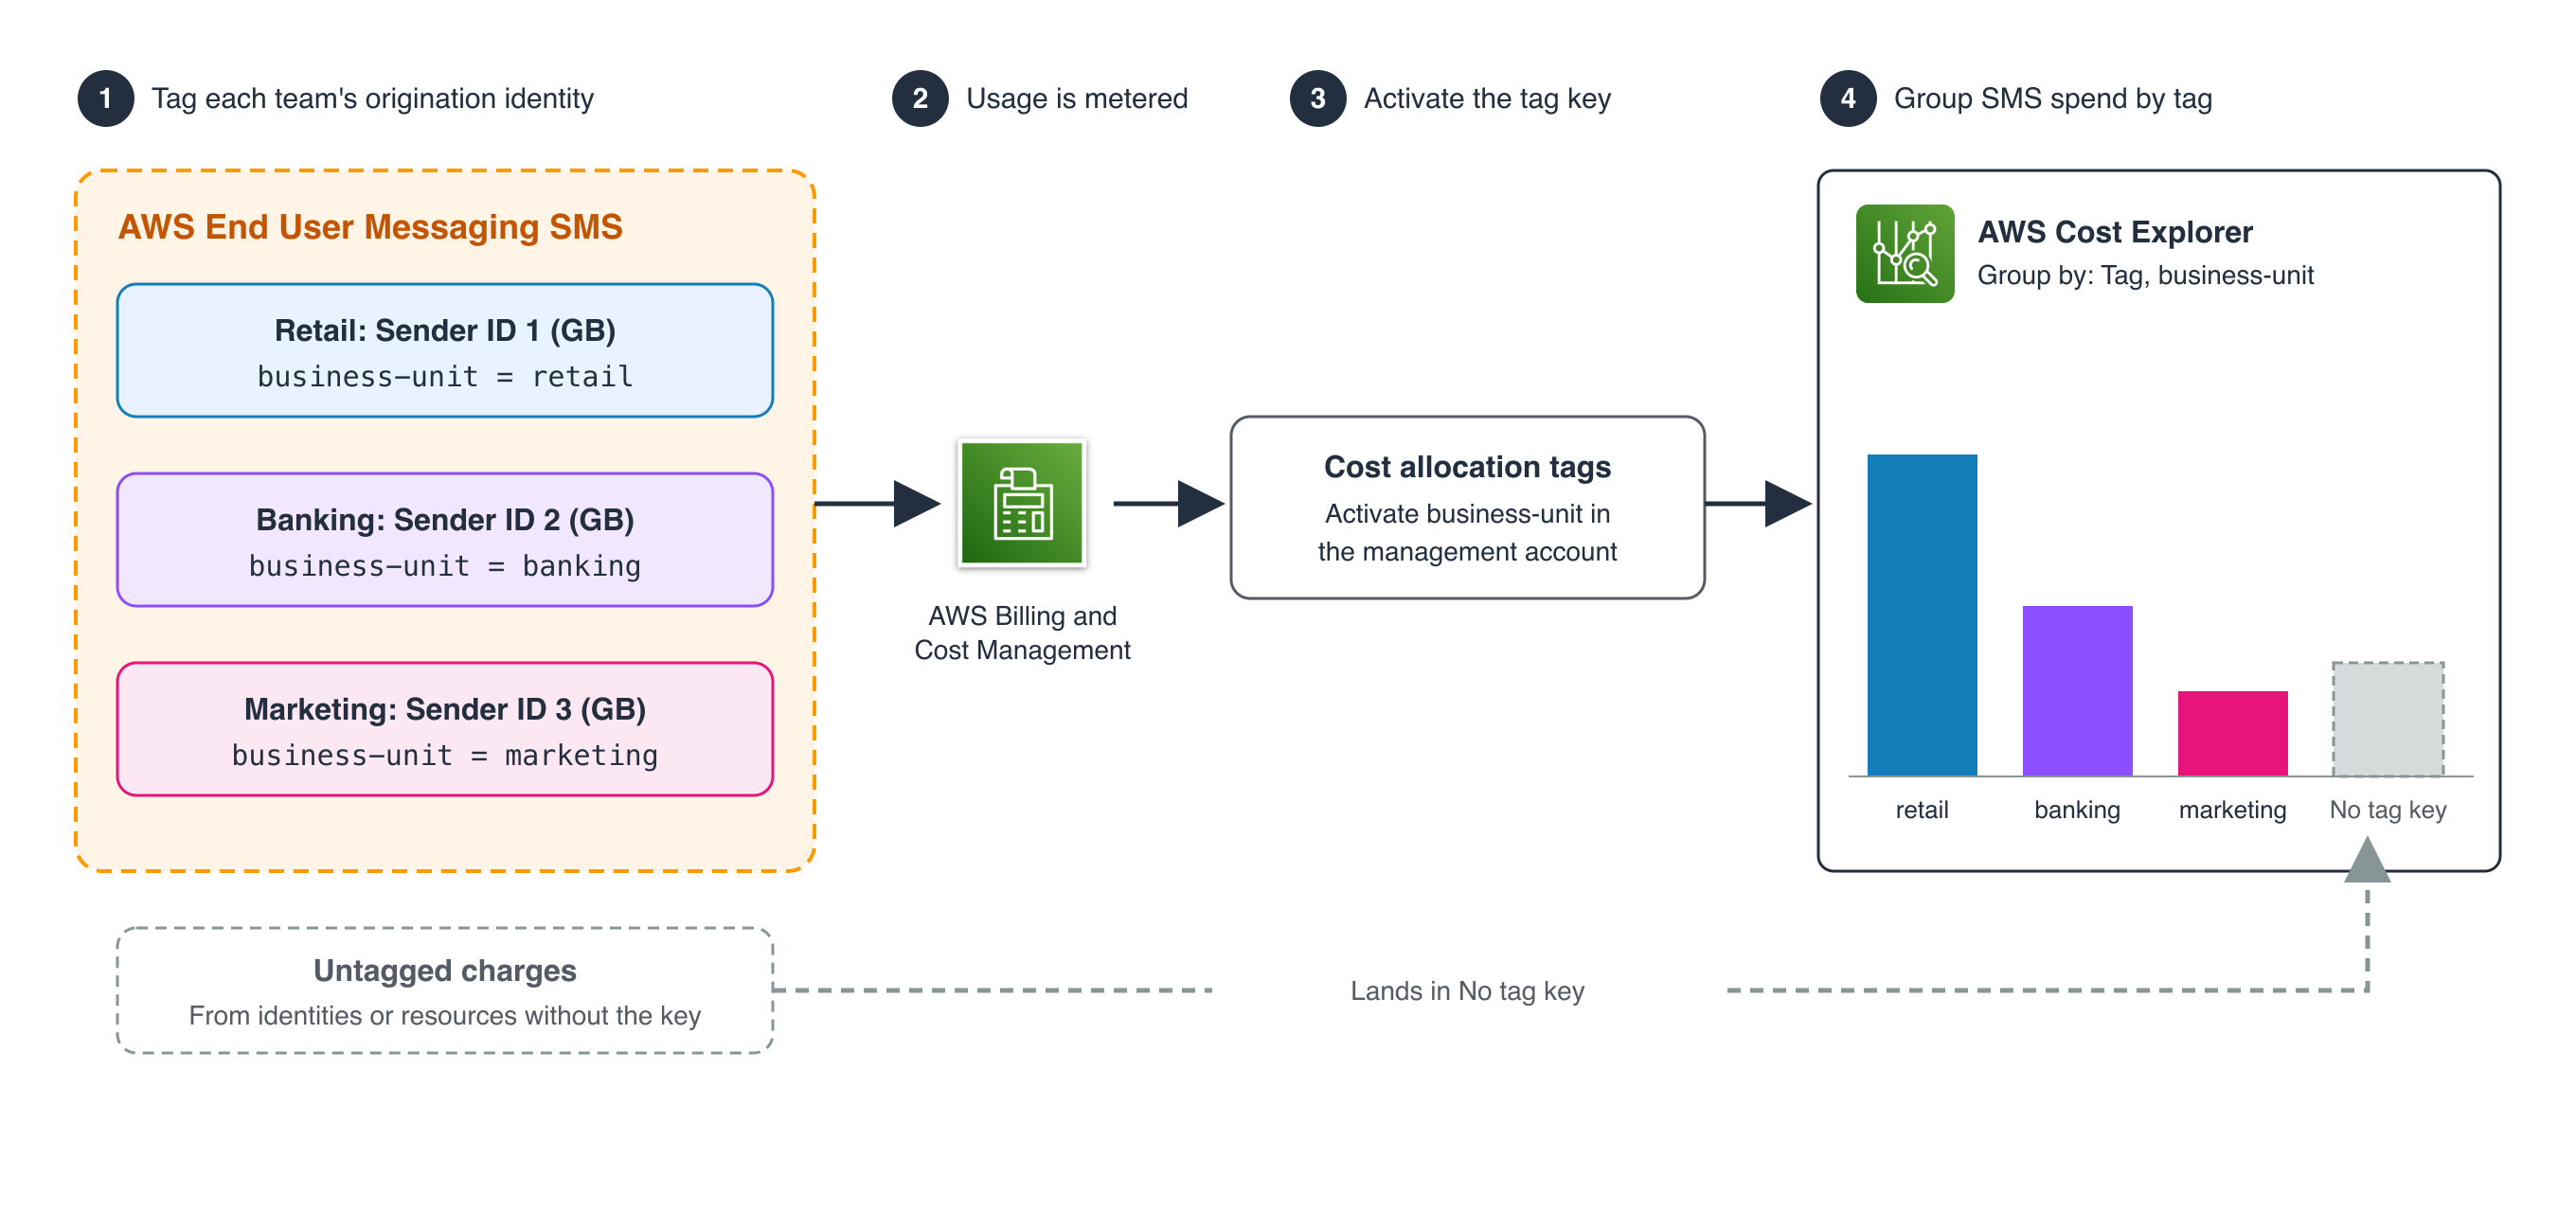
Figure 1: Each business unit sends from its own tagged sender ID. After the business-unit key is activated, Cost Explorer splits SMS spend by team. Charges from identities or resources without the key appear under No tag key.
Example scenario
Throughout this post, AnyCompany runs three business units that send SMS from one AWS account. All three send to the United Kingdom, each with its own sender ID, so usage type alone can’t separate their spend. AnyCompany uses the following tagging plan.
| Origination identity | business-unit | cost-center | use-case |
| Sender ID 1 (United Kingdom) | retail | cc-4100 | order-notifications |
| Sender ID 2 (United Kingdom) | banking | cc-7250 | otp |
| Sender ID 3 (United Kingdom) | marketing | cc-3300 | promotional |
Prerequisites
Before you begin, make sure you have the following components and permissions in place:
- An AWS account with AWS End User Messaging SMS and at least one origination identity (phone number or sender ID) that you send messages from.
- Access to the management account of your organization in AWS Organizations, or a standalone account. Only these accounts can activate cost allocation tags. If your SMS runs in a member account, you tag the origination identities there, and the management account activates the keys and requests any backfill.
- Cost Explorer enabled. The management account sees costs for every account. A member account sees only its own costs, and the management account can turn off Cost Explorer access for member accounts.
- AWS Identity and Access Management (IAM) permissions to view and tag AWS End User Messaging SMS resources (
sms-voice:DescribePhoneNumbers,sms-voice:DescribeSenderIds,sms-voice:DescribePools,sms-voice:TagResource,sms-voice:UntagResource, andsms-voice:ListTagsForResource). If you use the AWS Resource Groups Tagging API, you also needtag:TagResourcesandtag:GetResources. - IAM permissions in the management account or standalone account to activate and backfill cost allocation tags (
ce:ListCostAllocationTags,ce:UpdateCostAllocationTagsStatus,ce:StartCostAllocationTagBackfill, andce:ListCostAllocationTagBackfillHistory), and to view Cost Explorer reports, such asce:GetCostAndUsage,ce:GetDimensionValues, andce:GetTags.
Step 1: Plan your tag keys
Decide your keys before you tag anything. Tag keys and values are case sensitive, so Business-Unit and business-unit become two separate keys in your cost reports. Pick one convention, such as lowercase with hyphens, and use it everywhere.
AnyCompany uses three keys: business-unit (which team owns this spend), cost-center (which budget to charge), and use-case (what the traffic is for).
A tag describes the resource, so a sender ID that two teams share can only carry one business-unit value. If you need to split spend between teams, give each team its own origination identity. To see spend for each origination identity, for example, when one team owns several sender IDs, add a key that names the identity, such as identity-name.
Don’t include sensitive information, such as customer names or phone numbers, in tags. Cost allocation tags appear in billing reports that many people in your organization can read.
Step 2: Tag your origination identities
The following steps tag a sender ID. The steps for a phone number are the same, starting from Phone numbers under SMS & RCS.
- Open the AWS End User Messaging console.
- In the navigation pane, under SMS & RCS, choose Sender IDs.
- Choose the sender ID that you want to tag.
- On the Tags tab, choose Manage tags.
- Choose Add new tag, and then enter a Key and Value. Repeat for each key in your tagging plan.
- Choose Save changes.
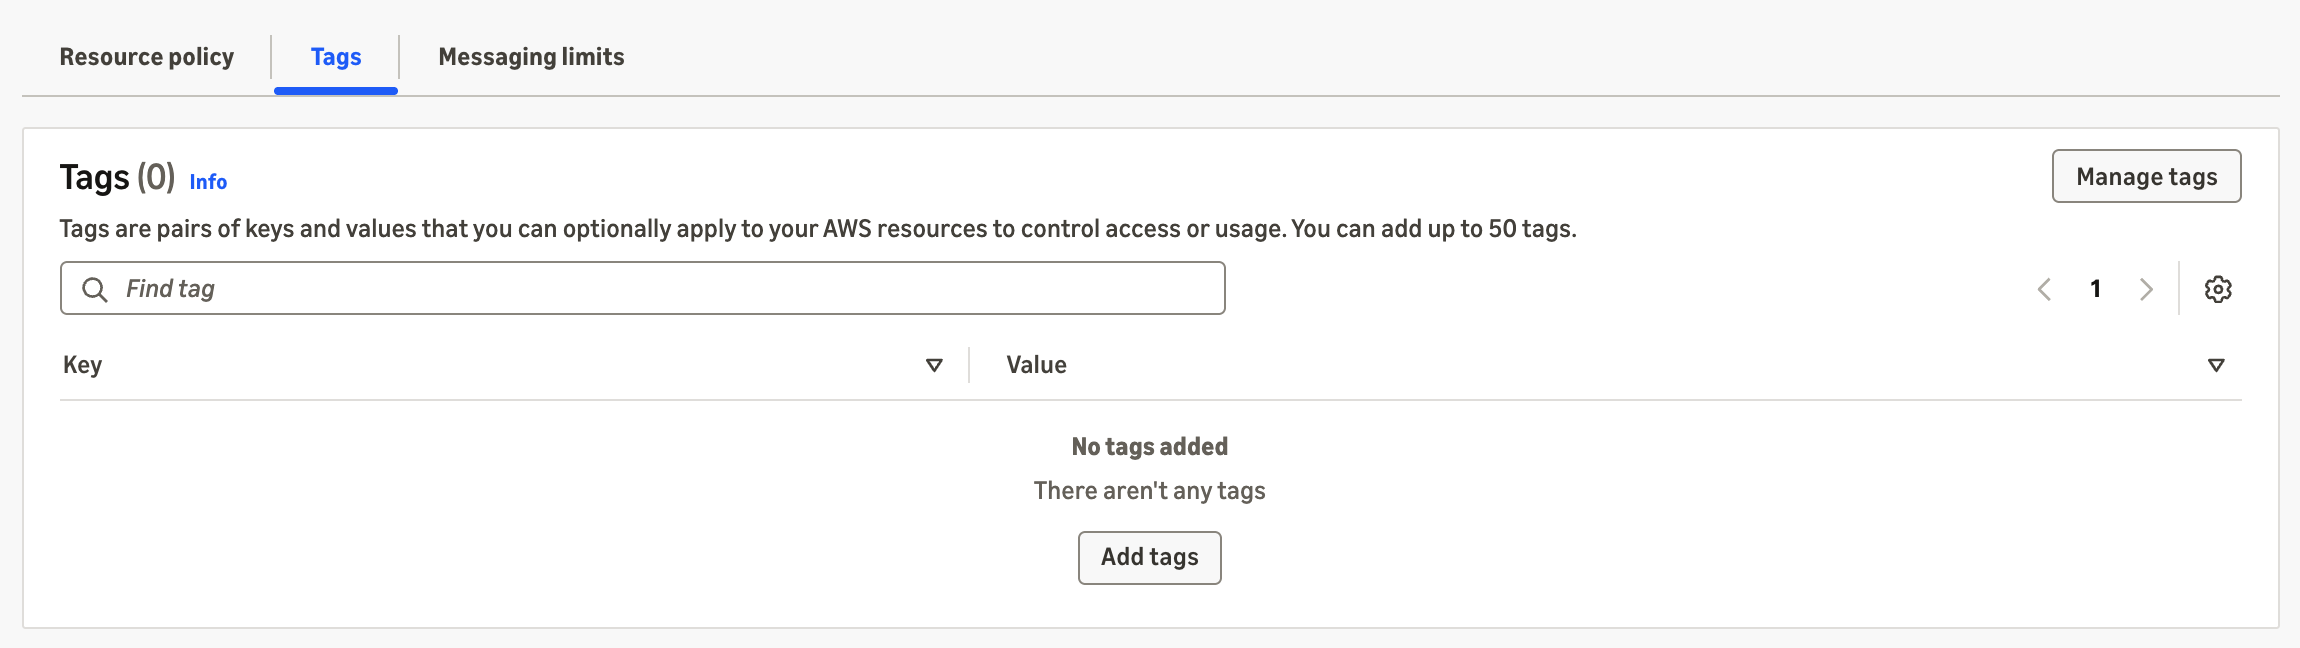
Figure 2: The Tags tab of a sender ID that has no tags yet. Choose Manage tags to add, edit, or remove tags.
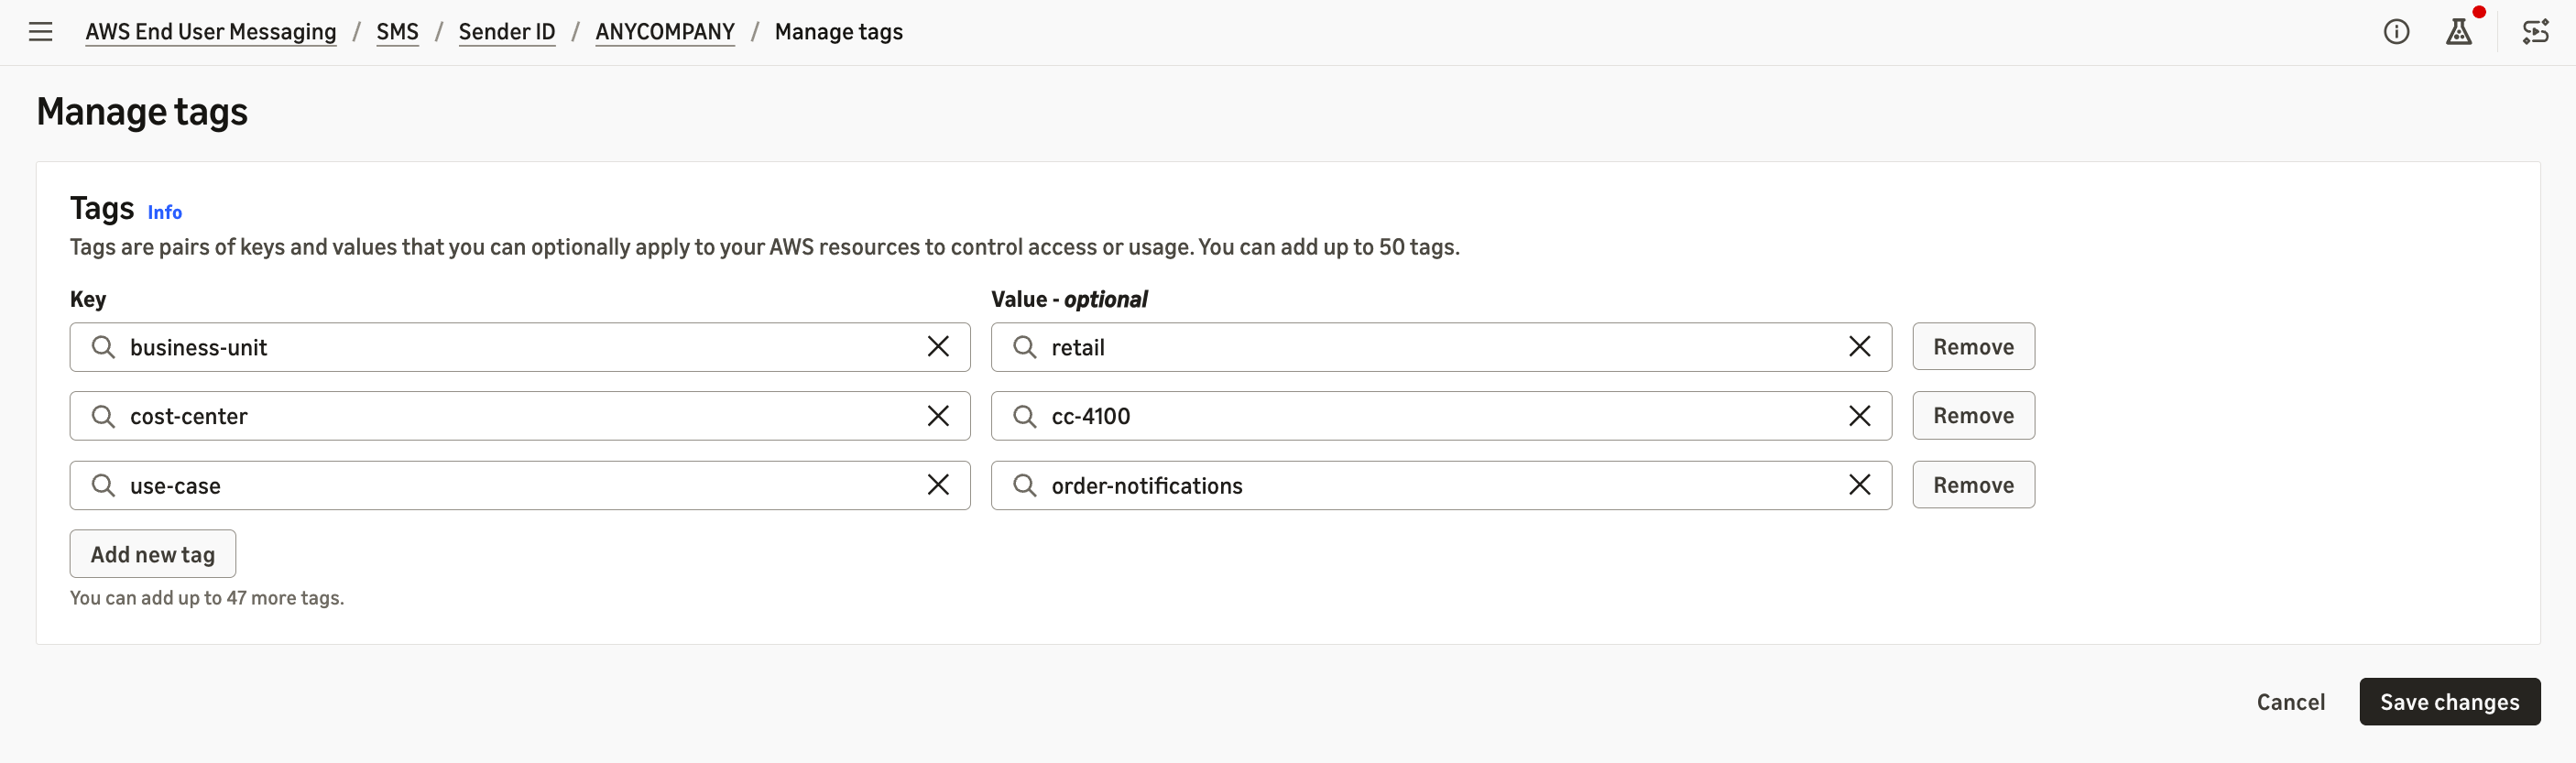
Figure 3: The Manage tags dialog for the retail sender ID. Enter a key and value for each tag in your tagging plan.
If you send through a phone pool, tag every phone number and sender ID in the pool. Message charges carry the tags of the origination identity that sends the message, not the tags on the pool.
The AWS Resource Groups Tag Editor console doesn’t list AWS End User Messaging SMS resources, but the Resource Groups Tagging API supports them. To tag many identities at once, use the TagResource operation with the AWS CLI or an AWS SDK, or the Tagging API. For examples, see Automate with the AWS CLI later in this post.
Step 3: Send traffic and wait for the tag keys to appear
Send messages from your tagged identities as usual. A new key can take up to 24 hours to appear on the Cost allocation tags page. You can’t activate it until it does, but you can attribute charges from that period with a backfill in Step 5.
If a key still isn’t listed after 24 hours, check the tag on the resource’s Tags tab. Also confirm that the key’s spelling and case match your plan, and that you’re signed in to the management account or standalone account.
Step 4: Activate the tag keys
- Sign in to the management account, or your standalone account, and open the AWS Billing and Cost Management console.
- In the navigation pane, choose Cost Allocation Tags.
- In the Cost allocation tags table, select
business-unit,cost-center, anduse-case. To find a key, enter it in Find cost allocation tags. Keys from tags on your resources have the type Resource. - Choose Activate.
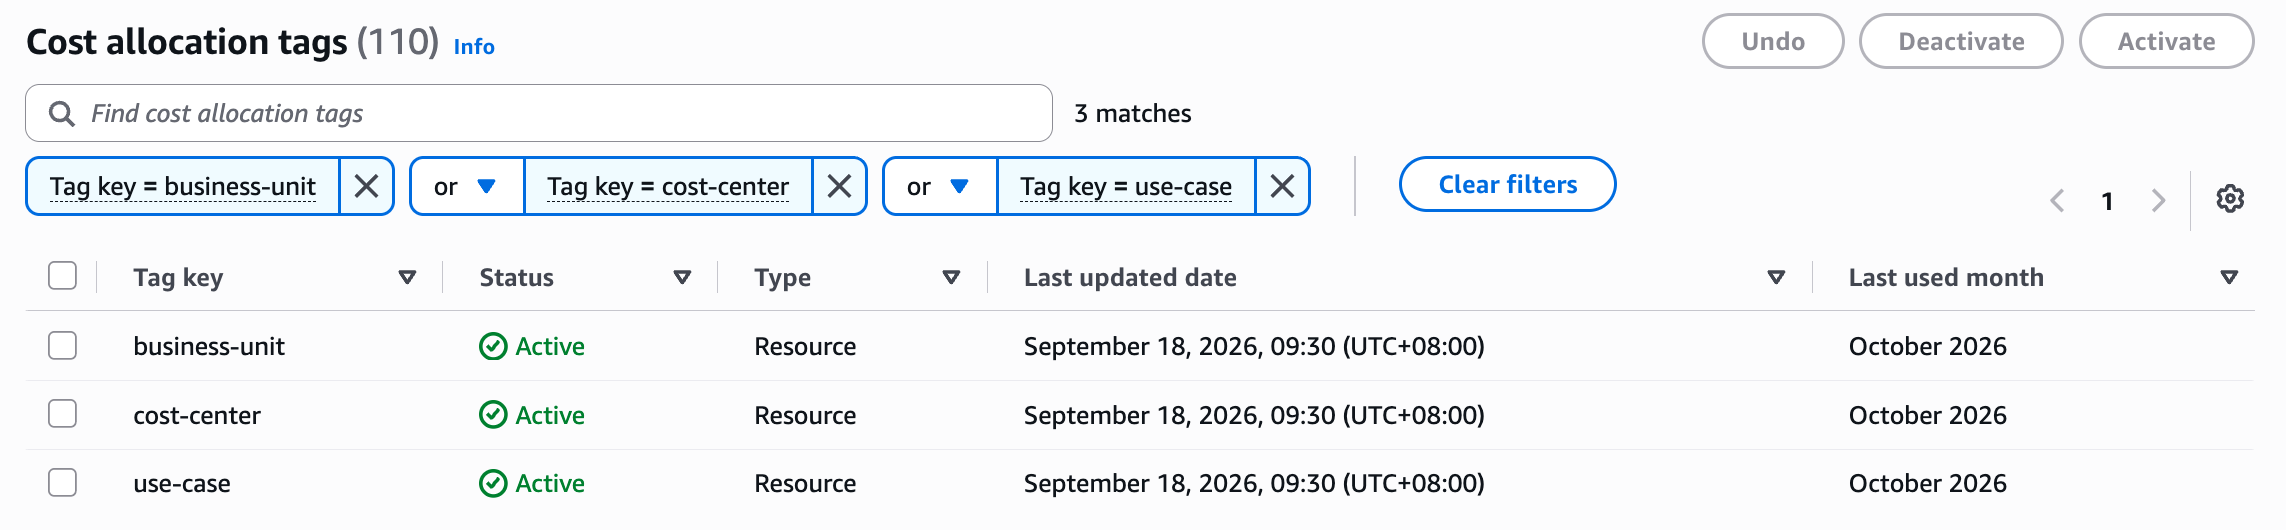
Figure 4: The Cost allocation tags page showing AnyCompany’s three keys after activation.
After you activate a key, it can take up to 24 hours to become active in Cost Explorer. Activation applies from that point forward, so charges from before activation stay in the untagged group unless you backfill them.
Step 5 (optional): Backfill earlier months
If you tagged your origination identities before activating the keys, the management account can backfill up to 12 months.
- On the Cost allocation tags page, choose Backfill tags.
- Choose the earliest month in which your origination identities carried the tags.
- Choose Confirm.
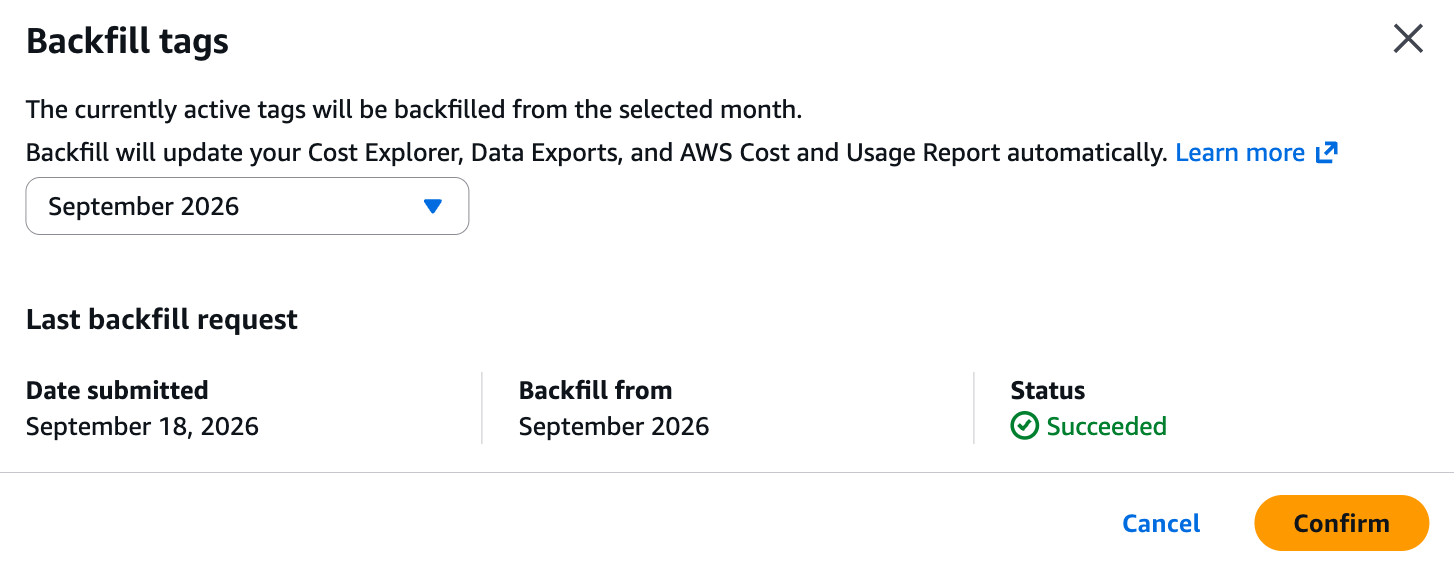
Figure 5: The Backfill tags dialog. Choose the earliest month when your origination identities carried the tags.
A backfill only adds tag values for periods when the tag was attached to the resource. For example, if you tagged a sender ID on September 17 and request a backfill from September 1, charges from September 1–16 remain untagged. You can submit one backfill request every 24 hours, and Cost Explorer shows the results after its next daily data refresh. A backfill applies each key’s current status, so any key you’ve since deactivated is also removed from earlier months.
Step 6: View SMS spend by tag in Cost Explorer
- Open Cost Explorer.
- In the Report parameters panel, set Date Range and Granularity. For example, choose the last three months and Monthly.
- Under Group by, for Dimension, choose Tag, and then for Tag, choose your key, such as
business-unit. Group by with a tag key splits your spend into one line per tag value. A Tag filter only narrows the data to the values that you select. - Under Filters, for Service, choose End User Messaging, and then choose Apply.
Note: SMS carrier fees are billed under this service. The separate End User Messaging Third Party Fees service covers fees such as the WhatsApp fees that Meta charges.
From the management account, you can also filter by Linked account to see the costs of one member account.
Before any tagged usage is metered for a key, every charge sits in a single group, as shown in the following screenshot.
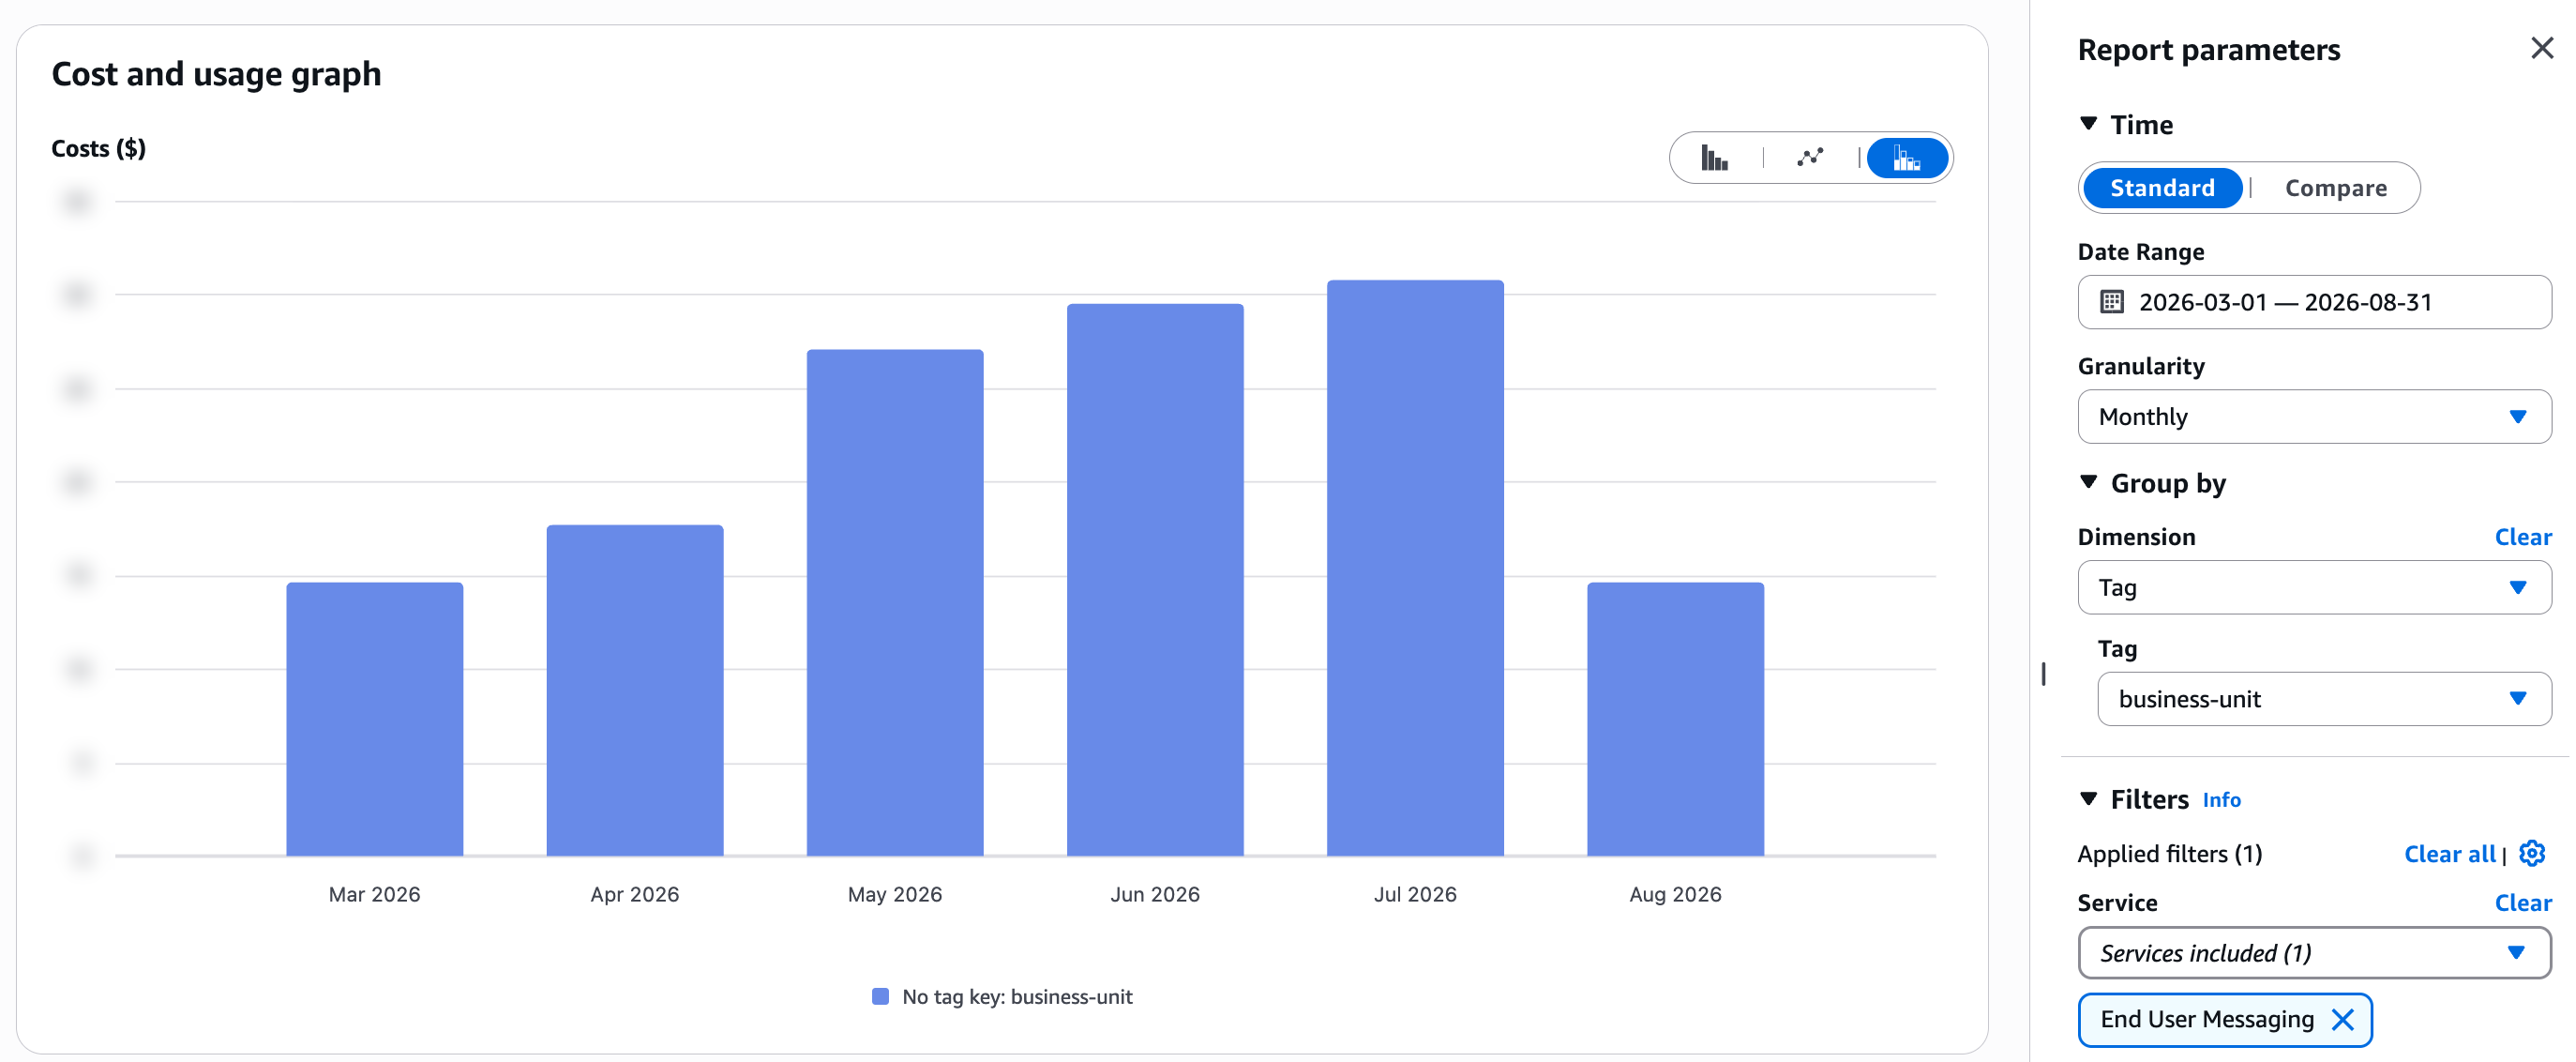
Figure 6: Cost Explorer grouped by business-unit for the months before the sender IDs were tagged. All AWS End User Messaging spend appears under No tag key: business-unit.
If you still see only No tag key more than 24 hours after activation, check that the key shows Active on the Cost allocation tags page. Also confirm that you’ve sent messages from a tagged identity since activation, or that you requested a backfill.
After the key is active and tagged usage has been metered, Cost Explorer shows one group for each tag value.
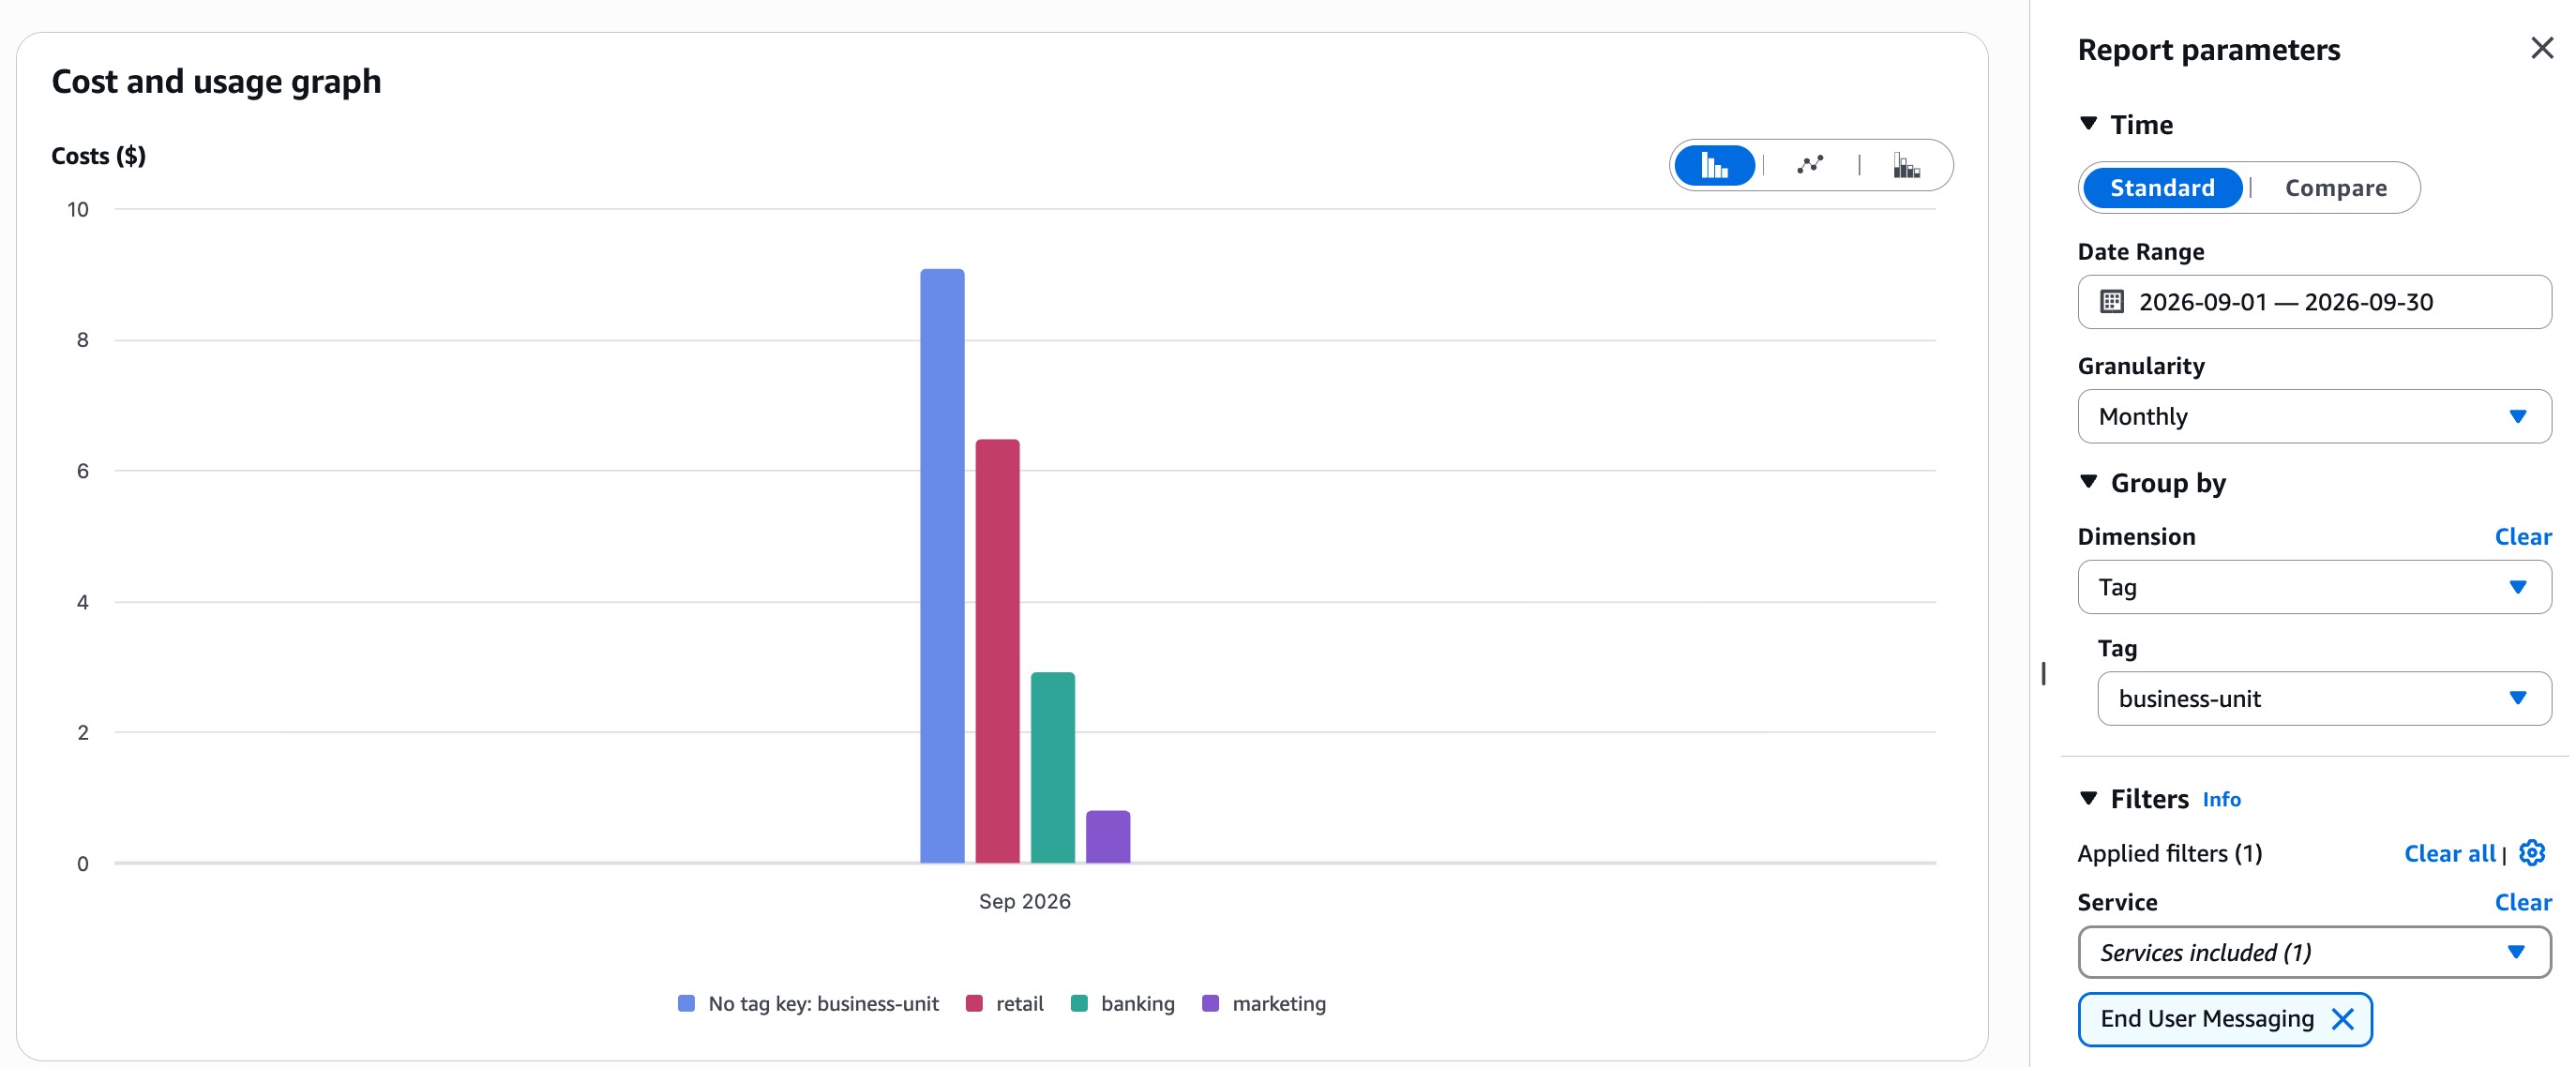
Figure 7: AnyCompany’s AWS End User Messaging spend for September, grouped by business-unit. Charges from resources without the key appear under No tag key: business-unit.
The No tag key group holds charges that have no value for the key. These include:
- Origination identities that you haven’t tagged yet, or that use a different spelling or case of the key.
- Other AWS End User Messaging resources that don’t carry the key, such as RCS agents.
- Messages sent over shared routes, which don’t use one of your origination identities.
- 10DLC registration fees, such as brand, vetting, and campaign fees.
- Charges from before the tag was attached or the key was activated.
To reuse this view each month, keep a relative date range, such as the last three months, and choose Save to report library.
Step 7: Combine usage type and tags
Group by Usage type to see what you’re paying for. Usage type names include the AWS Region prefix, the destination country, the origination identity type, and the type of charge, for example USE1-OutboundSMS-GB-Standard-Senderid-MessageFees. Message fees for all three AnyCompany United Kingdom sender IDs appear on this one line.
To split that line by team, set Group by to your tag key and add a Usage type filter for that line. The table then lists a costs row and a usage row for each tag value. To see only the cost rows, enter costs in the search box above the table.
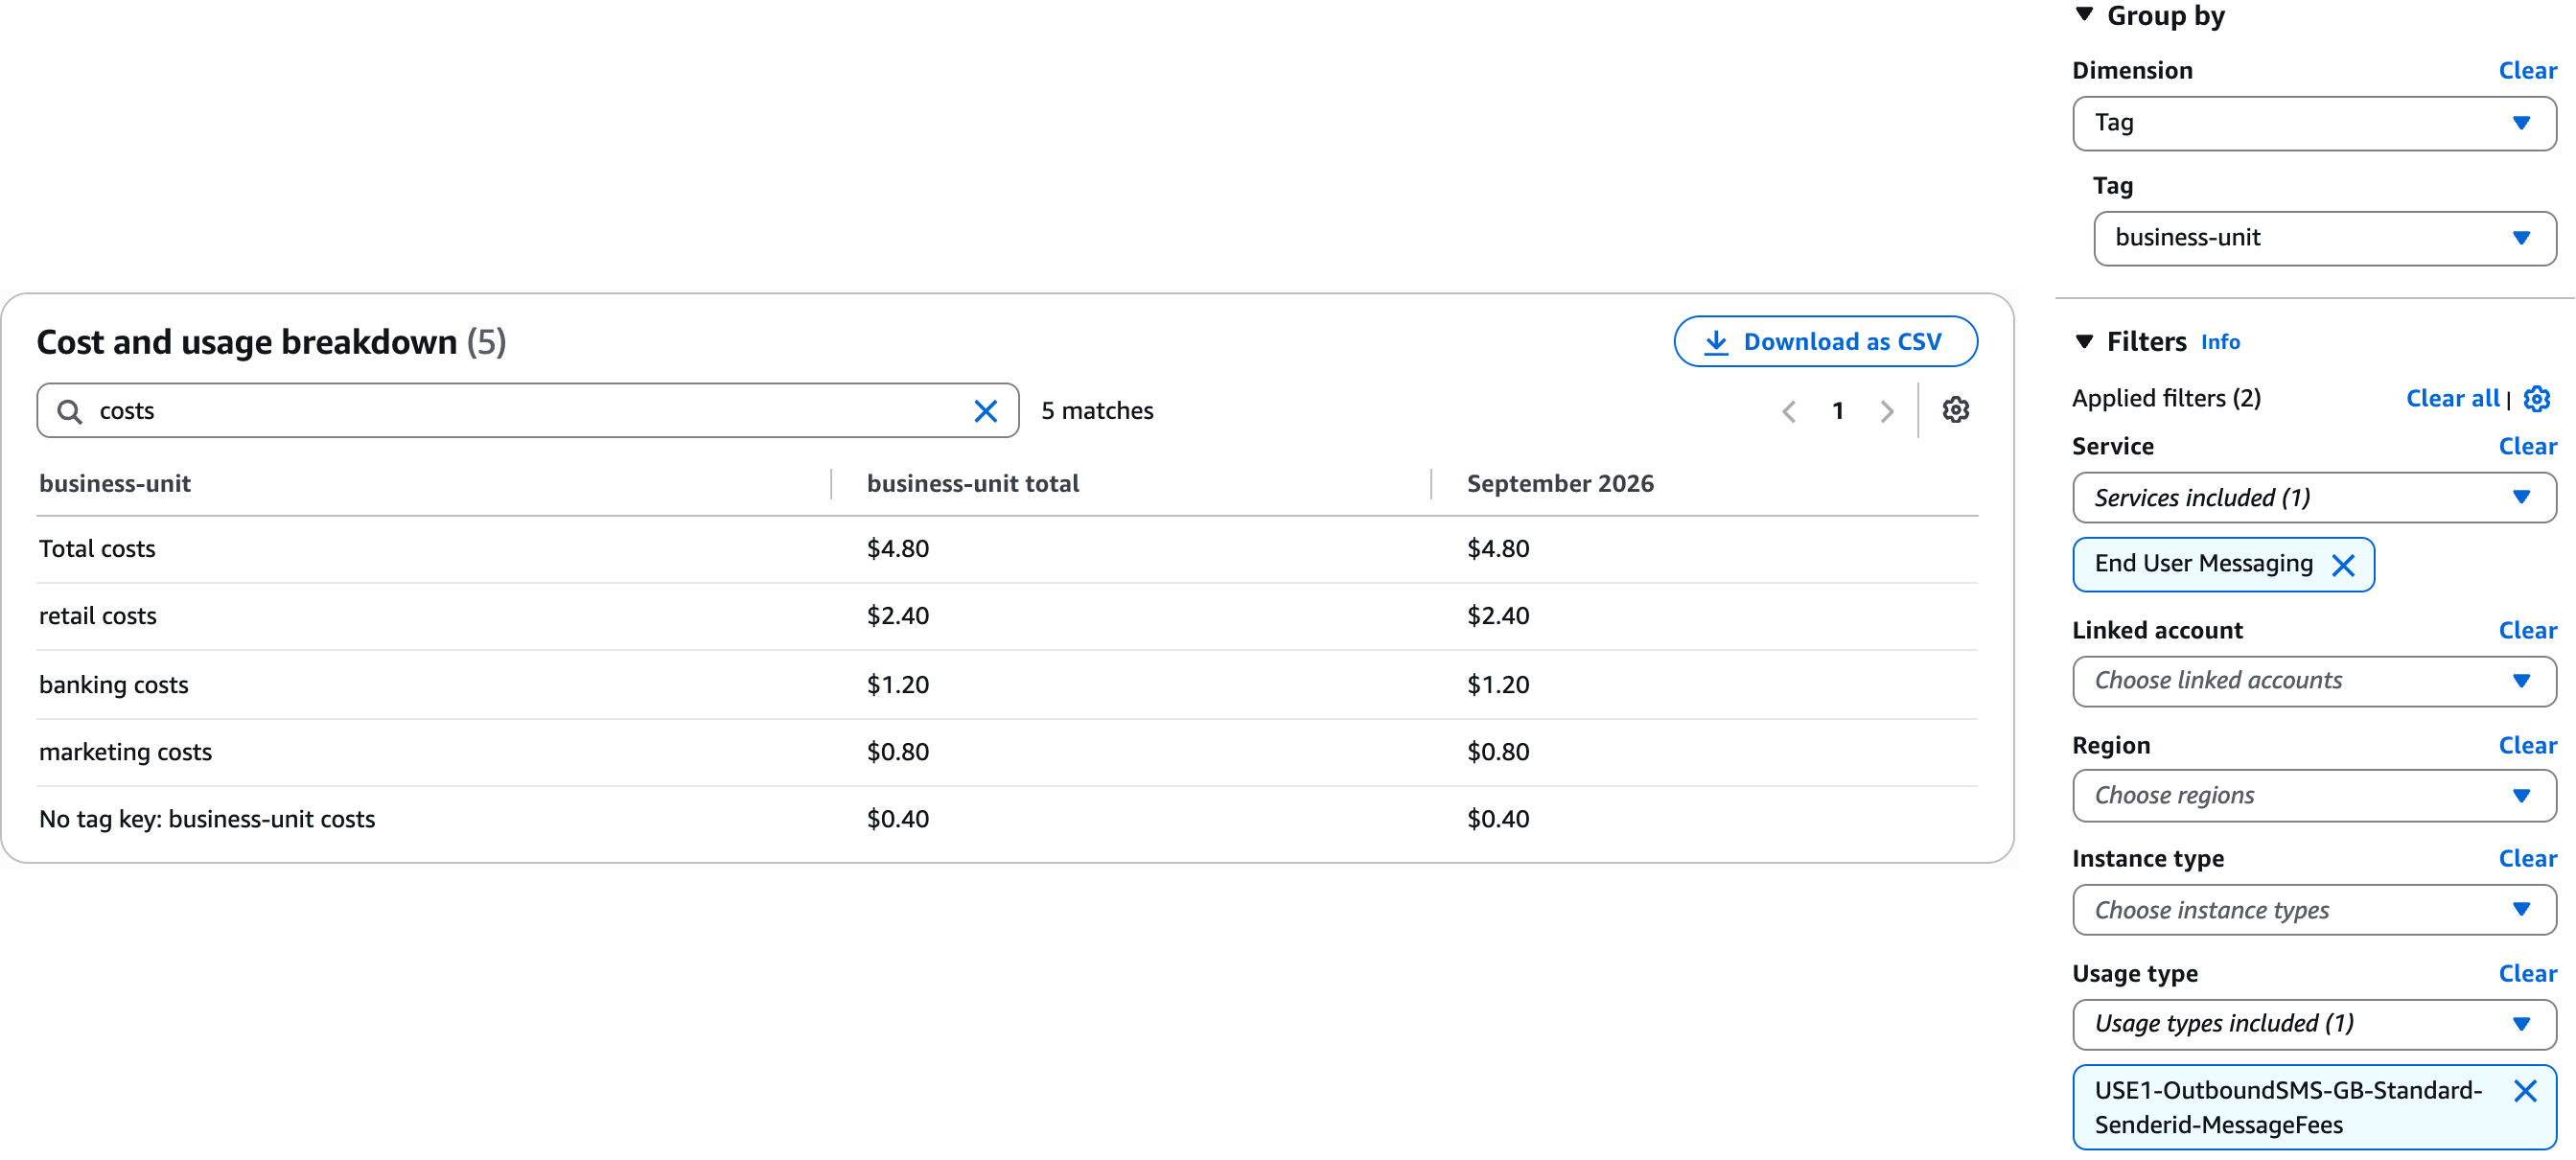
Figure 8: United Kingdom sender ID message fees split by business unit, with Group by set to the business-unit tag and a Usage type filter applied.
Automate with the AWS CLI
If you manage many origination identities, or you want to add tagging to your provisioning scripts, you can run the same steps with the AWS CLI. Replace the example ARNs and account ID with your own. To list your ARNs, run aws pinpoint-sms-voice-v2 describe-sender-ids or aws pinpoint-sms-voice-v2 describe-phone-numbers.
To tag a sender ID when you request it, add --tags. The request-phone-number and create-pool commands accept the same option.
To tag an existing sender ID or phone number (Step 2), run the following command:
To apply the same tags to several identities in one call, use the Resource Groups Tagging API. Each call accepts up to 20 ARNs:
To check which sender IDs carry a key, filter by that key. For phone numbers and pools, use sms-voice:phone-number and sms-voice:pool.
To activate the tag keys (Step 4), run the following command in the management account or standalone account. If a key hasn’t appeared yet, the command returns a Tag keys not found error. Wait and try again, as described in Step 3.
To backfill earlier months (Step 5), set --backfill-from to the first day of a month, and then check the status of the request:
To get the monthly split by tag (Step 6), run the following command. In the API, the service name is AWS End User Messaging. Charges without the key are returned under business-unit$, which is the API form of No tag key.
To split a single usage type line by team (Step 7), add a USAGE_TYPE dimension to the filter, for example:
Going further
With your tag keys active, you can reuse them in other AWS Cost Management features:
- Budgets per team – Create an AWS Budgets cost budget filtered by
business-unitto alert each team when its SMS spend crosses a threshold. To receive those alerts on WhatsApp, see Establishing finops management: Integrating AWS Budgets with WhatsApp using AWS End User Messaging. - Anomaly alerts – Create an AWS Cost Anomaly Detection monitor for a cost allocation tag, so that an unexpected spike in one team’s SMS spend raises an alert for that team. Create the monitor in the management account, because monitors for cost allocation tags can only be created there.
- Chargeback reports – Activated tags are included in the cost and usage reports that you create with AWS Data Exports, so you can build monthly chargeback reports in Amazon Athena or your business intelligence tool.
Best practices for SMS cost allocation
- Tag origination identities when you provision them, so that the first message they send is attributed.
- Give each team its own origination identity when you need to split its spend.
- Tag every phone number and sender ID in a phone pool. Tags on the pool itself don’t appear on message charges.
- Use the same tag keys that your organization uses for other AWS services, so that SMS spend rolls up with the rest of each team’s costs.
- Review the No tag key group each month. If it grows, check for new origination identities that are missing tags.
Conclusion
By tagging your AWS End User Messaging SMS origination identities and activating those tags for cost allocation, you can see SMS spend by team, cost center, and use case next to the rest of your AWS costs. Tags also separate teams that send to the same country, which usage type alone can’t do.
Tag your identities and send traffic first, and then activate the keys after they appear. If you tagged before activating, backfill up to 12 months so that earlier charges are attributed too. Review the No tag key group each month to catch new identities that are missing tags. To build upon this foundation, consider adding per-team budgets and anomaly monitors on the same tag keys.
For additional implementation guidance and best practices, refer to the following resources:
- Tag AWS End User Messaging SMS resources for billing
- Manage tags for a sender ID in AWS End User Messaging SMS
- Manage tags for a phone number in AWS End User Messaging SMS
- Manage AWS End User Messaging SMS tags for phone pools
- Activating user-defined cost allocation tags
- Backfill cost allocation tags
- Filtering the data that you want to view in Cost Explorer
About the authors
Monitor application health with Amazon EC2 application status checks
Post Syndicated from Caroline Frost original https://aws.amazon.com/blogs/compute/monitor-application-health-with-amazon-ec2-application-status-checks/
Amazon Elastic Compute Cloud (Amazon EC2) application status checks monitor application health and responsiveness alongside instance, system, and Amazon Elastic Block Store (Amazon EBS) status checks. You can use them to identify a web server that has stopped accepting requests, a Docker daemon that is not running, an incorrect networking configuration, or a network interface that is no longer passing traffic. Amazon EC2 reports application, instance, system, and Amazon EBS status checks through the DescribeInstanceStatus API and Amazon CloudWatch, so you can monitor application health through these EC2 signals rather than publish a custom health metric.
Application status checks can monitor an EC2 instance whether it is launched using RunInstances, Amazon EC2 Fleet, or Amazon EC2 Auto Scaling. For RunInstances and EC2 Fleet, launch the instance with the tag used by the check association. EC2 reports the application status, and you choose how to respond. Amazon EC2 Auto Scaling monitors instance health and can use included application status checks to automate recovery by replacing an instance when its application status is impaired. When Auto Scaling launches a replacement with the app=database tag, the existing tag-based association includes it, so the application status check monitors the new instance without another association call. This walkthrough uses an Auto Scaling group and also covers CloudWatch alarms, staged onboarding, and application maintenance.
For additional details about the feature and pricing, you can refer to the What’s New post and application status checks in the Amazon EC2 User Guide.
Solution overview
Application status checks report through the DescribeInstanceStatus API and Amazon CloudWatch, so you can consume the result in more than one way. You can poll the status from your own tooling, alarm on the CloudWatch metric and run your own remediation, or rely on Amazon EC2 Auto Scaling to replace an instance whose application status is impaired.
In this example, we use the feature with EC2 Auto Scaling groups. Auto Scaling groups help you manage the instance lifecycle across launching, monitoring, and refreshing instances, and they maintain the number of running instances you specify by replacing an instance that fails a health check. For simplicity, we assume the group is a fixed size, with its desired, minimum, and maximum capacity set to the same value, so replacing an instance keeps capacity steady. We assume we have already set up application monitoring for an application running on EC2 instances in an Amazon EC2 Auto Scaling group. Our goal is to replace an impaired application quickly.
The walkthrough adds one application status check across your instances, surfaces the result in CloudWatch, and configures Auto Scaling to replace an instance whose application status is impaired.
You configure the protocol, port, path, accepted response codes, and failure and success thresholds. EC2 evaluates the endpoint every 60 seconds. A matching response code passes. A different response code, a refused or reset connection, or a timeout counts as a failure. The check reports failed after FailureThreshold consecutive failures and passed after SuccessThreshold consecutive successes. Both thresholds default to 2.
The application status of the instance is separate from the result of any single check. It is the aggregation of the checks associated with the instance that have Aggregation set to included. It reports impaired when at least one included check has a failed result. This is the value that appears as ApplicationStatus in describe-instance-status and that Amazon EC2 Auto Scaling acts on. An initialization grace period delays evaluation after launch, so an application that is still starting is not reported impaired before it is ready. You can associate more than one check with an instance, for example a liveness path and a readiness path, and include or exclude each one from the aggregated instance-level status.
Prerequisites
Before you start, you need the following:
- An application running on EC2 instances in an Auto Scaling group. If you need to create a group for this walkthrough, see Create an Auto Scaling group using a launch template. Configure the Amazon Machine Image (AMI) or user data in the launch template to install and start the application on each instance.
- A tag on those instances that you can target, for example
app=database. - Instances reachable on the health check port from within your virtual private cloud (VPC). With AWS-managed network paths, EC2 matches the health check source to the subnet and security group combinations used by the associated instances. Before creating the check, add an inbound rule to each instance security group that allows health check traffic on the check port from the same security group. The host firewall must also allow the port. The instances do not need public IP addresses.
- An AWS Identity and Access Management (IAM) principal with permissions for the EC2 application status check actions and EC2 Auto Scaling.
- Make sure your AWS Command Line Interface (AWS CLI) is up to date. Older releases might not include the application status check commands. If the CLI does not recognize
create-application-status-check, follow Installing or updating to the latest version of the AWS CLI before continuing.
If you do not have an application on a health path yet, add a lightweight endpoint that returns a success code when the instance is ready (most web frameworks expose one), or point the check at an existing readiness path. You need at least one running instance in the Auto Scaling group that is reachable on the check port and serving that endpoint to see a passing result.
To add a lightweight endpoint for an instance running Amazon Linux 2023, install nginx and serve a path that returns 200:
The final curl command confirms that nginx is listening locally and returning a 200 response. Before you create the application status check, configure the instance security group to allow health check traffic on port 8080 from the same security group. For instructions, see Security group referencing.
Create an application status check
Create a check that requests /health on port 8080 over HTTP and treats 200 as healthy. Keep the default thresholds and set an initialization grace period so that newly launched instances have time to start.
The response returns an application status check ID, for example asc-0123456789abcdef0.
Name=database-health identifies the application status check. The app=database tag used in the next step selects the instances to monitor.
The status code matcher defaults to 200 and accepts a comma-separated list of individual codes or ranges, for example "200,204", up to 64 characters.
Associate the check with your instances
Use the application status check ID returned by the create step to associate the check with every instance that carries the app=database tag. Tag-based association covers instances that already carry the tag and instances that launch with it later, which suits an Auto Scaling group where replacement instances launch with the tag.
You can also associate specific instances with --instance-ids instead of --target-tag-associations.
View the application status
The describe-instance-status call returns the application status alongside the instance and system status checks, so a query you already run surfaces it without a new API call.
The following example response shows a case where the system and instance status checks pass, while the application status reports impaired.
describe-instance-status returns the aggregation of the included application status checks associated with an instance. For details on every application status check associated with an instance, use describe-application-status, which returns each associated check’s individual result, the reason code, and the HTTP status code your application returned. Use describe-instance-status to see the aggregated application health next to other status checks, and describe-application-status for details on which check failed and why.
A failed check includes a reason that explains the outcome. For example:
For ResponseCodeMatched and ResponseCodeMismatch, the Reason includes the returned StatusCode and the Protocol, so you can distinguish a 500 from a 503. Connection reasons such as ConnectionTimeout, ConnectionRefused, and ConnectionReset indicate that the application did not complete a response at all, and do not include a StatusCode.
Replace instances with an impaired status check
When an application status check reports impaired, the right response depends on what failed, and not every impairment calls for terminating the instance. Common responses include rebooting the instance, rolling back a recent deployment, or terminating the instance and replacing it, and your workload may call for others. A transient fault may clear with a reboot, a bad deployment may call for a rollback, and a crashed or wedged instance usually calls for termination and replacement.
Amazon EC2 Auto Scaling evaluates the aggregated application status as part of its EC2 health checks. When the status is impaired, the group marks the instance unhealthy, terminates it, and attempts to launch a replacement from the group’s launch template. Auto Scaling does not copy the application from the terminated instance. Configure the AMI, user data, or deployment system for the group to install and start the application on each replacement. Because the group has fixed capacity in this example, it replaces the impaired instance rather than changing capacity. Auto Scaling includes application status checks in the group’s EC2 health checks by default, so no separate Auto Scaling health check configuration is required.
Terminate and replace is the default an Auto Scaling group gives you. If your remediation is a reboot or a rollback instead, keep the same impaired signal and act on it yourself, using the CloudWatch alarm in the next section to trigger your own automation.
Set the check’s InitializationGracePeriodSeconds to at least the time your application needs to start, and make sure the Auto Scaling group’s health check grace period is no shorter. Then neither the check nor the group acts on an instance that is still initializing. Detection and remediation then run without a separate monitoring system.
Alarm on the application status in Amazon CloudWatch
EC2 publishes the application status to CloudWatch, so you can alarm on it without a custom metric. This step is optional. Auto Scaling replaces an impaired instance whether or not you create an alarm. Add one when you want notification or a dashboard alongside the replacement. The following alarm notifies an operations topic when the application status check fails for an instance.
The alarm enters the ALARM state when the application status is impaired for three consecutive minutes. StatusCheckFailed_Application aggregates across every associated check whose aggregation is included. EC2 also publishes a per-check metric named StatusCheckFailed_Application_{application-status-check-id}, so you can alarm on an individual check when an instance has more than one associated.
To see the behavior end to end, stop the application process on one instance without stopping the instance. After the configured thresholds are met, the application status can turn impaired, the CloudWatch alarm can enter the ALARM state, and the Auto Scaling group can replace the instance while the remaining healthy instances can continue to serve traffic.
Rollout and maintenance strategies
Use the following strategies to stage deployment across your instances and suppress reporting during planned application maintenance.
Onboard checks across your instances
Roll application status checks out to a large number of instances in stages. An excluded check does not contribute to replacement decisions while you validate it.
Start in observe-only mode
Create the check with Aggregation set to excluded. An excluded check still runs and reports its result through describe-application-status and CloudWatch, but it does not contribute to the instance-level application status and does not cause Auto Scaling to replace an instance. Watch it for a representative period, confirm it returns the codes you expect, and tune the StatusCodeMatcher, FailureThreshold, SuccessThreshold, and initialization grace period. When you are confident, move the check to included with ModifyApplicationStatusCheck, and the result begins contributing to the instance-level status and to Auto Scaling replacement.
Associate by tag
Associate the check with a tag rather than a list of instance IDs. A tag-based association also covers a new instance when it launches with the tag, without another API call. This fits an Auto Scaling group, an instance refresh, or any workflow that replaces instances over time.
Amazon EKS and Karpenter
Application status checks can monitor an application endpoint on an EC2 worker node, including nodes launched for Amazon Elastic Kubernetes Service (Amazon EKS) managed node groups or by Karpenter. Each associated node must expose the HTTP or HTTPS health path on the configured port and carry the tag used by the check association. For an EKS managed node group, apply the tag to the EC2 instances through its custom launch template. For Karpenter, apply the tag through spec.tags in the EC2NodeClass. Application status checks monitor the endpoint on the EC2 instance, not a Kubernetes Service or an individual pod.
Manage checks as code
Define the check, its thresholds, and its tag association in the same infrastructure-as-code templates you use for your instances, so you can apply the same definition across environments and use your review process for changes. Roll the same definition out one Auto Scaling group or one Region at a time, and use a CloudWatch dashboard on the StatusCheckFailed_Application metric and the per-check StatusCheckFailed_Application_{application-status-check-id} metric to compare behavior before and after you switch a check to included.
The following template creates the check and its tag association. The template creates the check with Aggregation set to excluded so that it reports without contributing to the instance-level status, and you change it to included when you are ready.
The association takes the check ID, which the check exposes as an Fn::GetAtt attribute. To target named instances instead of a tag, use AWS::EC2::ApplicationStatusCheckInstanceAssociation with ApplicationStatusCheckId and InstanceId. Every ID property on both association resources is create-only, so changing the target replaces the association.
Run more than one check
You can associate more than one check with an instance, for example a liveness path and a readiness path, and include or exclude each from the aggregated instance-level status. Create a new check and exclude it from the aggregated count, confirm it behaves, then include it. The application status appears alongside the instance, system, and Amazon EBS status checks in describe-instance-status, so you can adopt it without changing the queries and alarms you already run.
Perform application maintenance
Planned maintenance, such as a rolling configuration change or a version upgrade, can make an application stop responding on its health path for a short time. Without a pause, the check reports the instance impaired and Auto Scaling can replace an instance that is healthy and only briefly offline. Pause reporting for the duration, then resume it.
The direct control is EnableApplicationStatusCheckSuppression. While suppression is in effect, the check does not mark instances impaired, so Auto Scaling does not act on it. Reporting resumes when you call DisableApplicationStatusCheckSuppression, or at the resume time set for the suppression. The following patterns wire that pause into common maintenance workflows.
EC2 Auto Scaling instance refresh and standby
An instance refresh rolls a new launch template through the group in batches and waits for each new instance to pass its health checks, including the application status check, before it continues. Set the check’s InitializationGracePeriodSeconds, and the group’s instance warmup, to at least the time your application needs to start, so the refresh does not act on an instance that is still initializing. For one-off manual work on a single instance, move it to standby with EnterStandby. The group stops health-checking and replacing it until you call ExitStandby.
AWS CodeDeploy
Suppression is not tied to any one deployment tool. If you deploy with AWS CodeDeploy, a deployment that restarts your application fails its health path until the new version is serving, so suppress the instance in a lifecycle hook before the deployment and resume it after. Suppress in a BeforeInstall hook and resume in an ApplicationStart hook in your appspec.yml:
scripts/suppress_status_check.sh suppresses the instance before the new version installs:
scripts/resume_status_check.sh resumes reporting once the new version is up:
The --duration-seconds value is a safety net: If the deployment fails before the resume hook runs, suppression lifts on its own rather than leaving the instance unmonitored. Omit it to suppress until you call disable. Grant the instance role ec2:EnableApplicationStatusCheckSuppression and ec2:DisableApplicationStatusCheckSuppression. After reporting resumes, the check evaluates the application again and returns the instance to healthy once it passes, so a routine deployment does not trigger a replacement.
AWS Systems Manager maintenance windows
For scheduled maintenance such as patching, run the work inside an AWS Systems Manager maintenance window and bracket it with the suppression calls: an automation step that enables suppression before the patch task and disables it after. Reporting stays paused for the window and resumes on its own at the suppression resume time if a step does not complete.
Clean up resources
Application status checks incur charges while they are associated with instances. AWS charges for each managed elastic network interface (ENI) AWS creates in your VPC, per Availability Zone, and standard Amazon CloudWatch rates apply to the metrics the checks publish. AWS creates one endpoint per combination of source subnet and security group, so the count does not scale per instance or per check. Delete the resources you created so that you do not incur further charges. Delete the application status check and the CloudWatch alarm, and delete the Auto Scaling group if you created it only for this walkthrough.
Quotas
Application status checks are subject to service quotas that cap how many checks you create, how many associations you make, and how many instances you monitor. Review the current defaults before you roll out to a large number of instances, because a tag-based association covers instances that launch later. A growing number of instances can reach a quota without any change to your configuration. Once you pass a quota, the instances beyond it stop being checked and report no status. Use the Service Quotas console to view usage and request increases. For the current quotas and how each one is counted, see Application status checks in the Amazon EC2 User Guide.
Conclusion
In this post, we showed how to monitor application health on Amazon EC2 with application status checks. You created an HTTP check, associated it with your instances by tag, viewed the status alongside your existing status checks, alarmed on it in Amazon CloudWatch, and relied on Amazon EC2 Auto Scaling to replace an impaired instance. You can use EC2 status checks and Auto Scaling to detect and respond to application failures rather than operate a separate monitoring system.
If you use another deployment mechanism, apply the association tag to each EC2 instance and make sure the application exposes the configured health path and port. Contact your AWS account team if you need help adapting this pattern to your deployment process.
To learn more, see Application status checks in the Amazon EC2 User Guide and Health checks for instances in an Auto Scaling group in the Amazon EC2 Auto Scaling User Guide. As a next step, add a second check for a readiness path and exclude it from aggregation to see how per-check status contributes to the instance-level result.
About the author
How Intuit migrated from Apache Hive Metastore to AWS Glue Data Catalog
Post Syndicated from Srinivasan Krishnasamy original https://aws.amazon.com/blogs/big-data/how-intuit-migrated-from-apache-hive-metastore-to-aws-glue-data-catalog/
Migrating from Apache Hive Metastore (HMS) to AWS Glue Data Catalog (GDC) is a priority for many organizations as they scale their data analytics operations. At enterprise scale, maintaining an efficient and reliable metadata management system becomes increasingly critical. Many enterprises started their big data journey with HMS, which has served as a reliable catalog service for storing table definitions and metadata. As cloud adoption has grown, so have requirements for fine-grained access control and for serverless, fully managed solutions. As a result, organizations are looking to modernize their data catalog infrastructure and are moving their metastores to GDC, a fully managed AWS metadata repository. With GDC, they gain native integration with various AWS analytics and AI services, along with centralized data management and governance.
In this post, we walk through how Intuit successfully migrated its extensive data catalog from HMS to GDC. This migration is part of Intuit’s journey to an open, secure lakehouse architecture for data and analytics. We explore the challenges Intuit faced and the solutions it implemented. We also cover the benefits that motivated the move: reduced operational overhead, improved data discovery, and enhanced integration with AWS analytics services. Whether you are considering a similar migration or exploring your options for metadata management, this real-world example provides practical insights into the migration process.
Migration considerations and prerequisites
- Audit the HMS catalog and remove unused tables and views by deleting or flagging them to filter out during initial migration to GDC. This will make sure that after migration you have a clean catalog and will help with better migration performance.
- Estimate the read and write API limits you will need in GDC based on the traffic in HMS. To do this, you can audit the internal HMS tables and get the P99 numbers for reads and writes to tables and partitions. These numbers will need to be translated to AWS Glue Data Catalog API limits and the necessary quota increase requests will need to be submitted. Load test with these quotas to confirm that they support your peak read and write rates without throttling, and implement retries to handle any throttling that does occur.
- Make sure you have your AWS Glue quotas sized properly for your account and use case. You can work with AWS Support to increase these quotas based on the results of the load testing.
- Data is stored in Amazon Simple Storage Service (Amazon S3) for table resources that are planned for migration. Only databases, tables, and partitions can be migrated. Other entities, such as column statistics, privileges, roles, functions, and transactions, were outside the scope of the migration.
- Plan for table renames: In GDC table/database rename isn’t supported. In some cases, customers rename tables as part of their data pipelines to get atomic updates for tables that are non-partitioned and don’t use an open table format (OTF). For use cases where this pattern is required, we recommend writing to a new S3 location and then running the following
ALTER TABLEcommand to change the S3 location.
Architecture
The following diagram shows the overall architecture of the solution across two consumer accounts (spoke accounts), and a central data governance account as part of a hub-and-spoke architecture.
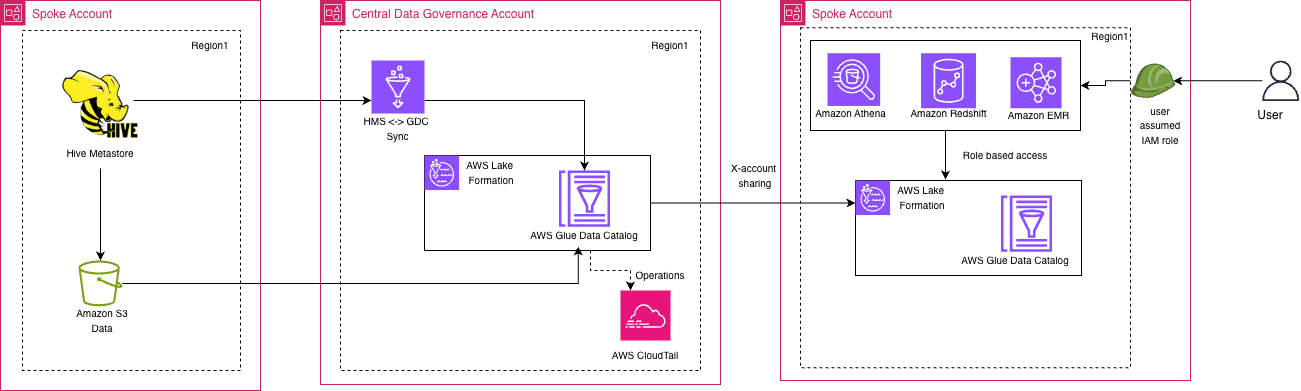
Figure 1: Solution architecture spanning the source and consumer spoke accounts and the central data governance account
In the source spoke account, Hive Metastore manages the metadata for data stored in Amazon S3. This is the current state. In the central data governance account, an HMS and GDC sync process propagates this metadata into the central AWS Glue Data Catalog, which AWS Lake Formation governs. AWS CloudTrail records operations on the central catalog. The central catalog is shared across accounts with the consumer spoke account. There, Amazon Athena, Amazon Redshift, and Amazon EMR query the data through role-based access, using Lake Formation and a local AWS Glue Data Catalog. This migration strategy is explained in detail in the following sections.
Migration strategy
At Intuit, the central team manages the data catalog and offers it as a platform for the different teams to use. Because of the scale of Intuit’s data lake and the large number of teams using the data platform, Intuit had to come up with a phased strategy. With these tenets in mind, Intuit came up with the following approach:
- One-time migration of all databases, tables, and partitions. During this phase all the objects were migrated from HMS to GDC. The migration will be point-in-time and any changes happening in HMS will not be captured by the initial migration.
- Ongoing sync from HMS to GDC to capture all changes happening in HMS and apply them to GDC. This would make sure any team that is ready to migrate their pipelines to GDC can do so without any dependency on upstream and downstream processes.
- Ongoing sync from GDC to HMS to capture any changes that happen in GDC and apply them back to HMS. Some of your pipelines might still point to HMS while the upstream pipelines whose tables they consume have already moved to GDC. This sync process replicates all changes back to HMS, so those pipelines aren’t impacted.
- To make sure both catalogs remain in sync and to prevent drift, a parity tool runs hourly to compare all critical metadata values and verify consistency between the catalogs. For details, see the Parity tool section later in this post.
- An ad hoc sync process was also built. If the parity tool identifies that the two catalogs are out of sync, this process provides a straightforward way to bring them back in sync.
To prevent a circular loop between the HMS-to-GDC sync (#2) and the GDC-to-HMS sync (#3), each table is assigned a single source of truth. The source of truth is recorded as a sourceCatalog flag (HMS or GDC) in an Amazon DynamoDB arbitration table. During the HMS-to-GDC incremental sync, only tables whose source of truth is HMS are picked up and synced to GDC. Conversely, the GDC-to-HMS sync checks the sourceCatalog flag to confirm the change genuinely originated in GDC and isn’t a cascading update that was originally synced from HMS. This arbitration model makes sure each table’s metadata flows in only one direction at any given time, eliminating the risk of circular updates between the two catalogs.
1. Initial full migration
The first step is to migrate all the databases, tables, and partitions from HMS to GDC. This will need to be planned over a weekend to make sure there is no impact on the workloads running on HMS. The duration of this initial migration will vary depending on the size of your data lake. After being customized to support batching and retries, the AWS Glue Hive metastore migration utility was used to migrate all the metadata (databases, tables, and partitions) from HMS to GDC.
This utility runs an AWS Glue extract, transform, and load (ETL) job that pulls the metadata from the Amazon Aurora MySQL tables that hold the HMS metadata. The job transforms the data and writes it to the AWS Glue Data Catalog.
The following diagram shows the one-time sync process.
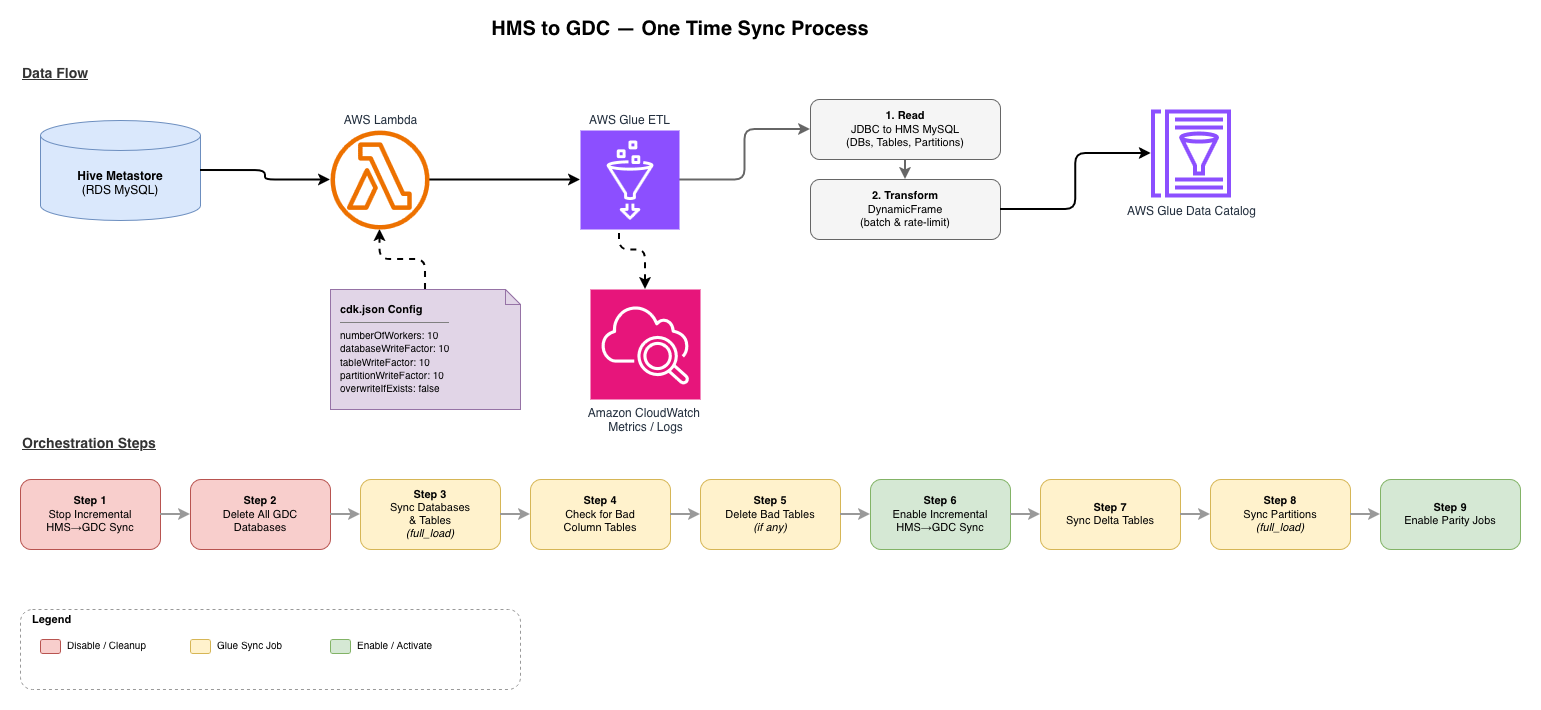
Figure 2: One-time migration of metadata from Hive Metastore to AWS Glue Data Catalog
An AWS Lambda function starts the AWS Glue ETL job. The job settings, such as the number of workers and the database, table, and partition write factors, come from a cdk.json configuration file. The job reads databases, tables, and partitions from the HMS MySQL database over JDBC. It transforms them into DynamicFrames with batching and rate limiting, and writes them to the AWS Glue Data Catalog. Amazon CloudWatch captures job metrics and logs. The lower half of the diagram shows nine orchestration steps: stopping the incremental sync, cleaning up GDC, running full and delta syncs, and turning on the parity jobs.
Customization options
The utility should work as-is for most cases, but Intuit customized the script to speed up the one-time migration process while making sure that GDC didn’t throttle requests.
Loading behavior
Set catalog.overwriteIfExists to false during your runs.
This is a good approach for use cases with a large number of tables because it skips overwriting a table that already exists.
Rate limiting
One way to control the rate and reduce the amount of data sent to GDC is to change the value of catalog.ratePerDPUSecond in the code. This parameter adjusts the rate at which changes are written to GDC, and you can configure it as shown in the preceding code sample. The following formula shows how RatePerSecond is calculated and how catalog.ratePerDPUSecond influences it.
Worked example
With the defaults (catalog.ratePerDPUSecond = 10, DefaultExecutorsPerDPU = 2), each data processing unit (DPU) submits five calls/sec. At that rate, a 200-DPU job submits approximately 500 calls/sec (100 x 10 / 2) when the DataFrame is well partitioned. Lower catalog.ratePerDPUSecond or the DPU count until throttling stops. Internally, these writes call BatchCreatePartitions, which batches partition creation and keeps API volume down.
Handling API limits
In GDC, there are limits for each API call and if you exceed the limits you will be throttled. One approach to handling API limits is to batch the database, table, and partition loads and send the batched data during each batch.
In addition to batching, you should also implement an exponential backoff and retry strategy, as described in the post Managing and monitoring API throttling in your workloads.
2. Incremental load for bidirectional sync
The second step involved creating a two-way synchronization between HMS and GDC. This synchronization made sure that any changes made to tables in HMS were reflected in GDC, and vice versa. To maintain consistency, incremental data loads were necessary between the two systems. The process synced metadata changes by capturing updates in HMS and GDC and applying them to the other system. This kept both catalogs synchronized. A key rule was to designate one catalog as the definitive source of truth for each table to avoid conflicts. This was done using the DynamoDB arbitration table as described earlier.
HMS to GDC
The following diagram shows the ongoing incremental sync from HMS to GDC.
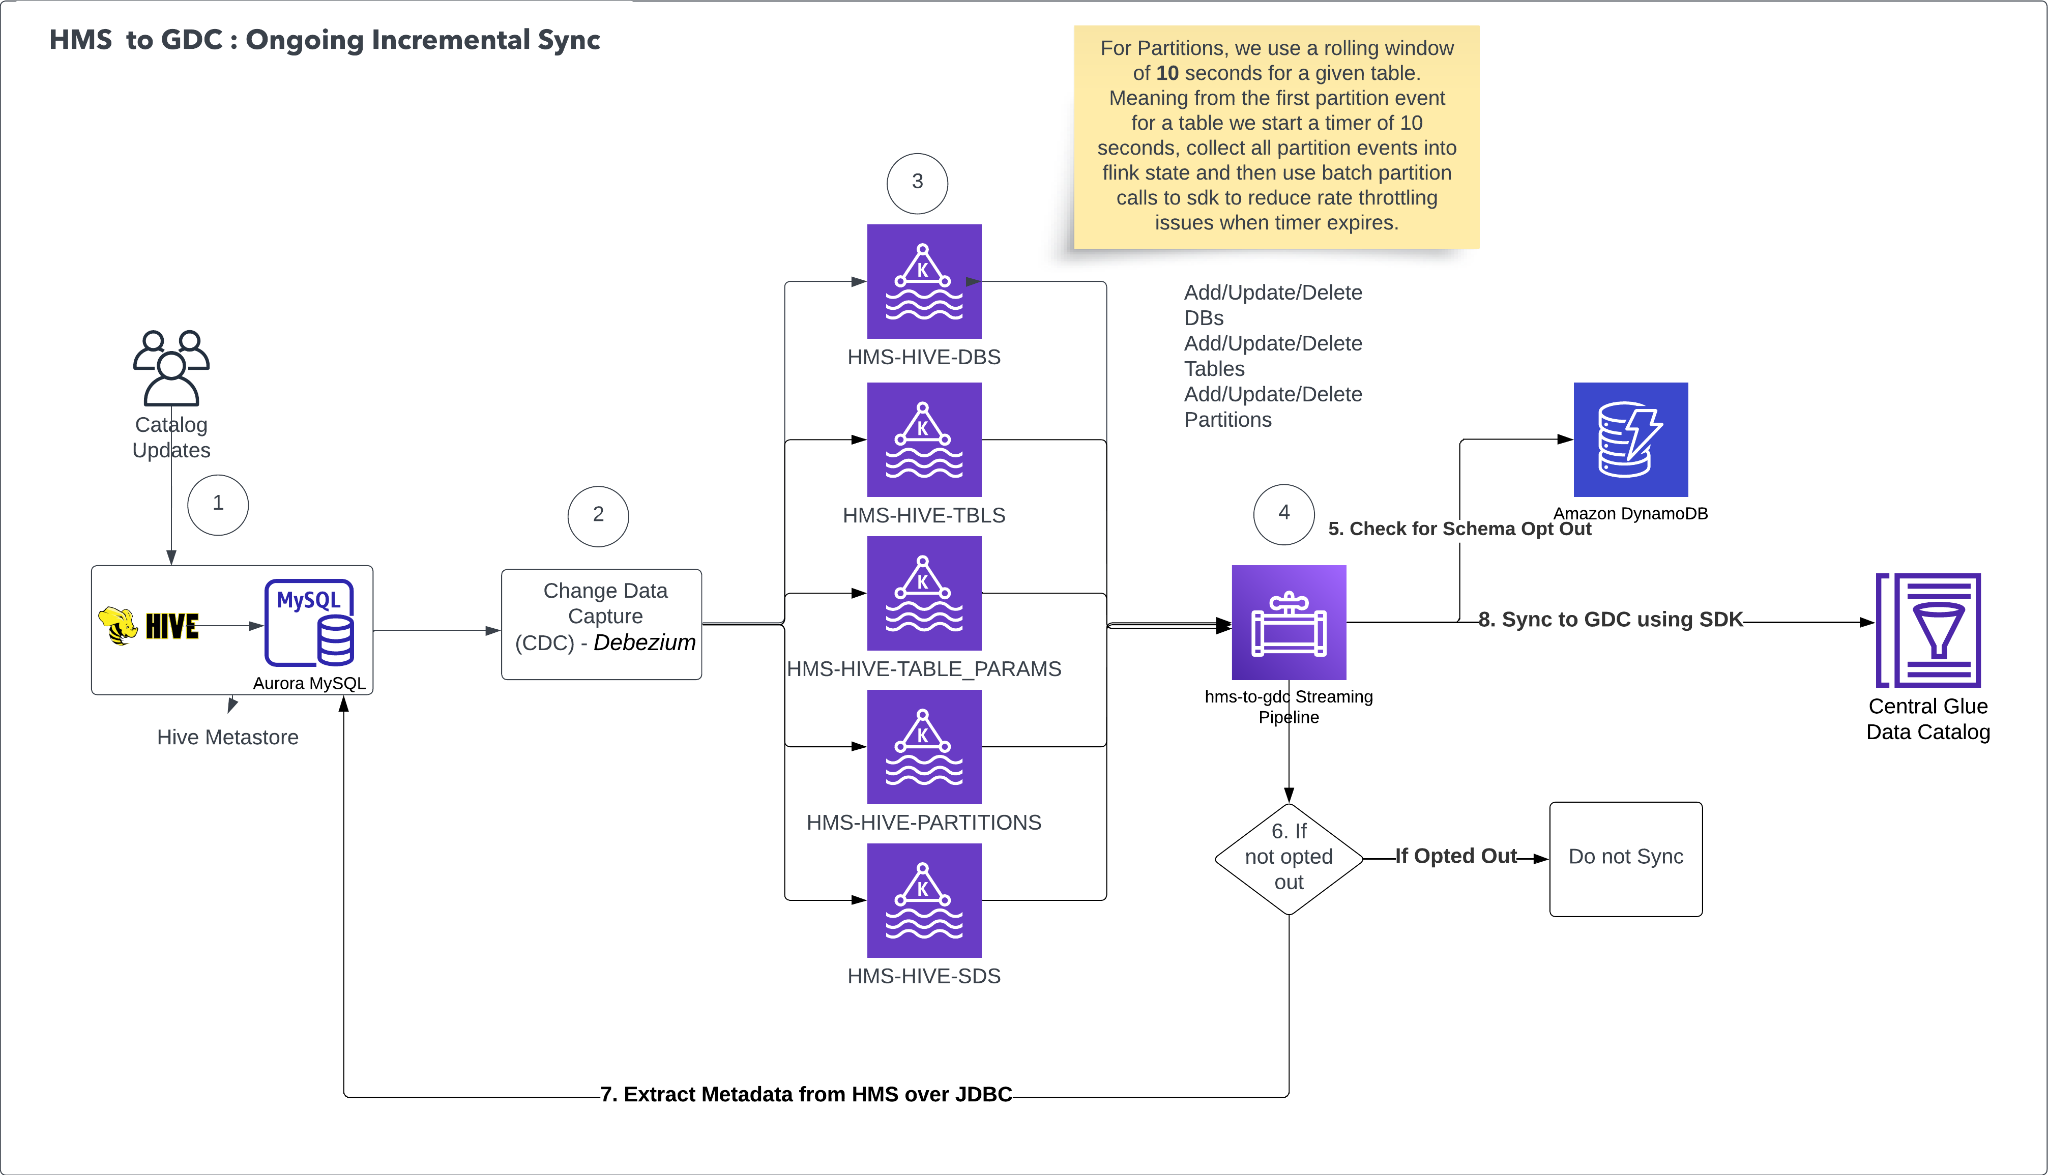
Figure 3: Ongoing incremental sync from Hive Metastore to AWS Glue Data Catalog
The ongoing incremental sync from HMS to GDC is powered by an event-driven architecture that propagates metadata changes in near real time. Catalog updates to the source HMS can affect databases, tables, table parameters, or partitions. A Debezium connector continuously monitors the underlying MySQL instance for any INSERT, UPDATE, or DELETE operations through Change Data Capture (CDC). This approach removes the need for polling or application-level hooks.
Captured changes are routed into dedicated Kafka topics based on the type of metadata object affected. HMS-HIVE-DBS receives database-level changes, HMS-HIVE-TBLS receives table-level changes, and HMS-HIVE-TABLE_PARAMS receives table parameter modifications. HMS-HIVE-PARTITIONS receives partition changes, and HMS-HIVE-SDS receives partition or table location change events. This separation allows each object type to be processed, scaled, and retried independently. For partitions specifically, a 10-second rolling window is applied per table. When the first partition event arrives for a given table, a 10-second timer begins, and all subsequent partition events for that table are collected. When the timer expires, all accumulated events are submitted as a single batch call to the SDK, which significantly reduces API throttling for tables with high partition churn.
Before any change is synced to GDC, the system performs a schema opt-out check against an Amazon DynamoDB table. This lookup determines whether the affected database or table has been explicitly excluded from synchronization, giving individual teams governance over what metadata flows into the central catalog. If the schema is opted out, the change is dropped and no sync occurs. If it isn’t opted out, the system proceeds to apply the metadata operation (create, update, or delete) to the central GDC through the AWS Glue SDK.
Sometimes additional metadata context is needed to fully resolve a change, for example, to construct a complete table definition when processing a partition update. In these cases, the system falls back to extracting metadata directly from HMS over a JDBC connection to the source Aurora MySQL database. This makes sure that GDC always receives complete and consistent metadata, even when the CDC event alone doesn’t carry all required fields.
The overall design achieves low-latency metadata propagation without placing read pressure on the source HMS. Together, the batching strategy, queue-based decoupling, and opt-out mechanism provide a scalable, governed, and throttle-resilient sync pipeline.
GDC to HMS
The following diagram shows the ongoing incremental sync from GDC to HMS.
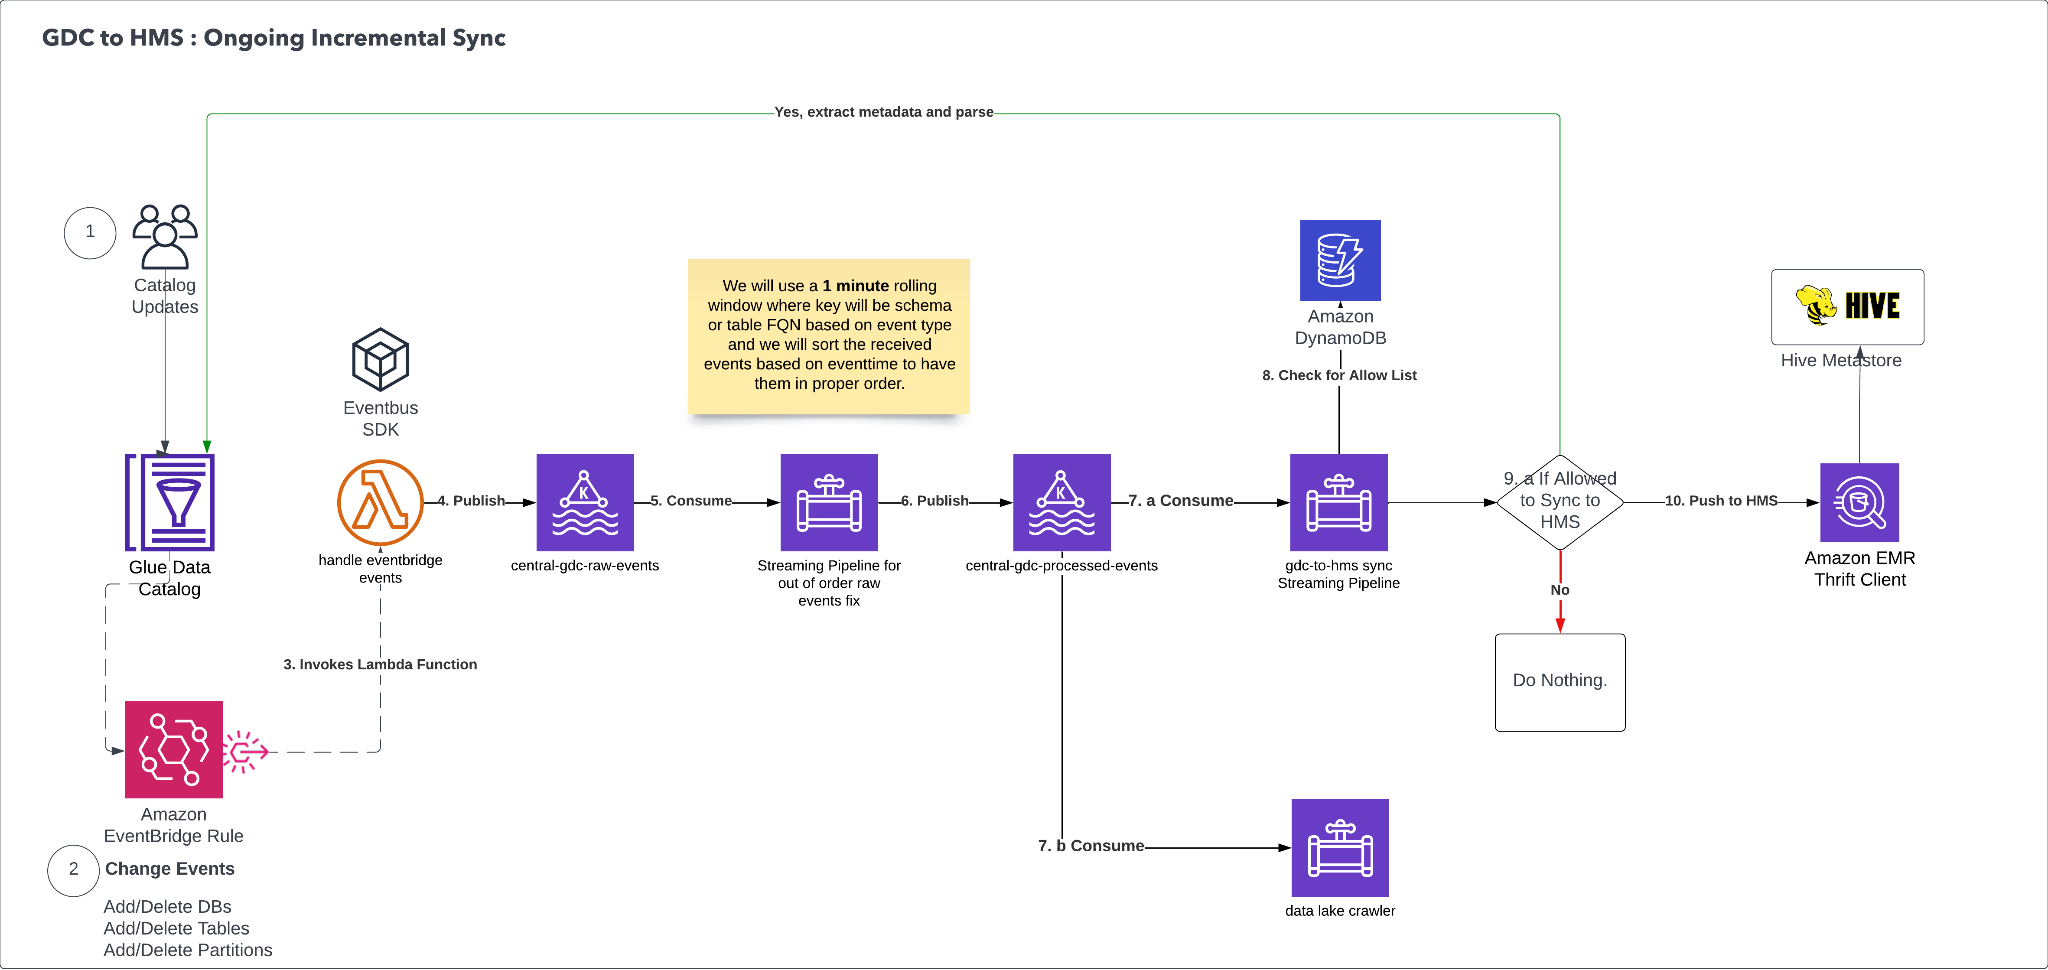
Figure 4: Ongoing incremental sync from AWS Glue Data Catalog to Hive Metastore
The reverse sync from GDC to HMS follows an event-driven architecture. It captures metadata changes made in the AWS Glue Data Catalog and propagates them back to HMS to maintain bidirectional consistency.
When databases, tables, or partitions are added to or deleted from GDC, Amazon EventBridge detects the change through an EventBridge rule. This rule is configured to match specific change events (adding or deleting databases, tables, or partitions) and triggers an AWS Lambda function (handle-eventbridge-events) to begin processing the event.
The Lambda function publishes the raw events to an Amazon Managed Streaming for Apache Kafka (Amazon MSK) topic called central-gdc-raw-events. A downstream Apache Flink consumer, the Streaming Pipeline for Out of Order Raw Events, reads from this topic and applies event ordering logic. Because events might arrive out of sequence, this pipeline uses a one-minute rolling window to buffer events by schema or table. It then sorts the buffered events by their event timestamp and re-publishes them in the correct order to a second Amazon MSK topic called central-gdc-ordered-events.
At this point, the flow splits into two parallel consumption paths.
- The first path is consumed by another Apache Flink consumer, the
gdc-to-hms-syncpipeline, which is responsible for determining whether a given schema or table is allowed to sync. It performs a lookup against an Amazon DynamoDB table to check an allow list. If the entity is permitted for synchronization, the pipeline proceeds to push the metadata change to HMS using Amazon Athena as the execution engine. If the entity isn’t on the allow list, the pipeline takes no action and the event is dropped. - The second consumption path is consumed by a Data Lake crawler which updates the Data Lake control plane metadata inventory database.
The content of each ordered event is used as a trigger to get the latest metadata from GDC. That metadata is then synced to HMS by using the Thrift SDK and a Thrift client running on an Amazon EMR cluster.
The overall design reflects changes made in GDC reliably and consistently back into HMS. The event ordering pipeline applies operations in the correct sequence, regardless of delivery order. The allowlist mechanism in DynamoDB provides governance, because teams control which schemas participate in the reverse sync. Amazon Athena handles the final push to HMS by using its native integration with both GDC and Hive-compatible data stores.
3. Parity tool
When doing a migration through a bidirectional sync approach, a mechanism to do a parity check between the two systems is important to track any drift in the two catalogs. A parity tool was built to make sure the two catalogs are always in sync and to catch any discrepancies.
The following diagram shows the four stages of the parity tool pipeline: data extraction, data storage, comparison, and results.
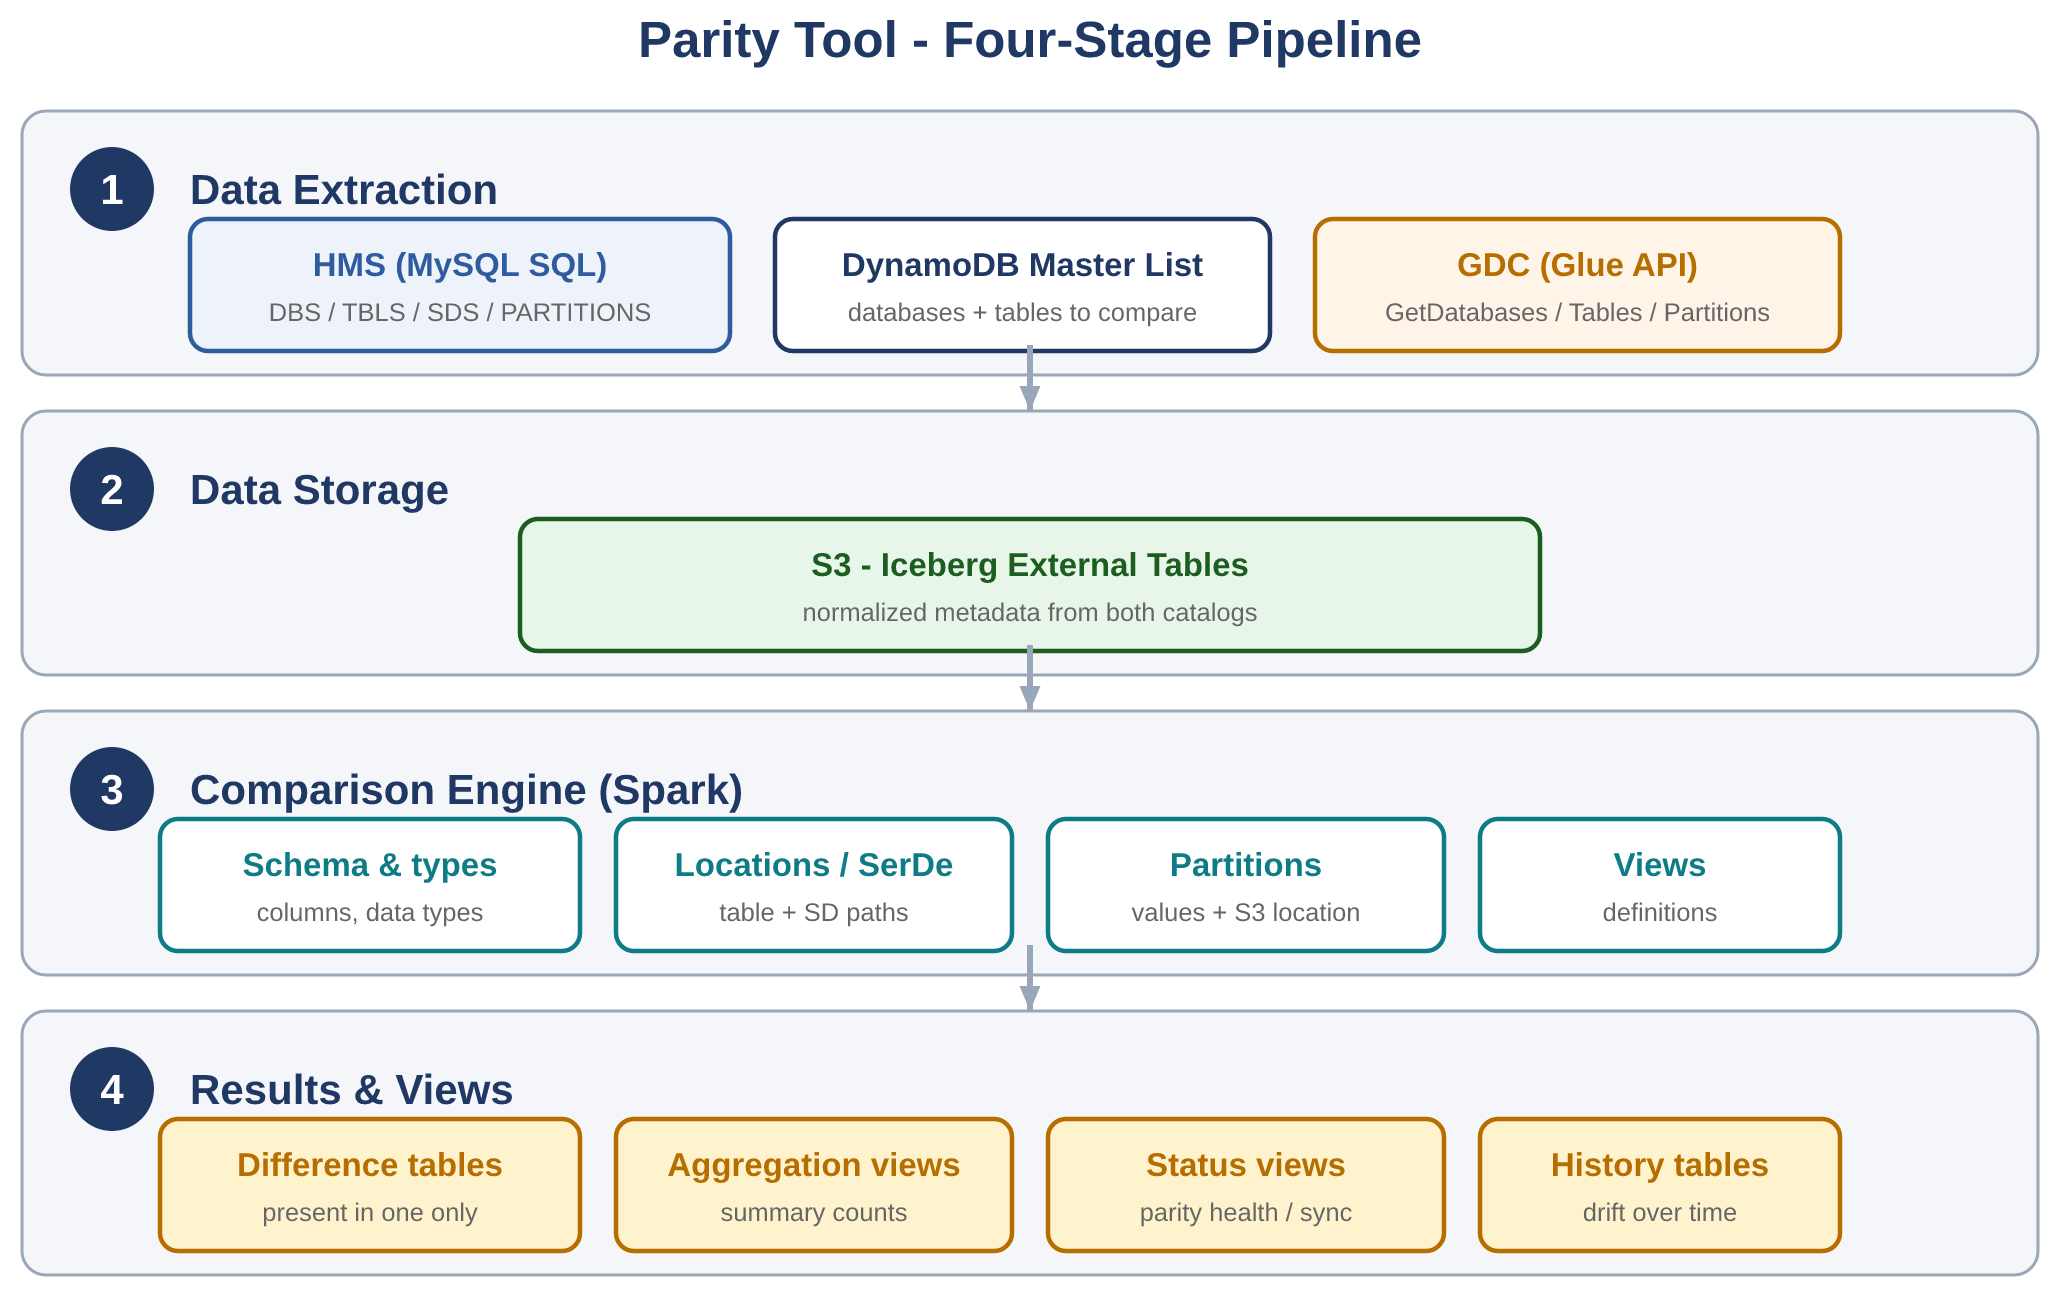
Figure 5: Four-stage parity tool pipeline that compares the two catalogs
The parity tool uses AWS Glue jobs and Spark processing to efficiently compare catalog metadata:
- Data extraction:
- Primary list: Reads from DynamoDB table to determine which databases and tables to compare.
- HMS: Connects to HMS MySQL database to extract metadata for tables in the primary list.
- GDC: Uses AWS Glue API to extract metadata for tables in the primary list.
- Data storage:
- S3 output: Extracted data from both catalogs is written to S3 in Iceberg table format.
- Iceberg tables: External Iceberg tables are created, allowing for efficient querying and comparison using Spark.
- Comparison engine:
- Spark jobs analyzed the Iceberg tables to identify differences in:
- Databases exist in both catalogs.
- Tables exist in both databases.
- Table structures including columns and data types.
- Table locations and SerDe paths.
- Partition information including values and S3 location.
- View definitions.
- Spark jobs analyzed the Iceberg tables to identify differences in:
- Results and views:
- Difference tables are created showing objects present in one catalog but not the other.
- Aggregation views provide summary counts.
- Status views show parity health and sync status.
- History tables track changes over time.
4. Ad hoc migration
An ad hoc migration process was built to perform ad hoc migrations for specific databases, tables, or partitions. This makes sure that if there is a discrepancy identified by the parity tool, it can be mitigated without having to run a full sync process. The ad hoc migration is an enhancement to the utility used for one-time sync where it can take the database name, table name, and partition information as input. Depending on the input provided, it will sync the respective objects.
GDC table requirements
- S3 location: The location for the table data must be in S3. Only databases with an S3 location, or databases with one or more tables with an S3 location, will be included in the migration.
- S3 location name length: The S3 location name can be up to 701 characters.
- Table type: Only the HMS table types
MANAGED_TABLE,EXTERNAL_TABLE, andVIRTUAL_VIEWare being imported to GDC. - Non-blank column names: Every column must have a name.
- Column name length: Column names can be up to 255 characters. HMS allows 256.
- Column name characters: Column names must not include the following characters:
?,\n, and\\. - Column type name length: Column type names can be up to 131,072 characters (2^17).
Conclusion
Migrating metadata from HMS to GDC is a complex process, but it can enhance your data management capabilities. Intuit’s migration shows that moving from HMS to GDC requires careful planning and execution. It also shows that the benefits of a modern, cloud-native catalog service make the move a worthwhile investment for organizations that want to scale their data operations efficiently and securely. After migrating to GDC, Intuit is focusing on implementing strong access controls using row-level, column-level, and cell-level controls in AWS Lake Formation. Because Intuit is building complex solutions and applications, this level of fine-grained access control is critical. Getting its catalog migrated to GDC was an important step in this journey.
To plan your own migration, see the AWS Glue Data Catalog documentation and the AWS Glue Hive metastore migration utility on GitHub. For fine-grained access control, see the AWS Lake Formation documentation.
About the authors
Building a GPU workstation for visual effects with Amazon EC2: Part 5 – Security
Post Syndicated from Andy Hayes original https://aws.amazon.com/blogs/compute/building-a-gpu-workstation-for-visual-effects-with-amazon-ec2-part-5-security/
For many years Amazon Web Services (AWS) has been guiding users in the deployment of powerful NVIDIA GPU backed workstations for graphics intensive workloads. With the recent expansion of our G-series Amazon Elastic Compute Cloud (Amazon EC2) graphics-based instances, we’re excited to introduce new instance families that deliver enhanced performance and capabilities. We’re also refreshing our comprehensive guidance on choosing and configuring these powerful virtual workstations.
This is the fifth post in a five-part series, exploring security practices related to the deployment of visual effects (VFX) workstations: how to secure these workstations by controlling who can reach the desktop, protecting the session in transit, and safeguarding the credentials, images, and storage behind it. The following screen capture shows these GPU-powered workstations in use, in a real production environment.

Figure 1: Amazon EC2 GPU-powered workstations, used in a Studio-in-the-Cloud courtesy of Outpost VFX
Before you begin
This post builds upon topics covered earlier in the series, regarding Linux and Windows EC2 instances, configured for the purposes of creating GPU workstations.
If you want to understand more about GPU accelerated Amazon EC2 G graphics instances, go to Part 1 in this series: Build a GPU workstation for visual effects on Amazon EC2: Part 1 – Setup.
For deployment instructions for creating a Rocky Linux graphics workstation, go to Part 2 in this series: Building a GPU workstation for visual effects on Amazon EC2: Part 2 – Linux.
For creating a Windows Server 2025 graphics workstation, go to Part 3 in this series: Building a GPU workstation for visual effects with Amazon EC2: Part 3 – Windows.
Finally, for methods to standardize and optimize instances, for rapid re-use at scale, go to Part 4 in this series: Building a GPU workstation for visual effects with Amazon EC2: Part 4 – Optimizations.
Security considerations
When deploying EC2 instance workloads on Amazon EC2, security hardening isn’t only a best practice but also essential for protecting your infrastructure, data, and applications from evolving threats. AWS provides secure cloud infrastructure, but the responsibility for securing the operating system and applications running on your EC2 instances falls squarely on you as part of the AWS Shared Responsibility Model. While AWS secures the underlying infrastructure (the physical servers, networking equipment, and hypervisor layer), you’re responsible for everything from the guest operating system upward. This includes patching, configuration management, access controls, and monitoring. A misconfigured EC2 instance can become an entry point for unauthorized users, potentially impacting more than that single instance in your AWS environment through lateral movement.
Throughout this post series, we’ve implemented security best practices aligned with the AWS documentation on Best practices for Amazon EC2. As we conclude, let’s revisit the key security principles we’ve applied and explore additional considerations for production environments.
Amazon DCV connection security
Amazon DCV provides immediate out-of-the-box encryption of pixels and end-user inputs, and to do so it creates a self-signed certificate. As previously mentioned, the browser issues a security warning when you connect by default. This is expected because the browser can’t verify the certificate’s authenticity in terms of domain or validity by a Certificate Authority (CA). Amazon DCV doesn’t immediately know your domain requirements for servers or clients. You elect to accept the risk based on your knowledge of the IP in question that you are connecting to.
Amazon DCV itself has further configurations that can mitigate potential security risks. For example, the DCV server can perform administrator-defined regex filtering on origin and host names to protect against WebSocket hijacking, and Host Header attacks. On Linux, add the following to dcv.conf, typically found at /etc/dcv/dcv.conf:
On Windows, you add the respective string values for each parameter subkey within the Computer\HKEY_USERS\S-1-5-18\Software\GSettings\com\nicesoftware\dcv\security registry key. The following screen capture shows this registry key open in Registry Editor, with the connectivity-restriction values in place. In this example, two values are defined under the security key (allowed-ws-origin-regex and allowed-http-host-regex) each set to a regular expression that limits connections to a specific domain.
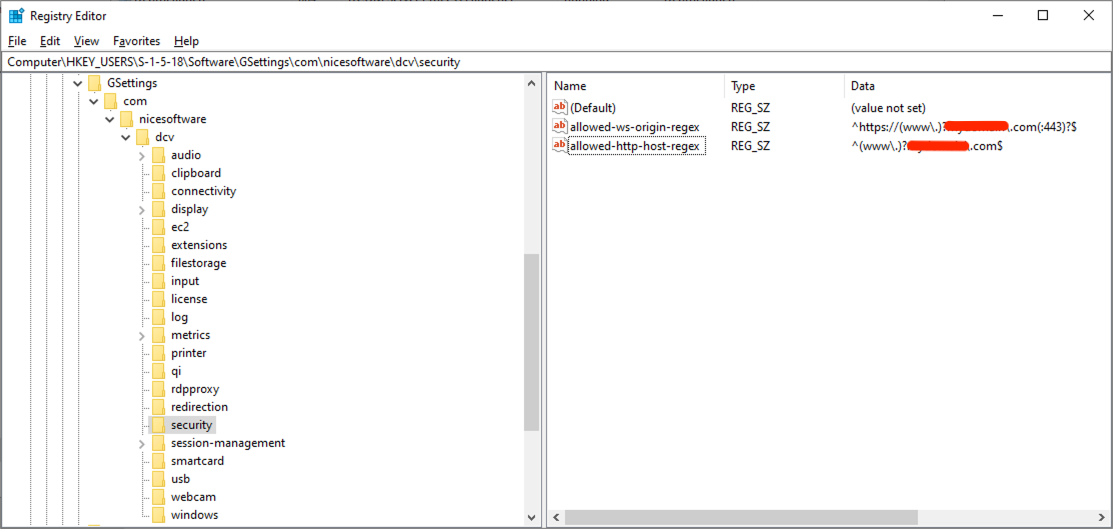
Figure 2: The Amazon DCV registry security key, with subkeys limiting host and origin connectivity
For more information about security parameters with Amazon DCV, see security parameter reference of the Amazon DCV Administrator Guide.
Amazon DCV clients requesting connections to the Amazon DCV server can be restricted through fundamental network-level controls that allow requests from specific IP addresses and ports:
- AWS Network Access Control List (ACLs) restrict inbound and outbound traffic at the subnet level on the VPC.
- AWS Security Groups (as already mentioned and used in this post) apply another layer of restrictions on incoming IP addresses and ports to the server instance.
- Firewall rules can further restrict incoming IP addresses and ports.
To extend both the functionality and security of Amazon DCV, an Amazon DCV Connection Gateway can also be used as part of a more extensive infrastructure, to act as an intermediary between clients and servers. From a security point of view, it adds a single point of entry, hiding the servers behind the gateway, mitigating load, but also implementing a token-based authentication system to resolve server sessions for clients.
Whilst these steps prevent unauthorized access attempts from unexpected sources, it doesn’t solve the certificate trust warning. To improve both the user experience (to resolve the warning, and the general question of is this secure?) as well as strengthen your security defenses, consider using your own certificate from a trusted CA. This is beyond the scope of this post, but services such as AWS Private Certificate Authority provide the ability to create certificates that encapsulate your domain and can be trusted by the browser as a legitimate CA. Not only does this simplify the user experience but it also provides cryptographic verification of server identity and protection against man-in-the-middle attacks.
Network security
We have repeatedly applied the principle of least privilege, using Security Group rules to restrict access to known IP addresses only. As detailed in Part 1 of this series, the choice of connectivity method significantly impacts your security architecture, and while this post uses internet connectivity for simplicity, production environments should evaluate additional security layers based on their requirements. Network Access Control Lists (NACLs) can also be used for subnet-level traffic filtering as an additional defense layer to security groups, and AWS Network Firewall offers advanced threat protection and intrusion detection.
For enhanced security postures AWS Site-to-Site VPN adds network-layer IPsec encryption on top of the application-layer security of Amazon DCV, protecting against man-in-the-middle attacks, traffic analysis, and DNS hijacking while allowing workstations to reside in private subnets. AWS Direct Connect further strengthens security by bypassing the public internet entirely through dedicated fiber connections, reducing exposure to internet-based DDoS attacks, ISP-level surveillance, and routing attacks.
If you have strict compliance requirements, also consider deploying Amazon DCV servers in private subnets with AWS PrivateLink endpoints for fully private connectivity. For comprehensive guidance on these connectivity options and additional firewall and protection services that enhance protection against exploits such as ransomware and DDoS, see Security, Identity and Compliance on AWS (refer back to Part 1’s detailed comparison of connectivity architectures).
AWS Identity and Access Management (IAM)
IAM securely controls access to AWS. With IAM, you can manage authentication and authorization and grant your identities only the least-privilege permissions required for their tasks, reducing the risk of mistakes or unauthorized behavior. Throughout this post series, we’ve applied this principle of least privilege to IAM roles and policies. For example, we attached IAM roles to EC2 instances rather than using long-lived static credentials, eliminating the risk of exposed access keys.
For example, for the purposes of this post, we used read-only policies for S3. For production environments, we recommend taking this further by prescribing:
- Access to specific S3 buckets using resource-level permissions.
- For example,
arn:aws:s3:::amzn-s3-demo-bucket/*.
- For example,
- Limiting actions to only what’s required.
- For example,
s3:GetObjectinstead ofs3:*.
- For example,
Credential security
As a best practice, we recommend changing default passwords immediately and aligning them with your organization’s password quality requirements, such as 16 or more characters with mixed case, numbers, and symbols. Any SSH key pairs should be rotated regularly in line with your organizational requirements.
Monitoring and logging
You can use a number of tools and services to monitor activity within an AWS account. For example, use AWS CloudTrail to audit IAM actions and API calls for compliance and security, and implement Amazon CloudWatch alarms to warn about specific security events. AWS Identity and Access Management Access Analyzer can be used to identify resources shared with external entities and validate that your IAM policies grant only intended access, whilst VPC Flow Logs monitor and allow you to audit network traffic patterns within your network. For vulnerability detection, Amazon Inspector can scan EC2 instances for software and network exposure, whilst Amazon GuardDuty can continuously monitor for threat detection across your infrastructure, looking for suspicious or malicious behavior.
Encryption
Encrypting your data at rest, and in transit helps protect against unauthorized access even if storage media is compromised or network traffic is intercepted. In these posts we made sure that Amazon Elastic Block Store (Amazon EBS) volumes for our instances were all encrypted using AWS Key Management Service (KMS) for encryption key management, providing cryptographic verification and centralized key rotation capabilities. We explored Transport Layer Security (TLS) encryption for Amazon DCV, which helps protect your desktop pixels and user inputs during transmission using TLS v1.2 or greater with strong cipher suites.
Patch management
Consider build-time hardening services such as EC2 Image Builder to automate the creation of Amazon Machine Images (AMIs) that apply the latest security patches, remove unnecessary components, and install anti-malware protection.
For lifecycle management, AWS Systems Manager Patch Manager can automate patching across your fleets. It uses patching policies that scan for and install approved updates on a schedule you define (weekly is recommended). Patch Manager is particularly valuable for fleet-wide VFX workstations because it centralises patching control across multiple accounts and AWS Regions. It supports custom patch baselines, so you can define what counts as compliant for your organisation. It also integrates with AWS Security Hub CSPM (Cloud Security Posture Management) and AWS Config for greater visibility, and it maintains audit trails through AWS CloudTrail.
Backup and recovery
Amazon EBS snapshots represent a cost-effective, encrypted, point-in-time backup of your instance data (such as the operating system and applications) residing on EBS volumes. They’re stored in Amazon Simple Storage Service (Amazon S3). Incremental versions only store the deltas in data from previously stored volumes (deletions of snapshots only remove unique data associated with that volume). With snapshots, you can retrieve a prior state (snapshot) of an instance and resume work or even turn a snapshot into an AMI for more permanent use. Whilst many companies using VFX workstations on AWS tend to regularly launch new daily instances for their artists (avoiding ‘stopped’ state charges overnight and ensuring artists are using up-to-date AMIs), long-term use of Amazon EC2 instances can use EBS snapshots to instigate disaster recovery preparation against accidents, corruption, or ransomware. It’s vital when using disaster recovery processes such as EBS snapshots, that testing is done to confirm that recovery procedures work when needed.
Conclusion
This post has covered essential security practices including network controls, IAM policies, encryption, monitoring, and threat detection, which are all foundational elements of a comprehensive security strategy. For production deployments, we strongly recommend consulting the AWS Security Best Practices documentation and the AWS Well-Architected Framework Security Pillar to explore additional security services, compliance frameworks, and industry-specific guidance tailored to your organization’s requirements.
For more information contact us at [email protected].
About the authors
Building a GPU workstation for visual effects with Amazon EC2: Part 4 – Optimizations
Post Syndicated from Andy Hayes original https://aws.amazon.com/blogs/compute/building-a-gpu-workstation-for-visual-effects-with-amazon-ec2-part-4-optimizations/
For many years, Amazon Web Services (AWS) has been guiding customers in deploying powerful workstations backed by NVIDIA graphics processing units (GPUs) for graphics-intensive workloads. With the recent expansion of our G-series Amazon Elastic Compute Cloud (Amazon EC2) graphics-based instances, we’re excited to introduce new instance families that deliver enhanced performance and capabilities. We’re also refreshing our comprehensive guidance on choosing and configuring these powerful virtual workstations.
This is the fourth post in a five-part series, exploring optimizations to support the ready deployment of visual effects (VFX) workstations, using Amazon DCV as a performant desktop display protocol. The screen capture that follows shows one such workstation running a live visual-effects workload.
“First there were rocks… Humanity made wheels. Those wheels ground flour and we made progress to sliced bread. Amazon DCV is the best thing since sliced bread.”
— Chris Coupe, CG Supervisor, Outpost VFX
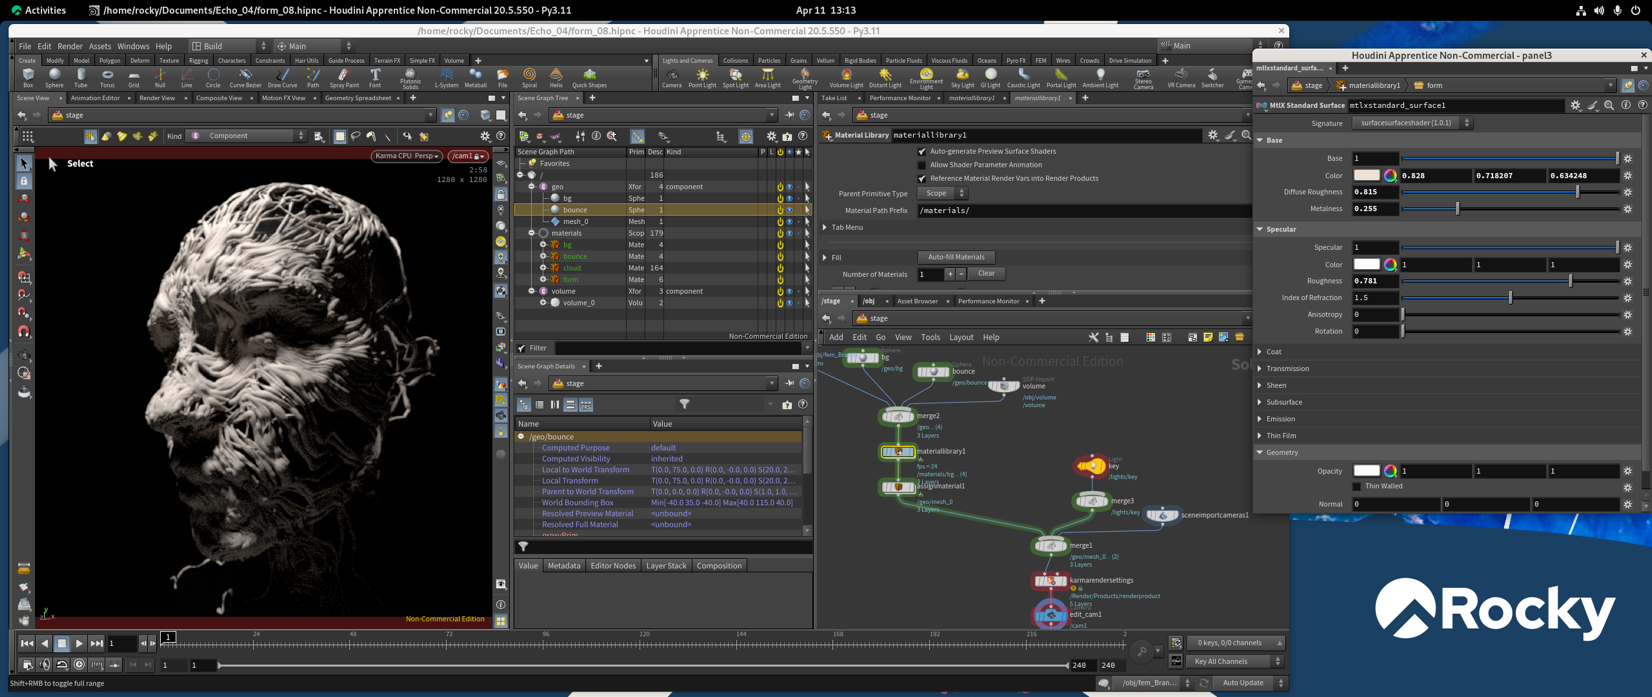
Figure 1: A screen capture of a Rocky Linux-based workstation
This post focuses on several key aspects:
- The consolidation and standardization of VFX workstation instance configurations, to allow simpler launching mechanisms, also facilitating deployments at larger scale (for example, a team of people).
- Optimizations to improve performance beyond out-of-the-box setups, with emphasis on GPU acceleration.
- Analysis and discussion of security considerations when implementing a VFX workstation on AWS.
Prerequisites
This post assumes that you have deployed a Linux or Windows EC2 instance, for the purposes of creating a GPU workstation.
If you want to understand more about GPU-accelerated Amazon EC2 G graphics instances, go to Part 1 in this series: Build a GPU workstation for visual effects on Amazon EC2: Part 1 – Setup.
For deployment instructions for creating a Rocky Linux graphics workstation, go to Part 2 in this series: Building a GPU workstation for visual effects on Amazon EC2: Part 2 – Linux.
Finally, for deployment instructions for creating a Windows Server 2025 graphics workstation, go to Part 3 in this series: Building a GPU workstation for visual effects with Amazon EC2: Part 3 – Windows.
Amazon Machine Images and launch templates
You have used existing base Amazon Machine Images (AMIs) as a source for your OS and software, customizing them to your needs. The next step is to produce your own AMIs from these customizations so that you can quickly launch one or more instances from this state in the future. Furthermore, you want to avoid replicating the work that you have just done, while also maintaining a standard environment across the teams that use these instances.
Moreover, when you initiated the workstation instances, you also stipulated the networking, security, permissions, and instance type that define the complete instance alongside the AMI. You can wrap all of this information into an Amazon EC2 launch template to standardize the whole instance, so you can launch it without issues.
Note the current size of the Amazon Elastic Block Store (Amazon EBS) volume that you are using for your OS and applications on your workstation. When you create an AMI you stipulate the size of the volume to associate with it. Keeping the storage size of the AMI efficient makes sure that your (relatively small) storage costs are optimized and any movement and startup using that AMI are as quick as possible.
On Windows, review the size of the C: drive in Windows Explorer by looking at the drive properties, and in a shell in Linux you can use df -h to review filesystem disk space usage.
Preparing a Linux AMI
To prepare Linux, first stop the instance, if it is running:
- In the Amazon EC2 console, choose Amazon EC2 Dashboard in the top left.
- Choose Instances (running).
- Choose the
my_linux_workstationinstance in the top pane. - Open the context menu for the instance, and choose Stop instance.
- Wait for the Instance state to move from Running to Stopped.
Preparing a Windows AMI
Windows Server 2025 uses the agent EC2Launchv2 on bootup to perform system tasks. You must configure the agent before shutting down the instance, prior to making an AMI, through the Amazon EC2LaunchSettings application. The following screen capture shows the EC2Launch Settings application, where you set the boot-time behavior of the agent. In this example, the General tab is open. This tab controls launch-time options for the instance, such as setting the instance name and configuring the administrator username and password.
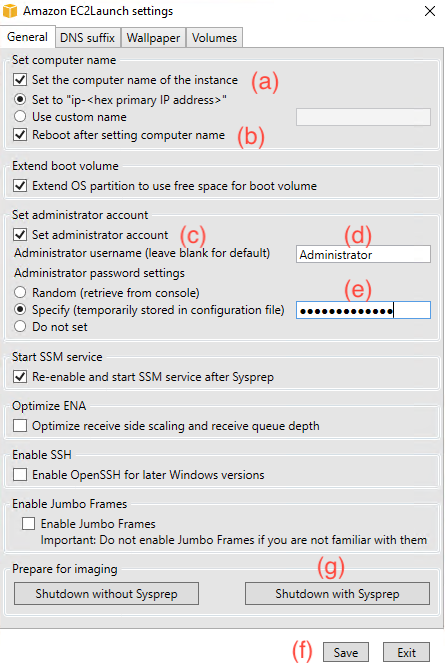
Figure 2: A screen capture of the Amazon EC2Launch Settings application, used to configure the EC2Launch agent on bootup
On your Windows instance, open the Amazon EC2Launch settings application.
This application controls which tasks the agent performs on boot. Pertinent options to enable are as follows:
Host name:
- Turn on “Set the compute name of the instance”, and set it to
ip-<hex primary IP address>. - Turn on “Reboot after setting Computer Name”.
This makes sure that the compute host name is unique upon booting for future considerations toward Active Directory, render farms, and so on.
Password
- Turn on Set the administrator account.
- Set the Administrator username (for example, Administrator).
- Specify the Administrator password.
This can be the same as what you previously set before, or you can change it.
Wallpaper (on the third tab)
You can specify the custom Windows wallpaper and stat burn-in of various instance parameters.
- When you have made your changes, choose Save at the bottom of the screen to save your configuration changes.
You have two choices to shut down based on Sysprep.
Shut down without Sysprep
This option is useful if you have embedded information on the image that you want to retain (for example, local users for processes) that would otherwise be removed by Sysprep.
Shut down with Sysprep
For removing PC-specific information for future AMI consideration:
- Shut down with Sysprep on this occasion. The machine automatically shuts down.
Wait for the Instance state to move from Running to Stopped.
You can find more information about Amazon EC2 Launch in the Amazon EC2 User Guide.
Creating the AMI
When your instances are in the Stopped state, you can proceed with making your AMI.
- In the Amazon EC2 console, choose Instances in the top left.
- Choose your workstation instance by selecting the checkbox next to its name.
- Choose Actions from the top right of the pane, and choose Image and templates, Create image.
In the Create image page, specify the options for your AMI:
- Give your AMI an Image name. You might want to consider versions in the AMI name.
- For example,
VFX_Workstation_Linux_v001.
- For example,
- Give your AMI a relevant Image description.
- For example,
base build, with GPU, WACOM, CLI.
- For example,
- The Size of your storage can be specified. As mentioned previously, consider reducing this down to something that is more aligned with your actual usage, such as usage + 20 percent.
- Consider adding a new tag to give your AMI a discernible name.
- For example, add a Name tag key, and paste the Image name as the value.
- Choose Create image to make the AMI. This can take several minutes to complete.
Amazon EC2 AMIs can be shared across accounts and Regions, which lets teams standardize workstation configurations and deploy them quickly. Because a VFX workstation AMI often bakes in licensed digital content creation (DCC) tools, render plugins, studio tooling, and credentials, treat it as a controlled asset rather than something to share broadly.
Share each AMI only with the specific accounts that need it and prefer sharing with named AWS account IDs over making an AMI public. Before you share, confirm the image contains no embedded secrets such as application API keys, license tokens, or SSH keys baked in during the build. Audit your sharing configuration periodically so access does not outlive its purpose and revoke it when a team or project no longer needs the image.
Creating a launch template
When you launched the EC2 instance, as well as the AMI to use, you also stipulated other options that were important to define how the machine launched, such as the network, security groups, and roles. Rather than do this each time that you want to start an instance, you can combine all this information, and more, into an Amazon EC2 launch template. You can then quickly launch machines in the future, or combine them with other brokering and scaling mechanisms to control larger usage of the machines. This is useful for studios with multiple artists, or render farms with multiple machines, all using standardized environments.
You can build a launch template through the Amazon EC2 console:
- In the Amazon EC2 console, choose Launch Templates under the Instances section on the left.
- Choose Create launch template on the right side of the pane.
- Provide a Launch template name and description in the relevant boxes.
Launch templates are versioned, so there is no need to add a version number to its name.
- For the AMI, choose My AMIs and choose the relevant AMI that you made in the previous steps.
- Under Instance type choose g6.4xlarge. This is the default size for your template (but this and all values can be overridden at launch time if you wish).
- Provide your
ec2_test_keypairin the Key pair (login). - Edit the Network settings to adjust security and network placement:
- Leave the Subnet to Don’t include in launch template.
- Under the Firewall (security groups) section of the Network Settings, choose Select existing security group, and choose the “ec2_test_sg” that you made earlier to set up the firewall for the machine.
- In Resource tags, add a Name key tag, with a value of
my_workstationor another suitable name. - Under Advanced details, specify the
basic_workstation_rolethat you made previously through the IAM instance profile list, to allow your workstation to access more services.
There are many other options that you can explore in launch templates. A useful feature is found at the bottom of the Advanced details: the User data. With user data, you can enter Windows PowerShell or Linux shell commands to run on boot, adding configurations or modifications on top of the AMI. This circumvents the need to publish new AMIs for certain kinds of change. An example of this can be found in the following GPU performance optimization section, but for now you can finish making the launch template.
- Choose Create launch template.
When you return to the Launch templates dashboard, your newly created template appears in the list. Select the template, then choose Launch instance from template from the Actions menu to open a dialog for launching a new instance from it. The dialog shows the template’s values and lets you adjust any setting before launch. You can also modify a template to create new versions and set a default version. This way, you can keep multiple versions for comparison while clearly marking which one to use by default. The following screen capture shows the dialog, where you confirm the source template and version and optionally override its settings before launching.
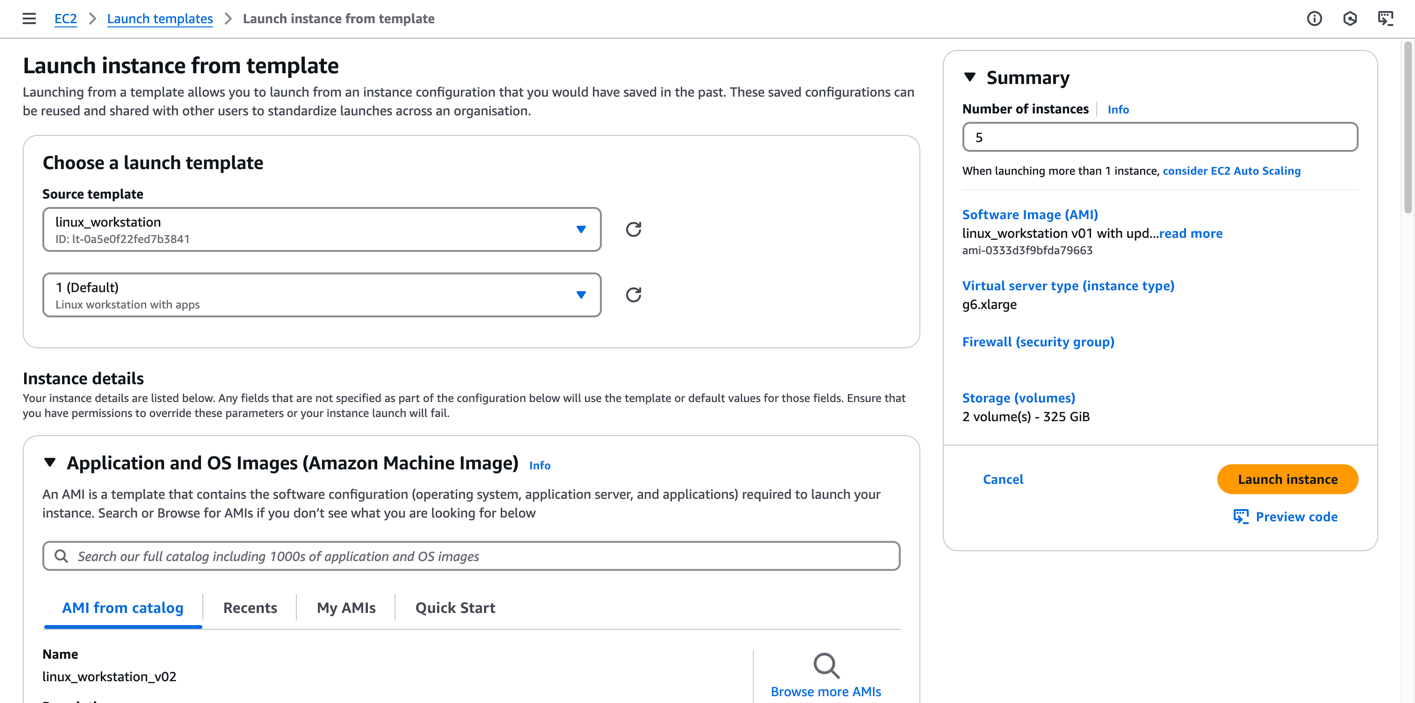
Figure 3: The Amazon EC2 launch template UI can be used to quickly start an instance, with options to override existing parameters
Launch templates can be used in other services to streamline and control instance starting mechanisms at scale, such as Amazon EC2 Auto Scaling groups, as well as third-party services listed in the Further reading section.
This post demonstrates how to build an AMI in manual steps. There are alternate services to create an AMI that can cater to larger scaling mechanisms to support productions. For example, Amazon EC2 Image Builder allows you to define recipes and schedules for automating the creation of AMIs.
GPU performance optimization
There’s dedicated AWS documentation in the Amazon EC2 User Guide regarding GPU optimizations. This includes initializing the persistent driver kernel on Linux, to keep GPU states initialized regardless of client connections:
It also includes documenting how to turn off GPU autoboost, for slightly more efficient GPU usage. This option should be considered and evaluated on a per-application basis to ascertain positive or negative impact on performance. Go to the preceding documentation for more information.
Outside of the official documentation on AWS, for VFX-specific workloads a further optimization can be made regarding NVIDIA Error Correction Code (ECC). Amazon EC2 G instance family types use NVIDIA data center cards, designed for high performance computing. These differ from the consumer-style cards typically found in individual workstations in offices. On data center cards, ECC is provisioned and enabled as a method to introspectively look for potential pixel errors because of bit flipping through phenomena such as cosmic ray interaction, and fix any errors found.
You should consider deactivating this feature to reduce the overhead of memory checking on the GPU, to gain performance. ECC isn’t typically available on consumer GPU cards, so many customers’ workloads haven’t relied on this error-correction feature in the first place. If debugging requires it, the feature can be quickly re-enabled.
ECC is activated on every fresh start of an EC2 instance, and disabling necessitates a reboot. You can automate turning it off with a traditional startup script, or with the previously mentioned User data script as part of the launch template.
For a Windows instance, you can add the User data script by inserting it between leading and trailing powershell elements to define a PowerShell script, with the persist element added so the script runs again on each reboot cycle, and not only on the first boot.
For a Linux instance, you can enter a shell script:
User data is a mechanism to make changes to EC2 instances, without reverting to changing the underlying AMI. However, you should avoid hardcoding and storing sensitive data in it, that might pose a visible compliance or security risk. AWS Secrets Manager can be used to obfuscate sensitive data, as it stores and manages the lifecycle of secrets, and provides robust mechanisms to pass that data programmatically into process within a user data context.
Cleaning up
Remember to turn off your instances when not in use. You can turn them off either through the AWS Management Console, or through other programmatic methods such as the AWS Command Line Interface (AWS CLI). You incur costs associated with a running machine, so deactivating machines when not in use reduces your expenditure.
There are two different options for deactivating an EC2 instance: stopping and terminating.
Stopping
When you stop an instance, its Amazon EBS volumes remain attached and their data is retained, so your work on the EBS volume persists while the instance is deactivated. Data held in memory (RAM) is not preserved, and neither is any data on the instance store (NVMe) volumes (that data is lost when the instance stops).
You perform this operation by choosing the instance from the Amazon EC2 console, and under the Instance state options you can elect to Stop instance. The instance remains in your console, with a “Stopped” state, but the persistent volumes enable you to restart the instance and resume your session when you want, retaining any changes that you made to the main volume. You can restart an instance by using the Start instance operation under the Instance state options.
When an instance is “Stopped”, you don’t pay for the instance itself but incur a smaller charge for the storage of the volume.
Terminating
This operation deactivates the instance and does not retain any information locally stored. You can’t restart a terminated instance.
To terminate an instance, choose Terminate instance from the Instance state options on the Amazon EC2 console. The instance shuts down and reports a “Terminated” state on the console, and automatically disappears after a short time.
For more information about Amazon EC2 lifecycles, options, and billing, go to the Amazon EC2 User Guide.
Conclusion
This post has demonstrated how existing base AMIs can be used as a source for creating a custom VFX workstation, with further GPU optimizations applied to increase performance. These customizations can be published as new AMIs themselves for quick redeployment of that machine setup. Then, you integrated this AMI into a launch template to specify the complete array of startup requirements needed for a workstation, for quick and standardized deployment of machines.
We recommend that you continue to the final Part 5 of our series, Building a GPU workstation for visual effects with Amazon EC2: Part 5 – Security, to explore security practices related to the deployment of visual effects (VFX) workstations. This post examines how to secure these workstations by controlling who can reach the desktop, protecting the session in transit, and safeguarding the credentials, images, and storage behind it.
For more information, contact us at [email protected].
Further reading
If you want to augment a VFX workstation environment with a dedicated render farm, then consider the managed service AWS Deadline Cloud.
EC2 instance metrics, such as CPU and memory usage, are readily sent to Amazon CloudWatch logs, allowing you to access this data through the console and AWS CLI. This information can be pertinent to discern if an EC2 instance is being over-provisioned or under-provisioned for the work at hand. For example, it has excessive CPU, memory, and networking resources for the current tasks and could be optimized for price, or the alternative where it has not been allocated enough resources to cope. For more information, visit the Amazon EC2 User Guide.
Windows instances can be lengthy to boot. Amazon EC2 Fast Launch for Windows is an AWS facility for quicker launching of Windows machines through smart snapshots of the AMI.
The following post shows how to programmatically configure a Windows EC2 instance as part of a domain. This is particularly useful when the instances are used ephemerally, for example as part of a fleet of instances that spool up and down for the purposes of rendering, and you need methods to bind and remove instances quickly.
Commercial options also exist to perform artist/instance brokering, using Amazon DCV and Amazon EC2 launch templates. An example of this offering is Leostream.
About the authors
Building a GPU workstation for visual effects with Amazon EC2: Part 3 – Windows
Post Syndicated from Andy Hayes original https://aws.amazon.com/blogs/compute/building-a-gpu-workstation-for-visual-effects-with-amazon-ec2-part-3-windows/
For many years Amazon Web Services (AWS) has been guiding customers in the deployment of powerful NVIDIA GPU-backed workstations for graphics-intensive workloads. With the recent expansion of our G-series Amazon Elastic Compute Cloud (Amazon EC2) graphics-based instances, we are excited to introduce new instance families that deliver enhanced performance and capabilities. We are also refreshing our comprehensive guidance on choosing and configuring these powerful virtual workstations.
This is the third post in a five-part series, focusing on the deployment of a Windows Server 2025 visual effects (VFX) workstation, using Amazon DCV as a performant desktop display protocol.
“Amazon DCV has unlocked previously unrealised playback performance, that has massively increased my productivity. Amazon DCV is performant on a range of systems and where other solutions have failed, I have been able to continue working and most importantly, continue delivering”
— Chris Coupe, CG Supervisor, Outpost VFX
Prerequisites
This post assumes that you have configured the following:
- An active AWS account with increased GPU Amazon EC2 service quota limits.
- A valid key pair in your AWS Region of choice.
- A configured virtual firewall security group, with open TCP/UDP ports 22, 443, 8443, and 3389 limited to only your own IP address.
- An AWS Identity and Access Management (IAM) profile with least-permissions Amazon Simple Storage Service (Amazon S3) read access.
We strongly recommend that you follow Part 1 of the series, Build a GPU workstation for visual effects on Amazon EC2: Part 1 – Setup, which goes through the preceding steps in detail.
Launching the Windows workstation
We use the latest AWS provided Windows Server 2025 Amazon Machine Image (AMI) for our deployment, and install the NVIDIA, Amazon DCV, and Wacom components to create a fully functioning VFX Windows desktop environment.
Follow these steps to launch a g6.4xlarge instance in your chosen AWS Region. If you want to use multiple GPU cards (for example, by using the 12xlarge, 24xlarge, or 48xlarge instance types), then Windows requires you to have that number of GPU cards present when setting up the GPU driver. In this case, we recommend starting the relevant multiple GPU instance size when making your AMI.
- Log in to the AWS Management Console and choose EC2 Dashboard in the top left.
- Choose Launch instances to start the prompt to launch a new instance.
- Give the instance a name, for example
my_windows_workstation. - Choose Windows under the Quick Start AMI and use the default Microsoft Windows Server Base Image 2025.
- Under Instance type, choose g6.4xlarge.
- Under Key pair name, choose the menu and choose your key pair. In the previous post we called it
ec2_test_keypairto specify the password security credentials. - Edit the Network settings to adjust security and network placement:
- Leave the Subnet to No preference.
- Make sure that Auto-assign public IP is set to Enable, so that you can access the instance through the internet.
- Under the Firewall (security groups) section of the Network Settings, choose Select existing security group, and specify your security group. In the previous post we named it
ec2_test_sgto set up the firewall for the machine. - In Configuration storage, expand the default root volume from 10 GiB to 50 GiB of gp3 storage.Important: Turn on encryption in the Advanced options by selecting the Encrypted option and selecting the default AWS managed key (aws/ebs) or a customer-managed KMS key for enhanced control. Amazon Elastic Block Store (Amazon EBS) encryption protects your VFX project files, renders, and application data at rest. Encryption uses industry-standard AES-256 encryption and is transparent to applications with minimal performance impact.
- Under Advanced details, specify the role that you created for workstation usage. In the previous post we called it
basic_workstation_rolethrough the IAM instance profile menu, so your workstation can access more services. - Choose Launch instance on the right-hand side, as shown in the following figure.
Choose the link to the EC2 instance that has been launched, or view it through the Instances pane in the Amazon EC2 Service page. The following screen capture shows the newly launched workstation in the EC2 Instances list, where you can confirm it is ready to use. Wait until the my_windows_workstation instance shows an Instance state of Running and a Status check of 3/3 checks passed. Once both conditions are met, you can continue.
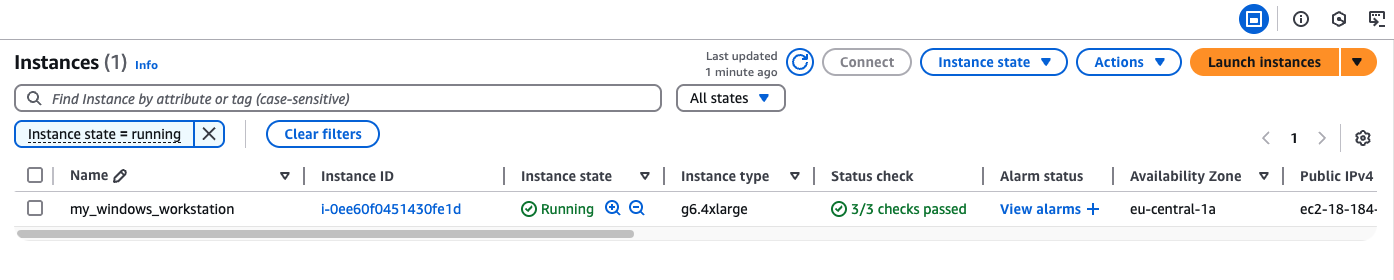
Figure 1: A screen capture of the EC2 Instances page, showing the my_windows_workstation in a ready state
Configuring the Windows workstation
In the last part of our series, Building a GPU workstation for visual effects with Amazon EC2: Part 4 – Optimizations, we show how to add scripting capabilities to the boot sequence of EC2 instances. This runs processes such as the NVIDIA GPU driver and Wacom tablet driver automatically during the startup of a machine. For the purposes of this post, we take a more manual approach, showing how you can remote into the machine to perform setup tasks.
You initially connect to the instance through the Windows Remote Desktop Protocol (RDP). In the Amazon EC2 Service page browser tab with the list of EC2 instances running, again choose the my_windows_workstation and choose Connect.
Choose the RDP client tab to connect to the machine through RDP with the following steps:
- Choose the Get password option to retrieve the Administrator password for the machine through your key pair credential.
- Upload the private
ec2_test_keypair.pem key file that you downloaded previously and choose Decrypt password. - The password is now displayed. Copy the password into the clipboard memory by choosing the copy icon, and choose OK, as shown in the following figure.
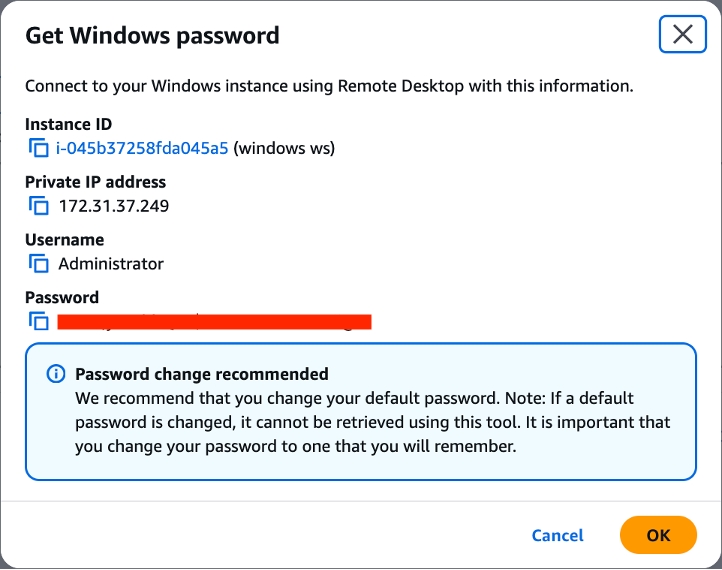
Figure 2: A screen capture of the Get Windows Password retrieval options available to EC2 instances
- Choose Download remote desktop file to download the .rdp file to your local machine.
- Run the .rdp file with your Remote Desktop Application of choice.
- When prompted, paste the previously copied
Administratorpassword and choose OK. - Choose Yes to trust the machine, and the session is authenticated and opened.
Security
We recommend setting a new, private password when you first start the fresh instance.
Open a Windows PowerShell to configure and make changes to the workstation. In the shell, configure that change and store your new password in a safe place.
Tools
To install the AWS Command Line Interface (AWS CLI) enter the following into the shell, and follow the on-screen prompts:
Graphics
You must use AWS approved NVIDIA GPU drivers, issued through Amazon S3, not only for optimal compatibility and performance, but also to make sure that the necessary professional GRID drivers are automatically provisioned. You can always find the latest instructions in the Amazon EC2 Windows User Guide. At the time of writing, you can download the latest version to your desktop by running the following in a new Windows PowerShell:
When it is downloaded, navigate to your Desktop, open the NVIDIA folder, then the latest folder inside, and run the NVIDIA installer executable, following the instructions.
Wacom support and Wacom Bridge
To add Wacom stylus support on the workstation, open Microsoft Edge (or install your browser of choice) and download and install the latest drivers from the Wacom drivers page.
Wacom Bridge is now generally available on Windows and Mac, and offers new advantages for Wacom users on AWS:
- Applications running locally and remotely on AWS transfer their Wacom-specific settings automatically.
- Artists can switch from local to remote use of the pen by choosing the necessary application window.
- Wacom Inkline draws an instant temporary line on your screen, to bridge any gap between the local pen tip and the remote drawn line.
- Amazon DCV provides enhanced security through data transport encrypted through HTTPS/TLS connections.
You can purchase a Wacom Bridge license (or request a trial) from a Wacom Sales representative.
Amazon DCV setup
To use Amazon DCV, you need to download the server application for the Amazon EC2 workstation from https://www.amazondcv.com/.
On the Amazon EC2 workstation, open the preceding link in your browser of choice, expand the latest Amazon DCV Server entry (2026.0 at the time of this post), choose the Windows (x86_64) link, download the installer, and run it. The default options automatically configure firewall entries for the Amazon DCV server ports, and start the Amazon DCV server.
Instance store setup
Finally, consider setting up the instance store on the instance:
- In the search bar at the bottom of the screen, enter
Computer Managementand press Enter. - Choose Disk Management in the left pane.
- If prompted, then choose OK to accept the requested formatting of the instance store. The following figure shows such a prompt.
- Open the context menu for the Unallocated drive and choose New Simple Volume.
- Accept the requests, making any wanted changes to the drive name, or assigning to a folder instead.
- Choose Finish and the new volume is available to use as a temporary drive.
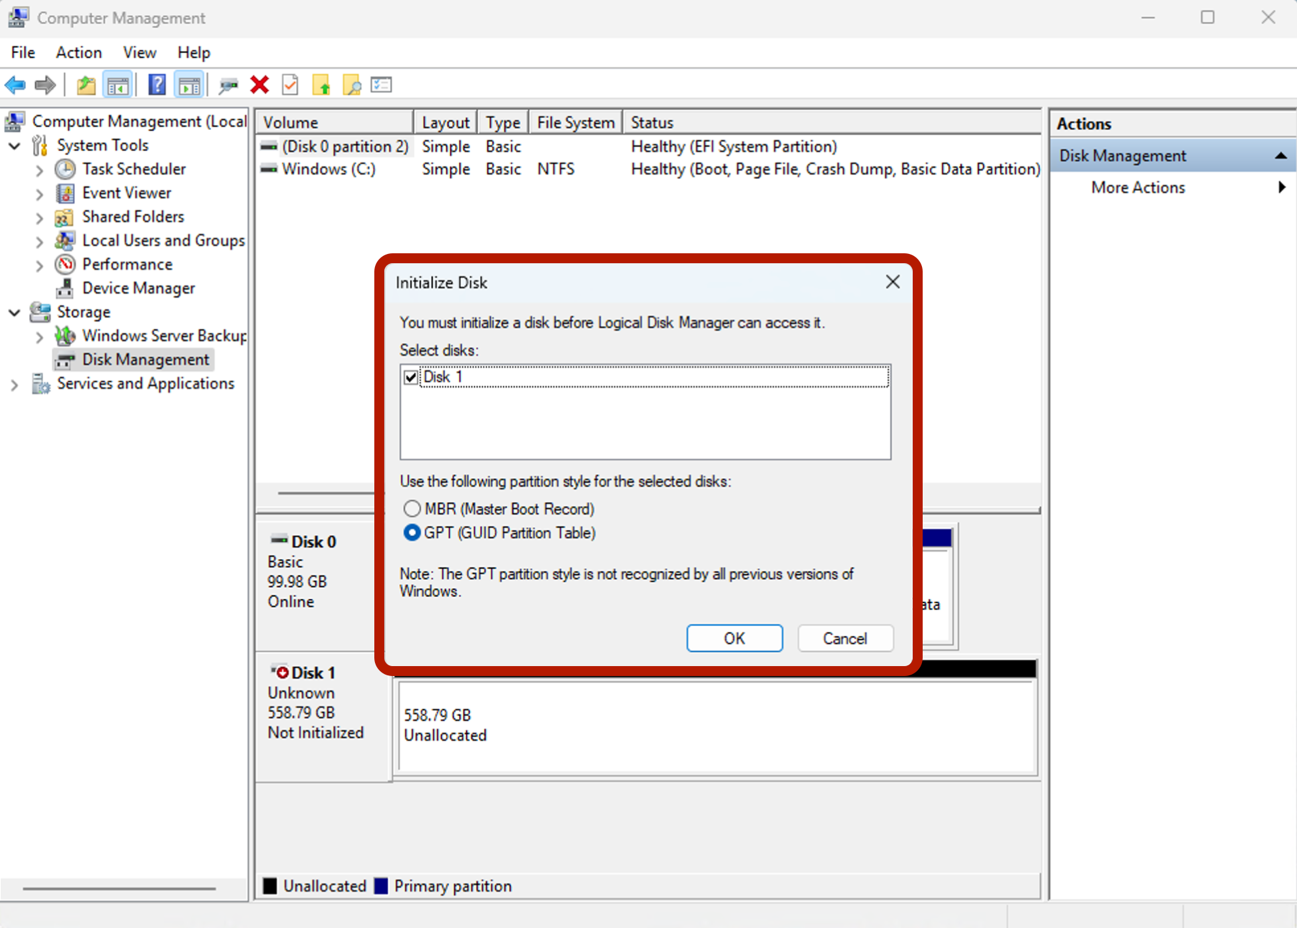
Figure 3: The Disk Management tool prompting the automatic formatting of the instance store
Proceed to the next section to log in to your workstation to use Amazon DCV.
Logging into your workstation through Amazon DCV
To log in to your machine using Amazon DCV, you must first set up the client software on your local machine:
- On your local machine or laptop, open Amazon DCV.
- Expand the Amazon DCV Client entry that matches the Server version that you installed on your workstation.
- Choose the relevant OS for your machine or laptop, for example Windows (x86_64).
- Download the installer.
- Run the installer.
When it is installed, you must determine the public IP address of the workstation to connect to:
- In the Amazon EC2 Console, choose Amazon EC2 Dashboard in the top left.
- Choose Instances (running).
- Choose the
my_windows_workstationEC2 instance, in the top pane of the screen. - Choose the copy icon next to the Public IPv4 address in the lower pane to copy the IP address.
Finally, use the Amazon DCV client to view the workstation:
- Open the Amazon DCV client on your local machine.
- Paste the previous IP address and press Enter, then trust the connection.
- You will see a security warning about an untrusted certificate. This is expected behavior because Amazon DCV uses a self-signed certificate by default. For this initial setup, it is safe to accept the certificate and proceed with the connection. For a detailed explanation of why this warning appears and how to implement proper certificate security for production environments, see Amazon DCV Connection Security in Building a GPU workstation for visual effects with Amazon EC2: Part 5 – Security.
- In the next Username / Password entry field, choose Administrator, and the appropriate password to which you set that user.
After the connection is established, Amazon DCV opens and displays the remote workstation desktop. The following screen capture shows the running workstation, confirming that your remote session is active and the environment is ready to use. In this example, the Windows Server 2025 desktop is shown with SideFX Houdini open, displaying a rendered scene in the viewport above the Windows taskbar.
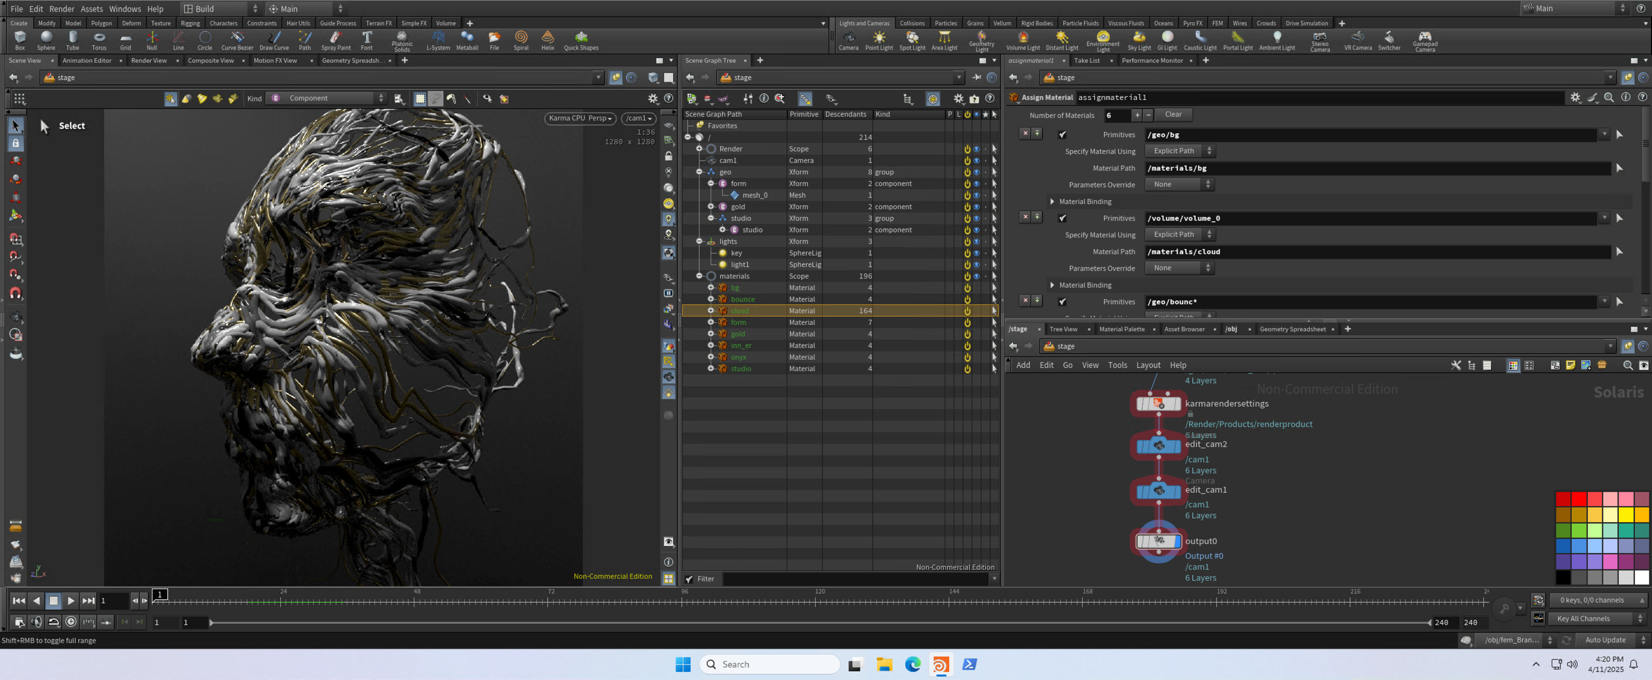
Figure 4: A screen capture of a Windows Server 2025 based workstation
With Windows, you automatically get brush sensitivity with Wacom and Amazon DCV connectivity. You don’t need to configure additional steps for your brushes to dynamically use the tablet’s controls.
Note: If you have need for a managed, non-persistent Windows desktop where several users share one GPU instance, consider Amazon WorkSpaces Applications multi-session fleets. They’re best for lighter graphics users such as reviewers, CAD viewers and editors, rather than artists working heavily in the viewport.
Cleaning up
Finally, you must remember to turn off your instances when not in use, either through the AWS Management Console, or through other programmatic methods such as AWS CLI. You incur costs associated with a running machine, and so deactivating machines when not in use reduces your expenditure.
This can be done by choosing Terminate instance from the Instance state options of the workstation in the Amazon EC2 console. The instance shuts down and reports a Terminated state on the console, but it automatically disappears after a short time.
However, if you want to learn more about the various methods to deactivate an EC2 instance, and create a persistent machine image of your Windows instance, then refer to Part 4 of the series, Building a GPU workstation for visual effects with Amazon EC2: Part 4 – Optimizations.
Conclusion
This post has shown how Amazon EC2 instances running Windows Server 2025 can create a GPU-backed VFX workstation. Your artists can use the latest technologies to unlock efficiencies, unhampered by the lengthy hardware renewal cycles typically found in on-premises environments.
We recommend that you continue to Part 4 of our series, Building a GPU workstation for visual effects with Amazon EC2: Part 4 – Optimizations, to learn how to implement GPU optimizations and infrastructure to streamline the provisioning of workstations. Part 4 also covers essential information on security practices for Windows EC2 instances, including build-time hardening and automated patch management to protect your workstation infrastructure from evolving threats.
For more information, contact us at [email protected].
Further reading
If you want to augment a VFX workstation environment with a dedicated render farm, then consider the managed service AWS Deadline Cloud.
EC2 instance metrics, such as CPU and memory usage, are sent to Amazon CloudWatch logs, so you can access this data through the console and AWS CLI. This information helps you discern whether an EC2 instance is over- or under-provisioned for the work at hand. For example, an instance might have excessive CPU, memory, and networking resources for the current tasks and could be optimized for price. Alternatively, it might not have enough resources to cope. For more information, visit the Amazon EC2 User Guide.
Windows instances can be lengthy to boot. Amazon EC2 Fast Launch for Windows is an AWS feature for faster launching of Windows machines through smart snapshots of the AMI.
Another post shows how to programmatically configure a Windows EC2 instance as part of a domain. This is particularly useful when the instances are used ephemerally, for example as part of a fleet of instances that spool up and down for rendering, and you need methods to bind and remove instances quickly.
More advanced examples of using Amazon DCV can be found in the aws-samples dcv-samples GitHub repo. This includes methods to broker multiple users and instances. Amazon DCV Connection Gateway provides a single entry point for users to connect to multiple Amazon DCV sessions across different instances, streamlining access management and improving security through centralized authentication.
Commercial options also exist to perform artist/instance brokering, using Amazon DCV and Amazon EC2 launch templates. An example of such an offering is Leostream.
For reference, examples of setting up Amazon DCV-capable instances and using AWS CloudFormation templates as a deployment method can be found in the amazon-ec2-nice-dcv-samples GitHub repo.
A deeper analysis of bit rates and latency for Amazon DCV connections can be found in this AWS HPC Blog post.
More information about Wacom Bridge running on Amazon DCV can be found in this AWS Wacom post and re:Invent 2024 talk.
About the authors
Building a GPU workstation for visual effects on Amazon EC2: Part 2 – Linux
Post Syndicated from Andy Hayes original https://aws.amazon.com/blogs/compute/building-a-gpu-workstation-for-visual-effects-on-amazon-ec2-part-2-linux/
For many years Amazon Web Services (AWS) has been guiding customers in the deployment of powerful NVIDIA GPU-backed workstations for graphics-intensive workloads. With the recent expansion of our G-series Amazon Elastic Compute Cloud (Amazon EC2) graphics-based instances, we are excited to introduce new instance families that deliver enhanced performance and capabilities. We are also refreshing our comprehensive guidance on choosing and configuring these powerful virtual workstations.
This is the second post in a five-part series, focusing on the deployment of a Rocky Linux 9.5 visual effects (VFX) workstation, using Amazon DCV as a high-performance desktop display protocol.
“Amazon DCV gives me the ability to prioritise image quality or smooth performance and playback, depending on the tasks I am performing. It adapts quickly to any monitor used and when in full screen, I forget I am operating a remote workstation.”
— Giorgio Pitino, Head of Creative Operations, Outpost VFX
Prerequisites
This post assumes that you have already configured the following:
- An active AWS account with increased GPU Amazon EC2 service quota limits.
- A valid Amazon EC2 key pair in your AWS Region of choice.
- A configured virtual firewall Security Group, with open TCP/UDP ports 22, 443, 8443, and 3389 limited to only your own IP address.
- An AWS Identity and Access Management (IAM) profile with Amazon Simple Storage Service (Amazon S3) read access, for workstation usage.
We strongly recommend that you follow Part 1 of the series, Build a GPU workstation for visual effects on Amazon EC2: Part 1 – Setup, which goes through the preceding steps in detail.
Launching the Linux workstation
The AWS Marketplace offers an official Rocky Linux 9 x86-64 Amazon Machine Image (AMI) that can be used as a base AMI for our GPU workstation.
To use this AMI, you need to subscribe to the AMI to use the updates:
- Log in to the AWS Management Console and navigate to the AWS Marketplace by searching for its name in the Service search bar, or by navigating:
Services > Cloud Financial Management > AWS Marketplace.
- Choose Discover products in the left pane.
- Search for “rocky linux 9 official” in the Search field.
- Choose Rocky Linux 9 (Official) – x86_64 to view the marketplace offering.
- Choose Continue to Subscribe to subscribe to this product.
| This product has no actual fee: other products, such as variations of Rocky Linux with support from third parties, might charge. |
- To continue, choose Accept Terms (if you agree).
- The subscription process starts, with Effective date showing pending. But when the subscription is complete (which can take a few minutes) this changes to the current date.
When the subscription process has completed, you can launch an EC2 instance from that AMI:
- Navigate back to the AWS Marketplace service console page and choose Manage subscriptions.
- Choose Launch new instance underneath the entry for Rocky Linux 9 (Official) – x86_64.
- Choose Launch instances.
- When prompted, specify your AWS Region, and choose Continue to launch through EC2.
This now opens the Amazon EC2 launch interface.
- Give the instance a name, for example “my_linux_workstation”.
- Note that the AMI has been pre-filled for you.
- Under Instance type, choose g6.4xlarge.
- Under Key pair name, open the list and choose your key pair. In the previous post we called it “ec2_test_keypair” to specify the password security credentials.
- Edit the Network settings to adjust security and network placement:
- Leave the Subnet to No preference.
- Make sure that Auto-assign public IP is set to Enable, so that you can access the instance through the internet.
- Under the Firewall (security groups) section of the Network Settings, choose Select existing security group, and specify your security group. In the previous post we named it “ec2_test_sg” to set up the firewall for the machine.
- In Configuration storage, expand the default root volume from 10 GiB to 50 GiB of gp3 storage.Important: Enable encryption in the Advanced options by checking the Encrypted option and select the default AWS managed key (aws/ebs) or a customer managed AWS KMS key for enhanced control. Amazon Elastic Block Store (Amazon EBS) encryption protects your VFX project files, renders, and application data at rest. Encryption uses industry-standard AES-256 encryption and is transparent to applications with minimal performance impact.
- Under Advanced details, specify the role that you created for workstation usage. In the previous post we called it “basic_workstation_role”, through the IAM instance profile list, so your workstation can access additional services.
- Choose Launch instance.
You can now choose the link to the EC2 instance that has been launched or view it through the Instances pane in the Amazon EC2 Service page. The following screen capture shows the newly launched workstation in the EC2 Instances list, where you can confirm it is ready to use. When the “my_linux_workstation” instance is in the Running state, and the Status check is 3/3 checks passed, you can continue.

Figure 1: A screen capture of the EC2 Instances page, showing my_linux_workstation in a ready state
Configuring the Linux workstation
Now you proceed to configure the instance with the necessary libraries and software needed to make it a capable workstation for making 2D and 3D content. From a Mac terminal, Linux terminal, or Windows PowerShell, you can now SSH into the rocky user over the public IP address. To find the Public IPv4 address, choose the EC2 instance in the Instances pane (as shown in the preceding figure), and you should find the address located in the top/middle part of the Details section.
When you are logged in to the machine, you can start with password updates and general necessary packages:
Reconnect to the instance to disable nouveau drivers, in preparation for installing the GPU drivers:
Reconnect to the instance to begin installing the GPU drivers:
|
You must use AWS approved NVIDIA GPU drivers, issued through Amazon S3, not only for optimal compatibility and performance, but also to make sure that the necessary professional GRID drivers are automatically provisioned: https://docs.aws.amazon.com/AWSEC2/latest/UserGuide/install-nvidia-driver.html |
At the time of writing, these are the current steps to install the correct NVIDIA GPU drivers.
You should get an output as follows:
Now set up the Amazon DCV server to stream the desktop to your local machine/client.
The Amazon DCV server uses parameters to specify configuration options. On Linux this manifests as a file on disk.
Note: Looking to the future of Linux based workstations, DCV now supports Wayland display drivers on RHEL 10, Rocky Linux 10, CentOS 10 and Ubuntu 26.04.
Now install the Wacom drivers:
The local instance store NVMe devices need mounting. For more information, visit the Amazon EC2 User Guide.
Finally, we show some examples of application-specific library setup. Each application potentially has its own list of necessary libraries to install, which can be referenced online. The following are some examples:
And lastly, it is time to clean up.
Logging in to your workstation
To log in to your machine using Amazon DCV, you must set up the client software on your local machine:
- On your local machine/laptop, open the Amazon DCV download webpage.
- Expand the Amazon DCV Client entry that matches the Server version that you installed on your workstation.
- Choose the relevant OS for your machine/laptop, for example Windows (x86_64).
- Download the installer.
- Run the installer.
When it is installed, we need to determine the Public IP address of the workstation to connect to:
- In the Amazon EC2 Console, choose Amazon EC2 Dashboard.
- Choose Instances (running).
- Choose the “my_linux_workstation” EC2 instance, in the top pane of the screen.
- Choose the copy icon next to the Public IPv4 address in the lower pane to copy the IP address.
Finally, use the Amazon DCV client to view the workstation:
- Open the Amazon DCV client on your local machine.
- Paste the preceding IP address and press Enter, then trust the connection.
- You will see a security warning about an untrusted certificate. This is expected behavior because DCV uses a self-signed certificate by default. For this initial setup, it’s safe to accept the certificate and proceed with the connection. For a detailed explanation of why this warning appears and how to implement proper certificate security for production environments, see Amazon DCV Connection Security in Building a GPU workstation for visual effects with Amazon EC2: Part 5 – Security.
- In the next Username / Password entry field, choose rocky, and the appropriate password to which you set that user.
After the connection is established, Amazon DCV opens and displays the remote workstation desktop. The following screen capture shows the running workstation, confirming that your remote session is active and the environment is ready to use. In this example, the Rocky Linux desktop is shown with SideFX Houdini open, displaying a rendered scene in the viewport against the Rocky Linux desktop background.
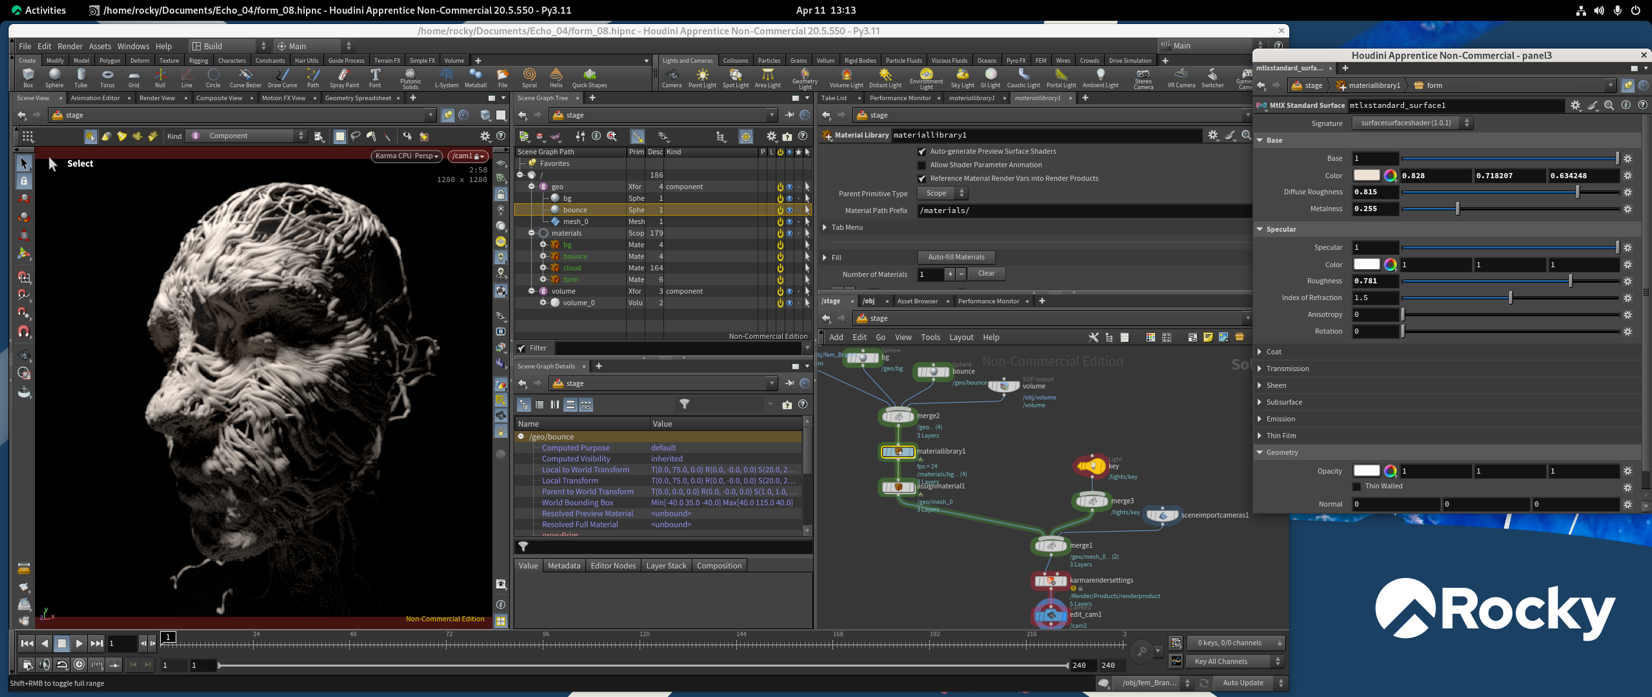
Figure 2: A screen capture of a Rocky Linux-based workstation
Cleaning up
Finally, you must turn off your instances when not in use, either through the AWS Management Console, or through other programmatic methods such as the AWS Command Line Interface (AWS CLI). You incur costs associated with a running machine, and so deactivating machines when not in use reduces your expenditure.
Deactivating instances can be done by choosing Terminate instance from the Instance state options of the workstation on the Amazon EC2 console. The instance shuts down and reports a “Terminated” state on the console, but it automatically disappears after a short time.
However, if you want to learn more about the various methods to deactivate an EC2 instance, and creating a persistent machine image of your Linux instance, then refer to Part 4 of the series: Building a GPU workstation for visual effects with Amazon EC2: Part 4 – Optimizations. Additionally, Part 4 will cover essential information on security practices for Linux EC2 instances, including build-time hardening and automated patch management to protect your workstation infrastructure from evolving threats.
Conclusion
In this post you have subscribed to and deployed an AWS Marketplace AMI of Rocky Linux to serve as your base image. Then, you modified it with GPU drivers, Wacom drivers, and other modules to make it a capable Linux-backed VFX workstation, using Amazon EC2 GPU accelerated G instance types.
You may also be interested in Part 3 of our series, Building a GPU workstation for visual effects with Amazon EC2: Part 3 – Windows, to learn how to create a Windows-backed VFX workstation.
We also recommend that you continue to Part 4 of our series, Building a GPU workstation for visual effects with Amazon EC2: Part 4 – Optimizations, to learn how to implement GPU optimizations and infrastructure to streamline the provisioning of workstations.
For more information contact us at [email protected].
Further reading
If you want to augment a VFX workstation environment with a dedicated render farm, then consider the managed service AWS Deadline Cloud.
EC2 instance metrics, such as CPU and memory usage, are readily sent to Amazon CloudWatch logs, so you can access this data through the console and AWS CLI. This information can be pertinent to discern if an EC2 instance is being over-provisioned or under-provisioned for the work at hand. An over-provisioned instance has excessive CPU, memory, and networking resources for the current tasks and could be optimized for price. Alternatively, an under-provisioned instance does not have enough resources to cope. For more information visit the Amazon EC2 User Guide.
More advanced examples of using Amazon DCV can be found in the aws-samples GitHub repo. This includes methods to broker multiple users and instances. Furthermore, DCV Connection Gateway provides a single entry point so you can connect to multiple DCV sessions across different instances, streamlining access management and improving security through centralized authentication.
Commercial options also exist to perform artist/instance brokering, using Amazon DCV and Amazon EC2 Launch templates. An example of such an offering is Leostream.
For reference, examples of setting up Amazon DCV capable instances, using AWS CloudFormation templates as a method of deployment, can be found in this GitHub repo.
A greater depth of analysis of bit rates and latency surrounding Amazon DCV connections can be found in this AWS HPC post.
About the authors
Build a GPU workstation for visual effects on Amazon EC2: Part 1 – Setup
Post Syndicated from Andy Hayes original https://aws.amazon.com/blogs/compute/build-a-gpu-workstation-for-visual-effects-on-amazon-ec2-part-1-setup/
For many years Amazon Web Services (AWS) has been guiding users in the deployment of powerful NVIDIA GPU-backed workstations for graphics-intensive workloads. With the recent expansion of our G-series Amazon Elastic Compute Cloud (Amazon EC2) graphics-based instances, we’re excited to introduce new instance families that deliver enhanced performance and capabilities. We’re also refreshing our comprehensive guidance on choosing and configuring these powerful virtual workstations.
This is the first in a five-part series providing detailed guidance on instance types, and deployment instructions for building Windows and Linux based NVIDIA GPU powered workstation on GPU accelerated EC2 instances. In this initial post, we explore the instance types, and outline essential AWS configurations for account preparation, security, policies, and other prerequisites. Subsequent posts cover Linux deployment (Part 2), Windows deployment (Part 3), optimizations and infrastructure for standardizing workstations deployment at scale (Part 4), and security considerations (Part 5).
G instance families
The Amazon EC2 G-series instances come in multiple families, with various types and fractionalization of GPUs, memory-to-CPU ratios, and sizes of vCPU and RAM. The g6 and gr6 instances, equipped with NVIDIA L4 GPUs, deliver up to 200 percent performance improvement in graphics-intensive workloads compared to the widely-adopted g4dn family, while offering enhanced performance and cost efficiency over their g5 predecessors. The g6f and gr6f options introduce more GPU partitioning capabilities with the NVIDIA L4, so you can provision fractional GPU allocations. This supports more cost-effective scaling for workloads that do not need a full GPU, with options for half, quarter, and one-eighth GPU. Fractional instances are ideal for remote workstation applications for staff that need only partial GPU usage, as well as other tasks such as lightweight machine learning (ML) research.
The g6e instances, featuring the NVIDIA L40S GPU, go further with double the GPU memory, 2.9x faster GPU memory bandwidth, and up to 2.5 times overall performance improvement compared to g5 instances. All three families offer flexible configurations with 1, 4, or 8 GPUs, providing specialized cores optimized for GPU processing, ray tracing, and machine learning workloads, as shown in the following figure.
The latest 7th generation instances, the g7 and g7e offer greater performance in GPU speed and memory with the latest NVIDIA RTX PRO 4500 and 6000 respectively. These instances are well suited for high-end 3D and 2D workloads and artificial intelligence (AI) workloads, delivering 4.6 times the AI inference performance of previous g6 instances. With up to 700 Gbps EFA-enabled network bandwidth, g7 instances help you run graphics and data workloads more efficiently.
| NVIDIA L4 |
NVIDIA L40S |
NVIDIA RTX PRO 4500 |
NVIDIA RTX PRO 6000 |
|
| Architecture | Ada Lovelace | Ada Lovelace | Blackwell | Blackwell |
| Memory | 24 GB GDDR6 | 48 GB GDDR6 | 32 GB GDDR7 | 96 GB GDDR7 |
| Memory Bandwith | 300 GB/s | 864 GB/s | 896 GB/s | 1790 GB/s |
| Cuda Cores | 7680 | 18176 | 10496 | 24064 |
| Tensor Cores | 240 | 568 | 328 | 752 |
| Ray Tracing Cores | 60 | 140 | 82 | 188 |
Figure 1: The list of GPU architecture statistics for the L4, L40S, RTX PRO 4500, and RTX PRO 6000 NVIDIA GPUs
The 6th and 7th generation of G instances are available in multiple configurations to accommodate diverse GPU, CPU, memory, and networking requirements. The g6, g6f, and g7 instances maintain the traditional 1:4 ratio of vCPUs to memory (GiB) established by previous generations such as g4dn and g5. The gr6 and gr6f families introduce an enhanced 1:8 ratio option, while the g6e and g7e instances natively possess the expanded 1:8 ratio. These higher allocations suit memory-intensive 2D and 3D workloads that frequently encounter memory constraints, providing support for demanding visual computing applications.
For the non-fractional g6 and gr6 instances, the configurations of sizes are as follows:
| Instance type | NVIDIA L4 GPU count | vCPUs | Memory (GiB) | EBS Bandwidth (Gbps) | Network Bandwidth (Gbps) | |
| Single GPU | g6.xlarge | 1 | 4 | 16 | Up to 5 | Up to 10 |
| g6.2xlarge | 1 | 8 | 32 | Up to 5 | Up to 10 | |
| g6.4xlarge | 1 | 16 | 64 | 8 | Up to 25 | |
| g6.8xlarge | 1 | 32 | 128 | 16 | 25 | |
| g6.16xlarge | 1 | 64 | 256 | 20 | 25 | |
| Single GPU / Memory Biased | gr6.4xlarge | 1 | 16 | 128 | 8 | Up to 25 |
| gr6.8xlarge | 1 | 32 | 256 | 16 | 25 | |
| Multi GPU | g6.12xlarge | 4 | 48 | 192 | 20 | 40 |
| g6.24xlarge | 4 | 96 | 384 | 30 | 50 | |
| g6.48xlarge | 8 | 192 | 768 | 60 | 100 |
Figure 2: The list of g6 and gr6 instance types with corresponding GPU amounts, vCPUs, network, and bandwidth data
The fractional g6f and gr6f configurations are:
| Memory (GiB) to vCPU ratio | Instance type | NVIDIA L4 GPU count | NVIDIA L4 GPU RAM (GiB) | vCPUs | Memory (GiB) | EBS Bandwidth (Gbps) | Network Bandwidth (Gbps) |
| 4-to-1 | g6f.large | 1/8 | 3 | 2 | 8 | Up to 5 | Up to 10 |
| g6f.xlarge | 1/8 | 3 | 4 | 16 | Up to 5 | Up to 10 | |
| g6f.2xlarge | 1/4 | 6 | 8 | 32 | Up to 5 | Up to 10 | |
| g6f.4xlarge | 1/2 | 12 | 16 | 64 | 6 | Up to 25 | |
| 8-to-1 | gr6f.4xlarge | 1/2 | 12 | 16 | 128 | 8 | Up to 25 |
Figure 3: The list of g6f and gr6f instance types with corresponding fractional GPU amounts, vCPUs, network, and bandwidth data
For the g7 instances, the configurations of sizes are as follows:
| Instance type | NVIDIA RTX PRO 4500 GPU count | vCPUs | Memory (GiB) | EBS Bandwidth (Gbps) | Network Bandwidth (Gbps) | |
| Single GPU | g7.2xlarge | 1 | 8 | 32 | Up to 8 | Up to 60 |
| g7.4xlarge | 1 | 16 | 64 | 8 | Up to 100 | |
| g7.8xlarge | 1 | 32 | 128 | 16 | 100 | |
| Multi GPU | g7.12xlarge | 2 | 48 | 192 | 20 | 175 |
| g7.24xlarge | 4 | 96 | 384 | 40 | 350 | |
| g7.48xlarge | 8 | 192 | 768 | 80 | 700 | |
| g7.metal* | 8 | 192 | 768 | 80 | 700 |
Figure 4: The list of g7 instance types with corresponding GPU amounts, vCPUs, network, and bandwidth data
For the enhanced g6e the following instance size configurations are:
| Instance type | NVIDIA L40S GPU count | vCPUs | Memory (GiB) | EBS Bandwidth (Gbps) | Network Bandwidth (Gbps) | |
| Single GPU | g6e.xlarge | 1 | 4 | 32 | Up to 5 | Up to 20 |
| g6e.2xlarge | 1 | 8 | 64 | Up to 5 | Up to 20 | |
| g6e.4xlarge | 1 | 16 | 128 | 8 | 20 | |
| g6e.8xlarge | 1 | 32 | 256 | 16 | 25 | |
| g6e.16xlarge | 1 | 64 | 512 | 20 | 35 | |
| Multi GPU | g6e.12xlarge | 4 | 48 | 384 | 20 | 100 |
| g6e.24xlarge | 4 | 96 | 768 | 30 | 200 | |
| g6e.48xlarge | 8 | 192 | 1536 | 60 | 400 |
Figure 5: The list of g6e instance types with corresponding GPU amounts, vCPUs, network, and bandwidth data
Moreover, the g7e has the following instance size configurations:
| Instance type | NVIDIA L40S GPU count | vCPUs | Memory (GiB) | EBS Bandwidth (Gbps) | Network Bandwidth (Gbps) | |
| Single GPU | g7e.2xlarge | 1 | 8 | 64 | Up to 5 | 50 |
| g7e.4xlarge | 1 | 16 | 128 | 8 | 50 | |
| g7e.8xlarge | 1 | 32 | 256 | 16 | 100 | |
| Multi GPU | g7e.12xlarge | 2 | 48 | 512 | 25 | 400 |
| g7e.24xlarge | 4 | 96 | 1024 | 50 | 800 | |
| g7e.48xlarge | 8 | 192 | 2048 | 100 | 1600 |
Figure 6: The list of g7e instance types with corresponding GPU amounts, vCPUs, network, and bandwidth data
EC2 instances mount one (or more) Amazon Elastic Block Store (Amazon EBS) volumes for durable, block-level storage. These can be detached from the instance and retained independently from the lifecycle of that instance, allowing modifications of the instance itself (such as changing the size and type) without the loss of storage.
Ephemeral NVMe storage on each instance is also provided by Instance Stores, aligned for temporary scratch data that benefits from performant local I/O access, which can be used by 2D/3D applications (for example Foundry Nuke’s cache directory). In the follow-up posts we discuss setting up and configuring these instance stores to maximize efficiency. The 6th and 7th generation EC2 instances automatically have instance stores allocated, dependent on their sizes, as shown in the following figure:
| Instance Type | Instance store volumes |
| g6f.large, g6f.xlarge | 1 x 100GB |
| g6f.2xlarge | 1 x 200 GB |
| g6.xlarge, g6e.xlarge | 1 x 250 GB |
| g6.2xlarge, g6e.2xlarge, g6f.4xlarge, gr6f.4xlarge | 1 x 450 GB |
| g6.4xlarge, g6e.4xlarge, gr6.4xlarge, g7.2xlarge, g7.4xlarge | 1 x 600 GB |
| g6.8xlarge, g6e.8xlarge, gr6.8xlarge | 2 x 450 GB |
| g6.12xlarge, g6e.12xlarge | 4 x 940 GB |
| g6.16xlarge, g6e.16xlarge | 2 x 940 GB |
| g6.24xlarge, g6e.24xlarge | 4 x 940 GB |
| g6.48xlarge, g6e.48xlarge | 8 x 940 GB |
| g7.8xlarge | 1 x 950 GB |
| g7.12xlarge, g7e.2xlarge, g7e.4xlarge, g7e.8xlarge | 1 x 1.9 TB |
| g7.24xlarge, g7e.12xlarge | 1 x 3.8 TB |
| g7.48xlarge, g7.metal*, g7e.24xlarge | 2 x 3.8 TB |
| g7e.48xlarge | 4 x 3.8 TB |
Figure 7: The configuration of instance stores on the 6th and 7th generation EC2 instances
The 6th and 7th generation G instances represent our latest offering in GPU-powered workstations capable servers, but we still offer previous generations, notably the g5 and g4dn, giving many choices in machine types to match performance and cost needs.
You can find specifications of all our instances types, on our Amazon EC2 webpage (G instances are classed as Accelerated Computing types).
Desktop streaming with Amazon DCV
Typically, cost-effective Mini PCs or laptops are used to connect to the Amazon EC2 workstation through a desktop streaming protocol. AWS offers a high-end desktop experience through Amazon DCV. This is a performant remote display protocol capable of streaming 4k UHD resolution images over multiple monitors (up to 4), 60 frames per second, QUIC UDP support for high performance image streaming, 4:4:4 8-bit chroma sub-sampling, and stylus/touch device support for M&E workloads. Our posts show how to set up both the server and client for Amazon DCV on Windows and Linux.
The recent addition of Wacom Bridge with Amazon DCV has optimized stylus operations further (on Windows at the time of writing, Linux in beta currently). This is both in terms of real-time user feedback on the local device, mitigating the effect of any potential latency delay, but also dedicated channel support for hardware communications to provide even lower latency performance, as well as the synchronization of settings.
Workstation connectivity
When establishing connectivity between your on-premises workstation and your EC2 instance, you have three primary options, each offering different levels of security, performance, and complexity.
Internet connectivity (used in this post)
For this post, we use the most basic connection method: direct internet connectivity. This approach connects your local workstation to your Amazon EC2 instance over the public internet, with security groups (virtual firewalls) configured to restrict access to your specific IP address and only the necessary ports.
This method uses application-layer security to provide built-in encryption for all Amazon DCV streaming sessions, which helps keep your visual data protected during transmission. Security groups operate at the network and transport layers to control which IP addresses and ports can reach your instances. Together, these layers provide complementary security properties:
- Confidentiality in transit: DCV session traffic is encrypted, which helps prevent an intermediary who intercepts the traffic from reading its contents.
- Access control at the instance boundary: Security groups accept connections only from IP addresses on your approved list, reducing the instance’s exposure to unsolicited inbound connection attempts.
- Reduced attack surface: Only the specific ports required for DCV are exposed, which limits how much of the instance is reachable from the network.
This method provides a straightforward setup suitable for individual users or small teams, combining quick configuration with secure encrypted streaming. We discuss the security group configuration in detail later in this post.
The following diagram illustrates this internet-based connectivity architecture. It shows how an artist’s local workstation connects across the public internet to a GPU-backed EC2 instance in AWS, with Amazon DCV carrying the session between them.
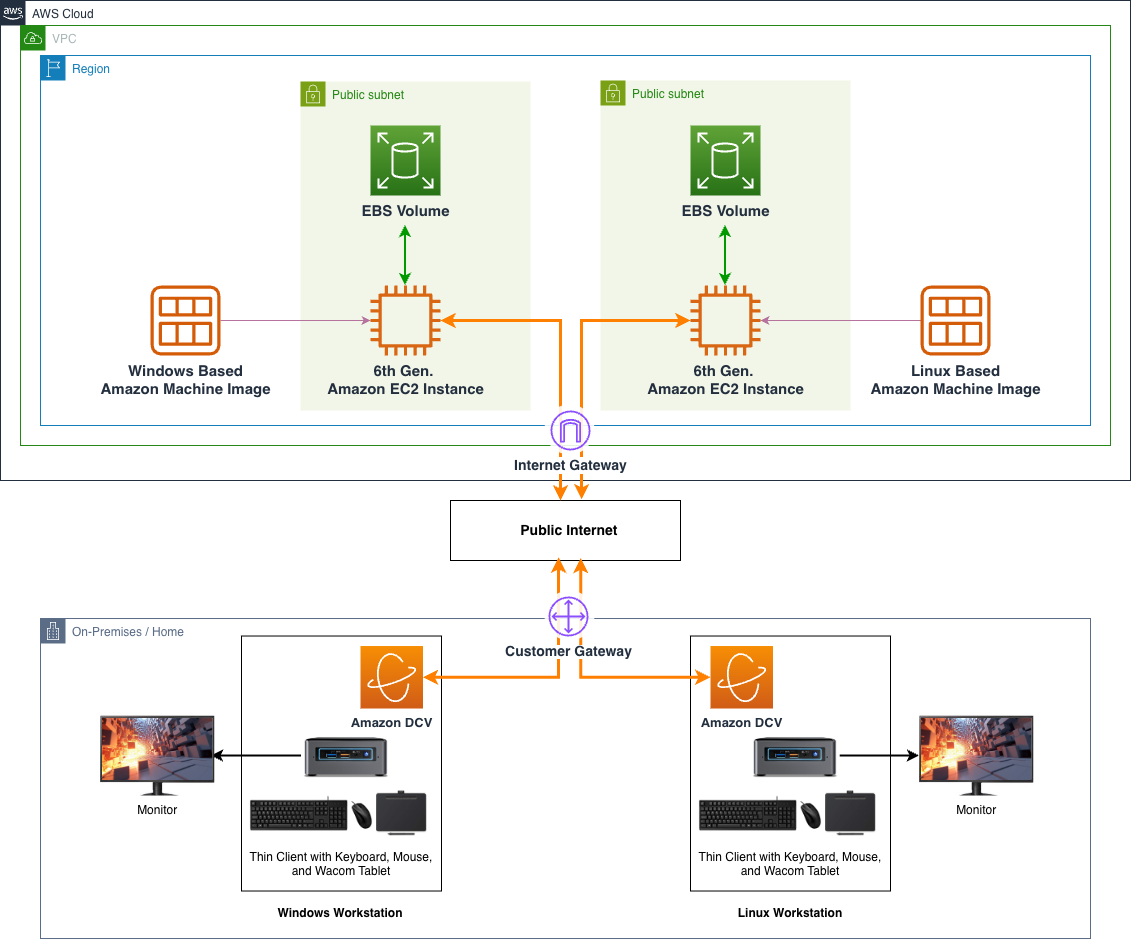
Figure 8: A streamlined architectural diagram showing on-premises and home workstations integrating with Amazon EC2 instances, using Amazon Machine Images and EBS storage, connecting through the internet
VPN connectivity
For organizations requiring additional security beyond basic internet connectivity, AWS Site-to-Site VPN provides encrypted tunnels that use the internet securely. This method creates a secure connection between your on-premises location and your AWS resources, allowing you to access EC2 workstations through encrypted channels while maintaining the high-performance capabilities needed for graphics-intensive work.
AWS Site-to-Site VPN adds network-layer encryption on top of the application-layer protection provided by Amazon DCV. The VPN establishes encrypted IPsec tunnels between your on-premises network and AWS, so traffic is protected at the network layer before it reaches the application. In practice this means your DCV session traffic travels inside an additional encrypted tunnel alongside the rest of your network connection.
Choosing Site-to-Site VPN over direct internet connectivity comes down to a few practical factors:
- Security posture: VPN extends your existing corporate network controls and policies into AWS, so the same governance you apply on-premises continues to apply to traffic reaching your instances. This is useful if your organization requires network-layer encryption or treats AWS as an extension of the internal network.
- Operational complexity: VPN requires configuring and maintaining the tunnel, a customer gateway, and routing on both sides. This is more involved than direct connectivity, which needs only a security group.
- Cost: Site-to-Site VPN carries an hourly connection charge plus data transfer.
VPN connectivity is a good fit when you need to extend your corporate network into AWS and maintain consistent security policies across both environments, and when the added setup and cost are justified by that requirement.
The following diagram shows the VPN-based connectivity architecture. The key difference from the direct-internet setup is that the EC2 instances now sit in a private subnet with no public internet access. The Site-to-Site VPN carries all traffic between your on-premises network and AWS instead.
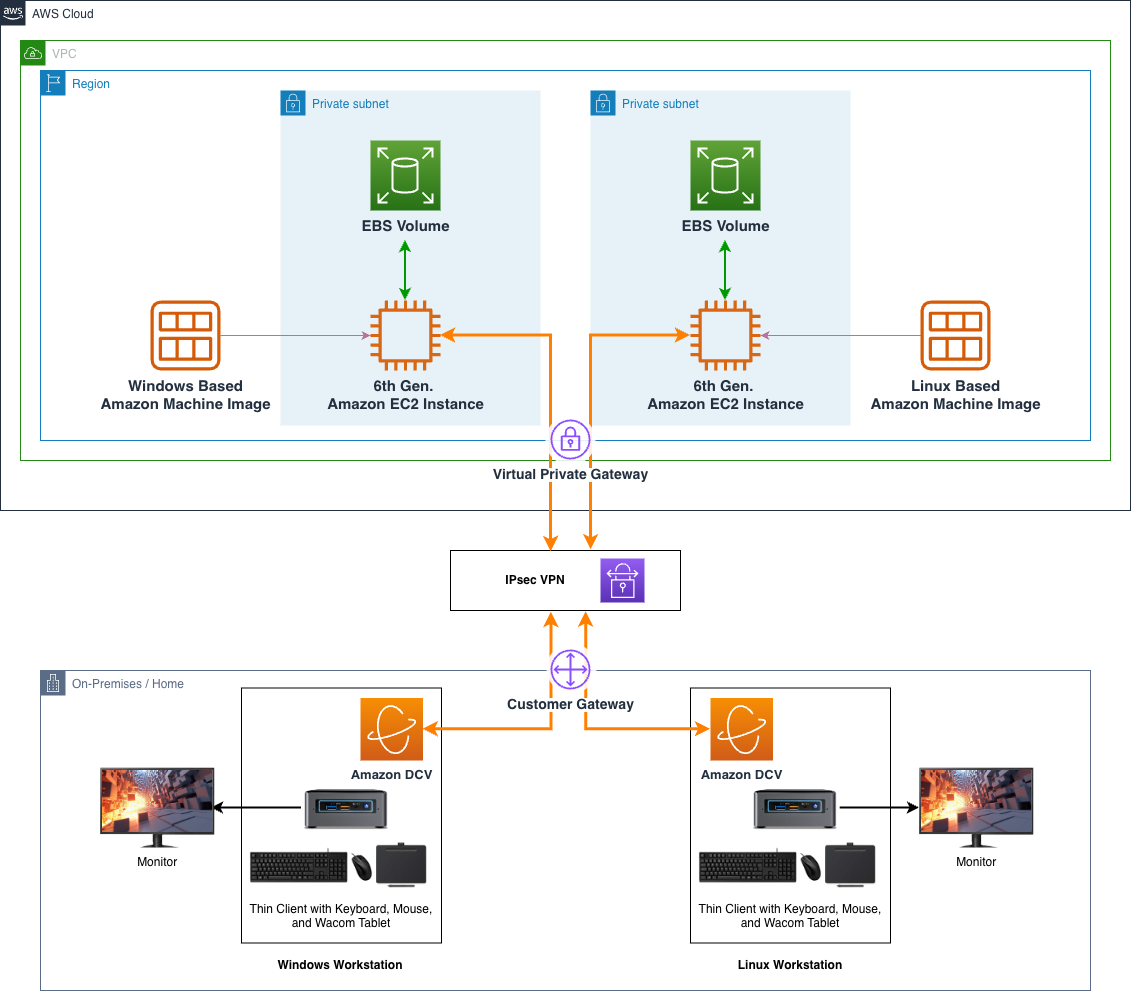
Figure 9: A streamlined architectural diagram showing on-premises and home workstations integrating with Amazon EC2 instances, using Amazon Machine Images and EBS storage, connecting through a Site-to-Site VPN
AWS Direct Connect
For workloads that need consistent network performance and a connection that doesn’t traverse the public internet, AWS Direct Connect establishes a dedicated physical connection between your on-premises location and AWS. Through your chosen network provider, it creates a private link from your premises to the AWS Region containing your Amazon EC2 G instances, which can offer more predictable latency and bandwidth than an internet-based connection.
AWS Direct Connect provides additional isolation at the physical and data link layers by using a dedicated connection that doesn’t traverse the public internet. Your traffic travels over private network infrastructure between your location and AWS, which keeps it off shared internet paths and gives you more consistent, predictable network behavior than an internet-based connection. Because the connection is private and dedicated, it isn’t exposed to the general internet in the way a public connection is.
AWS Direct Connect is ideal for organizations requiring consistent network performance, enhanced security, and reduced data transfer costs when working with graphics workstations in the cloud. Combined with the application-layer encryption of Amazon DCV, this provides defense-in-depth across the entire network stack, from the physical cables through to the application data itself. This approach provides the most predictable latency and bandwidth for demanding creative workflows.
The following diagram depicts the Direct Connect connectivity architecture. As with the VPN option, the EC2 instances sit in private subnets with no need for public internet access, but here the connection runs over a dedicated Direct Connect link between your on-premises location and AWS.
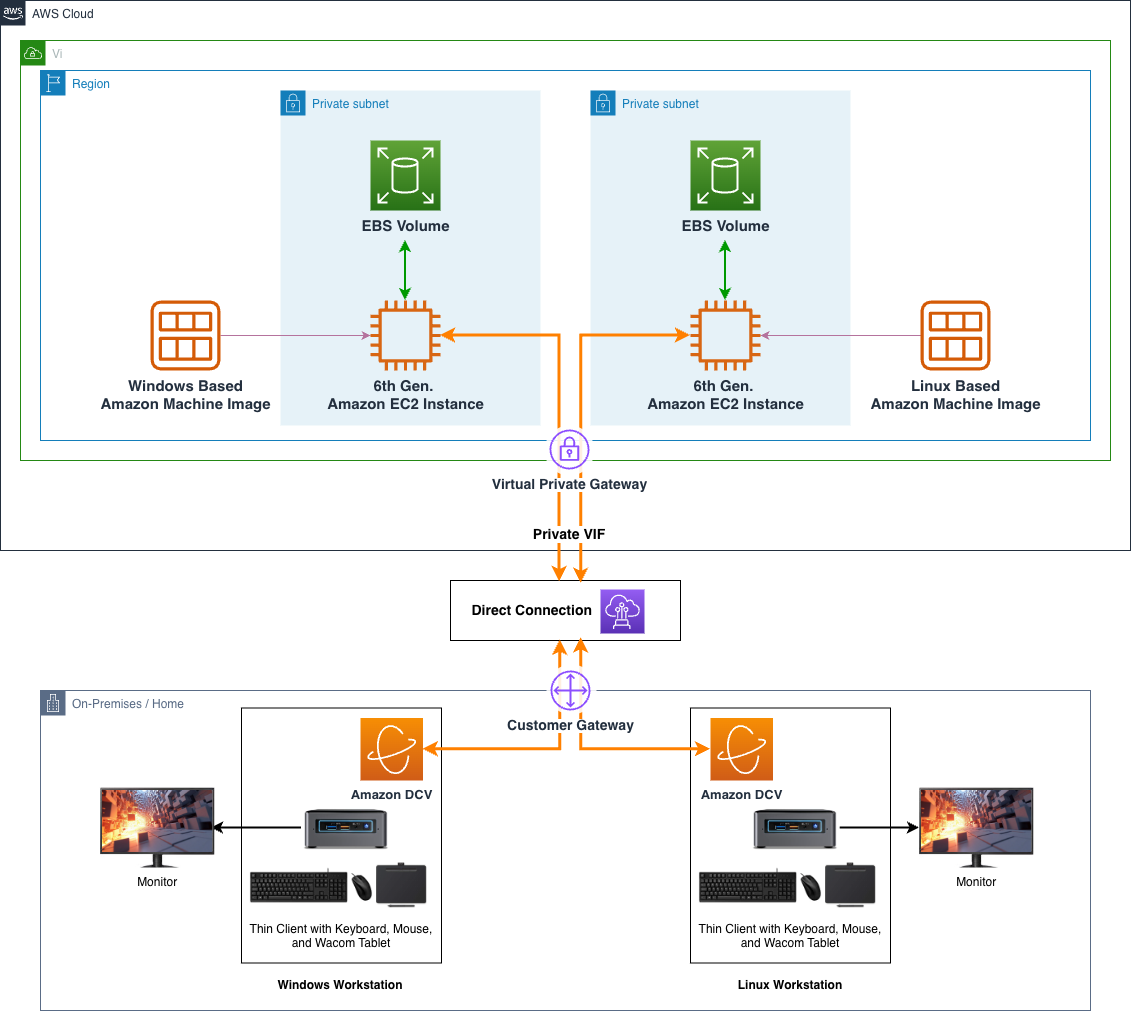
Figure 10: A streamlined architectural diagram showing on-premises and home workstations integrating with Amazon EC2 instances, using Amazon Machine Images and EBS storage, connecting through a Direct Connect link
Consult the documentation for further details and options around VPN offerings, as well as Direct Connect, to inform your security decisions. For further information, and additional firewall and protection services that can enhance protection against exploits such as ransomware and DDoS, please see Security, Identity and Compliance on AWS.
Latency
A superior virtual workstation experience relies on low-latency and high-bandwidth connectivity from your local client to your EC2 instance. Bandwidth requirements vary based on several factors such as the number of monitors, screen resolution, frame rate, and visual quality settings. For creative professionals using Wacom tablets or similar input devices, we recommend a latency round trip of 50 ms or less when using Amazon DCV. To evaluate your connection’s suitability, there are a number of third-party websites that you can use to test latency between your location and the nearest Region, such as https://aws-latency-test.com/ or https://www.cloudping.info/.
“Our collaboration with the AWS Visual Computing team and the use of EC2 instances as virtual workstations, has exceeded our expectations, delivering exceptional result.”
— John Coyne, Senior Technical Manager, Sky TV
Workstation build overview
For the purposes of this post, we focus on deploying a g6 family instance.
The following overview outlines the complete build across the whole series. Part 1 covers the prerequisites and base image selection. The remaining phases such as the instance configuration, creating Amazon Machine Images, and setting up launch templates are covered in later parts.
- Prerequisites.
- Account setup and GPU instance quotas.
- Security configurations (access, firewalls, permissions).
- Base image selection.
- Linux and Windows options.
- Customization for VFX needs.
- Instance configuration.
- Linux and Windows set up.
- GPU and system tools installation.
- Creating Amazon Machine Images (AMIs) to capture the resultant machine image.
- Setting up EC2 Launch Templates to encapsulate all boot requirements.
- Standardizing deployment parameters.
- Streamlining future workstation launches.
- GPU optimization tips and resources.
Cost consideration
In these posts we use different AWS services, with each service having a cost associated with its usage. EC2 instances are charged by the second, so you must make sure that you shut down or terminate the instances when you are finished to avoid unwanted costs.
Accessing AWS services through the AWS Command Line Interface
AWS has many API/SDK entry points for creating and manipulating services. In this post we use the AWS Command Line Interface (AWS CLI), a convenient utility that you can use to query and set AWS service properties through the command line. In both the Windows and Linux deployment posts we set up the CLI for later convenience.
For more information about how to configure the credentials for usage with the CLI, as well as the range of functionality that you can use with it, go to the AWS CLI User Guide.
Workstation prerequisites Part 1: account setup and service quotas
The following steps are used to set up a secure Amazon Virtual Private Cloud (Amazon VPC) network platform for your instances, providing security and permissions for accessing and configuring your instance:
- Create an AWS account.
- Open and configure the AWS Management Console to gain access to AWS.
- Go to the Console.
Setting the AWS Region
At the time of writing, AWS has 39 geographic Regions, each composed of multiple AWS Availability Zones (AZs) to make sure of service availability and durability, and over 35 AWS Local Zones (which are infrastructure deployments that place compute, storage, and other select AWS services closer to large population and industry centers). For more information, see the AWS Documentation on Global Infrastructure. As we previously mentioned, latency can be critical for optimal virtual workstation experiences. Therefore, we recommend building your workstations in a Region that offers the best latency experience. This is configured on the console itself:
- Choose your AWS Region that best suits your needs (a drop down of AWS Regions is available at the top right of the Console).
AWS services can vary across AWS Regions, so before proceeding you must confirm that g6 instances are available in your AWS Region of choice. This can be done through the Amazon EC2 service page, as shown in the following figure:
- Open the Amazon EC2 service page, the central service page for deploying EC2 instances.
- Search for “EC2” in the Service search bar (top left), or choose Services -> Compute -> EC2.
- Choose Instance Types in the left pane.
- Enter “g6” into the Instance Types search bar and confirm that the various g6 instance types are listed as available in that AWS Region. The following image shows a filtered response from the Instance Types pane.
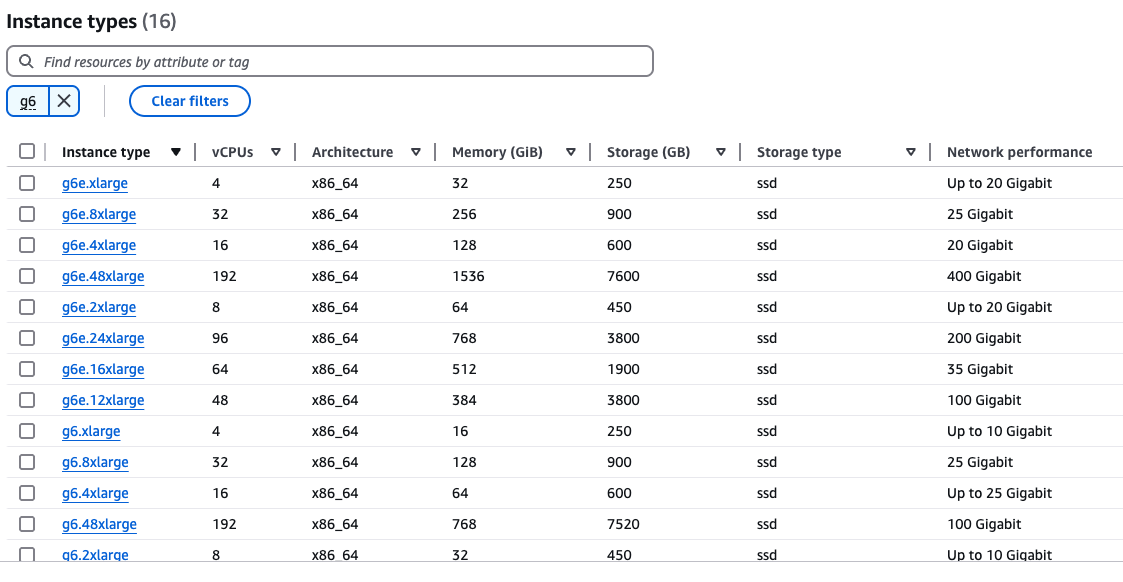
Figure 11: A screen capture of the Instance Types page, reporting g6 Amazon EC2 availability in a Region
Service limits
Limits exist around many AWS services. They act as guard rails for new users and prevent misuse of AWS services. New AWS accounts start with low limits to prevent unintentional spend, so you need to check the account limits to make sure that there is enough GPU vCPU quota to launch your workstation. You can check and request limit changes through the Service Quotas service page:
- Navigate to the Service Quotas page by searching for its name in the Services search bar (top left of the Console window). Or alternatively choose Services -> Management and Governance -> Service Quotas.
You can choose the star icon next to each service to bookmark it for access later at the top of the Console.
- Under Manage quotas (top right), enter EC2 in the search field, choose Amazon Elastic Compute Cloud (Amazon EC2), and choose View quotas.
- In the Service quotas search field that appears, enter On-Demand G and the list of quotas should reduce to just Running On-Demand G and VT instances, the quota controlling your access to G instance machines, as shown in the following figure.
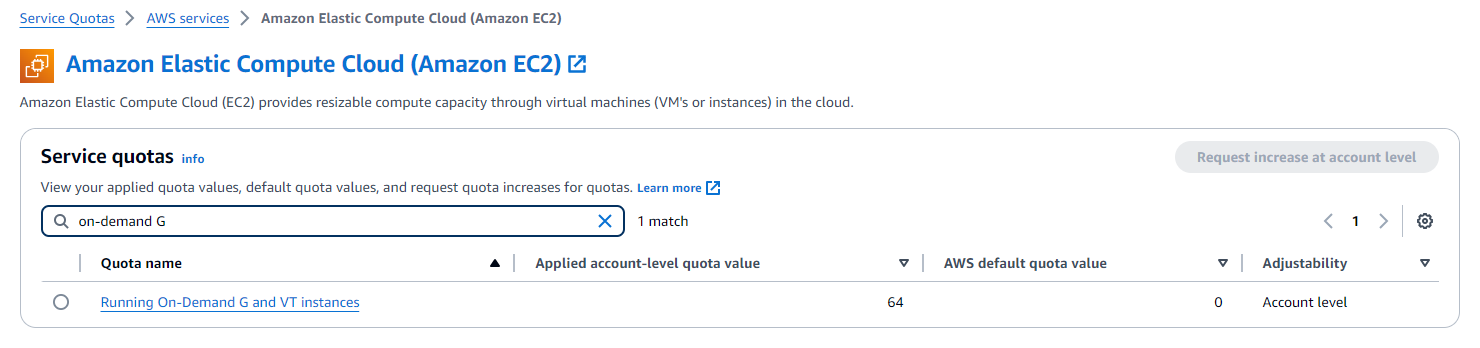
Figure 12: A screen capture of the Service Quotas page, requesting an increase to the GPU limit
You can see the current Applied account-level quota value, which is your limit on how many vCPUs you can use at any given time in this Region. This is not the number of instances (a common misconception)! We recommend making sure that you have at least a quota of 32, because this is enough to run two g6.4xlarge instances, a common size that suits basic 2D and 3D workflows. If the value in the applied account-level quota is below this, then you must submit a request to increase it:
- Choose Request Increase at account level.
- Enter “32” in the Increase quota value field.
- Choose Request.
When you receive an email confirmation of the increase, check the quota limit again for a value of 32 and you are safe to proceed with the rest of the post.
Workstation prerequisites Part 2: networking and security
When you have received your Service Quota increase, you can continue back in the AWS Management Console to start setting up some auxiliary components needed for workstations, for example security keys, firewall groups, and so on.
- Open the Amazon EC2 service page, the central service page for deploying EC2 instances.
- Search for “EC2” in the Service search bar (top left) or choose Services -> Compute -> EC2.
Amazon EC2 key pair security
Amazon EC2 key pairs are security credentials that validate your identity when accessing EC2 instances.
To set up an Amazon EC2 key pair:
- Under Network and Security on the left side of the panel, choose Key Pairs.
- Choose Create key pair in the top right.
- Give your new key pair a name, for example
ec2_test_keypair. - Leave the key pair as an RSA type, with a .pem extension, and choose Create key pair.
- Store the automatically downloaded
.pemfile in a safe place, because you need it later.
You should restrict the permissions on the .pem file so that only you can read it.
On a Mac or Linux machine you can change the permission in a terminal:
On Windows, open the context menu for the file, choose Properties, then the Security tab, choose Advanced, choose Disable inheritance, and remove access to all users except the current user. For more information surrounding the best use of key pairs, go to the relevant section in the Amazon EC2 User Guide.
Virtual firewalls
Security groups act as virtual firewalls, restricting incoming and outgoing traffic to your G instances. You should set up a security group working on the principle of least privilege, which means you must be very specific about which ports and which IP addresses can access it:
- Under Network and Security on the left pane, choose Security groups.
- Choose Create Security Group in the top left.
- Give your security group a name, for example
ec2_test_sg. - Give your security group a meaningful description, for example
SG for basic EC2 interaction. - Leave the VPC as-is. This automatically presents the ‘default’ VPC in your account and AWS Region.
- The following Inbound rules ports must be added to the security group to allow access to that machine from a specific client’s source IP address: in this case your local machine. Under Inbound rules, use the Add rule feature multiple times to add the definitions defined in the following figure, using the My IP drop-down under Source to automatically determine and use your current IP address, appending the /32 CIDR to limit the connectivity to that single address.The following table contains a list of TCP and UDP ports to add to your security group.
| Type | Protocol | Port Range | Source | Description |
| SSH | TCP | 22 | <YOUR “CUSTOM” CLIENT SOURCE IP> | SSH for Linux platform. |
| Custom TCP Rule | TCP | 443 | <YOUR “CUSTOM” CLIENT SOURCE IP> | HTTPS for both platforms. |
| Custom TCP Rule | TCP | 8443 | <YOUR “CUSTOM” CLIENT SOURCE IP> | Amazon DCV for both platforms. |
| Custom UDP Rule | UDP | 8443 | <YOUR “CUSTOM” CLIENT SOURCE IP> | Amazon DCV for both platforms. |
| RDP | TCP | 3389 | <YOUR “CUSTOM” CLIENT SOURCE IP> | RDP for Windows platform. |
Figure 13: The list of inbound ports that need to be opened to allow user access to the EC2 instance for the purpose of this post
| For the purposes of this post, we’re making a single security group that encompasses both Linux and Windows. If you’re only focusing on a specific operating system, then a security consideration would be to remove the unneeded ports. |
- For Outbound rules, the default allows all outbound traffic. This is enough for the instance to download packages and reach AWS service endpoints during setup, and because inbound access is already restricted to your IP, it doesn’t open an inbound path. Open outbound traffic is, however, the route that data exfiltration or a compromised host’s callbacks would use. Once your instance is running and you know which destinations it genuinely needs (for example, HTTPS 443 to AWS and your package repositories), restrict outbound rules to those destinations rather than leaving them fully open.
- Choose Create security group to finish making the security group.
Identity and Access Management
AWS advocates a policy of least permissions, establishing a strong base security standpoint, which necessitates that you add the permissions needed for access to services. To allow your Amazon EC2 workstation instance to access services such as Amazon Simple Storage Service (Amazon S3) (for graphics drivers), you must create a role to encompass these permissions for your instance. You should set up an AWS Identity and Access Management (IAM) profile to allow the instance access to the necessary services.
- Navigate to the IAM service page by entering “IAM” into the Service search field (top left), or choose Security, Identity & Compliance > IAM.
- Choose Roles (in the left side pane).
- Choose Create role, in the top right.
- Leave the Trusted entity type as AWS service.
You must use AWS approved NVIDIA GPU drivers, issued through Amazon S3, not only for optimal compatibility and performance, but also to make sure that the necessary professional GRID drivers are automatically provisioned. Therefore, you need a role that can read from Amazon S3. You should use a very generic Amazon S3 read-only policy to allow read access to public S3 buckets (such as the bucket on which AWS shares GPU drivers).
- Under Use case, enter “S3” and then choose Next (bottom right).
- Search for
AmazonS3ReadOnlyAccessand choose the box to the left of the policy to add it to the role. Then, choose Next. - Give your new role a name, for example
basic_workstation_role. - Choose Create role.
| If later on you want to add more service features to your workstation role (for example to enable write permissions from the workstation to one of your own storage buckets), then you can use the same process to add pre-defined permissions or create your own in JSON. |
You now have an account, and the resources needed to launch EC2 instances, which are covered in our next posts.
Conclusion
In this post we have discussed the different generation Amazon EC2 instance families: their memory, network, storage, and GPU options. We have outlined the steps needed not only to prepare an AWS account for running GPU workstations but also to build key infrastructure that is needed to deploy them.
We recommend that you continue to Part 2 of our series, Building a GPU workstation for visual effects on Amazon EC2: Part 2 – Linux, where you can learn how to create a Linux-backed workstation. You can also read Part 3 of our series, Building a GPU workstation for visual effects with Amazon EC2: Part 3 – Windows, to learn how to create a Windows-backed workstation.
For more information contact us at [email protected].
Further reading
If you want to augment a VFX workstation environment with a dedicated render farm, then consider the managed service AWS Deadline Cloud.
EC2 instance metrics, such as CPU and memory usage, are sent to Amazon CloudWatch, where you can access this data through the AWS Management Console and AWS CLI. This information can be pertinent to discern if an EC2 instance is being over or under provisioned for the work at hand. In other words, it has excessive CPU, memory, and networking resources for the current tasks, and it could be optimized for price, or the alternative where it has not been allocated enough resources to cope. For more information, go to the Amazon EC2 User Guide.
More advanced examples of using Amazon DCV can be found in this “aws-samples” GitHub repo. This includes methods to broker multiple users and instances. Furthermore, DCV Connection Gateway provides a single-entry point for users to connect to multiple DCV sessions across different instances, streamlining access management and improving security through centralized authentication.
Commercial options also exist to perform artist/instance brokering, using Amazon DCV and Amazon EC2 Launch templates. An example of such an offering is Leostream.
For reference, examples of setting up Amazon DCV capable instances, and using AWS CloudFormation templates as a method of deployment, can be found in this GitHub repo.
A greater depth of analysis of bit rates, and latency, surrounding Amazon DCV connections can be found in this AWS HPC post.
About the authors
[$] Additional hardening for the glibc dynamic linker
Post Syndicated from daroc original https://lwn.net/Articles/1105134/
The
Node.js project recently had a
security vulnerability that
affected its
Brotli decoder. The bug
was a buffer overflow,
but the particular way that official Node.js binaries are built for Linux meant that one of the
main protections against turning a buffer overflow into remote code execution,
address space layout randomization (ASLR) could not be turned on. If ASLR had been
enabled, the bug would still be exploitable in theory, but much more difficult
to exploit in practice. In response, the GNU C Library (glibc) is
considering a new set of
tunable settings to allow administrators to forbid programs that do not
support ASLR. The new settings, while a welcome hardening measure, may not
address the root problem.
Choosing QuePaxa, an unusual consensus algorithm
Post Syndicated from João Pedro Leite original https://blog.cloudflare.com/choosing-quepaxa/
Cloudflare recently announced Meerkat, an experimental distributed consensus service designed to manage our internal global control plane. It is powered by a new consensus algorithm called QuePaxa.
QuePaxa is an unusual choice; most consensus systems use well-established consensus algorithms like Raft, (Multi-)Paxos or Viewstamped Replication. These algorithms are well understood, have mature implementations, and usually work well.
Unfortunately, common consensus algorithms often suffer in wide-area networks with volatile network connectivity and latency, i.e., networks like the Internet, which is where Meerkat runs. These algorithms rely on a single leader process being available and having predictable latency. If the leader goes down, experiences higher latency than usual, or is disconnected, the entire consensus system slows down or becomes unavailable until the leader is replaced. This is unacceptable for Meerkat.
Meerkat’s global deployment environment led us to a newer consensus algorithm, QuePaxa, which promises better stability despite volatility, in large part by not relying on a leader to make progress. In this post we’ll explain why we chose QuePaxa and how the QuePaxa algorithm works.
What we’re building and why it’s unique
Meerkat is a distributed system in which replicas agree upon an ordered log of events, where each event is decided by a consensus algorithm.
Consensus algorithms allow a group of machines to agree on a single shared truth, even if some of those machines crash or disconnect. Consensus algorithms provide an important guarantee: machines never decide conflicting values. This ensures Meerkat replicas’ logs never diverge.
Meerkat uses its consensus-powered log to expose applications like a key-value store, where each entry in the log is a get or a put. Because the consensus algorithm guarantees replicas’ logs never diverge, they all construct the same key-value (KV) state. Comparable consensus-powered systems include Consul, etcd, and Apache ZooKeeper.
Unlike similar systems, however, Meerkat was designed for global scale. A Meerkat cluster may be distributed across continents and connected by links that often exhibit high and variable latency. This is an unusual setup for consensus systems, which are usually deployed in smaller, more local networks, and have strict latency requirements.
The challenges of consensus at a global scale
While all consensus algorithms ensure that replicas agree on the same value, many of them become disproportionately unavailable or slow when network conditions degrade (but machines do not crash). We have seen this happen firsthand: in 2020, the partial failure of a core Cloudflare network switch caused a consensus-powered system to degrade and the dashboard to operate 80x slower than usual, for six hours. Critically, the system lost no data. But it became unavailable for writes until the issue was resolved, which is unacceptable.
Ideally, a consensus algorithm should be able to make progress despite latency spikes and broken connections, not just replica failures. This is particularly a problem at global scale, where faults are more likely to originate in the network, and not our own servers.
Let’s examine two common traits of consensus algorithms that can lead to degradation under hostile network conditions: destructive interference and fault detection. Later, we’ll see how QuePaxa sidesteps both of these issues.
Destructive interference and leaders
Consider Paxos, the veritable grandfather of most consensus algorithms. A lot of consensus algorithms inherit the structure of Paxos – both the good and the not-so-good bits.
Leaving an egregious amount of detail out, here’s how Paxos works. There are two kinds of processes: proposers and acceptors. Abstractly, the goal of the system is for a majority of acceptors to agree on a value proposed by some proposer. There are two phases: the Prepare phase, and the Accept phase. In the Prepare phase, any proposer can send a ballot number out to a majority of acceptors. This ballot number serves as a promise – acceptors will only accept proposals with that ballot number or higher. Then, in the Accept phase, the proposer sends its proposal along with the ballot number to a majority of acceptors again. If a majority of acceptors still hold the ballot number of the proposal, the majority accepts it, and the proposer can safely decide the proposal.
Challenges arise when two or more proposers submit proposals at the same time. Specifically, another proposer can interleave its own higher ballot number in between the two phases, blocking any lower ballots. Two proposers can repeatedly block each other from progressing – effectively competing for acceptance.
When proposers compete and block each other in this way, we say that they destructively interfere. Destructive interference gets worse as more proposers propose their own ballots. The more concurrent proposers there are, the more likely it is that the system gets stuck repeatedly proposing. Even if none of the replicas have crashed or are unavailable, multiple proposers and misbehaving networks can block Paxos. Formally, we say that Paxos does not guarantee liveness (i.e., that proposals are eventually decided) without assuming that, at some point, all messages arrive within a bounded amount of time — an assumption known as partial synchrony.
To avoid multiple proposers constantly competing, most deployed consensus algorithms, like Raft, Multi-Paxos, and Viewstamped Replication, add a special leader proposer. The leader is the only replica that can make proposals. Centralizing the proposing power in one replica forces an order on concurrent requests, avoids competing proposals, and has the added benefit of getting decisions done in an optimal single network round-trip, instead of two. While the leader is healthy and the network is well-behaved, leader-based protocols are fast.
The trade-off is that the leader must remain operational and reachable. When it fails, becomes too slow, or is disconnected from the cluster, the system stalls. The only solution is for the remaining replicas to detect that the leader has failed, and elect a new one in its place.
When leader recovery is unstable
When a leader fails, the system must recover by electing a new one. Interestingly, leader recovery is often how destructive interference sneaks right back into a leader-based system.
Consider Raft. For safety reasons, Raft elects a new leader using a majority vote. A replica that suspects that the leader has failed announces itself as a candidate for leadership and requests a vote from other replicas. If more than half of the replicas agree to vote for the candidate, it becomes the new leader. If they don’t, then a new election is called, and the candidates try again.
Multiple replicas can become candidates — all they need to do is detect that the leader is down. The candidates may then all try to acquire a majority vote simultaneously. The problem is that the candidates will compete for the majority vote, which means Raft’s elections suffer from the destructive interference we just saw in Paxos: two replicas can mutually prevent each other from getting support from a majority and becoming the leader. The more elections fail, the more replicas will try to get themselves elected leader.
Even if the leader stops being faulty, elections continue to disrupt what could have been normal system functioning. This is known as a metastable failure: a failure pattern that perpetuates itself even when the initial cause of failure is removed. A two-second network outage — or a momentarily faulty network switch — can make the leader appear to be faulty and force a leader election, which can fail, and force further elections. The outage will be over in two seconds, but the election can continue for much longer as candidates continue to block each other.
Ideally, consensus algorithms wouldn’t need any recovery process, as they are complicated, prone to interference, and introduce another source of downtime.
When fault detection goes awry
The problem of destructive interference in leader elections is compounded by trigger-happy fault-detection, especially in wide-area networks. In order for leader-based consensus algorithms to choose a new leader, replicas must first detect that the leader has failed. However, if replicas detect leader-failures inaccurately, the system may spend an inordinate amount of time in recovery, not handling requests.
In a distributed system, where machines are separated over a network, fault detection will ultimately depend on expectations. A process cannot directly observe that a remote process has failed; it can only observe that an expected message has or hasn’t arrived. We need a predictable pattern of communication, such as heartbeats or acknowledgements, to tell us that a machine is healthy. If an expected message does not arrive within the expected time, we suspect a fault. The difficulty lies in managing those expectations.
In real networks, especially wide-area networks, messages don’t always arrive when predicted. There is no guaranteed upper bound on the time that it takes for messages to arrive. That’s not to say that the network is slow, or that it is unreliable — most messages arrive within the time we expect them to. Instead, sudden bursts of latency and losses in connectivity can, momentarily, and without warning, increase the time it takes for any message to traverse the network. We call such networks asynchronous.
The big issue with asynchronous networks is that if some server doesn’t reply in a given amount of time, we don’t really know if the server has failed or if the network is just slow — the two are indistinguishable over the network. Any practical fault detector has to make a guess based on how long it has been waiting compared to its expectation, and sometimes that guess will be wrong.
In leader-based algorithms, that guess is exactly what triggers leader elections. Sometimes the leader is down; sometimes its messages are late, or the connection is silently broken. The protocol cannot know which one happened before it reacts. If the guess is wrong, and a replica thinks the leader is faulty when it actually isn’t, then an election begins and the entire system must stop. Until the leader is replaced, no progress is made — and as we just saw, that can take a while.
Fault detection is fundamentally error-prone in asynchronous networks, and when the detector makes a mistake, we get downtime.
When fault detection is slow
Even when a fault detector guesses correctly, there are issues. Fault detectors react to failures by observing messages on the network, and so their response time has to scale with network latency — the detector’s timeout can’t be below the network latency. This is why Raft is commonly deployed with an election timeout of five to ten times the network round-trip time. It has to be high enough to give a chance for the leader to signal that it is alive, and avoid falsely triggering elections. The election timeout can be much lower than that, but since leader elections completely stop the system, timeouts are usually set conservatively high.
Roughly speaking, a round trip halfway across the world is measured in hundreds of milliseconds. If an election timeout is several round trips, detecting a failed coordinator can take around a second. Even when fault detection is completely accurate, it is slow, and it is slowest in high-latency global networks. Until the detector reacts, the system is down.
Why QuePaxa is the right fit
We realized that any algorithm relying on a strict leader or accurate timeouts was inevitably going to stall in a consensus system that runs over the Internet. We searched for consensus algorithms designed for asynchronous environments — protocols that didn't rely on a well-behaved network or precise timing to function. This led us to QuePaxa, published in 2023 by Tennage & Băsescu et al.
The most notable thing about QuePaxa is how it can efficiently reach consensus in a single round trip under favorable network conditions, but also gracefully degrades performance during latency spikes, connectivity issues, and server failures. QuePaxa achieves this by solving the exact problems we just discussed through three key design choices: having an optional leader, completely removing the reliance on fault detection, and designing for constructive interference between proposers.
In QuePaxa, much like in Paxos, there are two roles: proposers and recorders. Proposers submit proposals to be decided on, and recorders serve as intermediaries between proposers, recording every proposal they see.
Instead of having proposers compete to get their own proposals decided, in QuePaxa, proposers will cooperatively work towards a proposal that everyone supports. QuePaxa does this by assigning a priority to proposals, in the form of a random number. The optional leader gets an exclusive maximum priority. During execution, proposers submit their proposals to the recorders, who propagate the proposal to other active proposers. When proposers receive a proposal from a recorder with a higher priority than theirs, they adopt the new proposal as their own, i.e., begin broadcasting the higher priority proposal instead. In general, proposers in QuePaxa work together to decide on the highest priority proposal that they collectively know. This means proposers can’t lock each other out of deciding on a proposal, indefinitely.
The caveat is that it might not be possible to spread proposals around well enough to agree on a proposal, and so proposers have to try again, with each attempt constituting a round. However, as more proposers submit proposals, the more likely they are to converge on the highest priority proposal. This is what makes QuePaxa a randomized algorithm: the randomly generated priorities of non-leader proposers are likely — but not guaranteed — to lead to consensus on the highest known priority, in a round. Yet, given enough rounds, it is guaranteed that proposers agree on a proposal.
One proposer is designated the leader. The leader is the only proposer capable of deciding in a single round trip. The leader always proposes with the highest priority; if the leader knows it spread its proposal before any other proposer, then it can decide immediately. Clients aren’t forced to make requests to the leader — any proposer can propose. If the leader goes down, then clients can keep making requests to other proposers. The leader is completely optional. The leader is simply more likely to decide, than any other proposer, and do so faster, in a single round trip.
However, because the leader is the only one that can decide in a single round trip, we want to use it whenever possible. To exploit this fast path without creating a single point of failure, clients sending proposals to the system hedge their bets: they send their requests for proposals to every replica, and the non-leader replicas will wait for a small timeout, so the leader can propose and decide on its own. In our own implementation of QuePaxa, we actually deviate from the paper and have clients wait the hedge timeout instead of the replicas, to reduce the amount of messages we send over the network, but the overall result is the same.
This hedging timeout is very different from the timeouts used in Raft or Multi-Paxos. It is not fault detection, and so isn’t constrained by network latency; it is locally determined by replicas and can be as small as they want it to be. In Raft, having a five-millisecond timeout in a network with 100-millisecond latency would completely freeze the system. But in QuePaxa, a five-millisecond hedge timeout only increases the number of active proposers.
However, hedging isn’t free: the more proposers there are, the more proposals get broadcast, and the more likely it is that replicas fail to decide in a round. Instead, hedging provides a tradeoff: we can react faster to leader changes by lowering the hedge timeout, but we incur extra bandwidth costs and may take more time to decide. That’s a tradeoff we're more than willing to make.
If the QuePaxa leader goes down, we can recover as fast as we want — we’re not bound by network latency. This is how QuePaxa gets around fault detection: since anyone can propose, not just the leader, QuePaxa can proactively deal with leader failures by hedging, rather than reacting to failures.
How QuePaxa works under the hood
To understand how QuePaxa gives us all of these nice properties, let’s look at how QuePaxa actually works.
QuePaxa works in rounds made up of four phases. If a proposal hasn’t been decided on in the last phase, a new round is started, and QuePaxa starts over. At the start of each phase, proposers broadcast their currently adopted proposal to all recorders. Once a proposer receives a reply from a majority of recorders, they advance to the next phase. Here’s the general outline of the phases:
- Phase 0 (Propose and Adopt): Proposers randomly select a priority, send their proposals to recorders, and adopt the highest-priority proposal they receive from a majority of recorders. If it’s the first round and the leader knows its proposal reached a majority of recorders first, the leader decides immediately.
- Phase 1 (Spread): Proposers spread their adopted proposal to a majority of recorders.
- Phase 2 (Check and Decide): Proposers ask a majority of recorders for the highest-priority proposal seen in the previous phase. If it matches their own adopted proposal, they decide on it.
- Phase 3 (Carry Forward): Any proposer that failed to decide prepares for the next round by adopting the best proposal they see from a majority of recorders.
Let’s walk through a couple of example executions and unpack how each phase contributes to the overall behavior we want out of QuePaxa. Each execution will have two proposers (one of which is the leader) and three recorders.
The Leader Fast Path (Phase 0): The first phase does three important things: it randomizes priorities (which it must do to circumvent the FLP impossibility theorem), checks if the leader reached a majority of support first, and helps proposers converge if the leader didn't. The leader’s proposal is not randomized, and will always have the highest possible priority.
In the example above, the leader's proposal reaches a majority of recorders before anyone else, and receives replies confirming it. The leader can safely decide right away. This might seem dangerous, but it is entirely safe thanks to a property called majority intersection: any two majorities of recorders always share at least one recorder. Because the leader reached a majority, any other proposer querying a majority will inevitably encounter the leader's proposal and adopt it. Since the leader’s proposal has the highest priority, any other proposer will adopt the leader’s proposal. It is impossible to decide on any other proposal.
Concurrent Slow Path (Phases 0-3): When there are concurrent proposers, however, it is not guaranteed that the leader will immediately decide. The leader might fail to reach a majority of recorders first, or it might receive a single reply supporting another proposer. Let's look at what happens when another proposer contests the leader.
Phase 0: Pictured below, a second proposer (shown in red) reaches the second and third recorders first. The fast path is blocked. Instead of competing, proposers adopt the highest-priority proposal they receive from a majority and move to the second phase. The two proposers could both converge to the leader’s proposal in this phase. For illustrative purposes, our example will prevent convergence by delaying the leader’s messages.
Phase 1: Proposers spread the proposal they just adopted in Phase 0 to a majority of recorders. The recorders keep track of the highest-priority proposal they observe. It is a simple but critical step: it prevents the protocol from later deciding on a lower-priority proposal. This is once again thanks to majority intersection: any majority queried in the following phase must include at least one recorder that saw the adopted proposal, in this phase. For illustrative purposes, we prevent convergence in this phase by delaying the leader’s message to the third recorder, so the recorder does not adopt the leader’s proposal.
Phase 2: Now, a decision can happen. Each proposer determines if a higher-priority proposal gained enough support to overtake its own by asking a majority of recorders for the highest-priority proposal observed during Phase 1. If the highest proposal returned is still their adopted proposal, they decide. In our diagram, the leader sees its own proposal returned by a majority and safely decides. The other proposer receives conflicting summaries, so it cannot decide yet. Like in Phase 1, recorders keep track of the highest priority proposal they received.
Phase 3: If a proposer doesn’t decide in Phase 2, it moves to the final cleanup phase to prepare for the next round. Proposers spread their proposals again and adopt the best they find among a majority of recorders. Here, the remaining proposer discovers the decided proposal and adopts it, heading into the next round.
This is deliberate — if there was some decision in the previous phase, then a majority of the recorders will have that proposal, and any remaining proposers are guaranteed to adopt it. We see here another instance of cooperation between proposers — even when a round fails, proposers try to converge on the same proposal heading into the next round.
Moving to the next round: After the fourth phase, proposers move on to the next round. At this point, there is no more leader fast path, and the only way to decide is by converging in the third phase. Importantly, due to proposal adoption, it becomes exponentially easier to decide as rounds progress. The QuePaxa paper predicts that each round has a 50% chance of deciding, but in practice, that probability is much higher, thanks to convergence.
Putting all four phases together, we can see where QuePaxa gets its resilience. The first phase gives the leader its one-round-trip fast path. If that fast path fails, random priorities and proposal adoption help proposers converge instead of compete. The second and third phases make it safe to decide, thanks to majority intersection, while the fourth carries what proposers learned into the next round, in case proposers don’t decide.
No proposer has to detect that the leader has failed before making progress, and a failed round doesn’t throw away the work already done. When the network behaves, QuePaxa is fast. When it doesn’t, QuePaxa keeps moving.
How QuePaxa makes Meerkat possible
In our own evaluations of Meerkat, where we had servers spanning nearly all continents, we’ve directly experienced the impact that QuePaxa has on the overall performance and availability of the system. Meerkat continuously processes requests, even when the leader crashes, disconnects, or just becomes slow. At no point have we ever seen it completely stall. This is exactly what we wanted.
The rate at which Meerkat handles requests has also been generally predictable. Most decisions — upwards of 95% — are made by the leader in the first phase, which keeps our throughput fairly stable. In the instances where a decision isn't reached in the first phase, the throughput drops momentarily, down to at most a third of the usual rate, signaling that three round trips — so three phases — were needed to decide instead of just one. The system slows down, but does not grind to a halt.
QuePaxa also allows us to confidently switch out which replica acts as leader while the cluster is running. Since the leader isn’t the exclusive driver behind decisions and proposers are cooperative, a temporarily non-optimal leader isn’t as limiting as in other algorithms, where a leader misconfiguration could stall the system completely. We can dynamically tune which proposer is the leader without worrying too much about impacting the stability of a Meerkat cluster.
What we’ll be showing next
Designing Meerkat for a global network forced us to re-evaluate how we approach distributed consensus. Instead of sticking to familiar defaults that didn't quite fit our constraints, we looked to the decades of research produced by academia and industry. That search led us to QuePaxa.
Choosing QuePaxa meant choosing a less-traveled path. It has not been battle-tested as extensively as Raft or Paxos, and we’re also extending the original crash-stop design to support crash recovery. This demands careful engineering and stronger evidence of correctness than usual systems.
That is why we are formally verifying our QuePaxa implementation and Meerkat as a whole, alongside extensive simulation and fault-injection testing. Future posts in this series will explain how we verify Meerkat and QuePaxa’s Rust implementation, how we test failures that are difficult to reproduce in production, benchmarks, and what we have learned while turning an academic protocol into a production system.
Stay on the lookout for further Meerkat updates on the Cloudflare Blog, and if you want to learn more about research at Cloudflare, have a look at our work at Cloudflare Research.
Security updates for Wednesday
Post Syndicated from jzb original https://lwn.net/Articles/1106876/
Security updates have been issued by AlmaLinux (edk2), Debian (openexr, rsyslog, and srt), Fedora (alertmanager, dotnet11.0, gdal, mstflint, nextcloud, python-crate-ingredients, rust-ingredients, rust-pore, rust-pulldown-cmark, rust-rbw, rust-sequoia-sq, rust-siguldry-fedora-autopen, tigervnc, unbound, and zchunk), Gentoo (Brotli, git, and libde265), Mageia (mopidy, python-dulwich, rust-similar3, rclone, and sofia-sip), Oracle (dpdk, edk2, firefox, glibc, kernel, kernel-uek, nodejs-nodemon, nodejs22, nodejs:24, patch, ruby, ruby4.0, squid:4, and thunderbird), Red Hat (.NET 10.0, .NET 11.0, .NET 8.0, .NET 9.0, bind, bind9.16, bind9.18, buildah, c-ares, containernetworking-plugins, delve, flatpak-builder, gcc, gcc-toolset-15-gcc, gcc-toolset-16-gcc, go-fdo-client, go-fdo-server, golang-github-openprinting-ipp-usb, grafana, grafana-pcp, gstreamer1-plugins-bad-free, gstreamer1-plugins-good, gvfs, gvisor-tap-vsock, nginx, nginx:1.24, nginx:1.26, oci-delta, podman, python-oauthlib, python3, python3.12, python3.9, qt5-qtbase, qt6-qtbase, rhc, runc, skopeo, squid, squid:4, tesseract, util-linux, xdg-dbus-proxy, and yggdrasil), Slackware (xorg-server), SUSE (aliyun-cli, amazon-cloudwatch-agent, ansible-core, aspell, azure-storage-azcopy, bind, cups, dlib-devel, docker, dolphin, dpdk, evolution, firefox, flannel, fuse-overlayfs, gnome-podcasts, google-cloud-sap-agent, GraphicsMagick, graphicsmagick, haproxy, istioctl, kernel, kubevirt, kured, libvips-devel, libXi, mozilla-nss, nvidia-open-driver-G06-signed-check, okteto, openssl-1_1, pcre2, poppler, poppler-qt, poppler-qt5, poppler, poppler-qt5, proftpd, psqlodbc, python-graphql-core, python-M2Crypto, python-pillow, python-soupsieve, python-urllib3_1, python313-wyoming, qt6-coap, rust-keylime, sbc, scribus, SDL2_image, tar, terraform-provider-susepubliccloud, the linux kernel (live patch 18 for suse linux, vsftpd, xen, xorg-x11-server, and zchunk), and Ubuntu (ca-certificates-java, gst-plugins-good1.0, gst-plugins-base1.0, hplip, linux-azure-fde, linux-nvidia, linux-nvidia-7.0, linux-nvidia-bos, linux-nvidia-lowlatency, python-tornado, rust-coreutils, and unbound).
Fallujah: November 11, 2004
Post Syndicated from The History Guy: History Deserves to Be Remembered original https://www.youtube.com/watch?v=lRI0JtzAQdg
Three People Arrested for AI-Enhanced Impersonation Fraud
Post Syndicated from Bruce Schneier original https://www.schneier.com/blog/archives/2026/11/three-people-arrested-for-ai-enhanced-impersonation-fraud.html
It’s hard to believe how lucrative this crime can be:
According to a press release from the United States attorney’s office for the southern district of New York, three men Jacob Soall, Sharon Hazan, and Guy Sheetrit were arrested for using AI to alter and impersonate the voices and images of executives and attorneys at various companies in order to convince employees to send over large payments. Soall and Hazan were arrested in Spain over the summer, while Sheetrit was arrested in the United Kingdom in September. The alleged fraud took place between 2024 and 2026.
With the help of AI, the men allegedly acted as a corporate executive, targeting employees of various companies and telling them they needed their help with sensitive financial transactions. They would then instruct the employees to get in touch with lawyers at a large international law firm. The men would then impersonate a lawyer at these firms and have the employees wire a large amount of money.
The men ultimately stole more than $129m from companies all over the world including in the US, according to the DoJ.
Always remember that there are three parts of AI security: security of AI, security with AI, and security from AI. This is the third.
По бухалките ще ги познаете. Как Радев копира санкциите на Орбан
Post Syndicated from Емилия Милчева original https://www.toest.bg/po-buhalkite-shte-gi-poznaete-kak-radev-kopira-sanktsiite-na-orban/

Когато една власт не може да се справи с криза, започва да търси виновници за нея – външни или вътрешни врагове, върху които да прехвърли общественото недоволство и собствената си отговорност. В България такава криза е стремглавото повишение на инфлацията до 6,1% на годишна база за октомври, което ни отрежда второ място в еврозоната по този показател.
След месеци на провалени опити да овладеят поскъпването – чрез „Кошница с грижа“ например, правителството на Румен Радев намери „виновниците“ – големите търговски вериги, всички те чуждестранни инвеститори от държави членки на Европейския съюз.
Удобна мишена са – бизнесът им е на светло, оборотите им са огромни. Всяка касова бележка напомня колко са поскъпнали храните, а гневът на българите се пренася лесно от тях към виновното за всичко евро, а значи и ЕС, а значи и всичко европейско.
(Разбира се, мамицата ѝ и на демокрацията, защото, нали, „една кифла беше шест стотинки при социализма“, когато през 70-те заплатите едва стигаха сто лева!)
Така вместо отговор на въпроса защо държавата не се справя, чрез глобата, която Комисията за защита на конкуренцията (КЗК) наложи на „Кауфланд България“ (за общо 75 653 706 евро), на обществото беше посочен „виновникът“.
Тази политическа технология не е българско изобретение.
Сваленият от власт преди седем месеца Виктор Орбан я прилагаше години наред в Унгария, където чуждестранните търговски вериги се превърнаха в мишена на специални данъци, ценови ограничения и административни санкции. В името на „защитата на потребителите“ унгарската държава започна да определя не само колко да струват стоките, но и в какви количества да се продават, какви отстъпки да предлагат магазините и какви наличности да поддържат. През 2024 и 2026 г. Съдът на ЕС обяви част от тези ограничения за противоречащи на европейското право, а Европейската комисия започна отделни дела срещу Унгария за специалния данък върху оборота и за ограниченията на търговските надценки.
След призивите за бойкот на веригите от началото на годината, ударните проверки на магазинната и складовата им мрежа от КЗК и Комисията за защита на потребителите (КЗП) България поема по същия път.
Какво прави българската „бухалка“?
КЗК наложи безпрецедентната по размера си глоба за търговска верига не заради цените, които плащат потребителите, а заради отношенията на компанията с нейните доставчици. Комисията твърди, че през 2026 г. германската верига е извършила три нарушения на забраната за нелоялни търговски практики спрямо български производители на хранителни продукти.
Според регулатора „Кауфланд“ е използвал по-силната си позиция при преговорите с производители, за да изисква намаляване на доставните цени. За това нарушение е наложена санкция от близо 21,9 млн. евро.
Втората глоба, почти 31,9 млн. евро, е за недобросъвестно приспадане от доставните цени на възнаграждения за услуги, предоставяни от веригата.
Третата, отново близо 21,9 млн. евро, е за създаване на необосновани пречки пред доставчиците, които са поискали увеличение на цените, включително чрез забавяне и удължаване на преговорите. Всяка от санкциите е изчислена като процент от общия оборот на веригата за 2025 г., а не от печалбата ѝ.
Как точно глоба от близо 76 млн. евро, наложена на търговска верига за отношенията с нейните доставчици, ще намали цените за потребителите?
„Кауфланд“ отхвърли обвиненията. В публична позиция компанията обяви, че ще защити правата си пред компетентните български и европейски институции и ще преразгледа плановете си за инвестиции в страната ни за 200 млн. евро в следващите три години. Компанията определи размера на глобата като необоснован и несъразмерен спрямо европейската практика. Решението на КЗК подлежи на обжалване пред Административен съд – София-област в 14-дневен срок.
Защитата на доставчиците от нелоялни практики е цел, залегнала и в европейското законодателство. Известно е, че големите търговски вериги действително разполагат със значителна сила при преговорите с малките производители. Но въпросът е дали конкретните нарушения са доказани, дали размерът на санкциите е адекватен и прилага ли регулаторът еднакви критерии към всички участници на пазара.
Битката срещу „чужденците“
В Унгария на Виктор Орбан конфликтът между правителството и големите чуждестранни търговски вериги има дълга история. След завръщането на Орбан на власт през 2010 г. правителството постепенно въвежда различни форми на специално облагане и административни ограничения за големите търговци. Аргументите се променят според икономическата ситуация – защита на местния бизнес, справедливо разпределение на тежестите, овладяване на инфлацията, подкрепа за домакинствата.
Особено показателен е специалният данък върху оборота на търговските вериги, въведен в сегашния си вид през 2020 г. За разлика от корпоративния данък върху печалбата, той се начислява върху приходите от продажби. Това е от съществено значение за бизнес като търговията с хранителни продукти, където оборотите са огромни, а нетните маржове на печалба – сравнително ниски. През 2024 г. най-високата ставка достига 4,5% от оборота. Австрийската SPAR твърди, че подобна тежест може да принуди търговците да работят на загуба дори когато продават успешно.
На пръв поглед унгарският данък е неутрален – облага оборота, а не националността на собственика. Но в действителност не е така и обяснението се крие в организацията на търговията в страната.
Чуждестранните вериги, като SPAR, Lidl, Tesco, Aldi и Penny, обикновено оперират чрез интегрирани дружества, чиито обороти се сумират – магазините са обединени в едно дружество. За разлика от тях, много от големите унгарски търговски вериги работят на франчайзингов принцип, при който отделните магазини се управляват от самостоятелни дружества и се облагат поотделно.
Така дори при сходен общ оборот данъчната тежест може да бъде значително по-висока за чуждестранните вериги. Според Европейската комисия това поставя въпросните компании в неблагоприятно положение и ограничава свободата им на установяване в ЕС.
На 29 април 2026 г. Европейската комисия реши да предяви иск срещу Унгария пред Съда на ЕС заради този данъчен режим. Процедурата е започнала с официално уведомително писмо през октомври 2024 г., последвано от мотивирано становище през юни 2025 г. Будапеща не приема констатациите на Брюксел. Затова спорът преминава в съдебна фаза. Съдебно решение все още няма.
Цената на държавната намеса
Австрийската SPAR се превръща в един от най-откритите противници на унгарската политика по отношение на чуждестранните вериги. През март 2024 г. компанията подава жалба до ЕК, а австрийското правителство също поставя въпроса пред Брюксел. От компанията посочват, че унгарските мерки не само нарушават правилата на вътрешния пазар, но и поставят под съмнение възможността чуждестранните инвеститори да работят при равни условия с местните компании.
Числата, представени от компанията, са показателни – специалните данъци и задължителните ценови отстъпки са увеличили разходите ѝ с приблизително 90 млн. евро, а през 2023 г. тя е отчела загуба от близо 50 млн. евро за дейността си в Унгария.
Правителството на Орбан защитава ограниченията като мерки срещу високите цени на храните, за чието повишение правителството обвинява големите търговски компании. Унгария действително преживява тежък инфлационен шок, като през 2023 г. поскъпването на храните става сериозен обществен проблем. Но според критиците на мерките административните ограничения не премахват причините за инфлацията, а прехвърлят част от икономическата тежест върху определени предприятия.
Унгарското правителство не спира до данъците. През 2022 г. въвежда таван на цените на основни храни, а през 2023 г. преминава към система на задължителни промоции. Големите търговци биват задължени да предлагат продукти от определени категории с намаления, които впоследствие е заложено да са поне 15% спрямо най-ниската цена за конкретната стока през предходните 30 дни. Към това се добавя и задължението за поддържане на определени наличности.
Точно този режим доведе до делото на Penny Market, собственост на германската REWE Group. През март 2024 г. унгарските власти глобяват компанията, след като при проверка установяват, че в конкретен магазин липсват два продукта от задължителните промоционални категории – ябълки и минерални води или безалкохолни напитки.
Penny оспорва санкцията, като посочва забавена доставка и наличието на заместващ продукт. Унгарският съд отправя преюдициално запитване¹ до Съда на ЕС за съвместимостта на режима с европейското право.
На 18 юни 2026 г. Съдът на ЕС постановява, че унгарските правила за задължителните намаления противоречат на европейското право. Според Съда те ограничават свободата на търговците да определят цените и количествата въз основа на икономически съображения, без да е представена достатъчна обосновка за това ограничение.
Решението е важно, защото показва докъде е допустима държавната намеса.
В съдебното производство се появява и друг съществен детайл. Според изложените пред Съда на ЕС данни всички търговци с чуждестранна собственост са попадали в обхвата на оспорваните изисквания, докато унгарските компании с оборот под определения праг са били изключени.
И Lidl печели дела срещу унгарската КЗК
В България Kaufland тепърва започва съдебната битка. Lidl, която принадлежи към същата група Schwarz като Kaufland, води съдебни спорове с унгарския орган за защита на конкуренцията Gazdasági Versenyhivatal (GVH).
За разлика от делата на SPAR и Penny, които са свързани с правителственото регулиране на цените, тук става дума за решения на самия антимонополен регулатор. През 2026 г. унгарските съдилища постановяват две решения, благоприятни за Lidl, макар и с различен обхват.
На 17 февруари 2026 г. Върховният съд на Унгария (Kúria) отменя решение на GVH по дело VJ-19/2023 и разпорежда на регулатора да проведе ново производство. Съдът променя предходното решение на първоинстанционния съд и задължава антимонополния орган да плати на Lidl 1,5 млн. форинта съдебни разноски (близо 4132 евро).
Решението не подлежи на ново обжалване. То показва, че съдебният контрол върху действията на регулатора може да доведе не само до намаляване на санкция, но и до цялостна отмяна на административния акт. Веднага след това обаче унгарският регулатор започва ново производство срещу Lidl…
В друго дело – VJ-1/2024, Столичният съд на Будапеща отменя частта от решение на GVH, в която Lidl е санкционирана със 186 млн. форинта (512 346,30 евро). Съдът връща тази част от преписката за ново разглеждане, но отхвърля останалите искания на компанията. Следователно не става дума за пълно оправдаване на търговската верига, а за съдебна отмяна на конкретната имуществена санкция. Решението е публикувано на сайта на унгарския регулатор на 4 ноември 2026 г., само дни преди българската КЗК да обяви глобата срещу Kaufland.
Сравнението е показателно и заради разликата в мащаба.
В унгарския случай оспорената санкция е половин милион евро, докато в България КЗК налага на Kaufland общо близо 76 млн. евро. Макар размерите да не могат да се сравняват механично, тъй като нарушенията, законовите основания и методиките за определяне на санкциите са различни, въпросът е един и същ: какви са гаранциите, че регулаторът не е бухалка на властта?
Съдебните спорове на Lidl в Унгария обаче не се изчерпват с решенията на антимонополния регулатор. На 14 януари 2026 г. до Съда на ЕС е отправено преюдициално запитване по дело Lidl Magyarország, C-10/26, свързано с наложена на компанията санкция. Унгарските власти са задължили търговците да продават определени хранителни продукти при регулирани цени и да поддържат количества, съответстващи на среднодневните продажби през референтната година.
Мерките са мотивирани с необходимостта да бъдат защитени унгарските семейства от поскъпването заради войната в Украйна. Съдът в Сегед пита дали подобна намеса е съвместима с европейското право и дали при незаконосъобразно наложена глоба държавата дължи и лихви върху възстановената сума. Делото все още е висящо.
Брюксел срещу унгарските ограничения
През 2026 г. Европейската комисия предприе още една стъпка срещу унгарската политика в търговията. На 8 юли тя реши да сезира Съда на ЕС по две отделни процедури заради ограничения върху надценките: едната – за хранителните магазини, другата – за търговците на нехранителни стоки, включително дрогериите. Според Комисията ограниченията засягат предимно чуждестранни компании, а допустимите надценки са толкова ниски, че не позволяват на търговците да покриват разходите си.
Брюксел оспорва и начина, по който унгарското правителство представя разликата между доставната и продажната цена. Според Комисията тази разлика не е равнозначна на печалба, тъй като от нея трябва да се покриват заплати, наеми, логистика, данъци и други разходи. Възможно е търговецът да има положителна надценка върху отделен продукт и въпреки това да продава на загуба, след като се отчетат всички разходи. Комисията смята, че унгарските ограничения са непропорционални и могат да нарушават свободата на установяване и правилата на Директивата за услугите.
В доклада си за Унгария от 2026 г. Европейската комисия отбелязва, че чуждестранните компании продължават да понасят непропорционална данъчна тежест въпреки известното облекчаване на специалния данък през ноември 2025 г. В доклада се разглеждат и ограниченията за откриване и преустройство на големи търговски обекти.
Според Комисията подобни мерки ограничават конкуренцията, възпират инвестициите и водят до по-високи цени в засегнатите сектори. Така политиката, която официално се представя като защита на потребителите, може да има обратен ефект в дългосрочен план.
Прилики и разлики
Независимият по закон регулатор се оказва част от обявена от правителството кампания. Девет дни преди решението на КЗК за глобата на Kaufland вицепремиерът и министър на икономиката Александър Пулев обяви по БНТ предстоящи многомилионни санкции срещу търговските вериги:
… и доколкото разбирам, в медийното пространство ще има много сериозен анонс в близката седмица от страна на КЗК, която е образувала редица производства.
Пулев уточни, че става дума за глоби, достигащи почти 10% от оборота, които ще имат „много сериозен структурен ефект и дисциплиниращ ефект върху целия пазар и веригата на стойността“.
В същото интервю Пулев коментира и предизборното обещание на „Прогресивна България“ за намаляване с 15% на цените на хранителните продукти.
На 9 ноември КЗК обяви новината за санкцията си. Ден по-късно Пулев вече говори за действията на регулаторите като за част от правителствената политика.
Ние никога не сме били в някаква битка с търговските вериги. Ние сме в битка с нелоялните търговски практики и вече виждате видими резултати от цялата тази кампания на правителството.
Пулев е категоричен и по отношение на чуждестранните инвеститори:
Няма да се огънем под силата на лобизма, работим само в интерес на българските граждани.
Председателят на КЗК Росен Карадимов твърди, че те просто спазват закона. Според него глобите са в долната част на законовия диапазон: за две от нарушенията са определени на 1,58% от оборота, а за третото – на 2,2%, при законов максимум от 10% за всяко нарушение. Той посочва като пример Полша, където санкция от 170 млн. евро срещу търговска верига впоследствие е намалена от съда на 110 млн. евро.
Карадимов отказва да коментира предупреждението на Kaufland, че може да преразгледа планираните си инвестиции в България. Според него КЗК не може да прави компромиси със закона заради нечии инвестиционни планове.
Поръчка „от най-високо място“
Докато КЗК налага многомилионни санкции, други контролни органи провеждат масирани проверки в големите търговски вериги. На 21 октомври министърът на земеделието Пламен Абровски лично присъства на проверка на Българската агенция по безопасност на храните (БАБХ), КЗП и НАП в логистичната база на германската Lidl край Равно поле. Тогава той обявява началото на проверки във всички централни складове на веригите, последвани от инспекции в магазините и на борсите. Официалната цел е да се изясни ценообразуването по цялата верига на доставки.
На 10 ноември Lidl България излезе с безпрецедентно остра позиция, в която обвини държавните институции в административен тормоз.
Според компанията само за последните две седмици на октомври в магазините ѝ са извършени 171 проверки при средно 86 месечно от началото на годината.
Към 10 ноември остават 158 отворени проверки от различни държавни органи. Особено показателен е случаят във Видин, където един магазин е проверен осем пъти за пет седмици.
На 9 ноември инспектори на БАБХ затварят временно магазина във Видин заради нарушения при съхранението на хранителни продукти и хигиената в пекарната. Според Агенцията са установени 343 кг храни, съхранявани при неправилна температура, и 270 кг мухлясало зеле. Всички 613 кг са насочени за унищожаване.
Lidl оспорва констатациите, като твърди, че компрометираните продукти са били отделени от продажба, а техническият проблем с хладилното оборудване е отстранен още по време на проверката. Магазинът възобновява работа на следващия ден в 12 часа, като пекарната остава временно затворена до излизане на лабораторните резултати.
Компанията определя затварянето на целия магазин като несъразмерна мярка и обявява, че ще потърси съдебна защита.
Още по-сериозно е твърдението ѝ, че инспектори неформално са споделяли за натиск да търсят основания за затваряне на обекти по разпореждане от по-високо ниво.
Има и още един въпрос, на който КЗК дължи отговор. На 21 май 2026 г. Комисията образува едновременно производства срещу Kaufland и „Максима България“, която управлява веригата Т-Маркет. И двете са за предполагаеми нелоялни търговски практики спрямо доставчици. На 9 ноември регулаторът обявява глоба от близо 76 млн. евро срещу Kaufland, но не съобщава за резултат по производството срещу Т-Маркет.
Медийни публикации свързват веригата с най-богатия в Северна Македония Орце Камчев, макар според фирмените данни собственик на капитала да е нидерландското дружество PARETAS B.V., а като действителен собственик да е вписан литовецът Нериус Нума. А производството срещу нея няма как да бъде обявено нито за приключило, нито за прекратено без съответен акт.
В Унгария войната срещу чуждестранните вериги не свали цените, но доведе до съдебни дела и конфликти с Брюксел. В България властта тепърва я започва, но също ще разбере, че може да глобява търговците, но не и да санкционира инфлацията.
1 Процедура, при която национален съд се обръща към Съда на ЕС, за да получи разяснение как трябва да се тълкува европейското право или дали даден акт на ЕС е валиден.
Език свещен, почти узаконен
Post Syndicated from Павлина Върбанова original https://www.toest.bg/ezik-sveshten-pochti-uzakonen/

Един законопроект за българския език, внесен от депутати от „Възраждане“, разбуни духовете миналата седмица и предизвика повече емоционални, отколкото рационални реакции. Когато става въпрос за насъщния ни език, е естествено да се чувстваме силно засегнати и да изригнем с подигравки и саркастични коментари. След като тази вълна поотмина, нека да погледнем малко по-хладнокръвно на законопроекта.
Законопроект или декларация?
Вероятно първо трябва да си зададем въпроса дали се нуждаем от закон за българския език. Как се изготвя нормативен акт за една толкова жива, многообразна и трудно контролируема материя, каквато е изобщо езикът? Вероятно точно хора, които не се занимават професионално с него, дръзват да го правят, без да си дават сметка, колко е сложно да вкараш употребата му в членове и алинеи.
Докато четях разпоредбите, не ме напускаше усещането, че авторите са сбъркали жанра и вместо закон са писали програмна декларация. Държавата „предприема всички необходими действия“, „насърчава доставчиците на медийни услуги“, „провежда целенасочена езикова политика“, „приема национални програми“, „създава необходимите условия“. Какво по-конкретно ще върши държавата обаче, така и не разбрах. Най-вече ще насърчава разни неща, включително и самия български книжовен език – поне на пет места срещнах тази дума в законопроекта и придружаващите го документи.
Всъщност има нещо по-конкретно и то е в глава четвърта, в която се регламентира създаването на „държавен стандарт за българска форма на кирилица“ и използването на български кирилски шрифтове в електронна среда. Според мен това е единственият светъл лъч в законопроекта. С разпоредбите се подкрепят дългогодишните усилия на една общност, която си поставя за цел да популяризира именно българския вариант на кирилицата. Текстовете обаче са общи и не става ясно поне кой орган ще изработи и въведе държавния стандарт.
Разбират ли вносителите езика?
Когато се съставя закон в дадена област, е нужно много добре да се познават основните понятия в нея и да се използват внимателно. Законопроектът е за българския език, но в самия текст паралелно се употребява български книжовен език и съвременен български книжовен език. Още в чл. 2 пише: „Официалният език в Република България е българският книжовен език“, което най-малкото се различава от текста на Конституцията – според нея официален е „българският език“. Какво ще стане, ако един човек, който не е достатъчно образован, напише писмо до някоя институция и в него има правописни, пунктуационни и граматични грешки, тоест не е спазил книжовноезиковите норми, не е използвал книжовния език? Той ще бъде ли санкциониран?
Неразбирането на материята, върху която се упражняват вносителите, е отбелязано и в становището на Института за български език при БАН:
Чл. 1, ал. 1, т. 2 и 3 не съответстват на същността на книжовния език като обществено явление. Езикът е естествено възникнала знакова система, която функционира в обществото. Той се развива и променя по свои закони, които могат да се анализират от специалистите, но не и да се регулират с административни мерки.
Проблемът с транслитерацията, или голямото объркване
Обществената енергия и креативност в критиката към законопроекта се изляха в постове, изображения и коментари на чл. 4, ал. 3, според който се допуска транслитерация на латиница под текст на кирилица. За да се придържаме максимално близо до законопроекта, следва да прочетем по-внимателно текста.
Транслитерация се допуска съгласно едноименния закон, а в него е указано, че правилата за транслитерация важат за „български географски имена, имена на исторически личности, културни реалии, както и термини с български произход в съответната научна област“. Тоест няма как да бъдат транслитерирани имена на институции от типа на Народно събрание и Министерство на културата, както разясни председателят на „Възраждане“ Костадин Костадинов, и те си остават в този вид – „само на български и само на кирилица“, без превод, без транслитерация. Не сме били разбрали правилно текста на разпоредбите, затова трябваше Костадинов да обяснява какво е искал да каже авторът.
А защо всички вкупом не сме разбрали? Може би е трябвало някой да се потруди върху формулировките на текстовете.
Вероятно тези алинеи ще претърпят някакви промени, защото в момента са доста неясни, а и Костадинов каза, че няма да налагат диктат, и заговори за по-дребен шрифт на текста, „когато говорим за надписи на други езици и други графични системи“.
Във вида, в който са в момента, разпоредбите нищо не уреждат, а напротив – объркват. Изглежда, сякаш са включени повече с пропагандна цел, отколкото с намерението реално да издигнат авторитета на българския език и на кирилицата. Да вземем за пример Софийски университет „Св. Климент Охридски“. Според Закона за транслитерация името на патрона може да се транслитерира, но първата част – не и следователно цялото име си остава на кирилица, така ли? Обаче пък според проекта за новия закон на табела в метрото съответната станция може да бъде обозначена и в превод на английски, защото градският транспорт се ползва от туристите, посещаващи София.
Защо изобщо са нужни подобни рестрикции в XXI век и как е възможно да се мисли по този начин – че като забраняваш превод на говорения по цялото земно кълбо английски език, създаваш благоприятни условия за утвърждаването на своя език и своята азбука? Защо се затваряме за света, който идва при нас, застава пред сградата с надпис Народно събрание и се чуди: какво ли е пък това голямо здание? Защо пречим на другите да ни разберат – кои сме, какви сме, кои са институциите в центъра на столицата и къде се помещават? Забраната на паралелни преводни надписи на английски е опит отново да се затворим в черупката си, за да се предпазим от чуждо „вредно“, разбирай западно влияние.
Още една безполезна комисия в държавата
В законопроекта се предвижда да се създаде 7-членен Консултативен съвет за българския език към Министерския съвет. Основната му дейност ще се състои в получаване, обобщаване и изготвяне на доклади, предлагане на „препоръки относно правилата за ползване на книжовния български език“, даване на становища и др. Кому е нужен подобен съвет, след като вече има Институт за български език при БАН и той е в състояние да извършва почти същата работа? Но най-вече
какъв практически резултат ще има от тези доклади, становища и препоръки, които никой не е задължен да взема предвид?
А, видяхме го този доклад, добре, има някои хубави изводи в него. Благодарим за становището, прочетохме го, но ще си караме, както си знаем.
Основателни по-подробни критики към замислената нова комисия в държавата са отправени и от ИБЕ при БАН, и от Министерството на образованието и науката. В становището по законопроекта, подписано от министъра на образованието проф. Георги Вълчев, се посочва, че уредбата на Консултативния съвет влиза в противоречие с няколко разпоредби от действащия в момента Закон за администрацията.
Направили ли са си труда авторите да съобразят законопроекта си със съществуващото законодателство? Явно не – по-важно е било да се „защити“ нашият език.
Не ме гледай какво правя, слушай ме какво ти говоря
Предполагам, че това искат да ни внушат вносителите – колко много са загрижени за българския език, за неговото опазване, обогатяване, както и за „правилата за официална употреба […] от публичните институции“, фигуриращи в чл. 1, ал. 1, т. 3 от потенциалния закон.
А дали самите вносители са спазили правилата на българския книжовен език? Не са –
откриваме 57 грешки в текста на законопроекта и на придружаващите го документи.
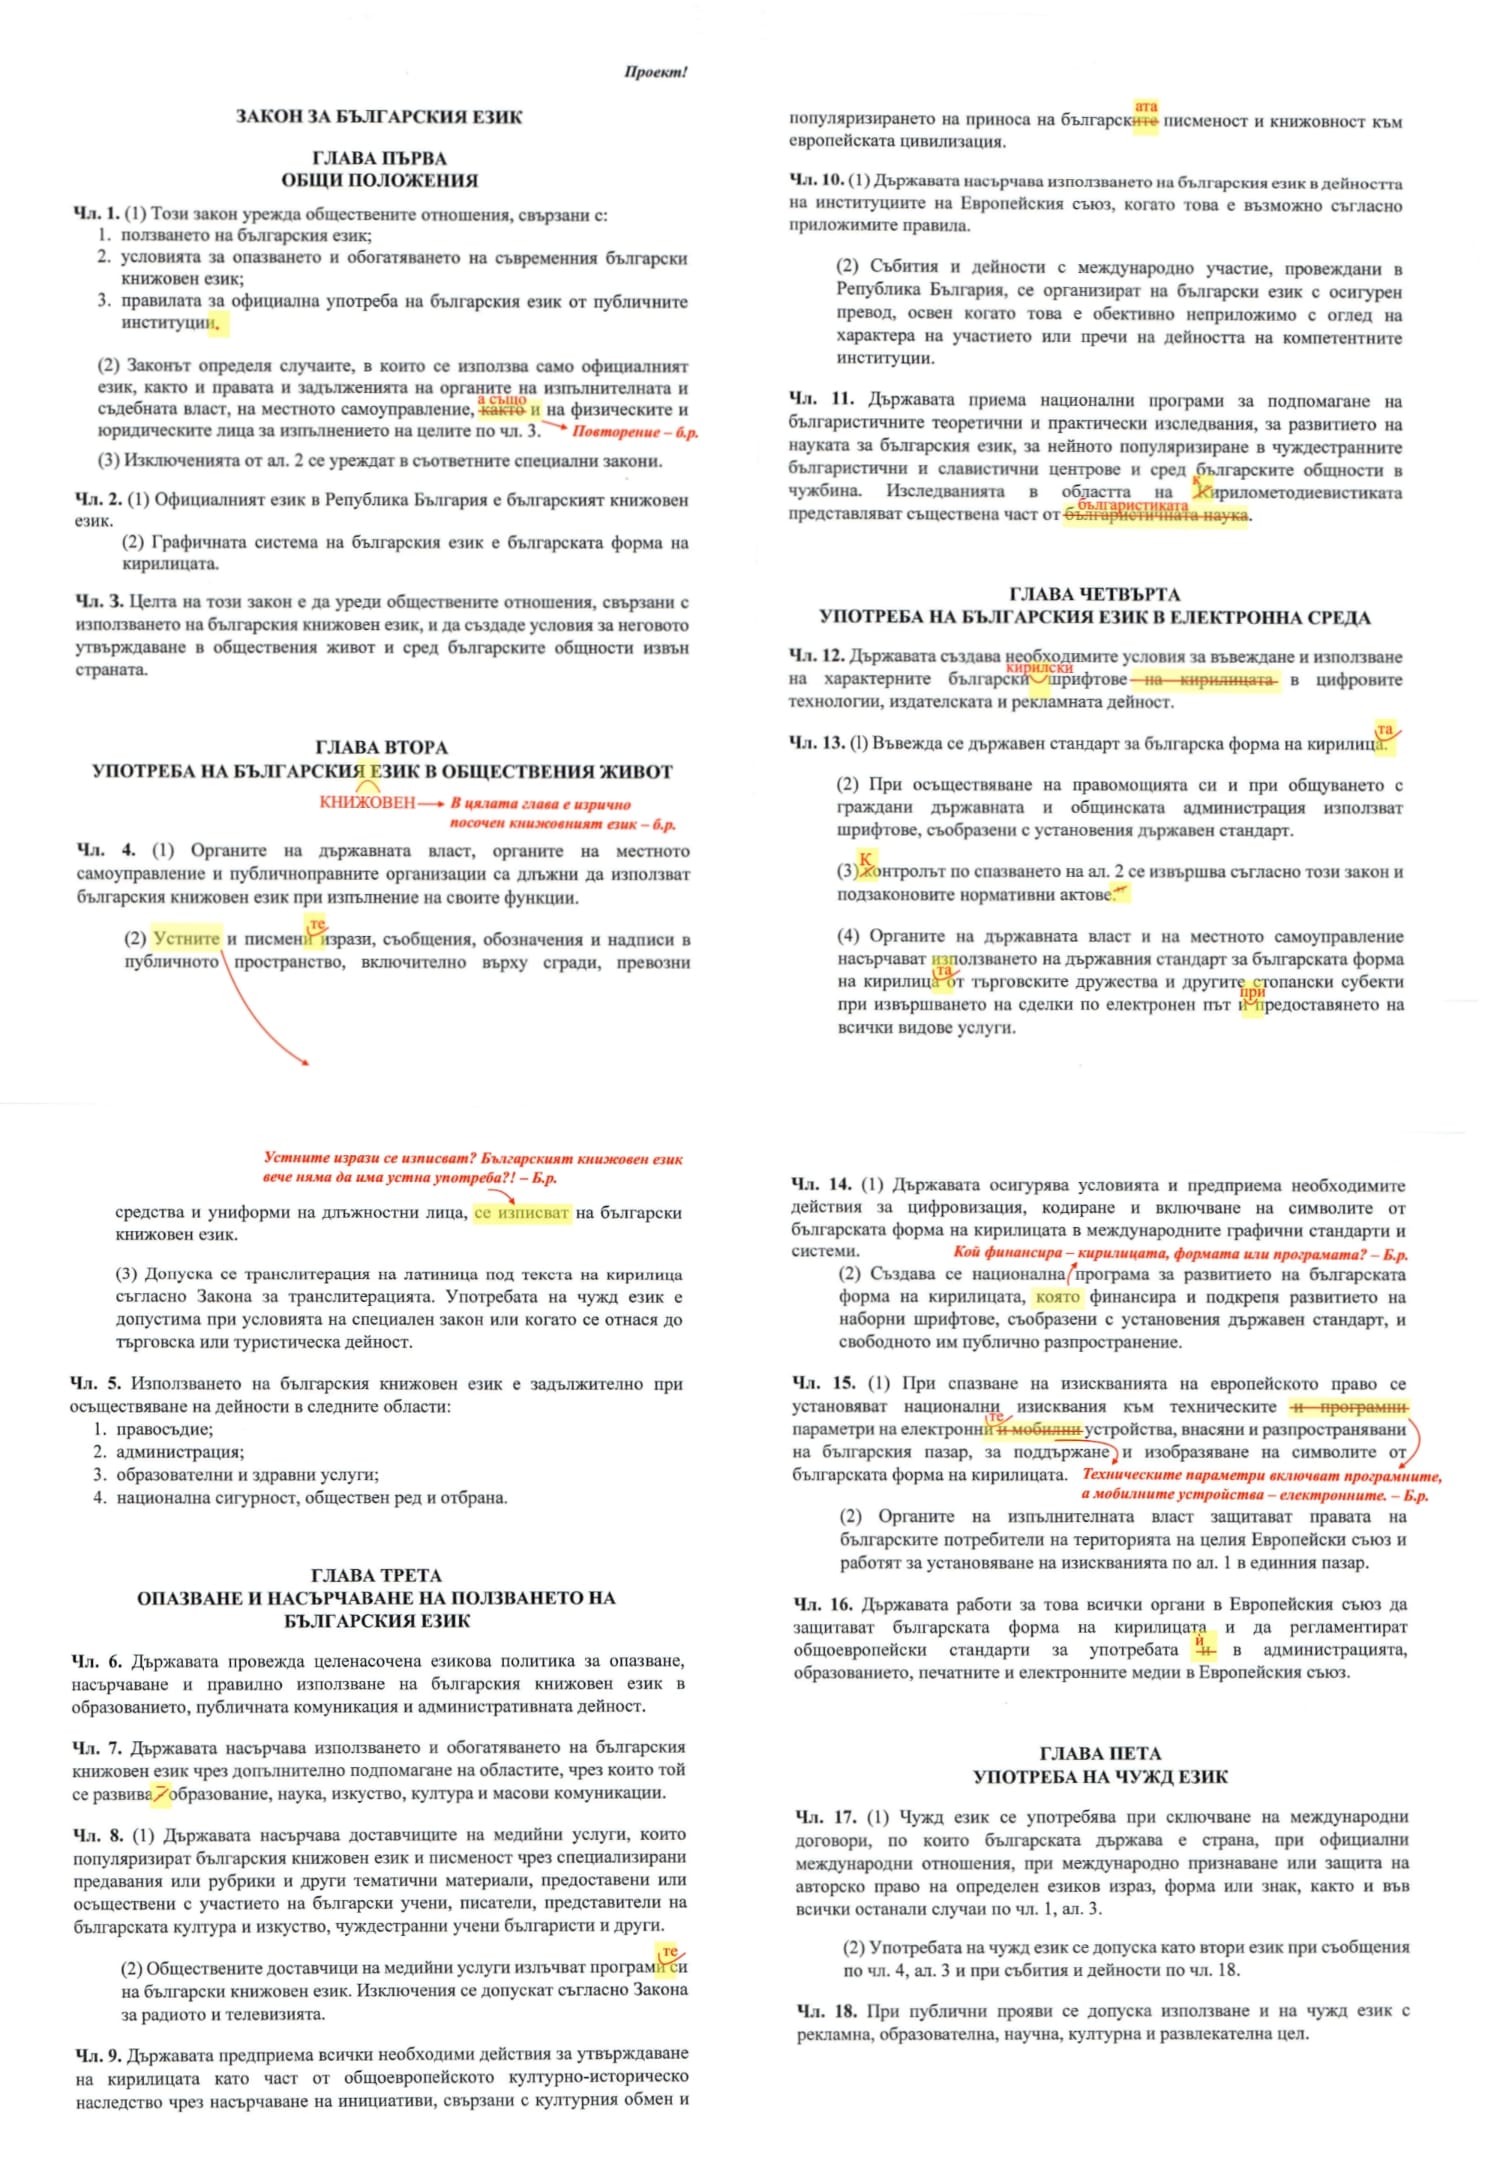
Поне основното правило за употреба на пълния член да беше уважено, но не би! Няма научаване ни от ученици, ни от депутати. И така, един урок по граматика, който е лесен и върши работа вероятно в 99% от случаите: ако членуваната дума или словосъчетанието, в което е включена, може да се замести с той, тази дума се членува с пълен член; ако не може – с кратък член. Консултативният съвет [той] избира от състава си заместник-председател. Специално в този случай употребата е типична и няма нищо сложно – подлогът (предшестван от съгласувано определение) е в началото на изречението, където обичайно си стои.
Друг тип граматична грешка е допусната при съгласуването на определения, които са определения към едно съществително, но се отнасят за различни обекти или групи от обекти: устни и писмени изрази вместо правилното устните и писмените изрази; научните и образователни среди вместо научните и образователните среди.
На някои места има излишни запетаи. В придружаващото писмо например виждаме една често срещана грешка в езиковата практика – запетая след моля, когато следва да-изречение. В случаите, в които молим някого да направи нещо или някакво действие да се осъществи, не поставяме запетая: Молим законопроектът да бъде поставен за разглеждане и гласуване…
Забелязват се и правописни грешки. Научната област кирилометодиевистика се пише с малка буква, но пък когато названието на Института за български език се свежда до една дума, главната буква се запазва – Института. Съюзът и не бива да се бърка с притежателното местоимение ѝ – употребата и в администрацията е грешно, когато става дума за употребата на кирилицата.
Няма как да подмина една лексикална грешка в самото название на документа – Законопроект на Закон за българския език. Ето ви пример за повторение. Редно е да бъде само Проект на Закон за българския език. Възможно е авторите да са се повлияли от много по-често внасяните законопроекти за изменение и допълнение на различни закони, но там употребата на думата е оправдана, защото, след като се одобри например Законопроектът [тоест проектът на закон] за изменение и допълнение на Закона за здравното осигуряване, ще бъде приет Закон за изменение и допълнение на Закона за здравното осигуряване.
Целта ми, разбира се, не е да правя пълен разбор на забелязаните грешки, а и няма особен смисъл от такава изчерпателност. По-важно е, че те показват немарливото отношение на вносителите към българския книжовен език и незачитането на неговите норми. И не, не ги обвинявам толкова в неграмотност, колкото в двойствено отношение към езика и неговите правила: загриженост на думи – пренебрежение на практика.
Както заяви проф. Владислав Миланов,
добре е хората, които пишат законите за езика, да познават първо законите на езика.
Подсказвам на вносителите какво бих направила аз на тяхно място. Първо щях да си кажа, че този законопроект, щом е за българския език, трябва да бъде изпипан до последната запетая. И ако не съм нито професионален редактор, нито коректор, щях да потърся услугите на специалисти, за да редактират и коригират текста.
Да осъзнаваш доколко си компетентен в дадена област, е важно и бих казала, задължително умение за един съвременен човек. Ако пък един депутат не го притежава, липсата може да стане опасна. Законопроектът на Закона за българския език е нагледен пример за това.
Езикът може да е вкусен и извън блюдото – онзи, българският език, на който говорим от малки и на който около 24 май се кълнем в обич. А той в същността си е средство за общуване и за да ни служи добре, непрекъснато се променя. Да го погледнем в неговата динамика и да се опитаме да разберем какво става и защо, кои са движещите механизми и как те са свързани с обществените процеси. И тъй като задачата не е лека, ще го правим постепенно – на порции.
Changed your mind? No need to start over! 🔄
Post Syndicated from Home Assistant original https://www.youtube.com/shorts/j3IMLSX-N88
What’s New in Zabbix 8.0 LTS
Post Syndicated from Arturs Lontons original https://blog.zabbix.com/whats-new-in-zabbix-8-0-lts/33755/
Zabbix 8.0 LTS might just be the largest Zabbix update yet. With a focus on application performance monitoring, new event processing workflows, scalability improvements, and MCP server for connecting Zabbix to your AI agents, Zabbix 8.0 stands out as a feature-rich and scalable solution for organizations of all types and sizes.
Application performance monitoring
Application performance monitoring (APM) has been one of our most requested features, and with the release of Zabbix 8.0 we’re ready to introduce it to our users.
Zabbix 8.0 LTS APM features enable Zabbix to collect and analyze metrics, logs, and traces collected using the OpenTelemetry protocol (OTLP). In our current implementation, OTLP data must be stored in a ClickHouse history backend, which can be configured as a Zabbix APM data source.
OpenTelemetry protocol data can be written to the ClickHouse source database either by a Zabbix proxy (which listens and collects incoming OTLP data and writes it to the ClickHouse database) or it can be sent directly to the ClickHouse database by the application itself using third-party plugins and solutions.
Telemetry query item
Existing item types have also been expanded to support OpenTelemetry data collection. The new Telemetry query item type enables the collection of specific OpenTelemetry traces, metrics, and logs. The item supports filtering based on OpenTelemetry data fields – meaning that only the matching data is picked up by the item.
In addition, the item can be configured to collect and aggregate only specific OpenTelemetry data columns, returning a JSON with the required data. The data collection buckets can also be configured with parameters such as Time shift, Lookback limit, and Granularity.
We also offer a Generic OpenTelemetry by OTLP template which can serve as a starting point for Telemetry Query item creation and problem detection.
More detailed information regarding Telemetry query item configuration can be found in Zabbix documentation.
ClickHouse history backend
The ClickHouse history backend was specifically selected as the new history backend option because of the scalability and performance supported by ClickHouse.
ClickHouse can be configured as an additional history backend, meaning a regular MySQL or PostgreSQL database is still required to store Zabbix configuration. ClickHouse then can be configured to store specific types of data. There are a variety of benefits to implementing a ClickHouse history backend in your environment:
- Column-based storage enables faster queries
- Horizontal scaling and parallel processing by using sharding
- In synthetic tests proven to support millions of values per second
- ClickHouse is used as OpenTelemetry data storage
Complex event processing
Over time we’ve introduced a variety of features and made design decisions to support the eventual introduction of our new complex event processing engine. The goal of the newly introduced complex event processing features is to support a variety of event processing scenarios, such as:
- Automated cause and symptom event ranking
- Event deduplication
- Event enrichment with contextual information
- Automatic event closure and discarding
Under the hood, the complex event processing rules are based on conditions (which events to match), a time window (the window during which event processing logic will be performed) and operations (what is going to be done with matched events).
For most complex use cases where the available event matching methods might not suffice, Zabbix administrators have the option to use JavaScript-based event pattern matching.
Zabbix MCP server
With the release of Zabbix 8.0 LTS, we’re introducing our official Zabbix MCP server. The MCP server can be installed from the official Zabbix repositories via the new zabbix-mcp-server package.
The MCP server contains definitions of multiple tools used to communicate with the Zabbix API:
- Read Host, template, item and related configuration
- Retrieve problems, maintenance and stored item history
- Perform problem updates and manage maintenance periods
The full list of tools supported by the MCP server is available in our MCP server documentation.
Ad-hoc maintenance
The existing maintenance functionality has been expanded from both the UX and the feature perspective.
Need to suppress a noisy trigger or a set of problems? Maintenance windows can now be created directly from the problem context menu. Here you can suppress not just the whole host, but also choose to suppress an individual trigger or a set of events based on their event names.
To achieve this, maintenance period configuration now has 2 new options:
- Suppress problems generated by an individual trigger
- Suppress problem events based on their name
Suppressing the trigger or event from the problem context menu will automatically fill in the corresponding configuration field. The fields can also be freely customized to fine-tune the maintenance window to fit your requirements.
Configurable table fields
One of the largest user experience improvements coming in Zabbix 8.0 LTS is the ability to fully customize table views in the Monitoring and Data collection sections of the Zabbix user interface:
- Table columns can be resized and reordered
- Existing columns can be hidden
- Columns for individual tag values can be added
- Tables can be extended with custom data columns
Custom text columns can be populated with built-in and user macro values in addition to static text.
With the ability to fully customize table fields, Zabbix administrators can create views tailored for individual use cases and scenarios. For example, tables can be enriched with columns containing data such as trigger threshold values, inventory information, host details, or event IDs. This way, instead of navigating across a variety of Zabbix sections, a lot of additional context information can be provided in a single table view.
Configuring the MCP server requires a few simple steps:
- Install the zabbix-mcp-server package
- Provide the frontend URL in the MCP server configuration file
- Configure additional security settings in the MCP server configuration file
- Configure Zabbix user roles and permissions and assign an API token to the user
- Connect your AI agent to the MCP server using the configured Zabbix user
From a security standpoint, the MCP server utilizes the Zabbix API, which means the usual user roles and permissions are fully considered when working with Zabbix via the MCP server. In addition to the usual set of Zabbix user permissions, the MCP server supports defining tool Allow and Deny lists, adding another layer of optional permission logic.
New dashboard theme
We have expanded the list of available frontend themes with a new addition – the dark blue frontend theme. The new theme can be accessed in user profile settings.
Visualization and UX/UI improvements
As always, our latest LTS release comes with a variety of improvements to UX/UI and Zabbix visualization features.
New and improved widgets:
- A new scatter plot widget can be used to display relations between 2 metrics
- The graph widget now supports inverting value display on the Y axis
- Hovering over an item in the tooltip highlights its graph while dimming others
- A geomap widget clustering parameter has been added
- The Top items widget can now aggregate item values into a single column or row
In addition to new widget features, Zabbix 8.0 introduces multiple improvements to the Zabbix user interface:
- We have continued with expanding inline validation to various Zabbix configuration fields
- Inherited tags are now displayed and returned consistently across templates, hosts, items, web scenarios, and triggers
- Suppression icons have been expanded to display whether the problem suppression was performed manually or by a maintenance period
- General improvements to Zabbix GUI look and feel
Dashboard import/export
In addition to widget improvements, we’ve also introduced the ability to import and export dashboards. This way, anyone can share their dashboards with other Zabbix users or use this feature to migrate a dashboard between multiple Zabbix instances.
When importing a dashboard, users will also see a full list of imported dashboards, dashboard pages, and widgets. If the imported dashboard contains references to entities that are missing in the current environment, a warning will be displayed. In case of missing entities, the dashboard structure is still preserved so users can link the widgets to existing entities after the import is done.
We’re also introducing our own public dashboard repository, where anyone can download and import official Zabbix dashboards into their own Zabbix environment.
New and updated templates
Zabbix 8.0 LTS comes packaged with a variety of new templates. The full list of templates can be found in our What’s new and upgrade notes documentation page.
In addition to new templates, we have continued expanding and improving upon our existing templates. Kubernetes administrators in particular might be interested in the reworked Kubernetes template – Kubernetes Cluster by HTTP. The old templates are retained for backward compatibility with existing configurations.
Final notes
But that’s not all – here we’ve listed only some of the more prominent features. In addition to what has been covered in this article, we have also introduced features such as:
- New items
- Improved performance related to various Zabbix components and data collection methods
- Support for PostgreSQL cluster DB backends
- Optimized Elasticsearch history backend
- Extended native security features
- Added the ability to import SAML certificates directly in Zabbix frontend
- New low-level discovery features
- And much more!
Check out the What’s new and upgrade notes documentation page to see the full list of features and improvements, and watch our Zabbix 8.0 webinar recording on YouTube to see the new updates in action.
The post What’s New in Zabbix 8.0 LTS appeared first on Zabbix Blog.
Светият синод на БТА
Post Syndicated from Дарина Сарелска original https://www.toest.bg/svetiyat-sinod-na-bta/

Добре че бяха президентските избори, за да си спомним, че има нещо като медия, нещо като държавно предприятие, нещо като министерство на официалната информация, нещо като пропаганден амвон, нещо, което в 2026 година прилича повече на ТАСС¹, отколкото на Reuters или AFP. Българската телеграфна агенция –
невзривеният мавзолей на медийното ни минало.
Реформирана отвън, сложила костюма на съвременната агенционна журналистика, кръстила се за пред чужденците Bulgarian News Agency (между другото, този текст в Закона за БТА сега сигурно ще трябва да се оправя, след като управляващите се заеха да пазят кирилицата от преводачите), все пак БТА си остава вярна на своя член 1, който я дефинира като информационен институт на бюджетна издръжка.
За разлика от БНТ и БНР, които се преоблякоха в обществени медии и чиито генерални директори от кумова срама се избират от поне-на-теория-независим-орган (СЕМ), тук генералният директор се назначава за срок от 5 години пряко от парламента по предложение на политическите партии. Което го прави нещо като министър на държавната информация с удължен мандат, ако се съди само по процедурата.
Това даже стига, за да направи връзката медии–власт проблематична, защото е пряка, близка и причинно-следствена. Но не е само то.
Кирил Вълчев изкара цяла предизборна кампания и беше дори избран за вицепрезидент, бидейки все още в неплатен отпуск като генерален директор на БТА. Междувременно Агенцията продължи да отразява шефа си в неговата двойна роля, произвеждайки дописки като тази, достойни за антипримери в часовете по журналистическа етика.


В предизборната кампания Кирил Вълчев се запомни основно с това, че се превърна в меме с ярката си защита на неясно от кого нападнатата кирилица и с прословутия призив „на следващите президентски избори да не си говорим с арабски цифри, а да си говорим с българските букви“. В изборната нощ бетеанци се шегуваха, че те именно са големият победител от изборите, защото след шест години най-накрая ще сменят Вълчев, избиран единодушно от всяка власт.
Аз вече не съм сигурна, че това е необходимо. Щом един човек може цяла предизборна кампания да е едновременно директор на държавната информационна агенция и кандидат за „Дондуков“ 2, а накрая и избран за вицепрезидент, без никой да се смути, защо изобщо да търсим наследник? Нека го узаконим: една длъжност на „Дондуков“ 2, една на „Цариградско шосе“.
Може даже да му добавим и светски патриарх по съвместителство, след като Вълчев се записа и с приумицата да вкара Евангелието в новините и да задължи кореспондентите да отразяват проповедите на БПЦ като факт. Истински официален пазител на българщината и буквите. С две думи,
Кирил на републиката (без Методий)
Кирил Вълчев не е първият преминал през въртящата се врата между медии и политика. Но определено е от ярките примери, редом с настоящата директорка на БНТ Милена Милотинова, която също направи едно кръгче по върховете между медиите и властта (беше депутатка от НДСВ, 2001–2005). И понеже всичко от един масраф се плаща – нашия, а и ретрото очевидно отново е на мода, си струва да припомним, че и двете организации имат дългогодишно минало на пропагандни апарати на социалистическата държава.
Признанието като самопризнание
Защо прескачането на журналисти в политиката е саморазобличително и за политиката, и за журналистиката? Как журналистическото доверие се превръща в политически капитал и какво остава след това от самата журналистика – от Дарина Сарелска.
БТА като централен информационен и пропаганден институт на комунистическия Министерски съвет, а Българската телевизия като държавен монопол, чието ръководство и съдържание са под контрола на БКП. И двете – с дълга история на високоговорители на властта вместо на нейни корективи. На ретранслатори на прессъобщения и официални държавни комюникета.
Минали са много години оттогава, но изглежда, разбирането за ролята на журналистите като прессекретарки на властта си е останало там. Поне за „прогресивното“ мнозинство на Румен Радев, което показа, че очакванията му от медиите са в най-добрите авторитарни традиции: да слушат и да препредават.
Достоверно и в пълнота
В края на октомври правителствената информационна служба разпространи официална позиция, в която се казва, че професионалните стандарти изисквали думите на премиера да се отразяват „достоверно и в пълнота“ дори когато журналистите не ги харесват. А медиите, които съкращават и подбират информацията си, бяха обвинени в създаването на „политически наративи“. БТА, разбира се, публикува това. Без контекст що е то новина и как именно професионалният подбор на база обществен интерес и новинарска ценност отделя новините от суровата информация, която се лее в партийните Facebook страници.
Асоциацията на европейските журналисти – България (АЕЖ – България) реагира веднага, че това издава дълбоко непознаване на журналистическата работа. Медиите не се свеждат до платформи за публикуване на прессъобщения на властта, а журналистите не са просто „стойки за микрофони“, четем в официалната позиция на професионалната организация. БТА не публикува това.
Прочетена през Закона за БТА обаче, грешката е вярна!
Защото онова, което АЕЖ – България с основание определя като нежурналистика, е всъщност законовото основание за съществуването на националната информационна агенция на държавна издръжка.
Член 5 задължава БТА да разпространява безвъзмездно официалните актове и съобщения на президента, премиера, парламента, главния прокурор и практически на целия държавен апарат. Нещо повече, член 9 освобождава Агенцията от всякаква редакционна отговорност, когато прави това, стига да цитира точно и в пълнота.
Вътрешните правила, утвърдени от Кирил Вълчев, отиват и по-далеч: съобщенията се публикуват „в пълен обем, във вида, в който са получени“.
Ето ви го златния стандарт. Описан и прошнурован. Не трябва да се учудваме, значи, че сега премиерът Радев викна „равнис“ за всички медии по този явно доказано работещ (за него) модел.
Good night, and good luck, motherf*ckers
Историята на американското предаване „60 минути“ е разказ за механизмите, чрез които се опитомяват медиите. И тези механизми са удивително сходни, независимо от пазара или знамето пред сградата на телевизията. Един текст в стил „Думам ти, дъще, сещай се, журналистическа снахо“ от Дарина Сарелска.
Държавен високоговорител с журналистическа карта
То така си беше, ще кажете вие. И ще сте прави – и при Борисов беше същото. Просто този е военен и командите се викат ясно и на плаца. Онзи беше пожарникар и гасеше пожарите в медиите с други достъпни му средства (опразване на столчета, държавна реклама и „размазване“ през регулаторите).
Но да се върнем на журналистиката. За разлика от устава на БТА, в нормалната агенционна журналистика прессъобщението е само източник: проверява се, поставя се в контекст и най-често не става новина само̀ по себе си. Ако не е вярно, даже става обект на разследване.
Професионалните агенции нямат нито задължението, нито лиценза да съобщават безнаказано всичко – дори неистини, само защото ги е изрекъл някой важен. Напротив, много от тях разполагат с цели екипи, чиято работа е да опровергават лъжите на важните (справка: Reuters Fact Check, AFP Proveri).
В БТА не просто няма такива екипи. Няма и стимул за подобно разбиране и практикуване на журналистиката. Законът на практика окуражава липсата на въпроси и безкритичното цитиране. Това е удобна защита за държавния куриер, но е и вграден рефлекс за автоцензура.
Когато не питаш, не рискуваш нищо.
Когато препечатваш, не създаваш „наративи“. Защото когато питаш, сравняваш и поставяш в контекст, може да ядосаш точно този, който ти плаща. Законът е превърнал липсата на въпрос и папагалската нежурналистика в начин на оцеляване и в бизнес модел. А за някои, като бонус – очевидно и във възможност за кариерно издигане.
„Няма места.“ Журналистиката след журналистите
Ако се чудите какво стана с медиите в България, този текст ви е напълно достатъчен, за да си дадете отговори на много въпроси. А иначе, вие въпроси може и да си задавате, но в много медии у нас вече няма кой да ги задава – гледайте какво нещо… Защо стана така – от Дарина Сарелска.
Агенция, която никой не купува, но всички плащаме
И тук няма как в наратива да не включим малко арабски цифри (с извинение към вицепрезидента – генерален директор).
Защото именно числата рисуват БТА като любопитен икономически феномен: куха държавна фирма, от която никой не иска да купува, но явно ни е скъпа. Толкова скъпа, че са налага данъкоплатците да плащат двойно – и на входа, и на изхода.
Веднъж осигуряват бюджетната издръжка на радиоточката, тоест явяват се неин собственик по неволя, и втори път – клиент по неволя, защото пак с публични средства се плаща сметката на държавните институции, които са нейни законово задължени абонати. Ето това е бизнес модел!
Явно за това говори Кирил Вълчев, когато казва, че вижда БТА като институция на съгласие и национално приобщаване и обединение. Със сигурност сме обединени в плащането на сметката.
От началото на управлението на Кирил Вълчев държавната субсидия на Агенцията се е увеличила повече от два пъти, от около 6 млн. лв. през 2020 г. до на над 15 млн. лв. за 2025 г., докато собствените приходи между 2020 и 2025 г. са намалели от 1,258 млн. до 981 000 лв., тоест с около 22%. И дори тези скромни постъпления не са от новините, които БТА произвежда, а основно от пресконференции, архивни материали, снимки, реклама и наеми.
За сравнение, AFP също получава от френската държава 120 млн. евро субсидия, но това е около една трета от общите ѝ приходи. Останалото идва от реални клиенти. При БТА собствените приходи са едва 5%, всичко друго е държавна помощ.
Качествената агенционна журналистика по правило не е евтина, камо ли безплатна. Бизнес моделът ѝ е споделяне на разходите: никоя редакция не може сама да си позволи кореспондент във всяка столица и екип за всяко събитие, затова десетки медии плащат по малко за общ агенционен екип, който работи за всички. Редакцията възлага тази част от работата си на Агенцията срещу абонамент.
Финансовата криза на традиционните медии постави на изпитание модела и на много места се наложи предоговаряне на условията. Абонамент за AFP или Associated Press можеше да достигне до 500 000 евро през 2009-та, след оптимизации сега стига до 80–100 000 евро на година. На абонат. Но медиите, включително българските, намират пари и плащат, когато виждат стойност.
Като обществени медии БНТ и БНР са обявили публично тези абонаменти, големите частни телевизии също ги ползват. Учудващо, но за периода ноември 2024 г. – април 2025 г. излиза, че общественото радио плаща повече за български агенции, отколкото за международни, въпреки разликите в качеството и обема информация.
Но тъй като радиото остава на практика сред малкото реални медийни клиенти на БТА, се наложи проблемът да бъде решен генерално: вместо да се конкурира за клиентите, през 2022-ра БТА стана безплатна по закон и получи допълнителна държавна гаранция за издръжката си. Това идва след дълги години мижав интерес (поради липса на качество) към бюлетините на БТА, предназначени за другите български и чуждестранни медии.
Краят на журналистиката
Журналистиката губи не само пари и трафик, а и необходимостта да я има. Алгоритми, нюзинфлуенсъри и политици, които вече говорят директно на публиката, променят правилата на играта. Въпросът вече e не дали медиите са в криза, а дали обществото изобщо още иска журналистика. От Дарина Сарелска.
Докато лобира за реформата, през 2021 г. самият Кирил Вълчев признава пред парламентарната Комисия по културата и медиите, че дори БНТ вече се е отказала от абонамента си. От 145 акредитирани посланици в България към онзи момент едва 37 плащат за англоезичния бюлетин Daily News, а другата английска емисия има само 7 абонати, повечето на бартер. Вълчев обяснява отлива на клиенти с финансовите затруднения на медиите. Но като видите водещата страница на БТА и я сравните с тези на Reuters или Associated Press, става ясно, че причините са други.
Ето ви малко БТА заглавия с дата 7 ноември 2026 г.
ОБНОВЕНА Бюджетът задава визията за развитие на държавата, а нашата цел е българите да живеят по-добре и по-сигурно, заяви премиерът Радев
Вицепремиерът и министър на финансите Гълъб Донев заяви, че за 2027 г. представя „бюджет на вразумяването“ и на реалните цифри
От 2017 г. не е имало увеличение на ученическите стипендии и се предвижда да бъдат повишени с 20 процента през 2027 г., каза министър Георги Вълчев
Ученически театър и срещи на кварталната общност ще се състоят в 104-о ОУ „Захари Стоянов“
Националният етнографски музей представя изложба за азербайджанската килимарска традиция
Пожарната служба в Петрич предупреждава за повишен риск от пожари през отоплителния сезон
Творчеството на Вежди Рашидов остава значима част от българската култура, написаха от НХА
В Самоков бе отслужена панихида в памет на героите, загинали във войнитe
Има и 1550 новини годишно само за български фолклорни състави в чужбина според отчетите на самия Вълчев. Стилът „Работническо дело“ не може да се сбърка – същият безпочвен оптимизъм, същият клиширан език, същото усещане, че няма значение какво се е случило, важното е как от държавния амвон се разказва за него. Само дето годината е 2026-та, има интернет и социални мрежи и това вече не работи.
Но продължава да ни струва пари.
За 2026 г. за издръжката на БТА-буквите и за публикуването на прессъобщения в пълнота бюджетът ще плати близо 10 млн. евро. Отделно са платените партньорства, които държавни институции подписват с БТА – нещо като задължителен втори стълб на издръжка. Общото е, че винаги е на принципа „от единия джоб в другия“. А платецът винаги сме всички ние, данъкоплатците.
Кой има нужда от мавзолея на „Цариградско шосе“?
Големият победител наистина е БТА и нейните държавни ръководители. Предстои да видим как ще бъде избран наследникът на Вълчев. Ще го има ли традиционния консенсус на партийни предложения като през 2021 и 2025 г., когато Вълчев беше избран без нито един против? Предложен първоначално от ГЕРБ, преизбран с гласовете на ГЕРБ, „Има такъв народ“ и БСП, а сега вицепрезидент, издигнат от днешното мнозинство. За това „единство на нацията“ говорим. Или просто за доказателството, че партиите не са имали интерес да сменят един функционер, който не им създава проблеми.
Затова не питайте колко струва БТА. Питайте какво ни казва фактът, че никой в парламента не иска да се замисли защо я издържаме на загуба.
1 Руската държавна информационна агенция, създадена през 1925 г. като Телеграфна агенция на Съветския съюз. След разпадането на СССР през 1992 г. е преименувана на ИТАР-ТАСС (Информационна телеграфна агенция на Русия – ТАСС), като запазва и познатата съветска абревиатура. През 2014 г. връща старото си име ТАСС.