Post Syndicated from Explosm.net original https://explosm.net/comics/blunt-rotation
New Cyanide and Happiness Comic
Post Syndicated from Explosm.net original https://explosm.net/comics/blunt-rotation
New Cyanide and Happiness Comic
Post Syndicated from Matt Granger original https://www.youtube.com/watch?v=OJNbElHrJlw
Post Syndicated from corbet original https://lwn.net/Articles/960606/
Simon Phipps writes
on the Open Source Initiative blog that the latest version of the
European Cyber Resilience Act is much improved: “As a result of all this
”
effort from so many people, the final text of the CRA mitigated pretty much
all the risks we had identified to individual developers and to Open Source
foundations.
Post Syndicated from corbet original https://lwn.net/Articles/960604/
Security updates have been issued by Debian (chromium, man-db, and openjdk-17), Fedora (chromium, indent, jupyterlab, kernel, and python-notebook), Gentoo (glibc), Oracle (firefox, thunderbird, and tigervnc), Red Hat (rpm), SUSE (cpio, gdb, gstreamer, openconnect, slurm, slurm_18_08, slurm_20_02, slurm_20_11, slurm_22_05, slurm_23_02, squid, webkit2gtk3, and xerces-c), and Ubuntu (imagemagick and xorg-server, xwayland).
Post Syndicated from Екип на Биволъ original https://bivol.bg/barcelonagate-bakalova.html

Публикуваме показанията на Ивайла Бакалова дадени по делото Барселонагейт, в които тя недвусмислено прави връзка между Борислава Йовчева и бившия премиер Бойко Борисов. След като делото беше иззето от наблюдаващия…
Post Syndicated from The History Guy: History Deserves to Be Remembered original https://www.youtube.com/watch?v=V6-_EeW_EHY
Post Syndicated from Bruce Schneier original https://www.schneier.com/blog/archives/2024/02/a-self-enforcing-protocol-to-solve-gerrymandering.html
In 2009, I wrote:
There are several ways two people can divide a piece of cake in half. One way is to find someone impartial to do it for them. This works, but it requires another person. Another way is for one person to divide the piece, and the other person to complain (to the police, a judge, or his parents) if he doesn’t think it’s fair. This also works, but still requires another person—at least to resolve disputes. A third way is for one person to do the dividing, and for the other person to choose the half he wants.
The point is that unlike protocols that require a neutral third party to complete (arbitrated), or protocols that require that neutral third party to resolve disputes (adjudicated), self-enforcing protocols just work. Cut-and-choose works because neither side can cheat. And while the math can get really complicated, the idea generalizes to multiple people.
Well, someone just solved gerrymandering in this way. Prior solutions required either a bipartisan commission to create fair voting districts (arbitrated), or require a judge to approve district boundaries (adjudicated), their solution is self-enforcing.
And it’s trivial to explain:
It’s not obvious that this solution works. You could imagine that all the districts are defined so that one party has a slight majority. In that case, no combination of pairs will make that map fair. But real-world gerrymandering is never that clean. There’s “cracking,” where a party’s voters are split amongst several districts to dilute its power; and “packing,” where a party’s voters are concentrated in a single district so its influence can be minimized elsewhere. It turns out that this “define-combine procedure” works; the combining party can undo any damage that the defining party does—that the results are fair. The paper has all the details, and they’re fascinating.
Of course, a theoretical solution is not a political solution. But it’s really neat to have a theoretical solution.
Post Syndicated from original https://www.toest.bg/na-vtoro-chetene-strannite-prezhivelitsi-na-edin-poshtalyon/

Превод от френски Калоян Праматаров, изд. „Лист“, 2019
Книгата лесно може да ви заблуди. Зад заглавието, което ми навяваше представа за по-скоро бързо, лековато, приключенско и забавно четиво (от рода на многото за книжарничките и кафенетата), всъщност стои нещо съвсем различно. Стои съвсем друг тип роман, или по-скоро
Написана на език, зареден с някаква почти старомодна естетика, тя звучи така, сякаш разказва за отминали времена, а не за съвремието ни (когато всъщност се развива действието), маркерите за което са сведени до минимум. За това допринася и сюжетът, построен изцяло около размяната на истински, книжни, писани на ръка писма – нещо почти ексцентрично в наши дни, или най-малкото занимание за носталгици, мечтатели и безнадеждни романтици.
Такъв се оказва и главният герой Билодо, прикрит зад рутината и сигурността на своя ежедневен образ на редови пощальон в Квебек, изпълнителен и изцяло отдаден на професията си. 27-годишният мъж сякаш наистина принадлежи на друга епоха – той изпълнява задълженията си по разнасянето на скучни сметки и формуляри с вече излезли от употреба добросъвестност и усърдие; следва разчертани маршрути и безопасни навици; посещава едно и също място за хранене; има само един колега приятел, а съвременният социален живот му е напълно чужд за сметка на часовете, прекарани у дома с джаз и стари компютърни игри. Единственото му прегрешение – престъпването на целия този ред – е, че преди да ги достави на клиентите си, Билодо чете, копира и съхранява съкровищата от пощата – писаните на ръка писма.
Истински писма, написани от реални хора, които предпочитаха пред змийската студенина на клавиатурата и мигновеността на интернет чувствения акт на писането на ръка, сладостното униние от очакването на отговора, хора, умеещи да пишат писма, за които това бе съзнателен избор, а в някои случаи се долавяше, че става дума за принцип, за заемане на позиция в полза на един начин на живот, по-малко подвластен на надпреварата с времето и стремежа към бърз резултат.
Сред този сноп от „еднопосочни“ сюжетни нишки (тъй като разполага само с текстовете на подателите), които пази в папки и чиито отговори измисля наум, Билодо ще попадне на преписка, която напълно ще го обсеби – между учителка от Гваделупа и канадски професор по литература, впуснали се в т.нар. ренку, или „нанизано стихотворение“, традиция, водеща началото си от поетическите турнири в императорския двор на средновековна Япония.
Изключително трудно е да се говори за тази повест, без човек незабавно да се натъкне на сюжетен спойлер. Достатъчно е обаче да кажем, че размяната на хайку между двамата непознати ще завладее съзнанието на Билодо, а един трагичен инцидент ще отвори пред него възможност, която ще го отведе до неведомите дълбини и ефирните висини на поезията, ще превземе, отгледа и просвети думите му и няма да му даде мира, докато не ги превърне в изящни приношения на олтара на любовта. След поредица от авантюристични ходове от негова страна, всичко това ще превърти живота му по напълно неочакван начин.
Най-ценното в „Странните преживелици на един пощальон“ е фактът, че
Текстът е изпълнен с поредица от красиви стихове, въпреки че те не спазват точно изискването за 5–7–5 срички, както е при хайку, нито за танка. Тук е важно да уточним, че не става дума за пропуск в чудесния български превод на Калоян Праматаров, а за решение, което присъства и в оригинала.
Билодо сам ще се впусне в преследване на духа на хайку, завещан ни от майстори като Мацуо Башо, Нагата Кои и Кобаяши Иса – а именно „съполагането на неизменното и мимолетното“, „деликатното равновесие между фуеки (неизменното, вечността, която ни надхвърля) и рюко (преходното, ефимерното, което ни пронизва)“.
Той пишеше, търсеше съпричастността на думите, опитваше се да ги улови в полет, преди да са се пръснали, да ги хване като пеперуди в мрежата на страницата и да ги закарфичи върху хартията.
В книгата се говори и за редица други принципи, като например уаби (неподправената красота в съзвучие с природата) и саби (простота, безметежност, самота). Централен за сюжета обаче ще се окаже дзен символът енсо – кръг, изписван с едно-единствено движение на ръката в пълното отсъствие на мисли (сатори), с цел постигане на просветление. Изпълнението на това „духовно упражнение на медитация върху небитието“ разкрива духовното състояние на твореца. Терио умело построява своя сюжет върху тази идея, върху кръга на цикличното време и природа, на вечното завръщане в изходната точка, на неизбежното начало.
Завихряйки се като водата,
срещнала скала,
времето бяга в кръг.
Повестта обаче може да се чете и изобщо като търсене на смисъла, динамиката, философията зад „направата“ и духа на поезията. В търсенията и опитите си Билодо ще премине през куп въпроси. Би ли могъл един обикновен пощальон да стане поет, т.е. за всеки ли е поезията, или както вярват романтиците, поетът е богоизбран и боговдъхновен, отделен от тълпата? Може ли това изкуство да се постигне по имитативен път, чрез усвояване и възпроизвеждане на външните му форми? Може ли човек да се научи на поезия чрез един практически подход? Какво трябва да направи, за да стане и да бъде поет. Ключ ли са вживяването в личността и биографията на големите автори, на образците и близкият прочит на творбите им към тайната на поезията (въпроси, които отварят поле за осмисляне и на видовете литературна критика и теория)?
И още: съществува ли химия между точните думи, способна да ги трансцендира? Не предпочита ли винаги истинският поет обектите на въображението си пред тези в реалността? Трябва ли да има превъзходни сетива за всяка подробност от заобикалящия ни свят, способна да ни „осигури“ материал за поезия:
Гъсеницата, лазеща по тротоара, ажурната арка, която образуваха над улицата дървесните клони, катеричките, боричкащи се между краката на градинската пейка, и розовите кюлоти, провесени на простора и развявани от вятъра: дали от всичко това можеше да се получат стихотворения? (…) Трябва ли да стори още нещо, да принесе някаква жертва, има ли ключ, който е пропуснал да пъхне в сложната ключалка на портата, отказваща му достъп до поезията?
Всички тези въпроси си задава Билодо в своя поход към сърцевината на поетичното преживяване, сравнимо с кулминацията на оргазма, докато се страхува да не накърни самата същност на Поезията. Докато се пита дали да изобразява видимото и уловимото, или пронизан от него, „да изрази по-величествени и красиви неща, да разкъса шевовете на пристягащата го дреха, да достигне по-надалече, най-сетне да разкрие сърцето си“.

Прекрасно малко бижу е тази повест – първата книга на Дени Терио, издадена на български от „Лист“, последвана от романа „Игуаната“ (2021, отново в превод на Калоян Праматаров). В привидната ѝ лекота, където на моменти прозира далечен нюанс на човеколюбива насмешка и самоиронична приповдигнатост, се оформя обликът на източната поетична традиция и на Поета, кореспондиращ с образа му от романтизма в западната традиция. „Странните преживелици на един пощальон“ в крайна сметка ни превежда и по един позабравен път на любовта – от платоничното към чувственото, осъществено изцяло през еротиката и сетивния заряд на езика.
Активните дарители на „Тоест“ получават постоянна отстъпка в размер на 20% от коричната цена на всички заглавия от каталога на издателство „Лист“, както и на няколко други български издателства в рамките на партньорската програма Читателски клуб „Тоест“. За повече информация прочетете на toest.bg/club.
Никой от нас не чете единствено най-новите книги. Тогава защо само за тях се пише? „На второ четене“ е рубрика, в която отваряме списъците с книги, публикувани преди поне година, четем ги и препоръчваме любимите си от тях. Рубриката е част от партньорската програма Читателски клуб „Тоест“. Изборът на заглавия обаче е единствено на авторите – Стефан Иванов и Антония Апостолова, които биха ви препоръчали тези книги и ако имаше как веднъж на две седмици да се разходите с тях в книжарницата.
Post Syndicated from Cliff Robinson original https://www.servethehome.com/hpe-servers-and-kioxia-sas-and-nvme-ssds-to-the-iss-in-the-hpe-spaceborne-computer-2/
HPE servers and Kioxia SAS and NVMe SSDs make their way to the ISS in the HPE Spaceborne Computer-2 after liftoff this week
The post HPE Servers and Kioxia SAS and NVMe SSDs to the ISS in the HPE Spaceborne Computer-2 appeared first on ServeTheHome.
Post Syndicated from xkcd.com original https://xkcd.com/2889/

Post Syndicated from Talks at Google original https://www.youtube.com/watch?v=64eugPFOcOo
Post Syndicated from Matthew Prince http://blog.cloudflare.com/author/matthew-prince/ original https://blog.cloudflare.com/thanksgiving-2023-security-incident
On Thanksgiving Day, November 23, 2023, Cloudflare detected a threat actor on our self-hosted Atlassian server. Our security team immediately began an investigation, cut off the threat actor’s access, and on Sunday, November 26, we brought in CrowdStrike’s Forensic team to perform their own independent analysis.
Yesterday, CrowdStrike completed its investigation, and we are publishing this blog post to talk about the details of this security incident.
We want to emphasize to our customers that no Cloudflare customer data or systems were impacted by this event. Because of our access controls, firewall rules, and use of hard security keys enforced using our own Zero Trust tools, the threat actor’s ability to move laterally was limited. No services were implicated, and no changes were made to our global network systems or configuration. This is the promise of a Zero Trust architecture: it’s like bulkheads in a ship where a compromise in one system is limited from compromising the whole organization.
From November 14 to 17, a threat actor did reconnaissance and then accessed our internal wiki (which uses Atlassian Confluence) and our bug database (Atlassian Jira). On November 20 and 21, we saw additional access indicating they may have come back to test access to ensure they had connectivity.
They then returned on November 22 and established persistent access to our Atlassian server using ScriptRunner for Jira, gained access to our source code management system (which uses Atlassian Bitbucket), and tried, unsuccessfully, to access a console server that had access to the data center that Cloudflare had not yet put into production in São Paulo, Brazil.
They did this by using one access token and three service account credentials that had been taken, and that we failed to rotate, after the Okta compromise of October 2023. All threat actor access and connections were terminated on November 24 and CrowdStrike has confirmed that the last evidence of threat activity was on November 24 at 10:44.
(Throughout this blog post all dates and times are UTC.)
Even though we understand the operational impact of the incident to be extremely limited, we took this incident very seriously because a threat actor had used stolen credentials to get access to our Atlassian server and accessed some documentation and a limited amount of source code. Based on our collaboration with colleagues in the industry and government, we believe that this attack was performed by a nation state attacker with the goal of obtaining persistent and widespread access to Cloudflare’s global network.
On November 24, after the threat actor was removed from our environment, our security team pulled in all the people they needed across the company to investigate the intrusion and ensure that the threat actor had been completely denied access to our systems, and to ensure we understood the full extent of what they accessed or tried to access.
Then, from November 27, we redirected the efforts of a large part of the Cloudflare technical staff (inside and outside the security team) to work on a single project dubbed “Code Red”. The focus was strengthening, validating, and remediating any control in our environment to ensure we are secure against future intrusion and to validate that the threat actor could not gain access to our environment. Additionally, we continued to investigate every system, account and log to make sure the threat actor did not have persistent access and that we fully understood what systems they had touched and which they had attempted to access.
CrowdStrike performed an independent assessment of the scope and extent of the threat actor’s activity, including a search for any evidence that they still persisted in our systems. CrowdStrike’s investigation provided helpful corroboration and support for our investigation, but did not bring to light any activities that we had missed. This blog post outlines in detail everything we and CrowdStrike uncovered about the activity of the threat actor.
The only production systems the threat actor could access using the stolen credentials was our Atlassian environment. Analyzing the wiki pages they accessed, bug database issues, and source code repositories, it appears they were looking for information about the architecture, security, and management of our global network; no doubt with an eye on gaining a deeper foothold. Because of that, we decided a huge effort was needed to further harden our security protocols to prevent the threat actor from being able to get that foothold had we overlooked something from our log files.
Our aim was to prevent the attacker from using the technical information about the operations of our network as a way to get back in. Even though we believed, and later confirmed, the attacker had limited access, we undertook a comprehensive effort to rotate every production credential (more than 5,000 individual credentials), physically segment test and staging systems, performed forensic triages on 4,893 systems, reimaged and rebooted every machine in our global network including all the systems the threat actor accessed and all Atlassian products (Jira, Confluence, and Bitbucket).
The threat actor also attempted to access a console server in our new, and not yet in production, data center in São Paulo. All attempts to gain access were unsuccessful. To ensure these systems are 100% secure, equipment in the Brazil data center was returned to the manufacturers. The manufacturers’ forensic teams examined all of our systems to ensure that no access or persistence was gained. Nothing was found, but we replaced the hardware anyway.
We also looked for software packages that hadn’t been updated, user accounts that might have been created, and unused active employee accounts; we went searching for secrets that might have been left in Jira tickets or source code, examined and deleted all HAR files uploaded to the wiki in case they contained tokens of any sort. Whenever in doubt, we assumed the worst and made changes to ensure anything the threat actor was able to access would no longer be in use and therefore no longer be valuable to them.
Every member of the team was encouraged to point out areas the threat actor might have touched, so we could examine log files and determine the extent of the threat actor’s access. By including such a large number of people across the company, we aimed to leave no stone unturned looking for evidence of access or changes that needed to be made to improve security.
The immediate “Code Red” effort ended on January 5, but work continues across the company around credential management, software hardening, vulnerability management, additional alerting, and more.
The attack started in October with the compromise of Okta, but the threat actor only began targeting our systems using those credentials from the Okta compromise in mid-November.
The following timeline shows the major events:
We’ve written about this before but, in summary, we were (for the second time) the victim of a compromise of Okta’s systems which resulted in a threat actor gaining access to a set of credentials. These credentials were meant to all be rotated.
Unfortunately, we failed to rotate one service token and three service accounts (out of thousands) of credentials that were leaked during the Okta compromise.
One was a Moveworks service token that granted remote access into our Atlassian system. The second credential was a service account used by the SaaS-based Smartsheet application that had administrative access to our Atlassian Jira instance, the third account was a Bitbucket service account which was used to access our source code management system, and the fourth was an AWS environment that had no access to the global network and no customer or sensitive data.
The one service token and three accounts were not rotated because mistakenly it was believed they were unused. This was incorrect and was how the threat actor first got into our systems and gained persistence to our Atlassian products. Note that this was in no way an error on the part of AWS, Moveworks or Smartsheet. These were merely credentials which we failed to rotate.
Our logs show that the threat actor started probing and performing reconnaissance of our systems beginning on November 14, looking for a way to use the credentials and what systems were accessible. They attempted to log into our Okta instance and were denied access. They attempted access to the Cloudflare Dashboard and were denied access.
Additionally, the threat actor accessed an AWS environment that is used to power the Cloudflare Apps marketplace. This environment was segmented with no access to global network or customer data. The service account to access this environment was revoked, and we validated the integrity of the environment.
The threat actor successfully accessed Atlassian Jira and Confluence on November 15 using the Moveworks service token to authenticate through our gateway, and then they used the Smartsheet service account to gain access to the Atlassian suite. The next day they began looking for information about the configuration and management of our global network, and accessed various Jira tickets.
The threat actor searched the wiki for things like remote access, secret, client-secret, openconnect, cloudflared, and token. They accessed 36 Jira tickets (out of a total of 2,059,357 tickets) and 202 wiki pages (out of a total of 194,100 pages).
The threat actor accessed Jira tickets about vulnerability management, secret rotation, MFA bypass, network access, and even our response to the Okta incident itself.
The wiki searches and pages accessed suggest the threat actor was very interested in all aspects of access to our systems: password resets, remote access, configuration, our use of Salt, but they did not target customer data or customer configurations.
The threat actor used the Smartsheet credential to create an Atlassian account that looked like a normal Cloudflare user. They added this user to a number of groups within Atlassian so that they’d have persistent access to the Atlassian environment should the Smartsheet service account be removed.
During this period, the attacker took a break from accessing our systems (apart from apparently briefly testing that they still had access) and returned just before Thanksgiving.
Since the Smartsheet service account had administrative access to Atlassian Jira, the threat actor was able to install the Sliver Adversary Emulation Framework, which is a widely used tool and framework that red teams and attackers use to enable “C2” (command and control), connectivity gaining persistent and stealthy access to a computer on which it is installed. Sliver was installed using the ScriptRunner for Jira plugin.
This allowed them continuous access to the Atlassian server, and they used this to attempt lateral movement. With this access the Threat Actor attempted to gain access to a non-production console server in our São Paulo, Brazil data center due to a non-enforced ACL. The access was denied, and they were not able to access any of the global network.
Over the next day, the threat actor viewed 120 code repositories (out of a total of 11,904 repositories). Of the 120, the threat actor used the Atlassian Bitbucket git archive feature on 76 repositories to download them to the Atlassian server, and even though we were not able to confirm whether or not they had been exfiltrated, we decided to treat them as having been exfiltrated.
The 76 source code repositories were almost all related to how backups work, how the global network is configured and managed, how identity works at Cloudflare, remote access, and our use of Terraform and Kubernetes. A small number of the repositories contained encrypted secrets which were rotated immediately even though they were strongly encrypted themselves.
We focused particularly on these 76 source code repositories to look for embedded secrets, (secrets stored in the code were rotated), vulnerabilities and ways in which an attacker could use them to mount a subsequent attack. This work was done as a priority by engineering teams across the company as part of “Code Red”.
As a SaaS company, we’ve long believed that our source code itself is not as precious as the source code of software companies that distribute software to end users. In fact, we’ve open sourced a large amount of our source code and speak openly through our blog about algorithms and techniques we use. So our focus was not on someone having access to the source code, but whether that source code contained embedded secrets (such as a key or token) and vulnerabilities.
Our security team was alerted to the threat actor’s presence at 16:00 and deactivated the Smartsheet service account 35 minutes later. 48 minutes later the user account created by the threat actor was found and deactivated. Here’s the detailed timeline for the major actions taken to block the threat actor once the first alert was raised.
15:58 – The threat actor adds the Smartsheet service account to an administrator group.
16:00 – Automated alert about the change at 15:58 to our security team.
16:12 – Cloudflare SOC starts investigating the alert.
16:35 – Smartsheet service account deactivated by Cloudflare SOC.
17:23 – The threat actor-created Atlassian user account is found and deactivated.
17:43 – Internal Cloudflare incident declared.
21:31 – Firewall rules put in place to block the threat actor’s known IP addresses.
10:44 – Last known threat actor activity.
11:59 – Sliver removed.
Throughout this timeline, the threat actor tried to access a myriad of other systems at Cloudflare but failed because of our access controls, firewall rules, and use of hard security keys enforced using our own Zero Trust tools.
To be clear, we saw no evidence whatsoever that the threat actor got access to our global network, data centers, SSL keys, customer databases or configuration information, Cloudflare Workers deployed by us or customers, AI models, network infrastructure, or any of our datastores like Workers KV, R2 or Quicksilver. Their access was limited to the Atlassian suite and the server on which our Atlassian runs.
A large part of our “Code Red” effort was understanding what the threat actor got access to and what they tried to access. By looking at logging across systems we were able to track attempted access to our internal metrics, network configuration, build system, alerting systems, and release management system. Based on our review, none of their attempts to access these systems were successful. Independently, CrowdStrike performed an assessment of the scope and extent of the threat actor’s activity, which did not bring to light activities that we had missed and concluded that the last evidence of threat activity was on November 24 at 10:44.
We are confident that between our investigation and CrowdStrike’s, we fully understand the threat actor’s actions and that they were limited to the systems on which we saw their activity.
This was a security incident involving a sophisticated actor, likely a nation-state, who operated in a thoughtful and methodical manner. The efforts we have taken to ensure that the ongoing impact of the incident was limited and that we are well-prepared to fend off any sophisticated attacks in the future. This required the efforts of a significant number of Cloudflare’s engineering staff, and, for over a month, this was the highest priority at Cloudflare. The entire Cloudflare team worked to ensure that our systems were secure, the threat actor’s access was understood, to remediate immediate priorities (such as mass credential rotation), and to build a plan of long-running work to improve our overall security based on areas for improvement discovered during this process.
I am incredibly grateful to everyone at Cloudflare who responded quickly over the Thanksgiving holiday to conduct an initial analysis and lock out of the threat actor and all those who contributed to this effort. It would be impossible to name everyone involved, but their long hours and dedicated work made it possible to undertake an essential review and change of Cloudflare’s security while keeping our global network running and our customers’ service running.
We are grateful to CrowdStrike for having been available immediately to conduct an independent assessment. Now that their final report is complete, we are confident in our internal analysis and remediation of the intrusion and are making this blog post available.
IOCs
Below are the Indications of Compromise (IOCs) that we saw from this threat actor. We are publishing them so that other organizations, and especially those that may have been impacted by the Okta breach, can search their logs to confirm the same threat actor did not access their systems.
| Indicator | Indicator Type | SHA256 | Description |
|---|---|---|---|
| 193.142.58[.]126 | IPv4 | N/A | Primary threat actor Infrastructure, owned by M247 Europe SRL (Bucharest, Romania |
| 198.244.174[.]214 | IPv4 | N/A | Sliver C2 server, owned by OVH SAS (London, England) |
| idowall[.]com | Domain | N/A | Infrastructure serving Sliver payload |
| jvm-agent | Filename | bdd1a085d651082ad567b03e5186d1d4 6d822bb7794157ab8cce95d850a3caaf |
Sliver payload |
Post Syndicated from Satesh Sonti original https://aws.amazon.com/blogs/big-data/combine-transactional-streaming-and-third-party-data-on-amazon-redshift-for-financial-services/
Financial services customers are using data from different sources that originate at different frequencies, which includes real time, batch, and archived datasets. Additionally, they need streaming architectures to handle growing trade volumes, market volatility, and regulatory demands. The following are some of the key business use cases that highlight this need:
The challenge is to come up with a solution that can handle these disparate sources, varied frequencies, and low-latency consumption requirements. The solution should be scalable, cost-efficient, and straightforward to adopt and operate. Amazon Redshift features like streaming ingestion, Amazon Aurora zero-ETL integration, and data sharing with AWS Data Exchange enable near-real-time processing for trade reporting, risk management, and trade optimization.
In this post, we provide a solution architecture that describes how you can process data from three different types of sources—streaming, transactional, and third-party reference data—and aggregate them in Amazon Redshift for business intelligence (BI) reporting.
This solution architecture is created prioritizing a low-code/no-code approach with the following guiding principles:
The following diagram illustrates the solution architecture and how these guiding principles were applied to the ingestion, aggregation, and reporting components.

You can use the following AWS CloudFormation template to deploy the solution.

This stack creates the following resources and necessary permissions to integrate the services:
To ingest data, you use Amazon Redshift Streaming Ingestion to load streaming data from the Kinesis data stream. For transactional data, you use the Redshift zero-ETL integration with Amazon Aurora MySQL. For third-party reference data, you take advantage of AWS Data Exchange data shares. These capabilities allow you to quickly build scalable data pipelines because you can increase the capacity of Kinesis Data Streams shards, compute for zero-ETL sources and targets, and Redshift compute for data shares when your data grows. Redshift streaming ingestion and zero-ETL integration are low-code/no-code solutions that you can build with simple SQLs without investing significant time and money into developing complex custom code.
For the data used to create this solution, we partnered with FactSet, a leading financial data, analytics, and open technology provider. FactSet has several datasets available in the AWS Data Exchange marketplace, which we used for reference data. We also used FactSet’s market data solutions for historical and streaming market quotes and trades.
Data is processed in Amazon Redshift adhering to an extract, load, and transform (ELT) methodology. With virtually unlimited scale and workload isolation, ELT is more suited for cloud data warehouse solutions.
You use Redshift streaming ingestion for real-time ingestion of streaming quotes (bid/ask) from the Kinesis data stream directly into a streaming materialized view and process the data in the next step using PartiQL for parsing the data stream inputs. Note that streaming materialized views differs from regular materialized views in terms of how auto refresh works and the data management SQL commands used. Refer to Streaming ingestion considerations for details.
You use the zero-ETL Aurora integration for ingesting transactional data (trades) from OLTP sources. Refer to Working with zero-ETL integrations for currently supported sources. You can combine data from all these sources using views, and use stored procedures to implement business transformation rules like calculating weighted averages across sectors and exchanges.
Historical trade and quote data volumes are huge and often not queried frequently. You can use Amazon Redshift Spectrum to access this data in place without loading it into Amazon Redshift. You create external tables pointing to data in Amazon Simple Storage Service (Amazon S3) and query similarly to how you query any other local table in Amazon Redshift. Multiple Redshift data warehouses can concurrently query the same datasets in Amazon S3 without the need to make copies of the data for each data warehouse. This feature simplifies accessing external data without writing complex ETL processes and enhances the ease of use of the overall solution.
Let’s review a few sample queries used for analyzing quotes and trades. We use the following tables in the sample queries:
You can use the following query to find weighted average spreads on quotes:
You can use the following query to find $-volume on trades by detailed exchange, by sector, and by major exchange (NYSE and Nasdaq):
You can use Amazon QuickSight and Amazon Managed Grafana for BI and real-time reporting, respectively. These services natively integrate with Amazon Redshift without the need to use additional connectors or software in between.
You can run a direct query from QuickSight for BI reporting and dashboards. With QuickSight, you can also locally store data in the SPICE cache with auto refresh for low latency. Refer to Authorizing connections from Amazon QuickSight to Amazon Redshift clusters for comprehensive details on how to integrate QuickSight with Amazon Redshift.
You can use Amazon Managed Grafana for near-real-time trade dashboards that are refreshed every few seconds. The real-time dashboards for monitoring the trade ingestion latencies are created using Grafana and the data is sourced from system views in Amazon Redshift. Refer to Using the Amazon Redshift data source to learn about how to configure Amazon Redshift as a data source for Grafana.
The users who interact with regulatory reporting systems include analysts, risk managers, operators, and other personas that support business and technology operations. Apart from generating regulatory reports, these teams require visibility into the health of the reporting systems.
In this section, we explore some examples of historical quotes analysis from the Amazon QuickSight dashboard.
The following chart shows the daily aggregation by sector of the weighted average bid-ask spreads of all the individual trades on NASDAQ and NYSE for 3 months. To calculate the average daily spread, each spread is weighted by the sum of the bid and the ask dollar volume. The query to generate this chart processes 103 billion of data points in total, joins each trade with the sector reference table, and runs in less than 10 seconds.

The following chart shows the daily aggregation of the weighted average bid-ask spreads of all the individual trades on NASDAQ and NYSE for 3 months. The calculation methodology and query performance metrics are similar to those of the preceding chart.

In this section, we explore some examples of historical trades analysis from the Amazon QuickSight dashboard.
The following chart shows the daily aggregation by sector of all the individual trades on NASDAQ and NYSE for 3 months. The query to generate this chart processes 3.6 billion of trades in total, joins each trade with the sector reference table, and runs in under 5 seconds.

The following chart shows the daily aggregation by exchange group of all the individual trades for 3 months. The query to generate this chart has similar performance metrics as the preceding chart.

Monitoring and observability is an important requirement for any critical business application such as trade reporting, risk management, and trade management systems. Apart from system-level metrics, it’s also important to monitor key performance indicators in real time so that operators can be alerted and respond as soon as possible to business-impacting events. For this demonstration, we have built dashboards in Grafana that monitor the delay of quote and trade data from the Kinesis data stream and Aurora, respectively.
The quote ingestion delay dashboard shows the amount of time it takes for each quote record to be ingested from the data stream and be available for querying in Amazon Redshift.

The trade ingestion delay dashboard shows the amount of time it takes for a transaction in Aurora to become available in Amazon Redshift for querying.

To clean up your resources, delete the stack you deployed using AWS CloudFormation. For instructions, refer to Deleting a stack on the AWS CloudFormation console.
Increasing volumes of trading activity, more complex risk management, and enhanced regulatory requirements are leading capital markets firms to embrace real-time and near-real-time data processing, even in mid- and back-office platforms where end of day and overnight processing was the standard. In this post, we demonstrated how you can use Amazon Redshift capabilities for ease of use, low maintenance, and cost-efficiency. We also discussed cross-service integrations to ingest streaming market data, process updates from OLTP databases, and use third-party reference data without having to perform complex and expensive ETL or ELT processing before making the data available for analysis and reporting.
Please reach out to us if you need any guidance in implementing this solution. Refer to Real-time analytics with Amazon Redshift streaming ingestion, Getting started guide for near-real time operational analytics using Amazon Aurora zero-ETL integration with Amazon Redshift, and Working with AWS Data Exchange data shares as a producer for more information.
 Satesh Sonti is a Sr. Analytics Specialist Solutions Architect based out of Atlanta, specialized in building enterprise data platforms, data warehousing, and analytics solutions. He has over 18 years of experience in building data assets and leading complex data platform programs for banking and insurance clients across the globe.
 Alket Memushaj works as a Principal Architect in the Financial Services Market Development team at AWS. Alket is responsible for technical strategy for capital markets, working with partners and customers to deploy applications across the trade lifecycle to the AWS Cloud, including market connectivity, trading systems, and pre- and post-trade analytics and research platforms.
 Ruben Falk is a Capital Markets Specialist focused on AI and data & analytics. Ruben consults with capital markets participants on modern data architecture and systematic investment processes. He joined AWS from S&P Global Market Intelligence where he was Global Head of Investment Management Solutions.
 Jeff Wilson is a World-wide Go-to-market Specialist with 15 years of experience working with analytic platforms. His current focus is sharing the benefits of using Amazon Redshift, Amazon’s native cloud data warehouse. Jeff is based in Florida and has been with AWS since 2019.
Post Syndicated from Shijian Tang original https://aws.amazon.com/blogs/big-data/preprocess-and-fine-tune-llms-quickly-and-cost-effectively-using-amazon-emr-serverless-and-amazon-sagemaker/
Large language models (LLMs) are becoming increasing popular, with new use cases constantly being explored. In general, you can build applications powered by LLMs by incorporating prompt engineering into your code. However, there are cases where prompting an existing LLM falls short. This is where model fine-tuning can help. Prompt engineering is about guiding the model’s output by crafting input prompts, whereas fine-tuning is about training the model on custom datasets to make it better suited for specific tasks or domains.
Before you can fine-tune a model, you need to find a task-specific dataset. One dataset that is commonly used is the Common Crawl dataset. The Common Crawl corpus contains petabytes of data, regularly collected since 2008, and contains raw webpage data, metadata extracts, and text extracts. In addition to determining which dataset should be used, cleansing and processing the data to the fine-tuning’s specific need is required.
We recently worked with a customer who wanted to preprocess a subset of the latest Common Crawl dataset and then fine-tune their LLM with cleaned data. The customer was looking for how they could achieve this in the most cost-effective way on AWS. After discussing the requirements, we recommended using Amazon EMR Serverless as their platform for data preprocessing. EMR Serverless is well suited for large-scale data processing and eliminates the need for infrastructure maintenance. In terms of cost, it only charges based on the resources and duration used for each job. The customer was able to preprocess hundreds of TBs of data within a week using EMR Serverless. After they preprocessed the data, they used Amazon SageMaker to fine-tune the LLM.
In this post, we walk you through the customer’s use case and architecture used.
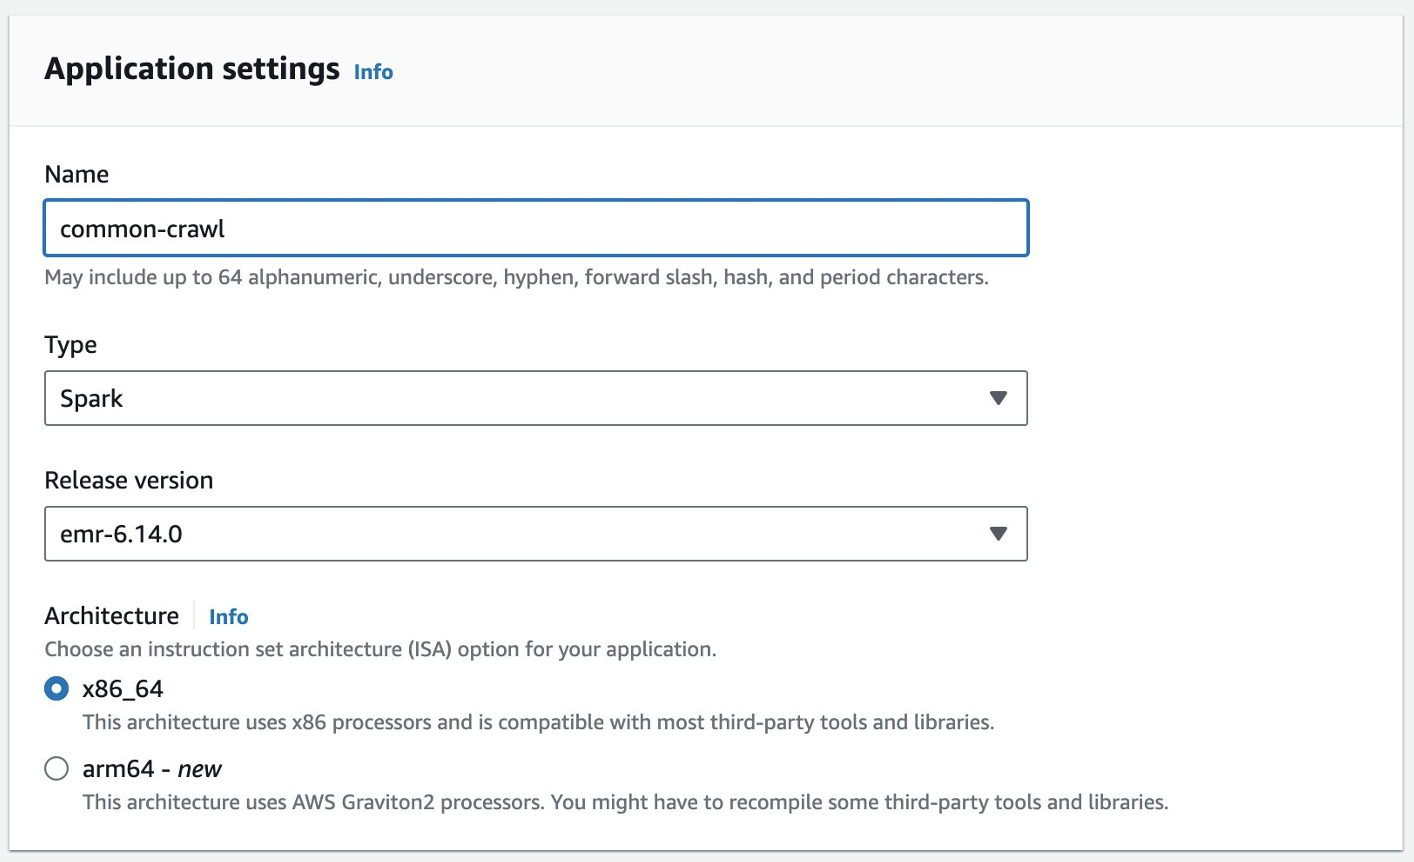
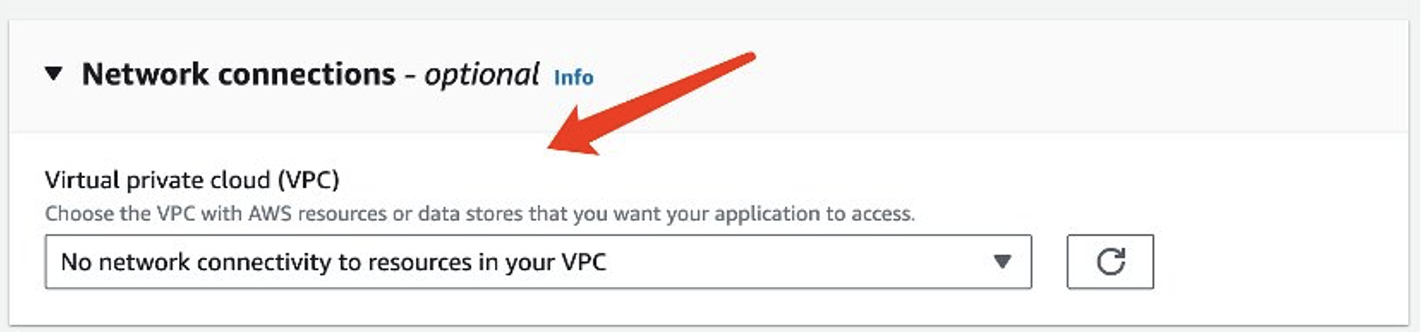
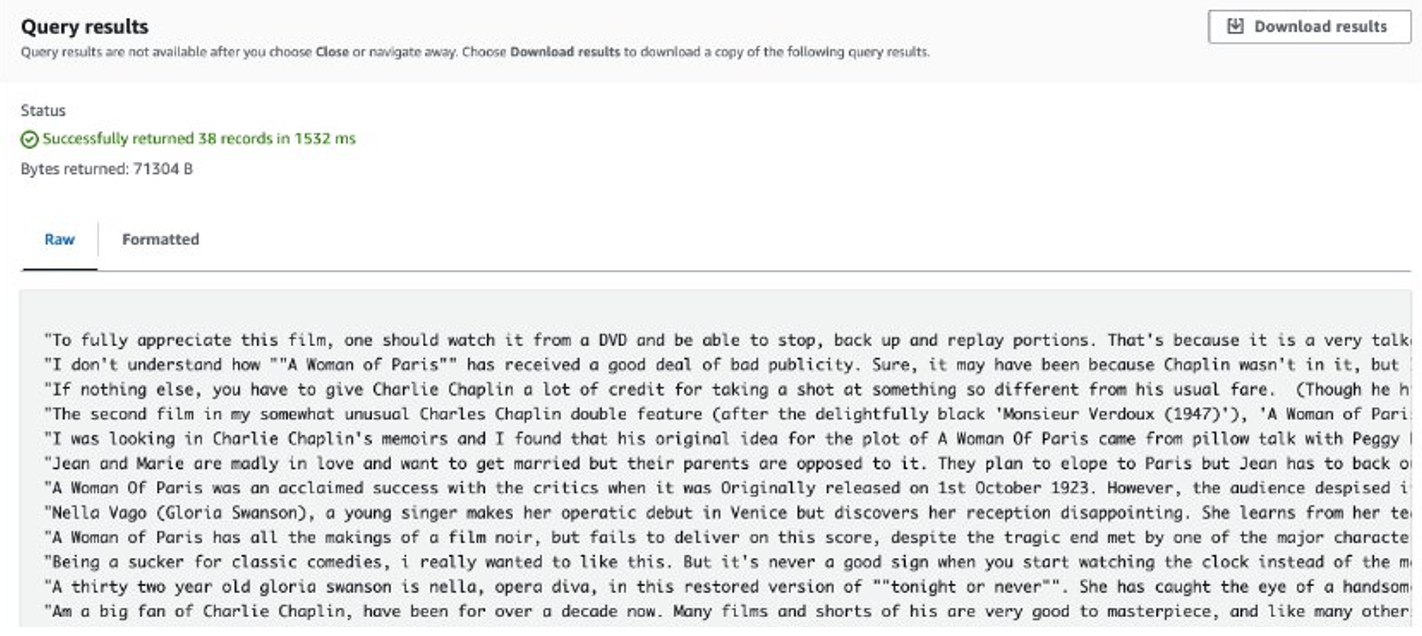
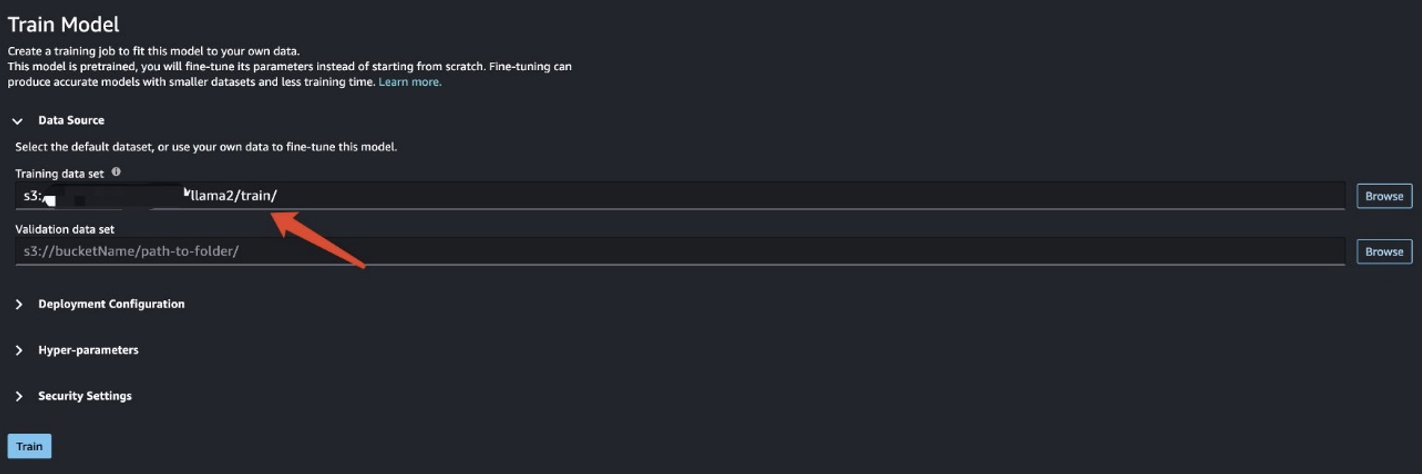
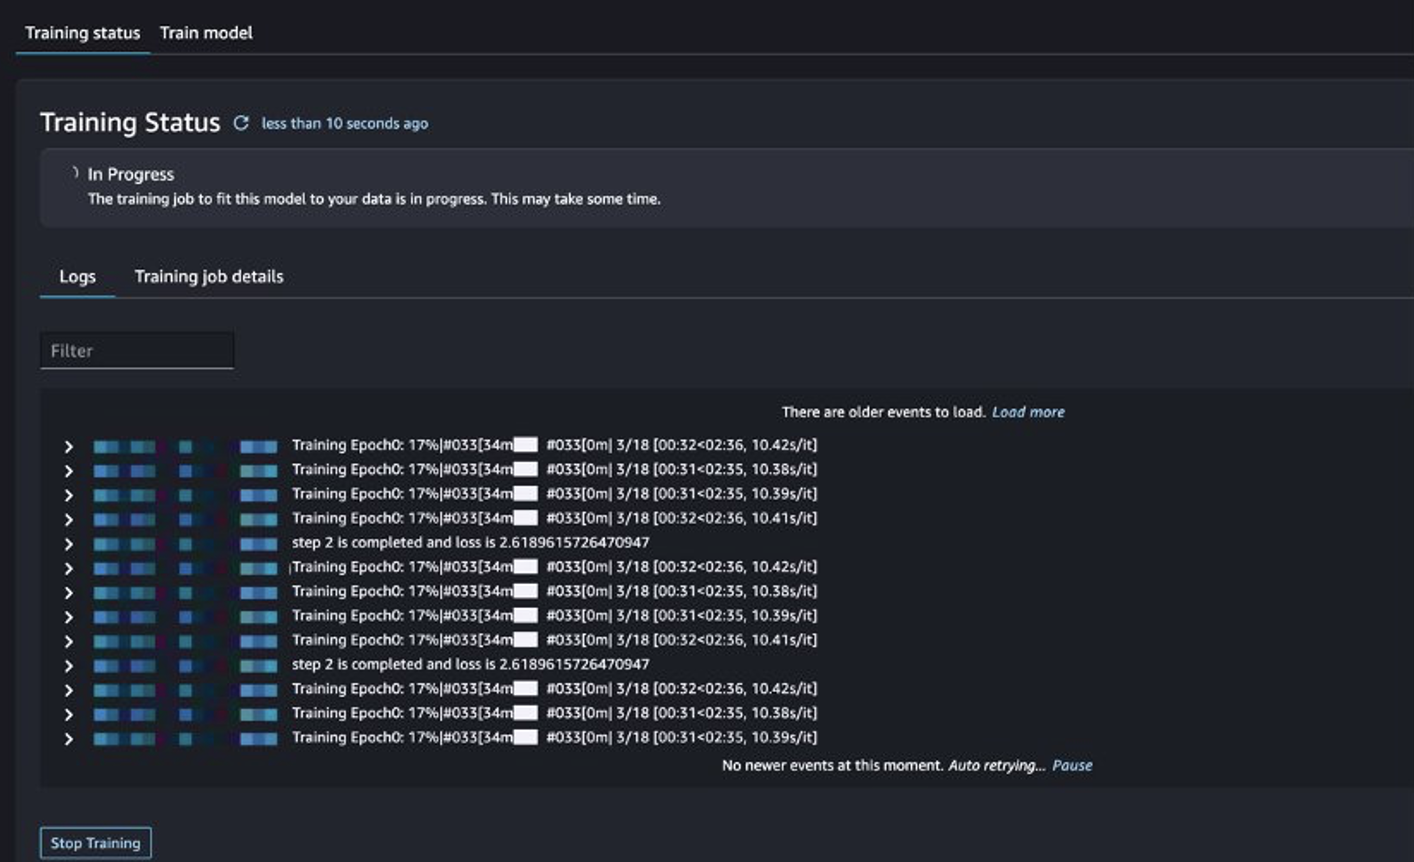
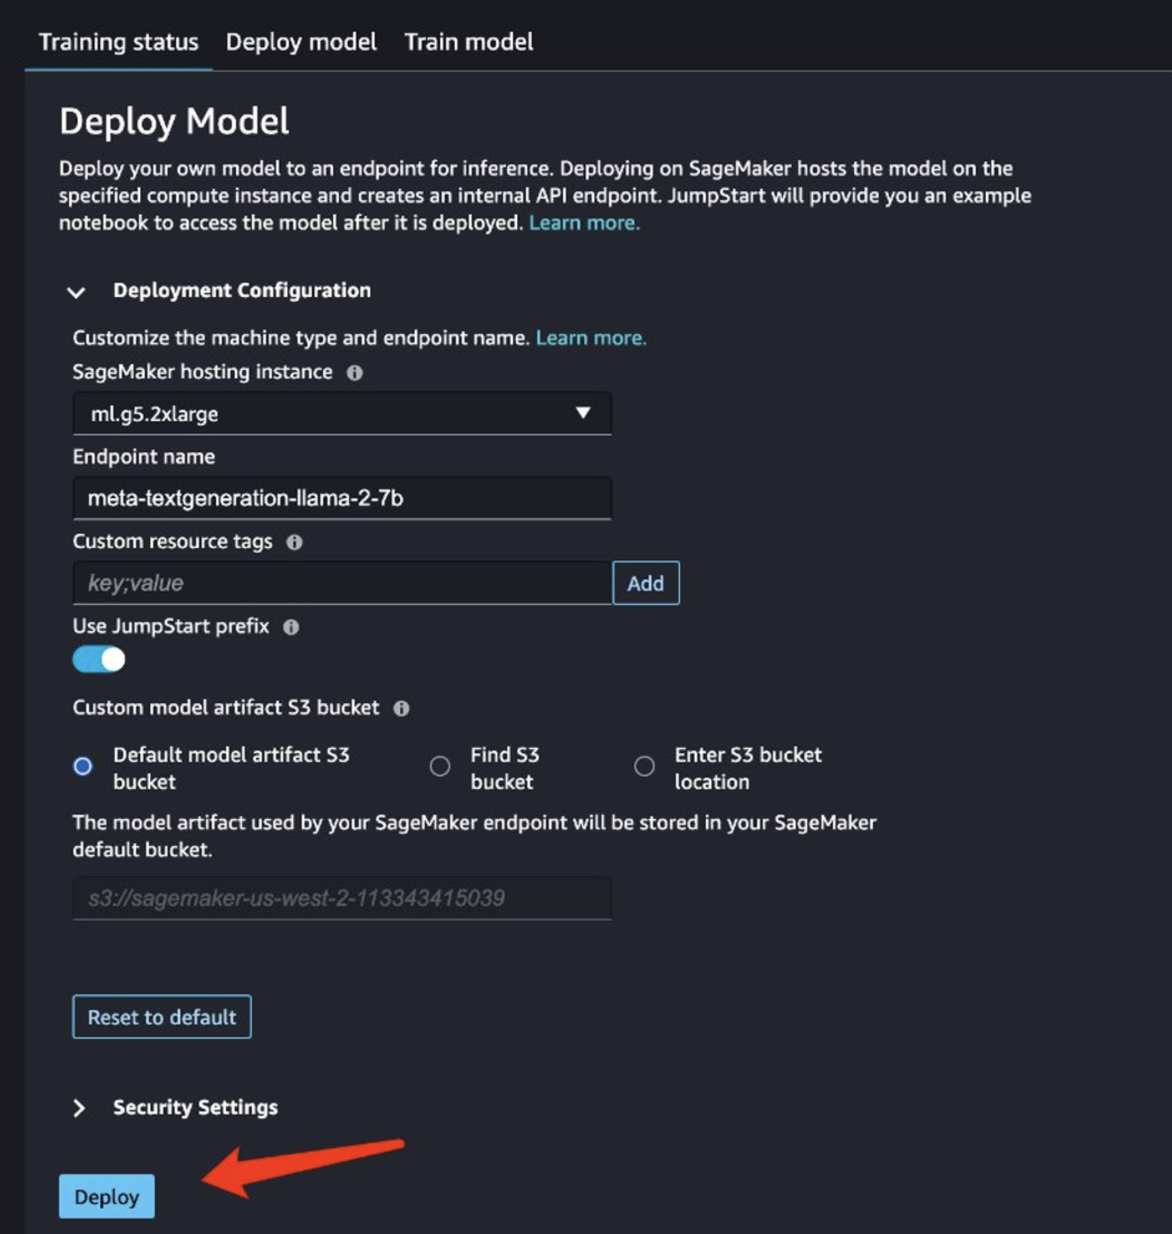
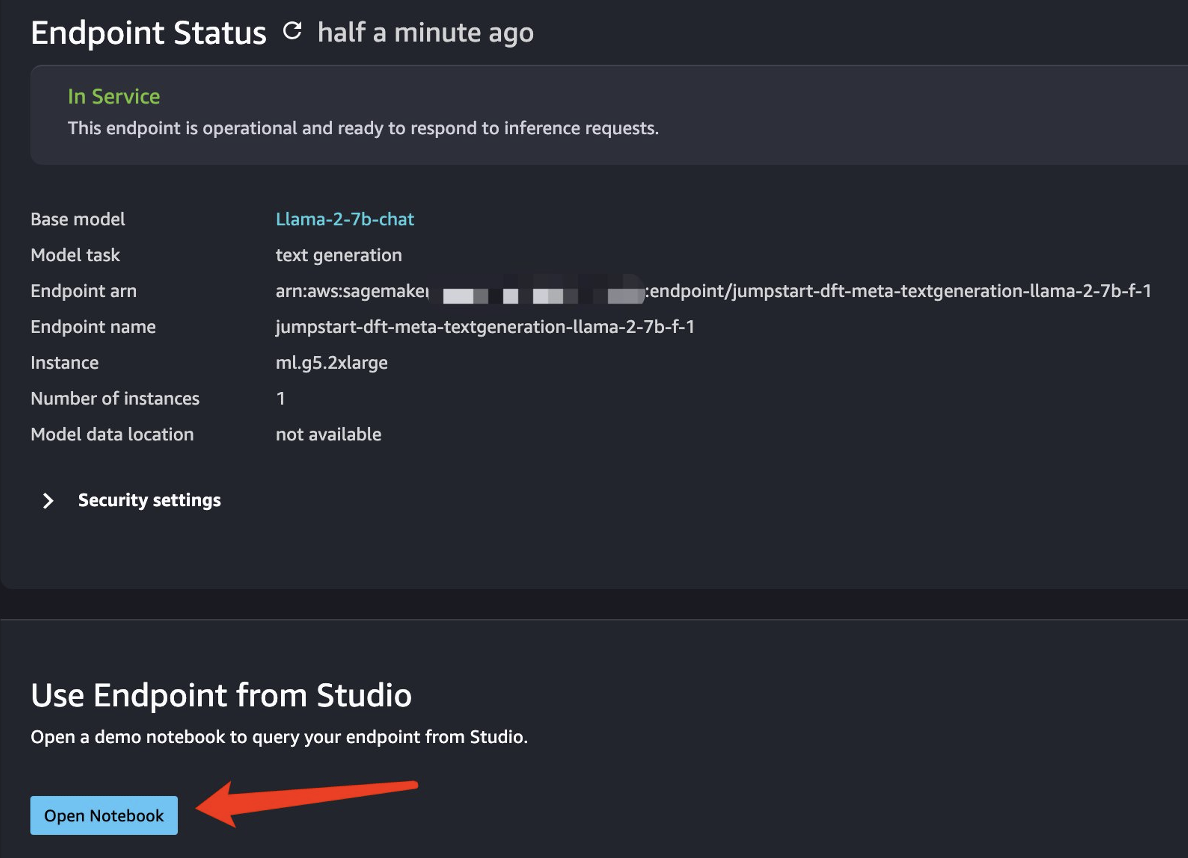
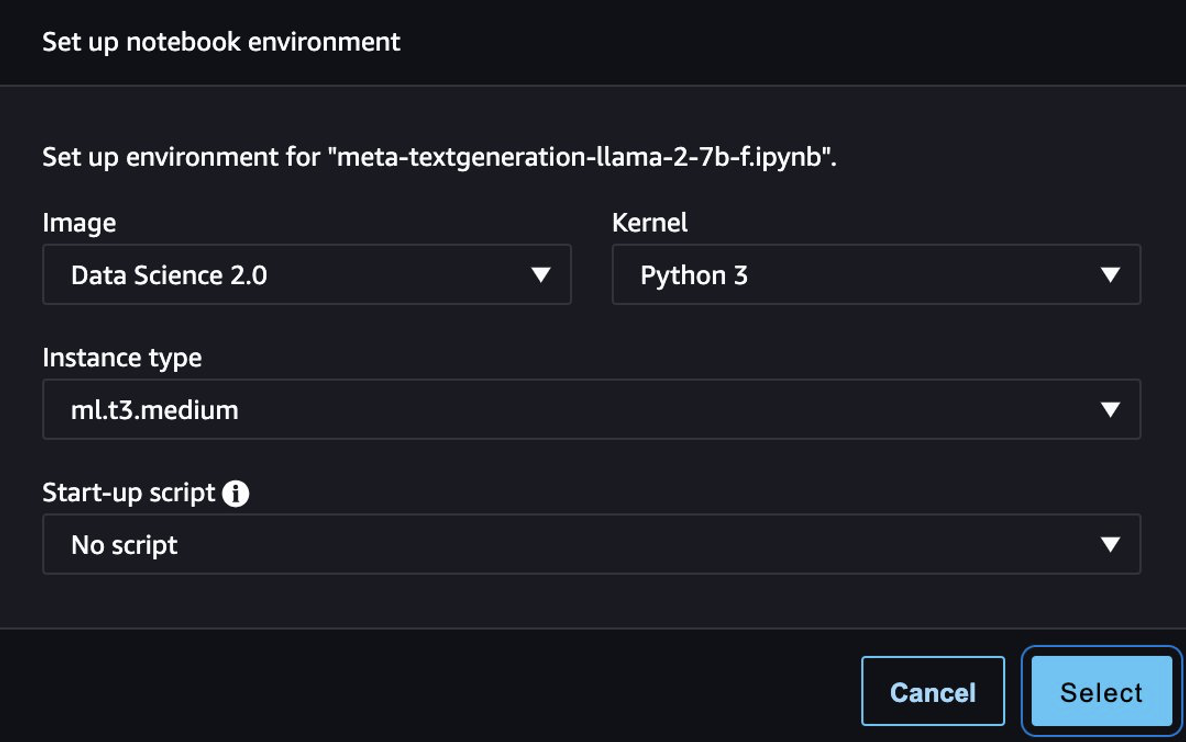
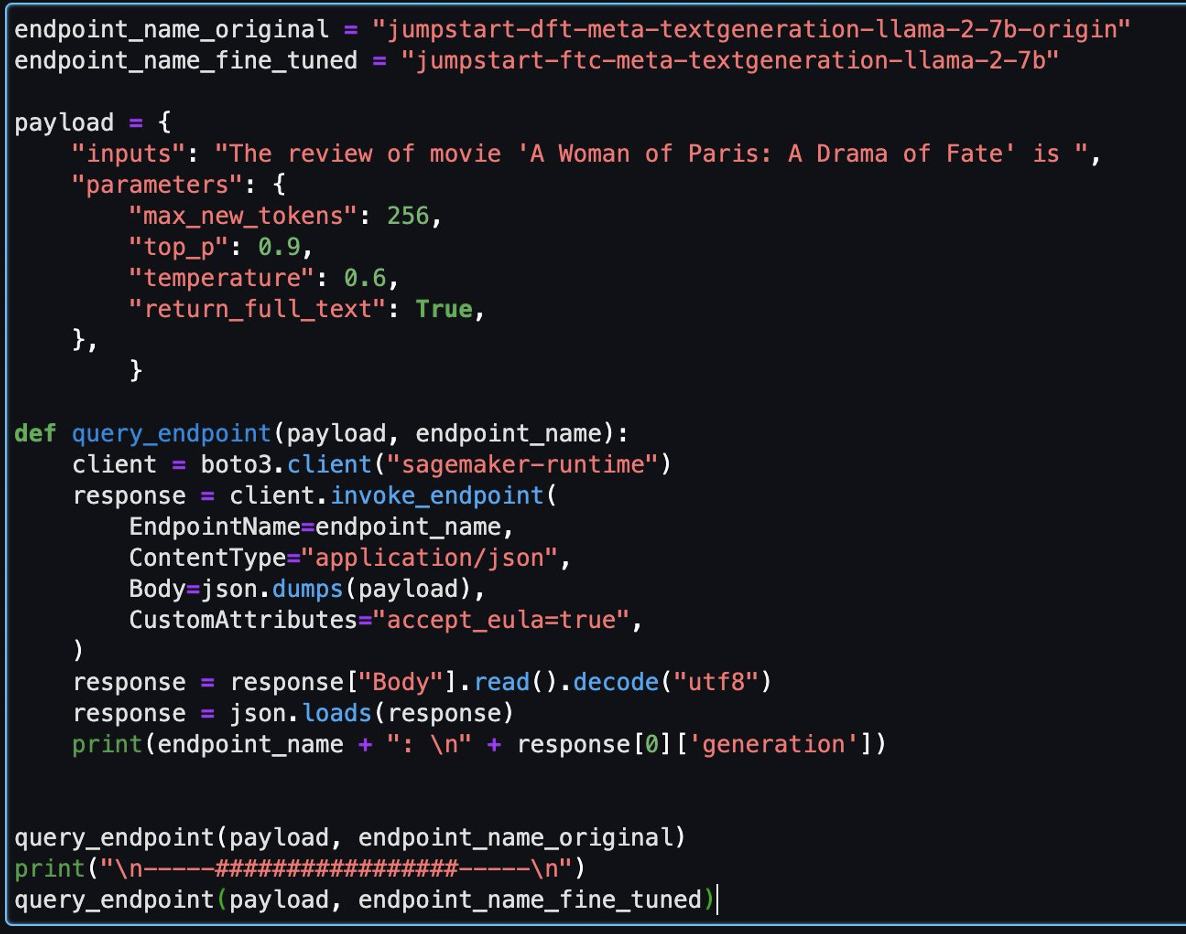
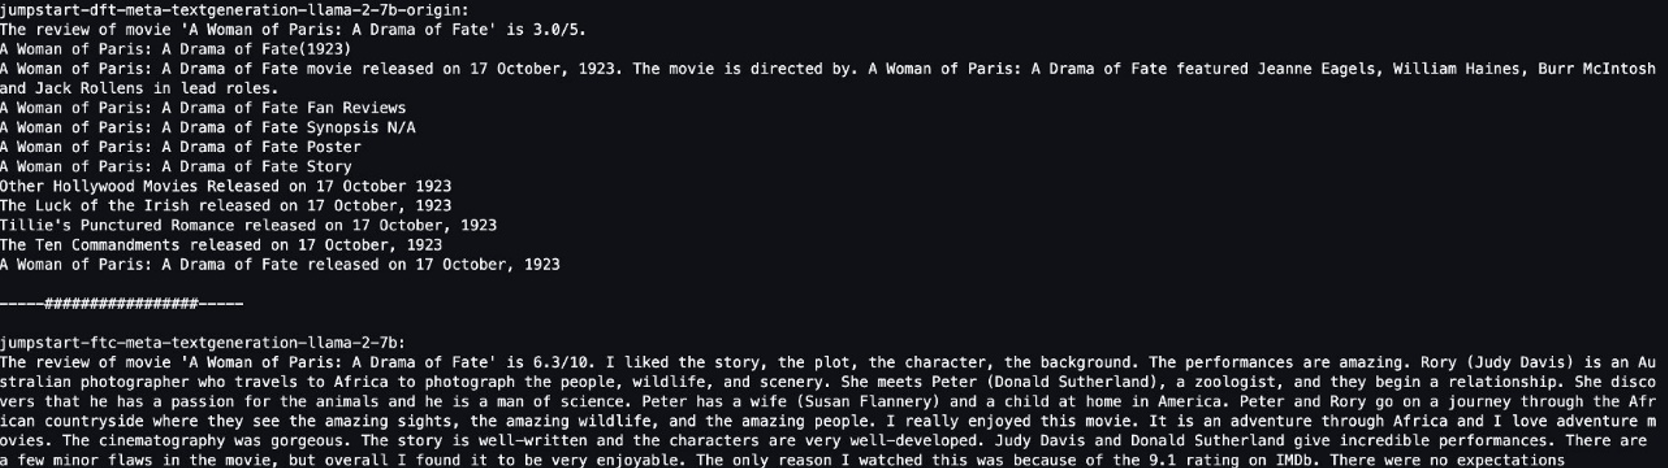
In the following sections, we first introduce the Common Crawl dataset and how to explore and filter the data we need. Amazon Athena only charges for the data size it scans and is used to explore and filter the data quickly, while being cost-effective. EMR Serverless provides a cost-efficient and no-maintenance option for Spark data processing, and is used to process the filtered data. Next, we use Amazon SageMaker JumpStart to fine-tune the Llama 2 model with the preprocessed dataset. SageMaker JumpStart provides a set of solutions for the most common use cases that can be deployed with just a few clicks. You don’t need to write any code to fine-tune an LLM such as Llama 2. Finally, we deploy the fine-tuned model using Amazon SageMaker and compare the differences in text output for the same question between the original and fine-tuned Llama 2 models.
The following diagram illustrates the architecture of this solution.

Before you dive deep into the solution details, complete the following prerequisite steps:
Common Crawl is an open corpus dataset obtained by crawling over 50 billion webpages. It includes massive amounts of unstructured data in multiple languages, starting from 2008 and reaching the petabyte level. It is continuously updated.
In the training of GPT-3, the Common Crawl dataset accounts for 60% of its training data, as shown in the following diagram (source: Language Models are Few-Shot Learners).

Another important dataset worth mentioning is the C4 dataset. C4, short for Colossal Clean Crawled Corpus, is a dataset derived from postprocessing the Common Crawl dataset. In Meta’s LLaMA paper, they outlined the datasets used, with Common Crawl accounting for 67% (utilizing 3.3 TB of data) and C4 for 15% (utilizing 783 GB of data). The paper emphasizes the significance of incorporating differently preprocessed data for enhancing model performance. Despite the original C4 data being part of Common Crawl, Meta opted for the reprocessed version of this data.
In this section, we cover common ways to interact, filter, and process the Common Crawl dataset.
The Common Crawl raw dataset includes three types of data files: raw webpage data (WARC), metadata (WAT), and text extraction (WET).
Data collected after 2013 is stored in WARC format and includes corresponding metadata (WAT) and text extraction data (WET). The dataset is located in Amazon S3, updated on a monthly basis, and can be accessed directly through AWS Marketplace.
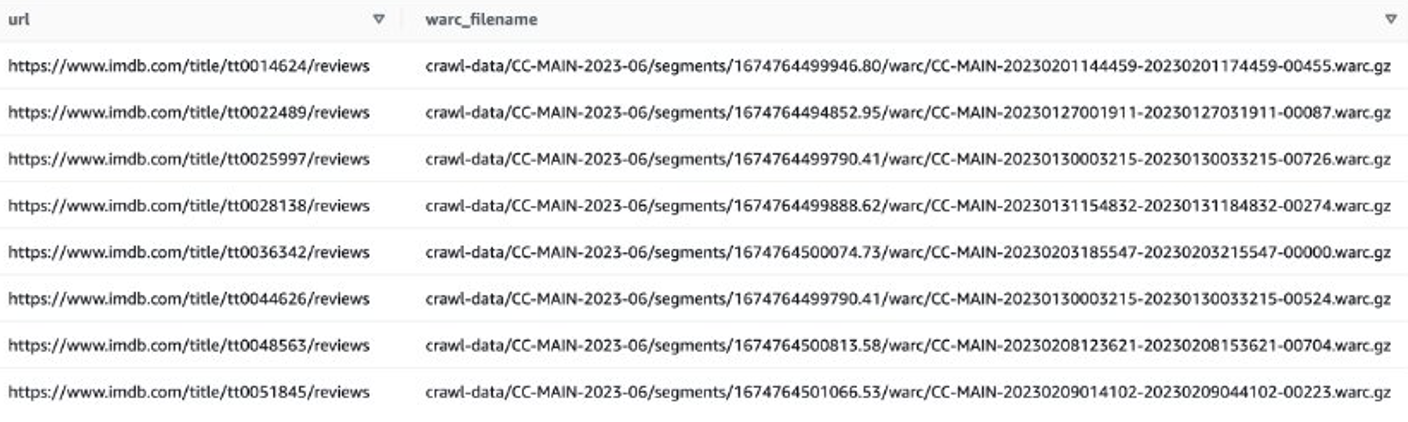
For example, the following snippet is data from June of 2023:
The Common Crawl dataset also provides an index table for filtering data, which is called cc-index-table.
The cc-index-table is an index of the existing data, providing a table-based index of WARC files. It allows for easy lookup of information, such as which WARC file corresponds to a specific URL.
The Common Crawl GitHub repo provides corresponding Athena statements to query the index. For explanations of each field, refer to Common Crawl Index Athena.
For example, you can create an Athena table to map cc-index data with the following code:
Post Syndicated from Molly Clancy original https://www.backblaze.com/blog/whats-diff-ram-vs-storage/

Memory is a finite resource when it comes to both humans and computers—it’s one of the most common causes of computer issues. And if you’ve ever left the house without your keys, you know memory is one of the most common human problems, too.
If you’re unclear about the different types of memory in your computer, it makes pinpointing the cause of computer problems that much harder. You might hear folks use the terms memory and storage interchangeably, but there are some important differences. Understanding how both components work can help you understand what kind of computer you need, diagnose problems you’re having, and know when it’s time to consider upgrades.
Random access memory (RAM) and storage are both forms of computer memory, but they serve different functions.
RAM is volatile memory used by the computer’s processor to store and quickly access data that is actively being used or processed. Volatile memory maintains data only while the device is powered on. RAM takes the form of computer chips—integrated circuits—that are either soldered directly onto the main logic board of your computer or installed in memory modules that go in sockets on your computer’s logic board.
You can think of it like a desk—it’s where your computer gets work done. When you double-click on an app, open a document, or do much of anything, part of your “desk” is covered and can’t be used by anything else. As you open more files, it is like covering your desk with more and more items. Using a desk with a handful of files is easy, but a desk that is covered with a bunch of stuff gets difficult to use.
On the other hand, storage is used for long-term data retention, like a hard disk drive (HDD) or solid state drive (SSD). Compared with RAM, this type of storage is non-volatile, which means it retains information even when a device is powered off. You can think of storage like a filing cabinet—a place next to your desk where you can retrieve information as needed.
Two of the primary differences between RAM and storage are speed and performance. RAM is significantly faster than storage. Data stored in RAM can be written and accessed almost instantly, so it’s very fast—milliseconds fast. DDR4 RAM, one of the newer types of RAM technology, is capable of a peak transfer rate of 25.6GB/s! RAM has a very fast path to the computer’s central processing unit (CPU), the brain of the computer that does most of the work.
Storage, as it’s slower in comparison, is responsible for holding the operating system (OS), applications, and user data for the long term—it should still be fast, but it doesn’t need to be as fast as RAM.
That said, computer storage is getting faster thanks to the popularity of SSDs. SSDs are much faster than hard drives since they use integrated circuits instead of mechanical platters that have to be read sequentially, like HDDs. SSDs use a special type of memory circuitry called non-volatile RAM (NVRAM) to store data, so those shorter term memory access points stay in place even when the computer is turned off.
Even though SSDs are faster than HDDs, they’re still slower than RAM. There are two reasons for that difference in speed. First, the memory chips in SSDs are slower than those in RAM. Second, there is a bottleneck created by the interface that connects the storage device to the computer. RAM, in comparison, has a much faster interface.
RAM is typically smaller in capacity compared to storage. It is measured in gigabytes (GB) or terabytes (TB), whereas storage capacities can reach multiple terabytes or even petabytes. The smaller size of RAM is intentional, as it is designed to store only the data currently in use, ensuring quick access for the processor.
Another key difference is the volatility of RAM and the persistence of storage. RAM is volatile, meaning it loses its data when the power is turned off or the system is rebooted. This makes it ideal for quick data access and manipulation, but unsuitable for long-term storage. Storage is non-volatile or persistent, meaning it retains data even when the power is off, making it suitable for holding files, applications, and the operating system over extended periods.
Understanding how much RAM you have might be one of your first steps for diagnosing computer performance issues.
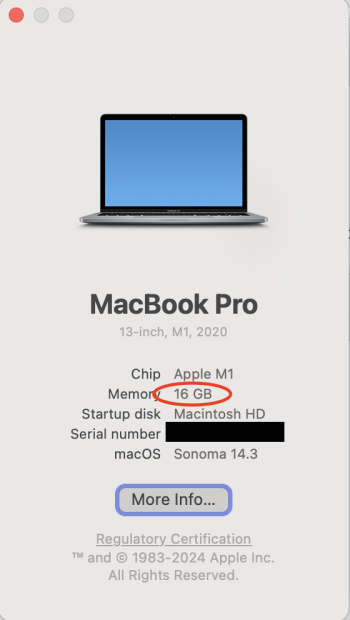
Use the following steps to confirm how much RAM your computer has installed. We’ll start with an Apple computer. Click on the Apple menu and then click About This Mac. In the screenshot below, we can see that the computer has 16GB of RAM.
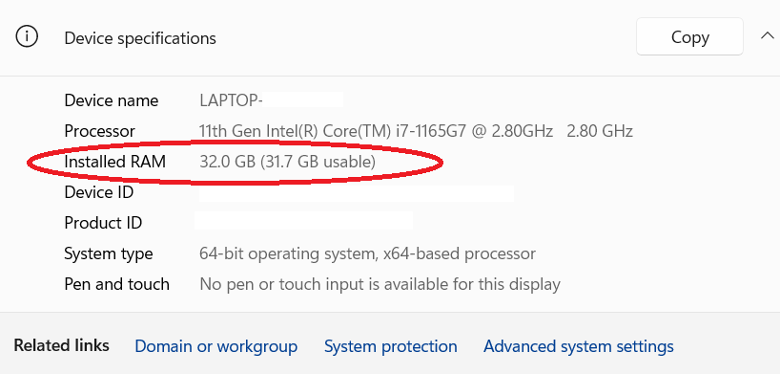
With a Windows 11 computer, use the following steps to see how much RAM you have installed. Open the Control Panel by clicking the Windows button and typing “control panel,” then click System and Security, and then click System. Look for the line “Installed RAM.” In the screenshot below, you can see that the computer has 32GB of RAM installed.
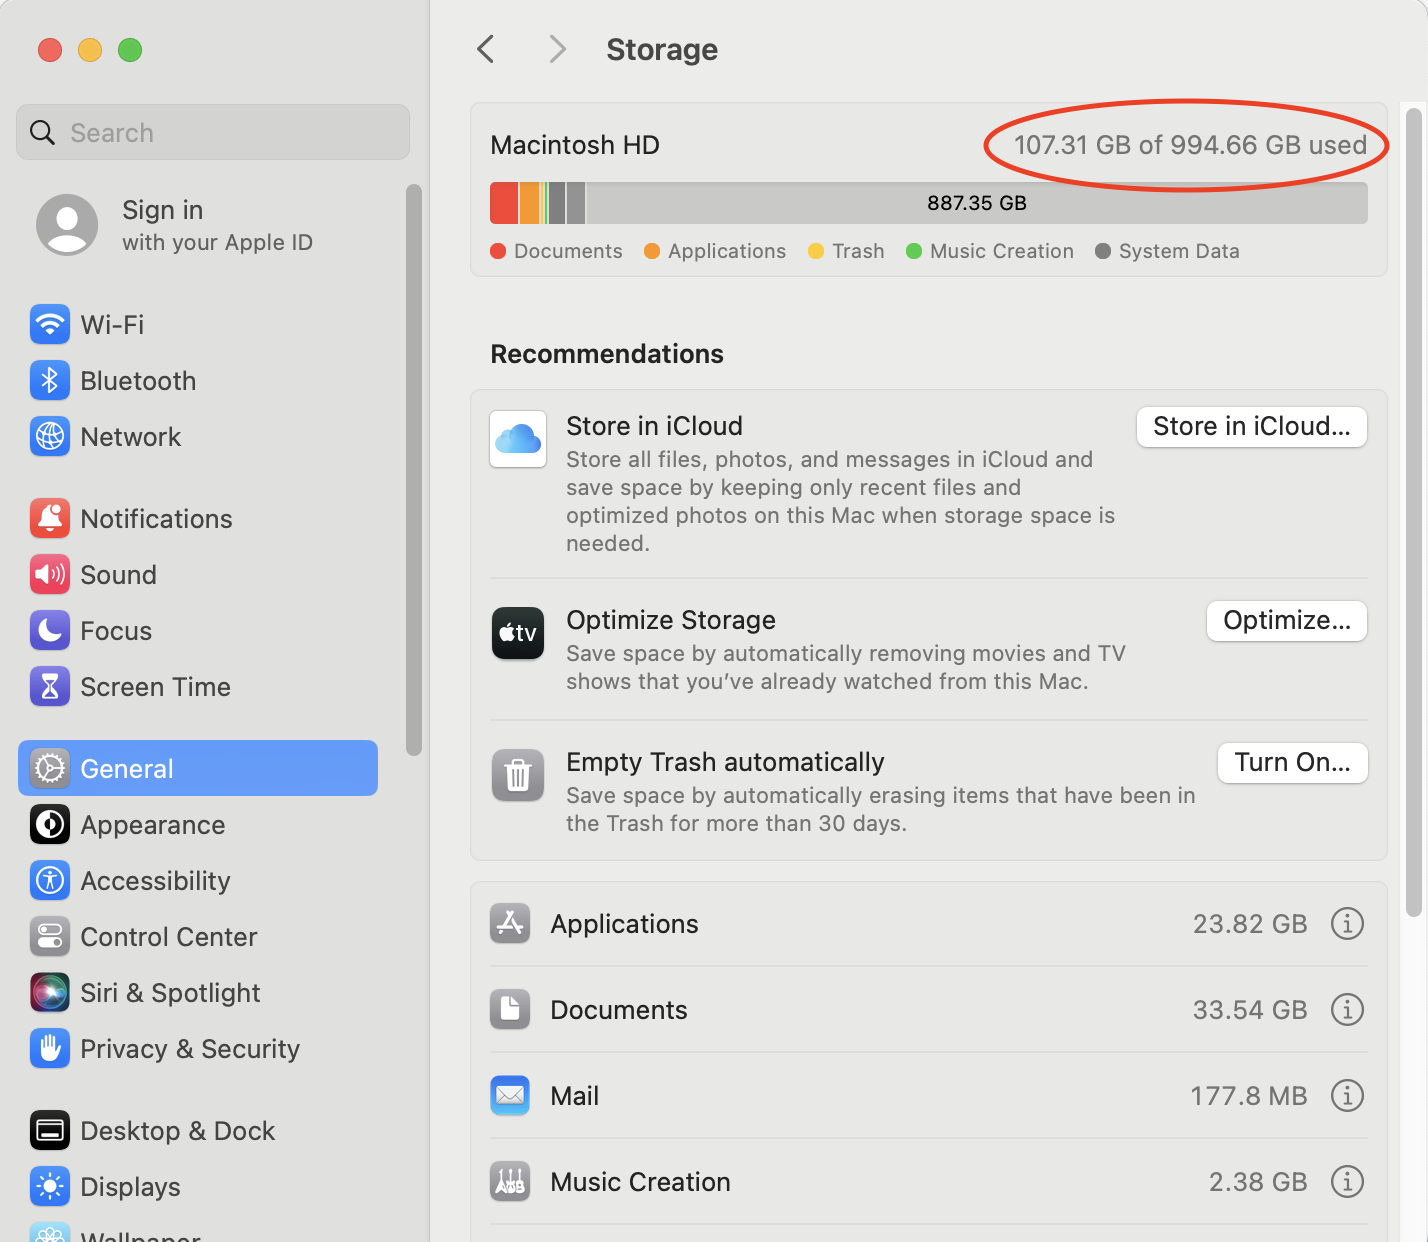
To view how much free storage space you have available on a Mac computer, use these steps. Click on the Apple menu, then System Settings, select General, and then open Storage. In the screenshot below, we’ve circled where your available storage is displayed.
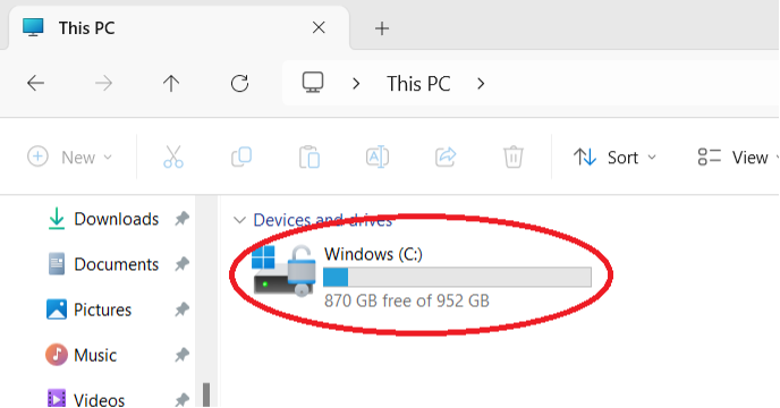
With a Windows 11 computer, it is also easy to view how much available storage space you have. Click the Windows button and type in “file explorer.” When File Explorer opens, click on This PC from the list of options in the left-hand pane. In the screenshot below, we’ve circled where your available storage is displayed (in this case, 200GB).
For most general-purpose uses of computers—email, writing documents, surfing the web, or watching Netflix—the RAM that comes with our computer is enough. If you own your computer for a long enough time, you might need to add a bit more to keep up with memory demands from newer apps and OSes. Specifically, more RAM makes it possible for you to use more apps, documents, and larger files at the same time.
People that work with very large files like large databases, videos, and images can benefit significantly from having more RAM. If you regularly use large files, it is worth checking to see if your computer’s RAM is upgradeable.
In some situations, adding more RAM is worth the expense. For example, editing videos and high-resolution images takes a lot of memory. In addition, high-end audio recording and editing as well as some scientific work require significant RAM.
However, not all computers allow you to upgrade RAM. For example, the Chromebook typically has a fixed amount of RAM, and you cannot install more. So, when you’re buying a new computer—particularly if you plan on using that computer for more than five years, make sure to 1) understand how much RAM your computer has, and, 2) if you can upgrade the computer’s RAM.
When your computer’s RAM is filled up, your computer has to get creative to keep working. Specifically, your computer starts to temporarily use your hard drive or SSD as “virtual memory.” If you have relatively fast storage like an SSD, virtual memory will be fast. On the other hand, using a traditional hard drive will be fairly slow.
Besides RAM, the most serious bottleneck to improving performance in your computer can be your storage. Even with plenty of RAM installed, computers need to read and write information from the storage system (i.e., the HDD or the SSD).
Hard drives come in different speeds and sizes. For laptops and desktops, the most common RPM rates are between 5400–7200RPM. In some cases, you might even decide to use a 10,000RPM drive. Faster drives cost more, are louder, have greater cooling needs, and use more power, but they may be a good option.
New disk technologies enable hard drives to be bigger and faster. These technologies include filling the drive with helium instead of air to reduce disk platter friction and using heat or microwaves to improve disk density, such as with heat-assisted magnetic recording (HAMR) drives and microwave-assisted magnetic recording (MAMR) drives.
Today, SSDs are becoming increasingly popular for computer storage. This type of computer storage is popular because it is faster, cooler, and takes up less space than traditional hard drives. They’re also less susceptible to magnetic fields and physical jolts, which makes them great for laptops.
For more about the difference between HDDs and SSDs, check out our post, “Hard Disk Drive (HDD) vs. Solid-state Drive (SSD): What’s the Diff?”
As a user’s disk storage needs increase, typically they will look to larger drives to store more data. The first step might be to replace an existing drive with a larger, faster drive. Or you might decide to install a second drive. One approach is to use different drives for different purposes. For example, use an SSD for the operating system, and then store your business videos on a larger SSD.
If more storage space is needed, you can also use an external drive, most often using USB or Thunderbolt to connect to the computer. This can be a single drive or multiple drives and might use a data storage virtualization technology such as RAID to protect the data.
If you have really large amounts of data, or simply wish to make it easy to share data with others in your location or elsewhere, you might consider network-attached storage (NAS). A NAS device can hold multiple drives, typically uses a data virtualization technology like RAID, and is accessible to anyone on your local network and—if you wish—on the internet, as well. NAS devices can offer a great deal of storage and other services that typically have been offered only by dedicated network servers in the past.
As a cloud storage company, we’d be remiss not to mention that you should back up your computer. No matter how you configure your computer’s storage, remember that technology can fail (we know a thing or two about that). You always want a backup so you can restore everything easily. The best backup strategy shouldn’t be dependent on any single device, either. Your backup strategy should always include three copies of your data on two different mediums with one off-site.
Internal storage is a method of data storage that writes data to a disk, holding onto that data until it’s erased. Think of it as your computer’s brain. RAM is a method of communicating data between your device’s CPU and its internal storage. Think of it as your brain’s short-term memory and ability to multi-task. The data the RAM receives is volatile, so it will only last until it’s no longer needed, usually when you turn off the power or reset the computer.
If you’re looking for better PC performance, you can upgrade either RAM or storage for a boost in performance. More RAM will make it easier for your computer to perform multiple tasks at once, while upgrading your storage will improve battery life, make it faster to open applications and files, and give you more space for photos and applications. This is especially true if you’re switching your storage from a hard disk drive (HDD) to a solid state drive (SSD).
More RAM does not provide you with more free space. If your computer is giving you notifications that you’re getting close to running out of storage or you’ve already started having to delete files to make room for new ones, you should upgrade the internal storage, not the RAM.
Memory and storage are also not the same thing, even though the words are often used interchangeably. Memory is another term for RAM.
The post What’s the Diff: RAM vs. Storage appeared first on Backblaze Blog | Cloud Storage & Cloud Backup.
Post Syndicated from corbet original https://lwn.net/Articles/960088/
Filesystem development is not an easy task; the performance demands are
typically high, and the consequences for mistakes usually involve lost data
and irate users. The implementation of a virtual (or “pseudo”) filesystem
— a filesystem implemented within the kernel and lacking a normal backing
store — can also be challenging, but for different reasons. A series of
conversations around the eventfs virtual filesystem has turned a spotlight
on the difficulty of creating a virtual filesystem for Linux.
Post Syndicated from The Hook Up original https://www.youtube.com/watch?v=y3qL9o7CvEA
Post Syndicated from BeardedTinker original https://www.youtube.com/watch?v=UButm1BuVMc
Post Syndicated from corbet original https://lwn.net/Articles/960446/
A new version of the Damn Small
Linux distribution has come out with an updated definition of “damn
small”:
The new goal of DSL is to pack as much usable desktop distribution
into an image small enough to fit on a single CD, or a hard limit
of 700MB. This project is meant to service older computers and have
them continue to be useful far into the future. Such a notion sits
well with my values. I think of this project as my way of keeping
otherwise usable hardware out of landfills.
Post Syndicated from jake original https://lwn.net/Articles/960439/
The 6.7.3, 6.6.15, and 6.1.76 stable kernels have been released.
These contain a large number of important fixes throughout the tree, as is
the norm.

 Shijian Tang is a Analytics Specialist Solution Architect at Amazon Web Services.
 Matthew Liem is a Senior Solution Architecture Manager at Amazon Web Services.
 Dalei Xu is a Analytics Specialist Solution Architect at Amazon Web Services.
 Yuanjun Xiao is a Senior Solution Architect at Amazon Web Services.