There’s a particular energy to mid-September in New York. Pumpkin spice lattes are flowing, temperatures are dropping, and it’s nearly sweater weather. The city is back at full speed, and so is the AWS launch calendar. This week that energy showed up in a new frontier model on Amazon Bedrock, a desktop app for Amazon Quick, and a reminder that the developers seeing the biggest gains from AI agents aren’t just using better tools — they’re working differently.
Let’s dive in.
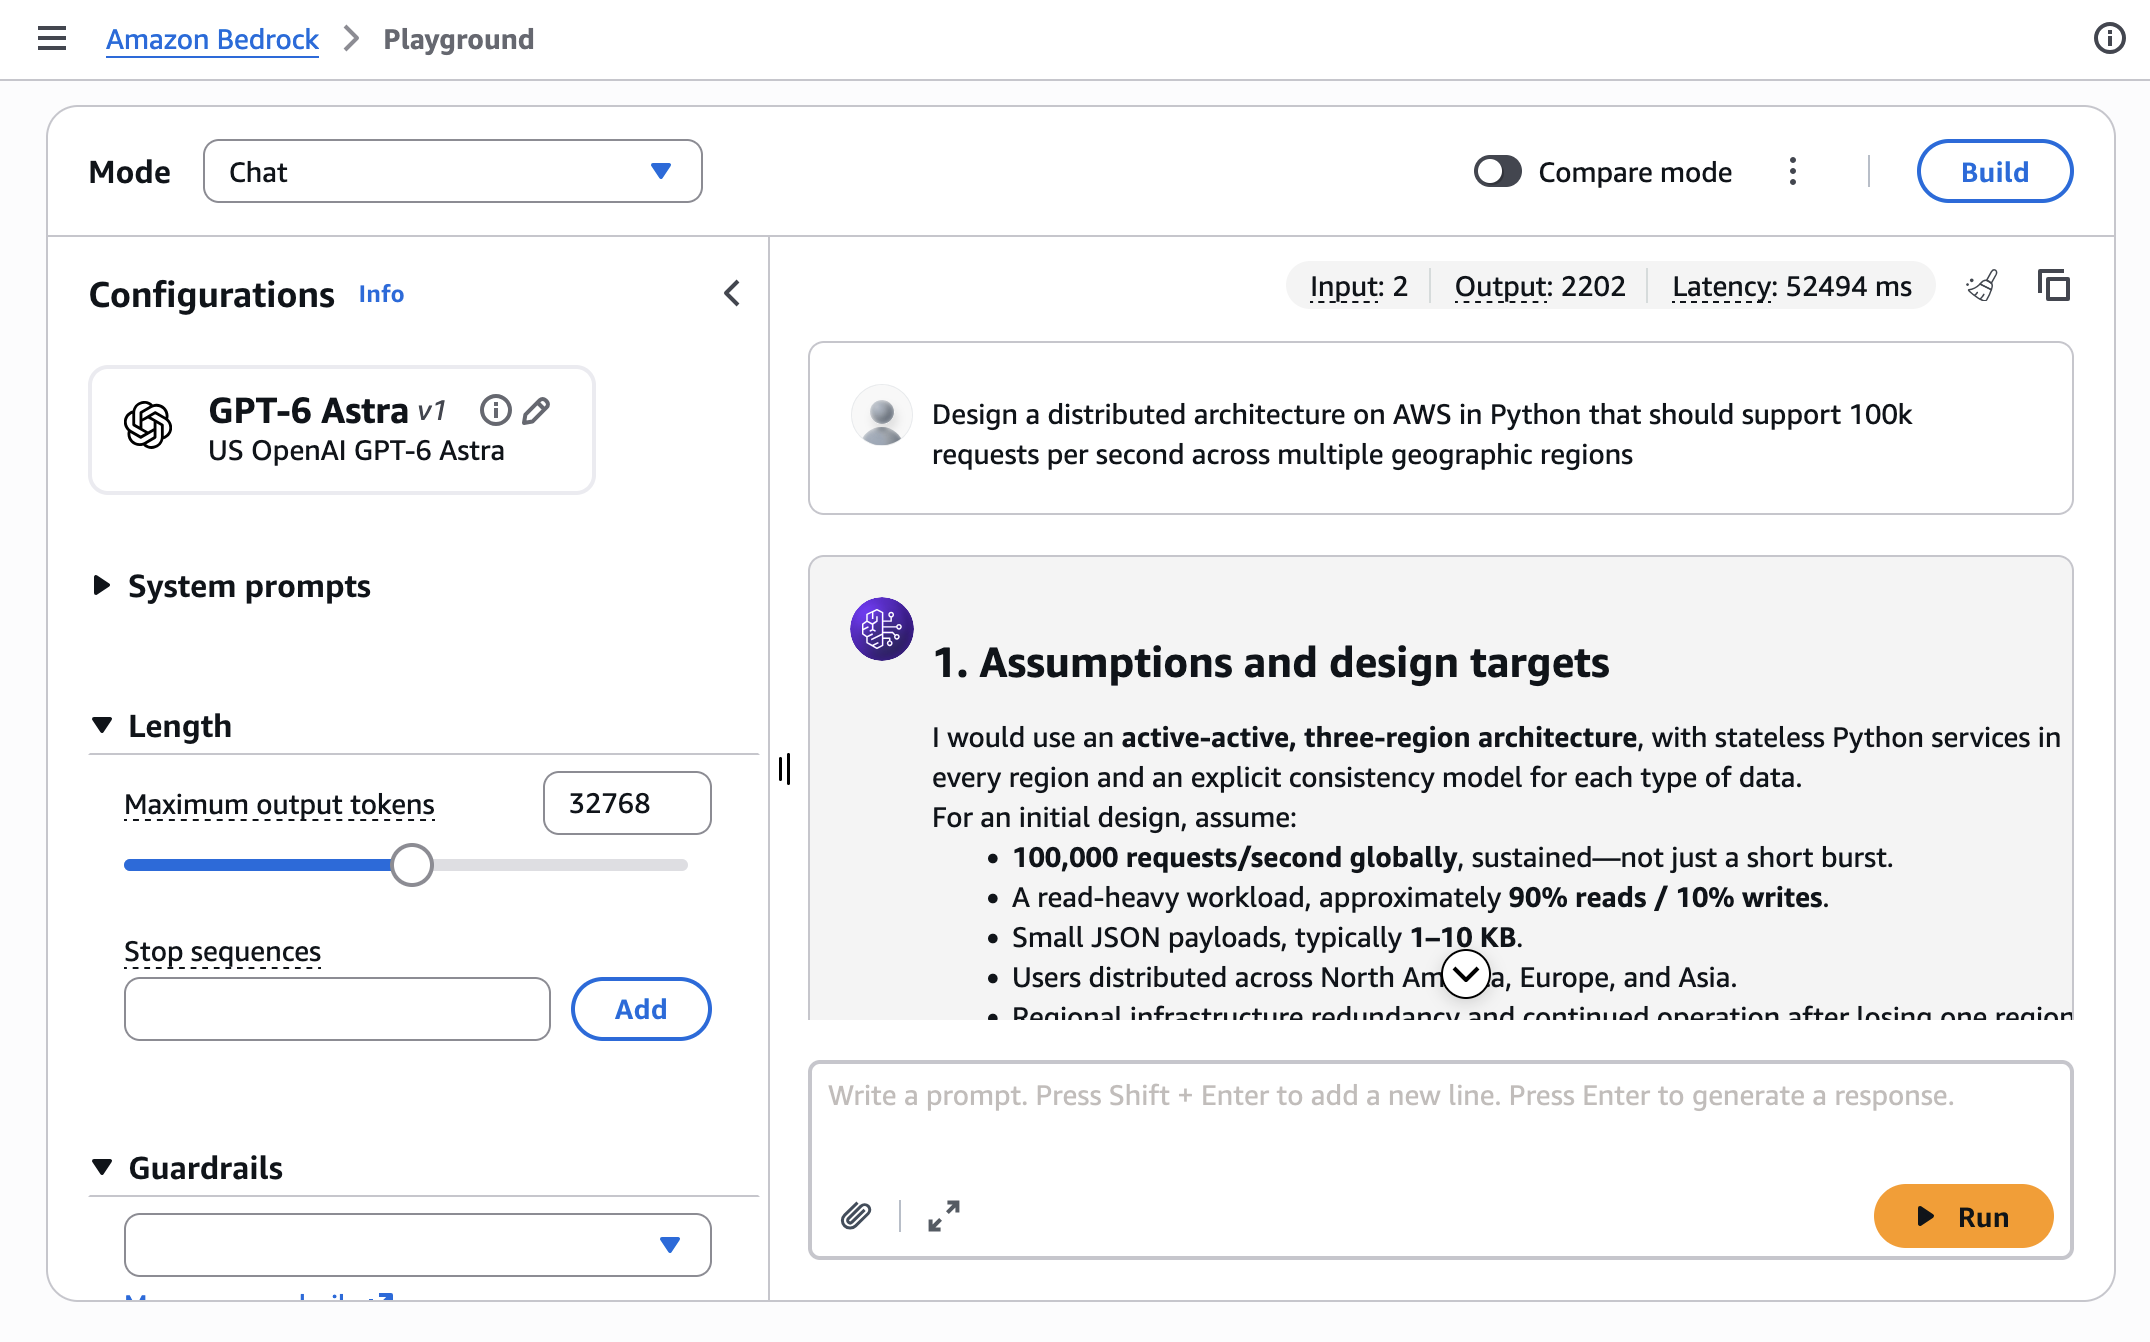
Headlines OpenAI GPT-6 Astra is now generally available on Amazon Bedrock – GPT-6 Astra is OpenAI’s latest and most capable model to date, and you can now run it on Amazon Bedrock. It brings deeper reasoning and judgment, professional-quality writing and design, and advanced computer and browser use to demanding business workflows. The model supports a context window of up to 1 million input tokens, so you can send it large codebases, long contracts, or extensive document collections and ask it to reconcile competing inputs.
You can call GPT-6 Astra through supported Amazon Bedrock APIs, or configure ChatGPT Work and Codex to use the model on Amazon Bedrock. Alongside the launch, OpenAI is introducing new enterprise plugins for ChatGPT Work that extend Astra’s browser-use capabilities across common business applications. Established AWS controls help you secure workloads, govern access, and audit model invocation activity, and your inference data isn’t used for model training. Read more
Last week’s launches Here are some launches and updates from this past week that caught my attention:
Amazon Quick desktop app is now generally available on macOS and Windows – The Amazon Quick desktop app brings Amazon Quick to your computer, where it can work with local files and stay connected to your calendar, email, and business apps in the background. Conversations, context, and agents stay synchronized across desktop and mobile, so work you start on one surface carries over to the other. With this release, Quick agents also keep running after you close your computer, which means you can start a long-running task before you leave the office, add input from the mobile app on the way home, and review the result when you get there. Existing Quick users can download the desktop app, and the mobile app is available from the Apple App Store and Google Play. Read more
AWS Lambda now supports a 90-minute function timeout on Lambda Managed Instances – You can now configure a function timeout of up to 90 minutes for asynchronous and event source mapping (ESM) invocations on Lambda Managed Instances, a 6x increase from the previous 15-minute limit. That opens the door to data processing, media transcoding, financial calculations, AI inference, and batch jobs that need longer continuous execution, without splitting the work across multiple functions. Synchronous invocations keep the existing 15-minute maximum. The longer timeout also applies to steps inside Lambda durable functions, which can still run for up to a year when invoked asynchronously. Read more
Amazon EBS Volume Clones now copies volumes across accounts – Amazon Elastic Block Store (Amazon EBS) Volume Clones can now copy a volume into another AWS account and re-encrypt it with an AWS Key Management Service (AWS KMS) key in the target account. If you keep production and development in separate accounts, you can share a volume with AWS Resource Access Manager (AWS RAM) and let the target account create a fresh copy in the same Availability Zone, for example, cloning a production database volume into an isolated development account. Cross-account copy works for all volume types, including unencrypted volumes and volumes encrypted with customer managed keys. Read more
Second-generation single-rack AWS Outposts is now generally available – The new single-rack AWS Outposts is a self-contained 42U rack that puts compute, storage, and networking into one compact unit for locations that need low latency, local data processing, or data residency, and don’t have room for a larger footprint. A single rack delivers up to 2,688 vCPU and 100 TB of Amazon EBS storage, and supports the latest x86-powered Amazon EC2 instances, including general purpose (M7i, M8i), compute-optimized (C7i, C8i), memory-optimized (R7i, R8i), and Outposts accelerated networking instances. You get the same APIs, console, automation, governance, and security controls as multi-rack Outposts and AWS Regions. Read more
Amazon OpenSearch Serverless is now available on v0 by Vercel – You can now describe a search or AI application in natural language inside v0 by Vercel and get a full-stack app backed by Amazon OpenSearch Serverless. v0 provisions a collection, indexes your data, and uses the OpenSearch Serverless endpoint for full-text search and vector search for retrieval-augmented generation (RAG) workloads, without leaving the v0 interface. OpenSearch Serverless scales capacity up and down for you, so you can focus on the application instead of cluster management. You can provision under a new AWS account or link an existing one. Read more
AWS Transform for .NET modernization is now generally available via CLI – You can trigger an AWS-managed .NET modernization in AWS Transform custom with a single CLI command, then run it interactively or script it into an existing pipeline. The CLI sits alongside the existing AWS Transform for .NET experiences in the web application, Visual Studio IDE, Kiro Power, and MCP agents. Use it to upgrade language versions, migrate frameworks, optimize performance, and analyze codebases with transformations you can run as-is or customize. The .NET modernization transformation includes 50,000 free agent minutes per month. Read more
For a full list of AWS announcements, be sure to keep an eye on the What’s New with AWS page.
Other AWS news Here are some additional posts and resources that you might find interesting:
Clare Liguori on frontier engineering – If you already use an AI coding assistant but don’t feel like you’re shipping much faster, start here. Clare Liguori, Senior Principal Engineer at AWS, published a practitioner’s manifesto on frontier engineering: ten principles, drawn from teams across Amazon, for changing how you build software with AI agents. The argument is direct. Software development has split in two, people who changed how they work with agents, and people who only changed their coding tools. Frontier engineering is not vibe coding. You spend the first weeks writing steering files, refactoring the codebase, and learning to decompose work for agents. Those weeks feel slower. The weeks after feel dramatically faster, because you’re no longer building the software directly — you’re building the agent setup that builds the software.
A free year of Kiro for students around the world – The Kiro Students program is expanding from 11 universities to 121 new schools across 16 countries. Eligible students get one year of Kiro with 1,000 credits per month and full access to paid features such as premium models and Kiro Web, no credit card and no trial timer. You can work in the IDE, the CLI, Kiro Web in a browser, or Kiro Crew. If you’re a student, sign up with your university email.
The state of AI for security: measuring what matters for trust – Security teams are using AI for triage, threat modeling, incident response, and code review, but a tool that flags everything doesn’t save time. In The state of AI for security, Anshumali Shrivastava and Neha Rungta introduce Deception Benchmark, a new evaluation that tests whether a model can tell a real vulnerability from code that looks risky but is actually safe. The benchmark includes 14,822 samples across 16 languages and more than 70 Common Weakness Enumeration (CWE) categories. Under standard prompting, precision landed in the mid-50s, about as likely to be inaccurate as accurate, and none of the 12 models tested kept both false positives and false negatives below 10 percent. The post links to the dataset, whitepaper, and submission workflow for verified scoring.
Build full-stack AWS applications in minutes with AI-powered scaffolding – Version 1.0 of the Nx Plugin for AWS is an open source toolkit of deterministic generators for APIs, websites, databases, and AI agents, plus the AWS infrastructure to run them. Each generator writes working, deployable code with security, observability, and type-safety already in place, so an AI assistant can assemble the foundation and spend its effort on your application logic. Bingo Industries used it to take a multi-agent operations chatbot from idea to production in less than 3 weeks. The plugin is open source on GitHub. Create a workspace with pnpm create @aws/nx-workspace and point your coding agent at the included MCP server.
The oldest architecture in computing – On All Things Distributed, Werner Vogels starts from a question customers always ask “Will AI take my job?”, and lands on memory. After spending time with Kiro Crew, he traces a line from Jeff Hawkins’ A Thousand Brains to how Crew stores, consolidates, and forgets across markdown files, a vector database, and a key-value index. His conclusion: the brain is the oldest architecture in computing, and the people who think hardest about how it works will build the next tools. Now, go build.
For a full list of AWS blog posts, be sure to keep an eye on the AWS Blogs page.
Upcoming AWS events Check your calendar and sign up for upcoming AWS events:
AWS Summits – AWS Summits are free in-person events that bring the cloud and AI community together to connect, learn, and explore the latest technologies. Upcoming stops include Dubai (September 30). Browse the full calendar to find a Summit near you, or stream sessions through the Global Livestream and On-Demand Hub.
Join the AWS Builder Center to connect with builders, share solutions, and access content that supports your development. Browse here for upcoming AWS-led in-person and virtual events and developer-focused events.
That’s all for this week. Check back next Monday for another Weekly Roundup!
— Micah
This post is part of our Weekly Roundup series. Check back each week for a quick roundup of interesting news and announcements from AWS!
Maintaining visibility into your data catalog’s health requires more than ad-hoc queries. Data stewards and compliance teams need automated dashboards that surface governance metrics and alert them when issues arise. These issues include undocumented assets, missing ownership, and stale metadata.
In a previous post, we showed you how to query Amazon SageMaker Catalog metadata using SQL by using the metadata export feature. This post builds on that foundation by demonstrating how to create governance dashboards with Amazon Quick.
Amazon Quick is an agentic AI-powered digital workspace that provides integrated analytics, automation, and research capabilities. With Amazon Quick Sight, a component of Amazon Quick, you can create interactive dashboards and visualizations with automatic chart suggestions and machine learning (ML) insights.
We walk through how to connect Amazon Quick Sight to your Amazon SageMaker Catalog metadata and build governance dashboards using natural language prompts.
Solution overview
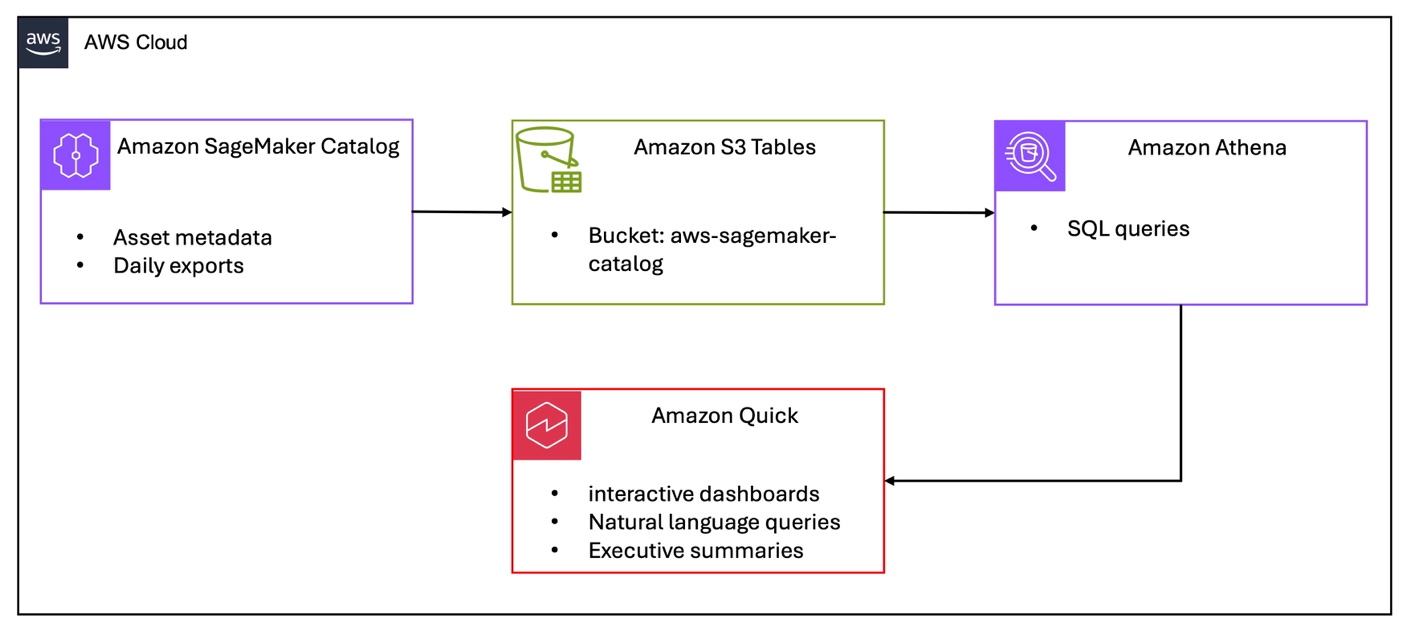
This solution extends the metadata export architecture by adding a visualization layer:
Amazon SageMaker Catalog exports asset metadata daily to Amazon Simple Storage Service (Amazon S3) Tables
Amazon Athena queries the metadata using standard SQL
Amazon Quick Sight connects to Athena for interactive dashboards
Amazon Quick uses natural language to build visualizations
Both the Amazon Quick Sight service role and your Amazon Quick Sight admin user need AWS Lake Formation permissions on the S3 Tables catalog. First, find your Amazon Quick Sight admin user ARN by running this AWS Command Line Interface (AWS CLI) command:
Enter your Amazon Quick Sight admin user ARN (from the preceding command).
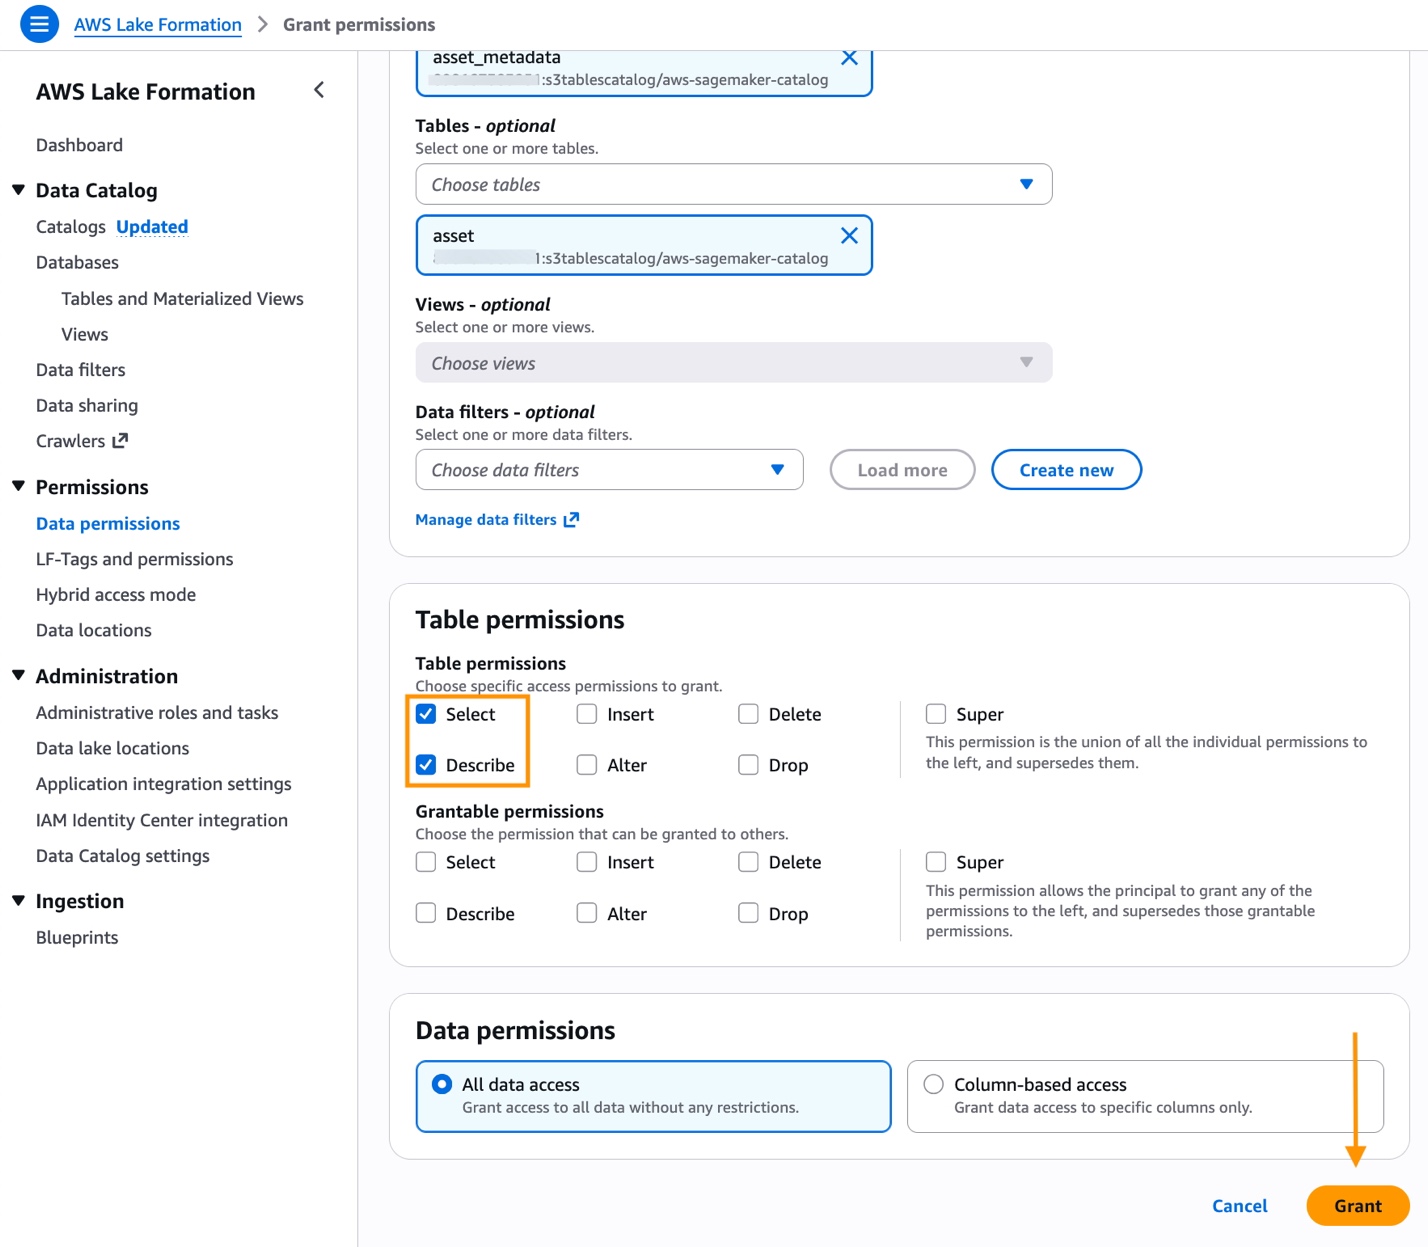
Under LF-Tags or catalog resources, choose Named Data Catalog resources.
For Catalogs, choose the S3 Tables catalog: ACCOUNT_ID:s3tablescatalog/aws-sagemaker-catalog.
For Databases, choose asset_metadata.
Under Tables, choose asset.
For Table permissions, choose Select and Describe.
Select Grant.
Figure 2 – Grant access to Amazon SageMaker Catalog resources
Repeat steps 1–9 for the Amazon Quick Sight service role, but in step 2 choose IAM users and roles instead.
When choosing the catalog in the Lake Formation console, you must choose the full S3 Tables catalog identifier (ACCOUNT_ID:s3tablescatalog/aws-sagemaker-catalog) to see the asset_metadata database.
Create an Amazon Quick Sight dataset.
Access S3 Tables data by creating a Quick Sight dataset using an Amazon Athena data source and the custom SQL option. An S3 Tables data source is also available but requires additional permissions. See Introducing new data source with S3 Tables in Amazon Quick for using S3 Tables as an Amazon Quick data source.
Open Amazon Quick Sight in the AWS Management Console.
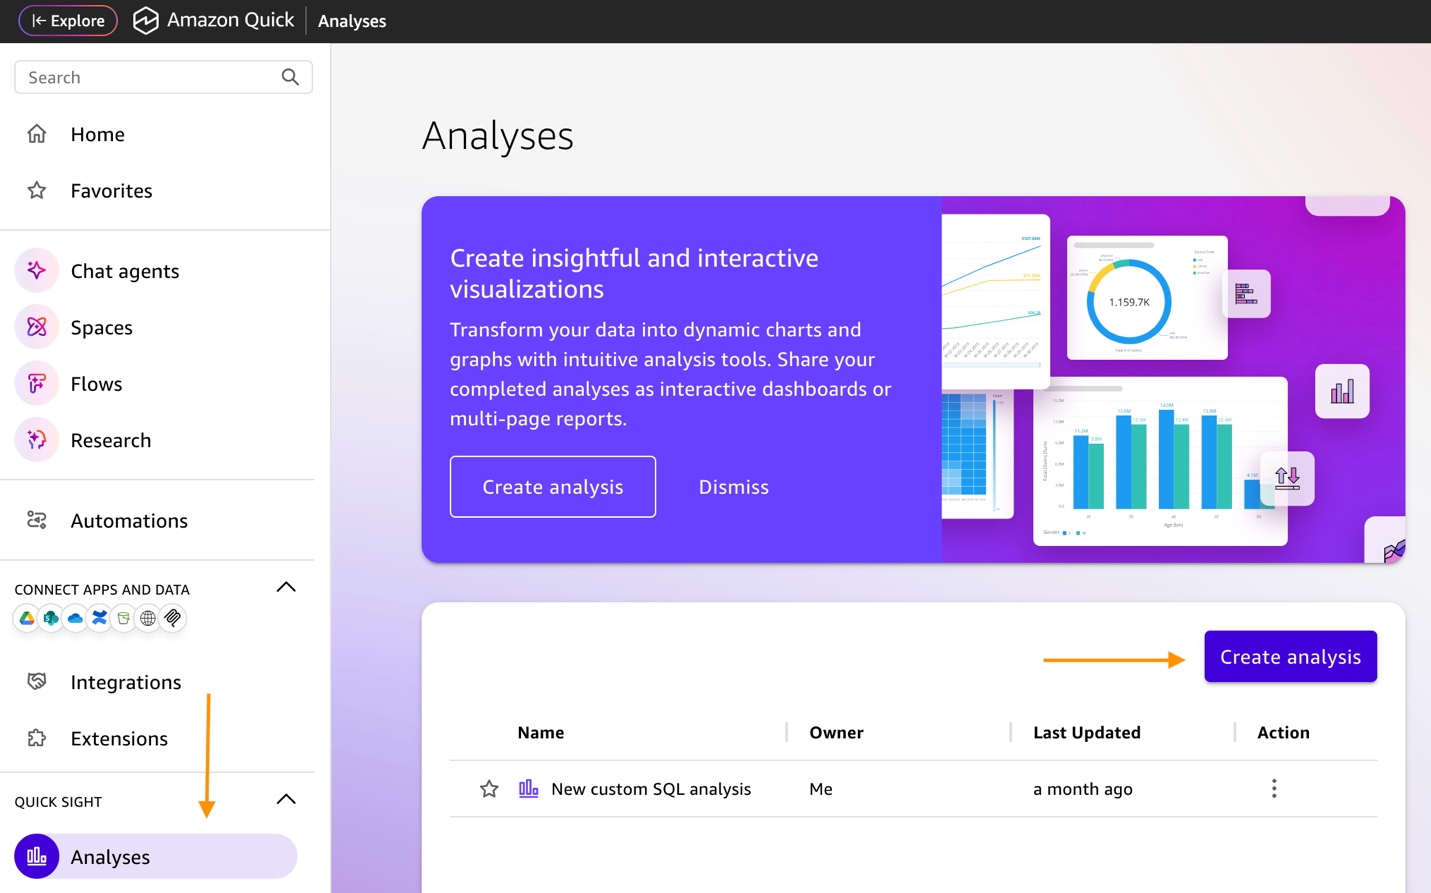
Select Analyses and Create analysis.
Figure 3 – Create Amazon Quick Sight analysis
Choose Create dataset and Create data source.
Figure 4 – Create dataset
Select Amazon Athena as the data source and select Next.
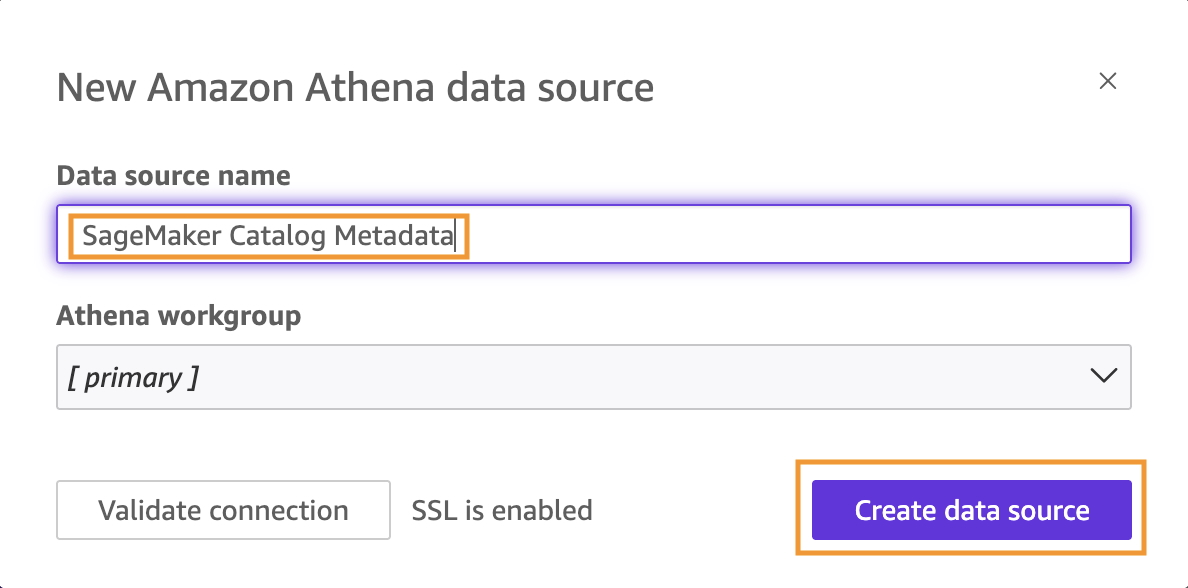
Enter a Data source name (for example, “SageMaker Catalog Metadata”) and choose Create data source.
Figure 5 – Create data source
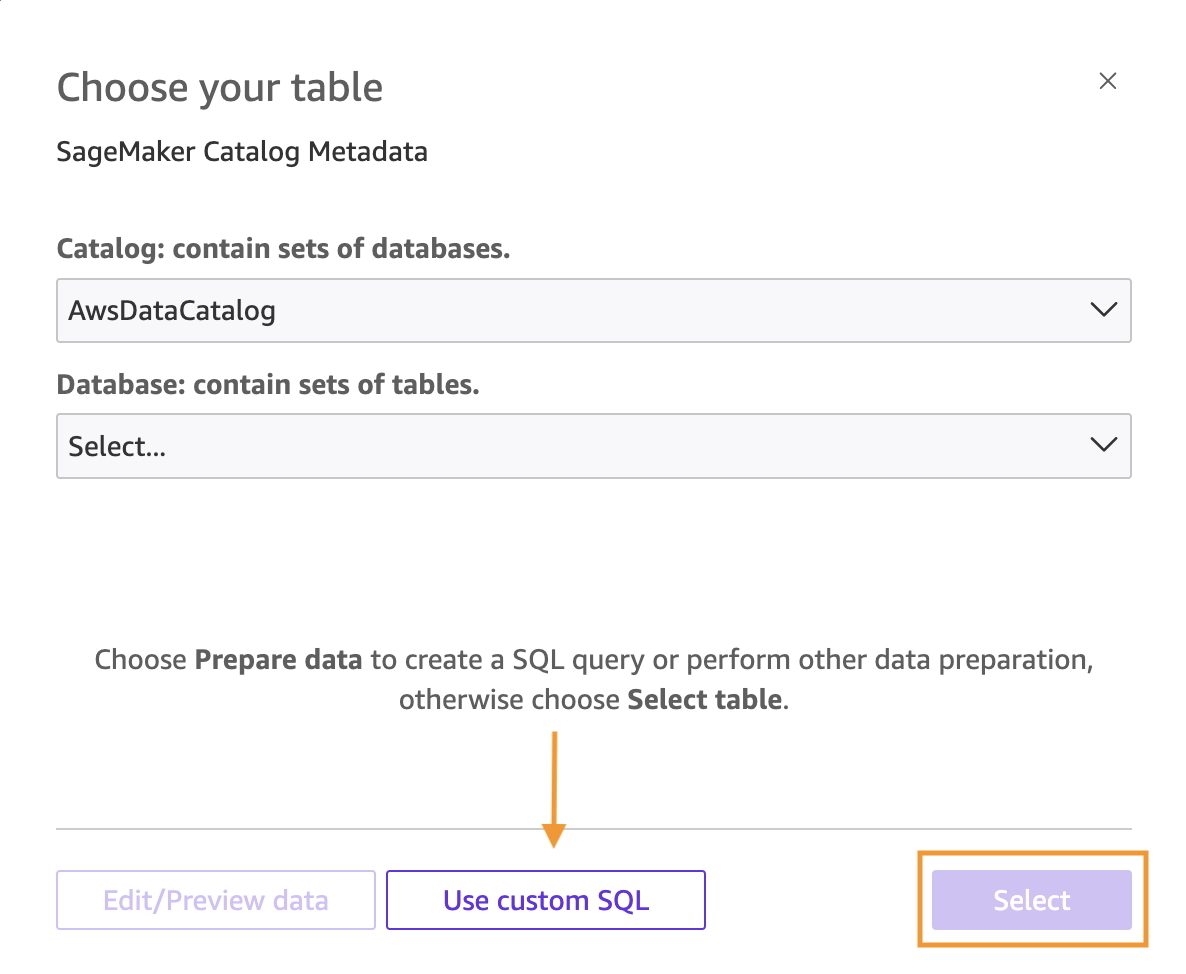
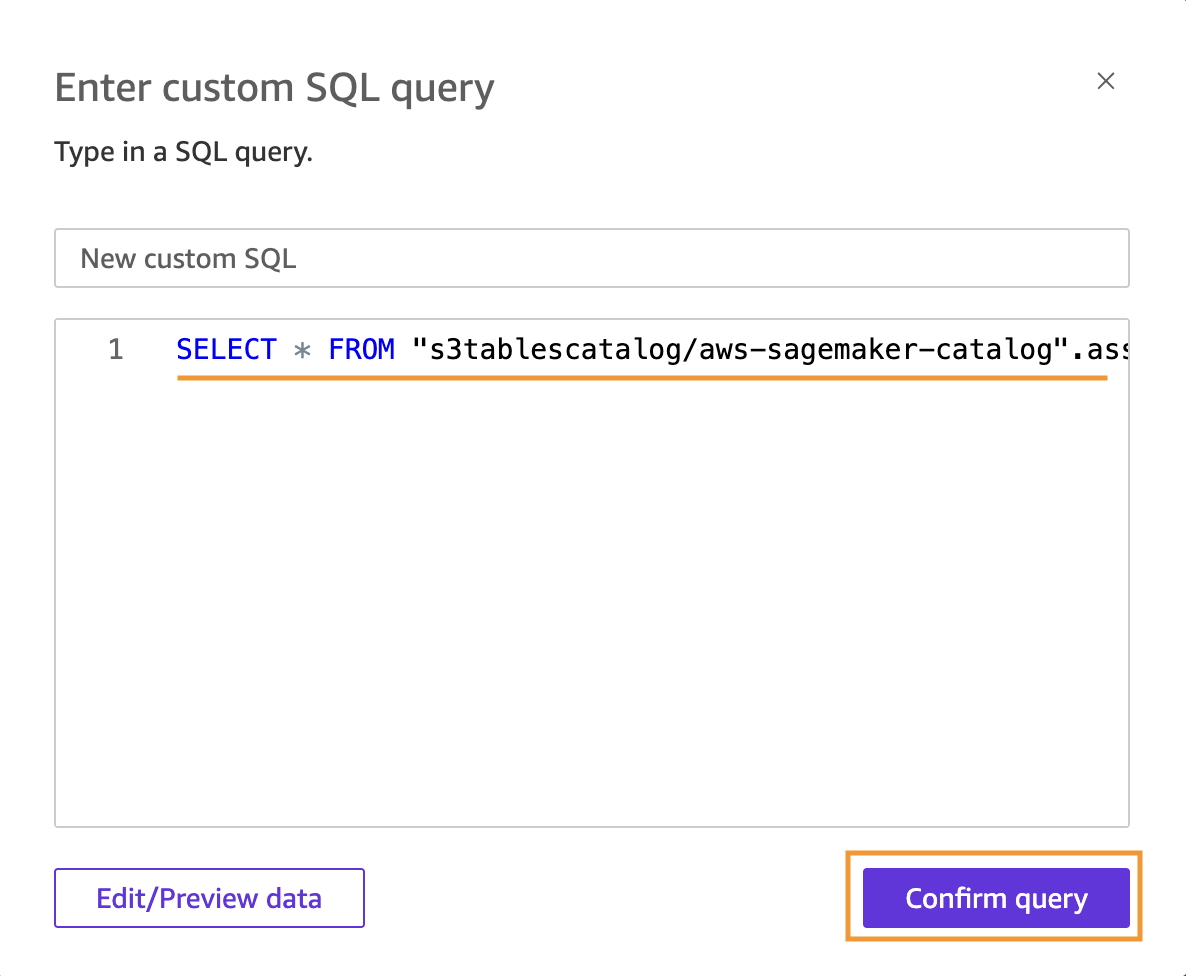
Select Use custom SQL and enter a custom SQL query that references the S3 Tables catalog using the full three-part name.
Figure 6 – Use custom SQL
Figure 7 – Enter custom SQL
SELECT * FROM "s3tablescatalog/aws-sagemaker-catalog".asset_metadata.asset
Select Confirm query.
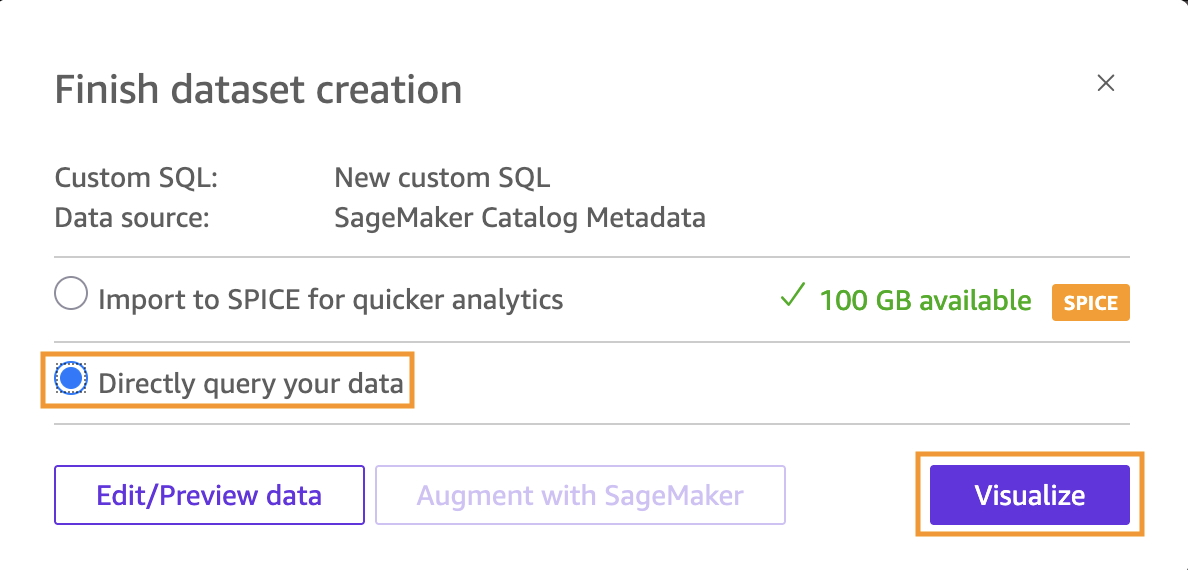
Choose Directly query your data (SPICE import may fail with S3 Tables catalogs)
Figure 8 – Directly query your data
Choose Visualize and Create to start building your dashboard.
Create visualizations with Amazon Quick.
With Amazon Quick, you can build governance dashboards using natural language prompts. This removes the need for manual field configuration. This approach is faster and more intuitive than traditional dashboard building.The Amazon Quick Sight user must have AdminPro or AuthorPro subscription (the Build feature isn’t available for Reader users).Start building your dashboard with the following steps:
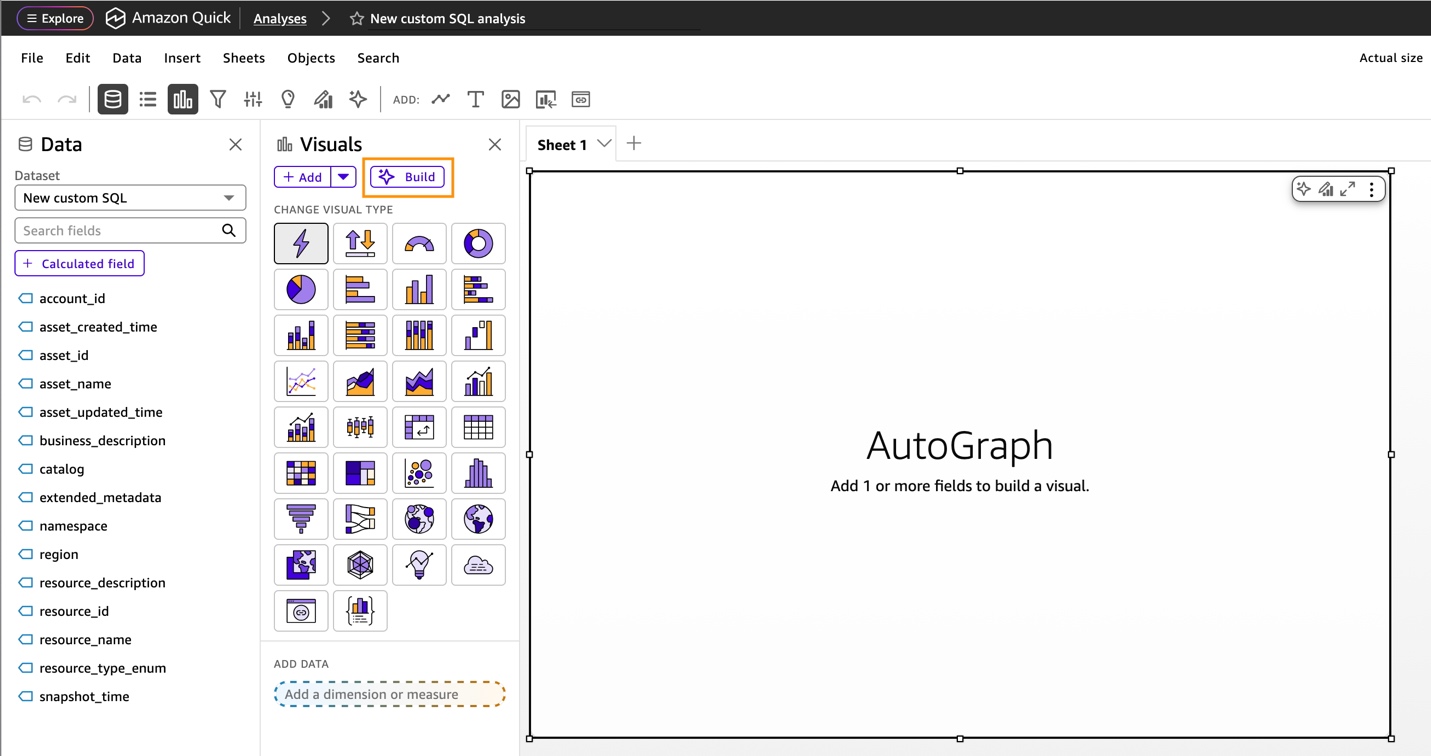
Select Build in the top toolbar to open the natural language builder.
Figure 9 – Amazon Quick build dashboard
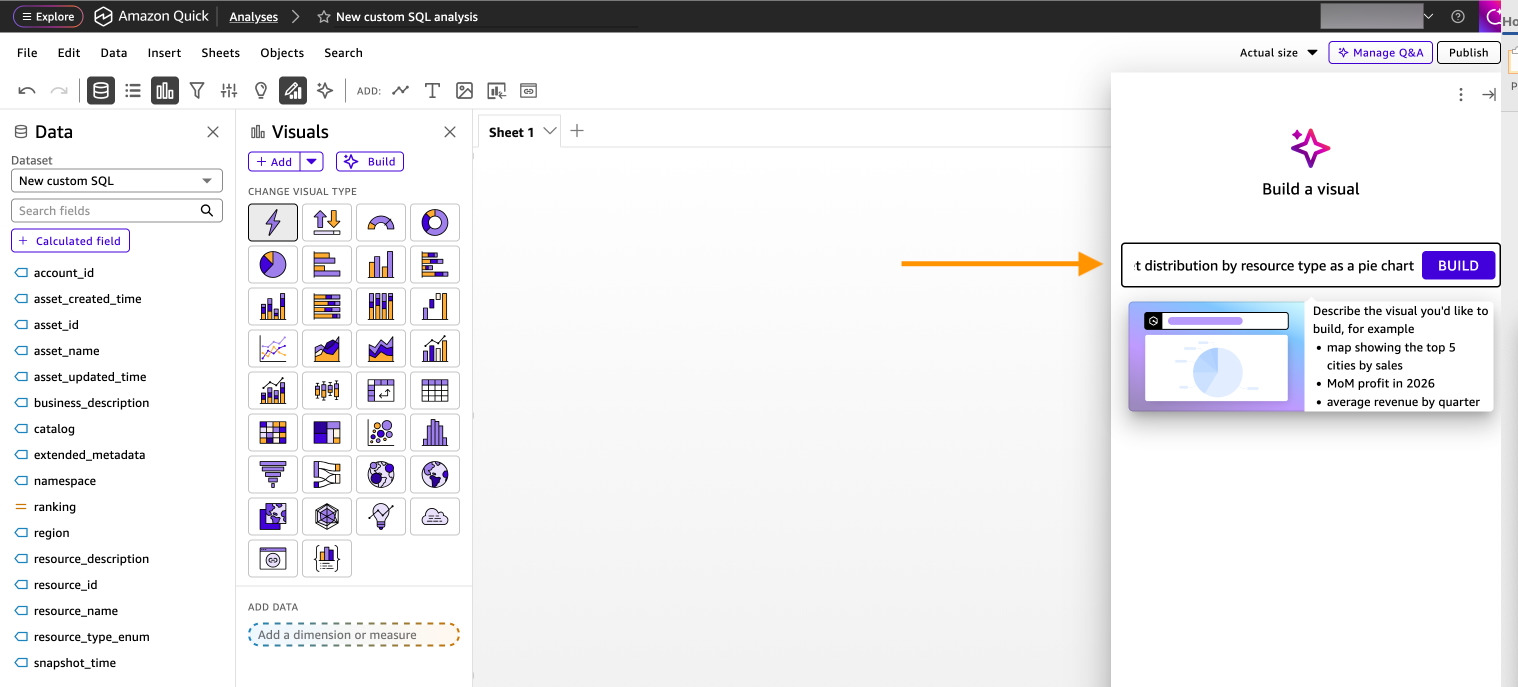
You will see a text box where you can describe the visualization that you want to create.
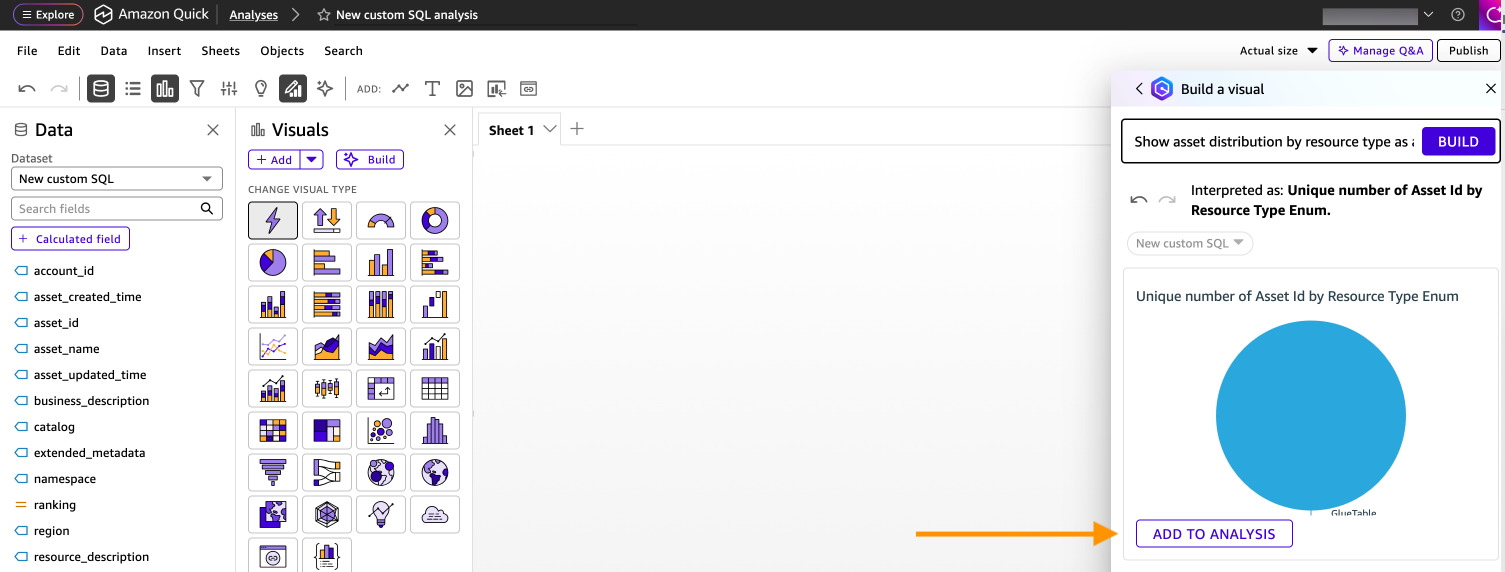
Create each visualization using natural language. For each of the six recommended visualizations, enter the corresponding natural language prompt, select Build, then choose ADD TO ANALYSIS.
Figure 11 – Add to analysis
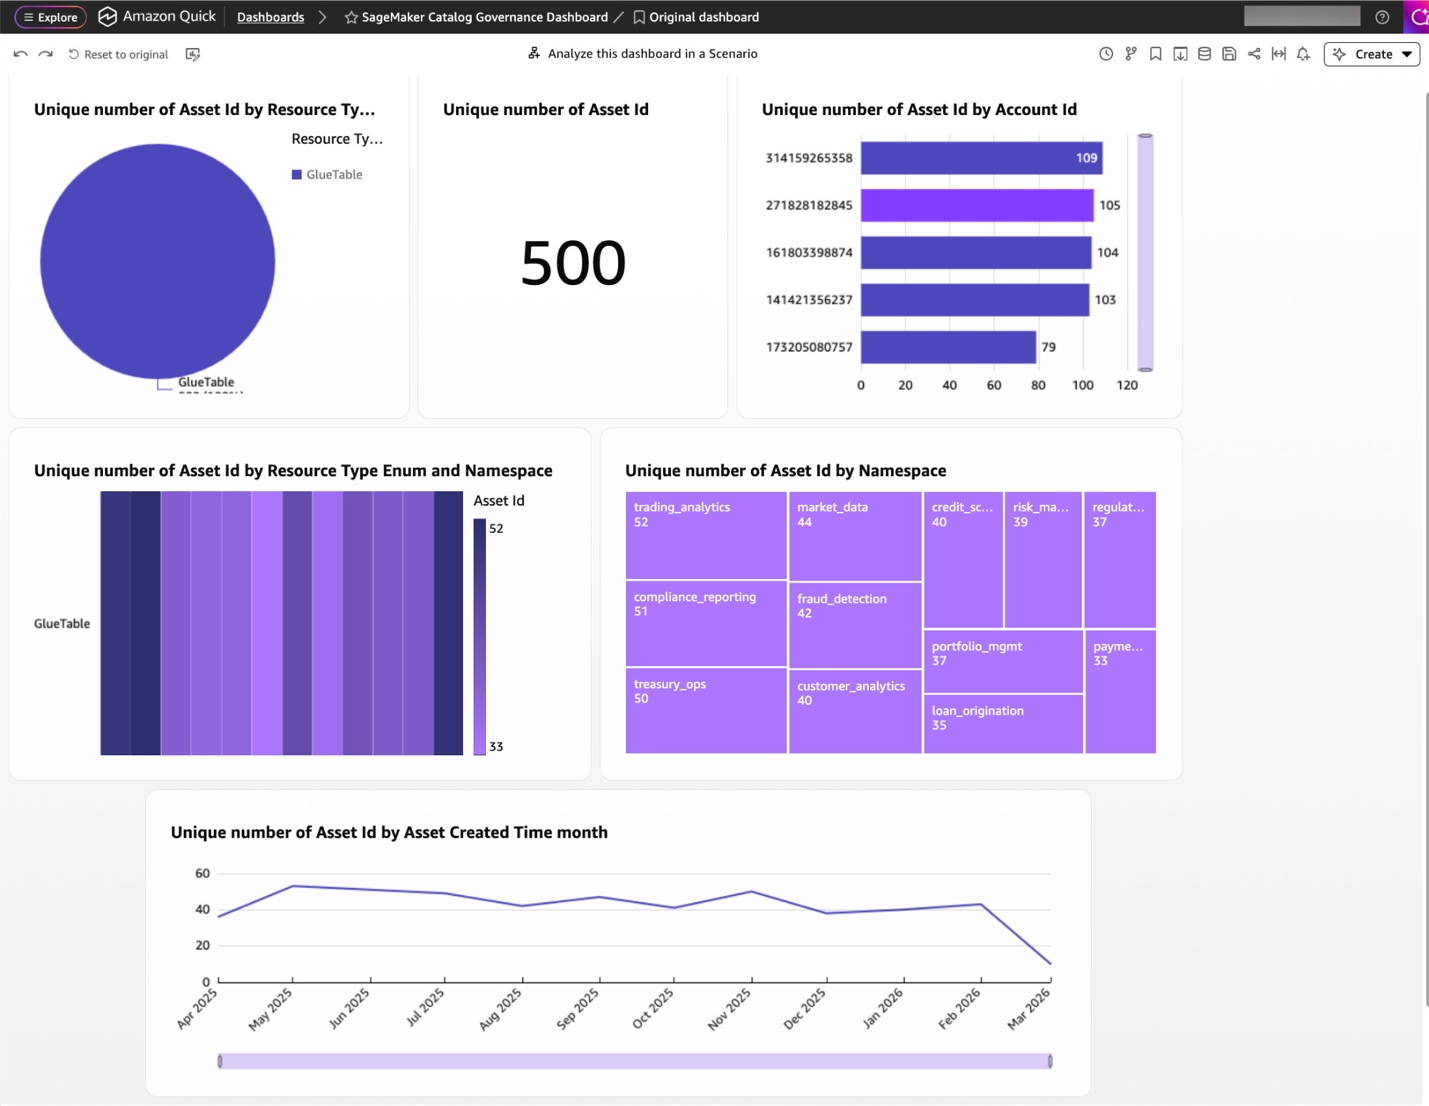
Visualization 1: Asset inventory by type
Show count of asset_id by resource_type_enum as a pie chart
After the pie chart is created, choose ADD TO ANALYSIS.
Visualization 2: Documentation completeness
Show count of asset_id where business_description is not null asa KPI
After the KPI is created, choose ADD TO ANALYSIS.
Visualization 3: Monthly registration trends
Show count of asset_id by asset_created_time month as a line chart
After the line chart is created, choose ADD TO ANALYSIS.
Visualization 4: Asset count by account
Show count of asset_id by account_id as a bar chart
After the bar chart is created, choose ADD TO ANALYSIS.
Visualization 5: Namespace distribution
Show count of asset_id by namespace as a treemap
After the treemap is created, choose ADD TO ANALYSIS.
Visualization 6: Resource type by namespace
Show count of asset_id by resource_type_enum and namespace as a heat map
Choose ADD TO ANALYSIS
Arrange and publish your governance dashboard with the following steps:
Delete any empty or unwanted visualizations by choosing the three dots menu and choosing Delete.
Arrange visualizations by dragging them into your preferred layout.
Resize visualizations to emphasize key metrics.
Add titles to each visualization for clarity.
Choose PUBLISH in the top right corner.
Enter a dashboard name: “SageMaker Catalog Governance Dashboard”.
After you publish, you can ask questions about your governance data:
On the dashboard, choose Analyze this dashboardin a Scenario in the top center.
In the Data to Insights panel, enter natural language questions such as:
“Which resource types have the lowest documentation rates?”
“How many assets were registered last month compared to this month?”
“What percentage of assets lack ownership information?”
Choose Submit to generate AI-powered insights.
Amazon Quick analyzes your data and provides insights with supporting visualizations.
Generate executive summaries
Create automated governance reports for data stewards and compliance teams:
Choose the Amazon Quick logo in the top left to return to the home page
Select Dashboards from the left panel
Choose your “SageMaker Catalog Governance Dashboard”
Choose the Create dropdown menu in the top right
Select Executive Summary
Amazon Quick will automatically generate a summary with key governance insights, including Total asset counts and growth trends, Documentation completeness metrics, Ownership coverage statistics, and Classification distribution analysis.
Create governance stories.
Build governance reports that combine multiple dashboards:
From the Create dropdown, select Story.
Enter a prompt: “Write a summary of catalog governance metrics and data quality trends”.
Choose Add to select dashboards to include in the report.
Choose Build (this might take a few minutes to complete).
Amazon Quick will generate a narrative report combining your visualizations with AI-generated insights. Share the reports with leadership or compliance teams.
Governance dashboards contain metadata such as ownership and classification details. Restrict access to users who need it. In the Amazon Quick Sight console, open the dashboard, choose Share, and grant access to named users or a dedicated Quick Sight group (for example, data-stewards) instead of selecting Everyone in this account. Review the dashboard’s permissions periodically and remove entries that are no longer needed.
Cleaning up
To avoid ongoing charges, clean up the resources created in this walkthrough. Delete Amazon Quick Sight resources including the dashboard, analyses, and dataset.
Conclusion
In this post, you connected Amazon Quick Sight to your Amazon SageMaker Catalog metadata export, built governance dashboards using the Amazon Quick natural language prompts. This approach gives data stewards and compliance teams visibility into catalog health through six key visualizations covering asset inventory, documentation completeness, registration trends, account distribution, classification coverage, and stale asset detection.
Automating data security and analytics for legal documents presents a unique challenge when your legal team stores documents with strong access controls, organized by client and matter, encrypted at rest, and governed by well-defined policies. But what happens when you want to run analytics across those repositories? The typical path is extracting content into separate data pipelines or third-party tools, which fragments your governance model and introduces new risks. Law firms and corporate legal departments operate under distinct obligations that make data governance non-negotiable. Attorney-client privilege, work product doctrine, and professional conduct rules impose strict duties around how client information is handled, accessed, and disclosed. Governance failure in this context isn’t just a compliance gap, it can result in privilege waiver, disqualification from representation, or disciplinary action.
Legal professionals use ethical walls, also called information barriers, as structural safeguards that prevent the flow of confidential information between teams within a firm that represent adverse or potentially conflicting interests. Professional conduct rules mandate these barriers, and failure to maintain them can result in firm disqualification, malpractice liability, or regulatory sanctions.
Privilege boundaries are equally critical. Attorney-client privilege and work product protection apply only when you properly control access to the underlying material. If you expose privileged documents or metadata about their contents to unauthorized individuals, you risk losing your privilege protection. When organizations fail to maintain reasonable controls over privileged material, courts might find that they have waived their privilege. You should therefore actively manage your access governance, not only as a security concern but as a legal preservation requirement.When you extract content into separate analytics systems or grant broader access than your matter structures support, you create pressure on both protections. You gain visibility but lose confidence in your controls.
In this post, we show you a reference architecture that automates sensitive data discovery across legal document repositories on Amazon Web Services (AWS), demonstrate how to capture structured findings as a compliance dataset, and guide you through building a governed analytics workspace that maintains your security boundaries. You walk away with a practical model for building security and analytics into the same lifecycle, without moving documents outside their system of record.
Analytics shouldn’t weaken governance
Most legal organizations have invested heavily in securing their document repositories. You store documents in structured storage, organized by client and matter. You access controls map to matter boundaries (the organizational and access structures that separate one client engagement from another). You establish retention and hold policies.The difficulty starts when teams want to analyze what’s inside those repositories. Running analytics typically means copying content into a separate system, standing up a new data pipeline, or granting broader access than existing matter structures support. Each of these steps introduces governance gaps. Manual reporting fills some of the void, but it doesn’t scale and can’t provide continuous visibility. What’s missing is a model where security controls and analytics reinforce each other, where the act of discovering sensitive data also produces the dataset that you use for reporting, and where governance applies once and carries through every downstream operation.
Automation addresses this by combining continuous sensitive data discovery with governed analytics, built on discovery metadata rather than document copies. This automated approach delivers four key advantages:
No document movement. Your files stay in their system of record. Analytics runs against structured discovery metadata, not document content, so governance boundaries remain intact.
Continuous discovery instead of manual scanning. Automated classification identifies regulated and sensitive information on an ongoing basis, replacing periodic manual reviews with on demand visibility.
Unified governance. You define matter-aligned access policies once, and they carry through from document storage to findings analytics and compliance reporting.
Built-in audit readiness. A durable record of discovery findings and remediation actions accumulates automatically over time, giving you structured evidence for client reviews and regulatory inquiries.
Reference Architecture
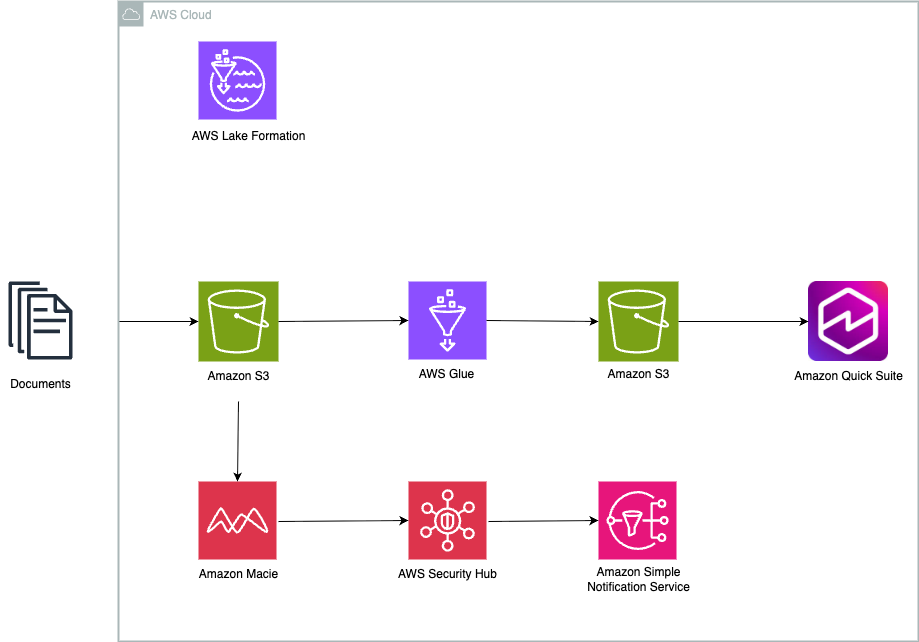
The following architecture shows how continuous discovery, governance, and compliance operations can work together without copying legal documents into analytics systems.
Architecture walkthrough
Store and protect documents in Amazon Simple Storage Service (Amazon S3)
Store your legal documents in Amazon S3, which serves as the system of record for document content. Align your buckets and prefixes to client and matter structures so that access controls map directly to matter boundaries. Where your retention or legal hold requirements demand it, apply S3 Object Lock to enforce immutability. You can encrypt your data using AWS Key Management Service (AWS KMS), which gives you centralized control over encryption keys and policies.
Discover and classify sensitive data with Amazon Macie
You will configure Amazon Macie to continuously analyze your document repositories. Macie identifies regulated information such as personally identifiable information (PII), financial data, and other sensitive content and produces structured findings that describe what Macie identified and where it exists. This provides ongoing visibility into data exposure without requiring document movement or manual scanning.
Catalog and govern findings with AWS Glue and AWS Lake Formation
You will use AWS Glue to catalog the findings dataset and maintain its schema so it stays query-ready. Apply AWS Lake Formation tag-based policies to govern access, aligning tags to client, matter, and confidentiality tier. This approach enforces ethical walls and least-privilege access consistently across analytics and reporting activities.
AI-powered chat agent using Amazon Quick Suite
You can create custom chat agents to tailor conversational interfaces for specific legal business needs. These agents can be configured with legal-specific knowledge bases, connected to relevant document repositories, and customized with instructions appropriate for legal workflows. You can use this chat agent to interact with your legal documents through natural language conversation for capabilities like:
E-Discovery:Search and analyze large volumes of legal documents to quickly find relevant information across your document repository.
Contract Analysis:Review contracts and automatically extract key terms, clauses, and obligations to streamline your contract review process.
The chat agent can help you navigate complex document sets through conversational queries, making legal research and document review more efficient and accessible.
Analyze and report with Amazon Quick Sight
You will use Amazon Quick as your compliance operations workspace. Quick provides a unified environment where your teams can query findings, generate dashboards, track remediation actions, and produce audit-ready reports. The agentic AI capabilities of Amazon Quick can autonomously build analyses, surface anomalies across matters, generate executive summaries for client reviews, and proactively recommend remediation priorities based on finding severity and trends. Combined with built-in data stories for automated narrative generation and pixel-perfect paginated reports for regulatory submissions, Quick reduces the time from discovery to action while keeping your teams within a governed interface aligned to matter-based permissions. Rather than switching between separate visualization, workflow, and reporting tools, your legal and compliance teams can review findings, manage response activities, and collaborate all within a single workspace that respects ethical walls and privilege boundaries.
Escalate high-severity findings
For high-severity findings that demand immediate attention, route alerts through AWS Security Hub or Amazon Simple Notification Service (Amazon SNS) to trigger escalation workflows. This connects visibility directly to action when your teams identify sensitive data risks.
Why this approach works for legal
Documents stay where they belong. Your files remain in Amazon S3, aligned to client and matter boundaries. No content moves into separate analytics pipelines.Ethical walls remain intact. Because analytics is built on discovery findings and not document copies, you can govern access to findings using the same matter-aligned controls that apply to documents. Compliance and security teams gain visibility without expanding document access.Discovery runs continuously, not periodically. Rather than scheduling quarterly or annual scans, you maintain a current view of sensitive data across your repositories.
Governance applies once and carries through. Lake Formation tag-based policies govern findings access at the catalog level. You define your matter and confidentiality mappings once, and they carry through to every dashboard, query, and report.Audit readiness is built in. Instead of assembling reports manually before a client review or regulatory inquiry, you maintain a historical record of discovery findings and remediation actions. You can demonstrate your posture over time with consistent, structured evidence.
Security and analytics reinforce each other. Your analytics capability is built on top of your security controls, not alongside them. Strengthening one strengthens the other.
Cost considerations
The primary cost drivers for this architecture include:
Amazon Macie: You pay based on the number of S3 buckets evaluated and the volume of data inspected for sensitive data discovery. Review Amazon Macie pricing for current rates.
Amazon S3: Storage costs for both your document repositories and the compliance intelligence bucket. Consider S3 lifecycle policies to tier older findings into lower-cost storage classes.
AWS Glue and AWS Lake Formation: Charges for crawlers and catalog storage. For most implementations, these costs are modest.
Amazon QuickSight: Per-user pricing based on the edition that you select (Standard or Enterprise). Enterprise edition supports row-level and column-level security, which aligns well with matter-based governance.
Amazon EventBridge, AWS Security Hub, and Amazon SNS: Charges based on event volume and notifications delivered. For findings-based workflows, these costs are generally low.
Use the AWS Pricing Calculator to estimate costs based on your repository size, user count, and discovery frequency.
Getting started
Start by identifying a representative set of document repositories in Amazon S3. We recommend that you start with two or three matters that span different practice areas and confidentiality tiers.
Turn on Amazon Macie for those repositories and configure automated sensitive data discovery.
Catalog the findings dataset with AWS Glue and apply Lake Formation tag-based access policies aligned to your matter structure.
Build your first Amazon Quick Sight dashboard to visualize findings by matter, sensitivity type, and severity.
Define escalation rules in AWS Security Hub or Amazon SNS for high-severity findings.
After you validate this workflow against your initial repositories, expand gradually. Add more repositories to Macie discovery. Refine your governance tags to reflect practice areas and confidentiality tiers. Extend your dashboards from basic posture visibility to trend analysis and remediation tracking.The goal isn’t to build a comprehensive analytics solution all at once. Start with a secure foundation where discovery findings, governance, and reporting operate together in a way that aligns with your legal workflows, and then expand from there.
Conclusion
You don’t have to choose between protecting client data and understanding it. By building analytics on top of governed discovery findings and using a unified compliance workspace, you gain visibility into your data posture without weakening confidentiality boundaries.This approach brings security, governance, and analytics together in a way that reflects how legal work is actually structured. It provides continuous visibility, supports audit readiness, and delivers insight without requiring documents to move outside their system of record.
Today at the What’s Next with AWS, Matt Garman, CEO of AWS, Colleen Aubrey, SVP Amazon Applied AI Solutions, Julia White, CMO of AWS, and OpenAI leaders discussed how they and their customers are changing how businesses operate with agents.
Here’s our roundup of the biggest announcements from the event:
Amazon Quick is an AI assistant for work that connects to all of them, learns what matters to you, and takes action on your behalf. Starting today, you can use the new desktop app, sign up for Free and Plus pricing plans, generate visual assets in the chat, and easily connect Quick to even more apps.
Quick’s new desktop app (Preview): You can create a personalized experience by staying connected to your local files, calendar, and communications without opening a browser.
New Free and Plus pricing plans for Quick: You can sign up within minutes using your personal email address or existing Google, Apple, Github, or Amazon credentials—no AWS account required.
Generate visual assets on the fly: Available today, Quick now lets you create polished documents, presentations, infographics, and images directly from the chat interface, no design skills or hours of formatting required.
Easily connect Quick to even more apps: Also available today, Quick is expanding its native integrations to include Google Workspace, Zoom, Airtable, Dropbox, and Microsoft Teams.
Amazon Connectis expanding from a single product into a set of four agentic AI solutions designed to work within your existing workflows: Amazon Connect Decisions (supply chains), Talent (hiring), Customer (customer experience), and Health (health care).
Amazon Connect Decisions is a supply chain planning and intelligence solution that shifts teams from crisis management to proactive planning and decisioning. AI teammates, combining 30 years of Amazon operational science and 25+ specialized supply chain tools, adapt to your business, learn from your team, and continuously improve your operations.
Amazon Connect Talent (Preview) is an agentic AI hiring solution built for talent acquisition leaders managing scaled hiring. It delivers AI-led interviews, science-backed assessments, and consistent evaluation, helping recruiters hire high quality candidates faster while providing applicants with a flexible interview experience that reduces human preconceptions.
Amazon Connect Customer, previously known as Amazon Connect, delivers intelligent, personalized customer experiences across voice, chat, and digital channels. Amazon Connect Customer now offers new configuration capabilities that enable organizations to set up conversational AI in weeks, not months, and configure experiences without technical expertise.
Amazon Connect Health delivers agentic patient verification, appointment management, patient insights, ambient documentation, and medical coding — giving patients faster access to care, clinicians more time for care, and staff capacity for specialized work.
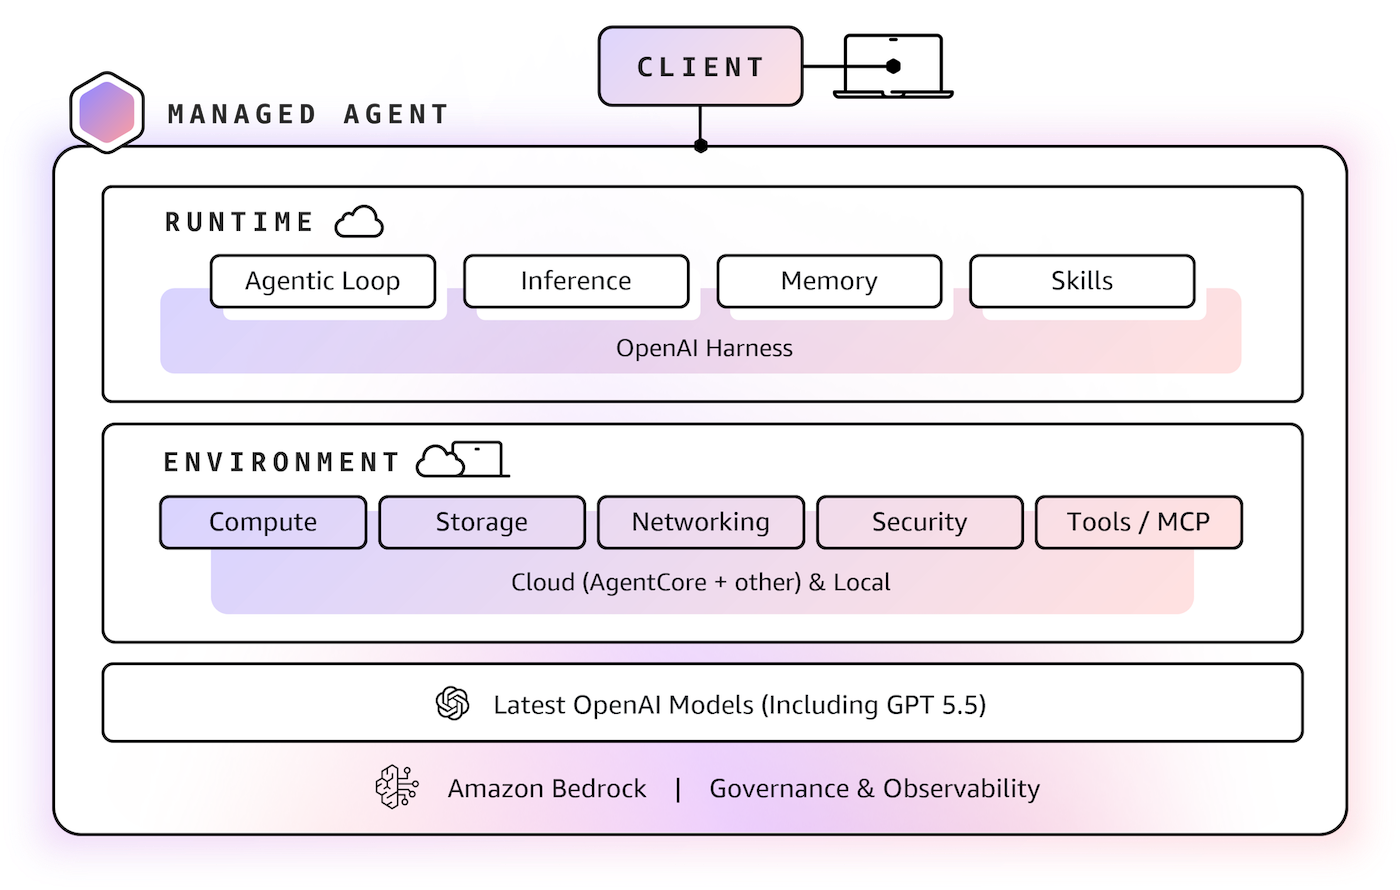
AWS and OpenAI extended partnership AWS and OpenAI are bringing the latest OpenAI models to Amazon Bedrock, launching Codex on Amazon Bedrock, and launching Amazon Bedrock Managed Agents, powered by OpenAI (all in limited preview), giving enterprises the frontier intelligence they want on the infrastructure they trust.
OpenAI models on Amazon Bedrock (Limited preview): The latest OpenAI models, including GPT-5.5 and GPT-5.4, will be available in preview on Amazon Bedrock. Use OpenAI’s frontier models through the same Bedrock APIs you already rely on, with unified security, governance, and cost controls. No additional infrastructure to configure, no new security model to learn.
Codex on Amazon Bedrock (Limited preview): You can access the OpenAI coding agent within the AWS environments where they already operate at scale. You can authenticate using their AWS credentials, process inference through Amazon Bedrock infrastructure, and apply Codex usage toward their AWS cloud commitments. Codex on Bedrock is available through the Bedrock API, starting with the Codex CLI, the Codex desktop app, and Visual Studio Code extension.
Amazon Bedrock Managed Agents, powered by OpenAI (Limited preview): Amazon Bedrock Managed Agents combines frontier AI models with trusted AWS infrastructure, enabling customers to quickly and easily build production-ready OpenAI-powered agents in the cloud. It is built with the OpenAI harness, which is engineered to unlock the full potential of OpenAI frontier models, delivering faster execution, sharper reasoning, and reliable steering of long-running tasks.
Traditional business intelligence (BI) integration with enterprise data warehouses has been the established pattern for years. With generative AI, you can now modernize BI workloads with capabilities like interactive chat agents, automated business processes, and using natural language to generate dashboards.
In this post, we provide implementation guidance for building integrated analytics solutions that combine the generative BI features of Amazon Quick with Amazon Redshift and Amazon Athena SQL analytics capabilities. Use this post as a reference for proof-of-concept implementations, production deployment planning, or as a learning resource for understanding Quick integration patterns with Amazon Redshift and Athena.
Common use cases
You can use this integrated approach across several scenarios. The following are some of the most common use cases.
Traditional BI reporting benefits from bundled data warehouse and BI tool pricing, making generative BI the primary use case with significant cost advantages.
Insurance: Automates Solvency II and IFRS 17 regulatory reporting, replacing manual spreadsheet consolidation.
Banking: Accelerates FDIC call report generation and capital adequacy dashboards, cutting month-end close from days to hours.
Interactive dashboards with contextual chat agents give BI teams conversational interfaces alongside their visual metrics.
Gaming: Live ops teams query player retention and monetization KPIs in plain English—no SQL needed.
Financial Services: Trading analysts chat with real-time P&L dashboards to surface anomalies and drill into positions on demand.
Domain-specific analytics workspaces democratize enterprise data exploration through Quick Spaces and natural language queries.
Insurance: Actuarial and underwriting teams query claims and risk data without waiting on data engineering.
Banking: Risk and compliance teams explore credit, market, and operational data through a single natural language interface.
Workflow automation removes repetitive tasks and accelerates self-service analytics.
Financial Services: Automated AR reconciliation flows replace manual ledger matching, shrinking close cycle effort significantly.
Gaming: Telemetry ingestion pipelines trigger reporting refreshes automatically, freeing data engineers from routine work.
Let us examine an end-to-end solution combining these technologies.
Solution flow
AWS offers two native SQL analytics engines for building analytics workloads. Amazon Redshift provides a fully managed data warehouse with columnar storage and massively parallel processing. Amazon Athena delivers serverless interactive query capabilities directly against data in Amazon S3.
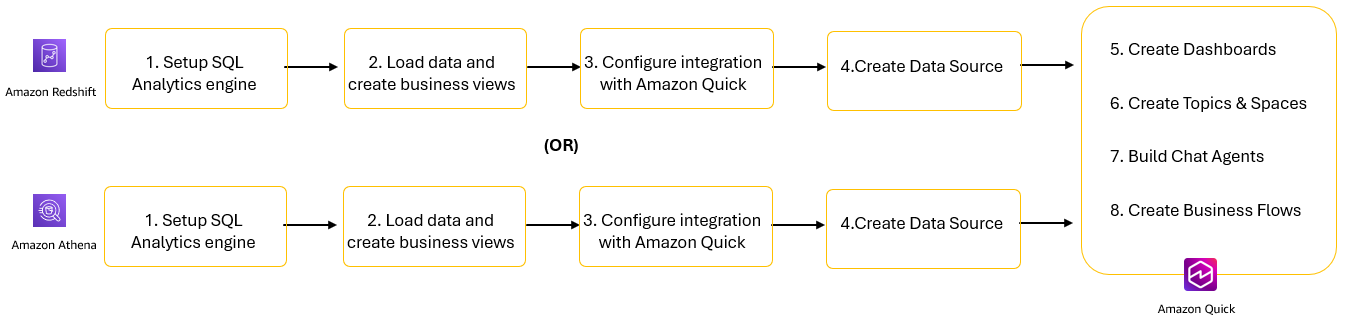
You can use either Amazon Redshift or Amazon Athena as a SQL engine while implementing the steps in this post. The following are the steps involved in building an end-to-end solution.
Figure1: Solution steps to integrate SQL Analytics engines with Amazon Quick
Set up your SQL analytics engines: Amazon Redshift or Amazon Athena.
Load data and create business views designed for analytics workloads.
Configure integration between SQL analytics engines and Amazon Quick.
Create data sources in Amazon Quick.
Create datasets and dashboards for visual analytics.
Use Topics and Spaces to provide natural language interfaces to your data.
Deploy chat agents to deliver conversational AI experiences for business users.
Implement business flows to automate repetitive workflows and processes.
Let’s start by walking through steps 1–4 for Amazon Redshift. We then describe the same four steps for Amazon Athena before explaining the Amazon Quick steps 5–8.
Configure and create datasets in Amazon Redshift
Amazon Redshift offers two deployment options to meet your data warehousing needs. Provisioned clusters provide traditional deployment where you manage compute resources by selecting node types and cluster size. Serverless automatically scales compute capacity based on workload demands with pay-per-use pricing. Both options are supported by Amazon Quick. For this walkthrough, we use Redshift Serverless.
Set up SQL analytics engine
To create a Redshift Serverless namespace and workgroup:
On the left navigation pane, select Redshift Serverless.
Follow the steps described in the Creating a workgroup with a namespace documentation page to create a workgroup and a namespace. Note the username and password provided. You will use these details for configuring connections in Amazon Redshift and Quick.
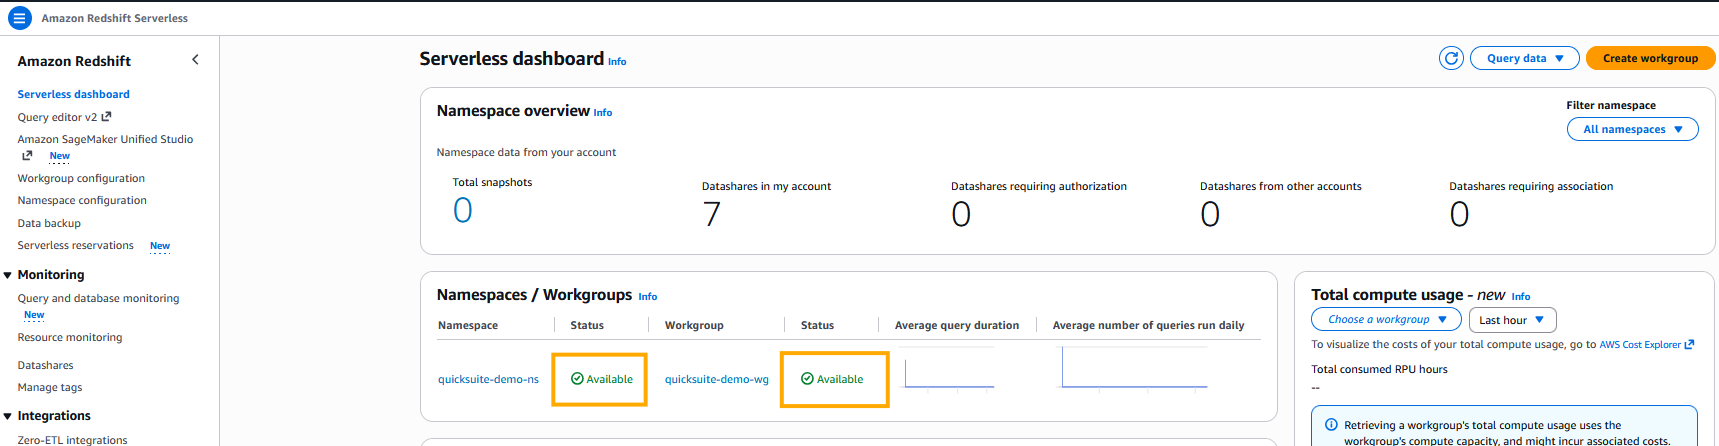
You should see the status as Available for both the workgroup and namespace in the Serverless dashboard.
Figure 2: Amazon Redshift Serverless Workgroup and NamespacesThe deployment will be completed in approximately 3–5 minutes.
Load data and create business views
Now you can load data using the industry-standard TPC-H benchmark dataset, which provides realistic customer, order, and product data for analytics workloads.To load data into Amazon Redshift:
Run the following COPY commands to load data from the public S3 bucket: s3://redshift-downloads/TPC-H/.
Ensure that the IAM role attached to the namespace is set as the default IAM role. If you didn’t set up the default IAM role at the time of namespace creation, you can refer to the Creating an IAM role as default for Amazon Redshift documentation page to set it now.
copy customer from 's3://redshift-downloads/TPC-H/2.18/100GB/customer/' iam_role default delimiter '|' region 'us-east-1';

copy orders from 's3://redshift-downloads/TPC-H/2.18/100GB/orders/' iam_role default delimiter '|' region 'us-east-1';

copy lineitem from 's3://redshift-downloads/TPC-H/2.18/100GB/lineitem/' iam_role default delimiter '|' region 'us-east-1';
Run the following query to validate load status. The status column should show as completed. You can also review the information in other columns to see details about the loads such as record counts, duration, and data source.
select * from SYS_LOAD_HISTORY Where table_name in ('customer','orders','lineitem');
Figure 3: Output of SYS_LOAD_HISTORY showing successful completion of COPY Jobs
Create a materialized view to improve query performance:
Run the following SQL to create a materialized view that pre-compute results set for customer revenues and order volumes by market segment.
CREATE MATERIALIZED VIEW mv_customer_revenue AS
SELECT
c.c_custkey,
c.c_name,
c.c_mktsegment,
SUM(l.l_extendedprice * (1 - l.l_discount)) as total_revenue,
COUNT(DISTINCT o.o_orderkey) as order_count
FROM customer c
JOIN orders o ON c.c_custkey = o.o_custkey
JOIN lineitem l ON o.o_orderkey = l.l_orderkey
GROUP BY c.c_custkey, c.c_name, c.c_mktsegment;
Run the following SQL to review the data in the materialized view.
select * from mv_customer_revenue limit 10;
Configure integration with Amazon Quick
Amazon Quick auto discovers the Amazon Redshift provisioned clusters that are associated with your AWS account. These resources must be in the same AWS Region as your Amazon Quick account. For Amazon Redshift clusters in other accounts or Amazon Redshift Serverless, we recommend that you add a VPC connection following the steps in Enabling access to an Amazon Redshift cluster in a VPC documentation. Usually, these steps are performed by your organization’s cloud security administration team.
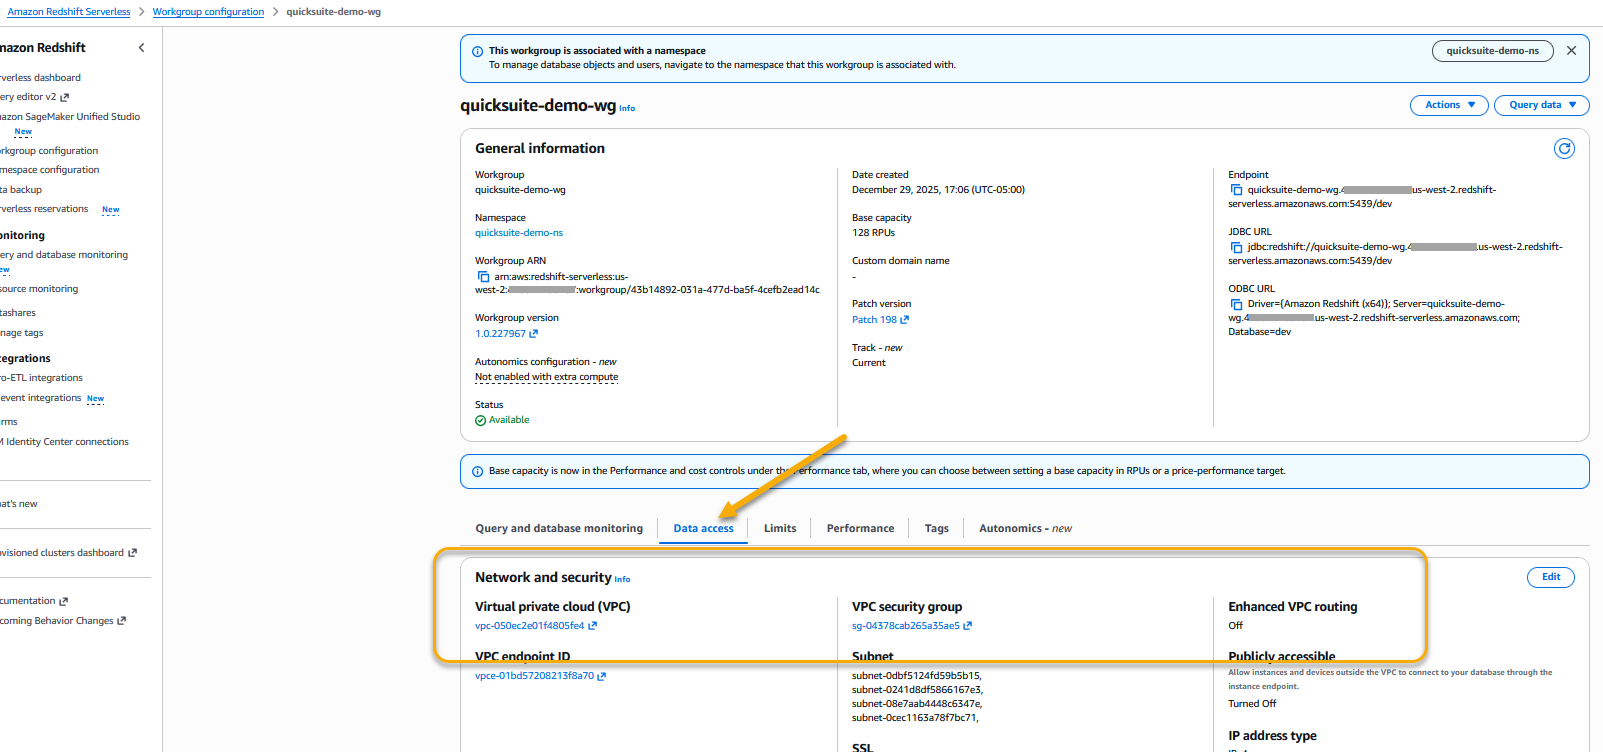
For serverless, you will apply the same steps in the workgroup instead of the cluster. You can find the VPC and Security Group settings in the Data Access tab of a workgroup.
Figure 4: Amazon Redshift Serverless workgroup VPC and Security groups
To create a dataset connecting to Amazon Redshift, complete the following steps.
In the Quick left navigation pane, go to Datasets.
Choose the Data sources tab and select Create data source.
Select Amazon Redshift and enter the following:
Data Source Name: Provide customer-rev-datasource as data source name.
Connection type: Select the VPC connection created in the previous step.
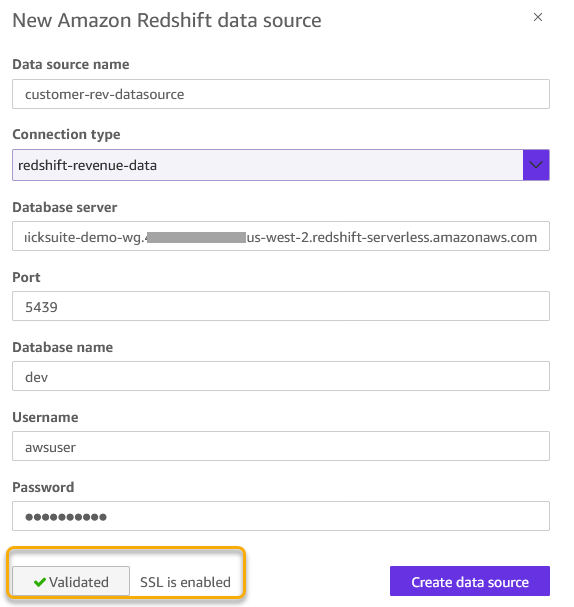
Database server: Enter the Amazon Redshift workgroup endpoint (for example, quick-demo-wg.123456789.us-west-2.redshift-serverless.amazonaws.com).
Port: 5439 (default).
Database: dev.
Username/Password: Amazon Redshift credentials with access to the database.
Choose Validateconnection. The validation should be successful.
Figure 5: Amazon Redshift data source configuration
Choose Create Data Source to create a data source.
Now let’s explore how to perform all these four steps to configure Athena in Amazon Quick.
Configure and create datasets in Amazon Athena
Amazon Athena provides immediate query capabilities against petabytes of data with automatic scaling to handle concurrent users. Let’s go through the steps to configure connections between Amazon Quick and Amazon Athena.
For Query result configuration, select Athena managed.
Choose Create workgroup.
Your workgroup is ready immediately for querying data.
Load data and create business views
For Athena, you create tables using the TPC-H benchmark dataset that AWS provides in a public S3 bucket. This approach gives you 1.5 million customer records already optimized in Parquet format without requiring data loading.
To create tables and views in Athena:
Open the Athena Query Editor from the console.
Create a database for your analytics (create S3 bucket if it exists already):
CREATE DATABASE IF NOT EXISTS athena_demo_db
COMMENT 'Analytics database for customer insights'
LOCATION 's3://my-analytics-data-lake-[account-id]/';
Create an external table pointing to the TPC-H public dataset:
CREATE EXTERNAL TABLE IF NOT EXISTS athena_demo_db.customer_csv (
  C_CUSTKEY INT,
  C_NAME STRING,
  C_ADDRESS STRING,
  C_NATIONKEY INT,
  C_PHONE STRING,
  C_ACCTBAL DOUBLE,
  C_MKTSEGMENT STRING,
  C_COMMENT STRING
)

ROW FORMAT DELIMITED
FIELDS TERMINATED BY '|'
STORED AS TEXTFILE
LOCATION 's3://redshift-downloads/TPC-H/2.18/100GB/customer/'
Create a business-friendly view for analytics:
Run the following SQL to create a view that aggregates customer account balances grouped by market segments.
CREATE VIEW athena_demo_db.customer_deep_analysis AS
SELECT
    c_custkey AS customer_id,
    c_name AS customer_name,
    c_mktsegment AS market_segment,
    c_nationkey,
    ROUND(c_acctbal, 2) AS account_balance,
    CASE
        WHEN c_acctbal < 0    THEN 'At-Risk'
        WHEN c_acctbal < 2500 THEN 'Low'
        WHEN c_acctbal < 5000 THEN 'Mid'
        WHEN c_acctbal < 8000 THEN 'High'
        ELSE 'Premium'
    END
AS balance_tier,

    ROUND(AVG(c_acctbal) OVER (PARTITION BY c_mktsegment), 2)        AS segment_avg,
    ROUND(c_acctbal - AVG(c_acctbal) OVER (PARTITION BY c_mktsegment), 2) AS vs_segment_avg,
    ROUND((c_acctbal - AVG(c_acctbal) OVER (PARTITION BY c_mktsegment))
          / NULLIF(STDDEV(c_acctbal) OVER (PARTITION BY c_mktsegment), 0), 2) AS segment_z_score,
    RANK() OVER (PARTITION BY c_mktsegment ORDER BY c_acctbal DESC)  AS rank_in_segment,
    NTILE(5) OVER (ORDER BY c_acctbal DESC)                          AS global_quintile

FROM athena_demo_db.customer_csv
ORDER BY c_acctbal DESC;
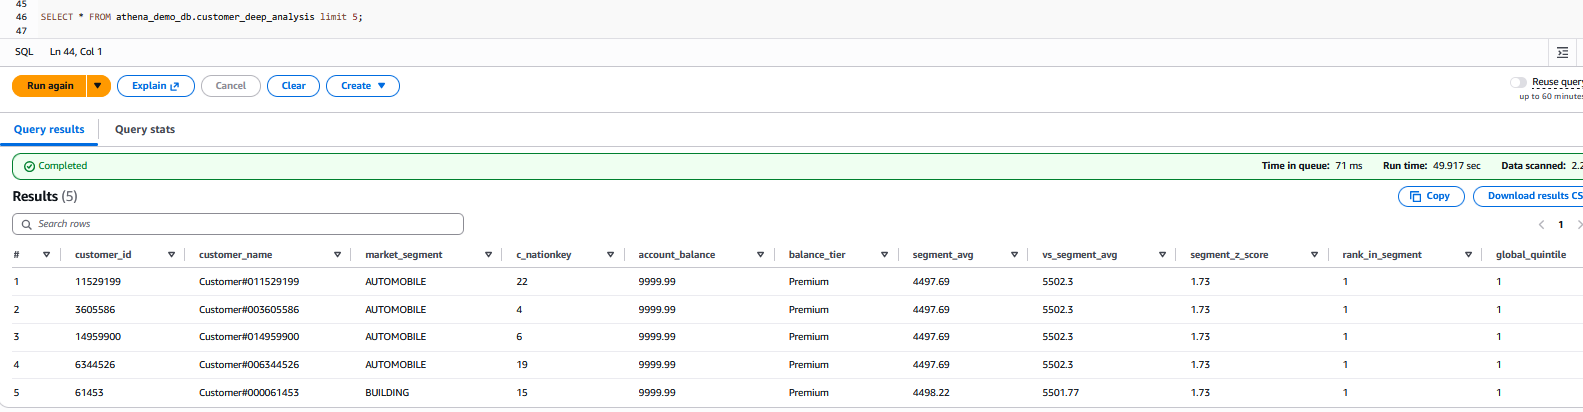
Verify your view from Athena with:
SELECT * FROM athena_demo_db.customer_deep_analysis limit 5;
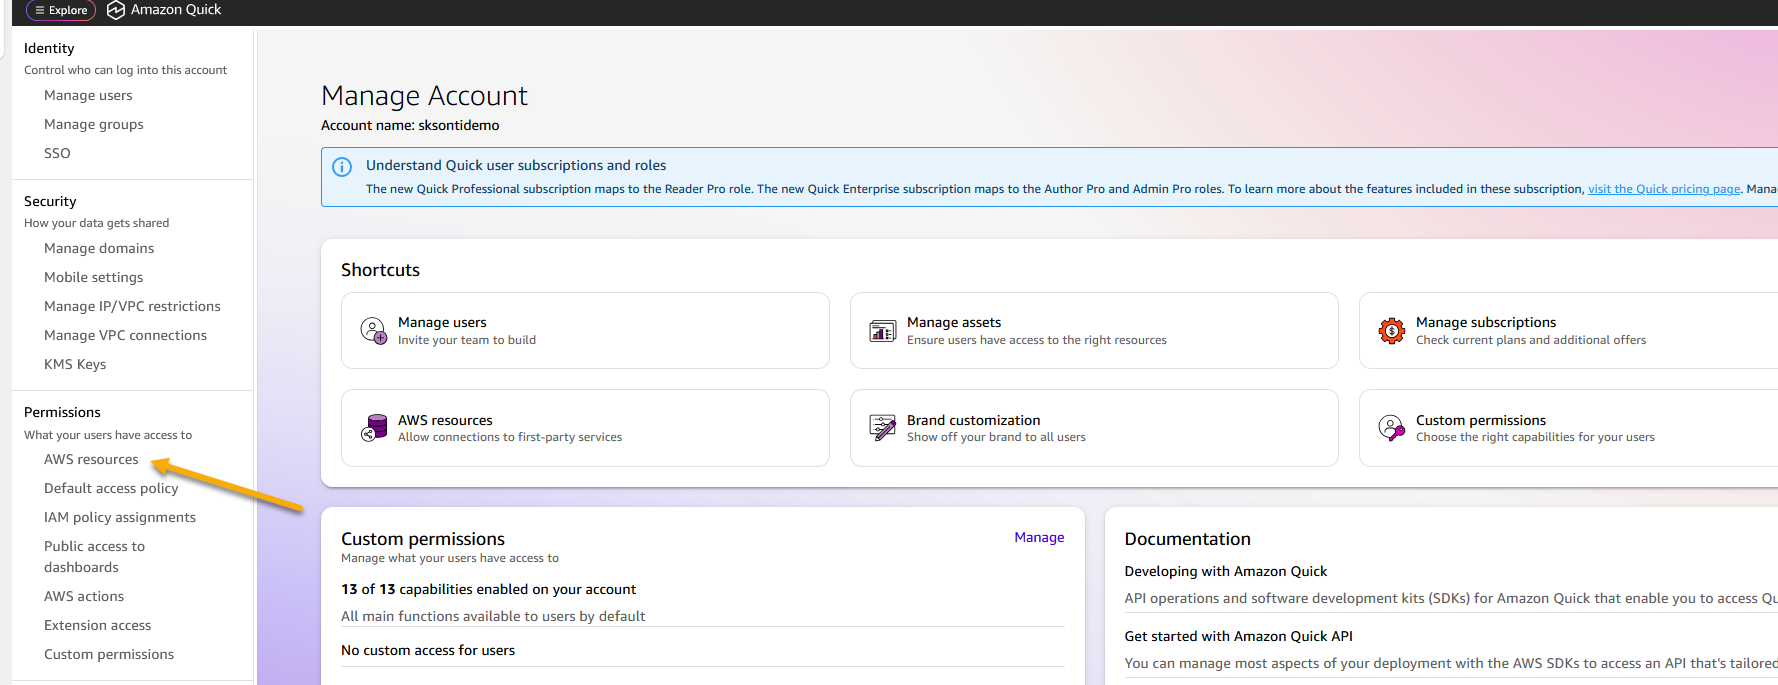
In the top-right corner, choose your profile icon, then select Manage account.
Under Permissions, choose AWS resources. Figure 7: AWS resource permissions
Enable Athena Access
Under Quick access to AWS services, choose Manage.
Locate Amazon Athena in the list of AWS services.
If Athena is already selected but access issues persist, clear the checkbox and re-select it to re-enable Athena.
Under Amazon S3, select S3 buckets.
Check the boxes next to each S3 bucket that Amazon Quick needs to access—including buckets used for Athena query results and any Redshift COPY source buckets.
Enable Write permission for Athena Workgroup to allow Amazon Quick to write Athena query results to S3 and choose Finish.
Choose Save to update the configuration.
The final step is to grant your Amazon Quick author permissions to query your database, Athena tables, and views. Configuration depends on whether AWS Lake Formation is enabled.
If AWS Lake Formation is not enabled
Permissions are managed at the Quick service role level through standard IAM-based S3 access control. Ensure that the Quick service role (for example, aws-quick-service-role-v0) has the appropriate IAM permissions for the relevant S3 buckets and Athena resources. No additional Lake Formation configuration is required.
If AWS Lake Formation is enabled
Lake Formation acts as the central authorization layer, overriding standard IAM-based S3 permissions. Grant permissions directly to the Amazon Quick author or IAM role.
Choose Permissions, then Data permissions, then Grant.
Select the IAM user or role.
Choose the required databases, tables, and columns.
Grant SELECT at minimum; add DESCRIBE for dataset creation.
Repeat for each user or role that requires access.
Create data source
Follow these steps to create an Athena data source on Amazon Quick.
In the Amazon Quick console, navigate to Datasets and choose Data sources tab.
Choose Create data source, then select the Amazon Athena card.
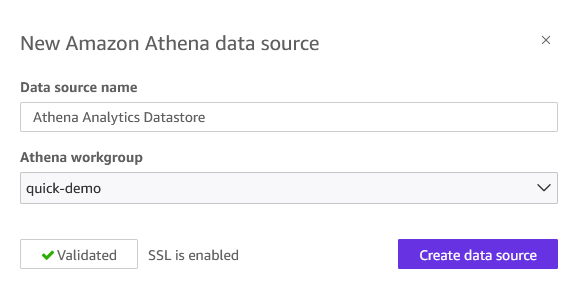
Enter a Data source name (you can give any name of your choice), select your Athena workgroup (like quick-demo), and choose Validate connection.
Figure 8: Athena data source creation
Choose Create data source.
Your Athena data source is now available for building datasets, dashboards, and Topics.
Use Amazon Quick generative AI features
The next steps, from 5–8, demonstrate Amazon Quick generative AI capabilities using Amazon Redshift as a data source. While we use Amazon Redshift in this example, you can substitute with Amazon Athena based on your specific requirements.
Create dashboards
Let’s start by creating datasets from the Amazon Redshift data source.
In the left navigation pane, choose Datasets.
On the Datasets page, choose Create Dataset.
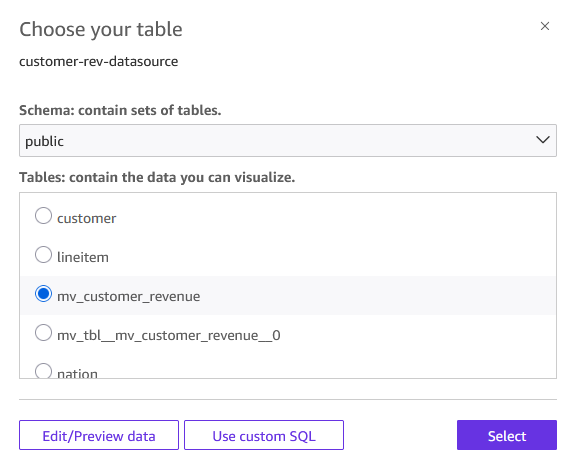
For the data source, select Amazon Redshift data source customer-rev-datasource.
From the menu, choose mv_customer_revenue.
Figure 9: Select table to visualize
You can choose one of the following query modes. For this post, select Directly query your data option and choose Visualize.
Import to SPICE for quicker analytics – Quick loads a snapshot into its in-memory engine for faster dashboard performance.
Directly queryyour data– Quick runs queries on demand against your query engine.
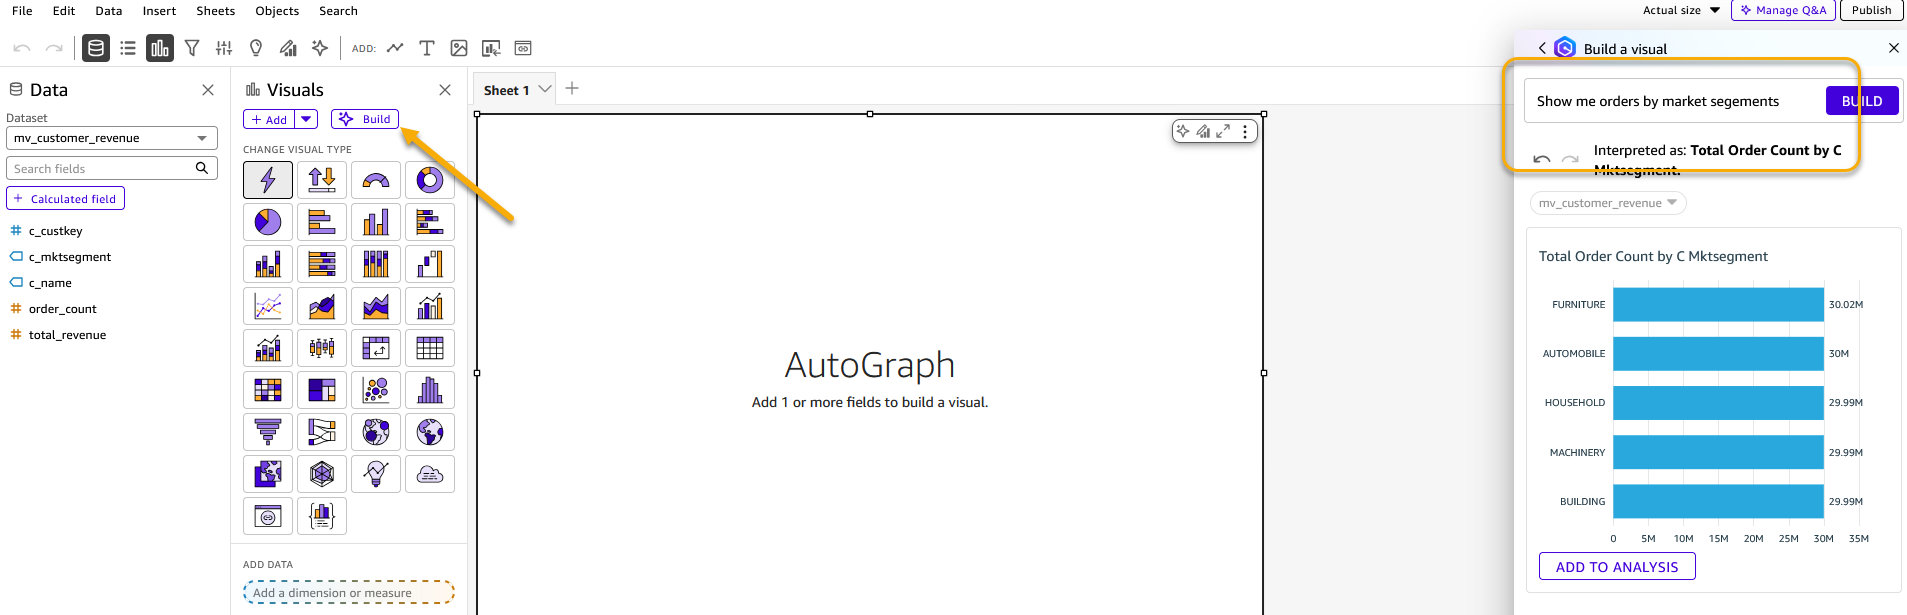
Select Build icon to open a chat window. Enter “Show me orders by market segments” as the prompt. Note that you need Author Pro access to use this feature.
Figure 10: Build visualization using generative BI feature
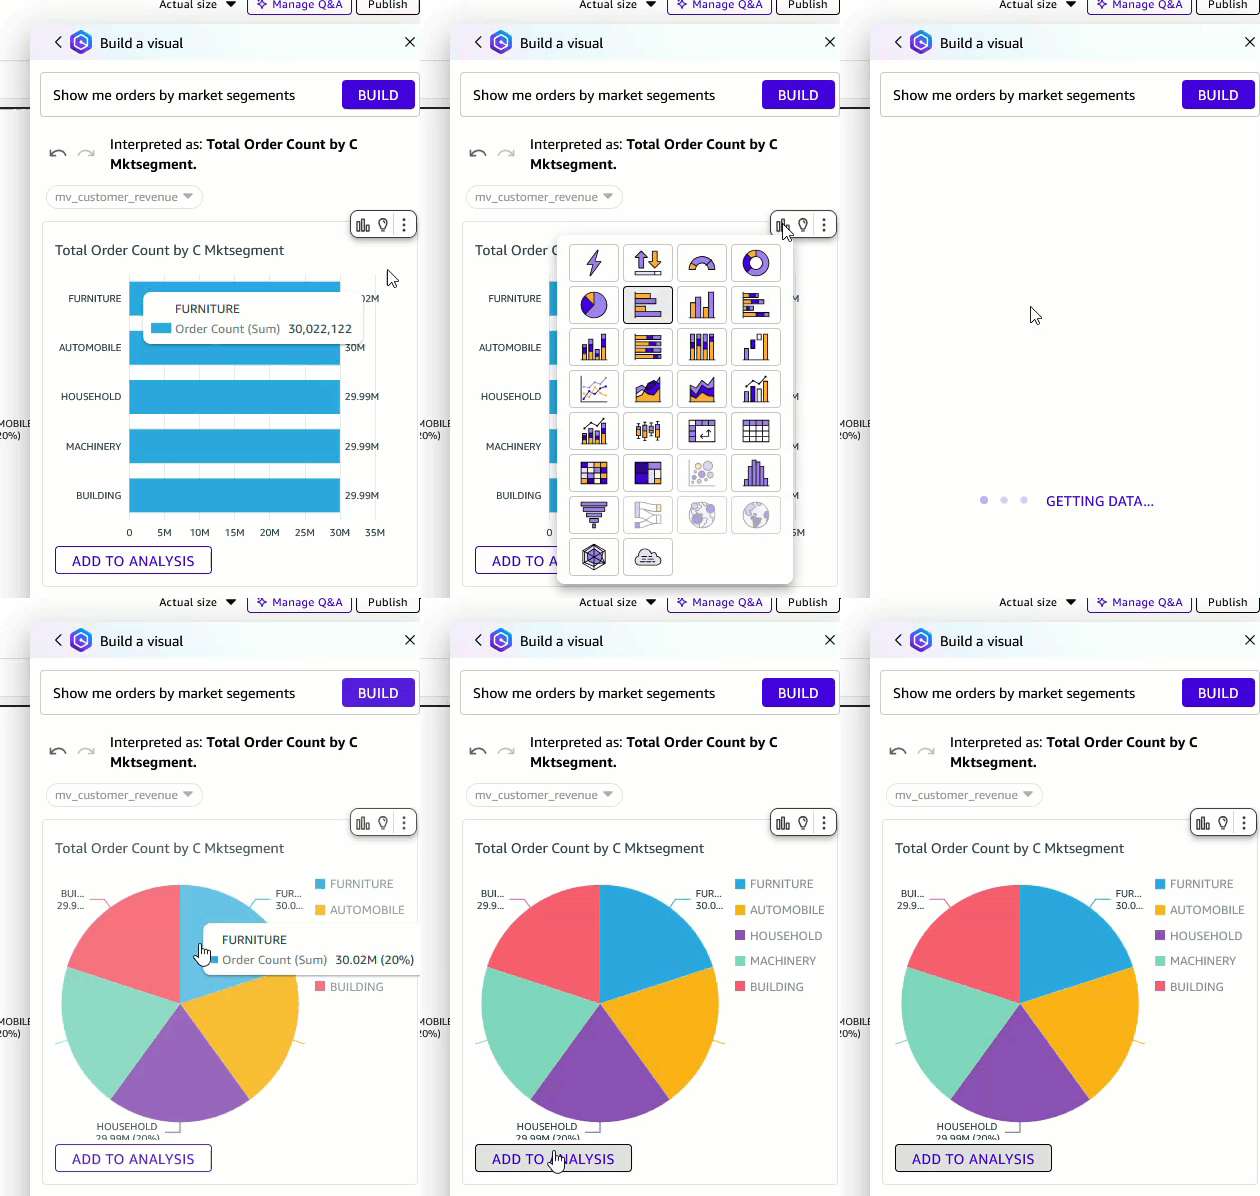
You can change the visual type to a pie chart and add it to the analysis.
Choose Publish dashboard. Your dashboard is now available for viewing and sharing.
Create topics and spaces
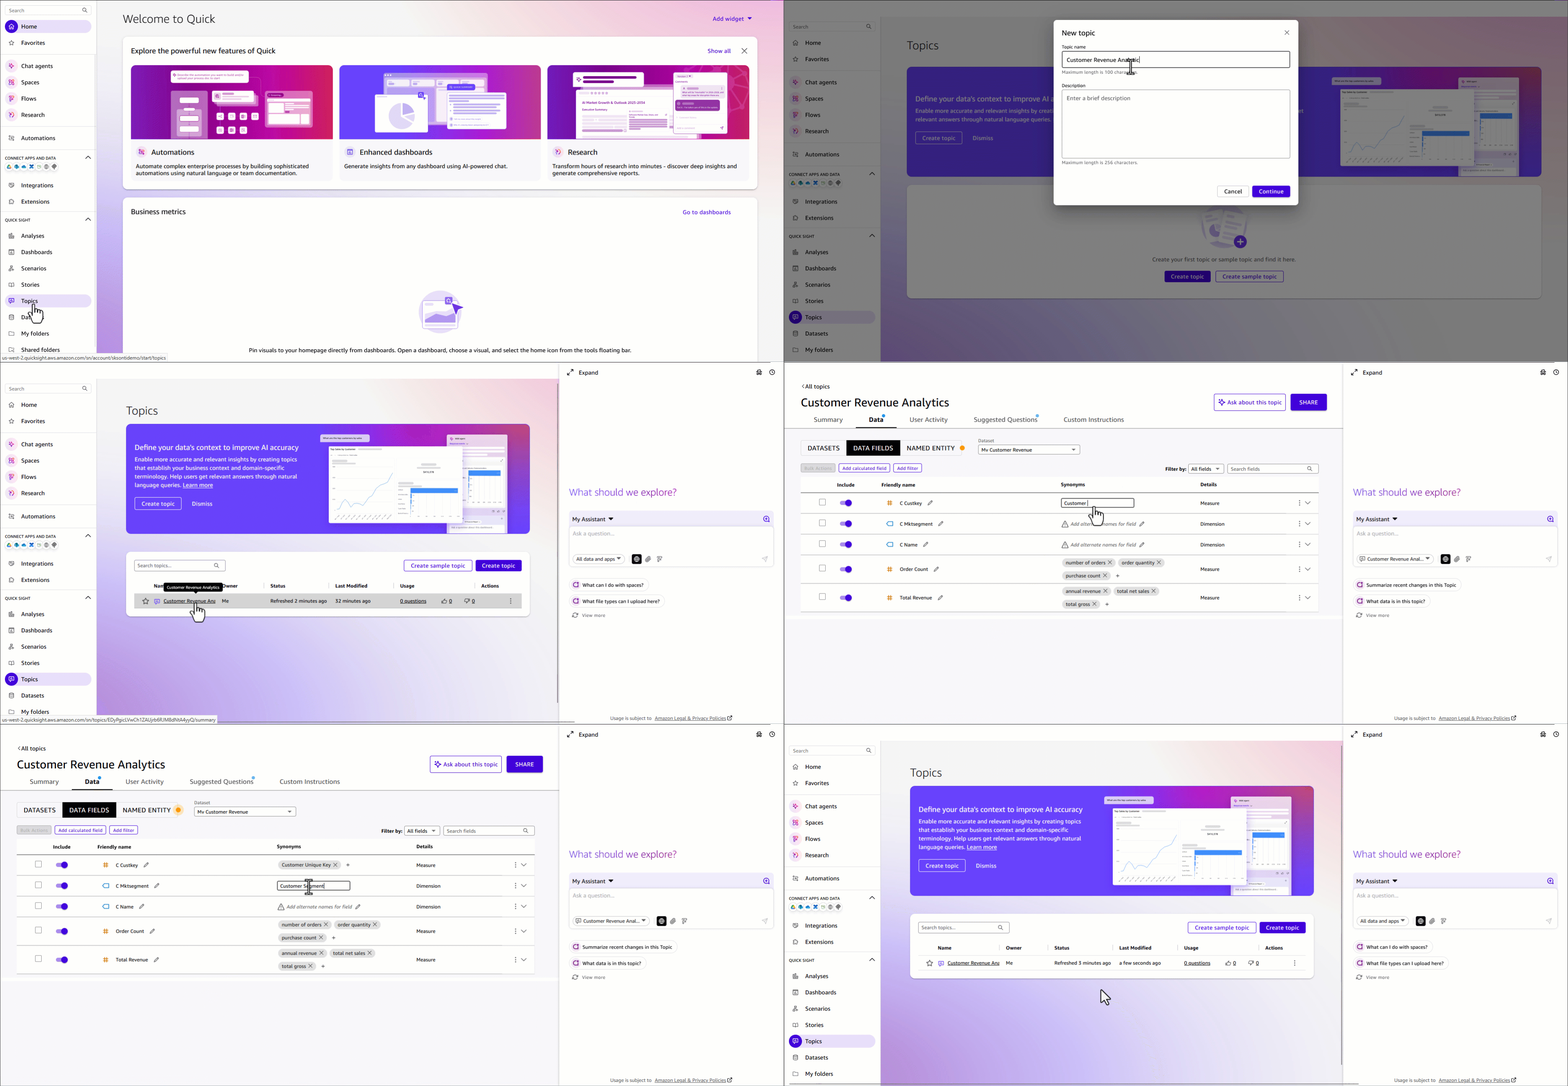
To fully maximize enterprise data with AI, we must provide the right structure and context. That’s where Topics and Spaces come in. Topics act as natural language interfaces to your structured datasets, automatically analyzing your data, mapping fields, and adding synonyms. Business users can ask “What are total revenues by market segment?” and receive instant, visualized answers without writing a single line of SQL. Spaces bring together all of your related assets into a single collaborative workspace that democratizes data access, reduces context-switching, accelerates team onboarding, so everyone is working from the same trusted, AI-ready data sources.
To create a Quick topic
From the Amazon Quick homepage, choose Topics, then choose Create topic.
Enter a name for your topic. For this post, use Customer Revenue Analytics.
Enter a description. For example:
The Customer Revenue Analytics topic is designed for business users (including analysts, sales operations teams, finance, and market segment owners who need to explore customer and revenue data without SQL expertise. It serves as a natural language interface over the mv_customer_revenue Amazon Redshift dataset, allowing users to ask plain-English questions like “What are total revenues by market segment?” and receive instant, visualized answers. By automatically mapping business language to the underlying schema, it democratizes access to revenue insights across the organization.
Under Dataset, select mv_customer_revenue.
Choose Create. The topic can take 15–30 minutes to enable depending on the data. During this time, Amazon Quick automatically analyzes your data, selects relevant fields, and adds synonyms.
After the topic is enabled, take a few minutes to review and enrich it. The following are some example enrichments.
Add column descriptions to clarify field meaning for business users.
Define preferred aggregations (for example, sum compared to average for revenue fields).
Confirm which fields are Dimensions and which are Measures.
(Optional) To further refine how your topic interprets and responds to queries, add multiple datasets (for example, a customer CSV combined with a database view), custom instructions, filters, and calculated fields.
After your topic is created, its columns are available to add to a Space or to an Agent by selecting it as a data source.
Figure 11: Create a Quick Topic
Create a Space for your team
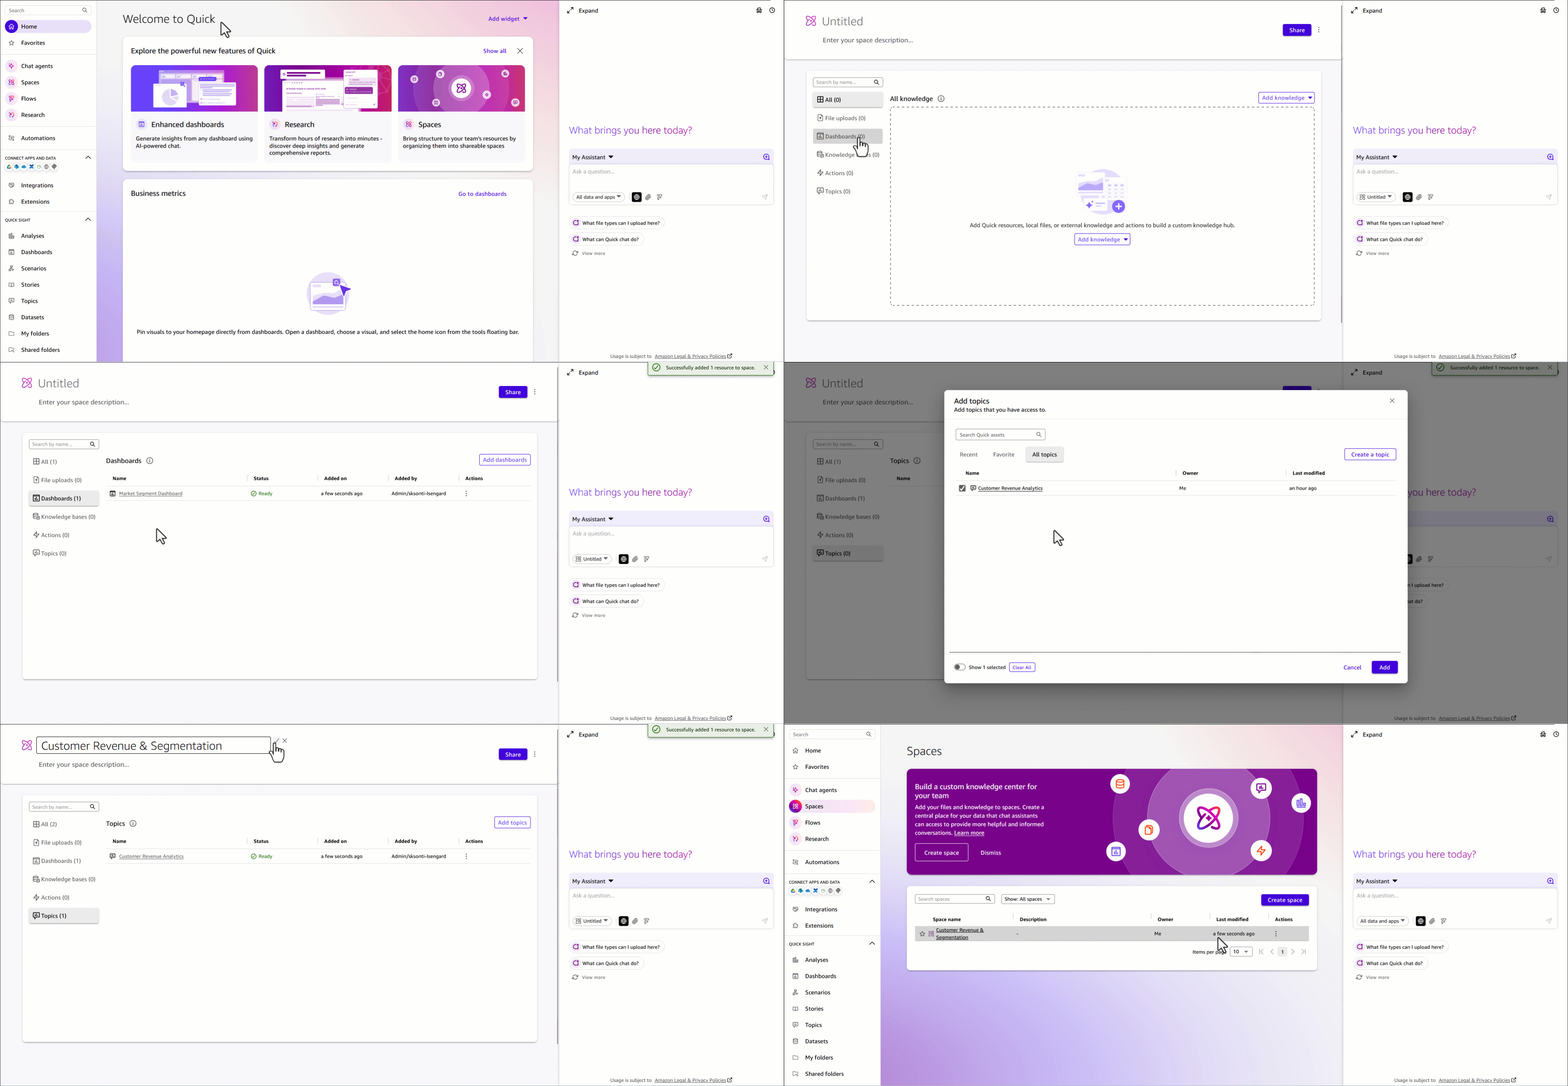
Spaces bring together dashboards, topics, datasets, documents, and other resources into organized, collaborative workspaces. By centralizing related assets in a single workspace, Spaces reduce context-switching, accelerate onboarding, so everyone is working from the same trusted data sources.
What to include in your Quick Space
Dashboard – Add the dashboard Market Segment Dashboard published from your mv_customer_revenue analysis. This gives team members instant access to visualizations such as revenue by market segment, top customers by order volume, and revenue distribution.
Topic – Connect the Customer Revenue Analytics (built on the mv_customer_revenue materialized view) to enable natural language queries directly against your Amazon Redshift data.
Optionally, you can upload supporting context to ground your team’s analysis:
Data dictionary or field definitions for mv_customer_revenue
Business rules for revenue calculation (for example, how discounts are applied in the TPC-H model)
This implementation guide, so new team members can onboard quickly
To create the Quick Space
From the left navigation menu, choose Spaces, then choose Create space.
Enter a name, for example, Customer Revenue & Segmentation.
Enter a description. For example:
Centralized workspace for customer revenue analysis powered by Amazon Redshift includes interactive dashboards, natural language query access to customer and segment data, and supports documentation for the TPC-H revenue model.
Add knowledge by connecting the Market Segment Dashboard and topic Customer Revenue Analytics.
You can invite team members, such as finance, sales operations, and segment owners, and set appropriate permissions.
Your Space is now ready for collaborative data exploration.
Figure 12: Create a Quick Space
Build chat agents
A custom chat agent delivers conversational AI experiences that understand business context and provide intelligent, grounded responses to user queries. These agents go beyond question-and-answer interactions. They synthesize knowledge from your dashboards, topics, datasets, and documents to explain trends, surface anomalies, guide users through complex analytics workflows, and recommend next steps.
Rather than requiring users to navigate multiple tools or write SQL queries, agents serve as a single conversational interface to your entire analytics environment. Agents can also connect to Actions, pre-built integrations with enterprise tools such as Slack, Microsoft Teams, Outlook, and SharePoint, enabling them to answer questions and trigger real-world workflows, send notifications, create tasks, and interact with external systems directly from the conversation. Custom agents can be tailored to specific business domains, teams, or use cases so that responses align with organizational terminology, data definitions, and business processes. After created, agents can be shared across teams, enabling consistent, actionable, AI-powered data access at scale. For teams working with the mv_customer_revenue dataset, we recommend creating a dedicated Customer Revenue Analysis Agent. This is a purpose-built conversational assistant grounded in your Amazon Redshift data, dashboards, and the Customer Revenue & Segmentation Space.
Create a Quick chat agent
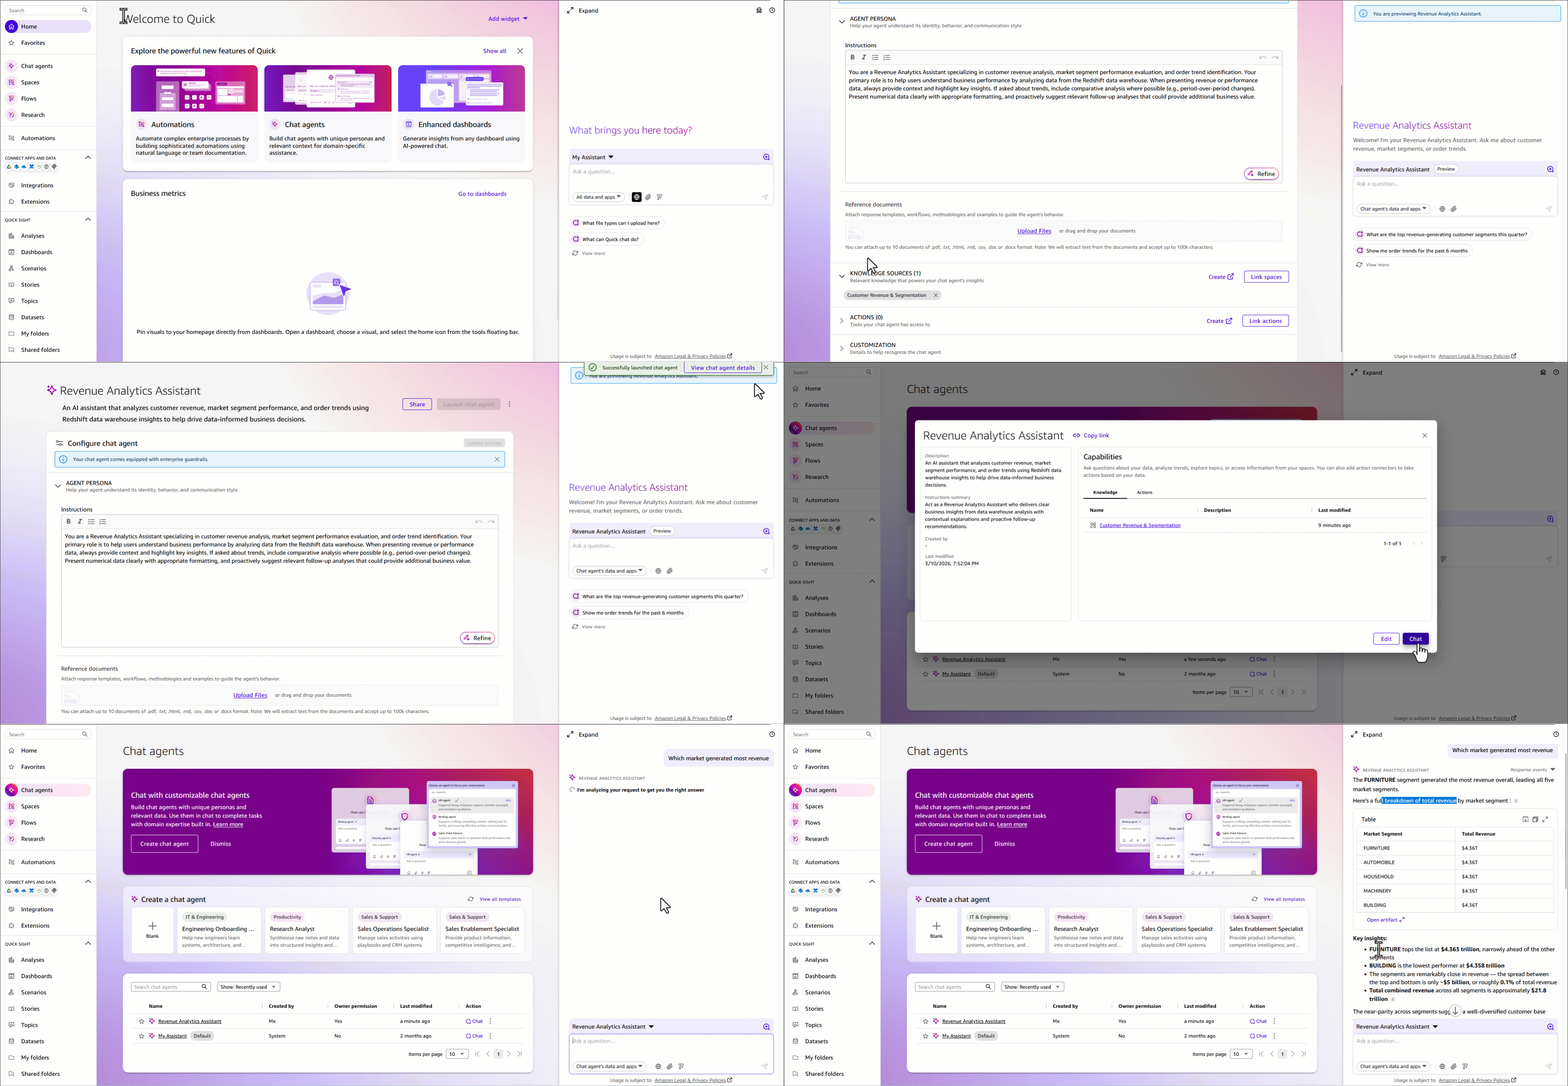
There are two ways that you can use Amazon Quick to create a Quick agent. You can use the navigation menu or directly from Space. The following steps walk you through creating one from the navigation menu.
To create a Quick chat agent
From the left navigation menu, choose Agents, then choose Create agent.
Enter a name for your agent, for example, Customer Revenue Analyst.
Enter a description. For example:
An AI assistant for analyzing customer revenue, market segment performance, and order trends using our Amazon Redshift or data warehouse.
Under Knowledge Sources, add the Customer Revenue & Segmentation Space as a data source. This gives your agent access to the dashboards, topics, and reference documents you’ve already built.
(Optional) Define custom persona instructions to align the agent’s responses with your business context. For example, specifying preferred terminology, response style, or the types of questions it should prioritize.
Choose Launch chat agent.
Start having a conversation with your data. You are welcome to ask any questions. The following are some examples.
Which market segment generated most revenue?
Show me order trends
Figure 13: Create a Quick Chat agent
To share your Quick chat agent
After your agent is published, choose Share and invite team members or share it across your organization. Custom agents can be tailored to specific business contexts so that different teams can get AI assistance that speaks their language, without needing to configure anything themselves.
Create Quick Flows
Quick Flows automate repetitive tasks and orchestrate multi-step workflows across your entire analytics environment. This removes manual effort, reducing human error, and ensuring consistent execution of critical business processes. Flows can be triggered on a schedule or launched on demand, giving you flexible control over when and how automation runs.
You can build flows that span the full analytics lifecycle: monitoring data quality and flagging anomalies, generating and distributing scheduled reports to stakeholders, and triggering downstream actions in integrated systems such as Slack, Outlook. Amazon Quick gives you three ways to create a flow, so whether you prefer a no-code conversation or a visual step-by-step builder, there’s an option that fits how you work.
To create a flow from chat
While conversing with My Assistant or a custom agent, describe the workflow that you want to automate in plain English.
Amazon Quick generates the flow and offers to create it directly from your conversation — no configuration screens required.
To create a flow from a natural language description
From the left navigation menu, choose Flows, then choose Create flow.
Enter a plain-English description of your workflow. For example:
” Query revenue data by market segments. Filter by order count and all dates. Search web for comparable relevant market trends. Generate formatted summary reports providing market summary and look ahead per segment. ”
Amazon Quick automatically generates the complete workflow with all the necessary steps.
Optionally, you can add additional steps.
Choose Run Mode to test the Flow.
After your flow is created, share it with team members or publish it to your organization’s flow library, so everyone benefits from the same automation without having to rebuild it independently.
Figure 14: Create a Quick Flow to generate summaries and publish dashboards
For more complex flow, review weekly customer revenue summary flow as an example.
Queries the mv_customer_revenue materialized view in Amazon Redshift for the latest weekly revenue figures by market segment.
Compares results against the prior week to calculate segment-level variance.
Generates a formatted summary report and publishes it to the Customer Revenue & Segmentation Space.
Sends a notification through email or Slack to finance, sales operations, and segment owners with a direct link to the updated dashboard.
Flags any segment where revenue has declined more than a defined threshold, routing an alert to the appropriate owner for follow-up.
This flow transforms what might otherwise be a manual, multi-step reporting process into a fully automated pipeline, so stakeholders receive consistent, timely revenue insights without analyst intervention and saving analysts an estimated 3–5 hours per week. For detailed guidance on creating and managing flows, see Using Amazon Quick Flows. Also review Create workflows for routine tasks demo.
Cleanup
Consider deleting the following resources created while following this post to avoid incurring costs. We encourage you to use the trials at no cost as much as possible to familiarize yourself with the features described.
Delete the Amazon Quick account used while following this post. If you used an existing account, delete the data sets, dashboards, topics, spaces, agents and flows created.
Conclusion
This integrated approach to business intelligence combines the power of AWS SQL analytics engines with Amazon Quick generative AI capabilities to deliver comprehensive analytics solutions. By following these implementation steps, you establish a foundation for traditional BI reporting, interactive dashboards, natural language data exploration, and intelligent workflow automation. The architecture scales from proof-of-concept implementations to production deployments, transforming how organizations access and act on data insights. For more information about Amazon Quick features and capabilities, see the Amazon Quick documentation. To learn more about Amazon Redshift, visit the Amazon Redshift product page. For Amazon Athena details, see the Amazon Athena product page.
At the end of 2025 I was happy to take a long break to enjoy the incredible summers that the southern hemisphere provides. I’m back and writing my first post in 2026 which also happens to be my last post for the AWS News Blog (more on this later).
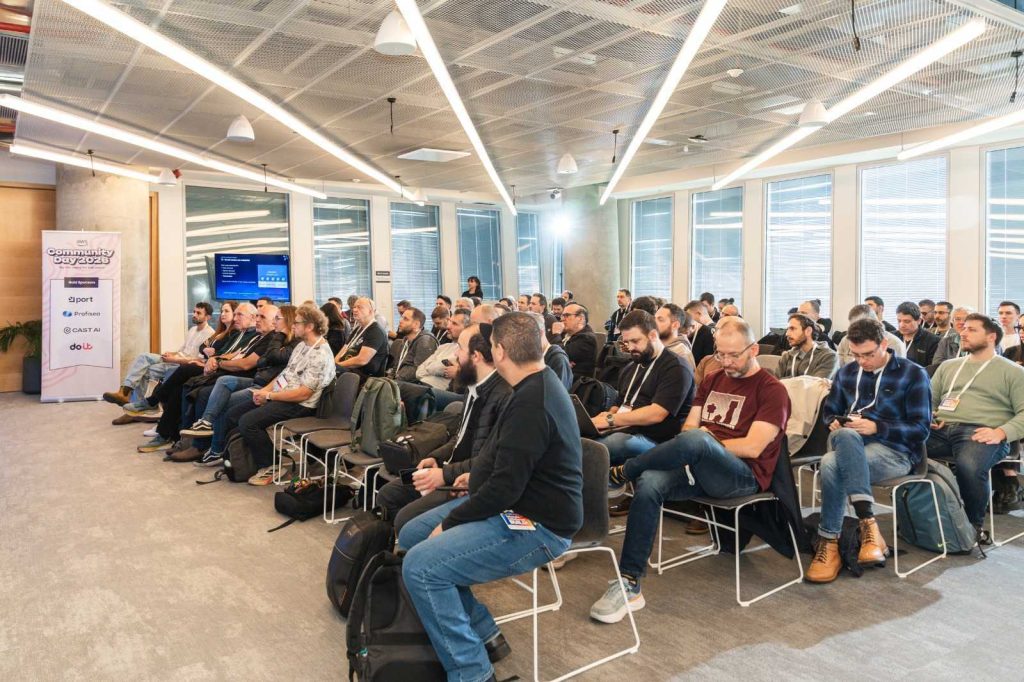
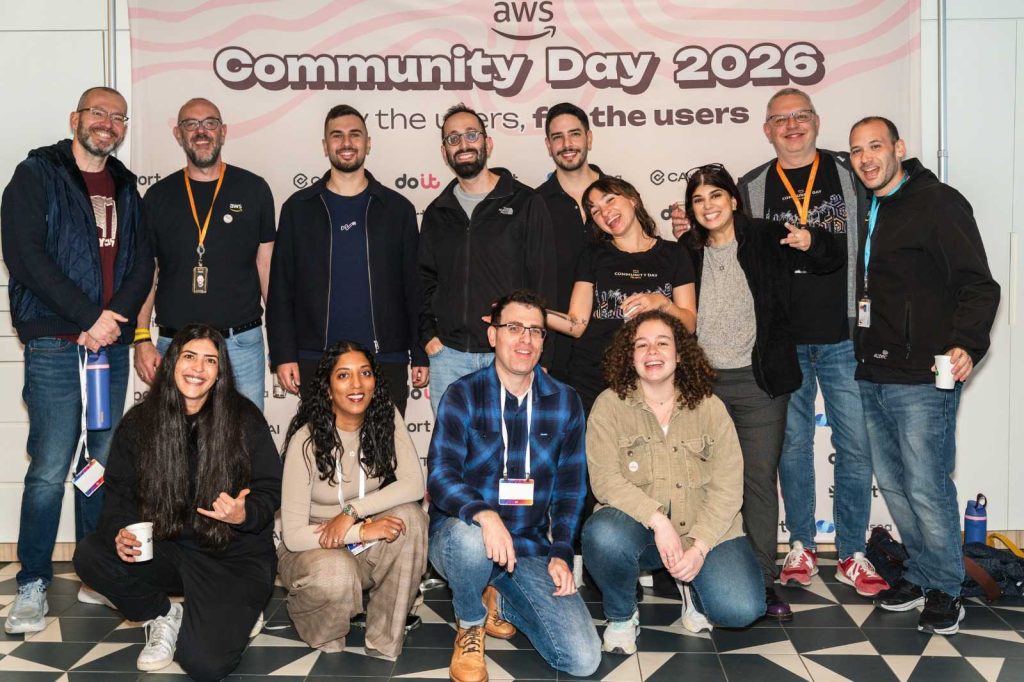
The AWS community is starting the year strong with various AWS re:invent re:Caps being hosted around the globe, with some communities already hosting their AWS Community Day events, the AWS Community Day Tel Aviv 2026 was hosted last week.
Last week’s launches Here are last week’s launches that caught my attention:
Kiro CLI latest features – Kiro CLI now has granular controls for web fetch URLs, keyboard shortcuts for your custom agents, enhanced diff views, and much more. With these enhancements, you can now use allowlists or blocklists to restrict which URLs the agent can access, ensure a frictionless experience when working with multiple specialized agents in a single session, to name a few.
Amazon EC2 X8i instances – Previously launched in preview at AWS re:Invent 2025, last week we announced the general availability of new memory-optimized Amazon Elastic Compute Cloud (Amazon EC2) X8i instances. These instances are powered by custom Intel Xeon 6 processors with a sustained all-core turbo frequency of 3.9 GHz, available only on AWS. These SAP certified instances deliver the highest performance and fastest memory bandwidth among comparable Intel processors in the cloud.
Additional updates These projects, blog posts, and news articles also caught my attention:
5 core features in Amazon Quick Suite – AWS VP Agentic AI Swami Sivasubramanian talks about how he uses Amazon Quick Suite for just about everything. In October 2025 we announced Amazon Quick Suite, a new agentic teammate that quickly answers your questions at work and turns insights into actions for you. Amazon Quick Suite has become one of my favorite productivity tools, helping me with my research on various topics in addition to providing me with multiple perspectives on a topic.
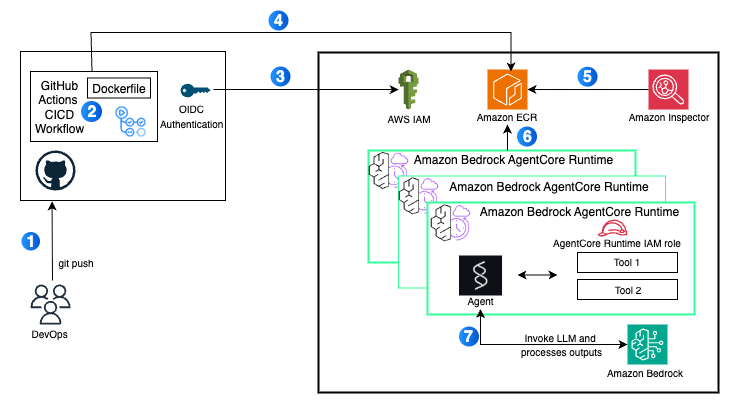
Deploy AI agents on Amazon Bedrock AgentCore using GitHub Actions – Last year we announced Amazon Bedrock AgentCore, a flexible service that helps you seamlessly create and manage AI agents across different frameworks and models, whether hosted on Amazon Bedrock or other environments. Learn how to use a GitHub Actions workflow to automate the deployment of AI agents on AgentCore Runtime. This approach delivers a scalable solution with enterprise-level security controls, providing complete continuous integration and delivery (CI/CD) automation.
Upcoming AWS events Join us January 28 or 29 (depending on your time zone) for Best of AWS re:Invent, a free virtual event where we bring you the most impactful announcements and top sessions from AWS re:Invent. Jeff Barr, AWS VP and Chief Evangelist, will share his highlights during the opening session.
There is still time until January 21 to compete for $250,000 in prizes and AWS credits in the Global 10,000 AIdeas Competition (yes, the second letter is an I as in Idea, not an L as in like). No code required yet: simply submit your idea, and if you’re selected as a semifinalist, you’ll build your app using Kiro within AWS Free Tier limits. Beyond the cash prizes and potential featured placement at AWS re:Invent 2026, you’ll gain hands-on experience with next-generation AI tools and connect with innovators globally.
If you’re interested in these opportunities, join the AWS Builder Center to learn with builders in the AWS community.
With that, I close one of my most meaningful chapters here at AWS. It’s been an absolute pleasure to write for you and I thank you for taking the time to read the work that my team and I pour our absolute hearts into. I’ve grown from the close collaborations with the launch teams and the feedback from all of you. The Sub-Sahara Africa (SSA) community has grown significantly, and I want to dedicate more time focused on this community, I’m still at AWS and I look forward to meeting at an event near you!
To provide the best experiences, we use technologies like cookies to store and/or access device information. Consenting to these technologies will allow us to process data such as browsing behavior or unique IDs on this site. Not consenting or withdrawing consent, may adversely affect certain features and functions.
Functional
Always active
The technical storage or access is strictly necessary for the legitimate purpose of enabling the use of a specific service explicitly requested by the subscriber or user, or for the sole purpose of carrying out the transmission of a communication over an electronic communications network.
Preferences
The technical storage or access is necessary for the legitimate purpose of storing preferences that are not requested by the subscriber or user.
Statistics
The technical storage or access that is used exclusively for statistical purposes.The technical storage or access that is used exclusively for anonymous statistical purposes. Without a subpoena, voluntary compliance on the part of your Internet Service Provider, or additional records from a third party, information stored or retrieved for this purpose alone cannot usually be used to identify you.
Marketing
The technical storage or access is required to create user profiles to send advertising, or to track the user on a website or across several websites for similar marketing purposes.