Tag Archives: Amazon Elastic Block Store (Amazon EBS)

AWS Weekly Roundup: OpenAI GPT-6 Astra on Amazon Bedrock, Amazon Quick desktop GA, Kiro for students, and more (September 14, 2026)

Post Syndicated from Micah Walter original https://aws.amazon.com/blogs/aws/aws-weekly-roundup-openai-gpt-6-astra-on-amazon-bedrock-amazon-quick-desktop-ga-kiro-for-students-and-more-september-14-2026/

There’s a particular energy to mid-September in New York. Pumpkin spice lattes are flowing, temperatures are dropping, and it’s nearly sweater weather. The city is back at full speed, and so is the AWS launch calendar. This week that energy showed up in a new frontier model on Amazon Bedrock, a desktop app for Amazon Quick, and a reminder that the developers seeing the biggest gains from AI agents aren’t just using better tools — they’re working differently.

Let’s dive in.

Headlines
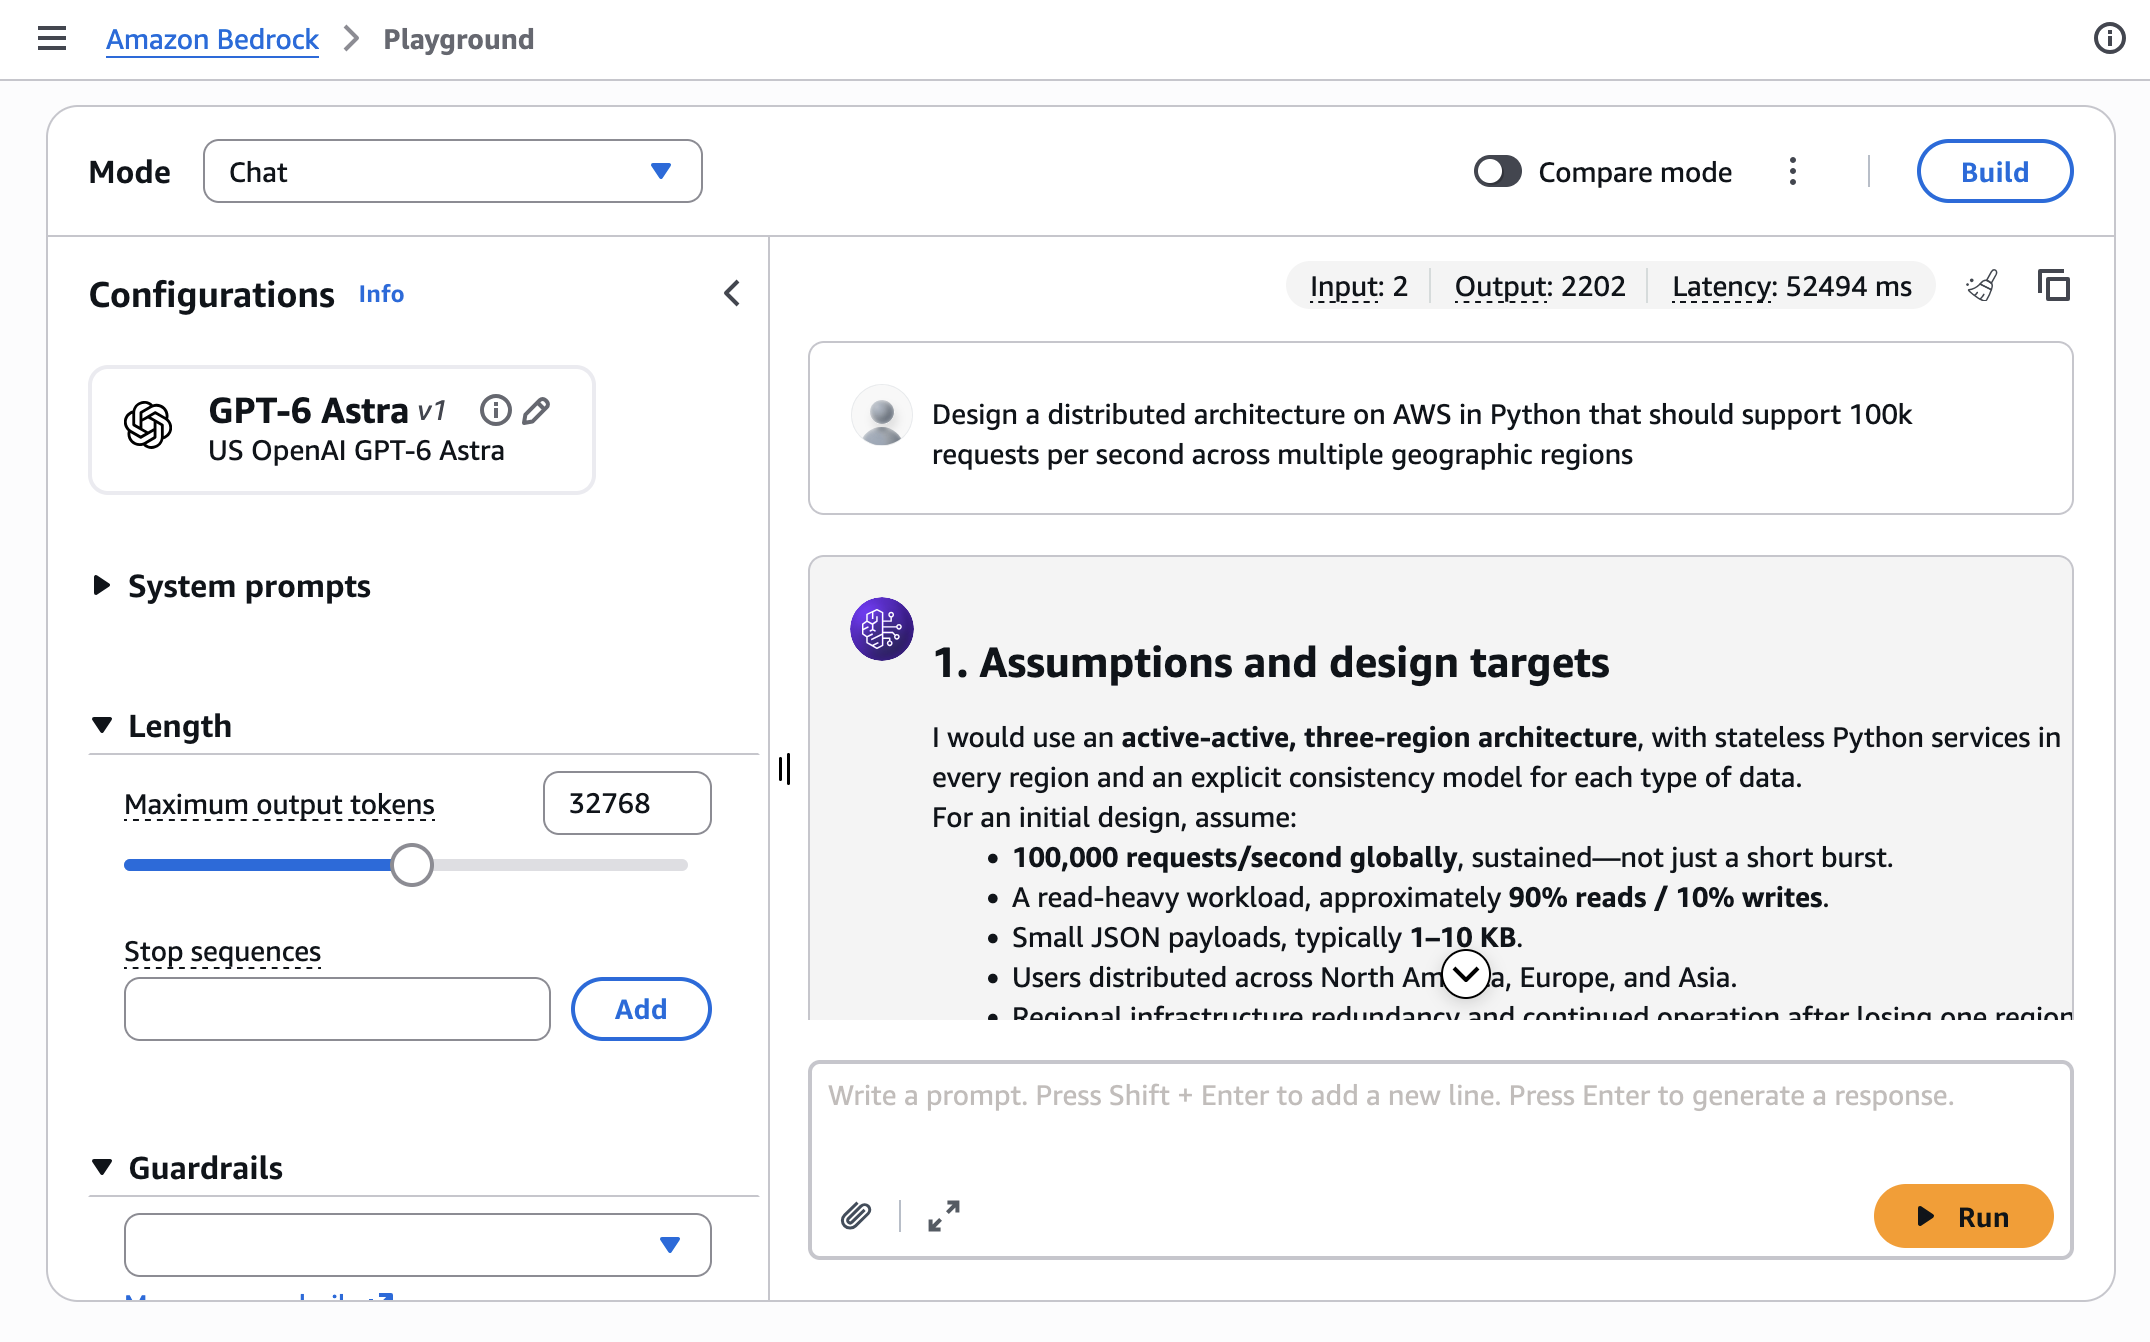
OpenAI GPT-6 Astra is now generally available on Amazon Bedrock – GPT-6 Astra is OpenAI’s latest and most capable model to date, and you can now run it on Amazon Bedrock. It brings deeper reasoning and judgment, professional-quality writing and design, and advanced computer and browser use to demanding business workflows. The model supports a context window of up to 1 million input tokens, so you can send it large codebases, long contracts, or extensive document collections and ask it to reconcile competing inputs.

You can call GPT-6 Astra through supported Amazon Bedrock APIs, or configure ChatGPT Work and Codex to use the model on Amazon Bedrock. Alongside the launch, OpenAI is introducing new enterprise plugins for ChatGPT Work that extend Astra’s browser-use capabilities across common business applications. Established AWS controls help you secure workloads, govern access, and audit model invocation activity, and your inference data isn’t used for model training. Read more

Last week’s launches
Here are some launches and updates from this past week that caught my attention:

  • Amazon Quick desktop app is now generally available on macOS and Windows – The Amazon Quick desktop app brings Amazon Quick to your computer, where it can work with local files and stay connected to your calendar, email, and business apps in the background. Conversations, context, and agents stay synchronized across desktop and mobile, so work you start on one surface carries over to the other. With this release, Quick agents also keep running after you close your computer, which means you can start a long-running task before you leave the office, add input from the mobile app on the way home, and review the result when you get there. Existing Quick users can download the desktop app, and the mobile app is available from the Apple App Store and Google Play. Read more
  • AWS Lambda now supports a 90-minute function timeout on Lambda Managed Instances – You can now configure a function timeout of up to 90 minutes for asynchronous and event source mapping (ESM) invocations on Lambda Managed Instances, a 6x increase from the previous 15-minute limit. That opens the door to data processing, media transcoding, financial calculations, AI inference, and batch jobs that need longer continuous execution, without splitting the work across multiple functions. Synchronous invocations keep the existing 15-minute maximum. The longer timeout also applies to steps inside Lambda durable functions, which can still run for up to a year when invoked asynchronously. Read more
  • Amazon EBS Volume Clones now copies volumes across accounts – Amazon Elastic Block Store (Amazon EBS) Volume Clones can now copy a volume into another AWS account and re-encrypt it with an AWS Key Management Service (AWS KMS) key in the target account. If you keep production and development in separate accounts, you can share a volume with AWS Resource Access Manager (AWS RAM) and let the target account create a fresh copy in the same Availability Zone, for example, cloning a production database volume into an isolated development account. Cross-account copy works for all volume types, including unencrypted volumes and volumes encrypted with customer managed keys. Read more
  • Second-generation single-rack AWS Outposts is now generally available – The new single-rack AWS Outposts is a self-contained 42U rack that puts compute, storage, and networking into one compact unit for locations that need low latency, local data processing, or data residency, and don’t have room for a larger footprint. A single rack delivers up to 2,688 vCPU and 100 TB of Amazon EBS storage, and supports the latest x86-powered Amazon EC2 instances, including general purpose (M7i, M8i), compute-optimized (C7i, C8i), memory-optimized (R7i, R8i), and Outposts accelerated networking instances. You get the same APIs, console, automation, governance, and security controls as multi-rack Outposts and AWS Regions. Read more
  • Amazon OpenSearch Serverless is now available on v0 by Vercel – You can now describe a search or AI application in natural language inside v0 by Vercel and get a full-stack app backed by Amazon OpenSearch Serverless. v0 provisions a collection, indexes your data, and uses the OpenSearch Serverless endpoint for full-text search and vector search for retrieval-augmented generation (RAG) workloads, without leaving the v0 interface. OpenSearch Serverless scales capacity up and down for you, so you can focus on the application instead of cluster management. You can provision under a new AWS account or link an existing one. Read more
  • AWS Transform for .NET modernization is now generally available via CLI – You can trigger an AWS-managed .NET modernization in AWS Transform custom with a single CLI command, then run it interactively or script it into an existing pipeline. The CLI sits alongside the existing AWS Transform for .NET experiences in the web application, Visual Studio IDE, Kiro Power, and MCP agents. Use it to upgrade language versions, migrate frameworks, optimize performance, and analyze codebases with transformations you can run as-is or customize. The .NET modernization transformation includes 50,000 free agent minutes per month. Read more

For a full list of AWS announcements, be sure to keep an eye on the What’s New with AWS page.

Other AWS news
Here are some additional posts and resources that you might find interesting:

  • Clare Liguori on frontier engineering – If you already use an AI coding assistant but don’t feel like you’re shipping much faster, start here. Clare Liguori, Senior Principal Engineer at AWS, published a practitioner’s manifesto on frontier engineering: ten principles, drawn from teams across Amazon, for changing how you build software with AI agents. The argument is direct. Software development has split in two, people who changed how they work with agents, and people who only changed their coding tools. Frontier engineering is not vibe coding. You spend the first weeks writing steering files, refactoring the codebase, and learning to decompose work for agents. Those weeks feel slower. The weeks after feel dramatically faster, because you’re no longer building the software directly — you’re building the agent setup that builds the software.
  • A free year of Kiro for students around the world – The Kiro Students program is expanding from 11 universities to 121 new schools across 16 countries. Eligible students get one year of Kiro with 1,000 credits per month and full access to paid features such as premium models and Kiro Web, no credit card and no trial timer. You can work in the IDE, the CLI, Kiro Web in a browser, or Kiro Crew. If you’re a student, sign up with your university email.
  • The state of AI for security: measuring what matters for trust – Security teams are using AI for triage, threat modeling, incident response, and code review, but a tool that flags everything doesn’t save time. In The state of AI for security, Anshumali Shrivastava and Neha Rungta introduce Deception Benchmark, a new evaluation that tests whether a model can tell a real vulnerability from code that looks risky but is actually safe. The benchmark includes 14,822 samples across 16 languages and more than 70 Common Weakness Enumeration (CWE) categories. Under standard prompting, precision landed in the mid-50s, about as likely to be inaccurate as accurate, and none of the 12 models tested kept both false positives and false negatives below 10 percent. The post links to the dataset, whitepaper, and submission workflow for verified scoring.
  • Build full-stack AWS applications in minutes with AI-powered scaffolding – Version 1.0 of the Nx Plugin for AWS is an open source toolkit of deterministic generators for APIs, websites, databases, and AI agents, plus the AWS infrastructure to run them. Each generator writes working, deployable code with security, observability, and type-safety already in place, so an AI assistant can assemble the foundation and spend its effort on your application logic. Bingo Industries used it to take a multi-agent operations chatbot from idea to production in less than 3 weeks. The plugin is open source on GitHub. Create a workspace with pnpm create @aws/nx-workspace and point your coding agent at the included MCP server.
  • The oldest architecture in computing – On All Things Distributed, Werner Vogels starts from a question customers always ask “Will AI take my job?”, and lands on memory. After spending time with Kiro Crew, he traces a line from Jeff Hawkins’ A Thousand Brains to how Crew stores, consolidates, and forgets across markdown files, a vector database, and a key-value index. His conclusion: the brain is the oldest architecture in computing, and the people who think hardest about how it works will build the next tools. Now, go build.

For a full list of AWS blog posts, be sure to keep an eye on the AWS Blogs page.

Upcoming AWS events
Check your calendar and sign up for upcoming AWS events:

Join the AWS Builder Center to connect with builders, share solutions, and access content that supports your development. Browse here for upcoming AWS-led in-person and virtual events and developer-focused events.

That’s all for this week. Check back next Monday for another Weekly Roundup!

— Micah

This post is part of our Weekly Roundup series. Check back each week for a quick roundup of interesting news and announcements from AWS!

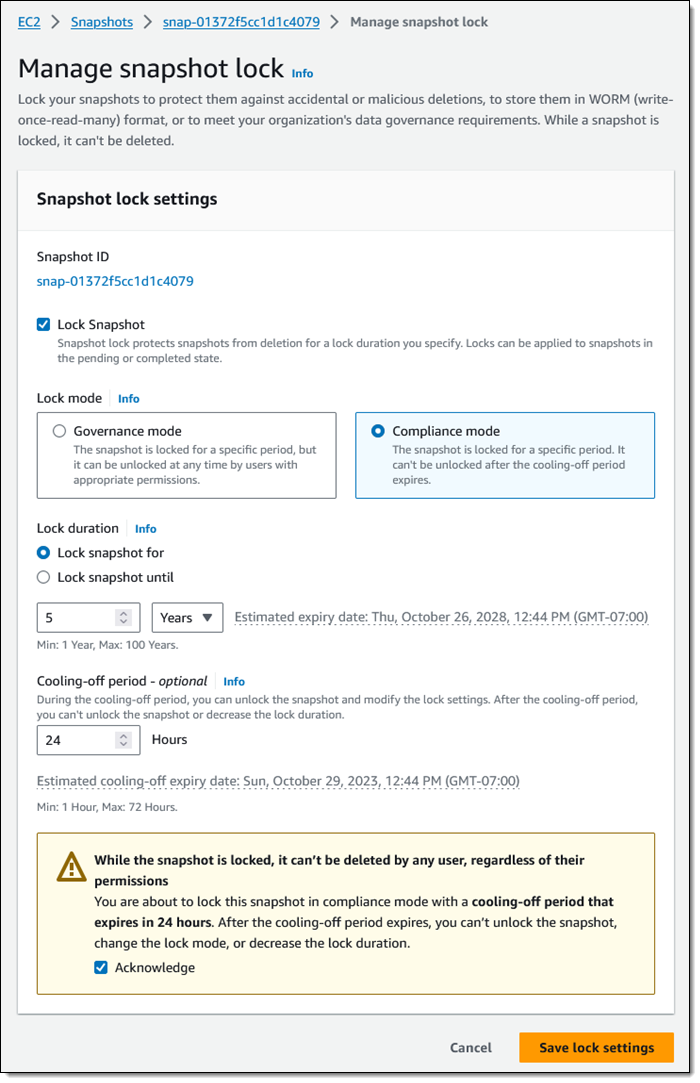
Introducing Amazon EBS Volume Clones across AWS accounts

Post Syndicated from Channy Yun (윤석찬) original https://aws.amazon.com/blogs/aws/introducing-amazon-ebs-volume-clones-across-aws-accounts/

Last year, we introduced Volume Clones of Amazon Elastic Block Store (Amazon EBS), a new capability that lets you create instant point-in-time copies of your EBS volumes within the same Availability Zone.

Today, we are extending Volume Clones with cross-account copy, so you can create copies of your EBS volumes into other AWS accounts and optionally re-encrypt them with an AWS Key Management Service (AWS KMS) key in the target account.

With this new feature, you can use your latest application data to develop, test, and experiment in a secondary environment, while protecting and isolating the information in the production environment. For example, you can create copies of a production environment to refresh test and development environments set up in separate accounts with the desired EBS encryption.

Copy EBS volumes across AWS accounts in action
To create a copy of an EBS volume across accounts, the owners of the volume can first grant the target account access to their volume in AWS Resource Access Manager (RAM), which provides a way to share resources across AWS accounts or within an AWS Organization. Then, from the target account, they can locate the volume they have access to create a copy of it.

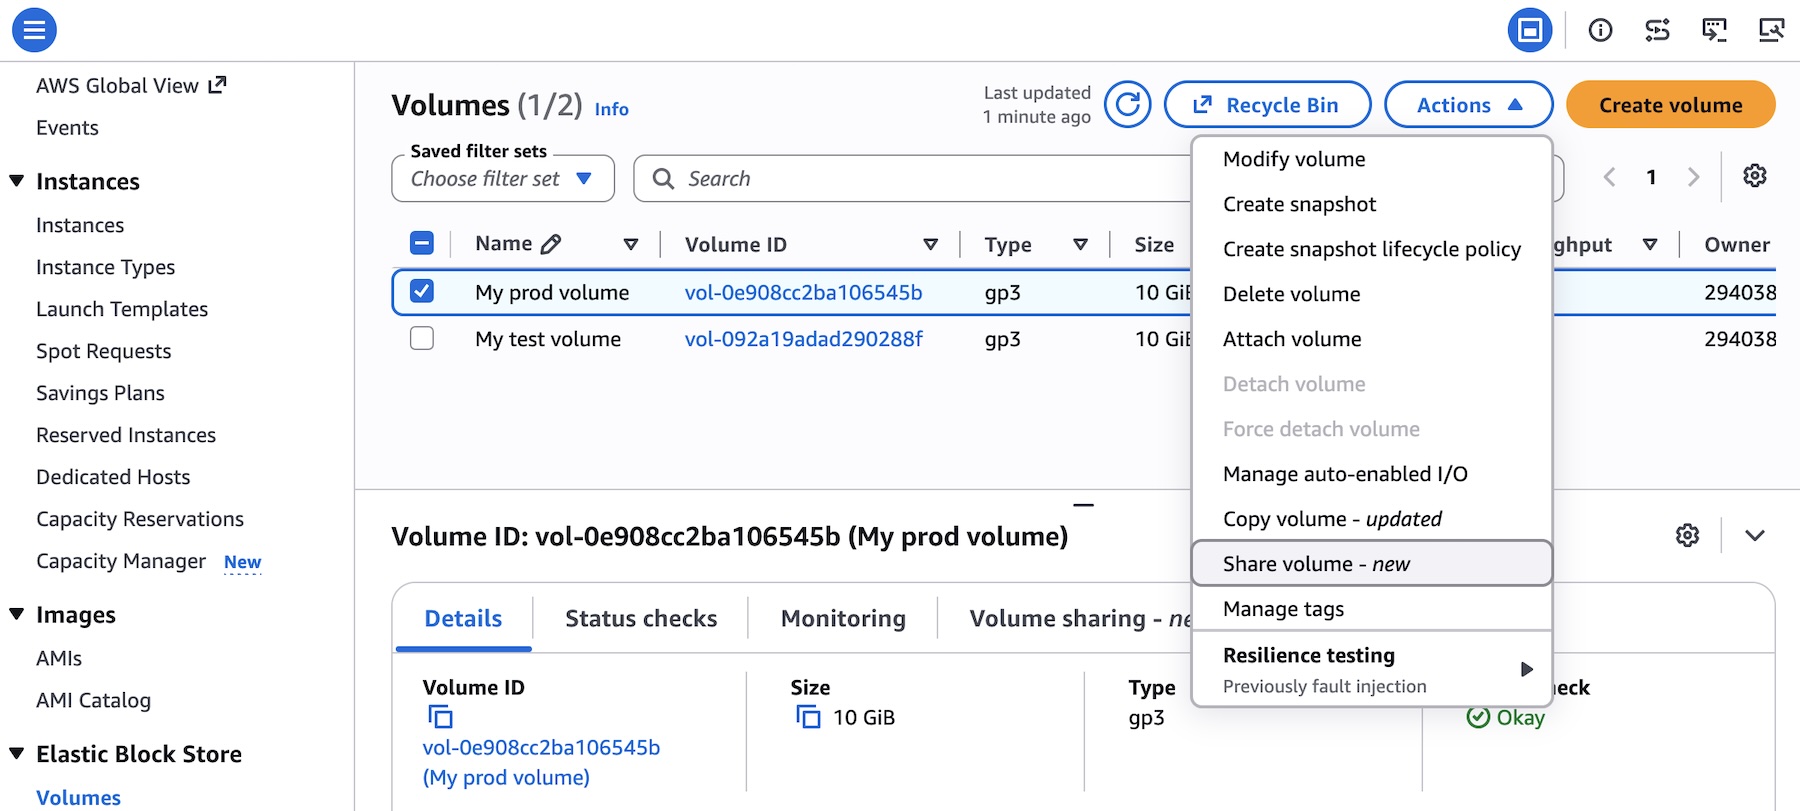
To get started, choose Share volume for the volume you want to share with the target account in the Amazon EBS console.

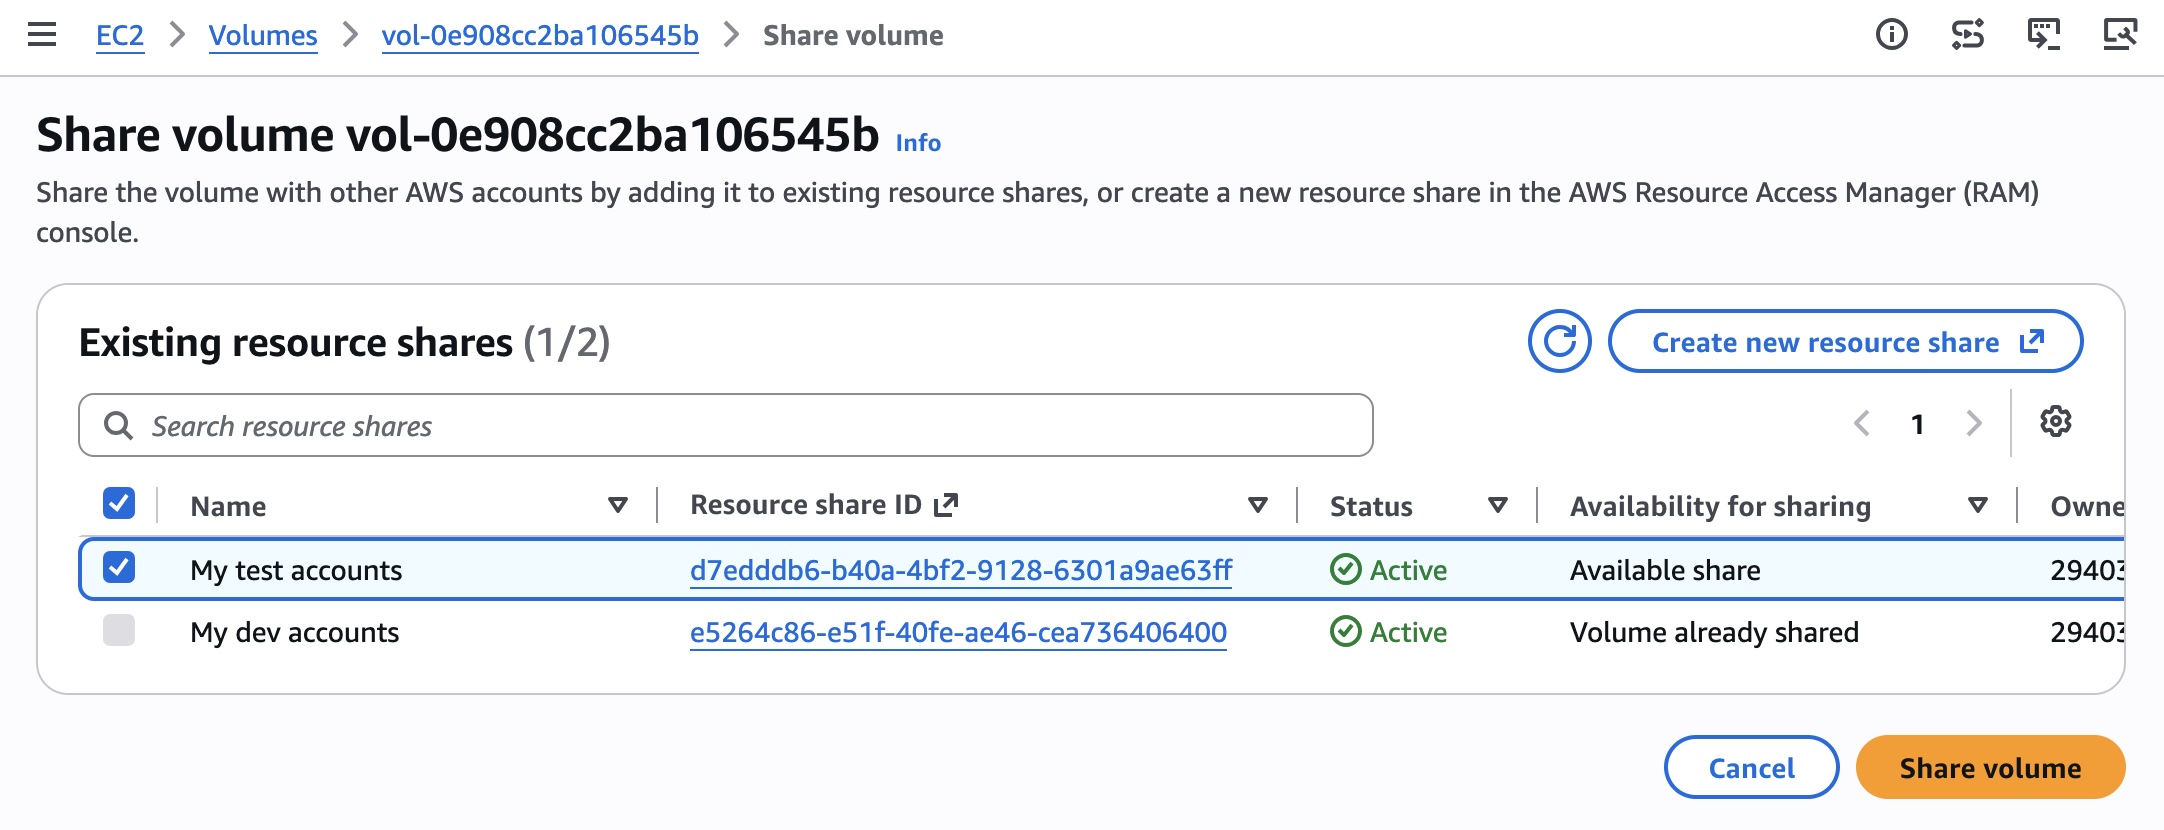
Share the volume with other AWS accounts by adding it to existing resource shares, or create a new resource share in the AWS RAM console. For more details, refer to the AWS RAM User Guide.

You can now see confirmation that the volume has been shared in the Volume sharing tab of the volume detail page.

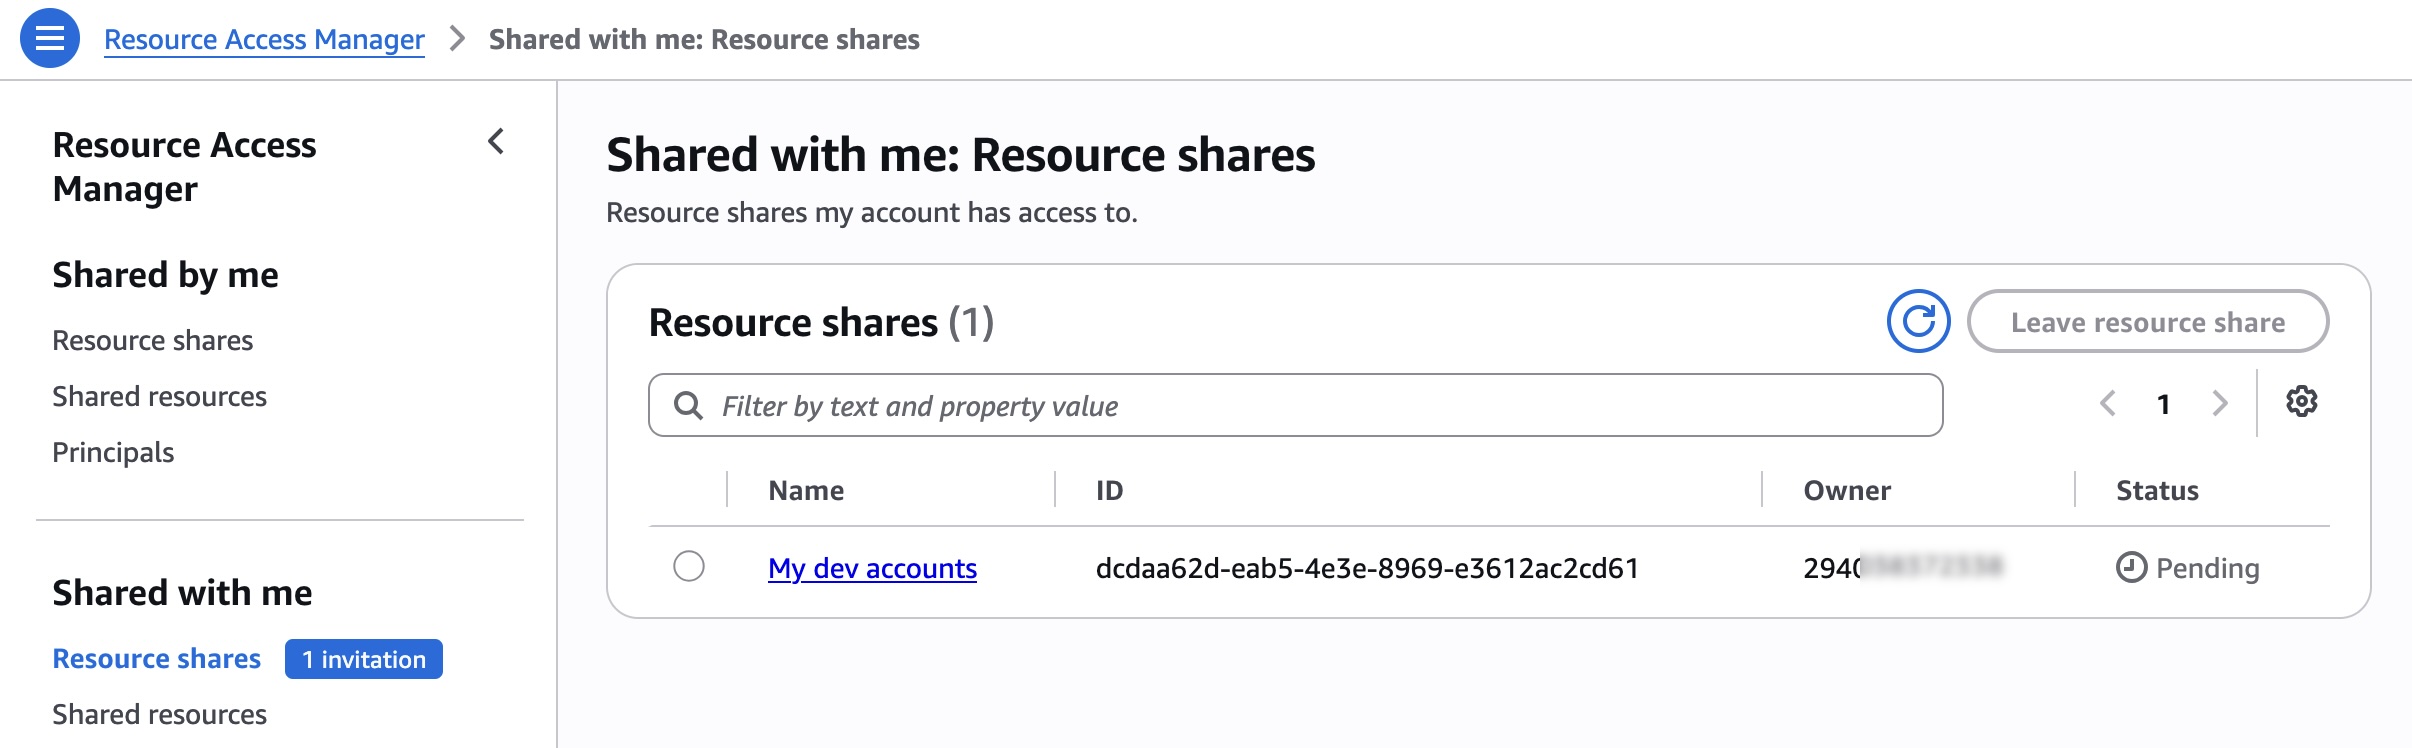
A target account must accept the resource share on the RAM console.

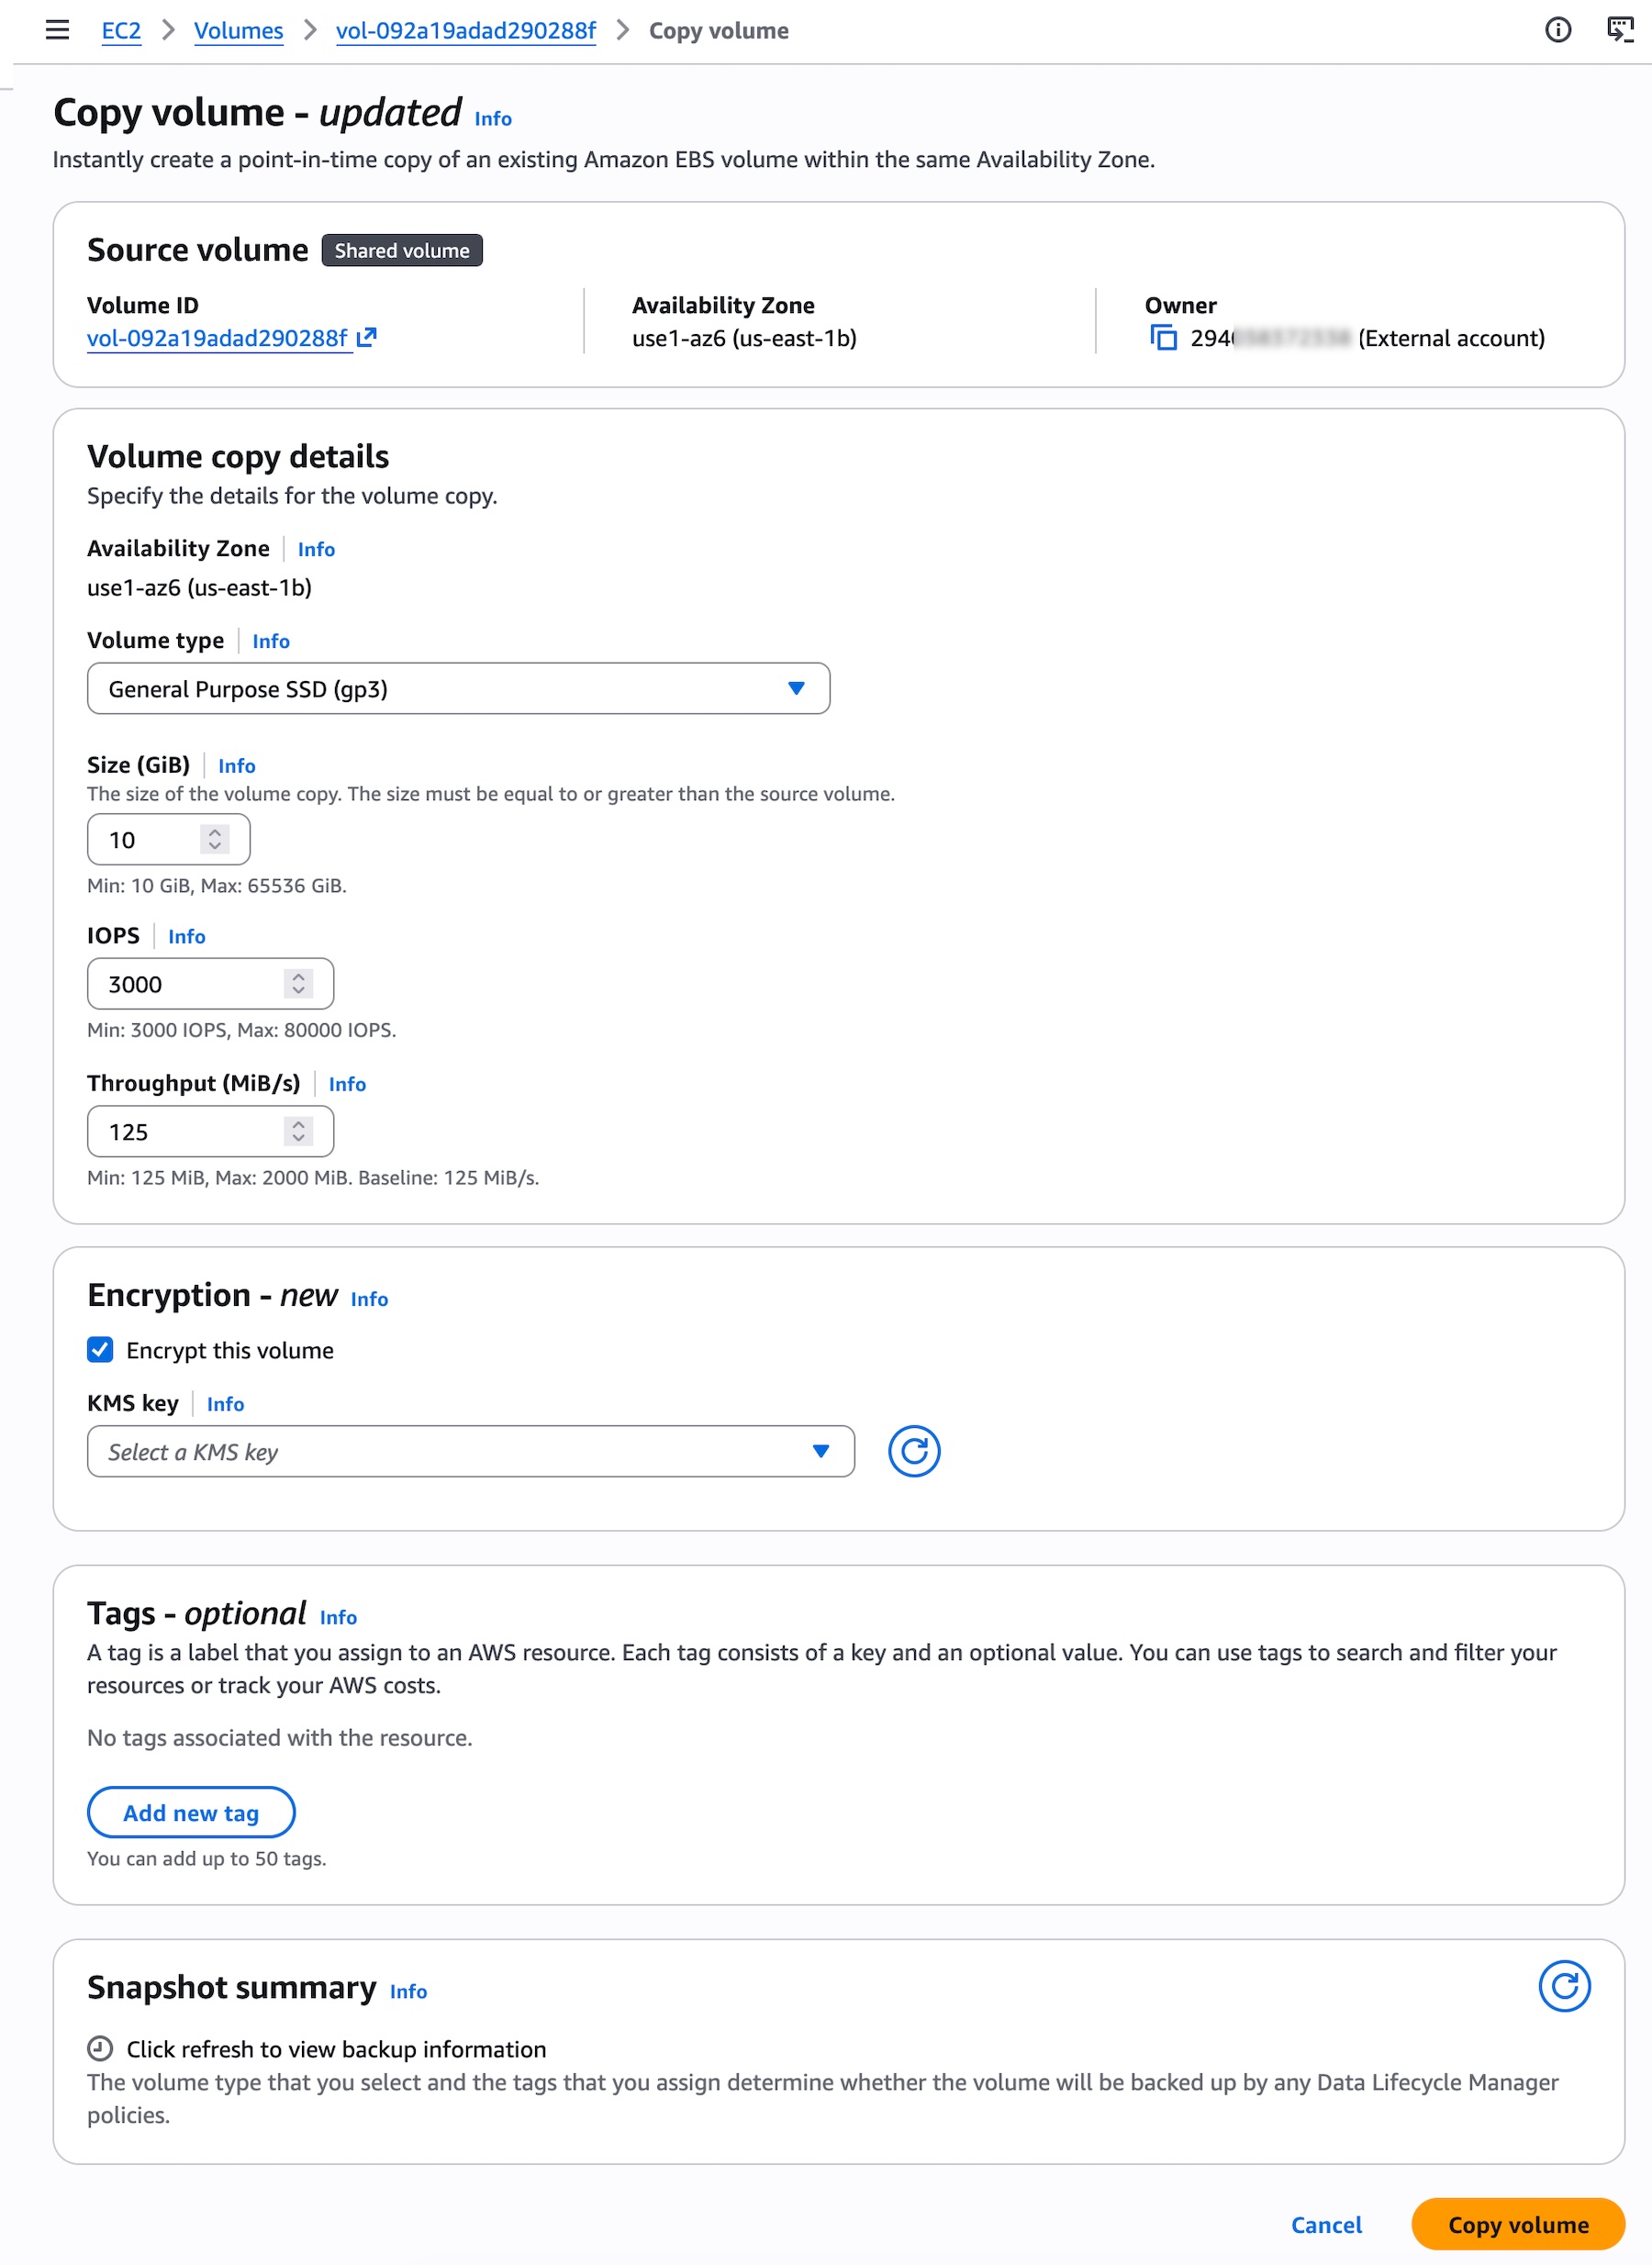
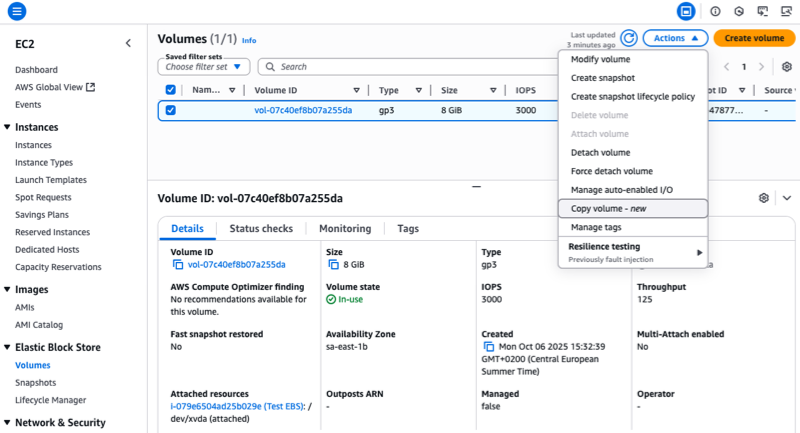
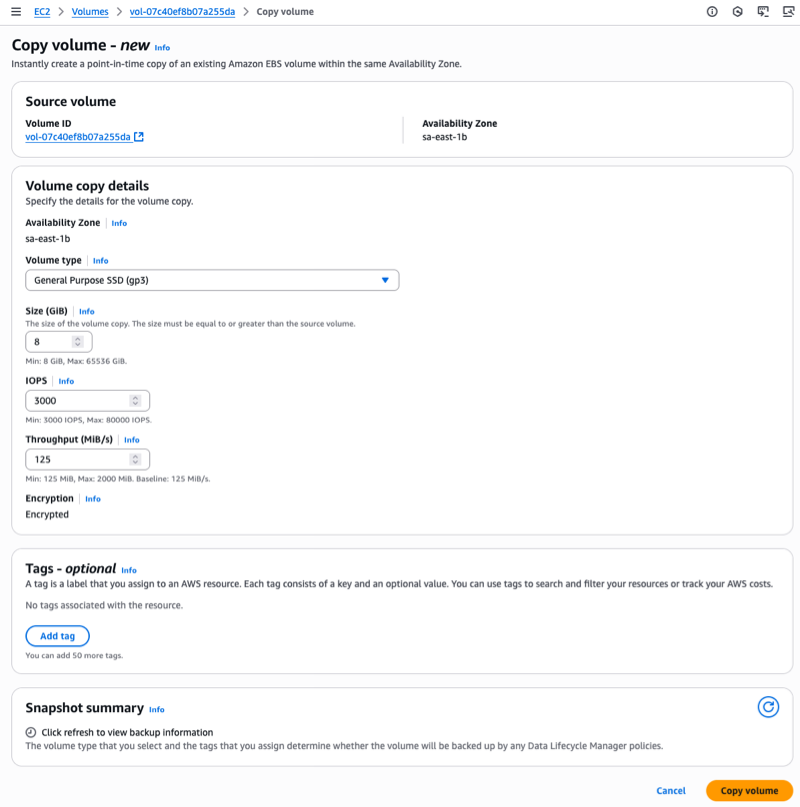
Once they accept the resource share, they can see the volumes in the EBS volume page of the target account. Choose Copy volume for any shared volume.

To share and copy EBS volumes across AWS accounts programmatically, including calling APIs and searching documentation, try the AWS MCP Server and plugins with your preferred AI coding tool. To learn more, visit the Amazon EBS User Guide.

Things to know
Let me share some important technical details that I think you’ll find useful.

  • Encryption: You can share unencrypted volumes and volumes encrypted with a customer managed key (CMK). Volumes encrypted with the default AWS managed key (AMK) cannot be shared. When copying a shared volume encrypted with a CMK, the CMK must also be shared with the target account. You can specify a different CMK to re-encrypt the copy in the target account.
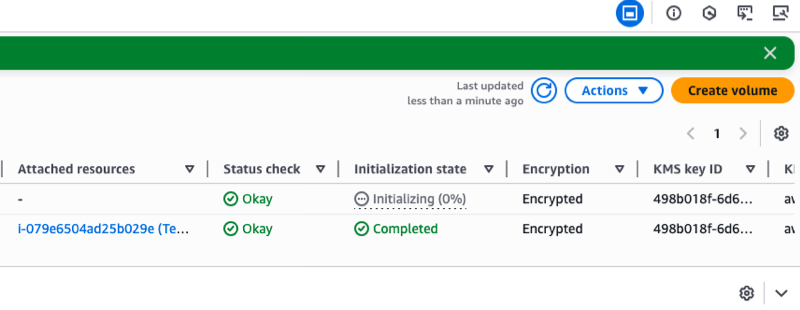
  • Monitoring: You can monitor SharedVolumeCopyInitiated through AWS CloudTrail event in your account. You will also receive events in Amazon EventBridge at the start of the copy operation when the state of the copied volume is initializing, and at the end of the operation when the state of the copied volume changes to completed. You can see the shared volume ID, consuming account ID, and event time.
  • Pricing: Once a copy is initiated, you’ll pay a one-time fee based on your volume size, charged to the account where the copy will reside. There’s no cost for sharing EBS volumes through AWS RAM. The copied volume will incur regular EBS volume charges upon creation.
  • Availability Zone: The volume copy must be created in the same Availability Zone as the source volume. Use Availability Zone IDs (such as use1-az1) to identify the same physical location across accounts.

Now available
Cross-account volume clones for Amazon EBS are available in all AWS Regions that support Amazon EBS Volume Clones. For Regional availability and a future roadmap, visit the AWS Capabilities by Region.

Give this feature a try in the Amazon EC2 console today and send feedback to AWS re:Post for Amazon EBS or through your usual AWS Support contacts.

— Channy

How Autodesk migrated 2.3 billion documents to Amazon OpenSearch Service using Migration Assistant and intelligent routing

Post Syndicated from Ambarish Rao original https://aws.amazon.com/blogs/big-data/how-autodesk-migrated-2-3-billion-documents-to-amazon-opensearch-service-using-migration-assistant-and-intelligent-routing/

OpenSearch is an open source software suite for search, analytics, security monitoring, and observability applications, licensed under the Apache License V2.0. Amazon OpenSearch Service is a managed service that lets you deploy, scale, and operate OpenSearch and the Elasticsearch engine in the AWS Cloud. Customers run search workloads on OpenSearch Service at a scale of billions of documents. When a single index holds millions to billions of documents, you need to plan the topology of the OpenSearch Service domain that holds the index. This post walks through how Autodesk re-architected a single-index Elasticsearch 7.1.1 domain on Amazon OpenSearch Service into four multi-index OpenSearch Service domains, using Migration Assistant for Amazon OpenSearch Service and a routing layer that directs each query to the shards that hold the data for that query.

Autodesk is a technology company that serves customers across three industry verticals: Architecture, Engineering, and Construction (AEC), Product Design and Manufacturing, and Media and Entertainment. Autodesk’s mission is to empower everyone, everywhere to design and make anything, helping customers work across the boundaries of project, discipline, and industry.

Autodesk Forma (formerly Autodesk Construction Cloud, or ACC) is a cloud-based construction management and collaboration system. Customers across the globe use Autodesk Forma for workflows that include document management, bid management, quantification, coordination, design collaboration, project management and field collaboration. Autodesk Forma uses Amazon OpenSearch Service to provide a search experience for millions of users. As customers add data, the data that Forma stores in OpenSearch Service grows. In an OpenSearch Service domain, an index is the unit of data storage and organization. When an index reaches 100 TB, the index becomes a performance bottleneck and is hard to scale. As Autodesk Forma grew, Forma data management (formerly Autodesk Docs) hit performance and scaling limits. This component supports access and search across the project catalog.

Where Autodesk started

Forma data management ran on a single Elasticsearch 7.1.1 domain on Amazon OpenSearch Service with one index. The domain held about 100 TB of data on over 100 data nodes with over 400 primary shards and a replication factor of 1. The average shard held 200 GB. Because of the scale and the production state of the domain, tuning techniques such as adding shards, adding indices, or rebalancing data were not viable.

The single-index, single-domain design exposed three challenges to future data growth:

  1. Query performance. Query latency degraded over time as data grew.
  2. Vertical scaling. The team had reached the limit of the largest Amazon Elastic Compute Cloud (Amazon EC2) instance size available for the existing instance class.
  3. Horizontal scaling. Without a routing mechanism, adding nodes produced hot nodes inside the cluster managed by the OpenSearch Service domain.

Multi-domain architecture with intelligent routing

Vertical or horizontal scaling can address query performance in the short term, but neither addresses the underlying single-index, single-domain scalability limit. A horizontal scaling approach that uses routing keys gives you control over which shards each query touches, without requiring larger hardware. The Autodesk team applied this approach to re-architect the search service without impacting production traffic.

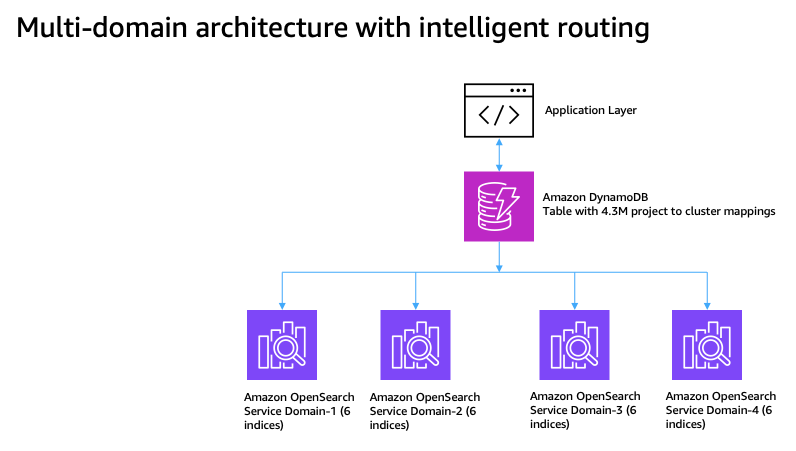
Four Amazon OpenSearch Service domains with an Amazon DynamoDB routing layer directing each query to the correct domain

Figure 1: Multi-domain architecture with intelligent routing

The architecture has the following properties:

  • Four Amazon OpenSearch Service domains on OpenSearch 2.19, each running 24 m7i.4xlarge.search nodes.
  • 24 indices total (6 per domain).
  • About 95 million documents per index.
  • 52 TB of primary storage. This is 37 percent smaller than the primary storage size of the original single-index domain, mainly because the migration skipped deleted documents.

The setup uses four horizontally scaled OpenSearch Service domains, with a routing layer that directs each query to the domain that holds the project’s data.

The architecture uses a Amazon DynamoDB table that stores 4.3 million routing records, one record per project. A project is the primary workspace in Forma data management, where teams, data, documents, models, workflows, permissions, issues, and collaboration activities live together. Forma application looks up the Amazon DynamoDB table for the project-to-domain mapping and then issues the search query to the correct domain.

Redistributing millions of records across four domains was hard. To find an even project-to-index allocation, the team used a bin-packing algorithm. A bin-packing algorithm packs items of varying sizes into a fixed number of bins to minimize waste and produce an even distribution. The team worked with 4.3 million projects of varying document counts, from a few documents per project up to millions, across 24 indices that each target around 400 million documents. The team implemented a stratified bin-packing algorithm that uses historical usage metrics for the workload. This algorithm avoids over- or under-allocation of resources during migration planning. To avoid over-allocation, the team used the 95th percentile (P95) usage metric. After applying the algorithm, each OpenSearch Service domain landed at about 49 percent utilization, which leaves a 2x growth buffer. The application then uses routing-key-based queries to search only the relevant shards, instead of every shard in the index.

The architecture has the following benefits:

  • Horizontal scalability. The team can add more domains and indices as needed.
  • Efficient routing. Queries hit specific shards, not every shard in the domain.
  • Reduced blast radius. If one domain becomes unavailable, only about 25% of traffic is affected, instead of full downtime under the single-domain design.
  • Independent scaling. The team can scale each domain based on its load pattern.
  • More search threads. The aggregate search-thread pool is larger across four domains than on one domain.

Migration steps

The following sections describe the four steps the Autodesk team followed to complete the migration.

Step 1: Categorize projects by size

The team grouped projects into four size categories by current document count, then collected data over six months to compute a per-category growth factor and extrapolate one year out:

Category Document range Project count % of total P95 growth factor Rationale
TINY 0 – 1,000 4,085,310 95.0% 3.82x Tiny projects grow fastest
SMALL 1,000 – 10,000 184,347 4.3% 2.11x Moderate growth expected
MEDIUM 10,000 – 100,000 28,385 0.66% 1.72x Slower relative growth
LARGE 100,000+ 2,266 0.05% 1.38x Already mature, minimal growth
Total 4,300,308 100%

The table shows that 95 percent of projects are TINY, but LARGE projects account for the bulk of document volume. The stratification by category lets the algorithm handle each category appropriately.

The Autodesk team analyzed document count per project over six months to estimate growth. Using the P95 growth factor per category gives a conservative capacity plan that covers 95 percent of projects and avoids over-provisioning.

Step 2: Interleaved distribution

If you process all LARGE projects first, you create imbalance across the indices. To avoid this imbalance, the bin-packing algorithm interleaves the categories in a round-robin pattern. The team used the following sequence to distribute documents evenly across the Amazon OpenSearch Service domains:

  1. Sort the projects within each category, largest first.
  2. Create a queue for each category. The queue is a first-in, first-out data structure that holds the sorted projects for one category.
  3. Distribute projects in a round-robin pattern: pick one from LARGE, then MEDIUM, then SMALL, then TINY, and repeat.

Step 3: Load-balanced best fit

After interleaving, the team computed the projected size of each project and assigned the project to an index. The following steps describe the approach:

  1. Compute the estimated future size as current size × growth factor.
  2. Use a priority queue to find the index with the most available capacity. In a priority queue, each element has a priority. Here, the priority of each index is the amount of available capacity the index has. Unlike a regular queue, a priority queue returns the highest-priority element first, not the first one inserted.
  3. Assign the project to the index that has the most available capacity.
  4. Update the index’s estimated load and re-insert the index into the priority queue with the new capacity. The re-insert step keeps the queue accurate for the next project assignment.

The preceding three steps produced the following results:

  • The algorithm distributed 4.3 million projects with 99.999 percent routing accuracy.
  • Project distribution across indices held to a 0.15 percent variance.
  • Each domain landed at 49.1 percent capacity utilization after applying growth factors, leaving 50.9 percent headroom for future growth.
  • The algorithm computed the 4.3 million project allocations in about 10 minutes.

The team stored the project-to-index allocation mapping in Amazon DynamoDB for real-time query routing. Routing controls how the application uses domain resources and how each domain performs. With routing, the application searches the shards that match the routing key (projectId) for that project. Without routing, the same query searches every shard in the index, which wastes domain resources and produces slower queries. The team also tuned the shard size, which matters most for large projects. One of the largest projects held 7 million documents at about 40 KB per document, for a total of about 280 GB. To split the data for that project into 20–25 GB shards, the team set routing_partition_size to 12.

Step 4: Migration with Migration Assistant for Amazon OpenSearch Service

The Autodesk team used the snapshot and re-index path in Migration Assistant for Amazon OpenSearch Service to migrate 2.3 billion documents. Migration Assistant for Amazon OpenSearch Service adapts to the migration profile and provides AWS Identity and Access Management (IAM) permission boundaries, Amazon Virtual Private Cloud (Amazon VPC) support, and the security policies the migration needs. Migration Assistant for Amazon OpenSearch Service integrated with the over 400 tasks that run the application on Amazon Elastic Container Service (Amazon ECS) with AWS Fargate.

Before the production cutover, the team ran several proof-of-concept (PoC) iterations and tuned the migration configuration to raise throughput from 18 GB/hr to 228 GB/hr. The first PoC iteration hit 18 GB/hr on m7g.large.search nodes. Each subsequent iteration added horizontal scale, larger instances (m7g.2xlarge.search and m7g.4xlarge.search), parallel writes across domains, and zero replicas during migration. The fourth and final PoC iteration hit 228 GB/hr. Multiple PoC iterations helped the team select the optimal instance size and instance class to migrate 2.3 billion documents in 6 hours with zero downtime and no customer incidents.

Post-migration analysis

After the team migrated 2.3 billion documents with routing enabled, the shards landed as follows:

Metric Result Target Status
Total primary shards 4,325
Total data size 52.11 TB ~52 TB ✓ On target
Average shard size 12.34 GB 10–15 GB ✓ Optimal
Median shard size 11.9 GB 10–15 GB ✓ Optimal
Shards in optimal range (10–15 GB) 75.5% 70% ✓ Above target
Hot shards (> 30 GB) 12 (0.28%) < 1% ✓ Within limit
Undersized shards (< 10 GB) 528 (12.2%) < 15% ✓ Within limit
Cross-domain balance 2.3% variance < 5% ✓ Within target
Node balance (StdDev) 0.78–1.12 shards < 2 ✓ Within target

The following table compares the pre- and post-migration architectures:

Aspect Old (single domain) New (four domains with intelligent routing)
Shard size 200 GB average 12.34 GB average (94% reduction)
Query broadcast All 400+ shards ~12 shards (97% reduction)
Shards in optimal range 0% 75.5%
Cross-domain balance N/A (single domain) 2.3% variance
Storage 83.3 TB 52 TB
Total P99 query latency 17 seconds 5 seconds

The team migrated 2.3 billion documents in about 6 hours. Storage dropped by about 37 percent, from 83.3 TB to 52 TB, because the migration dropped deleted documents. The migration produced 4,325 shards at an average of 12.34 GB per shard, distributed across the four domains. 75.5 percent of shards landed in the 10–15 GB range, compared to 210 GB before the migration, which confirms that the new architecture solves the large-shard problem. The shard size is as per general guidance where search latency is a key performance objective. Cross-domain variance of 2.3 percent (12.85 TB to 13.15 TB per domain) confirms even data distribution.

After the migration, queries that include the projectId routing key scan only the relevant shards (typically 12 of 180 per index), which reduces search load across shards by 93 percent. Routing also balances CPU and memory use across each domain. The routing_partition_size of 12 per index produced the right shard count per index. Overall P99 latency improved by 72 percent, from 17 seconds to 5 seconds. Within that figure, search-query P99 improved by 92 percent, from 2,500 ms to 200 ms.

Lessons learned

The PoC iterations surfaced several lessons. Larger instance types help query performance in the short term, but query routing combined with horizontal scaling produces higher sustained throughput. During bulk loads, disable replicas and increase the refresh interval to reduce write overhead. Plan for enough IP addresses and subnet capacity when you scale the application out, so that you do not hit a service limit mid-migration. Validate the VPC routing configuration between the application and the OpenSearch Service domains. Confirm OpenSearch Service data-node capacity with AWS Support before a horizontal scale-out. The Amazon DynamoDB-based routing layer adds about 20 ms of routing latency per query, but the routing layer cuts overall search latency and unlocks horizontal scale.

Conclusion

In this post, you saw how the Autodesk team migrated 2.3 billion documents from a single-index domain to four multi-index Amazon OpenSearch Service domains in about 6 hours.

Transitioning to a multi-domain architecture or updating to the latest OpenSearch version has historically been complex. It can also be difficult to predict the outcome of a migration before production traffic moves. The Migration Assistant for Amazon OpenSearch Service solution addresses these challenges by making migration workflow-driven, repeatable, and more straightforward to validate before cutover.

Migration Assistant for Amazon OpenSearch Service coupled with Amazon DynamoDB-based intelligent routing helped achieve balanced shards and improved search query performance. Multiple PoC iterations helped find routing bugs, service-quota limitations, and infrastructure-provisioning gaps before the production cutover.

If you plan to migrate a large dataset between OpenSearch Service domains, you can use Migration Assistant for Amazon OpenSearch Service. For more information, see the Migration Assistant for Amazon OpenSearch Service documentation.


About the authors

Ambarish Rao

Ambarish Rao

Ambarish is a Principal Engineer at Autodesk Search Team. He is based out of Pune. With 11 years of experience across financial data, logistics and now design and manufacturing, he has worked on mid to large scale distributed systems. When not working on Search, he’s either swimming, playing badminton, volunteering to teach kids, or hunting for Pune’s best biryani.

Chengsi Xie

Chengsi Xie

Chengsi is a Software Development Engineer on Autodesk Search Team. He is focused on building scalable distributed search platforms. He enjoys digging into the root causes behind problems and understanding how systems behave. Outside of work, he likes to stay active through running, playing badminton, hiking, and other outdoor activities that help him stay energized and grounded.

Manoj Kale

Manoj Kale

Manoj is a Senior Solutions Architect at Amazon Web Services. He helps customers design and build scalable, resilient solutions on AWS. He specializes in cloud architecture, AI/ML, and DevOps, and enjoys working with customers to solve complex technical challenges. Outside of work, he likes to spend time with family, travel and log the travel through travel logs and photos.

Anirudh Gupta

Anirudh Gupta

Anirudh is a Technical Account Manager at Amazon Web Services. He works closely with enterprise customers to help them architect, optimize, and operate their workloads on AWS. He is passionate about helping customers modernize their infrastructure and scale distributed systems on AWS.

Priyanshi Omer

Priyanshi Omer

Priyanshi is a Solutions Architect at Amazon Web Services. She helps customers design and build scalable, resilient solutions on AWS. She specializes in cloud architecture, AI/ML, and DevOps, and enjoys working with customers to solve complex technical challenges.

Uncover new performance insights using Amazon detailed performance statistics on Windows

Post Syndicated from Xinze Zhang original https://aws.amazon.com/blogs/compute/uncover-new-performance-insights-using-amazon-detailed-performance-statistics-on-windows/

The primary storage solutions for EC2 Windows instances, Amazon EC2 Instance Store and Amazon Elastic Block Store (Amazon EBS) , now provide detailed performance statistics for real-time monitoring. Real-time monitoring enables you to gain visibility into key performance metrics, such as latency, throughput, and IOPS, allowing you to detect and address potential bottlenecks or issues proactively.

In this post, we explore how to use detailed performance statistics for both Amazon EBS and Instance Storage on Windows environments. These new metrics provide sub-minute granularity, offering real-time visibility into storage volume performance across both storage types. You can access these statistics directly from your Amazon EBS NVMe/Amazon Instance Storage NVMe device attached to the Amazon Elastic Compute Cloud (Amazon EC2) instance and use them to monitor I/O performance at the storage level. We also provide examples of how to use these statistics to quickly assess EBS volume/Storage health and identify performance bottlenecks, which improve both the reliability and performance of your applications. When creating or attaching EBS volumes, enable encryption at rest using AWS Key Management Service (AWS KMS) to protect your data. For more information, see Amazon EBS encryption in the Amazon EC2 User Guide.

Solution overview

Using the new Amazon EC2 Instance Store/Amazon Elastic Block Store (Amazon EBS) detailed performance statistics at the instance-level, this sample solution enhances observability and troubleshooting capabilities for latency-sensitive applications running on EC2 Nitro instances. We use the new nvme_amzn.exe tool to collect high-frequency statistics on I/O operations, latency, and queue length, enabling proactive troubleshooting.

As examples of how to use these granular metrics, this solution demonstrates how to validate the responsiveness of local storage and EBS volume, so that you can quickly identify any I/O interruptions. This solution helps you identify storage performance bottlenecks, which can be used to optimize the local storage and EC2 instance configurations for your workloads.

Prerequisites

This solution involves setting up an EC2 Nitro instance and an attached local storage to access detailed performance statistics for the local storage. This is a setup you likely already have if using Amazon EC2. To deploy the required components, you must complete the following steps:

  1. Launch an EC2 Nitro instance (or use an existing Nitro instance), and connect to it via Remote Desktop Protocol (RDP).
  2. Verify that your EC2 Windows instance includes AWS NVMe driver version 1.7.0 or later installed by following identify your driver type
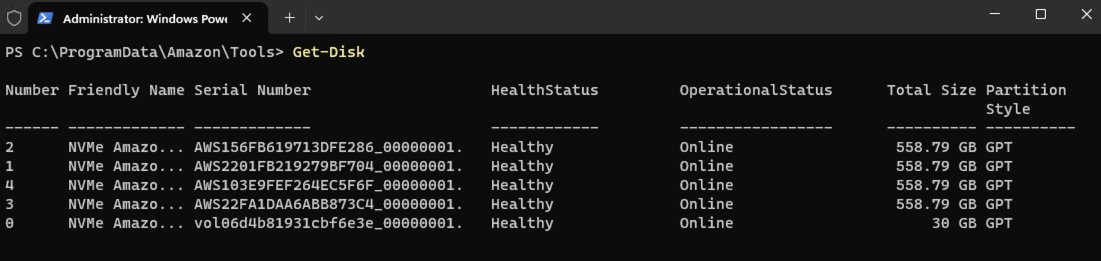
  3. Identify the NVMe device associated with the local storage/EBS volume for which you want to query the stats. You can run the Get-Disk command in PowerShell to output all NVMe devices on the instance. For more information, see Map NVMe disks on Amazon EC2 Windows instance to volumes.

For this demonstration, we’ll monitor two storage volumes:

  • EBS volume (Disk 0): Serial Number vol01234567890abcdef_00000001.
  • Local storage (Disk 1): Serial Number AWSEXAMPLE1234567890_00000001.
  1. Ensure that nvme_amzn.exe is present in C:\ProgramData\Amazon\Tools by default.
  2. Use the nvme_amzn.exe tool, with administrator privileges, and pass the disk number as a parameter with different command. The returned output looks like the following.

Administrator: Windows PowerShell:

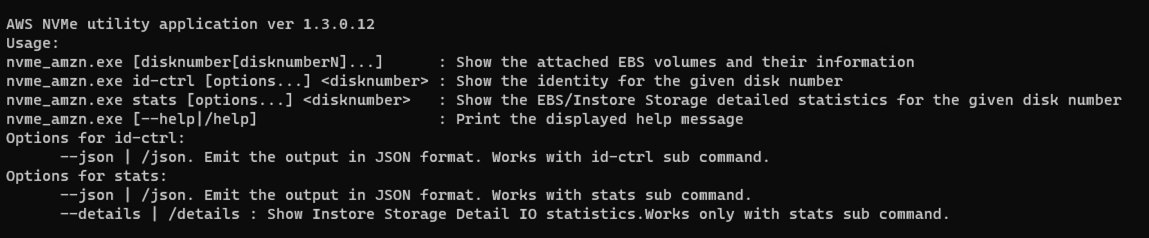
.\nvme_amzn.exe --help or nvme_amzn.exe /help

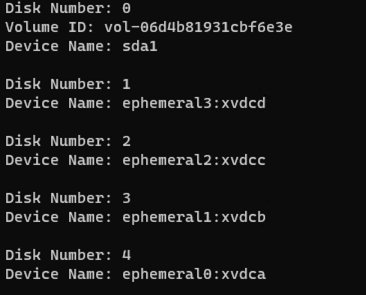
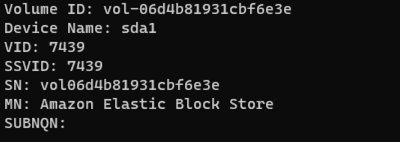
Users can see the EBS volumes devices mapping by default without passing the disk number as a parameter

.\nvme_amzn.exe

Users can view the specific device mapping by passing disk numbers or a single disk number as a parameter.

.\nvme_amzn.exe 0 1 2 3 4

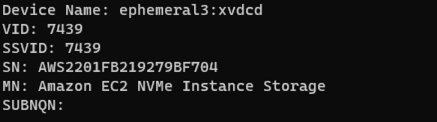
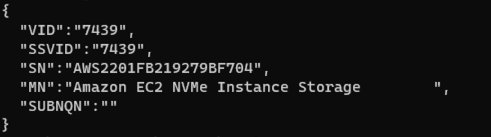
Users can see the nvme controller details by using id-ctrl and pass the disk number as a parameter (JSON output can be retrieved by providing the --json or /json parameter to the tool)

# EBS volume
.\nvme_amzn.exe id-ctrl 0

# EC2 local storage
.\nvme_amzn.exe id-ctrl 1

.\nvme_amzn.exe id-ctrl 0 --json

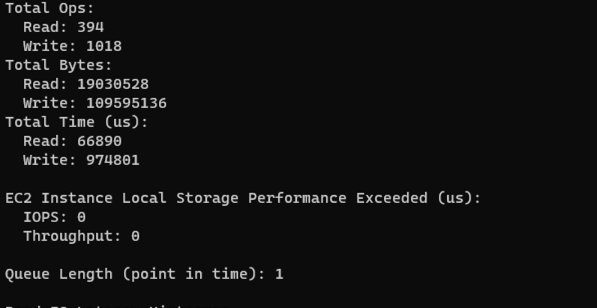
Users can see the performance statistics for EBS/EC2 local storage volume by using stats and pass the disk number as a parameter (provide the --json or /json parameter to retrieve JSON output).

# EBS volume
.\nvme_amzn.exe stats 0
# Json format
.\nvme_amzn.exe stats 0 --json

# EC2 Local storage volume
.\nvme_amzn.exe stats 1
# Json format
.\nvme_amzn.exe stats 1 --json

In addition, for EC2 local storage volume, by providing the --details/-d option, you can see the histogram of 5 different IO bands: (0, 512 Byte], (512B, 4KiB], (4KiB, 8KiB], (8KiB, 32KiB], (32 KiB, MAX].

.\nvme_amzn.exe stats 0 --details

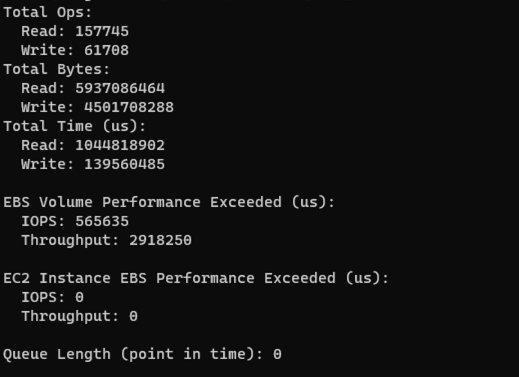
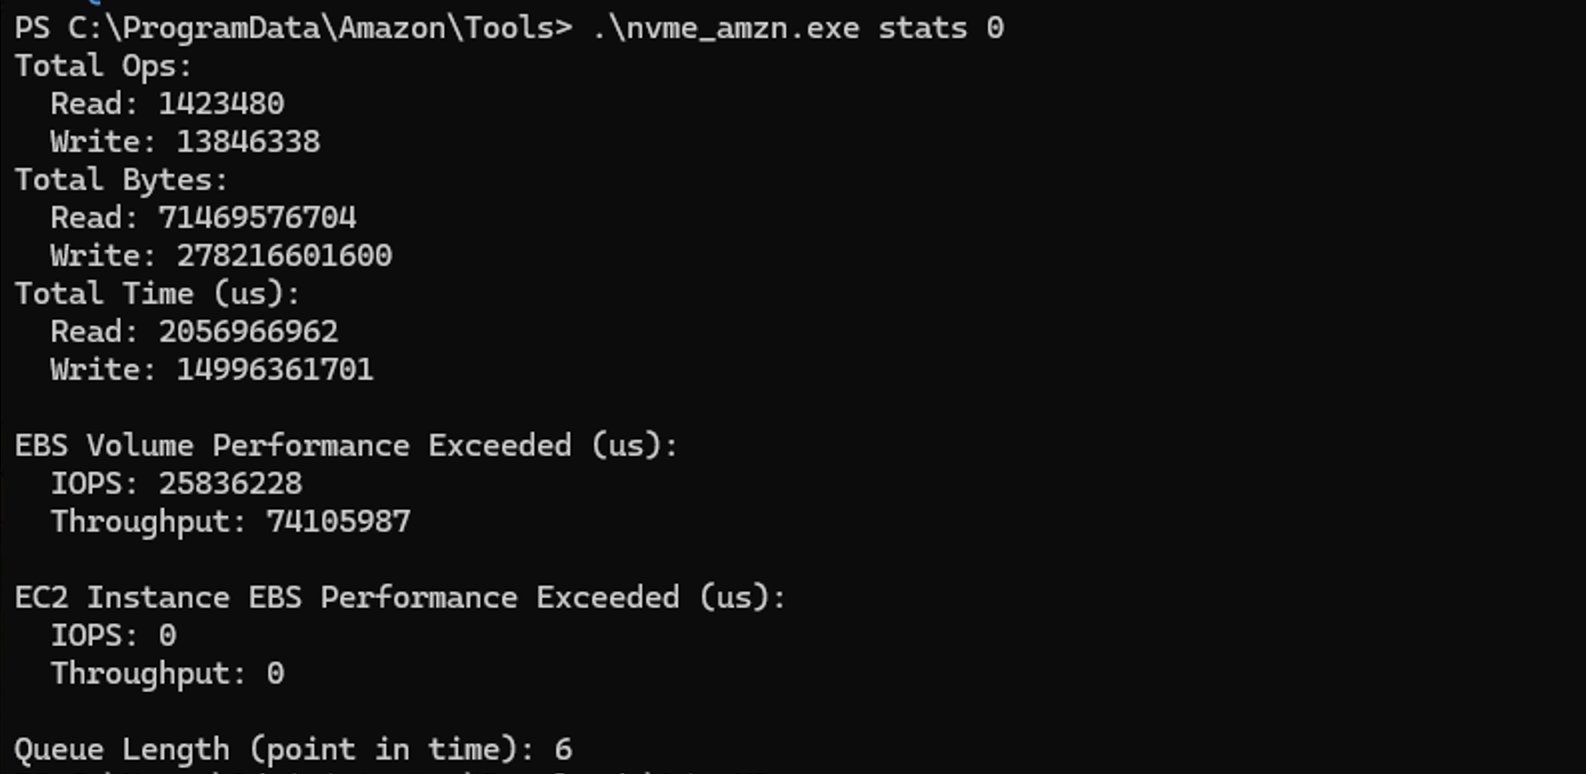
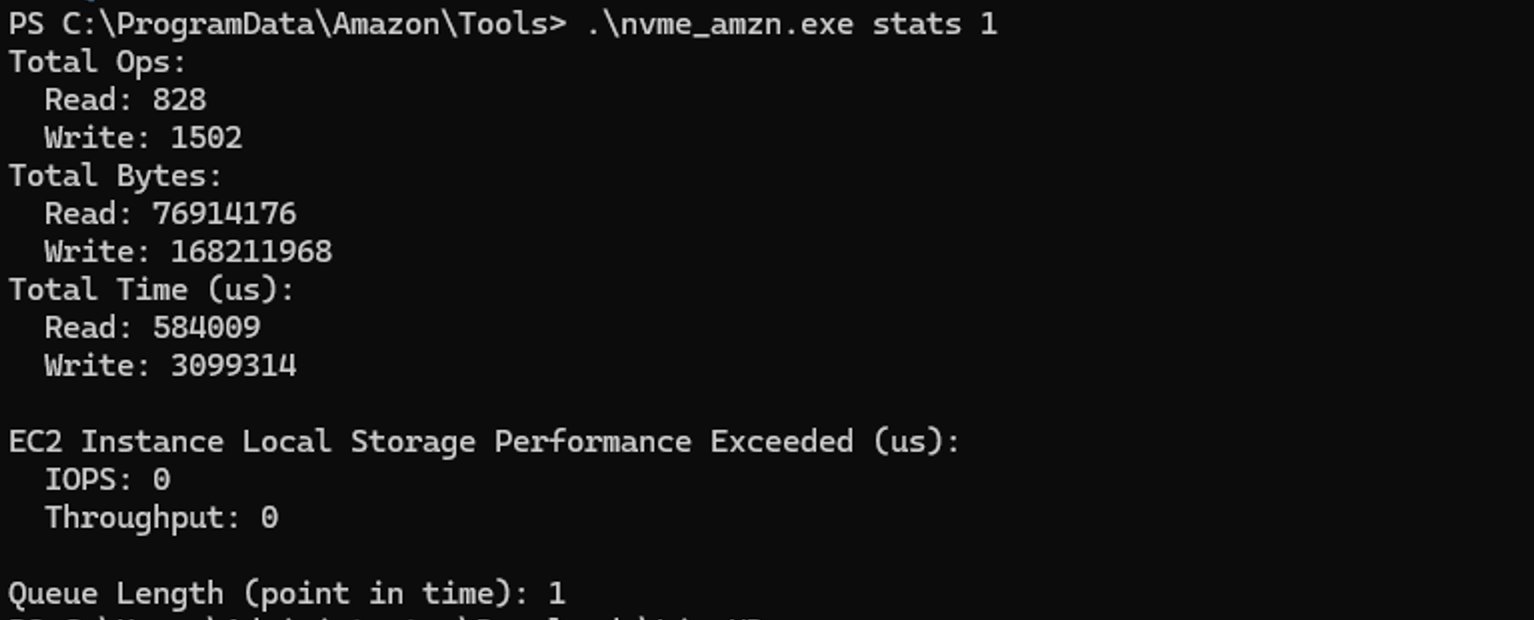
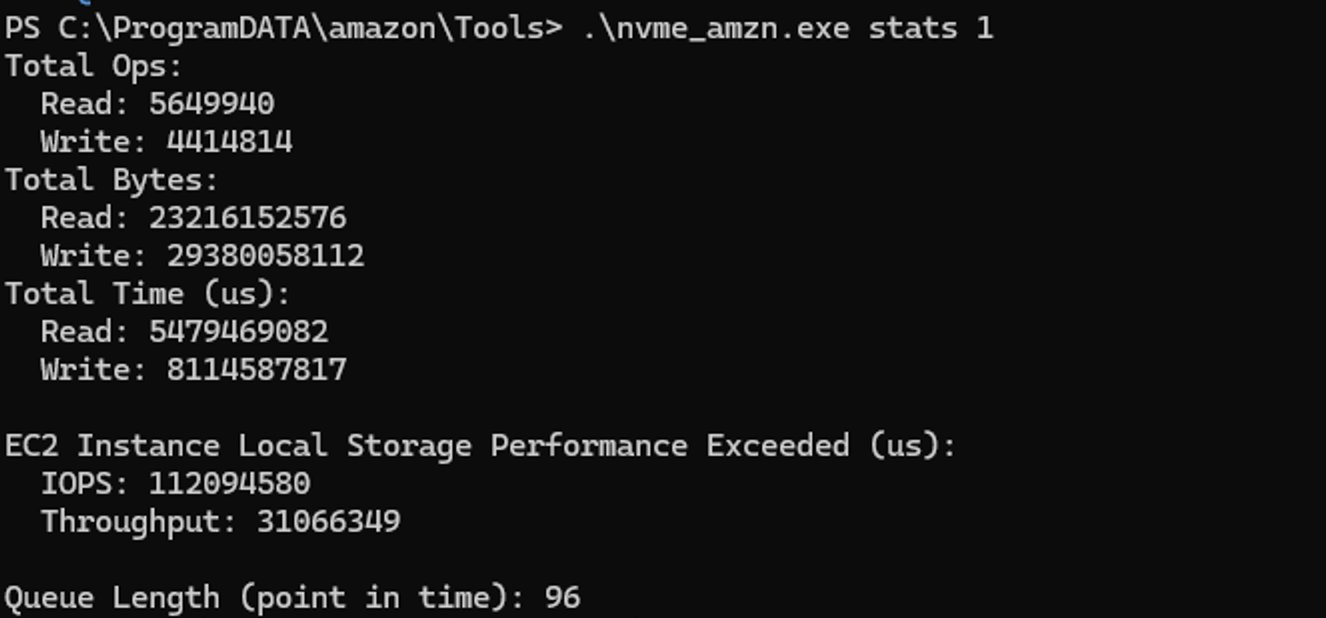
The following example shows NVMe log output with cumulative statistics. The statistics indicate read/write operations, bytes transferred, and time spent processing operations (in microseconds). They also show the number of microseconds in which the application attempted to exceed the Amazon EBS or Amazon EC2 Instance Local Storage IOPS/throughput limits

EBS volume:

EC2 local storage volume:

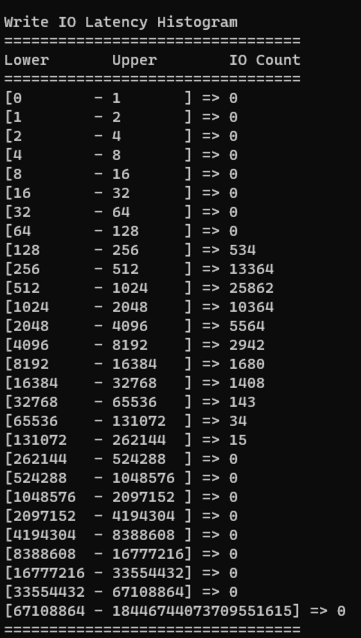
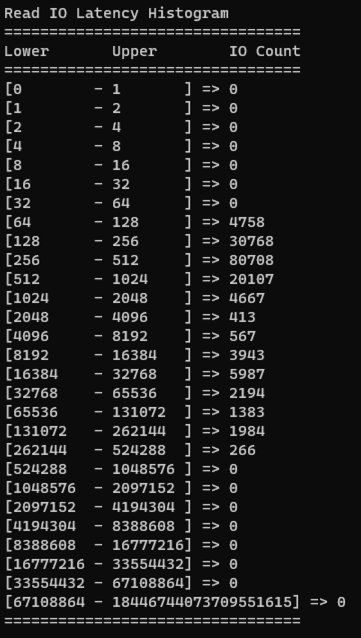
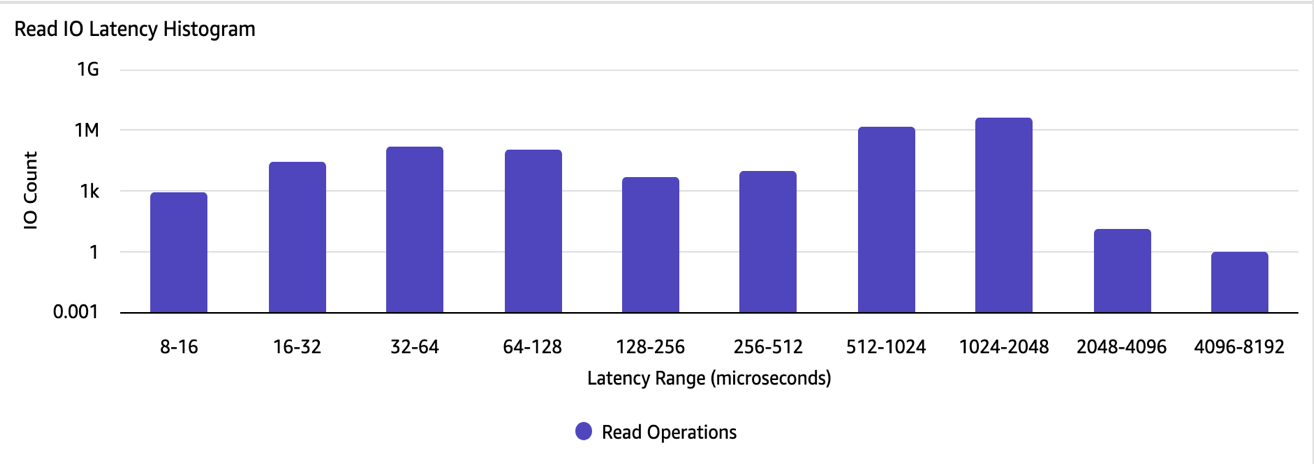
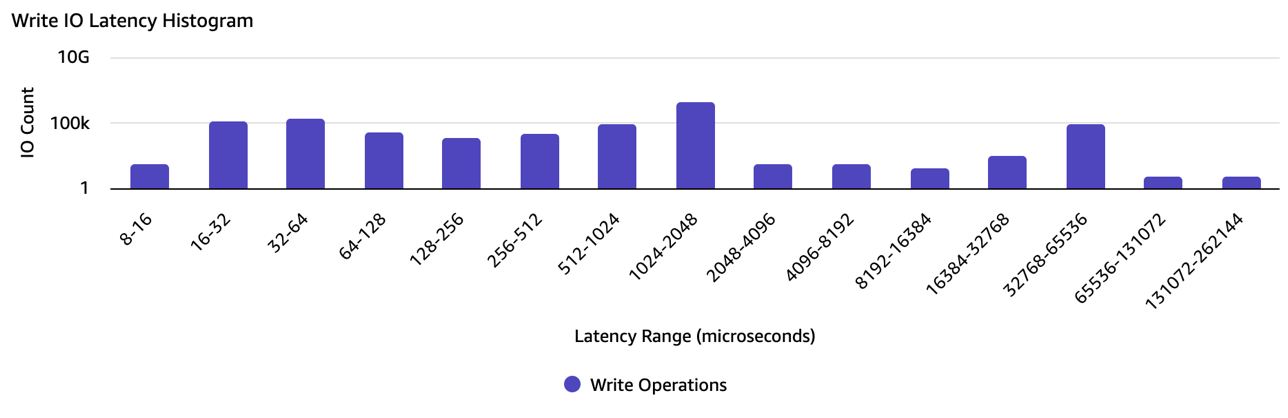
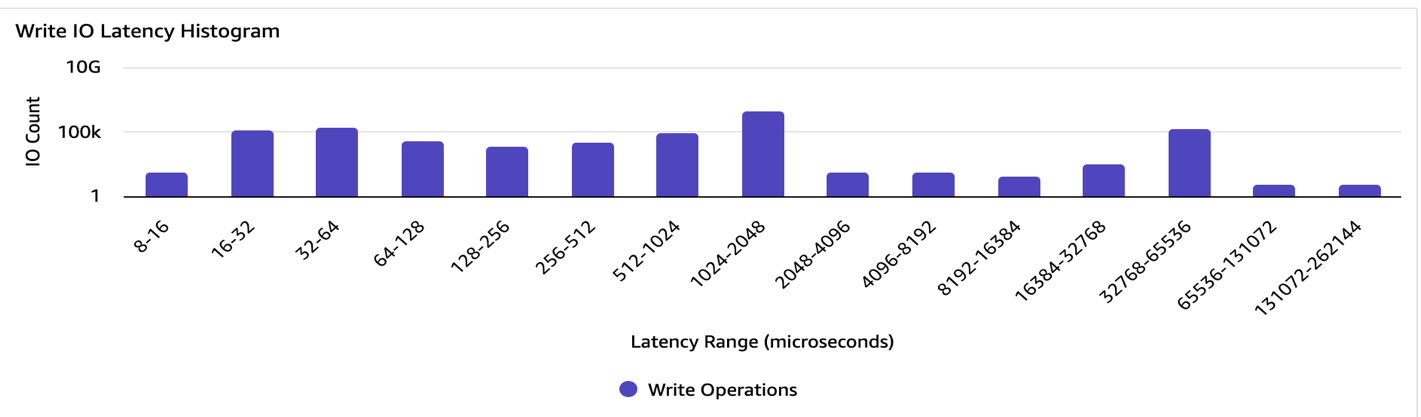
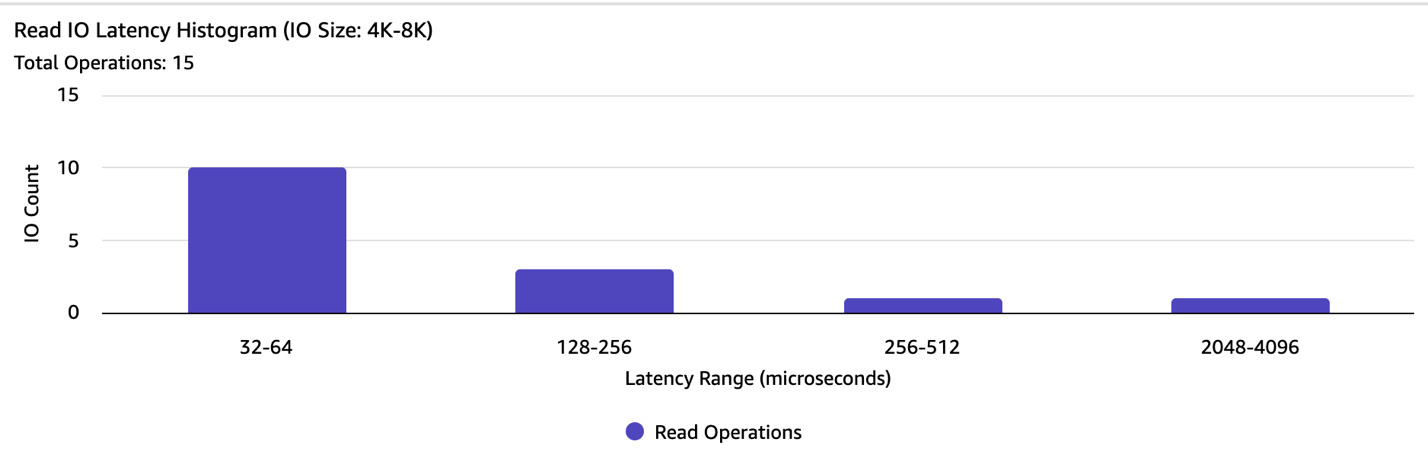
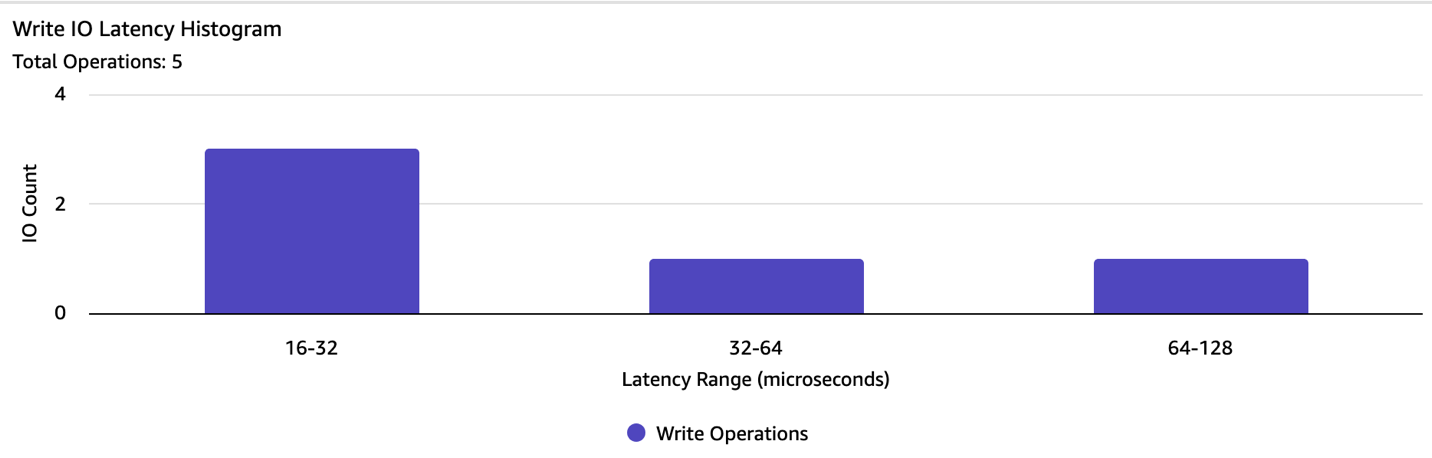
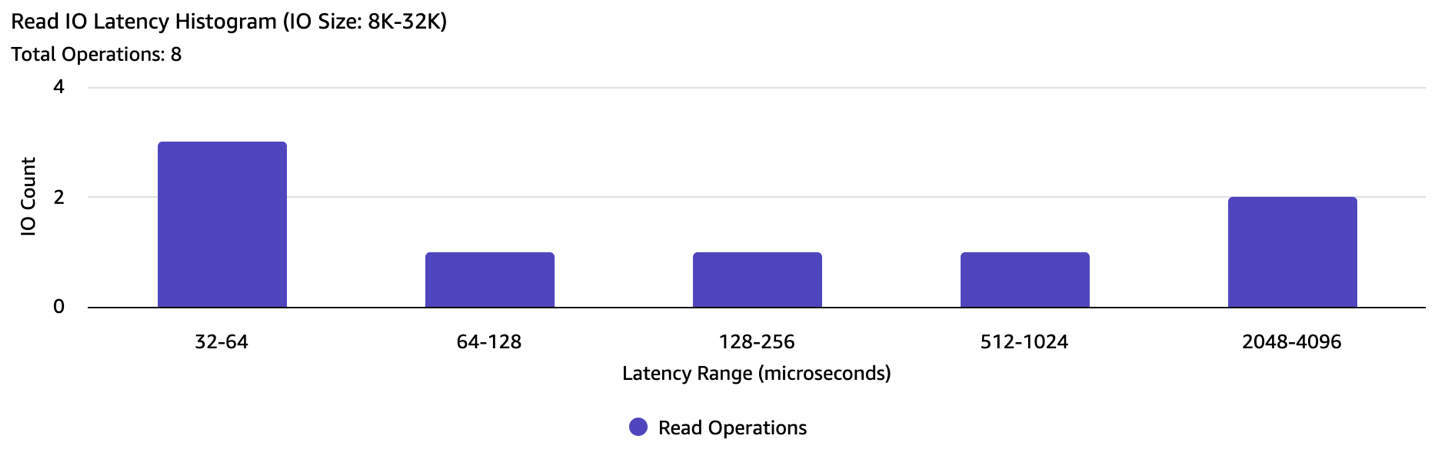
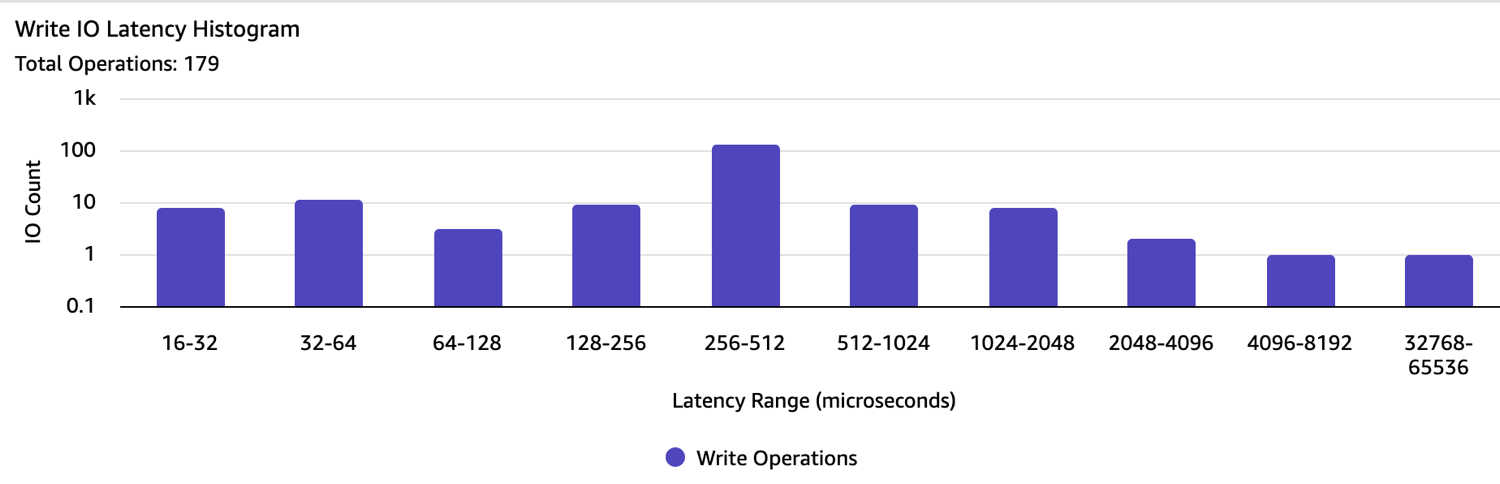
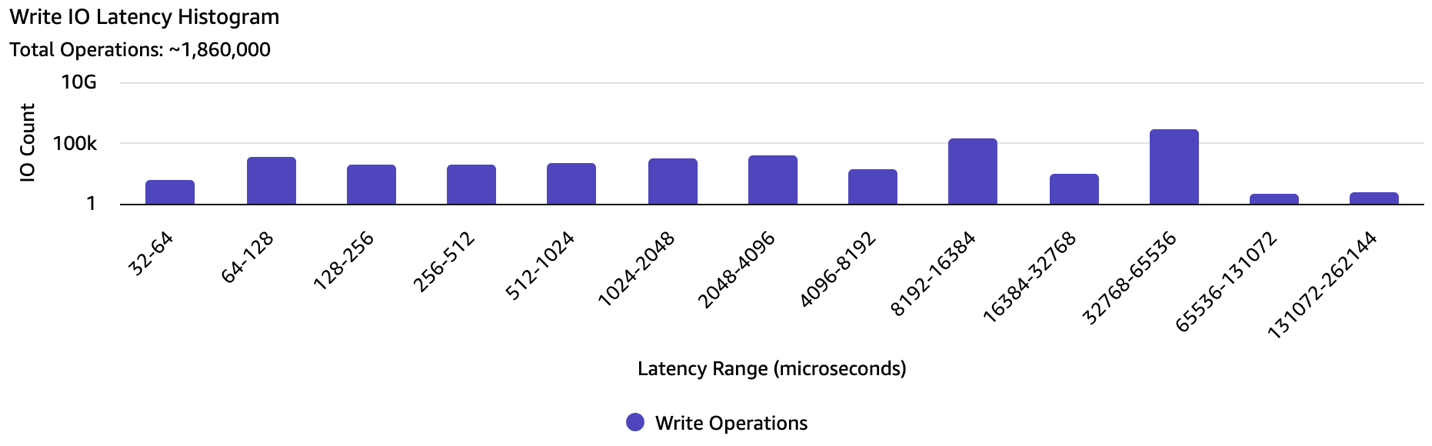
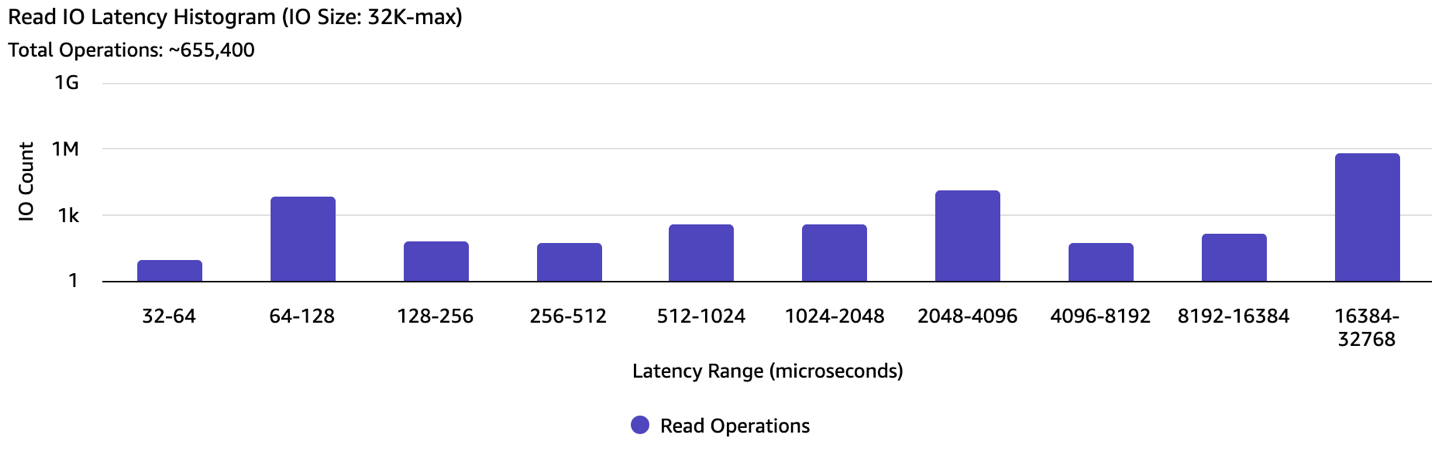
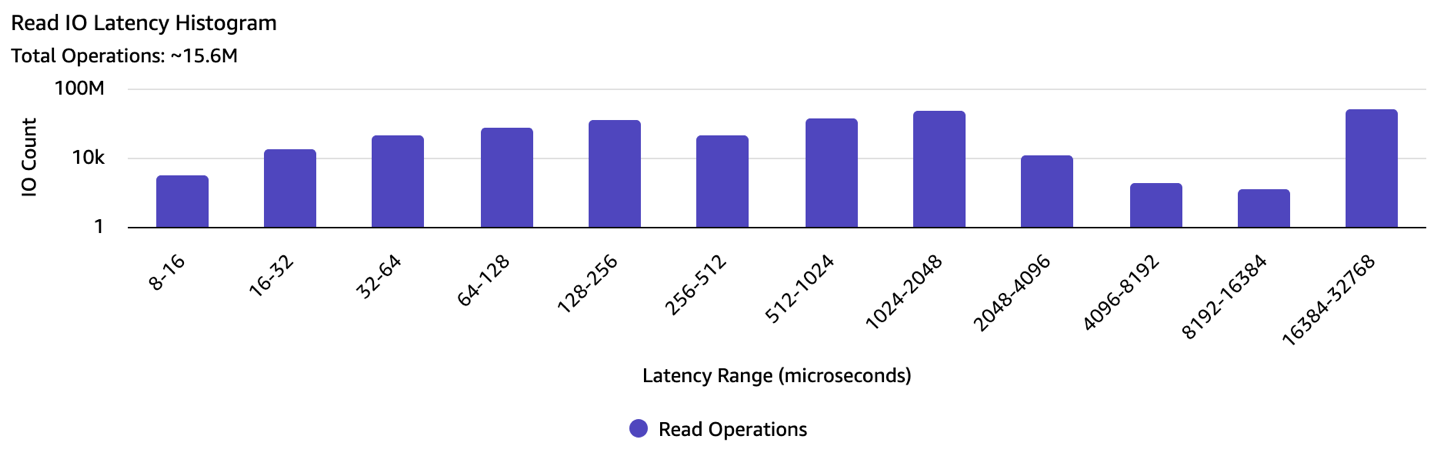
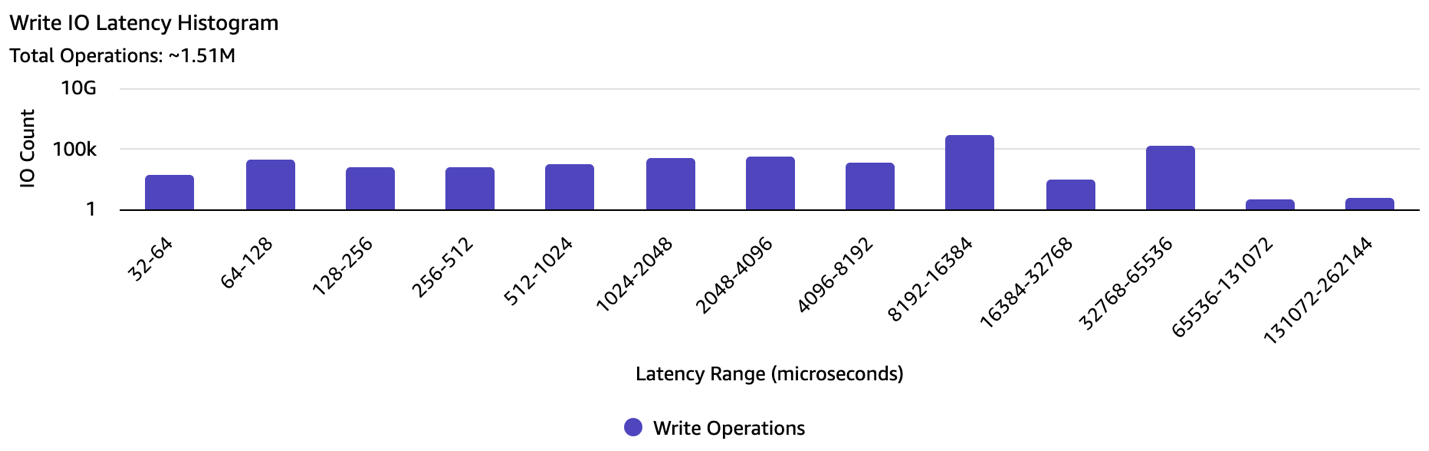
Also included in the following figures are read and write I/O latency histograms, with each row representing the total number of I/O operations completed so far within a specific bin of time (in microseconds).

These statistics are presented as cumulative counters up to the time at which the command is executed. The command can be run at the desired interval, for example, every 15 seconds, with each subsequent output reflecting the updated cumulative totals for the metrics. Calculating the difference in the statistics across the last two outputs allows you to derive insight into the instance storage profile over the given 15 second period.

Deriving insights from the Amazon Instance Storage/EBS volume detailed performance statistics

You have set up monitoring using these detailed performance statistics, now we can demonstrate the different ways you can use these statistics.

As mentioned in the preceding section, you can use the detailed statistics to view I/O latency histograms to observe the spread of I/O latency within the period. You can use the read/write operations and time spent statistics to calculate the average latency. Using the detailed statistics allows you to view the average latency at a sub-minute granularity.

Here are four examples for you to use the statistics to shed light on key performance metrics.

Scenario 1: Identifying unresponsive state of an EBS volume

In this scenario, we discuss how to use Amazon EBS detailed performance statistics to observe when an EBS volume isn’t responding to I/O operations. If you observe multiple intervals where your volume is unresponsive, then you can take actions, such as replacing the affected volume or stopping and restarting the instance to which the volume is attached. In most cases, when your volume becomes unresponsive, Amazon EBS automatically diagnoses and recovers your volume within a few minutes.

To identify if your volume is unresponsive, you can use the following steps to determine whether I/O disrupted on your volume:

  1. Identify the EBS volume’s NVMe device to troubleshoot
  2. Collect stats for the device at the desired intervals
  3. Compare the stats to check if the EBS volume is unresponsive

Step 1: Identify the EBS volume’s NVMe device to troubleshoot

1. Identify the NVMe device associated with the EBS volume on the instance by using the nvme_amzn.exe tool.

.\nvme_amzn.exe

Step 2: Collect stats for the device at the desired intervals

1. Collect the Amazon EBS detailed performance statistics directly from the device by using the nvme_amzn.exe tool:

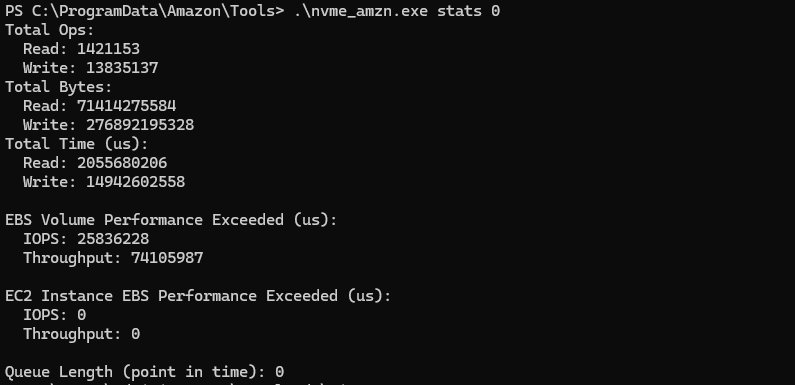
# EBS volume disk0
.\nvme_amzn.exe stats 0

Step 3: Compare the stats to check if the EBS volume is unresponsive

1. From the output, consider the following three fields for this scenario: Total Read Ops, Total Write Ops, and Queue Length.

2. Issue the same ebsnvme command after a desired interval (for example: after 15 seconds), so that you can compare how Total Read/Write I/Os have progressed at the Amazon EBS level.

3. From the detailed performance statistics collected approximately 15 seconds apart, we make the following key observations

  • Total Read Ops increased from 1421153 to 1423480, indicating 2327 Read operations completed in the 15 second span.
  • Total Write Ops increased from 13835137 to 13846338, indicating 11201 Read operations completed in the 15 second span.
  • Queue Length stayed between 0 and 6, indicating that the application was issuing I/Os to the EBS volume. If you see a gradual increase in the Queue Length, then it would reflect a buildup in queued I/Os.

This shows that the EBS volume is still driving I/Os that it is receiving, which rules out the EBS volume as the source of observed degradation in application performance. If we had seen an increase in the Queue Length along with 0 Read/Write Ops processed during the period, then it would reflect an unresponsive EBS volume.

If you would like to validate your mechanisms of identifying unresponsive EBS volumes, refer to the Conducting chaos engineering experiments on Amazon EBS using AWS Fault Injection Service blog post, which walks through how to set up an AWS Fault Injection Service Pause I/O experiment.

Scenario 2: Identifying bottlenecks in storage performance on EBS

Amazon EBS detailed performance statistics can also be used to configure the appropriate performance characteristics for your EBS volume and EC2 instance based on the performance needs of your application. The EBS Volume Performance Exceeded and EC2 Instance EBS Performance Exceeded statistics indicate the duration for which your workload consistently attempted to drive IOPS or throughput that is greater than your volume or your instance’s provisioned performance in a given period. Exceeding either the volume’s or instance’s provisioned performance can result in elevated latency on your workload. For this scenario, consider the same application as the one used in scenario 1.

Complete the following steps to check if EBS volume performance is correctly provisioned:

1. Select the EBS volume’s NVMe device to check
2. Collect stats for the device at the desired intervals
3. Compare the stats to check if the EBS volume is exceeding provisioned performance

Step 1. Select the EBS volume’s NVMe device to check

1. This step is the same as Step 1 discussed previously in scenario 1.

Step 2. Collect stats for the device at the desired intervals

1. Similar to Step 2 discussed in scenario 1, access the detailed performance statistics across two points in time.

2. Consider the EBS Volume Performance Exceeded and EC2 Instance EBS Performance Exceeded statistics from the EBS NVMe device.

$DiskNumber = 0
$Interval = 15

while ($true) {
    Write-Host "=== $(Get-Date -Format 'yyyy-MM-dd HH:mm:ss') ===" -ForegroundColor Cyan; & "C:\ProgramData\Amazon\Tools\nvme_amzn.exe" stats $DiskNumber
    Write-Host ""
    Start-Sleep -Seconds $Interval
}

Step 3: Compare the stats to check if the EBS volume is exceeding provisioned performance

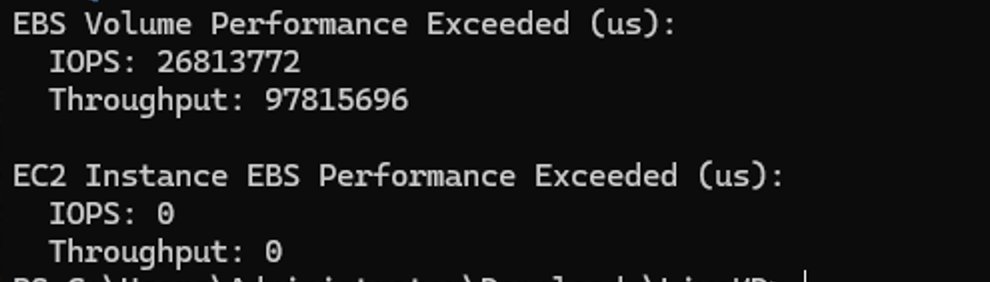
1. In the following example output, you can see the EBS Volume Performance Exceeded statistic increasing by 26813772 microseconds. This shows the workload running on EBS volume vol-EXAMPLEabcd1234 has attempted to drive more IOPS than provisioned on the underlying EBS volume, which can impact the volume’s I/O latency. We recommend that you increase the performance of your volume to make sure that you have sufficient provisioned performance for your application’s needs.

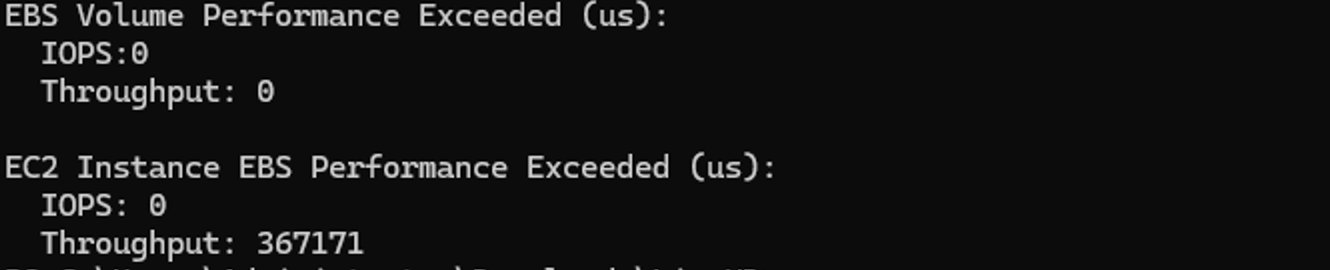
2. In the following example output, driving a different workload on the instance allows us to see that the volume has exceeded the provisioned IOPS performance at the attached EC2 instance level. In this case, up-sizing to a larger instance size can improve the performance of your application.

3. A synthetic load generator for Oracle called Silly Little Oracle Benchmark (SLOB) could also be used to simulate workloads on Oracle databases, while monitoring the Amazon EBS statistics to see which volume or instance is becoming the bottleneck.

It’s important to have the right instance and volume configurations to avoid performance bottlenecks to your application. Refer to the EBS volume types documentation for more information on the different EBS volume types, and the Amazon EBS-optimized documentation to understand how to select the optimal combination of EC2 instance and EBS volume suited for your application. These statistics are available at up to a one-second granularity, which allows you to effectively perform these checks in real-time and initiate volume modifications to optimize volume characteristics as needed.

Scenario 3: Identifying bottlenecks in storage performance on instance storage volume

Amazon Instance Storage detailed performance statistics can be used to configure the appropriate performance characteristics for your application. The “EC2 Instance local storage Performance Exceeded” statistics indicate the duration for which your workload consistently attempted to drive IOPS or throughput that is greater than your rate limit in a given period. Exceeding the throttle value can result in elevated latency on your workload.

For example, i3en.xlarge can support up to 85,000 read IOPS, 65,000 write IOPS, 634,765 KiB/S for read and 317,382 KiB/S for write. By using the detailed IO metrics, you can more efficiently determine if the instance meets your requirements.

Complete the following steps to check if the device meets your application needs:

  1. Select the instance storage device to check.
  2. Collect stats for the device at the desired intervals
  3. Compare the stats to check if the instance storage is exceeding the throttled value

Step 1. Select the Instance Storage NVMe device to check

Use the nvme_amzn tool and identify the NVMe device associated with the instance storage.

Step 2: Collect stats for the device at the desired intervals

$DiskNumber = 0
$Interval = 15

while ($true) {
    Write-Host "=== $(Get-Date -Format 'yyyy-MM-dd HH:mm:ss') ===" -ForegroundColor Cyan; & "C:\ProgramData\Amazon\Tools\nvme_amzn.exe" stats $DiskNumber
    Write-Host ""
    Start-Sleep -Seconds $Interval
}

Step 3: Compare the stats to check if the instance storage is exceeding throttle value

Take the following scenario as an example. At the very beginning, after the instance launch, both the IOPS and Throughput under “EC2 Instance local storage Performance Exceeded (us)” are 0s.

You start your applications and find that the application write does not meet your expectation. You can check the IO metrics afterwards. You see a lot of IO falls into the 1 ms to 2 ms range, which is unexpected.

By further checking the “EC2 Instance local storage Performance Exceeded (us)”. You found that the IO reached the allowed upper limit for up to 8 seconds, which indicates the i3en.xlarge would not meet your expectations. Select a larger instance size to address this.

It’s important to have the right instance size to avoid performance bottlenecks to your application. Refer to the ec2-instance-type-specifications documentation for more information on the different instance storage size to understand how to select the optimal instance size suited for your application. This tool helps you to effectively perform these checks in real-time.

Scenario 4: Identifying which block size caused the long latency on instance storage volume

You may have a mixed workload:

  • Data (either read or write) pattern with different block sizes like 4K and 128K.
  • Mixed read and write data pattern.

By using the --detail/-d switch from the NVMe CLI, you can identify the issue quickly and readjust the workload.

Example 1: High write latency from a workload

By further looking at the histogram of the block size range larger than 32 KiB, you can see that the larger IO caused high application latency, while other block sizes (like 8K) show no latency abnormality.

Example 2: Mixed read and write traffic

Some users will have a mix of read and write traffic. For example, some applications will do light read traffic (for example to read out some metadata) and heavy write. This may inadvertently impact the read latency. For example, an application is doing a read operation with a single IO of small block size. However, the user experiences high read latency. Examining the histogram breakdown, you could reasonably believe the heavy larger IO write may interfere with the read.

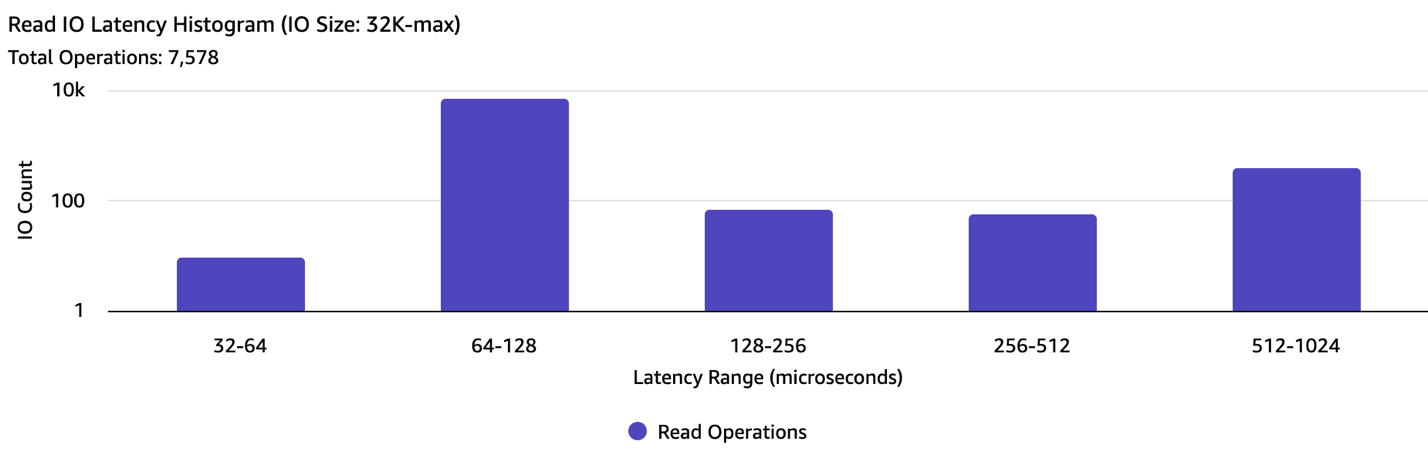
The detailed IO histogram for IO size larger than 512B but less than or equal to 4KB

The detailed IO histogram for IO size larger than 32 KiB

The user should consider smoothing out the write pattern to alleviate the read latency.

Cleaning up

If you created an EC2 instance and EBS volume for this exercise, then terminate and delete the appropriate instance and volumes to avoid future costs.

Conclusion

In this post, we presented a solution for accessing high-resolution performance statistics for Amazon EBS volumes and EC2 Instance Store at the instance level. These detailed metrics provide a real-time view into your underlying storage performance at sub-minute granularity, helping you to quickly root cause disruptions to your applications.

This approach also helps you identify performance bottlenecks caused by workloads exceeding your provisioned IOPS or throughput limits on Amazon EC2, EBS volumes, or EC2 Instance Store. Combined with Amazon CloudWatch metrics, which provide volume-level insights at one-minute granularity, these tools help give you the visibility you need to confidently diagnose and resolve storage-related performance issues.

Simulating Amazon EC2 EBS burst credits before downsizing an instance

Post Syndicated from Vineedh George original https://aws.amazon.com/blogs/compute/simulating-amazon-ec2-ebs-burst-credits-before-downsizing-an-instance/

When downsizing an Amazon Elastic Compute Cloud (Amazon EC2) instance, teams often evaluate CPU and memory utilization but overlook the instance’s Amazon Elastic Block Store (Amazon EBS) performance limits for throughput and IOPS. Smaller Amazon EBS-optimized instance types have lower baselines and rely on burst credits to handle peaks. If your workload’s I/O pattern drains those credits faster than the instance can refill them, the instance will throttle your workload to baseline. This post applies to burstable EBS-optimized instances with baselines below their maximum.

This post shows how to pull your instance’s Amazon EBS metrics from Amazon CloudWatch, simulate the burst credit balance against a target instance type’s limits, and help evaluate whether the downsize might be appropriate before making the change.

Solution overview

The analysis compares your workload’s actual I/O pattern against the target instance type’s Amazon EBS limits.

  1. Measure your current Amazon EBS usage. Pull instance-level throughput and IOPS from Amazon CloudWatch at 5-minute granularity. You need at least two weeks of data to capture weekly patterns. Four weeks is better if your workload has monthly cycles. While you pull data, check whether your current instance already hits its Amazon EBS-optimized performance limits.
  2. Compare against the target instance’s limits. Look up the baseline and burst ceiling for your target instance type. Simulate the burst credit balance across your observation window: for each 5-minute interval, calculate whether credits are draining or refilling, and track whether the balance ever hits zero. If it does, you will experience throttling on the smaller instance.
  3. Monitor after the move. Watch InstanceEBSThroughputExceededCheck and InstanceEBSIOPSExceededCheck for immediate throttle detection. Track EBSByteBalance% and EBSIOBalance% to gauge how much headroom remains for workload growth.

Note: These balance metrics are only available on burstable instance sizes where the baseline is lower than the maximum.

Prerequisites

An AWS account with permissions for cloudwatch:GetMetricData and ec2:DescribeInstanceTypes. The instance must be Amazon EBS-optimized (AWS enables EBS-optimization by default on most current-generation instance types).

Note: AWS doesn’t provide these instance-level Amazon CloudWatch metrics in AWS Outposts, AWS Local Zones, or AWS Wavelength Zones.

Pulling instance-level Amazon EBS metrics from Amazon CloudWatch

Amazon CloudWatch provides Amazon EBS metrics at the instance level in the AWS/EC2 namespace, using the InstanceId dimension. Here are the metrics that you need:

Metric What it measures
EBSReadBytes Total read bytes in the period
EBSWriteBytes Total write bytes in the period
EBSReadOps Total read operations in the period
EBSWriteOps Total write operations in the period
EBSIOBalance% IOPS burst credit balance (0-100%)
EBSByteBalance% Throughput burst credit balance (0-100%)
InstanceEBSIOPSExceededCheck 1 if instance hit IOPS limit, 0 otherwise
InstanceEBSThroughputExceededCheck 1 if instance hit throughput limit, 0 otherwise

The first four metrics are the inputs for the simulation. The rest are useful context:

  • EBSIOBalance% and EBSByteBalance% show how much of the burst credit pool remains, as a percentage. On the current (larger) instance, these should sit at or near 100 percent. If they’re dipping, the workload is already consuming burst credits at the current size, and a downsize will make it worse.

Note: These metrics only appear on instances where the baseline is lower than the maximum.

  • InstanceEBSIOPSExceededCheck and InstanceEBSThroughputExceededCheck are binary: 1 means the instance hit its EBS-optimized performance limit within the last minute. If either is firing on the current instance, the workload is already throttling and should be addressed before considering a downsize.

Pull these at 5-minute granularity for at least two weeks (four if your workload has monthly cycles). Amazon CloudWatch retains 5-minute data points for 63 days, so that’s your upper bound. You can retrieve the data through the AWS Command Line Interface (AWS CLI) (GetMetricData API), the Amazon CloudWatch console, or any AWS SDK. The metrics live in the AWS/EC2 namespace with your InstanceId as the dimension.

Use the Maximum statistic for the four I/O metrics and Minimum for the balance percentages. Maximum captures the highest 1-minute data point within each 5-minute window, which is the conservative choice for the simulation inputs. The Sum statistic gives a more precise total for each interval, but Maximum is the intentionally conservative choice. It assumes the peak 1-minute rate held for the full 5-minute window, which overstates actual consumption. Minimum on the balance metrics captures the lowest point the balance hit within each window, so you see the actual dips rather than averaging them away. For the ExceededCheck metrics, use Maximum (you want to know if the limit was hit at any point in the window).

Combine read and write values to get totals per interval. To convert to per-second rates:

total_throughput_MBps = (EBSReadBytes + EBSWriteBytes) / (60 * 1024 * 1024)
total_iops            = (EBSReadOps + EBSWriteOps) / 60

The division by 60 (not by the period length) is intentional. The Maximum statistic for a 5-minute period returns the highest 1-minute aggregate within that window, not a 5-minute total. Dividing by 60 converts that 1-minute peak to a per-second rate. The additional divisions by 1,024 convert bytes to mebibytes to match the units in describe-instance-types.

Comparing actual usage against target limits

From the Amazon EBS-optimized instances documentation, find the baseline and maximum (burst ceiling) for both IOPS and throughput on your target instance type. You can also pull these programmatically:

aws ec2 describe-instance-types \
  --instance-types r8i.large \
  --query 'InstanceTypes[0].EbsInfo.EbsOptimizedInfo' \
  --output table

This returns the baseline and maximum bandwidth (MB/s) and IOPS for the instance type. Note that BandwidthInMbps is megabits per second (network-style units), while ThroughputInMBps is megabytes per second. The throughput values are what you compare against your Amazon CloudWatch data.

-------------------------------------------
|          EbsOptimizedInfo               |
+----------------------------+------------+
| BaselineBandwidthInMbps    | 650        |
| BaselineThroughputInMBps   | 81.25      |
| BaselineIops               | 3600       |
| MaximumBandwidthInMbps     | 10000      |
| MaximumThroughputInMBps    | 1250.0     |
| MaximumIops                | 40000      |
+----------------------------+------------+

BaselineThroughputInMBps is the sustained rate the instance can deliver indefinitely. MaximumThroughputInMBps is the burst ceiling, the absolute maximum the instance can deliver while it has burst credits. Same relationship for IOPS. IOPS and throughput have separate burst budgets, tracked by EBSIOBalance% and EBSByteBalance% respectively.

How burst credits work

The instance maintains a credit pool for each budget (IOPS and throughput). The pool capacity is:

credit_pool = (burst_ceiling - baseline) * 1800

The 1800 comes from 30 minutes (1800 seconds) of burst at the maximum rate, which AWS provisions as the pool size for burstable Amazon EBS-optimized instances. Credits drain when usage exceeds baseline and refill when usage is below baseline, at a rate of baseline – effective_usage per second, where effective_usage is min(actual_usage, burst_ceiling). The instance cannot deliver more than the ceiling regardless of credit balance, so credits drain at the ceiling rate, not the requested rate. The pool is capped at its maximum and floored at zero. When credits hit zero, your workload is throttled to baseline performance. AWS resets the pool to full every 24 hours, giving you at least 30 minutes of burst capacity per day.

See Improving application performance and reducing costs with Amazon EBS-optimized instance burst capability for a detailed walkthrough of how burst credits work.

Simulating the credit balance

With the time series data and the target limits, you can simulate what the credit balance would look like on the smaller instance. For each 5-minute interval in your observation window:

effective_usage = min(actual_usage, burst_ceiling)
net_credit_change = (baseline - effective_usage) * interval_seconds
new_balance = previous_balance + net_credit_change
new_balance = clamp(new_balance, 0, credit_pool)

Where interval_seconds is 300 for 5-minute data or 60 for 1-minute data.

When actual usage is below baseline, credits accumulate. When above, they drain. Run this across the full observation window, resetting the pool to full at the start of each 24-hour period to model the AWS top-off guarantee. Start each day with a full pool, then drain and refill through the day’s intervals. If the balance hits zero on any day, the workload will throttle on the smaller instance.

Run the simulation twice: once for IOPS, once for throughput. Throttling happens if either pool hits zero.

A Python script that pulls Amazon CloudWatch data for a given instance ID, looks up the target instance type’s Amazon EBS limits, and runs this simulation end-to-end is available at sample-ec2-ebs-burst-analyzer repository.

This simulation is an approximation

It models credit behavior at 5-minute (or 1-minute) granularity using Amazon CloudWatch aggregates, not the actual per-second I/O stream. Two factors make the simulation more conservative than reality, and two can make reality worse than the simulation.

The Maximum statistic returns the highest 1-minute total within each 5-minute window. The simulation applies that peak rate across the full 300-second interval. This overestimates credit drain by up to 5x for any given interval, because the other 4 minutes likely had lower usage. The tradeoff is intentional. If the simulation says the workload fits, the result is reliable. If it says the workload doesn’t fit, the actual situation might be better than predicted. In that case, re-run with the Average statistic for a less conservative check, or pull 1-minute data (available for the most recent 15 days in Amazon CloudWatch) for higher fidelity.

Working in the other direction, two things can make the real situation worse than the simulation predicts. If the downsize also reduces memory, database workloads (SQL Server buffer pool, PostgreSQL shared_buffers, Oracle SGA) will generate more disk I/O than what you measured because the smaller cache forces more page reads from Amazon EBS. Account for this by including additional headroom in the burst credit budget. And I/O spikes that last milliseconds don’t show up in 5-minute Amazon CloudWatch data. If EBSByteBalance% or EBSIOBalance% are trending down on the current instance but your throughput metrics look fine, the workload is microbursting.

What to look for in the results

The simulation produces two outputs per budget (IOPS and throughput): the low-water mark (lowest credit balance across the observation window) and the number of intervals where the balance hit zero.

  • IOPS credit balance (EBSIOBalance%) – If the simulated low-water mark stays well above zero, the workload’s IOPS pattern fits within the target’s burst budget. A low-water mark of 90 percent means the workload barely touches the IOPS burst pool. A low-water mark of 40 percent means it fits today but has limited room for IOPS growth.
  • Throughput credit balance (EBSByteBalance%) – Same logic for throughput. Check this independently because a workload can be comfortable on IOPS but tight on throughput, or the reverse.
  • Intervals at zero – If either balance hits zero on any day, the workload will throttle to baseline on this instance type.
  • Peak usage vs. burst ceiling – The ceiling is the absolute maximum regardless of credit balance. If your peak throughput exceeds MaximumThroughputInMBps or peak IOPS exceeds MaximumIops, the instance will cap I/O at the ceiling rate during those intervals. This doesn’t mean the workload doesn’t fit overall (credits might still be fine), but the application will experience reduced I/O during those peaks. A handful of brief spikes may be acceptable. Sustained ceiling breaches are a stronger signal to size up.
  • Throttled intervals – The most direct measure of impact. A throttled interval is one where the credit balance is at zero and usage exceeds baseline. During these intervals, the instance cannot deliver what the workload is asking for. A few throttled intervals during a nightly batch may be tolerable. Dozens per day during business hours is a problem.

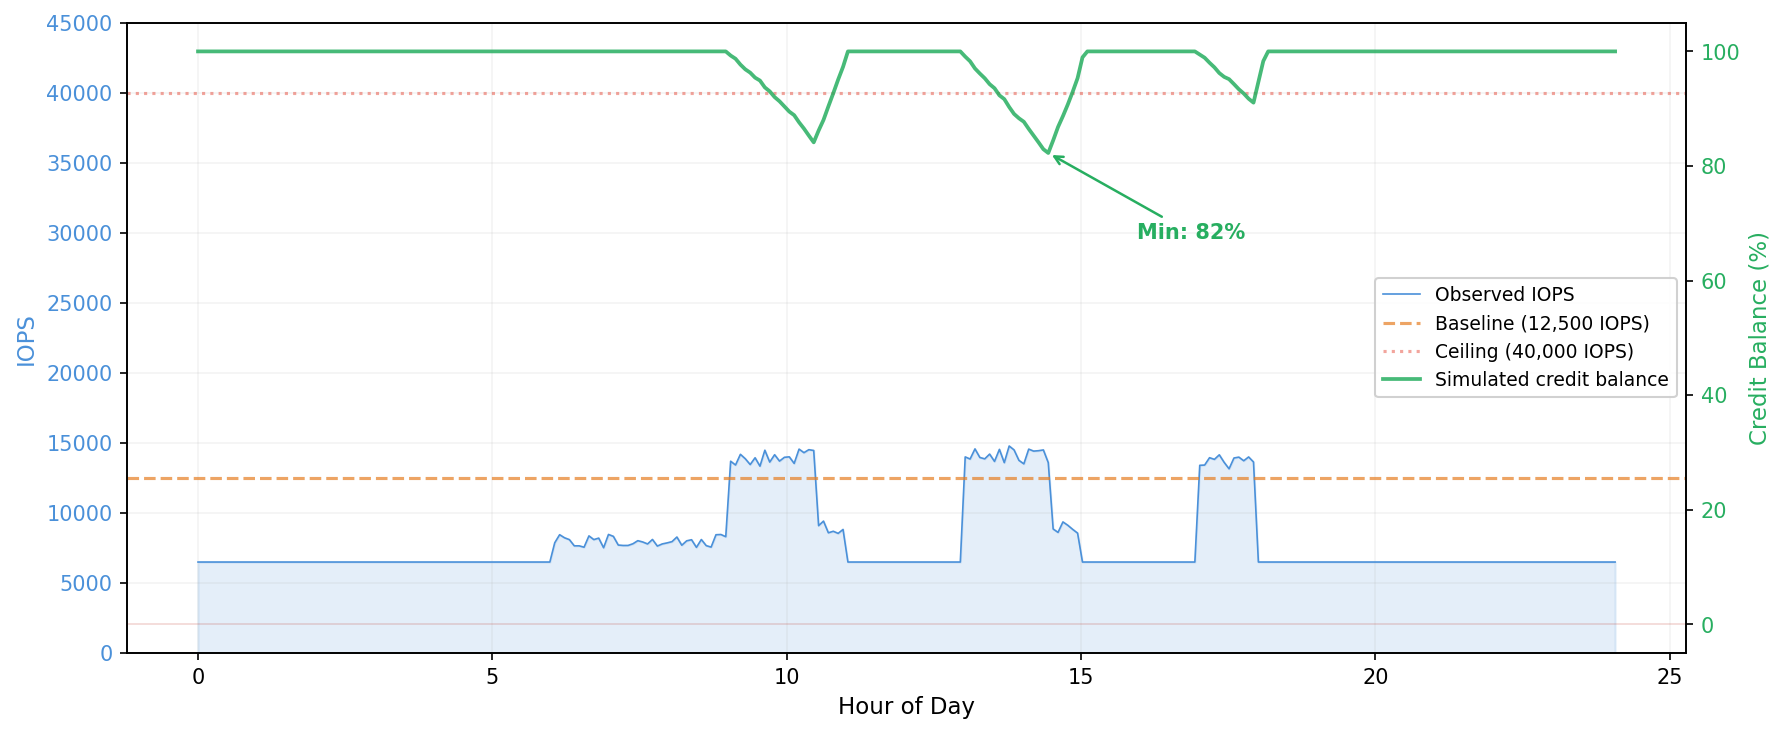
The following two figures show what these outcomes look like. In the first, the workload bursts above baseline during business hours but credits never fully deplete. The minimum balance stays at 82 percent, well above zero. This workload is safe to downsize.

Figure 1: Chart showing observed IOPS over 24 hours with baseline and ceiling reference lines. IOPS bursts above baseline during business hours. Simulated credit balance dips to a minimum of 82% and recovers, indicating the workload sustains burst credits on this instance type.

Figure 1: Amazon EC2 EBS-optimized instance burst credit simulation: credits sustained

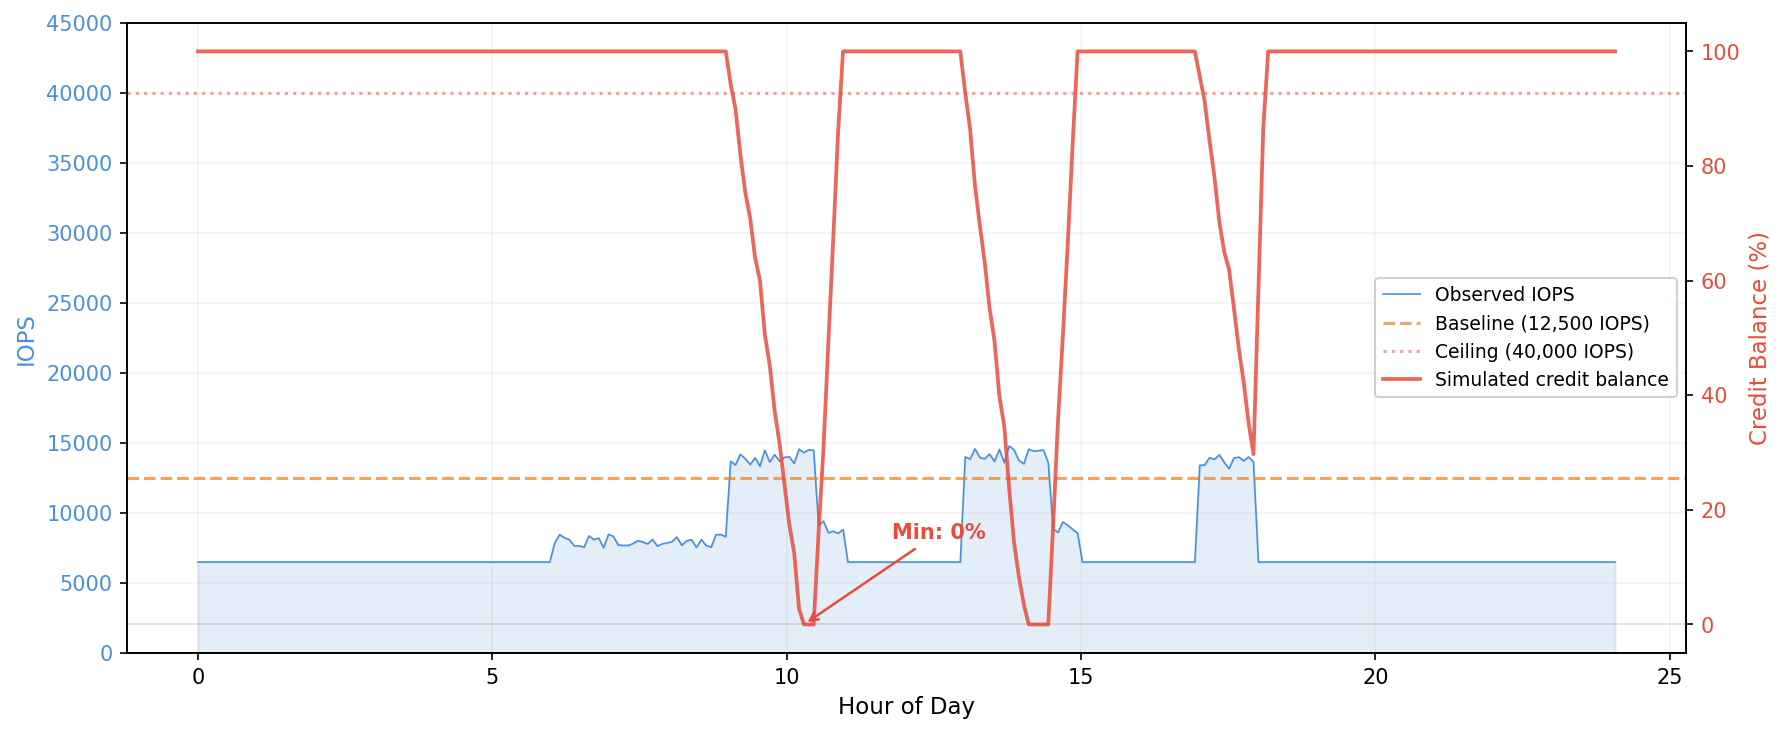
In the second figure, the same workload runs on a smaller instance type with a lower burst pool. Credits deplete within the first burst window and stay near zero for most of the business day. This workload would throttle on the smaller instance.

Figure 2: Chart showing the same IOPS pattern with a smaller burst pool. Simulated credit balance drops to 0% during each burst window, indicating burst credits are depleted and the workload would be throttled on this instance type.

Figure 2: Amazon EC2 EBS-optimized instance burst credit simulation: credits depleted

Worked examples

The following servers are from a customer running SQL Server on EC2. We simulated the burst credit balance for each against the proposed target instance type, using 28 days of Amazon CloudWatch data at 5-minute granularity with the Maximum statistic.

Server A: fits comfortably (current: c6in.4xlarge; proposed: r6i.large)

Target limits: baseline 3,600 IOPS / 81.25 MB/s, burst ceiling 40,000 IOPS / 1,250 MB/s.

Simulating the credit balance across 28 days with a daily pool reset:

IOPS Throughput
Credit pool 65,520,000 2,103,750 MB
Low-water mark 52,084,325 (79.5%) 1,656,415 MB (78.7%)
Intervals at zero 0 0

On the worst day for throughput, here’s what the simulation looks like during the evening burst window, showing how credits drain and recover interval by interval:

Time Throughput (MB/s) Net credit change Balance Balance %
22:00 154.25 -21,900 1,854,076 88.1%
22:05 22.57 +17,603 1,871,679 89.0%
22:10 452.16 -111,273 1,760,406 83.7%
22:15 427.89 -103,991 1,656,415 78.7%
22:20 30.99 +15,077 1,671,492 79.5%

At 22:10 and 22:15, throughput spiked above 400 MB/s, well above the 81.25 MB/s baseline but still under the 1,250 MB/s burst ceiling. Each interval drained roughly 100,000 credits. The pool hit its low-water mark of 78.7 percent at 22:15, then immediately began recovering as throughput dropped. By 23:55, the pool was back to 100 percent.

Assessment: fits, with roughly 20 percent headroom on the worst day.

Server B: fits but tight (same workload as Server A; proposed: r5.large)

Target limits: baseline 3,600 IOPS / 81.25 MB/s, burst ceiling 18,750 IOPS / 593.75 MB/s.

IOPS Throughput
Credit pool 27,270,000 922,500 MB
Low-water mark 13,834,325 (50.7%) 475,165 MB (51.5%)
Intervals at zero 0 0

Same workload, same burst pattern, but the r5.large has a smaller credit pool, so the same spikes drain a larger percentage. The throughput low-water mark drops from 78.7 percent to 51.5 percent. The same evening burst window that used 20 percent of the r6i.large pool now consumes nearly half the r5.large pool:

Time Throughput (MB/s) Net credit change Balance Balance %
22:00 154.25 -21,900 672,826 72.9%
22:05 22.57 +17,603 690,429 74.8%
22:10 452.16 -111,273 579,156 62.8%
22:15 427.89 -103,991 475,165 51.5%
22:20 30.99 +15,077 490,242 53.1%

This still fits, but with limited margin. Any workload growth (more users, larger databases, additional backup jobs) could push the balance toward zero. Separately, a single IOPS interval reached 20,226, exceeding the r5.large burst ceiling of 18,750. The instance can only deliver up to the ceiling while credits remain, so the application received 18,750 IOPS during that interval. That single spike would not cause sustained throttling, but combined with the tight throughput margins, it confirms this workload is at the boundary of what r5.large can handle.

Assessment: fits today, but not a safe long-term choice.

Server C: ceiling breach (current: c6in.4xlarge; proposed: r6i.xlarge)

Target limits: baseline 6,000 IOPS / 156.25 MB/s, burst ceiling 40,000 IOPS / 1,250 MB/s.

Peak throughput: 1,502.94 MB/s. This exceeds the 1,250 MB/s burst ceiling. During those peak intervals, the instance would cap throughput at 1,250 MB/s while credits remain. If credits are exhausted, throughput drops to the 156.25 MB/s baseline. The credit simulation might still show the workload fits (credits never hit zero), but the application would experience reduced I/O during those peaks. For this customer, the peaks coincided with production SQL Server activity, so even brief throttling wasn’t acceptable, and a larger instance type was needed.

Assessment: workload will be throttled during peak intervals. Whether that’s acceptable depends on the application’s sensitivity to I/O latency.

Monitoring after the resize

The pre-migration analysis uses historical data from the larger instance. After you resize, real metrics replace the simulation. Monitor the following three layers:

  1. InstanceEBSThroughputExceededCheck and InstanceEBSIOPSExceededCheck = 1 means the instance is actively throttling. This is the definitive signal. Alarm on Sum > 0 over 3 consecutive 1-minute periods to filter out single-second spikes that resolve on their own.
  2. EBSByteBalance% and EBSIOBalance% trending downward over days or weeks means the workload is growing into the instance’s limits. You’re not throttling yet, but you’re on a trajectory. An instance that dips to 90 percent nightly and recovers is in a different position than one that dips to 40 percent and barely recovers before the next burst. Neither instance is throttling, but the first has headroom while the second doesn’t.
  3. EBSByteBalance% and EBSIOBalance% stay at 100 percent means the workload never exceeds baseline. The instance has unused capacity, and you might even be able to go smaller.

If the workload has weekly patterns, allow at least one full week of data before drawing conclusions.

Conclusion

In this post, we showed how to simulate the EBS-optimized instance burst credit balance against a target instance type’s limits before downsizing an Amazon EC2 instance. The approach pulls Amazon CloudWatch metrics at 5-minute granularity, compares actual throughput and IOPS against the target’s baseline and burst ceiling, and tracks whether the credit balance would hit zero during the observation window.

This covers the Amazon EBS dimension of a right-sizing decision. A complete evaluation also considers CPU utilization, memory usage, and network throughput against the target instance’s limits. For workloads where Amazon EBS utilization is well below baseline, the burst credit simulation might not be necessary.

To run this analysis on your own instances, see the companion script in the sample-ec2-ebs-burst-analyzer repository. For more on how instance-level burst credits work, see Improving application performance and reducing costs with Amazon EBS-optimized instance burst capability. For instance-level EBS baseline and burst limits by instance type, see Amazon EBS-optimized instances.

AWS Outposts monitoring and reporting: A comprehensive Amazon EventBridge solution

Post Syndicated from Matt Price original https://aws.amazon.com/blogs/compute/aws-outposts-monitoring-and-reporting-a-comprehensive-amazon-eventbridge-solution/

Organizations using AWS Outposts racks commonly manage capacity from a single AWS account and share resources through AWS Resource Access Manager (AWS RAM) with other AWS accounts (consumer accounts) within AWS Organizations. In this post, we demonstrate one approach to create a multi-account serverless solution to surface costs in shared AWS Outposts environments using Amazon EventBridge, AWS Lambda, and Amazon DynamoDB. This solution reports on instance runtime and allocated storage for Amazon Elastic Compute Cloud (Amazon EC2), Amazon Relational Database Services (Amazon RDS), and Amazon Elastic Block Store (Amazon EBS) services running on Outposts racks. In turn, teams can track the cost of infrastructure associated with their workloads across AWS accounts. This solution is a framework that can be customized to meet your organization’s specific business objectives.

Solution overview

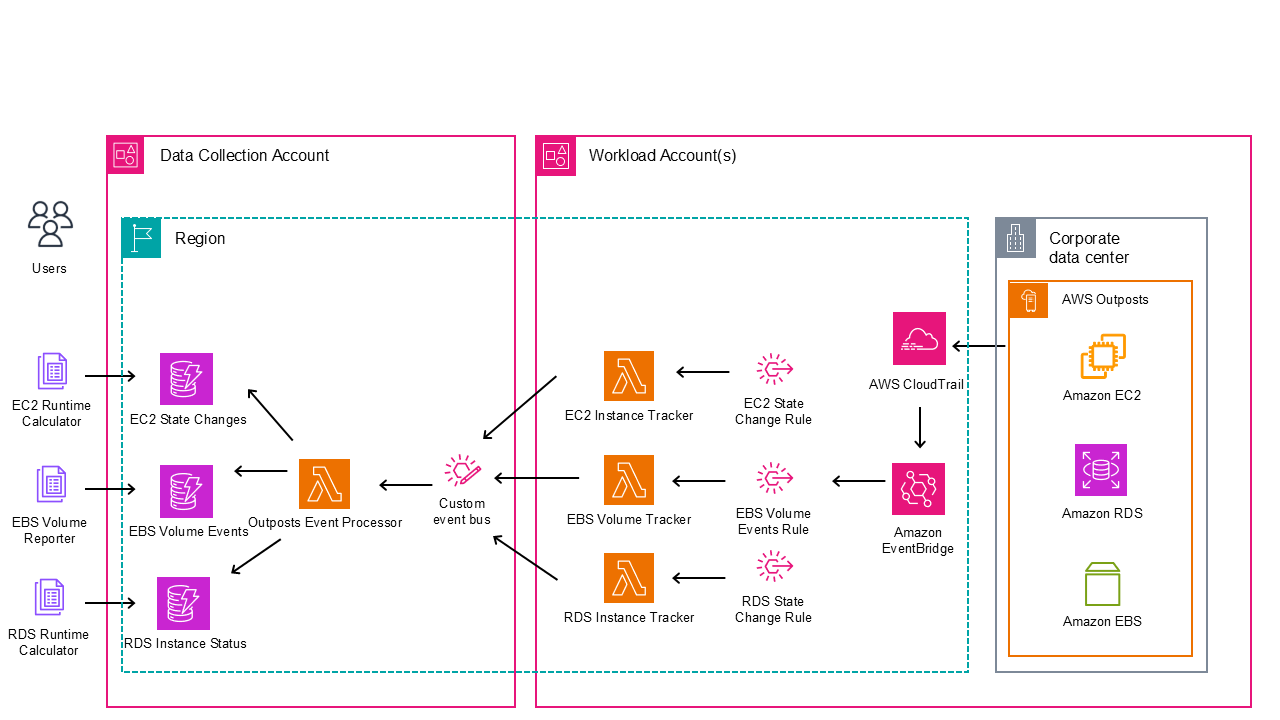
The following is the Terraform-based reference architecture used to represent the solution, including EventBridge, DynamoDB, and Lambda across a multi-account environment. Relevant launch events are tracked in EventBridge that invoke Lambda functions, which are logged in DynamoDB tables (see sample code). This allows reporting on captured event data through the AWS SDK for Python (Boto3)AWS architecture diagram showing data collection and workload account integration with EventBridge, CloudTrail, and Outposts
Figure 1: Reference architecture for reporting solution on AWS Outposts 

Prerequisites

The following prerequisites are necessary to implement this solution:

Walkthrough

The following sections walk you through how to deploy this solution.

Deploying in data collection account

Step 1: Create a bucket in-Region to hold the Terraform state file in the data collection account.

aws s3 mb s3://state-bucket-name

Step 2: Clone the repository.On your local machine, clone the repository that contains the sample by running the following command:

git clone https://github.com/aws-samples/sample-outposts-monitoring-and-reports.git

Navigate to the cloned repository by running the following command:cd sample-outposts-monitoring-and-reports/data_collection

Step 3: Edit the providers.tf to configure the AWS provider.


provider "aws" {
  region = ""
}

Step 4: Edit the backend.tf to provide the Terraform state bucket and Outposts anchored AWS Region.

terraform {
  backend "s3" {
    bucket = ""
    key    = "terraform.tfstate"
    region = ""
  }
}

Step 5: Modify the variables.tf.From the root directory of the cloned repository, modify the variables.tf file with the target Region and workload accounts as shown in the following example. The target Region is the collection destination.

variable "aws_region" {
  description = "AWS region for resources"
  type        = string
  default     = ""
}

variable "allowed_account_id" {
  description = "AWS account ID allowed to put events to the event bus"
  

}

Initialize the configuration directory of the data collection account to download and install the providers defined in the configuration by running the following command:

terraform init

All resources are deployed with minimal permissions to serve as an example. We recommend viewing all configurations to make sure that they meet your organizational security policies. Step 6: Deploy infrastructure in the data collection account.Run terraform plan on the configuration to and review which resources are created:

terraform plan

When you have reviewed the plan, run the following command and enter “yes” to accept the changes and deploy:

terraform apply

Deployment should take less than 5 minutes. If you receive any errors, review the previously mentioned steps to ensure that you followed them in their entirety. If the errors persist, reach out to AWS Support for additional guidance.

Deploying in workload account

The data collection account receives events from EventBridge and performs intelligent analysis and storage from the AWS Outposts resource data.Step 1: Navigate to the workload account directory by running the following command:

cd ../workload_account

Step 2: Edit variables.tf to set up the Region and event bus Amazon Resource Name (ARN). 

variable "aws_region" {
  description = "AWS region for resources"
  type        = string
  default     = ""
}

variable "event_bus_arn" {
  description = "target event bus arn"
  type        = string
  default     = ""
}

Edit the code to update the event bus name.

Step 3: Run the following command to create the backend.tf and create the Terraform state bucket for each workload account.

./init-backend.sh

This is an idempotent operation that creates a file from the template and a bucket with a fixed name including the account ID if it doesn’t exist. 

Step 4: Initialize the configuration directory of the Data Collection Account to download and install the providers defined in the configuration by running the following command:

terraform init

Step 5: Deploy the infrastructure in the Data Collection Account.Run a terraform plan on the configuration and review which resources are created:

terraform plan

After you have reviewed the plan, run the following command and enter “yes” to accept the changes and deploy:

terraform apply

Deployment should take less than 5 minutes. If you receive any errors, follow the troubleshooting steps in the previous section.

At this point, any Amazon EC2 or Amazon RDS instances and Amazon EBS volumes are logged to the DynamoDB tables in the data collection account. Repeat Steps 3–5 for each workload account running resources on AWS Outposts with appropriate account credentials. If you’re deploying at scale and using AWS Control Tower consider using AWS Control Tower Account Factory for Terraform (AFT).

Running monthly reports

With this solution in place, reports can be generated on demand. These reports can be customized by modifying the Python example scripts shown to support your needs. Reports can be created from a local machine with credentials that have access to the DynamoDB tables in the data collection account. The examples were created from the source directory of the data collection account git repository. Run the following command to view the report for Amazon RDS usage in September 2025:

./rds_runtime_calculator.py --year 2025 --month 9 --output rds_report.csv

Spreadsheet showing RDS database instances with configuration details, storage allocation, and operational status in us-west-2 region

Figure 2: Example of RDS runtime report 


Run the following command to view the report for Amazon EBS usage in September 2025:

./ebs_volume_reporter.py --year 2025 --month 9 --output ebs_report.csv


EBS volume tracking table showing volume configurations, lifecycle hours, and active/deleted status in us-west-2

Figure 3: Example of EBS usage report 


Run the following command to view the report for Amazon EC2 usage in September 2025:

./ec2_runtime_calculator.py --month 9 --year 2025 --output ec2_report.csv

EC2 instance tracking table showing c5.large instances with runtime hours and running/stopped status on AWS Outposts

Figure 4: Example of EC2 runtime report 


Cleaning up

Complete the following steps to clean up the resources that were deployed by this solution. For each workload account, complete the following:

cd sample-outposts-monitoring-and-reports/workload_account
terraform destroy 

Enter “yes” to proceed. You can then manually empty and remove the terraform state S3 bucket for that account.

For the data collection, complete the following:

cd ../data_collection
terraform destroy

Enter “yes” to proceed. You can then manually empty and remove the terraform state S3 bucket for that account.

Conclusion

Customers who have shared multi-account Outposts deployments can use this solution to create account level reporting for Outposts resources using real-time event capture and processing, state analysis and categorization, historical usage metrics, and serverless architecture. Teams can use this to visualize and report on the costs of running their workloads on Outposts. The event-driven design supports accurate tracking while maintaining low operational overhead. The solution scales effectively across multiple Outposts and accounts, providing a unified view of hybrid infrastructure. Keep in mind that you can extend the functionality described here to meet your business objectives.

Deploy this solution today using the GitHub repository to gain financial insights to share with the tenants of your Outposts workload accounts. Reach out to your AWS account team, or fill out this form to learn more about Outposts.

Optimizing storage performance for Amazon EKS on AWS Outposts

Post Syndicated from Arun Kumar original https://aws.amazon.com/blogs/compute/optimizing-storage-performance-for-amazon-eks-on-aws-outposts/

Amazon Elastic Kubernetes Service (Amazon EKS) on AWS Outposts brings the power of managed Kubernetes to your on-premises infrastructure. Use Amazon EKS on Outposts rack to create hybrid cloud deployments that maintain consistent AWS experiences across environments. As organizations increasingly adopt edge computing and hybrid architectures, storage optimization and performance tuning become critical for successful workload deployment.

Outposts extend AWS infrastructure, services, APIs, and tools to virtually any datacenter, co-location space, or on-premises facility. In this blog post you will learn about your storage options and their performance characteristics which is essential for building resilient, high-performing applications using Amazon EKS on Outposts.

Amazon EKS on Outposts deployment options

The following two sections outline the differences between Amazon EKS extended and local cluster deployment options available on Outposts.

Amazon EKS extended cluster architecture

Amazon EKS extended clusters on Outposts provide a powerful solution for organizations seeking to use the benefits of Kubernetes while maintaining certain workloads on-premises, as shown in the following figure. This hybrid architecture allows businesses to extend their EKS clusters from the AWS Cloud to their own data centers or edge locations using Outposts. The Kubernetes control plane remains in the AWS Region, providing centralized management and benefiting from the AWS infrastructure in the cloud and on the Outpost.

Outposts is designed to be a connected service, and needs reliable network connectivity to the AWS Region using the Outposts service link.

Figure 1 : Extended cluster

Amazon EKS local cluster architecture

Amazon EKS local clusters deploy the Kubernetes control plane on your Outpost, as shown in the following figure. This provides greater network resilience against outages as cluster operations run entirely on the Outposts and reduces the dependency on network connectivity to the AWS Region. Having the Kubernetes control plane hosted on your Outpost also reduces latency for cluster operations.

  Figure 2: Local cluster

Storage options for Amazon EKS extended clusters on Outposts

Persistent Volumes (PV) and Persistent Volume Claims (PVC) serve as a critical abstraction layer in Kubernetes, separating the storage consumption details from storage provisioning, and allowing administrators to manage storage resources independently from how applications consume them. PVs and PVCs make sure of data persistence across pod restarts and rescheduling events, making them essential for applications that need to maintain state, such as databases, file storage systems, and other data-intensive workloads. The abstraction provided by PV and PVC enables platform-agnostic storage management, where applications can request storage through PVCs without needing to know the underlying storage implementation details. PVs and PVCs support dynamic provisioning through Storage Classes, allowing for automated storage allocation based on application demands, while also providing features such as access modes, capacity management, and reclaim policies to effectively manage the storage lifecycle in a Kubernetes cluster.

Integrating Amazon EBS with Amazon EKS

Amazon Elastic Block Store (Amazon EBS) provides high-performance block storage that’s ideal for low-latency applications providing consistent performance. When deployed on Outposts racks, EBS volumes are stored on the Outposts hardware, providing significant performance advantages over network-attached storage solutions, as shown in the following figure.

Figure 3 : Integrating Amazon EBS with Amazon EKS on Outposts

Benefits and use cases

  • Storage: EBS volumes on Outposts racks provide data access without dependency on external connectivity.
  • Performance: Local storage delivers consistent latency and high IOPS/throughput.
  • Cost: On-premises storage eliminates data transfer costs and reduces bandwidth needs, lowering the total cost of ownership.

Implementation considerations

Consider the following when using EBS on Outposts rack:

  • EBS volumes on Outposts are tied to a single rack and the availability zone the Outpost is homed to, needing applications to address single-point-of-failure risks.
  • Protect data using EBS snapshots in the parent Region and schedule regular backups.
  • Capacity on Outposts is finite, monitor Outposts storage usage and plan expansions proactively to avoid insufficient capacity errors.

Refer to Dynamic Volume Provisioning to learn more about deploying pod with the EBS volume attached.

Amazon EFS with Amazon EKS

Amazon Elastic File System (Amazon EFS) provides scalable, shared file storage that can be accessed across multiple AWS Availability Zones (AZs) and on-premises environments. Although Amazon EFS with Amazon EKS on Outposts maintains the same setup procedures as standard cloud deployments, there is a critical dependency on the service link connection between your Outposts and the AWS Region. Amazon EFS is not a locally supported service on Outposts, so connectivity to the AWS Region is required to use this service with your Outpost.

Amazon EFS allows multiple pods to concurrently access shared file systems. It is well-suited for applications that need collaborative data access, content management, and distributed processing workloads.

Amazon EFS as a persistent storage solution for Amazon EKS extended cluster instances

Amazon EFS as a PV for your Amazon EKS extended cluster operates through a hybrid architecture where the Amazon EFS file system resides in the Region, but mount points can be created on the worker nodes running on Outposts subnets through the service link as shown in the following figure.

Figure 4 : Amazon EFS as a persistent storage solution for extended clusters

Benefits and use cases

  • Shared storage capabilities: multiple pods can access a centralized file system, enabling shared data, code, and assets across instances.
  • Scalability: storage capacity and performance automatically scale with usage, eliminating manual provisioning and upfront planning.
  • Compliance: Amazon EFS provides full file system features and compatibility for traditional applications, such as locking, permissions, and directory structure.

Challenges and limitations

Consider the following when using Amazon EFS with Outposts:

  • Network latency: file access involves network traversal to Amazon EFS in the Region, adding more latency and making small or metadata operations potentially slow for latency-sensitive applications.
  • Throughput: aggregate throughput is restricted by the available bandwidth on the service link between the Outposts and AWS Region. This impacts concurrent access and large file transfers during peak usage.
  • Dependency on AWS Region connectivity: Amazon EFS needs continuous connectivity to the parent Region. Disruptions may affect file system availability, operations, and disaster recovery processes.
  • Data Transfer charges: Since EFS is in AWS Parent region and EKS worker nodes and pods are in Outpost additional charges are applicable.

You can refer to Amazon EFS Features and When to Choose Amazon EFS for more detailed insights into its capabilities and use cases.

Deploying pods on extended clusters using Amazon EFS as PV

Refer to Use Elastic File System Storage with Amazon EFS for deployment guidance. Note, Create Amazon EFS mount targets in subnets that are in the same Availability Zone (AZ) as the Outposts subnets.

Amazon S3 with Amazon EKS extended cluster

Amazon Simple Storage Service (Amazon S3) on Outposts delivers local object storage on your Outposts, allowing applications to use Amazon S3 APIs for storing and retrieving data while keeping it onsite. It is ideal for workloads that need Amazon S3 compatibility, low latency access to object data, and local data residency.

You should use Amazon S3 access point Amazon Resource Names (ARNs) and not bucket ARNs for proper integration with Amazon EKS workloads.

Learn more about Amazon S3 on Outposts.

Figure 5 : Amazon S3 with Amazon EKS extended cluster on Outposts

Benefits and use cases

  • Data archiving and compliance: Enables cost-effective, locally retained storage for logs, audit trails, regulatory compliance, backups, and sensitive healthcare data with strict residency requirements.
  • Content distribution and media: Provides ultra-low latency local storage for serving static content, media streaming, digital asset management, and gaming asset delivery.
  • Data lake and analytics: Supports local data processing for analytics, ETL, machine learning (ML), real-time Internet of Things (IoT) data handling, and business intelligence with reduced latency and transfer costs.
  • Application integration: Seamlessly integrates with Amazon S3 compatible apps for backup, synchronization, microservices storage, API-driven workflows, and container image management on-premises.

Refer to How is Amazon S3 on Outposts different from Amazon S3 and the Amazon S3 on Outposts documentation to learn more.

Deploying pods on extended clusters using Amazon S3 as PV

Step 1: Create Amazon S3 on Outposts bucket
Step 2: Create Amazon S3 Access Point (necessary for Amazon EKS integration)
Step 3: Configure IAM roles and policies
Step 4: Install Amazon S3 CSI driver
Step 5: Deploying your pod with Amazon S3 volume attached
Step 6: Complete Amazon S3 configuration with Kubernetes

Refer to the documentation Static Provisioning on Outposts bucket for more details on Step 5.

Best practices for optimizing performance

Optimizing performance starts with selecting the right storage type for your workload: Amazon EBS for low-latency, high-throughput block storage; Amazon EFS for shared POSIX-compliant file systems; and Amazon S3 for scalable object storage with API compatibility. Ensure proper volume sizing, monitor usage proactively, and configure CPU and memory requests accurately to balance performance and efficiency—auto scaling and QoS classes can further optimize resource management. Improve data locality by using local storage, apply caching with intelligent eviction, and design for efficient, asynchronous, and compressed data access patterns.

Monitoring and observability

Monitoring key performance metrics is essential to maintain storage efficiency and application reliability. For Amazon EBS, track IOPS, throughput, latency, burst balance, queue depth, and snapshot performance to avoid degradation—see the Amazon CloudWatch metrics for Amazon EBS for the full list. For Amazon EFS, monitor total I/O, throughput, client connections, metadata operations, burst credits, and Regional data transfers to support effective capacity planning—refer to CloudWatch metrics for Amazon EFS. For Amazon S3, observe request and error rates, data transfer, storage usage, latency, multipart upload efficiency, and access patterns to optimize performance and cost—see Metrics and dimensions.

Security considerations

Strong security practices are critical for Amazon EKS on Outposts. Use AWS Key Management Service (AWS KMS) for Amazon EBS encryption, encrypt Amazon EFS data at rest and in transit, and enable server- or client-side encryption for Amazon S3. Enforce TLS for all data transfers and apply key rotation with compliance controls. Implement least privilege IAM policies, scoped roles, and Kubernetes Role-Based Access Control (RBAC) for granular pod access. Secure traffic with security groups and NACLs, and maintain audit logs for all storage operations.

Cost optimization strategies

Manage storage costs by right-sizing volumes, automating lifecycle policies, selecting appropriate storage classes, monitoring data transfer, and using de-duplication and compression where applicable. Lower operational expenses through automated backups, infrastructure as code (IaC), monitoring automation, leveraging managed services, applying cost allocation tags, and conducting regular usage reviews.

Conclusion

Amazon EKS on Outposts empowers organizations to build hybrid applications with storage options that align to performance, compliance, and data residency needs. By selecting the right storage solution for each workload and leveraging Outposts’ local infrastructure, you can reduce latency, minimize network dependencies, and maintain consistency across environments. As Outposts capabilities continue to evolve, they offer a strong foundation for modern, resilient, and cost-efficient hybrid cloud architectures.

Reach out to your AWS account team, or fill out this form to learn more about running containarized applications on Outposts.

AWS Weekly Roundup: Kiro waitlist, EBS Volume Clones, EC2 Capacity Manager, and more (October 20, 2025)

Post Syndicated from Veliswa Boya original https://aws.amazon.com/blogs/aws/aws-weekly-roundup-kiro-waitlist-ebs-volume-clones-ec2-capacity-manager-and-more-october-20-2025/

I’ve been inspired by all the activities that tech communities around the world have been hosting and participating in throughout the year. Here in the southern hemisphere we’re starting to dream about our upcoming summer breaks and closing out on some of the activities we’ve initiated this year. The tech community in South Africa is participating in Amazon Q Developer coding challenges that my colleagues and I are hosting throughout this month as a fun way to wind down activities for the year. The first one was hosted in Johannesburg last Friday with Durban and Cape Town coming up next.

Last week’s launches
These are the launches from last week that caught my attention:

Additional updates
I thought these projects, blog posts, and news items were also interesting:

Upcoming AWS events
Keep a look out and be sure to sign up for these upcoming events:

AWS re:Invent 2025 (December 1-5, 2025, Las Vegas) — AWS flagship annual conference offering collaborative innovation through peer-to-peer learning, expert-led discussions, and invaluable networking opportunities.

Join the AWS Builder Center to learn, build, and connect with builders in the AWS community. Browse here for upcoming in-person and virtual developer-focused events.

That’s all for this week. Check back next Monday for another Weekly Roundup!

Veliswa.

Introducing Amazon EBS Volume Clones: Create instant copies of your EBS volumes

Post Syndicated from Sébastien Stormacq original https://aws.amazon.com/blogs/aws/introducing-amazon-ebs-volume-clones-create-instant-copies-of-your-ebs-volumes/


As someone that used to work at Sun Microsystems, where ZFS was invented, I’ve always loved working with storage systems that offer instant volume copies for my development and testing needs.

Today, I’m excited to share that AWS is bringing similar capabilities to Amazon Elastic Block Store (Amazon EBS) with the launch of Amazon EBS Volume Clones, a new capability that lets you create instant point-in-time copies of your EBS volumes within the same Availability Zone.

Many customers need to create copies of their production data to support development and testing activities in a separate nonproduction environment. Until now, this process required taking an EBS snapshot (stored in Amazon Simple Storage Service (Amazon S3)) and then creating a new volume from that snapshot. Although this approach works, the process creates operational overhead due to multiple steps.

With Amazon EBS Volume Clones, you can now create copies of your EBS volumes with a single API call or console click. The copied volumes are available within seconds and provide immediate access to your data with single-digit millisecond latency. This makes Volume Clones particularly useful for quickly setting up test environments with production data or creating temporary copies of databases for development purposes.

Let me show you how Volume Clones works
For this post, I created a small Amazon Elastic Compute Cloud (Amazon EC2) instance, with an attached volume. I created a file on the root file system with the command echo "Hello CopyVolumes" > hello.txt.

To initiate the copy, I open a browser on the AWS Management Console and I navigate to EC2, Elastic Block Store, Volumes. I select the volume I want to copy.

Note that, at the time of publication of this post, only encrypted volumes can be copied.

On the Actions menu, I choose the Copy Volume option.

Copy Volume - initiate

Next, I choose the details of the target volume. I can change the Volume type and adjust the Size, IOPS, and Throughput parameters. I choose Copy volume to start the Volume Clone operation.

Copy Volume - Parameters

The copied volume enters the Creating state and becomes available within seconds. I can then attach it to an EC2 instance and start using it immediately.

Data blocks are copied from the source volume and written to the volume copy in the background. The volume remains in the Initializing state until the process is complete. I can monitor its progress with the describe-volume-status API. The initializing operation doesn’t affect the performance of the source volume. I can continue using it normally during the copy process.

I love that the copied volume is available immediately. I don’t need to wait for its initialization to complete. During the initialization phase, my copied volume delivers performance based on the lowest of: a baseline of 3,000 IOPS and 125 MiB/s, the source volume’s provisioned performance, or the copied volume’s provisioned performance.

After initialization is completed, the copied volume becomes fully independent of the source volume and delivers its full provisioned performance.

Copy Volume - InitializingAlternatively, I can use the AWS Command Line Interface (AWS CLI) to initiate the copy:

aws ec2 copy-volumes                          \
     --source-volume-id vol-1234567890abcdef0 \
     --size 500                               \
     --volume-type gp3

After the volume copy is created, I attach it to my EC2 instance and mount it. I can check the file I created at start is present.

First, I attach the volume from my laptop, using the attach-volume command:

aws ec2 attach-volume \
         --volume-id 'vol-09b700e3a23a9b4ad' \
         --instance-id 'i-079e6504ad25b029e'   \
         --device '/dev/sdb'

Then, I connect to the instance, and I type these commands:

$ sudo lsblk -f
NAME          FSTYPE FSVER LABEL UUID                                 FSAVAIL FSUSE% MOUNTPOINTS
nvme0n1                                                                              
├─nvme0n1p1   xfs          /     49e26d9d-0a9d-4667-b93e-a23d1de8eacd    6.2G    22% /
└─nvme0n1p128 vfat   FAT16       3105-2F44                               8.6M    14% /boot/efi
nvme1n1                                                                              
├─nvme1n1p1   xfs          /     49e26d9d-0a9d-4667-b93e-a23d1de8eacd                
└─nvme1n1p128 vfat   FAT16       3105-2F44     

$ sudo mount -t xfs /dev/nvme1n1p1 /data

$ df -h
Filesystem        Size  Used Avail Use% Mounted on
devtmpfs          4.0M     0  4.0M   0% /dev
tmpfs             924M     0  924M   0% /dev/shm
tmpfs             370M  476K  369M   1% /run
/dev/nvme0n1p1    8.0G  1.8G  6.2G  22% /
tmpfs             924M     0  924M   0% /tmp
/dev/nvme0n1p128   10M  1.4M  8.7M  14% /boot/efi
tmpfs             185M     0  185M   0% /run/user/1000
/dev/nvme1n1p1    8.0G  1.8G  6.2G  22% /data

$ cat /data/home/ec2-user/hello.txt 
Hello CopyVolumes

Things to know
Volume Clones creates copies within the same Availability Zone as your source volume. You can create copies from encrypted volumes only, and the size of your copy must be equal to or greater than the source volume.

Volume Clones creates crash-consistent copies of your volumes, exactly like snapshots. For application consistency, you need to pause application I/O operations before creating the copy. For example, with PostgreSQL databases, you can use the pg_start_backup() and pg_stop_backup() functions to pause writes and create a consistent copy. At the operating system level on Linux with XFS, you can use the xfs_freeze command to temporarily suspend and resume access to the file system and ensure all cached updates are written to disk.

Although Volume Clones creates point-in-time copies, it complements rather than replaces EBS snapshots for backup purposes. EBS snapshots remain the recommended solution for data backup and protection against AZ-level and volume failures. Snapshots provide incremental backups to Amazon S3 with 11 nines of durability, compared to Volume Clones which maintains EBS volume durability (99.999% for io2, 99.9% for other volume types). Consider using Volume Clones specifically for test and development environment scenarios where you need instant access to volume copies.

Copied volumes exist independently of their source volumes and continue to incur standard EBS volume charges until you delete them. To manage costs effectively, implement governance rules to identify and remove copied volumes that are no longer needed for your development or testing activities.

Pricing and availability
Volume Clones supports all EBS volume types and works with volumes in the same AWS account and Availability Zone. This new capability is available in all AWS commercial Regions, selected Local Zones, and in the AWS GovCloud (US).

For pricing, you’re charged a one-time fee per GiB of data on the source volume at initiation and standard EBS pricing for the new volume.

I find Volume Clones particularly valuable for database workloads and continuous integration (CI) scenarios. For instance, you can quickly create a copy of your production database for testing new features or troubleshooting issues without impacting your production environment or waiting for data to hydrate from Amazon S3.

To get started with Amazon EBS Volume Clones, visit the Amazon EBS section on the console or check out the EBS documentation. I look forward to hearing how you use this capability to improve your development workflows.

— seb

Accelerate the transfer of data from an Amazon EBS snapshot to a new EBS volume

Post Syndicated from Channy Yun (윤석찬) original https://aws.amazon.com/blogs/aws/accelerate-the-transfer-of-data-from-an-amazon-ebs-snapshot-to-a-new-ebs-volume/

Today we are announcing the general availability of Amazon Elastic Block Store (Amazon EBS) Provisioned Rate for Volume Initialization, a feature that accelerates the transfer of data from an EBS snapshot, a highly durable backup of volumes stored in Amazon Simple Storage Service (Amazon S3) to a new EBS volume.

With Amazon EBS Provisioned Rate for Volume Initialization, you can create fully performant EBS volumes within a predictable amount of time. You can use this feature to speed up the initialization of hundreds of concurrent volumes and instances. You can also use this feature when you need to recover from an existing EBS Snapshot and need your EBS volume to be created and initialized as quickly as possible. You can use this feature to quickly create copies of EBS volumes with EBS Snapshots in a different Availability Zone, AWS Region, or AWS account. Provisioned Rate for Volume Initialization for each volume is charged based on the full snapshot size and the specified volume initialization rate.

This new feature expedites the volume initialization process by fetching the data from an EBS Snapshot to an EBS volume at a consistent rate that you specify between 100 MiB/s and 300 MiB/s. You can specify this volume initialization rate at which the snapshot blocks are to be downloaded from Amazon S3 to the volume.

With specifying the volume initialization rate, you can create a fully performant volume in a predictable time, enabling increased operational efficiency and visibility on the expected time of completion. If you run utilities like fio/dd to expedite volume initialization for your workflows like application recovery and volume copy for testing and development, it will remove the operational burden of managing such scripts with the consistency and predictability to your workflows.

Get started with specifying the volume initialization rate
To get started, you can choose the volume initialization rate when you launch your EC2 instance or create your volume from the snapshot.

1. Create a volume in the EC2 launch wizard
When launching new EC2 instances in the launch wizard of EC2 console, you can enter a desired Volume initialization rate in the Storage (volumes) section.

You can also set the volume initialization rate when creating and modifying the EC2 Launch Templates.

In the AWS Command Line Interface (AWS CLI), you can add VolumeInitializationRate parameter to the block device mappings when call run-instances command.

aws ec2 run-instances \
    --image-id ami-0abcdef1234567890 \
    --instance-type t2.micro \
    --subnet-id subnet-08fc749671b2d077c \
    --security-group-ids sg-0b0384b66d7d692f9 \
    --key-name MyKeyPair \
    --block-device-mappings file://mapping.json

Contents of mapping.json. This example adds /dev/sdh an empty EBS volume with a size of 8 GiB.

[
    {
        "DeviceName": "/dev/sdh",
        "Ebs": {
            "VolumeSize": 8
            "VolumeType": "gp3",            
            "VolumeInitializationRate": 300
		 } 
     } 
]

To learn more, visit block device mapping options, which defines the EBS volumes and instance store volumes to attach to the instance at launch.

2. Create a volume from snapshots
When you create a volume from snapshots, you can also choose Create volume in the EC2 console and specify the Volume initialization rate.

Confirm your new volume with the initialization rate.

In the AWS CLI, you can use VolumeInitializationRate parameter and when calling create-volume command.

aws ec2 create-volume --region us-east-1 --cli-input-json '{
    "AvailabilityZone": "us-east-1a",
    "VolumeType": "gp3",
    "SnapshotId": "snap-07f411eed12ef613a",
    "VolumeInitializationRate": 300
}'

If the command is run successfully, you will receive the result below.

{
    "AvailabilityZone": "us-east-1a",
    "CreateTime": "2025-01-03T21:44:53.000Z",
    "Encrypted": false,
    "Size": 100,
    "SnapshotId": "snap-07f411eed12ef613a",
    "State": "creating",
    "VolumeId": "vol-0ba4ed2a280fab5f9",
    "Iops": 300,
    "Tags": [],
    "VolumeType": "gp2",
    "MultiAttachEnabled": false,
    "VolumeInitializationRate": 300
}

You can also set the volume initialization rate when replacing root volumes of EC2 instances and provisioning EBS volumes using the EBS Container Storage Interface (CSI) driver.

After creation of the volume, EBS will keep track of the hydration progress and publish an Amazon EventBridge notification for EBS to your account when the hydration completes so that they can be certain when their volume is fully performant.

To learn more, visit Create an Amazon EBS volume and Initialize Amazon EBS volumes in the Amazon EBS User Guide.

Now available
Amazon EBS Provisioned Rate for Volume Initialization is now available and supported for all EBS volume types today. You will be charged based on the full snapshot size and the specified volume initialization rate. To learn more, visit Amazon EBS Pricing page.

To learn more about Amazon EBS including this feature, take the free digital course on the AWS Skill Builder portal. Course includes use cases, architecture diagrams and demos.

Give this feature a try in the Amazon EC2 console today and send feedback to AWS re:Post for Amazon EBS or through your usual AWS Support contacts.

— Channy


How is the News Blog doing? Take this 1 minute survey!

(This survey is hosted by an external company. AWS handles your information as described in the AWS Privacy Notice. AWS will own the data gathered via this survey and will not share the information collected with survey respondents.)

Time-based snapshot copy for Amazon EBS

Post Syndicated from Jeff Barr original https://aws.amazon.com/blogs/aws/time-based-snapshot-copy-for-amazon-ebs/

You can now specify a desired completion duration (15 minutes to 48 hours) when you copy an Amazon Elastic Block Store (Amazon EBS) snapshot within or between AWS Regions and/or accounts. This will help you to meet time-based compliance and business requirements for critical workloads. For example:

Testing – Distribute fresh data on a timely basis as part of your Test Data Management (TDM) plan.

Development – Provide your developers with updated snapshot data on a regular and frequent basis.

Disaster Recovery – Ensure that critical snapshots are copied in order to meet a Recovery Point Objective (RPO).

Regardless of your use case, this new feature gives you consistent and predictable copies. This does not affect the performance or reliability of standard copies—you can choose the option and timing that works best for each situation.

Creating a Time-Based Snapshot Copy
I can create time-based snapshot copies from the AWS Management Console, CLI (copy-snapshot), or API (CopySnapshot). While working on this post I created two EBS volumes (100 GiB and 1 TiB), filled each one with files, and created snapshots:

To create a time-based snapshot, I select the source as usual and choose Copy snapshot from the Action menu. I enter a description for the copy, choose the us-east-1 AWS Region as the destination, select Enable time-based copy, and (because this is a time-critical snapshot), enter a 15 minute Completion duration:

When I click Copy snapshot, the request will be accepted (and the copy will become Pending) only if my account’s throughput quotas are not already exceeded due to the throughput consumed by other active copies that I am making to the destination region. If the account level throughput quota is already exceeded, the console will display an error.

I can click Launch copy duration calculator to get a better idea of the minimum achievable copy duration for the snapshot. I open the calculator, enter my account’s throughput limit, and choose an evaluation period:

The calculator then uses historical data collected over the course of previous snapshot copies to tell me the minimum achievable completion duration. In this example I copied 1,800,000 MiB in the last 24 hours; with time-based copy and my current account throughput quota of 2000 MiB/second I can copy this much data in 15 minutes.

While the copy is in progress, I can monitor progress using the console or by calling DescribeSnapshots and examining the progress field of the result. I can also use the following Amazon EventBridge events to take actions (if the copy operation crosses regions, the event is sent in the destination region):

copySnapshot – Sent after the copy operation completes.

copyMissedCompletionDuration – Sent if the copy is still pending when the deadline has passed.

Things to Know
And that’s just about all there is to it! Here’s what you need to know about time-based snapshot copies:

CloudWatch Metrics – The SnapshotCopyBytesTransferred metric is emitted in the destination region, and reflect the amount of data transferred between the source and destination region in bytes.

Duration – The duration can range from 15 minutes to 48 hours in 15 minute increments, and is specified on a per-copy basis.

Concurrency – If a snapshot is being copied and I initiate a second copy of the same snapshot to the same destination, the duration for the second one starts when the first one is completed.

Throughput – There is a default per-account limit of 2000 MiB/second between each source and destination pair. If you need additional throughput in order to meet your RPO you can request an increase via the AWS Support Center. Maximum per-snapshot throughput is 500 MiB/second and cannot be increased.

Pricing – Refer to the Amazon EBS Pricing page for complete pricing information.

Regions – Time-based snapshot copies are available in all AWS Regions.

Jeff;

How AWS powered Prime Day 2024 for record-breaking sales

Post Syndicated from Channy Yun (윤석찬) original https://aws.amazon.com/blogs/aws/how-aws-powered-prime-day-2024-for-record-breaking-sales/

The last Amazon Prime Day 2024 (July 17-18) was Amazon’s biggest Prime Day shopping event ever, with record sales and more items sold during the two-day event than any previous Prime Day event. Prime members shopped for millions of deals and saved billions across more than 35 categories globally.

I live in South Korea, but luckily I was staying in Seattle to attend the AWS Heroes Summit during Prime Day 2024. I signed up for a Prime membership and used Rufus, my new AI-powered conversational shopping assistant, to search for items quickly and easily. Prime members in the U.S. like me chose to consolidate their deliveries on millions of orders during Prime Day, saving an estimated 10 million trips. This consolidation results in lower carbon emissions on average.

We know from Jeff’s annual blog post that AWS runs the Amazon website and mobile app that makes these short-term, large scale global events feasible. (check out his 2016, 2017, 2019, 2020, 2021, 2022, and 2023 posts for a look back). Today I want to share top numbers from AWS that made my amazing shopping experience possible.

Prime Day 2024 – all the numbers
Here are some of the most interesting and/or mind-blowing metrics:

Amazon EC2 – Since many of Amazon.com services such as Rufus and Search use AWS artificial intelligence (AI) chips under the hood, Amazon deployed a cluster of over 80,000 Inferentia and Trainium chips for Prime Day. During Prime Day 2024, Amazon used over 250K AWS Graviton chips to power more than 5,800 distinct Amazon.com services (double that of 2023).

Amazon EBS – In support of Prime Day, Amazon provisioned 264 PiB of Amazon EBS storage in 2024, a 62 percent increase compared to 2023. When compared to the day before Prime Day 2024, Amazon.com performance on Amazon EBS jumped by 5.6 trillion read/write I/O operations during the event, or an increase of 64 percent compared to Prime Day 2023. Also, when compared to the day before Prime Day 2024, Amazon.com transferred an incremental 444 petabytes of data during the event, or an increase of 81 percent compared to Prime Day 2023.

Amazon Aurora – On Prime Day, 6,311 database instances running the PostgreSQL-compatible and MySQL-compatible editions of Amazon Aurora processed more than 376 billion transactions, stored 2,978 terabytes of data, and transferred 913 terabytes of data.

Amazon DynamoDB – DynamoDB powers multiple high-traffic Amazon properties and systems including Alexa, the Amazon.com sites, and all Amazon fulfillment centers. Over the course of Prime Day, these sources made tens of trillions of calls to the DynamoDB API. DynamoDB maintained high availability while delivering single-digit millisecond responses and peaking at 146 million requests per second.

Amazon ElastiCache – ElastiCache served more than quadrillion requests on a single day with a peak of over 1 trillion requests per minute.

Amazon QuickSight – Over the course of Prime Day 2024, one Amazon QuickSight dashboard used by Prime Day teams saw 107K unique hits, 1300+ unique visitors, and delivered over 1.6M queries.

Amazon SageMaker – SageMaker processed more than 145B inference requests during Prime Day.

Amazon Simple Email Service (Amazon SES) – SES sent 30 percent more emails for Amazon.com during Prime Day 2024 vs 2023, delivering 99.23 percent of those emails to customers.

Amazon GuardDuty – During Prime Day 2024, Amazon GuardDuty monitored nearly 6 trillion log events per hour, a 31.9% increase from the previous year’s Prime Day.

AWS CloudTrail – CloudTrail processed over 976 billion events in support of Prime Day 2024.

Amazon CloudFront – CloudFront handled a peak load of over 500 million HTTP requests per minute, for a total of over 1.3 trillion HTTP requests during Prime Day 2024, a 30 percent increase in total requests compared to Prime Day 2023.

Prepare to Scale
As Jeff noted in every year, rigorous preparation is key to the success of Prime Day and our other large-scale events. For example, 733 AWS Fault Injection Service experiments were run to test resilience and ensure Amazon.com remains highly available on Prime Day.

If you are preparing for a similar business-critical events, product launches, and migrations, I strongly recommend that you take advantage of newly-branded AWS Countdown, a support program designed for your project lifecycle to assess operational readiness, identify and mitigate risks, and plan capacity, using proven playbooks developed by AWS experts. For example, with additional help from AWS Countdown, Legal Zoom successfully migrated 450 servers with minimal issues and continues to leverage AWS Countdown Premium to streamline and expedite the launch of SaaS applications.

We look forward to seeing what other records will be broken next year!

Channy & Jeff;

Using Amazon APerf to go from 50% below to 36% above performance target

Post Syndicated from Macey Neff original https://aws.amazon.com/blogs/compute/using-amazon-aperf-to-go-from-50-below-to-36-above-performance-target/

This post is written by Tyler Jones, Senior Solutions Architect – Graviton, AWS.

Performance tuning the Renaissance Finagle-http benchmark

Sometimes software doesn’t perform the way it’s expected to across different systems. This can be due to a configuration error, code bug, or differences in hardware performance. Amazon APerf is a powerful tool designed to help identify and address performance issues on AWS instances and other computers. APerf captures comprehensive system metrics simultaneously and then visualizes them in an interactive report. The report allows users to analyze metrics such as CPU usage, interrupts, memory usage, and CPU core performance counters (PMU) together. APerf is particularly useful for performance tuning workloads across different instance types, as it can generate side-by-side reports for easy comparison. APerf is valuable for developers, system administrators, and performance engineers who need to optimize application performance on AWS. From here on we use the Renaissance benchmark as an example to demonstrate how APerf is used to debug and find performance bottlenecks.

The example

The Renaissance finagle-http benchmark was unexpectedly found to run 50% slower on a c7g.16xl Graviton3 than on a reference instance, both initially using the Linux-5.15.60 kernel. This is unexpected behavior.Graviton3 should be performing as good or better than our reference instance as it does for other Java based workloads. It’s likely there is a configuration problem somewhere. The Renaissance finagle-http benchmark is written in Scala but produces Java byte code, so our investigation will focus on the Java JVM as well as system-level configurations.

Overview

System performance tuning is an iterative process that is conducted in two main phases, the first focuses on overall system issues, and the second focuses on CPU core bottlenecks. APerf is used to assist in both phases.

APerf can render several instances’ data in one report, side by side, typically a reference system and the system to be tuned. The reference system provides values to compare against. In isolation, metrics are harder to evaluate. A metric may be acceptable in general but the comparison to the reference system makes it easier to spot room for improvement.

APerf helps to identify unusual system behavior, such as high interrupt load, excessive I/O wait, unusual network layer patterns, and other such issues in the first phase. After adjustments are made to address these issues, for example by modifying JVM flags, the second phase starts. Using the system tuning of the first phase, fresh APerf data is collected and evaluated with a focus on CPU core performance metrics.

Any inferior metric of the SUT CPU core, as compared to the reference system, holds potential for improvement. In the following section we discuss the two phases in detail.
For more background on system tuning, refer to the Performance Runbook in the AWS Graviton Getting Started guide.

Initial data collection

Here is an example for how 240 seconds of system data is collected with APerf:

#enable PMU access
echo 0 | sudo tee /proc/sys/kernel/perf_event_paranoid
#APerf has to open more than the default limit of files.
ulimit -n 65536
#usually aperf would be run in another terminal. 
#For illustration purposes it is send to the background here
./aperf record --run-name finagle_1 --period 240 &
#With 64 CPUs it takes APerf a little less than 15s to report readiness 
#for data collection.
sleep 15
java -jar renaissance-gpl-0.14.2.jar -r 8 finagle-http

The APerf report is generated as follows:

./aperf report --run finagle_1

Then, the report can be viewed with a web browser:

firefox aperf_report_finagle_1/index.html

The APerf report can render several data sets in the same report, side-by-side.

./aperf report --run finagle_1_c7g --run finagle_1_reference --run ...

Note that it is crucial to examine the CPU usage over time shown in APerf. Some data may be gathered while the system is idle. The metrics during idle times have no significant value.

First phase: system level

In this phase we look for differences on the system level. To do this APerf collects data during runs of finagle-http on c7g.16xl and the reference. The reference system provides the target numbers to compare against. Any large difference warrants closer inspection.

The first differences can be seen in the following figure.

The APerf CPU usage plot shows larger drops on Graviton3 (highlighted in red) at the beginning of each run than on the reference instance.

Figure 1: CPU usage. c7g.16xl on the left, reference on the right.

Figure 1: CPU usage. c7g.16xl on the left, reference on the right.Figure 1: CPU usage. c7g.16xl on the left, reference on the right.

The log messages about the GC runtime hint at a possible reason as they coincide with the dips in CPU usage.

====== finagle-http (web) [default], iteration 0 started ======
GC before operation: completed in 32.692 ms, heap usage 87.588 MB → 31.411 MB.
====== finagle-http (web) [default], iteration 0 completed (6534.533 ms) ======

The JVM tends to spend a significant amount of time in garbage collection, during which time it has to suspend all threads, and choosing a different GC may have a positive impact.

The default GC on OpenJDK17 is G1GC. Using parallelGC is an alternative given that the instances have 64 CPUs, and thus GC can be performed highly parallel. The Graviton Getting Started guide also recommends checking the GC log when working on Java performance issues. A cross check using the JVM’s -Xlog:gc option confirms the reduced GC time with parallelGC.

The second difference is evident in the following figure, the CPU-to-CPU interrupts (IPI). There is more than 10x higher activity on Graviton 3, which means additional IRQ work c7g.16xl on which the reference system does not have to spend CPU cycles.
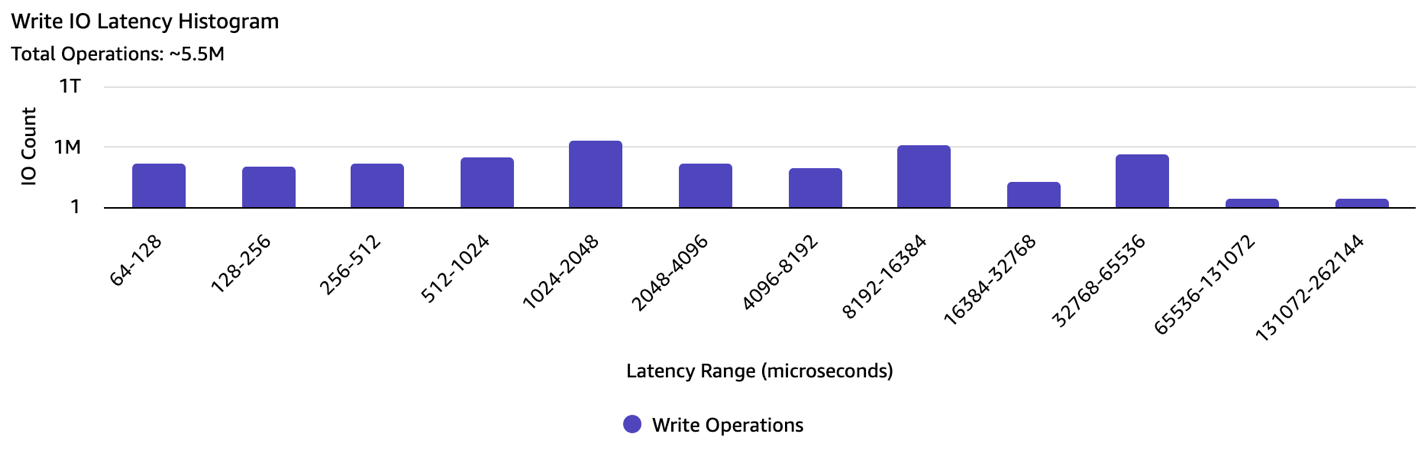
Figure 2: IPI0/RES Interrupts. c7g.16xl on the left, reference on the right.
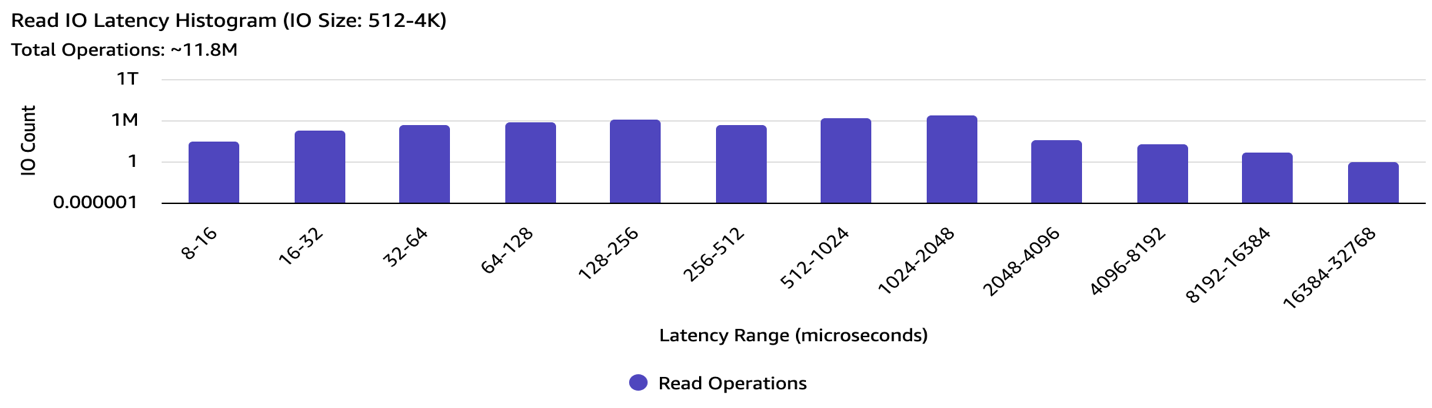
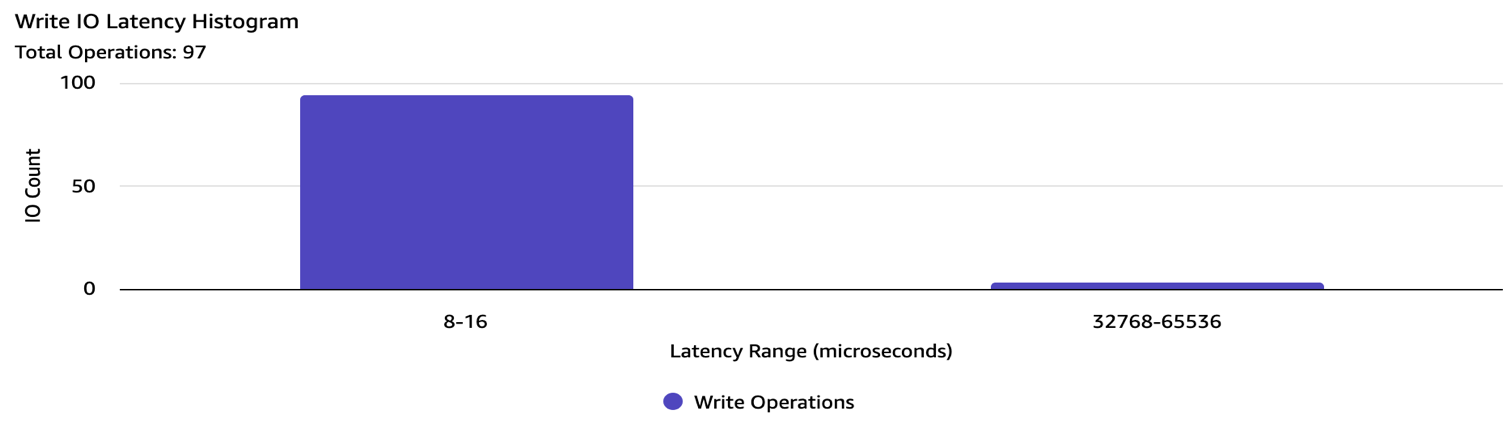
 Figure 2: IPI0/RES Interrupts. c7g.16xl on the left, reference on the right. Figure 2: IPI0/RES Interrupts. c7g.16xl on the left, reference on the right.

Grepping through kernel commit messages can help find patches that address a particular issue, such as IPI inefficiencies.
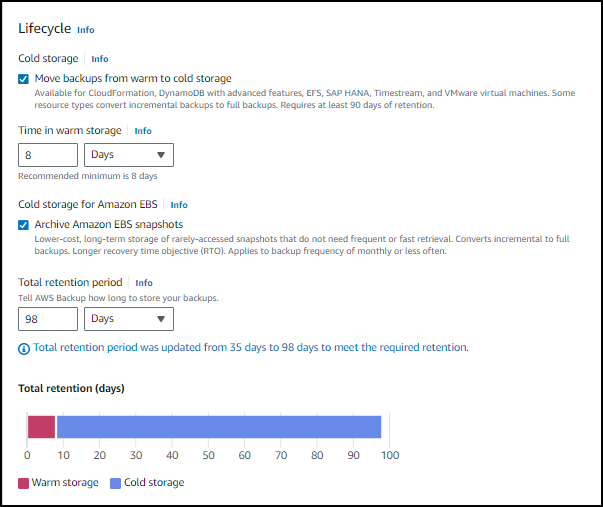
This scheduling patch improves performance by 19%. Another IPI patch provides an additional 1% improvement. Switching to Linux-5.15.61 allows us to use these IPI improvements. The following figure shows the effect in APerf.
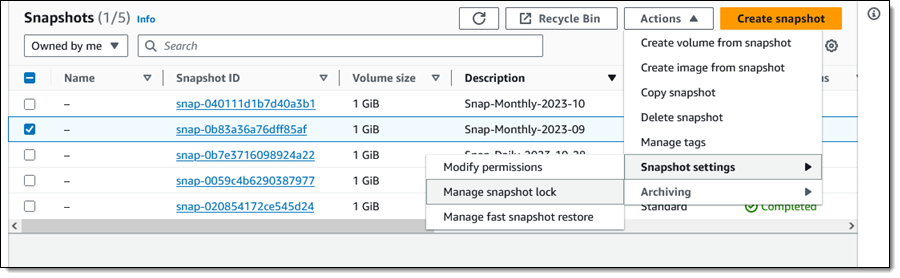
Figure 3: IPI0 Interrupts (c7g.16xl)

IPI0 Interrupts (c7g.16xl)

Second phase: CPU core level

Now that the system level issues are mitigated, the focus is on the CPU cores. The data collected by APerf shows PMU data where the reference instance and Graviton3 differ significantly.

PMU metric Graviton3 Reference system
Branch Prediction Misses/1000 Instructions 16 4
Instruction Translation Lookaside Buffer (TLB) Misses/1000 Instructions 8.3 4
Instructions Per Clock cycle 0.6 0.6*

*Note that reference has a 20% higher CPU clock than c7g.16xl. As a rule of thumb, instructions per clock (IPC) multiplied by clock rate equals work done by a CPU.

Addressing CPU Core bottlenecks

The first improvement in PMU metrics stems from the parallelGC option. Although the intention was to increase CPU usage, the following figure shows lowered branch miss counts as well. Limiting the JIT tiered compilation to only use C2 mode helps branch prediction by reducing branch indirection and increasing the locality of executed code. Finally adding Transparent Huge Pages helps branch prediction logic and avoids lengthy address translation look-ups in DDR memory. The following graphs show the effects of the chosen JVM options.

Branch misses/1000 instructions (c7g.16xl)

Figure 4: Branch misses per 1k instructions

Branch misses per 1k instructions

JVM Options from left to right:

  • -XX:+UseParallelGC
  • -XX:+UseParallelGC -XX:-TieredCompilation
  • -XX:+UseParallelGC -XX:-TieredCompilation -XX:+UseTransparentHugePages

With the options listed under the preceding figure, APerf shows the branch prediction miss rate decreasing from the initial 16 to 11. Branch mis-predictions incur significant performance penalties as they result in wasted cycles spent computing results that ultimately need to be discarded. Furthermore, these mis-predictions cause the prefetching and cache subsystems to fail to load the necessary subsequent instructions into cache. Consequently, costly pipeline stalls and frontend stalls occur, preventing the CPU from executing instructions.

Code sparsity

Figure 5: Code sparsity

Code sparsity

JVM Options from left to right:

  • -XX:+UseParallelGC
  • -XX:+UseParallelGC -XX:-TieredCompilation
  • -XX:+UseParallelGC -XX:-TieredCompilation -XX:+UseTransparentHugePages

Code sparsity is a measure of how compact the instruction code is packed and how closely related code is placed. This is where turning off tiered compilation shows its effect. Lower sparsity helps branch prediction and the cache subsystem.

Instruction TLB misses/1000 instructions (c7g.16xl)

Figure 6: Instruction TLB misses per 1k Instructions

Instruction TLB misses per 1k Instructions

JVM Options from left to right:

  • -XX:+UseParallelGC
  • -XX:+UseParallelGC -XX:-TieredCompilation
  • -XX:+UseParallelGC -XX:-TieredCompilation -XX:+UseTransparentHugePages

The big decrease in TLB misses is caused by the use of transparent huge pages, which increase the likelihood that a virtual address translation is present in the TLB, since fewer entries are needed. Translation table walks are avoided that otherwise need to traverse entries in DDR memory that cost hundreds of CPU cycles to read.

Instructions per clock cycle (IPC)

Figure 7: Instructions per clock cycle

Instructions per clock cycle

JVM Options from left to right:

  • -XX:+UseParallelGC
  • -XX:+UseParallelGC -XX:-TieredCompilation
  • -XX:+UseParallelGC -XX:-TieredCompilation -XX:+UseTransparentHugePages

The preceding figure shows IPC increasing from 0.58 to 0.71 as JVM flags are added.

Results

This table summarizes the measures taken for performance improvement and their results.

JVM option set baseline 1 2 3
IPC 0.6 0.6 0.63 0.71
Branch misses/1000 instructions 16 14 12 11
ITLB misses/1000 instructions 8.3 7.7 8.8 1.1
Benchmark runtime [ms] 6000 3922 3843 3512
execution time improvement vs baseline
  1. +parallelGC
  2. +parallelGC -tieredCompilation
  3. +parallelGC -tieredCompilation +UseTransparentHugePages

Re-examining the setup of our testing enviornment: Changing where the load-generator lives

With the preceding efforts, c7g.16xl is within 91% of the reference system. The c7g.16xl branch prediction miss rate is still higher at 11 than the references at 4. As shown in the preceding figure, reduced branch prediction misses have a strong positive effect on performance. What follows is an experiment to achieve parity or better with the reference system based on the reduction of branch prediction misses.

Finagle-http serves HTTP requests generated by wrk2, which is a load generator implemented in C. The expectation is that the c7g.16xl branch predictor works better with the native wrk2 binary, unlike the Renaissance load generator, which is executing on the JVM. The wrk2 load generator and the finagle-http are assigned through taskset to separate sets of CPUs: 16 CPUs for wrk2 and 48 CPUs for finagle-http. The idea here is to have the branch predictors on these CPU sets focus on a limited code set. The following diagram illustrates the difference between the Renaissance and the experimental setup.

With this CPU performance tuned setup, c7g.16xl can now handle a 36% higher request load than the reference using the same configuration, at an average latency limit of 1.5ms. This illustrates the impact that system tuning with APerf can have. The same system that scored 50% lower than the comparison system now exceeds it by 36%.
The following APerf data shows the improvement of key PMU metrics that lead to the performance jump.

Branch prediction misses/1000 instructions

Figure 8: Branch misses per 1k instructions

Left chart: Optimized Java-only setup. Right chart: Finagle-http with wrk2 load generator

The branch prediction miss rate is reduced to 1.5 from 11 with the Java-only setup.

IPC

Figure 9: Instructions Per Clock Cycle

Optimized Java-only setup. Right chart: Finagle-http with wrk2 load generator

Left chart: Optimized Java-only setup. Right chart: Finagle-http with wrk2 load generator

The IPC steps up from 0.7 to 1.5 due to the improvement in branch prediction.

Code sparsity

Figure 10: Code Sparsity

Left chart: Optimized Java-only setup. Right chart: Finagle-http with wrk2 load generator

Left chart: Optimized Java-only setup. Right chart: Finagle-http with wrk2 load generator

The code sparsity decreases to 0.014 from 0.21, a factor of 15.

Conclusion

AWS created the APerf tool to aid in root cause analysis and help address performance issues for any workload. APerf is a standalone binary that captures relevant data simultaneously as a time series, such as CPU usage, interrupt frequency, memory usage, and CPU core metrics (PMU counters). APerf can generate reports for multiple data captures, making it easy to spot differences between instance types. We were able to use this data to analyze why Graviton3 was underperforming and to also see the impact of our changes in terms of performance. Using APerf we were able to successfully adjust configuration parameters and go from 50% below our performance target to 36% more performant than our reference system and associated performance target. Without Aperf, collecting these metrics and visualizing them is a non-trival task. With Aperf you can capture and visualize these metrics with two short commands, saving you time and effort so you can focus on what matters most: getting the most performance from your application.

Amazon RDS now supports io2 Block Express volumes for mission-critical database workloads

Post Syndicated from Abhishek Gupta original https://aws.amazon.com/blogs/aws/amazon-rds-now-supports-io2-block-express-volumes-for-mission-critical-database-workloads/

Today, I am pleased to announce the availability of Provisioned IOPS (PIOPS) io2 Block Express storage volumes for all database engines in Amazon Relational Database Service (Amazon RDS). Amazon RDS provides you the flexibility to choose between different storage types depending on the performance requirements of your database workload. io2 Block Express volumes are designed for critical database workloads that require high performance and high throughput at low latency.

Lower latency and higher availability for I/O intensive workloads
With io2 Block Express volumes, your database workloads will benefit from consistent sub-millisecond latency, enhanced durability to 99.999 percent over io1 volumes, and drive 20x more IOPS from provisioned storage (up to 1,000 IOPS per GB) at the same price as io1. You can upgrade from io1 volumes to io2 Block Express volumes without any downtime, significantly improving the performance and reliability of your applications without increasing storage cost.

“We migrated all of our primary Amazon RDS instances to io2 Block Express within 2 weeks,” said Samir Goel, Director of Engineering at Figma, a leading platform for teams that design and build digital products. “Io2 Block Express has had a profound impact on the availability of the database layer at Figma. We have deeply appreciated the consistency of performance with io2 Block Express — in our observations, the latency variability has been under 0.1ms.”

io2 Block Express volumes support up to 64 TiB of storage, up to 256,000 Provisioned IOPS, and a maximum throughput of 4,000 MiB/s. The throughput of io2 Block Express volumes varies based on the amount of provisioned IOPS and volume storage size. Here is the range for each database engine and storage size:

Database engine Storage size Provisioned IOPS Maximum throughput
Db2, MariaDB, MySQL, and PostgreSQL Between 100 and 65,536 GiB 1,000–256,000 IOPS 4,000 MiB/s
Oracle Between 100 and 199 GiB 1,000–199,000 IOPS 4,000 MiB/s
Oracle Between 200 and 65,536 GiB 1,000–256,000 IOPS 4,000 MiB/s
SQL Server Between 20 and 16,384 GiB 1,000–64,000 IOPS 4,000 MiB/s

Getting started with io2 Block Express in Amazon RDS
You can use the Amazon RDS console to create a new RDS instance configured with an io2 Block Express volume or modify an existing instance with io1, gp2, or gp3 volumes.

Here’s how you would create an Amazon RDS for PostgreSQL instance with io2 Block Express volume.

Start with the basic information such as engine and version. Then, choose Provisioned IOPS SDD (io2) from the Storage type options:

Use the following AWS CLI command to create a new RDS instance with io2 Block Express volume:

aws rds create-db-instance --storage-type io2 --db-instance-identifier new-db-instance --db-instance-class db.t4g.large --engine mysql --master-username masteruser --master-user-password <enter password> --allocated-storage 400 --iops 3000

Similarly, to modify an existing RDS instance to use io2 Block Express volume:

aws rds modify-db-instance --db-instance-identifier existing-db-instance --storage-type io2 --allocated-storage 500 --iops 3000 --apply-immediately

Things to know

  • io2 Block Express volumes are available on all RDS databases using AWS Nitro System instances.
  • io2 Block Express volumes support an IOPS to allocated storage ratio of 1000:1. As an example, With an RDS for PostgreSQL instance, the maximum IOPS can be provisioned with volumes 256 GiB and larger (1,000 IOPS × 256 GiB = 256,000 IOPS).
  • For DB instances not based on the AWS Nitro System, the ratio of IOPS to allocated storage is 500:1. In this case, maximum IOPS can be achieved with 512 GiB volume (500 IOPS x 512 GiB = 256,000 IOPS).

Available now
Amazon RDS io2 Block Express storage volumes are supported for all RDS database engines and are available in US East (Ohio, N. Virginia), US West (N. California, Oregon), Asia Pacific (Hong Kong, Mumbai, Osaka, Seoul, Singapore, Sydney, Tokyo), Canada (Central), Europe (Frankfurt, Ireland, London, Stockholm), and Middle East (Bahrain) Regions.

In terms of pricing and billing, io1 volumes and io2 Block Express storage volumes are billed at the same rate. For more information, see the Amazon RDS pricing page.

Learn more by reading about Provisioned IOPS SSD storage in the Amazon RDS User Guide.

Abhishek

Amazon ECS supports a native integration with Amazon EBS volumes for data-intensive workloads

Post Syndicated from Channy Yun original https://aws.amazon.com/blogs/aws/amazon-ecs-supports-a-native-integration-with-amazon-ebs-volumes-for-data-intensive-workloads/

Today we are announcing that Amazon Elastic Container Service (Amazon ECS) supports an integration with Amazon Elastic Block Store (Amazon EBS), making it easier to run a wider range of data processing workloads. You can provision Amazon EBS storage for your ECS tasks running on AWS Fargate and Amazon Elastic Compute Cloud (Amazon EC2) without needing to manage storage or compute.

Many organizations choose to deploy their applications as containerized packages, and with the introduction of Amazon ECS integration with Amazon EBS, organizations can now run more types of workloads than before.

You can run data workloads requiring storage that supports high transaction volumes and throughput, such as extract, transform, and load (ETL) jobs for big data, which need to fetch existing data, perform processing, and store this processed data for downstream use. Because the storage lifecycle is fully managed by Amazon ECS, you don’t need to build any additional scaffolding to manage infrastructure updates, and as a result, your data processing workloads are now more resilient while simultaneously requiring less effort to manage.

Now you can choose from a variety of storage options for your containerized applications running on Amazon ECS:

  • Your Fargate tasks get 20 GiB of ephemeral storage by default. For applications that need additional storage space to download large container images or for scratch work, you can configure up to 200 GiB of ephemeral storage for your Fargate tasks.
  • For applications that span many tasks that need concurrent access to a shared dataset, you can configure Amazon ECS to mount the Amazon Elastic File System (Amazon EFS) file system to your ECS tasks running on both EC2 and Fargate. Common examples of such workloads include web applications such as content management systems, internal DevOps tools, and machine learning (ML) frameworks. Amazon EFS is designed to be available across a Region and can be simultaneously attached to many tasks.
  • For applications that need high-performance, low-cost storage that does not need to be shared across tasks, you can configure Amazon ECS to provision and attach Amazon EBS storage to your tasks running on both Amazon EC2 and Fargate. Amazon EBS is designed to provide block storage with low latency and high performance within an Availability Zone.

To learn more, see Using data volumes in Amazon ECS tasks and persistent storage best practices in the AWS documentation.

Getting started with EBS volume integration to your ECS tasks
You can configure the volume mount point for your container in the task definition and pass Amazon EBS storage requirements for your Amazon ECS task at runtime. For most use cases, you can get started by simply providing the size of the volume needed for the task. Optionally, you can configure all EBS volume attributes and the file system you want the volume formatted with.

1. Create a task definition
Go to the Amazon ECS console, navigate to Task definitions, and choose Create new task definition.

In the Storage section, choose Configure at deployment to set EBS volume as a new configuration type. You can provision and attach one volume per task for Linux file systems.

When you choose Configure at task definition creation, you can configure existing storage options such as bind mounts, Docker volumes, EFS volumes, Amazon FSx for Windows File Server volumes, or Fargate ephemeral storage.

Now you can select a container in the task definition, the source EBS volume, and provide a mount path where the volume will be mounted in the task.

You can also use $aws ecs register-task-definition --cli-input-json file://example.json command line to register a task definition to add an EBS volume. The following snippet is a sample, and task definitions are saved in JSON format.

{
    "family": "nginx"
    ...
    "containerDefinitions": [
        {
            ...
            "mountPoints": [
                "containerPath": "/foo",
                "sourceVoumne": "new-ebs-volume"
            ],
            "name": "nginx",
            "image": "nginx"
        }
    ],
    "volumes": [
       {
           "name": "/foo",
           "configuredAtRuntime": true
       }
    ]
}

2. Deploy and run your task with EBS volume
Now you can run a task by selecting your task in your ECS cluster. Go to your ECS cluster and choose Run new task. Note that you can select the compute options, the launch type, and your task definition.

Note: While this example goes through deploying a standalone task with an attached EBS volume, you can also configure a new or existing ECS service to use EBS volumes with the desired configuration.

You have a new Volume section where you can configure the additional storage. The volume name, type, and mount points are those that you defined in your task definition. Choose your EBS volume types, sizes (GiB), IOPs, and the desired throughput.

You cannot attach an existing EBS volume to an ECS task. But if you want to create a volume from an existing snapshot, you have the option to choose your snapshot ID. If you want to create a new volume, then you can leave this field empty. You can choose the file system type, either ext3 or ext4 file systems on Linux.

By default, when a task is terminated, Amazon ECS deletes the attached volume. If you need the data in the EBS volume to be retained after the task exits, check Delete on termination. Also, you need to create an AWS Identity and Access Management (IAM) role for volume management that contains the relevant permissions to allow Amazon ECS to make API calls on your behalf. For more information on this policy, see infrastructure role in the AWS documentation.

You can also configure encryption on your EBS volumes using either Amazon managed keys and customer managed keys. To learn more about the options, see our Amazon EBS encryption in the AWS documentation.

After configuring all task settings, choose Create to start your task.

3. Deploy and run your task with EBS volume
Once your task has started, you can see the volume information on the task definition details page. Choose a task and select the Volumes tab to find your created EBS volume details.

Your team can organize the development and operations of EBS volumes more efficiently. For example, application developers can configure the path where your application expects storage to be available in the task definition, and DevOps engineers can configure the actual EBS volume attributes at runtime when the application is deployed.

This allows DevOps engineers to deploy the same task definition to different environments with differing EBS volume configurations, for example, gp3 volumes in the development environments and io2 volumes in production.

Now available
Amazon ECS integration with Amazon EBS is available in nine AWS Regions: US East (Ohio), US East (N. Virginia), US West (Oregon), Asia Pacific (Singapore), Asia Pacific (Sydney), Asia Pacific (Tokyo), Europe (Frankfurt), Europe (Ireland), and Europe (Stockholm). You only pay for what you use, including EBS volumes and snapshots. To learn more, see the Amazon EBS pricing page and Amazon EBS volumes in ECS in the AWS documentation.

Give it a try now and send feedback to our public roadmap, AWS re:Post for Amazon ECS, or through your usual AWS Support contacts.

Channy

P.S. Special thanks to Maish Saidel-Keesing, a senior enterprise developer advocate at AWS for his contribution in writing this blog post.

AWS Weekly Roundup — AWS Lambda, AWS Amplify, Amazon OpenSearch Service, Amazon Rekognition, and more — December 18, 2023

Post Syndicated from Donnie Prakoso original https://aws.amazon.com/blogs/aws/aws-weekly-roundup-aws-lambda-aws-amplify-amazon-opensearch-service-amazon-rekognition-and-more-december-18-2023/

My memories of Amazon Web Services (AWS) re:Invent 2023 are still fresh even when I’m currently wrapping up my activities in Jakarta after participating in AWS Community Day Indonesia. It was a great experience, from delivering chalk talks and having thoughtful discussions with AWS service teams, to meeting with AWS Heroes, AWS Community Builders, and AWS User Group leaders. AWS re:Invent brings the global AWS community together to learn, connect, and be inspired by innovation. For me, that spirit of connection is what makes AWS re:Invent always special.

Here’s a quick look of my highlights at AWS re:Invent and AWS Community Day Indonesia:

If you missed AWS re:Invent, you can watch the keynotes and sessions on demand. Also, check out the AWS News Editorial Team’s Top announcements of AWS re:Invent 2023 for all the major launches.

Recent AWS launches
Here are some of the launches that caught my attention in the past two weeks:

Query MySQL and PostgreSQL with AWS Amplify – In this post, Channy wrote how you can now connect your MySQL and PostgreSQL databases to AWS Amplify with just a few clicks. It generates a GraphQL API to query your database tables using AWS CDK.

Migration Assistant for Amazon OpenSearch Service – With this self-service solution, you can smoothly migrate from your self-managed clusters to Amazon OpenSearch Service managed clusters or serverless collections.

AWS Lambda simplifies connectivity to Amazon RDS and RDS Proxy – Now you can connect your AWS Lambda to Amazon RDS or RDS proxy using the AWS Lambda console. With a guided workflow, this improvement helps to minimize complexities and efforts to quickly launch a database instance and correctly connect a Lambda function.

New no-code dashboard application to visualize IoT data – With this announcement, you can now visualize and interact with operational data from AWS IoT SiteWise using a new open source Internet of Things (IoT) dashboard.

Amazon Rekognition improves Face Liveness accuracy and user experience – This launch provides higher accuracy in detecting spoofed faces for your face-based authentication applications.

AWS Lambda supports additional concurrency metrics for improved quota monitoring – Add CloudWatch metrics for your Lambda quotas, to improve visibility into concurrency limits.

AWS Malaysia now supports 3D-Secure authentication – This launch enables 3DS2 transaction authentication required by banks and payment networks, facilitating your secure online payments.

Announcing AWS CloudFormation template generation for Amazon EventBridge Pipes – With this announcement, you can now streamline the deployment of your EventBridge resources with CloudFormation templates, accelerating event-driven architecture (EDA) development.

Enhanced data protection for CloudWatch Logs – With the enhanced data protection, CloudWatch Logs helps identify and redact sensitive data in your logs, preventing accidental exposure of personal data.

Send SMS via Amazon SNS in Asia Pacific – With this announcement, now you can use SMS messaging across Asia Pacific from the Jakarta Region.

Lambda adds support for Python 3.12 – This launch brings the latest Python version to your Lambda functions.

CloudWatch Synthetics upgrades Node.js runtime – Now you can use Node.js 16.1 runtimes for your canary functions.

Manage EBS Volumes for your EC2 fleets – This launch simplifies attaching and managing EBS volumes across your EC2 fleets.

See you next year!
This is the last AWS Weekly Roundup for this year, and we’d like to thank you for being our wonderful readers. We’ll be back to share more launches for you on January 8, 2024.

Happy holidays!

Donnie

Amazon EBS Snapshots Archive is now available with AWS Backup

Post Syndicated from Veliswa Boya original https://aws.amazon.com/blogs/aws/amazon-ebs-snapshots-archive-is-now-available-with-aws-backup/

Today we announce the availability of Amazon Elastic Block Store (Amazon EBS) Snapshots Archive with AWS Backup. Previously available only in the Amazon EC2 console or Amazon Data Lifecycle Manager, this feature gives you the ability to transition your infrequently accessed Amazon EBS Snapshots to low-cost archive, long-term storage of your rarely-accessed snapshots that do not need frequent or fast retrieval.

Amazon EBS Snapshots Archive in the AWS Backup console
Snapshots Archive with AWS Backup is only available for snapshots with a backup frequency of one month or longer (28-day cron expression) and a retention of more than 90 days. This is a protective measure to ensure that you don’t archive snapshots, such as hourly snapshots that wouldn’t benefit from the transition to the cold tier.

Backup frequency

The ability to archive Amazon EBS Snapshots is a new parameter of the Lifecycle section of the AWS Backup Plans. You must explicitly opt into moving your Amazon EBS Snapshots to cold storage, because this has different properties of our existing cold storage including:

  1. Always converting an incremental backup to a full backup.
  2. Longer recovery time objective (RTO) (up to 72 hours).
  3. Limitations on the frequency of backups that can be transitioned to cold storage (monthly or greater).

Time in warm storage indicates how long the backups will remain in warm storage before they are transitioned to cold storage. Total retention period is the total time the backups will be retained by AWS Backup, and its value is the sum of both warm and cold storage. For backups in cold storage, the minimum retention period is 90 days. This is why the default total retention is 98 days (8 days in warm + 90 days in cold). The bar graph shows the total retention of your backups and where the backups will reside during that time. In the example shown in this graph, 8 days is in warm storage (red bar), and 90 days is in cold storage (blue bar).

Cold storage for Amazon EBS Snapshots

To restore or use the archived Amazon EBS snapshot today (outside of AWS Backup), you have to follow a two-step process:

  1. Temporarily or permanently restore the snapshot from archive to standard tier.
  2. Once it’s in standard tier, call the CreateVolume API from the standard tier.

With this announcement, using either the AWS Backup console or the API to restore the archived Amazon EBS snapshot in AWS Backup, the following restore workflow applies:

  1. Enter the number of days you want to temporarily restore your snapshot from cold to standard tier.
  2. Choose your volume configuration.

Restore archived EBS snapshot

The end result will be a restored EBS volume. You will not have to manually move the snapshot from cold to standard tier, then restore the volume, this will be done automatically for you.

Now available
Amazon EBS Snapshots Archive with AWS Backup is available for you today in all AWS Regions except China and AWS GovCloud (US).

As usual, you pay as you go, with no minimum or fixed fees. There are two metrics that influence Amazon EBS Snapshots Archive billing: data storage and data retrieval. You are charged for a 90-day period at minimum. This means that if you delete a snapshot archive or permanently restore it less than 90 days after creation, then we charge for the full 90-day period. The AWS Backup pricing page has the details.

Veliswa

New – Amazon EBS Snapshot Lock

Post Syndicated from Jeff Barr original https://aws.amazon.com/blogs/aws/new-amazon-ebs-snapshot-lock/

You can now lock individual Amazon Elastic Block Store (Amazon EBS) snapshots in order to enforce better compliance with your data retention policies. Locked snapshots cannot be deleted until the lock is expired or released, giving you the power to keep critical backups safe from accidental or malicious deletion, including ransomware attacks.

The Need for Locking
AWS customers use EBS snapshots for backups, disaster recovery, data migration, and compliance. Customers in financial services and health care often need to meet specific compliance requirements, with prescribed time frames for retention, and also need to ensure that the snapshots are truly Write Once Read Many (WORM). In order to meet these requirements, customers have implemented solutions that use multiple AWS accounts with one-way “air gaps” between them.

EBS Snapshot Lock
The new EBS Snapshot Lock feature helps you to meet your retention and compliance requirements without the need for custom solutions. You can lock new and existing EBS snapshots using a lock duration that can range from one day to about 100 years. The snapshot is locked for the specified duration and cannot be deleted.

There are two lock modes:

Governance – This mode protects snapshots from deletions by all users. However, with the proper IAM permissions, the lock duration can be extended or shortened, the lock can be deleted, and the mode can be changed from Governance mode to Compliance mode.

Compliance – This mode protects snapshots from actions by the root user and all IAM users. After a cooling-off period of up to 72 hours, neither the snapshot nor the lock can be deleted until the lock duration expires, and the mode cannot be changed. With the proper IAM permissions the lock duration can be extended, but it cannot be shortened.

Snapshots in either mode can still be shared or copied. They can be archived to the low-cost Amazon EBS Snapshots Archive tier, and locks can be applied to snapshots that have already been archived.

Using Snapshot Lock
From the EBS Console I select a snapshot (Snap-Monthly-2023-09) and choose Manage snapshot lock from Snapshot Settings in the Actions menu:

This is a monthly snapshot and I want to lock it for one year. I choose Governance mode and select the duration, then click Save lock settings:

I try to delete it, and the deletion fails, as it should:

Now I would like to lock one of my annual snapshots for 5 years, using Compliance mode this time:

I set my cooling-off period to 24 hours, just in case I change my mind. Perhaps I have to run some kind of audit or final date validation on the snapshot before committing to keeping it around for five years.

Programmatically, I can use new API functions to establish and control locks on my EBS snapshots:

LockSnapshot – Lock a snapshot in governance or compliance mode, or modify the settings of a snapshot that is already locked.

UnlockSnapshot – Unlock a snapshot that is is governance mode, or is in compliance mode but within the cooling-off period.

DescribeLockedSnapshots – Get information about the lock status of my snapshots, with optional filtering based on the state of the lock.

IAM users must have the appropriate permissions (ec2:lockSnapshot, ec2:UnlockSnapshot, and ec2:DescribeLockedSnapshots) in order to use these functions.

Things to Know
Here are a couple of things to keep in mind about this new feature:

AWS BackupAWS Backup independently manages retention for the snapshots that it creates. We do not recommend locking them.

Pricing – There is no extra charge for the use of this feature. You pay the usual rates for storage of snapshots and archived snapshots.

Regions – EBS Snapshot Locking is available in all commercial AWS Regions.

KMS Key Retention – If you are using customer-managed AWS Key Management Service (AWS KMS) keys to encrypt your EBS volumes and snapshots, you need to make sure that the key will remain valid for the lifetime of the snapshot.

Jeff;

AWS Weekly Roundup – CloudFront security dashboard, EBS snapshots improvements, and more – November 13, 2023

Post Syndicated from Danilo Poccia original https://aws.amazon.com/blogs/aws/aws-weekly-roundup-cloudfront-security-dashboard-ebs-snapshots-improvements-and-more-november-13-2023/

This week, it was really difficult to choose what to recap here because, as we’re getting closer to AWS re:Invent, service teams are delivering new capabilities at an incredible pace.

Last week’s launches
Here are some of the launches that caught my attention last week:

Amazon Aurora – Aurora MySQL zero-ETL integration with Amazon Redshift is now generally available. Get a walk-through in our AWS News Blog post. Here’s a recap of data integration innovations at AWS. Optimized reads for Aurora PostgreSQL provide up to 8x improved query latency and up to 30 percent cost savings for I/O-intensive applications. Here’s more of a deep dive from the AWS Database Blog.

Amazon EBS – You can now block public sharing of EBS snapshots. Read more about how that works in the launch post.

Amazon Data Lifecycle Manager – Support for pre- and post-script automation of EBS snapshots simplifies application-consistent snapshots. Here’s how to use it with Windows applications.

AWS Health – There’s now improved visibility into planned lifecycle events like end of standard support of a Kubernetes version in Amazon EKS, Amazon RDS certificate rotations, and end of support for other open source software. Here’s how it works.

Amazon CloudFront – Unified security dashboard to enable, monitor, and manage common security protections for your web applications directly from the CloudFront console. Read more at Introducing CloudFront Security Dashboard, a Unified CDN and Security Experience.

Amazon Connect – Reduced outbound telephony pricing across Europe and South America. It’s also easier now to deliver persistent chat experiences for end users.

AWS Lambda – Busy week for the Lambda team! There is now support for Amazon Linux 2023 as both a managed runtime and a container base image. More details in this Compute Blog post. There’s also enhanced auto scaling for Kafka event sources (the Compute Blog has a post with more details) and faster polling scale-up rate for Amazon SQS events when AWS Lambda functions are configured with SQS.

AWS CodeBuild – Now supports AWS Lambda compute to build and test software packages. Read about how it works in this post.

Amazon SQS – Now supports JSON protocol to reduce latency and client-side CPU usage. More in the launch post. There’s also a new integration for Amazon SQS in the Amazon EventBridge Pipes console (the week before that, Amazon Kinesis Data Streams was also integrated into the EventBridge Pipes console).

Amazon SNS –  FIFO topics now support 3,000 messages per second by default.

Amazon EventBridge – There are 22 additional Amazon CloudWatch metrics to help you monitor the performance of your event buses. More info in this post from the AWS Compute Blog.

Amazon OpenSearch ServiceNeural search makes it easier to create and manage semantic search applications.

Amazon Timestream – The UNLOAD statement simplifies exporting time-series data for additional insights.

Amazon Comprehend – New trust and safety features with toxicity detection and prompt safety classification. Read how to apply that to generative AI applications using LangChain.

AWS App Runner – Now available in London, Mumbai, and Paris AWS Regions.

AWS Application Migration Service – Support for AWS App2Container replatforming  of .NET and Java based applications.

Amazon FSx for OpenZFS – Now available in ten additional AWS Regions with support for additional deployment types in seven Regions.

AWS Global Accelerator – There’s now IPv6 support for Network Load Balancer (NLB) endpoints. It was already available for Application Load Balancers (ALBs) and Amazon Elastic Compute Cloud (Amazon EC2) instances.

Amazon GuardDuty – New machine learning (ML) capability enhances threat detection for Amazon EKS.

Other AWS news
Some other news and blog posts that you might have missed:

AWS Local Zones Credit Program – If you have low-latency or data residency requirements for your application, our Local Zones Credit Program can get you started. Fill out our form to receive $500 in AWS credits and apply it to a Local Zones workload.

Amazon CodeWhispererCustomizing coding companions for organizations and optimizing for sustainability.

Sharing what we have learned – Creating a correction of errors document to understand what went wrong and what would be done to prevent it from happening again.

Good tips for containers – Securing API endpoints using Amazon API Gateway and Amazon VPC Lattice.

Another post in this amazing series – Let’s Architect! Tools for developers.

A few highlights from Community.AWS:

Don’t miss the latest AWS open source newsletter by my colleague Ricardo.

Upcoming AWS events
Check your calendars and sign up for these AWS events:

AWS Community Days – Join a community-led conference run by AWS user group leaders in your region: Uruguay (November 14), Central Asia (Kazakhstan, Uzbekistan, Kyrgyzstan, and Mongolia on November 17–18), and Guatemala (November 18).

AWS re:Invent (November 27 – December 1) – Join us to hear the latest from AWS, learn from experts, and connect with the global cloud community. Browse the session catalog and attendee guides and check out the highlights for generative AI. In the AWS re:Invent Builder Hub you can find developer-focused sessions, events, competitions, and content.

Here you can browse all upcoming AWS-led in-person and virtual events and developer-focused events.

And that’s all from me for this week. We’re now taking a break. The next weekly roundup will be after re:Invent!

Danilo

This post is part of our Weekly Roundup series. Check back for a quick roundup of interesting news and announcements from AWS!

New – Block Public Sharing of Amazon EBS Snapshots

Post Syndicated from Jeff Barr original https://aws.amazon.com/blogs/aws/new-block-public-sharing-of-amazon-ebs-snapshots/

You now have the ability to disable public sharing of new, and optionally existing, Amazon Elastic Block Store (Amazon EBS) snapshots on a per-region, per-account basis. This provides you with another level of protection against accidental or inadvertent data leakage.

EBS Snapshot Review
You have had the power to create EBS snapshots since the launch of EBS in 2008, and have been able to share them privately or publicly since 2009. The vast majority of snapshots are kept private and are used for periodic backups, data migration, and disaster recovery. Software vendors use public snapshots to share trial-use software and test data.

Block Public Sharing
EBS snapshots have always been private by default, with the option to make individual snaps public as needed. If you do not currently use and do not plan to use public snapshots, you can now disable public sharing using the AWS Management Console, AWS Command Line Interface (AWS CLI), or the new EnableSnapshotBlockPublicAccess function. Using the Console, I visit the EC2 Dashboard and click Data protection and security in the Account attributes box:

Then I scroll down to the new Block public access for EBS snapshots section, review the current status, and click Manage:

I click Block public access, choose Block all public sharing, and click Update:

This is a per-region setting, and it takes effect within minutes. I can see the updated status in the console:

I inspect one of my snapshots in the region, and see that I cannot share it publicly:

As you can see, I still have the ability to share the snapshot with specific AWS accounts.

If I have chosen Block all public sharing, any snapshots that I have previously shared will no longer be listed when another AWS customer calls DescribeSnapshots in pursuit of publicly accessible snapshots.

Things to Know
Here are a couple of really important things to know about this new feature:

Region-Level – This is a regional setting, and must be applied in each region where you want to block the ability to share snapshots publicly.

API Functions & IAM Permissions – In addition to EnableSnapshotBlockPublicAccess, other functions for managing this feature include DisableSnapshotBlockPublicAccess and GetSnapshotBlockPublicAccessState. To use these functions (or their console/CLI equivalents) you must have the ec2:EnableSnapshotBlockPublicAccess, ec2:DisableSnapshotBlockPublicAccess, and ec2:GetSnapshotBlockPublicAccessState IAM permissions.

AMIs – This does not affect the ability to share Amazon Machine Images (AMIs) publicly. To learn how to manage public sharing of AMIs, visit Block public access to your AMIs.

Jeff;