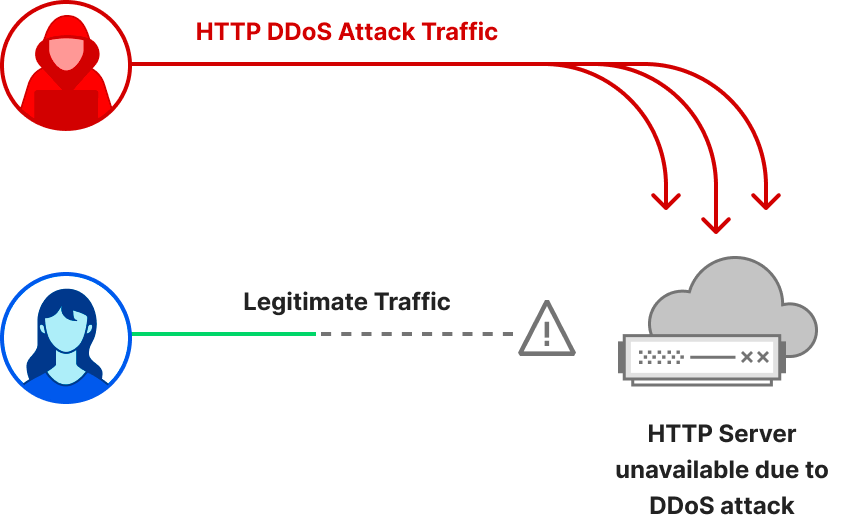
Welcome to the first DDoS threat report of 2023. DDoS attacks, or distributed denial-of-service attacks, are a type of cyber attack that aim to overwhelm Internet services such as websites with more traffic than they can handle, in order to disrupt them and make them unavailable to legitimate users. In this report, we cover the latest insights and trends about the DDoS attack landscape as we observed across our global network.
Kicking off 2023 with a bang
Threat actors kicked off 2023 with a bang. The start of the year was characterized by a series of hacktivist campaigns against Western targets including banking, airports, healthcare and universities — mainly by the pro-Russian Telegram-organized groups Killnet and more recently by AnonymousSudan.
While Killnet-led and AnonymousSudan-led cyberattacks stole the spotlight, we haven’t witnessed any novel or exceedingly large attacks by them.
Hyper-volumetric attacks
We did see, however, an increase of hyper-volumetric DDoS attacks launched by other threat actors — with the largest one peaking above 71 million requests per second (rps) — exceeding Google’s previous world record of 46M rps by 55%.
Back to Killnet and AnonymousSudan, while no noteworthy attacks were reported, we shouldn’t underestimate the potential risks. Unprotected Internet properties can still be, and have been, taken down by Killnet-led or AnonymousSudan-led cyber campaigns. Organizations should take proactive defensive measures to reduce the risks.
Business as usual for South American Telco targeted by terabit-strong attacks thanks to Cloudflare
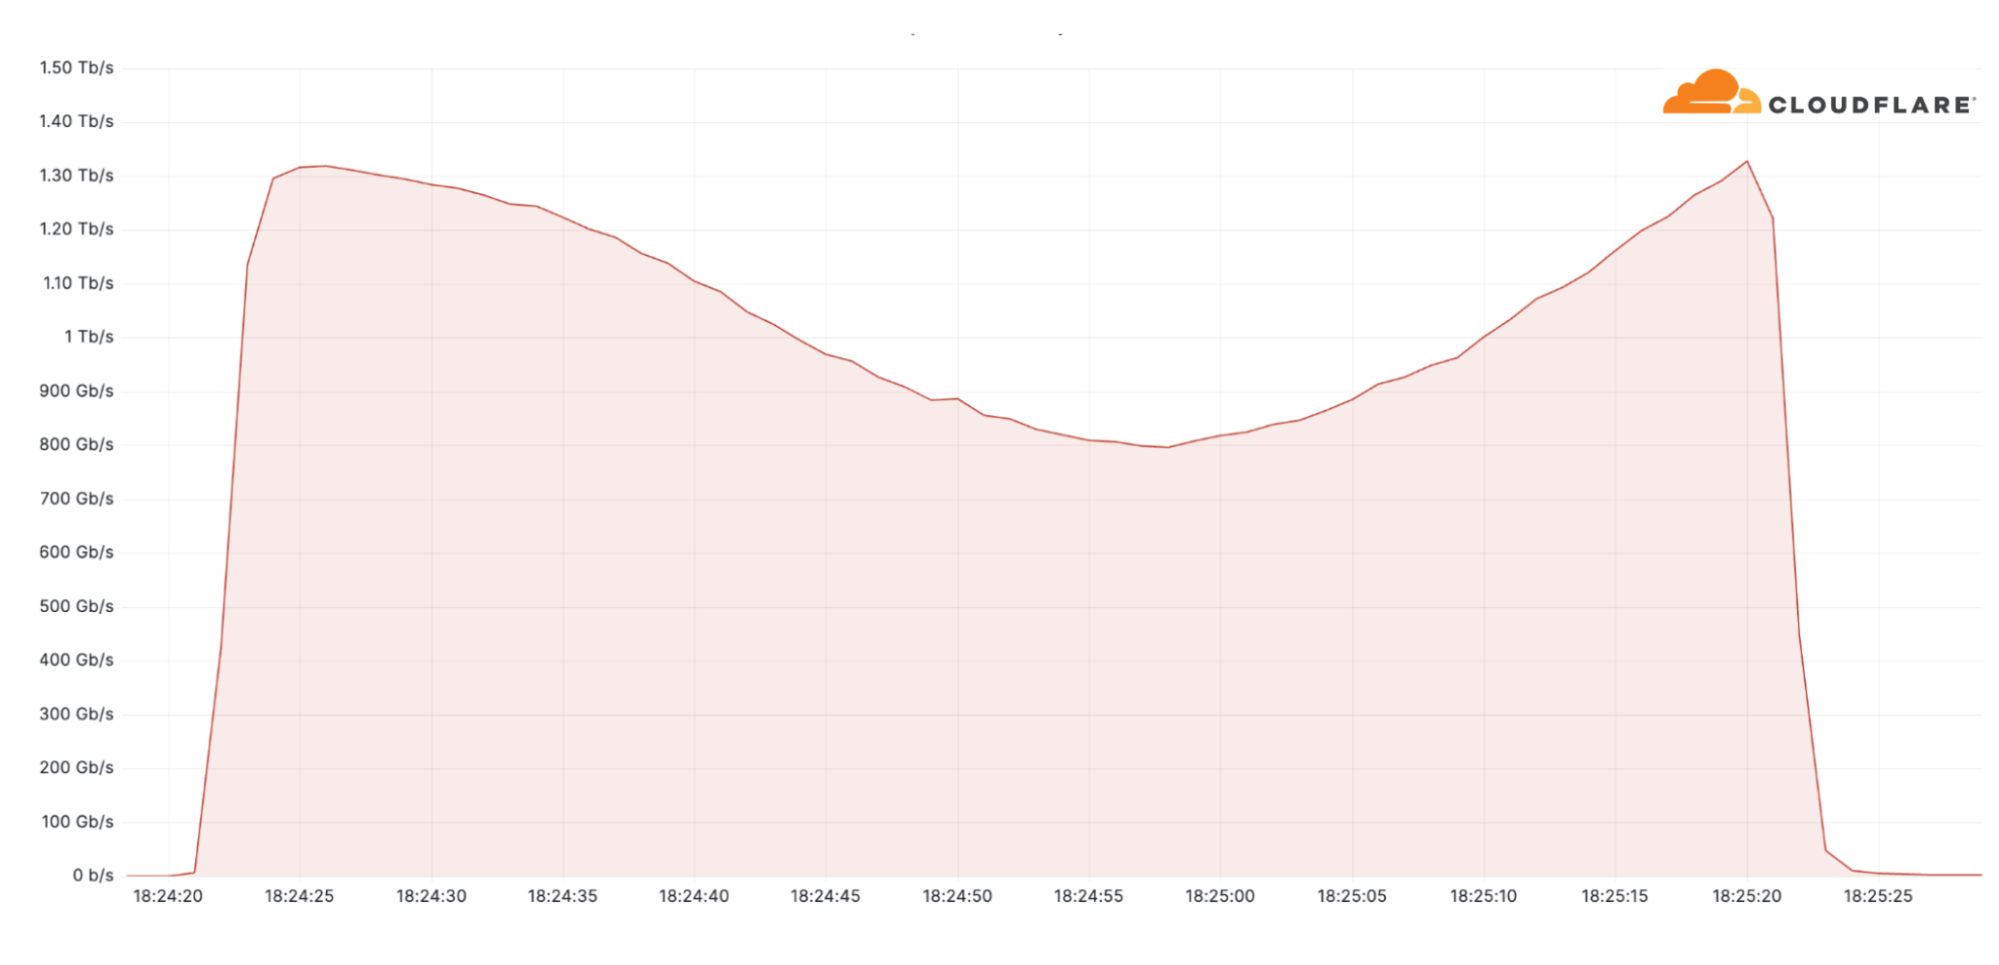
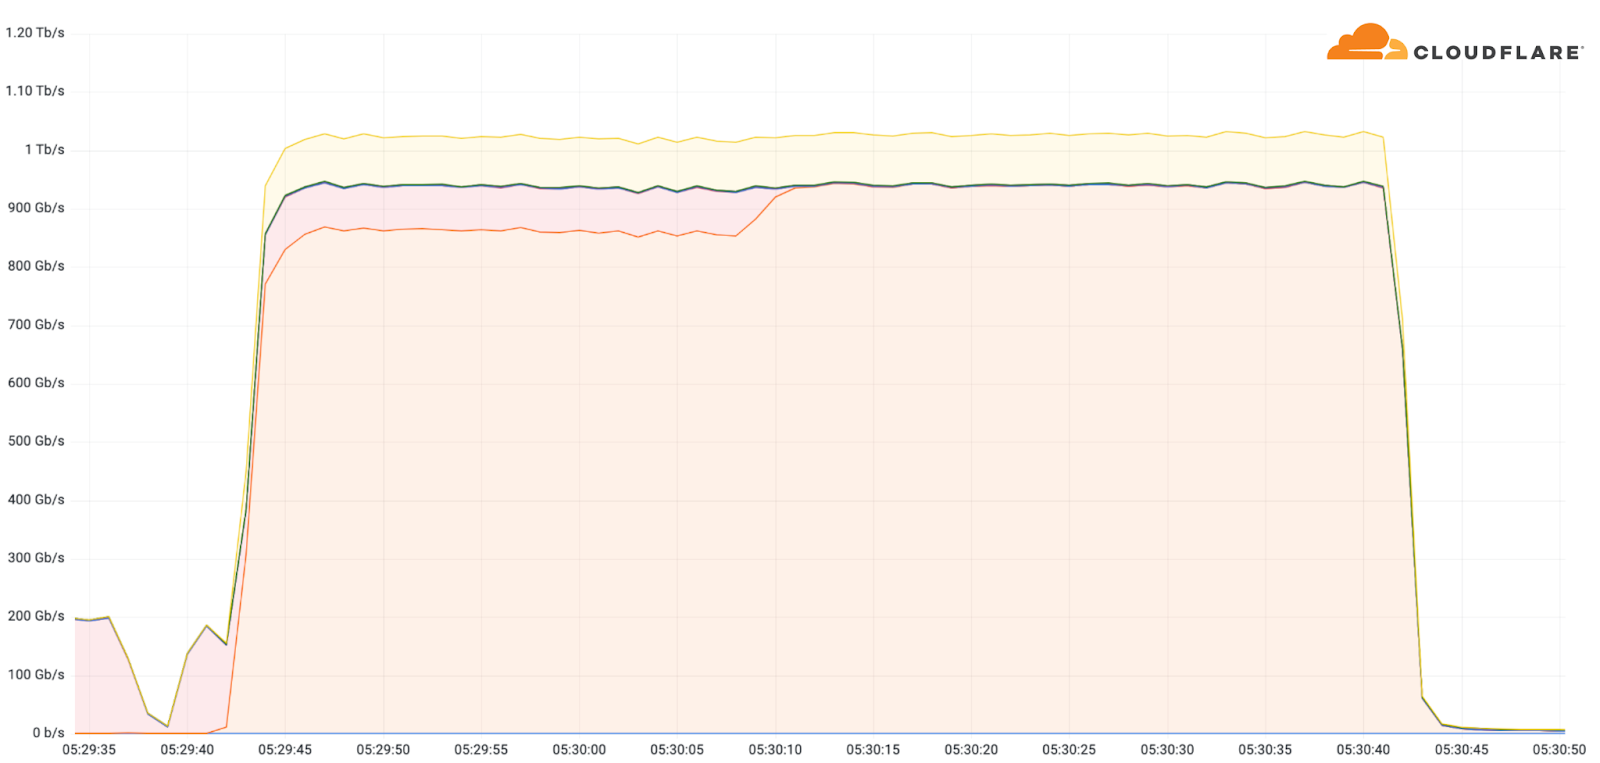
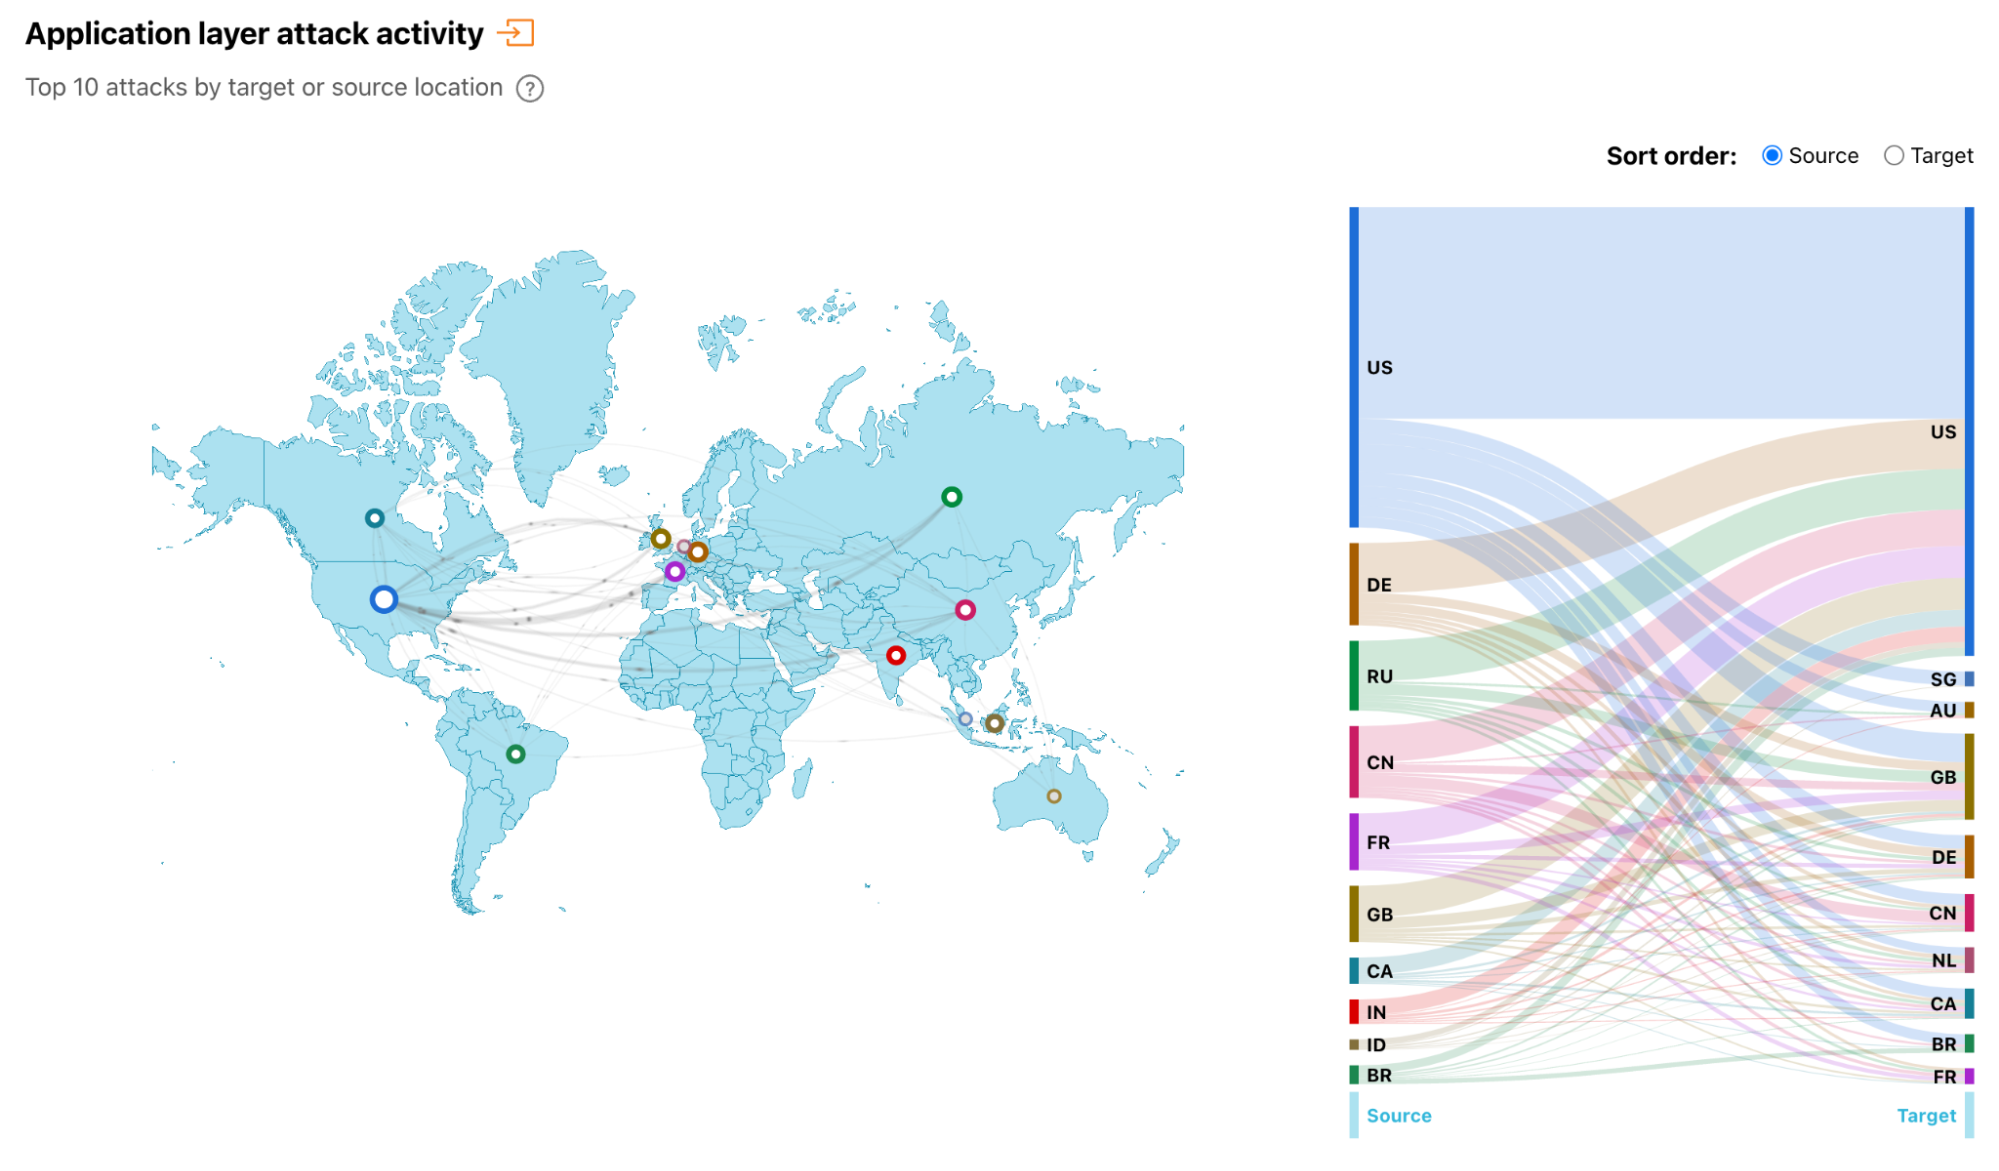
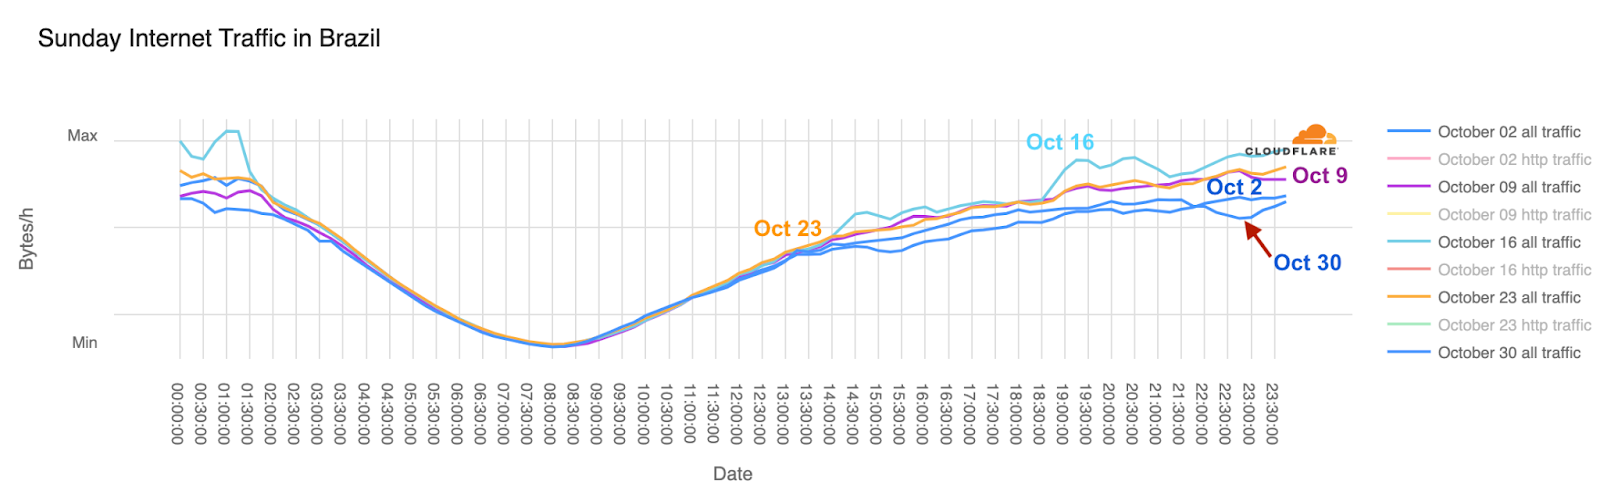
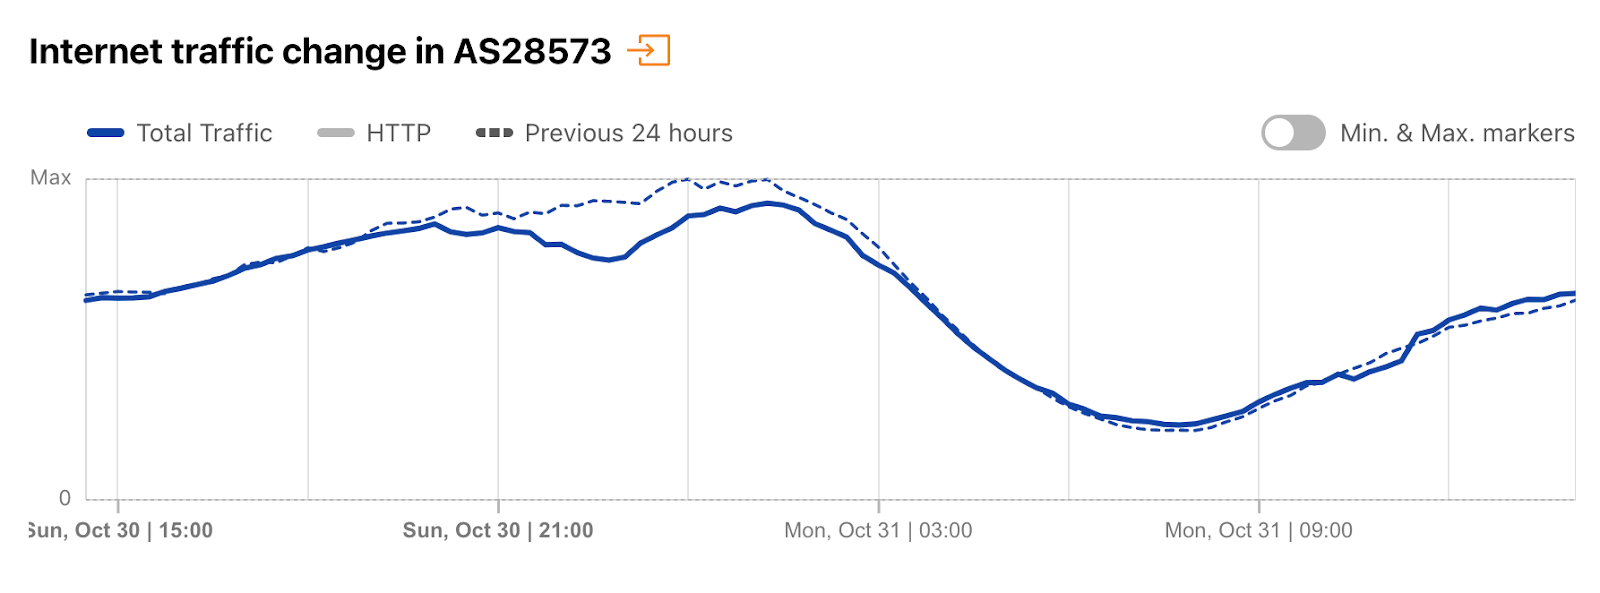
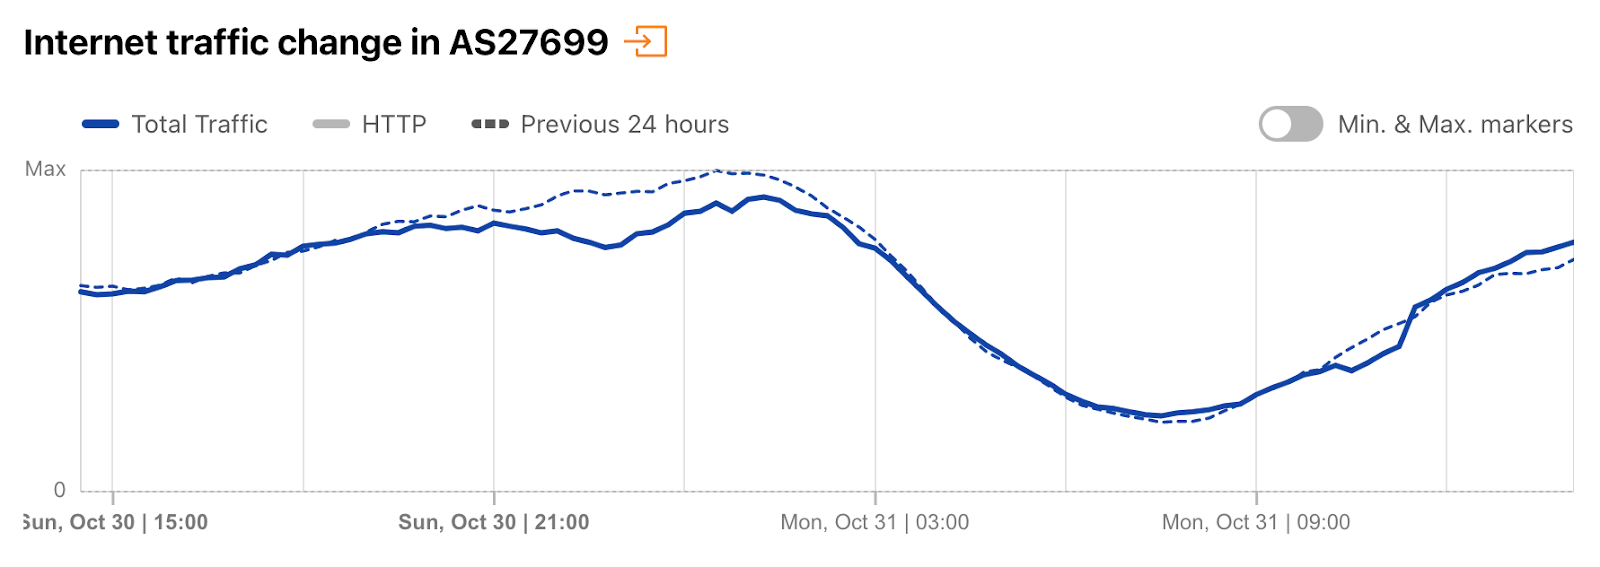
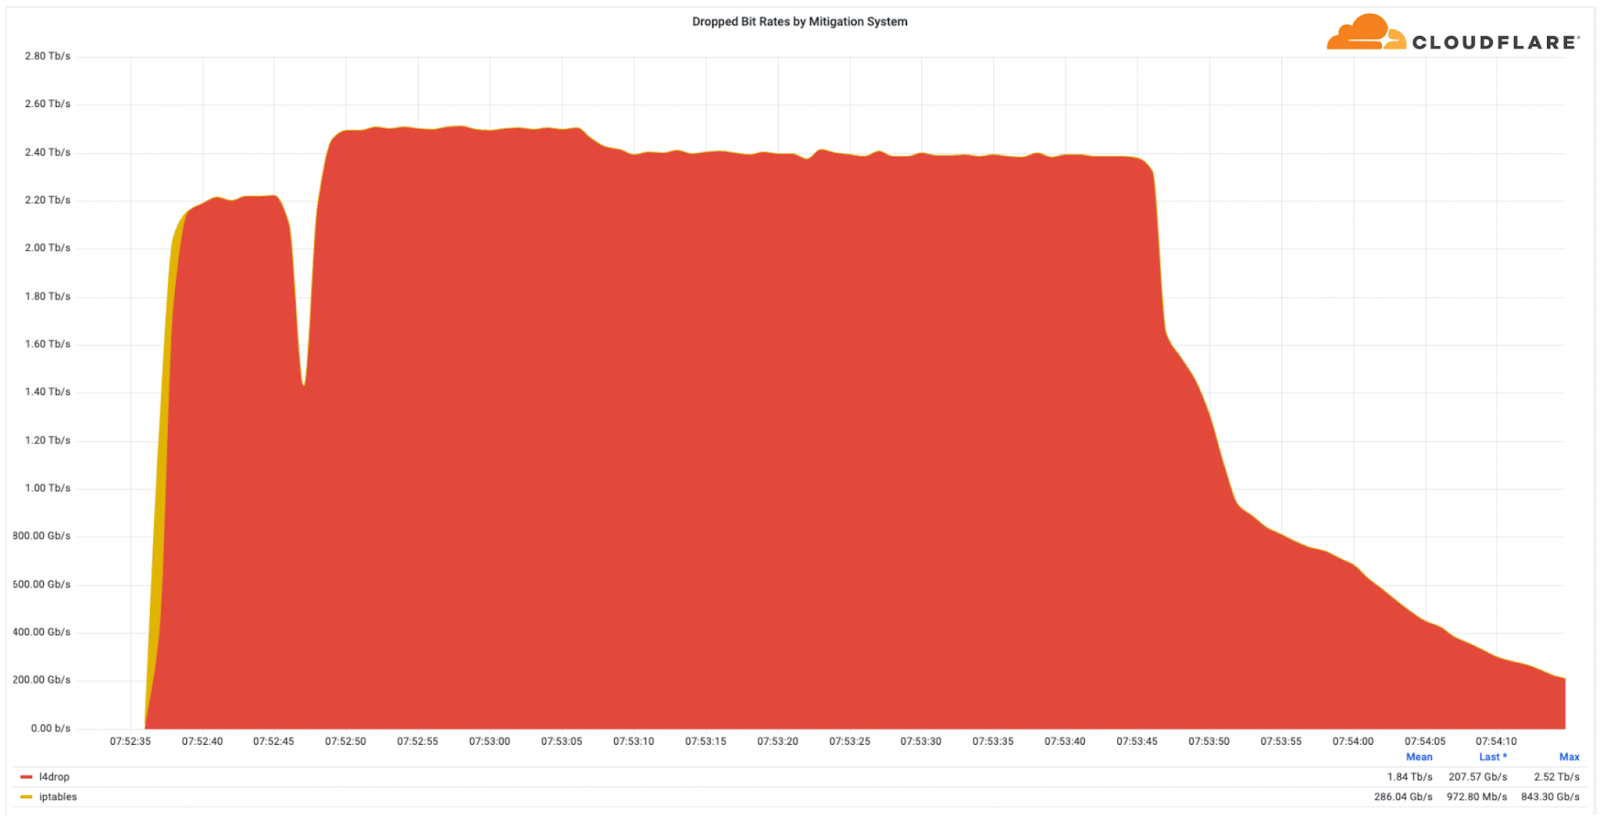
Another large attack we saw in Q1 was a 1.3 Tbps (terabits per second) DDoS attack that targeted a South American Telecommunications provider. The attack lasted only a minute. It was a multi-vector attack involving DNS and UDP attack traffic. The attack was part of a broader campaign which included multiple Terbit-strong attacks originating from a 20,000-strong Mirai-variant botnet. Most of the attack traffic originated from the US, Brazil, Japan, Hong Kong, and India. Cloudflare systems automatically detected and mitigated it without any impact to the customer’s networks.
Cloudflare auto-mitigates a 1.3 Tbps Mirai DDoS attack
High-performance botnets
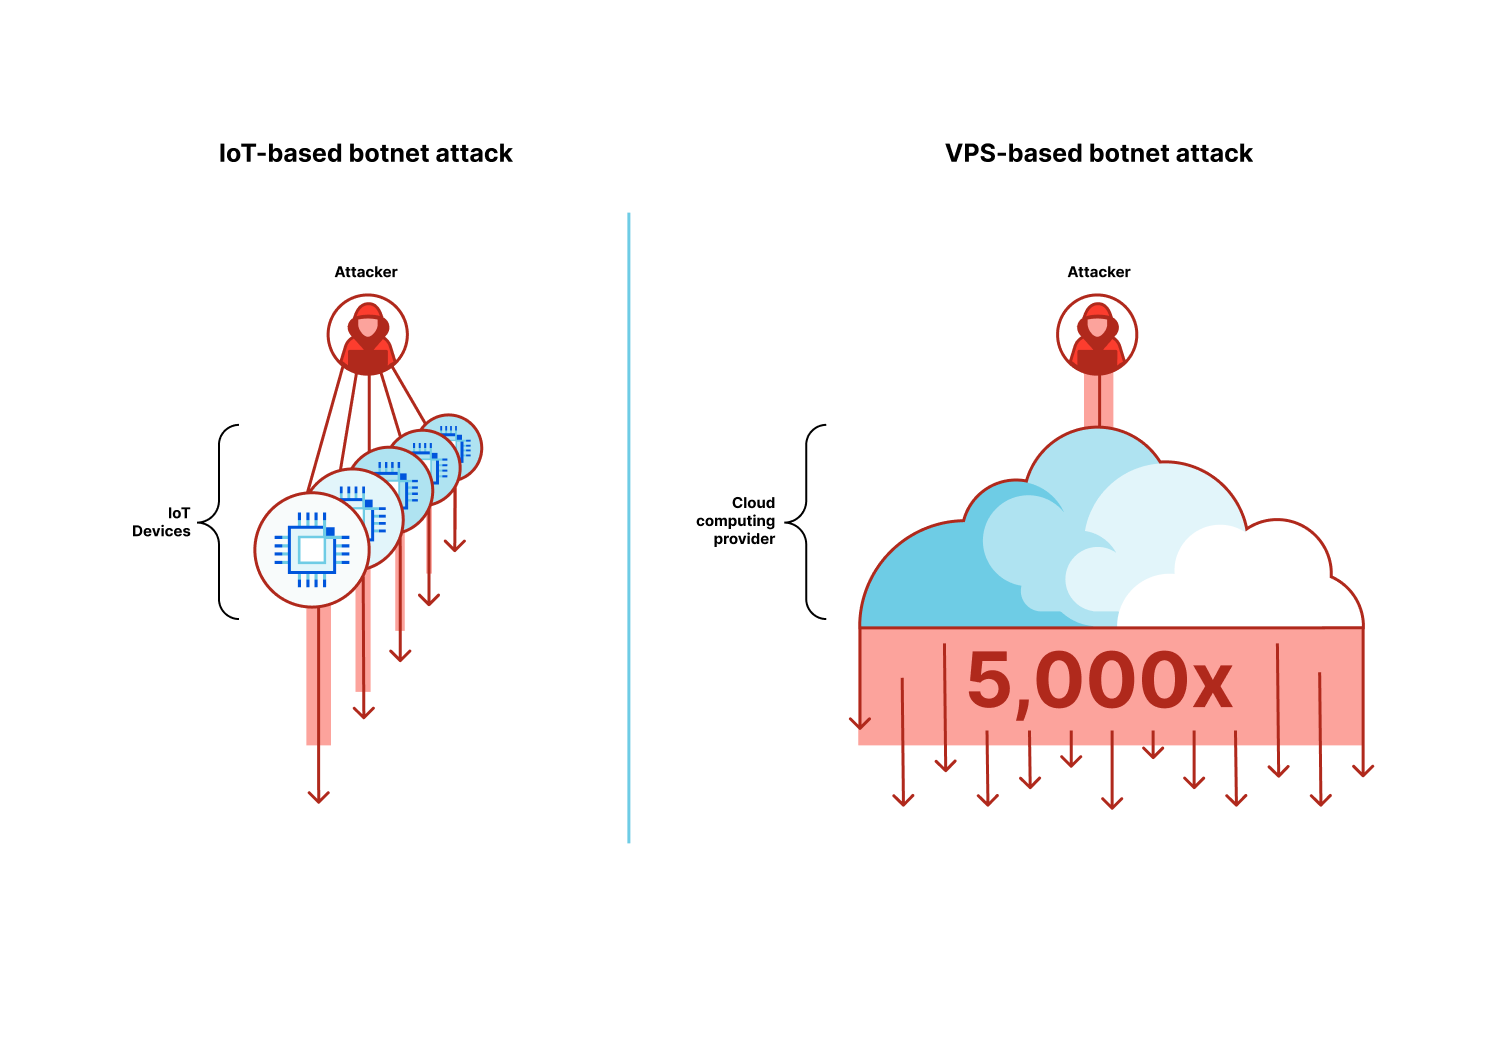
Hyper-volumetric attacks leverage a new generation of botnets that are comprised of Virtual Private Servers (VPS) instead of Internet of Things (IoT) devices.
Historically, large botnets relied on exploitable IoT devices such as smart security cameras to orchestrate their attacks. Despite the limited throughput of each IoT device, together — usually numbering in the hundreds of thousands or millions — they generated enough traffic to disrupt their targets.
The new generation of botnets uses a fraction of the amount of devices, but each device is substantially stronger. Cloud computing providers offer virtual private servers to allow start ups and businesses to create performant applications. The downside is that it also allows attackers to create high-performance botnets that can be as much as 5,000x stronger. Attackers gain access to virtual private servers by compromising unpatched servers and hacking into management consoles using leaked API credentials.
Cloudflare has been working with key cloud computing providers to crack down on these VPS-based botnets. Substantial portions of such botnets have been disabled thanks to the cloud computing providers’ rapid response and diligence. Since then, we have yet to see additional hyper-volumetric attacks — a testament to the fruitful collaboration.
We have excellent collaboration with the cyber-security community to take down botnets once we detect such large-scale attacks, but we want to make this process even simpler and more automated.
We invite Cloud computing providers, hosting providers and general service providers to sign up for Cloudflare’s free Botnet Threat Feed to gain visibility on attacks launching from within their networks — and help us dismantle botnets.
Key highlights from this quarter
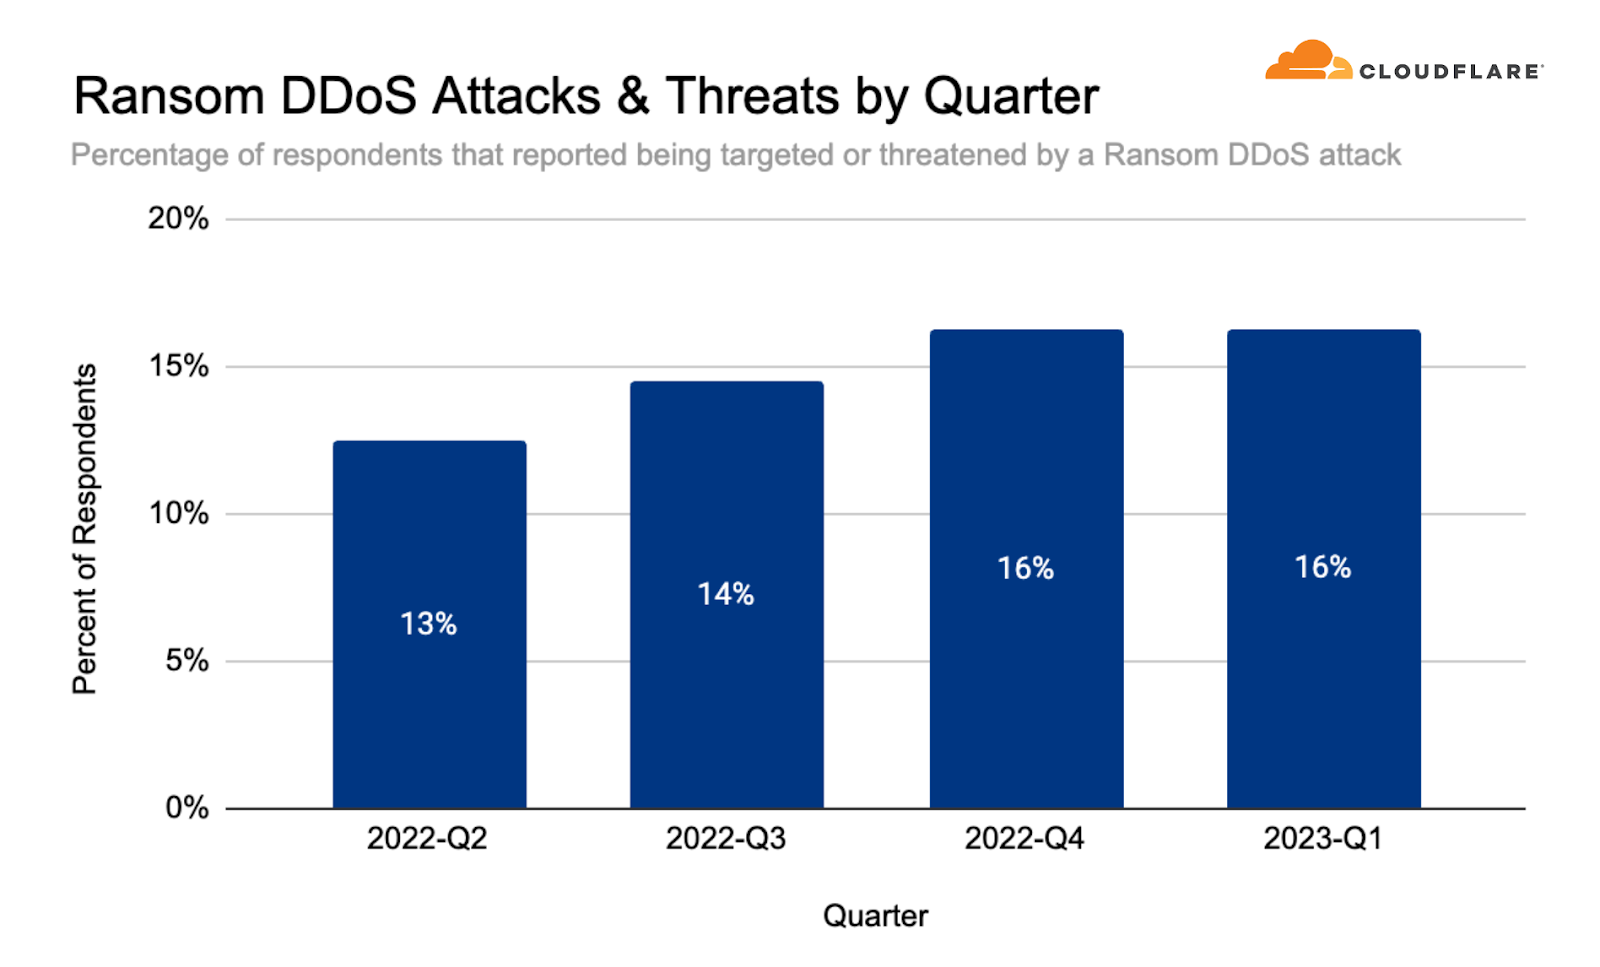
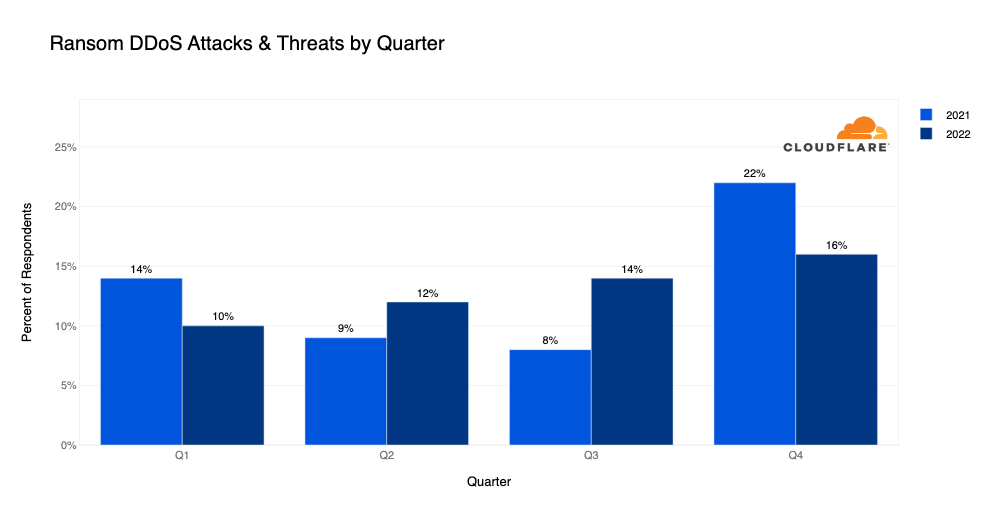
In Q1, 16% of surveyed customers reported a Ransom DDoS attack — remains steady compared to the previous quarter but represents a 60% increase YoY.
Non-profit organizations and Broadcast Media were two of the most targeted industries. Finland was the largest source of HTTP DDoS attacks in terms of percentage of attack traffic, and the main target of network-layer DDoS attacks. Israel was the top most attacked country worldwide by HTTP DDoS attacks.
Large scale volumetric DDoS attacks — attacks above 100 Gbps — increased by 6% QoQ. DNS-based attacks became the most popular vector. Similarly, we observed surges in SPSS-bas in ed DDoS attacks, DNS amplification attacks, and GRE-based DDoS attacks.
Ransom DDoS attacks
Often, DDoS attacks are carried out to extort ransom payments. We continue to survey Cloudflare customers and track the ratio of DDoS events where the target received a ransom note. This number has been steadily rising through 2022 and currently stands at 16% – the same as in Q4 2022.
Percent of users reporting a Ransom DDoS attack or threat, per quarter
As opposed to Ransomware attacks, where usually the victim is tricked into downloading a file or clicking on an email link that encrypts and locks their computer files until they pay a ransom fee, Ransom DDoS attacks can be much easier for attackers to execute. Ransom DDoS attacks don’t require tricking the victim into opening an email or clicking a link, nor do they require a network intrusion or a foothold into the corporate assets.
In a Ransom DDoS attack, the attacker doesn’t need access to the victim’s computer but rather just needs to bombard them with a sufficiently large amount of traffic to take down their websites, DNS servers, and any other type of Internet-connected property to make it unavailable or with poor performance to users. The attacker will demand a ransom payment, usually in the form of Bitcoin, to stop and/or avoid further attacks.
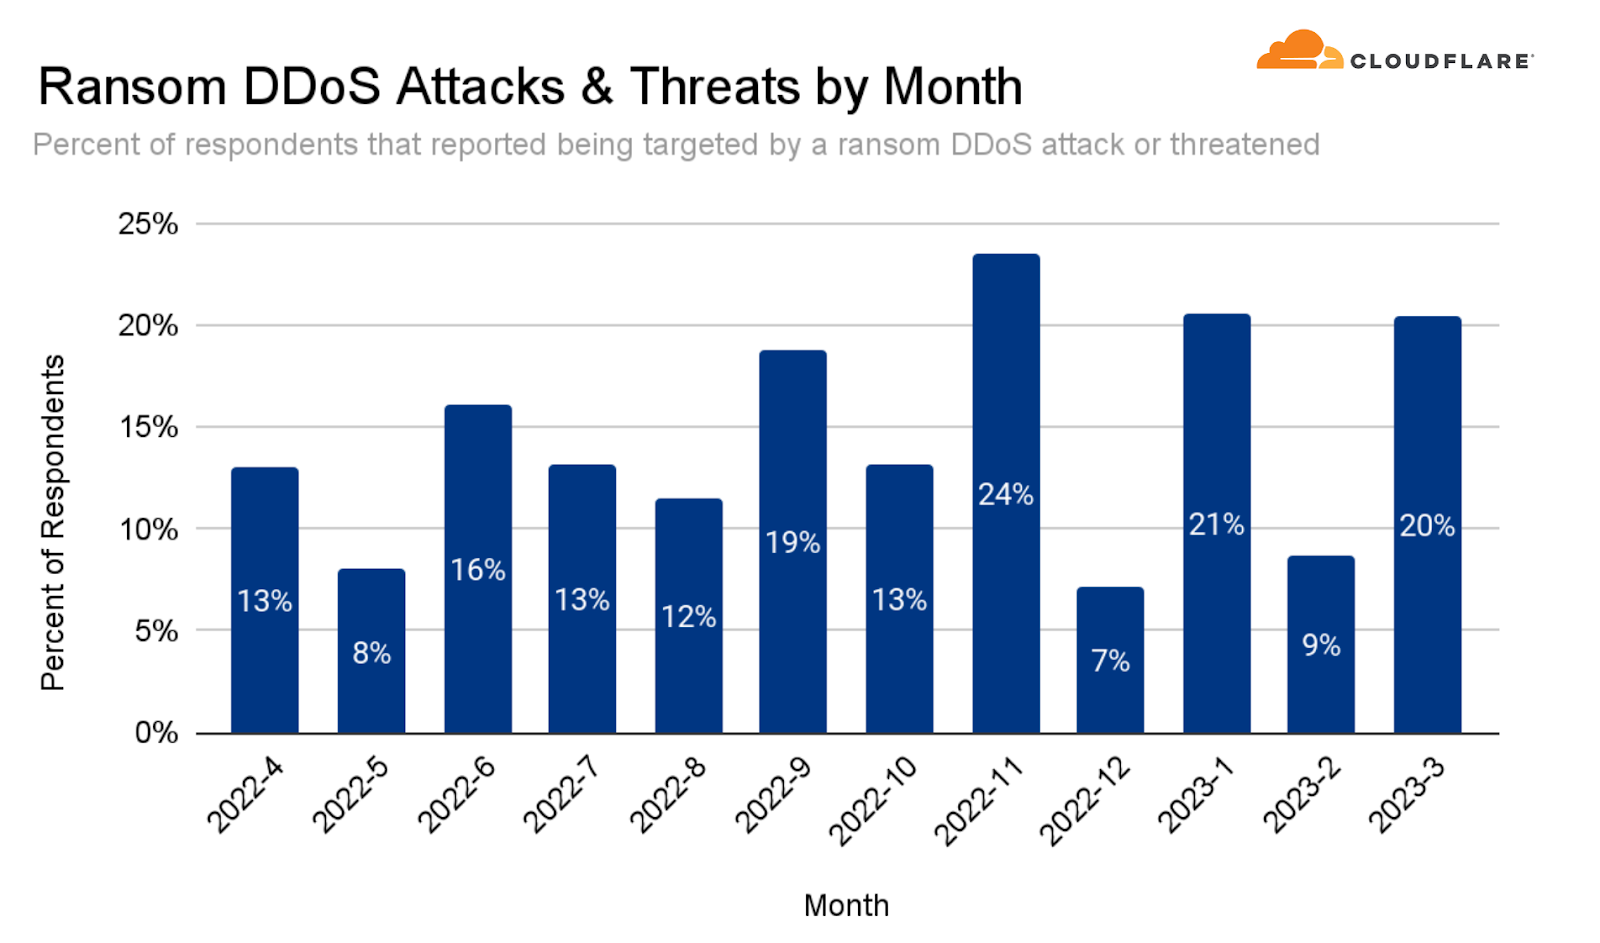
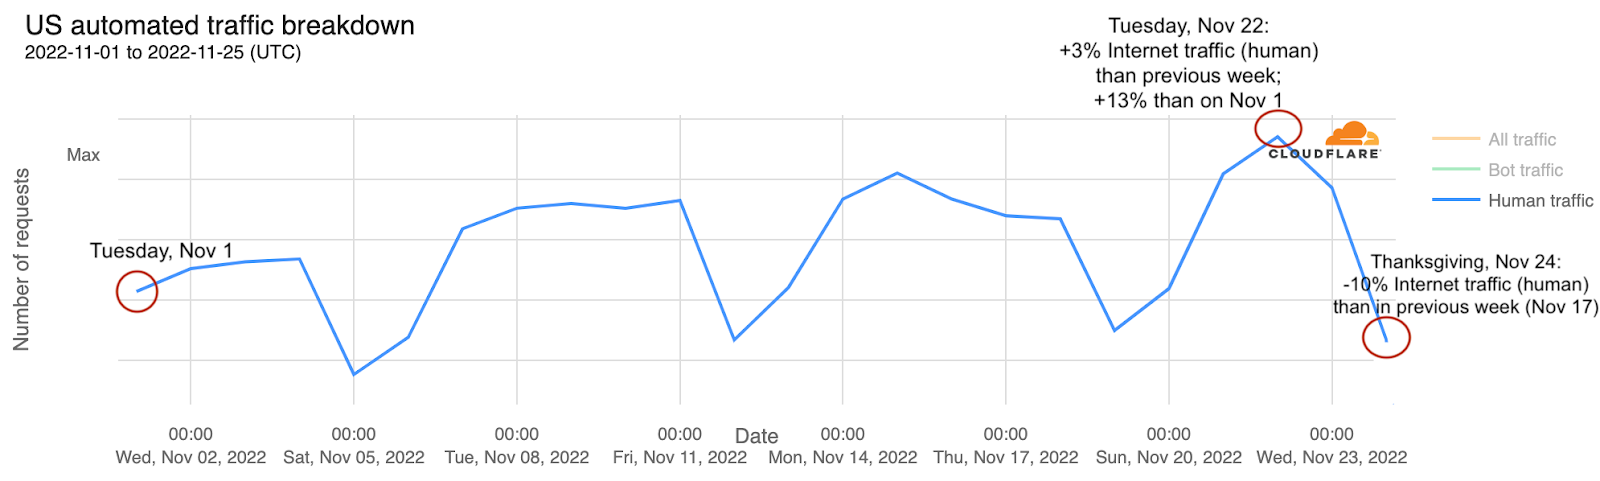
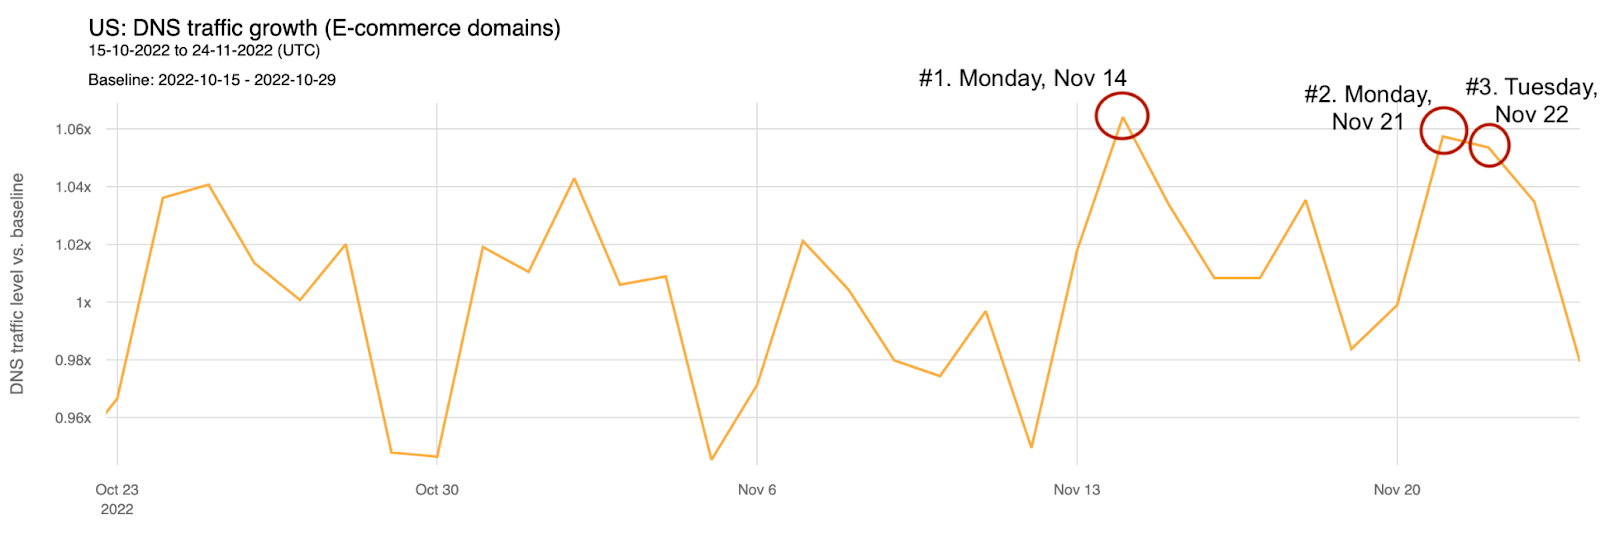
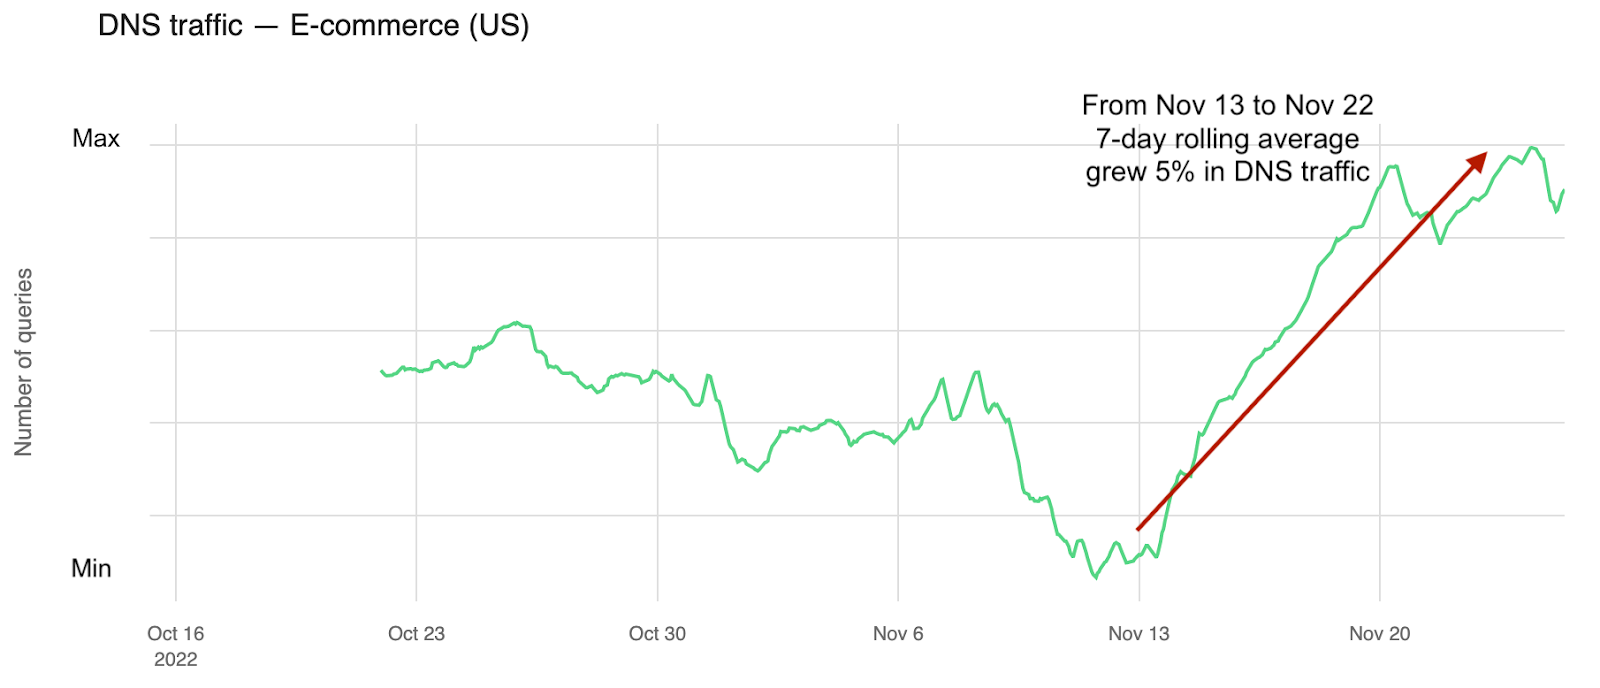
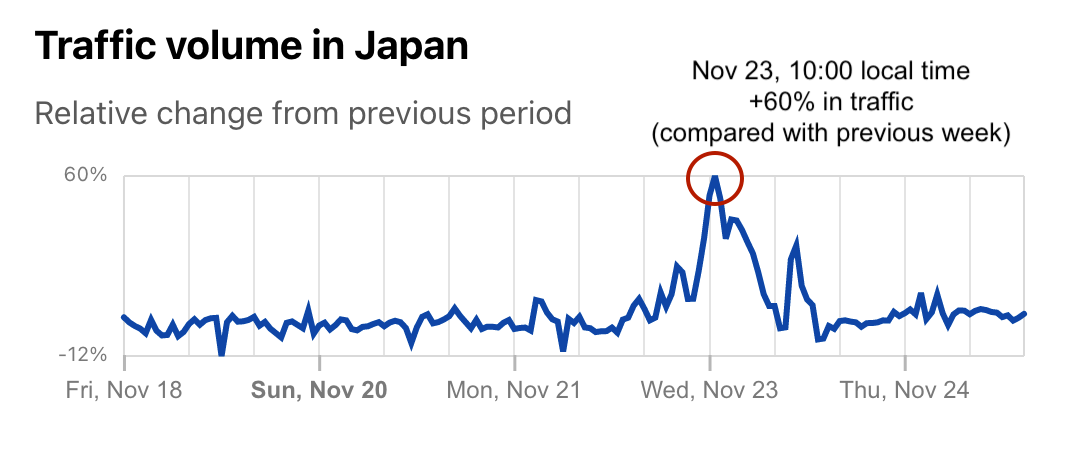
The months of January 2023 and March 2023 were the second highest in terms of Ransom DDoS activity as reported by our users. The highest month thus far remains November 2022 — the month of Black Friday, Thanksgiving, and Singles Day in China — a lucrative month for threat actors.
Percent of users reporting a Ransom DDoS attack or threat, per month
Who and what are being attacked?
Top targeted countries
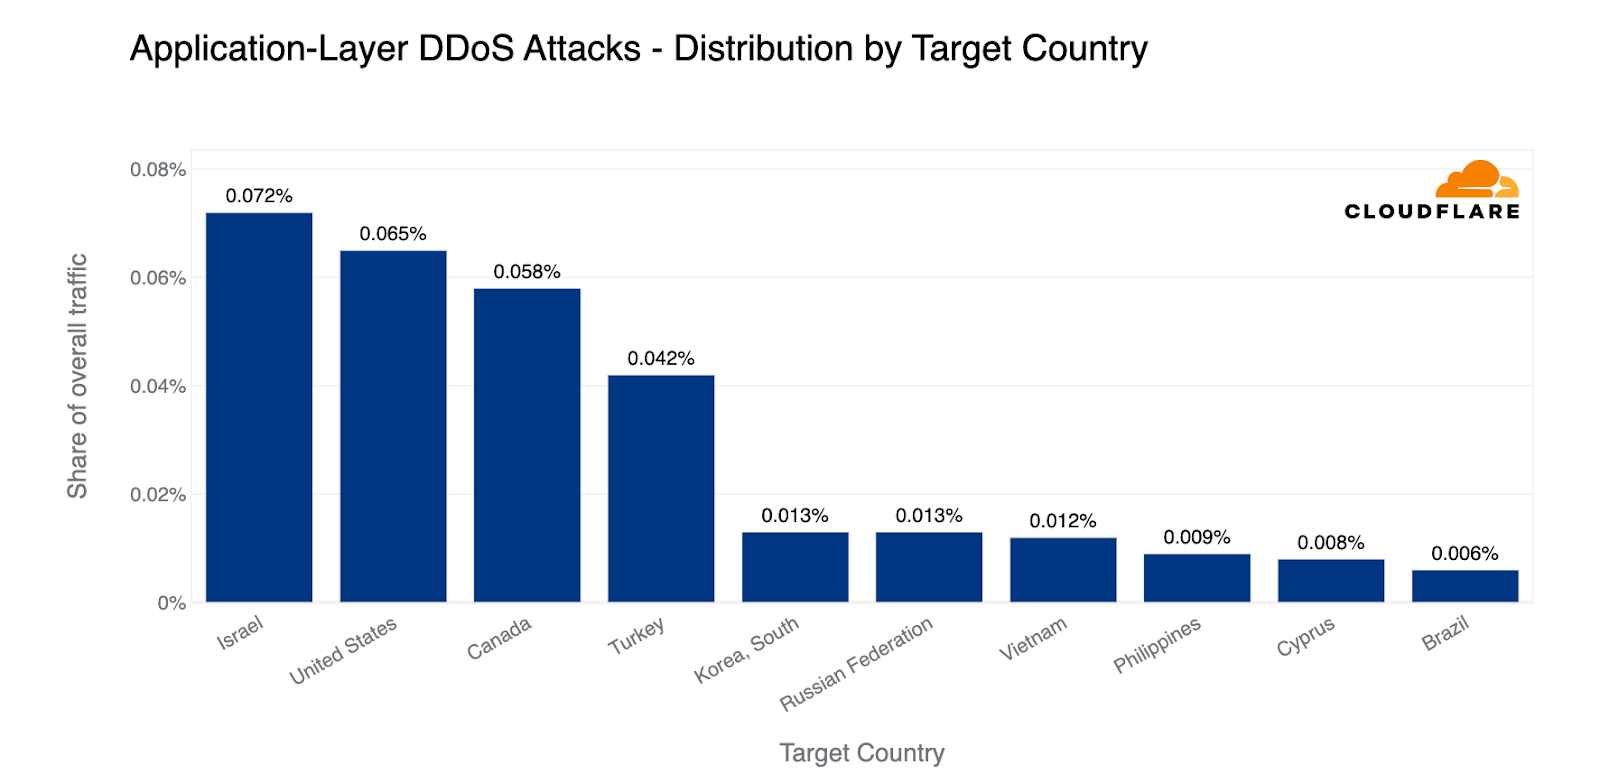
Perhaps related to the judicial reform and opposing protests, in Q1, Israel jumps to the first place as the country targeted by the most HTTP DDoS attack traffic — even above the United States of America. This is an astonishing figure. Just short of a single percent of all HTTP traffic that Cloudflare processed in the first quarter of the year, was part of HTTP DDoS attacks that targeted Israeli websites. Following closely behind Israel are the US, Canada, and Turkey.
Top countries targeted by HTTP DDoS attacks (percentage of attack traffic out of the total traffic worldwide)
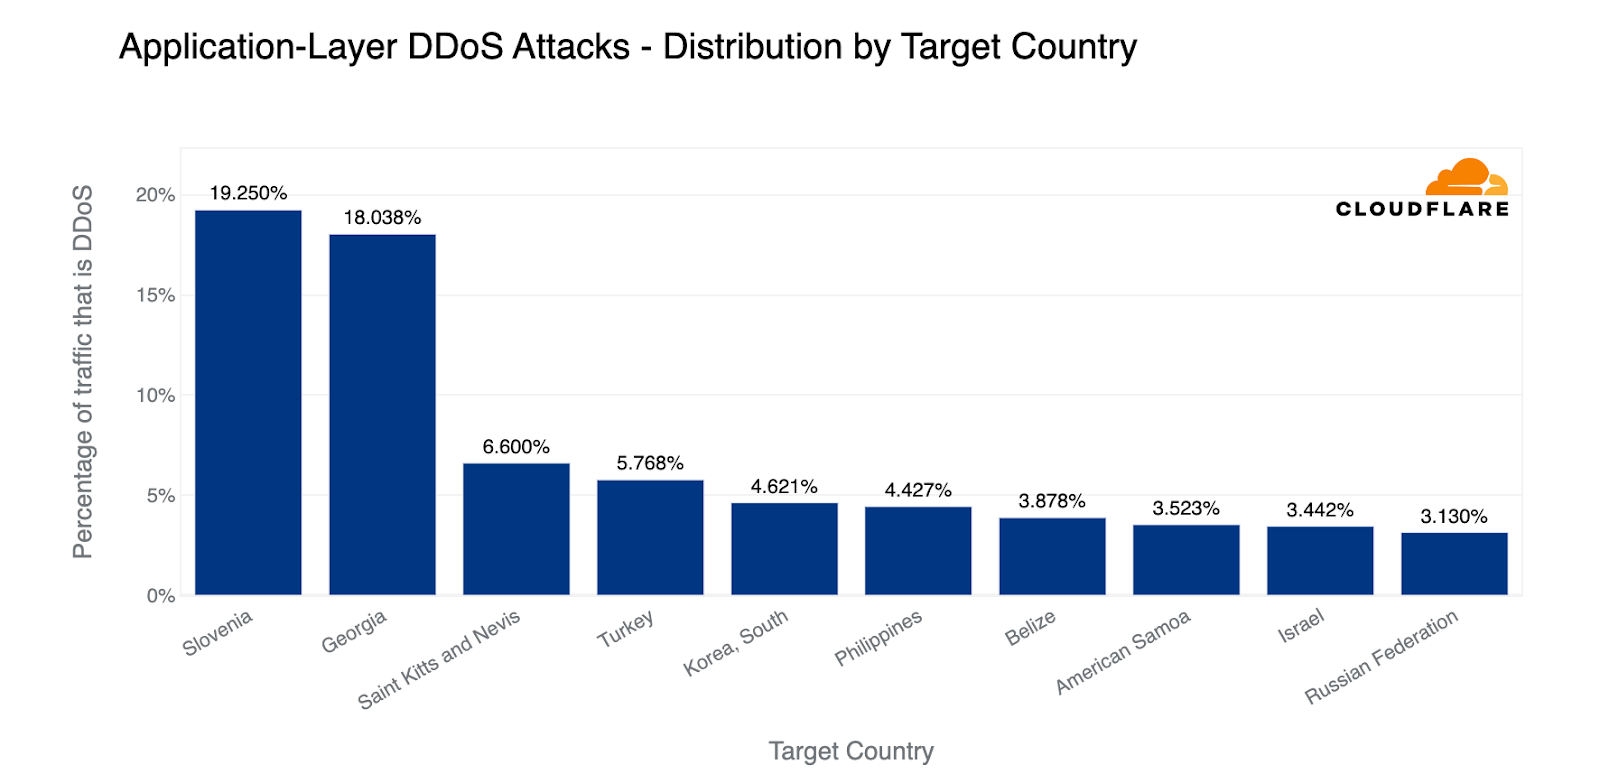
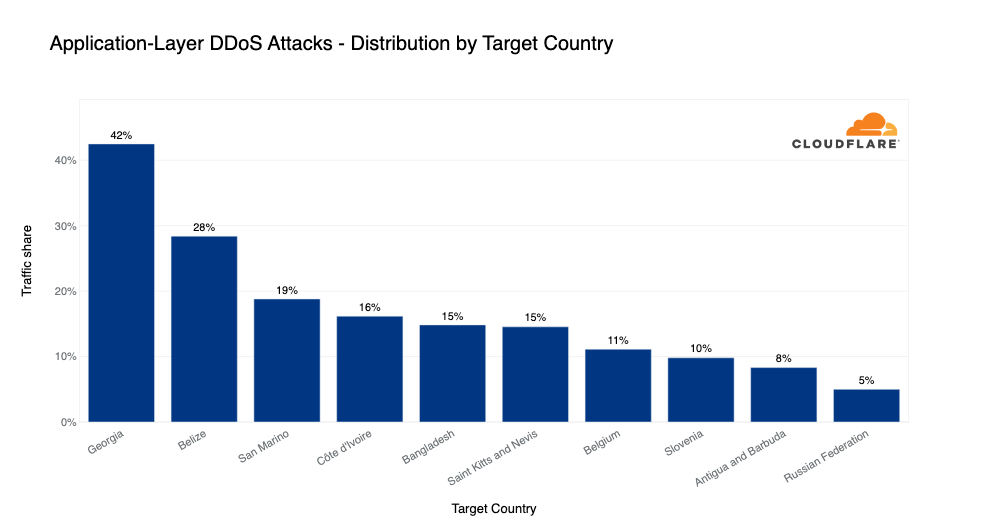
In terms of the percentage of attack traffic compared to all traffic to a given country, Slovenia and Georgia came at the top. Approximately 20% of all traffic to Slovenian and Georgian websites were HTTP DDoS attacks. Next in line were the small Caribbean dual-island nation, Saint Kitts and Nevis, and Turkey. While Israel was the top in the previous graph, here it has found its placement as the ninth most attacked country — above Russia. Still high compared to previous quarters.
Top countries targeted by HTTP DDoS attacks (percentage of attack traffic out of the total traffic per country)
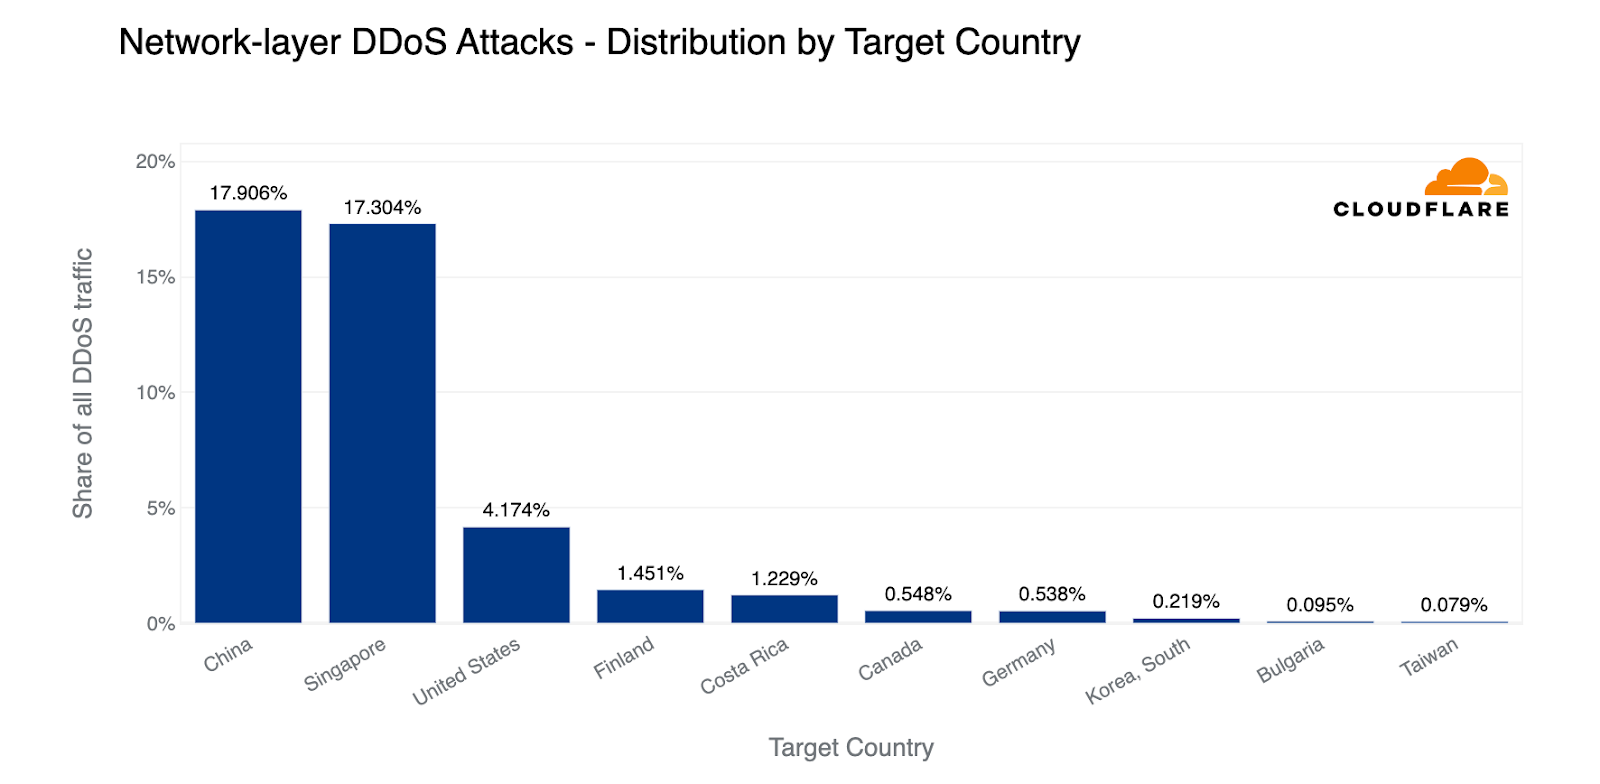
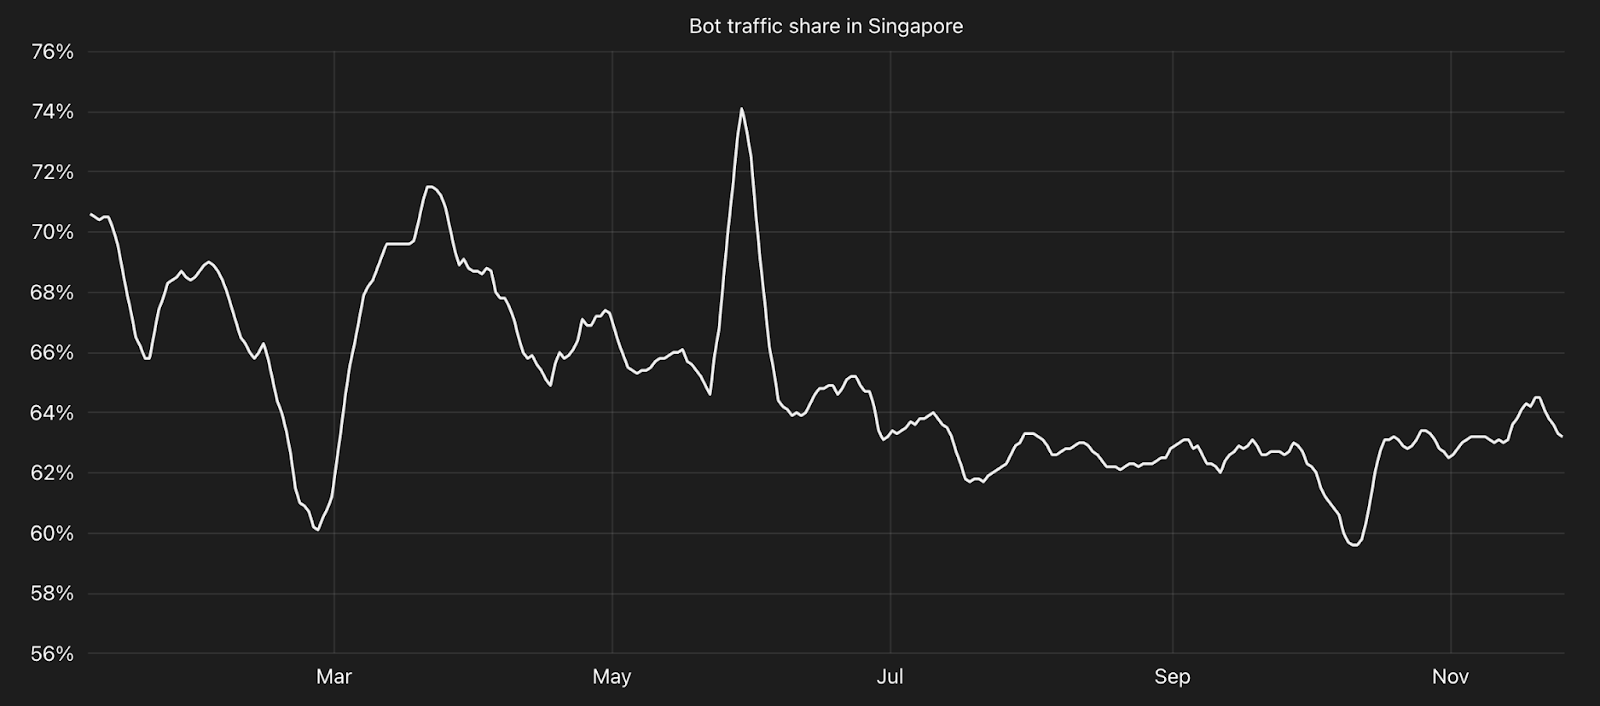
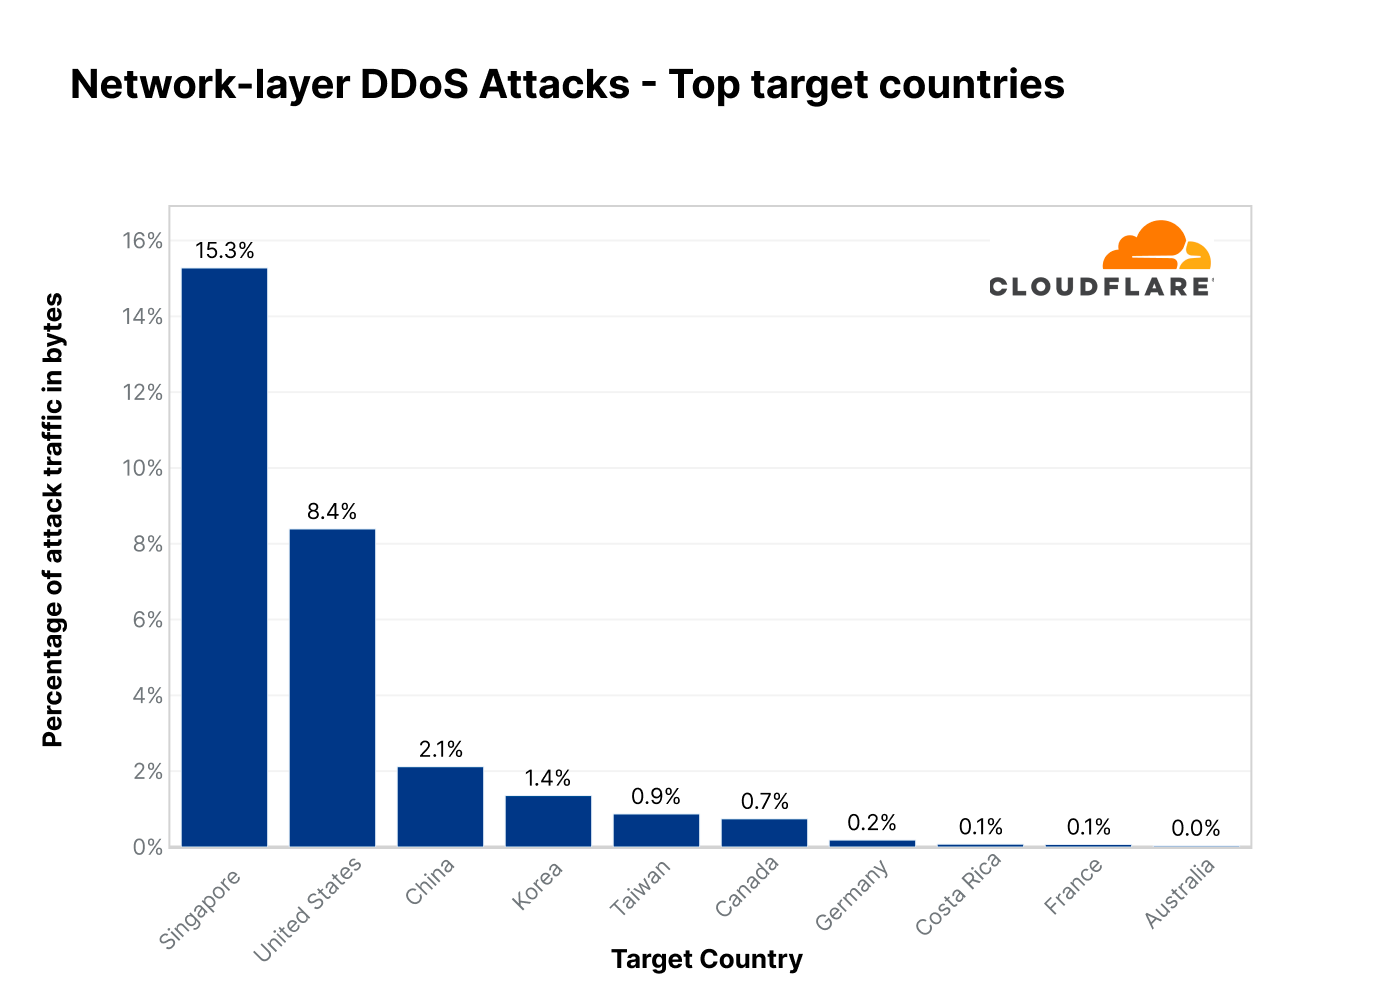
Looking at the total amount of network-layer DDoS attack traffic, China came in first place. Almost 18% of all network-layer DDoS attack traffic came from China. Closely in second, Singapore came in second place with a 17% share. The US came in third, followed by Finland.
Top countries targeted by network-layer DDoS attacks (percentage of attack traffic out of the all DDoS traffic worldwide)
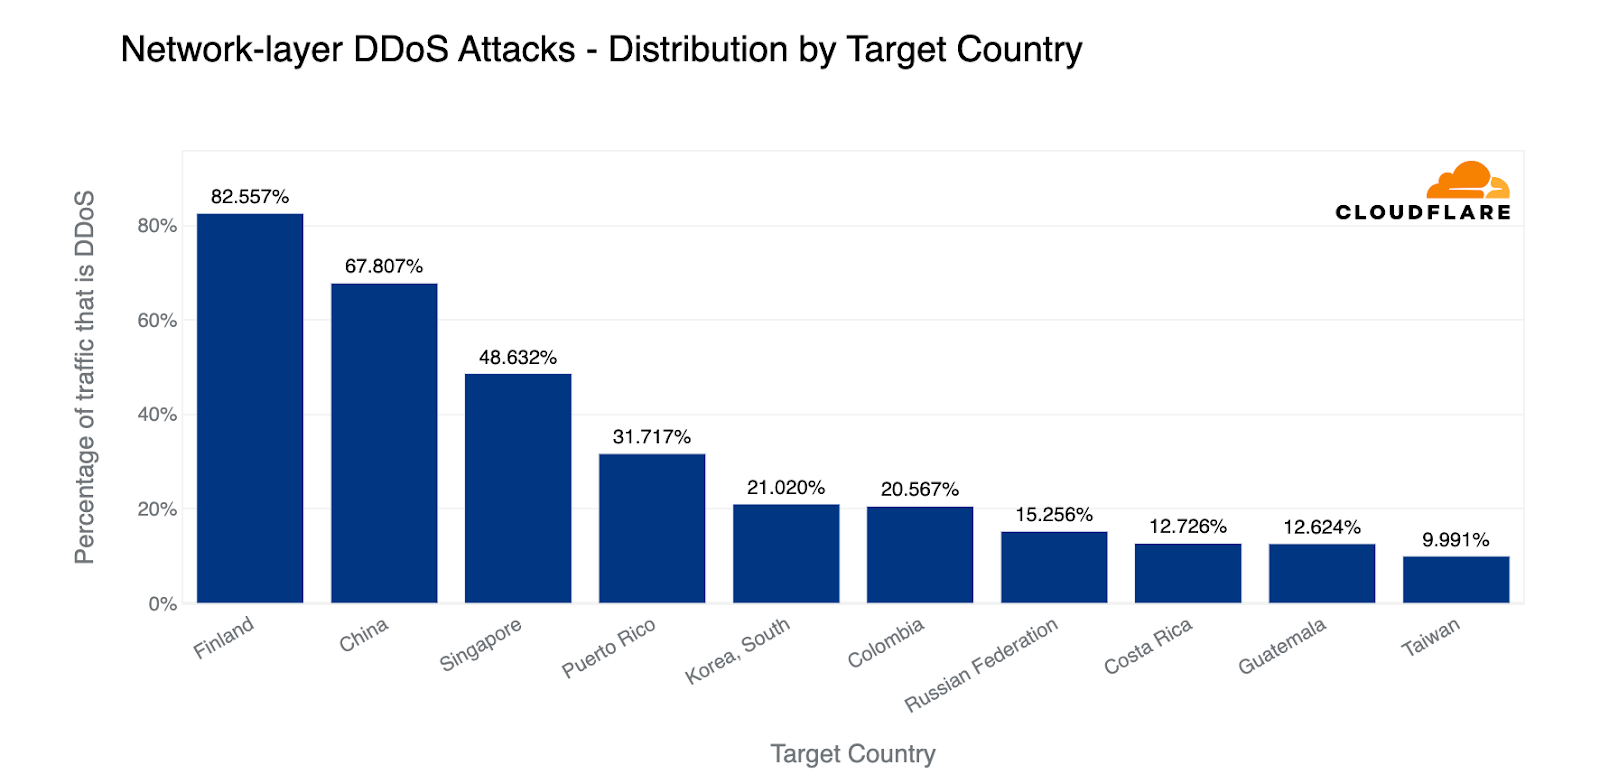
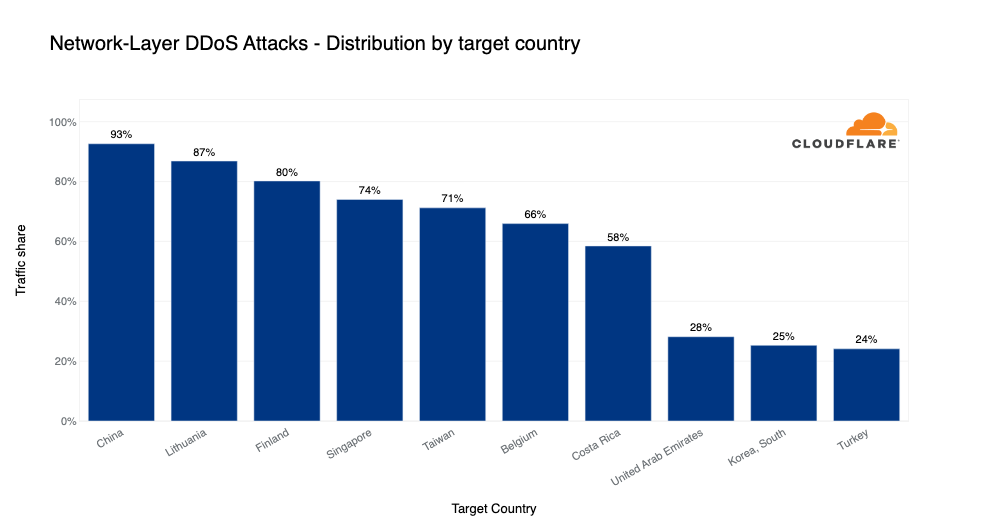
When we normalize attacks to a country by all traffic to that country, Finland jumps to the first place, perhaps due to its newly approved NATO membership. Nearly 83% of all traffic to Finland was network-layer attack traffic. China followed closely with 68% and Singapore again with 49%.
Top countries targeted by network-layer DDoS attacks (percentage of attack traffic out of the all traffic per country)
Top targeted industries
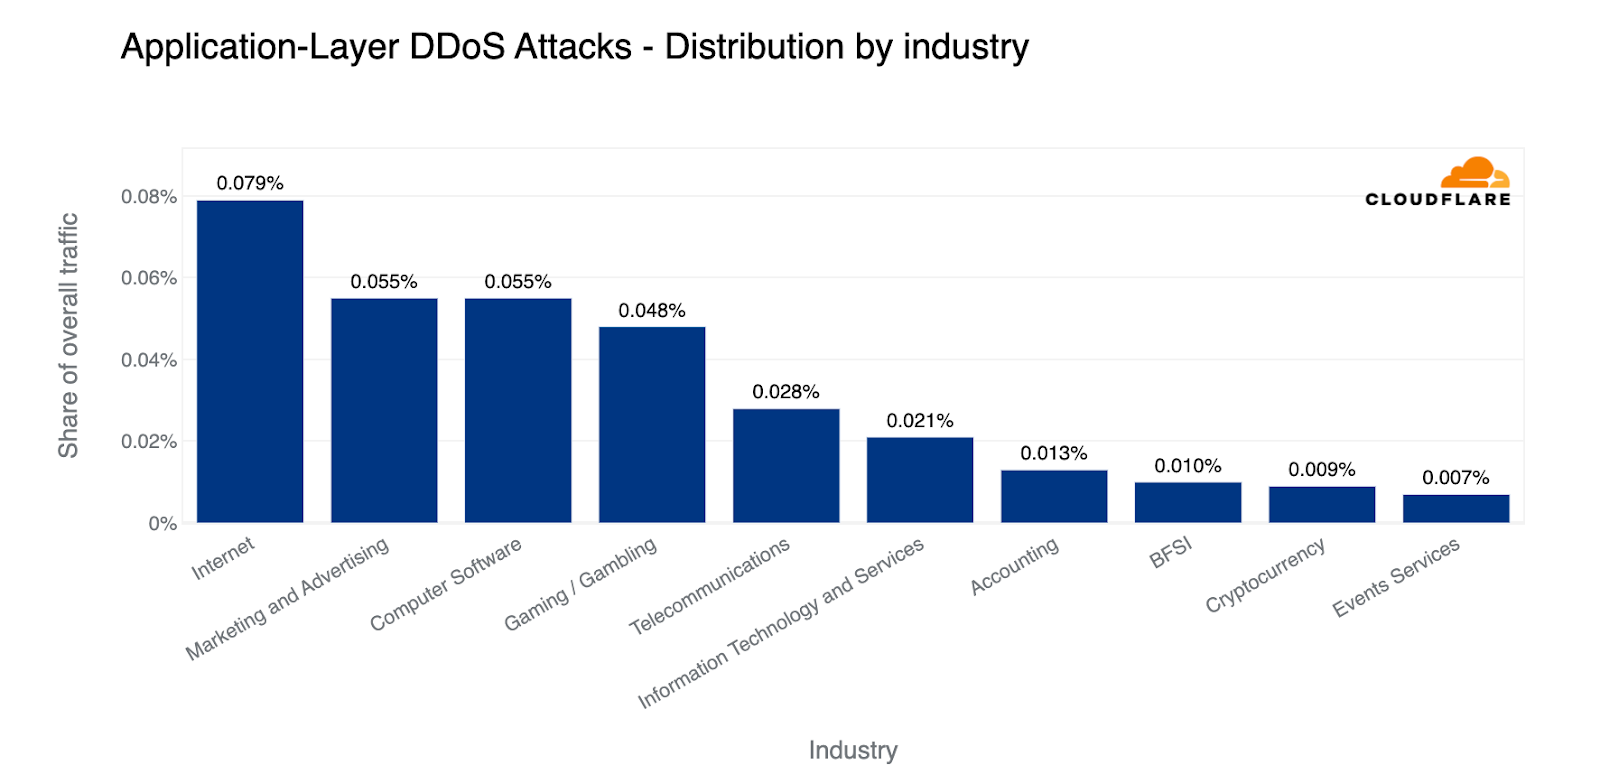
In terms of overall bandwidth, globally, Internet companies saw the largest amount of HTTP DDoS attack traffic. Afterwards, it was the Marketing and Advertising industry, Computer Software industry, Gaming / Gambling and Telecommunications.
Top industries targeted by HTTP DDoS attacks (percentage of attack traffic out of the total traffic for all industries)
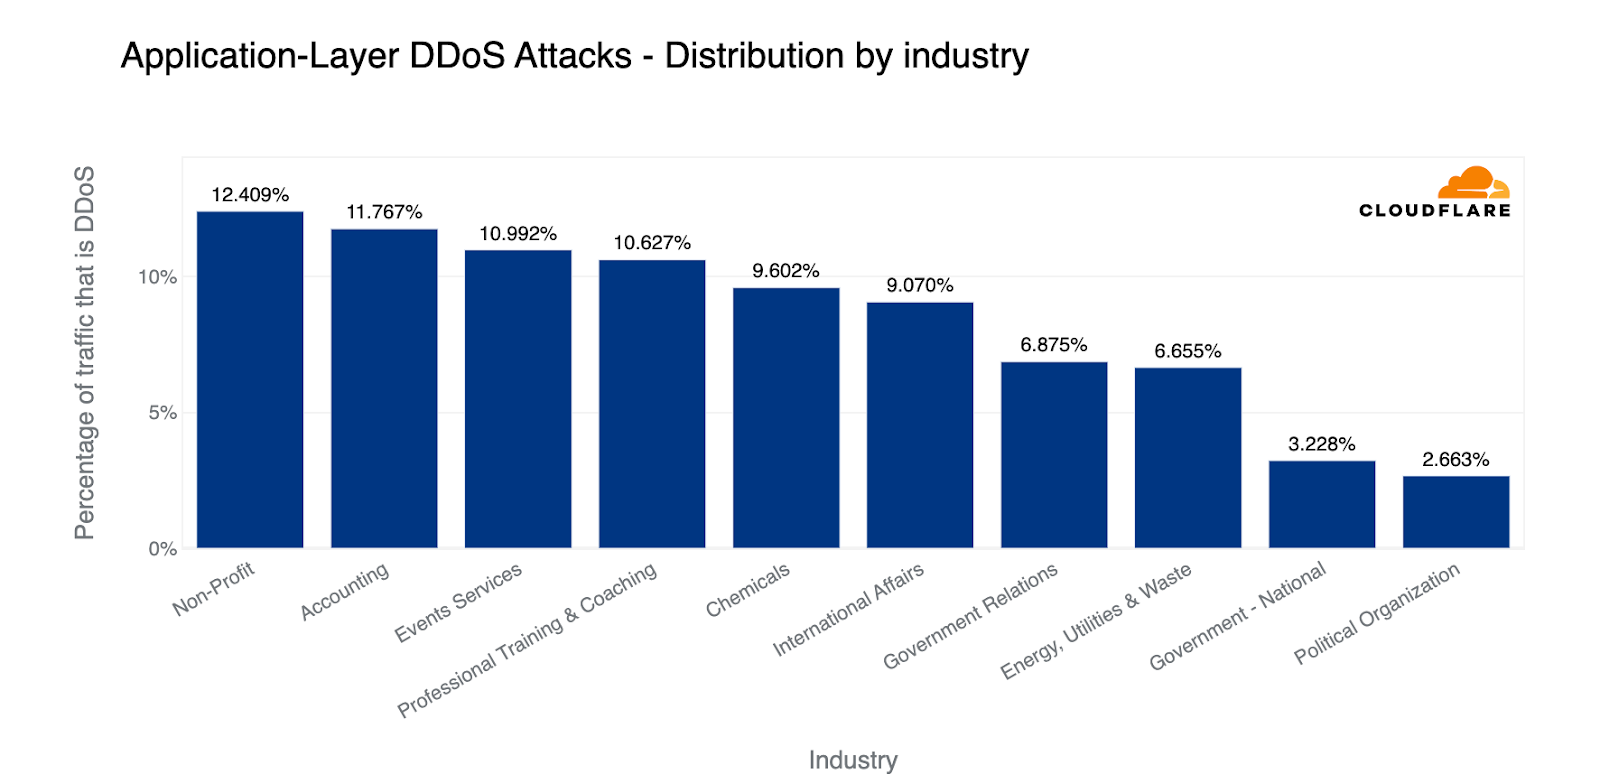
By percentage of attack traffic out of total traffic to an industry, Non-profits were the most targeted in the first quarter of the year, followed by Accounting firms. Despite the uptick of attacks on healthcare, it didn’t make it into the top ten. Also up there in the top were Chemicals, Government, and Energy Utilities & Waste industries. Looking at the US, almost 2% of all traffic to US Federal websites were part of DDoS attacks.
Top industries targeted by HTTP DDoS attacks (percentage of attack traffic out of the total traffic per industry)
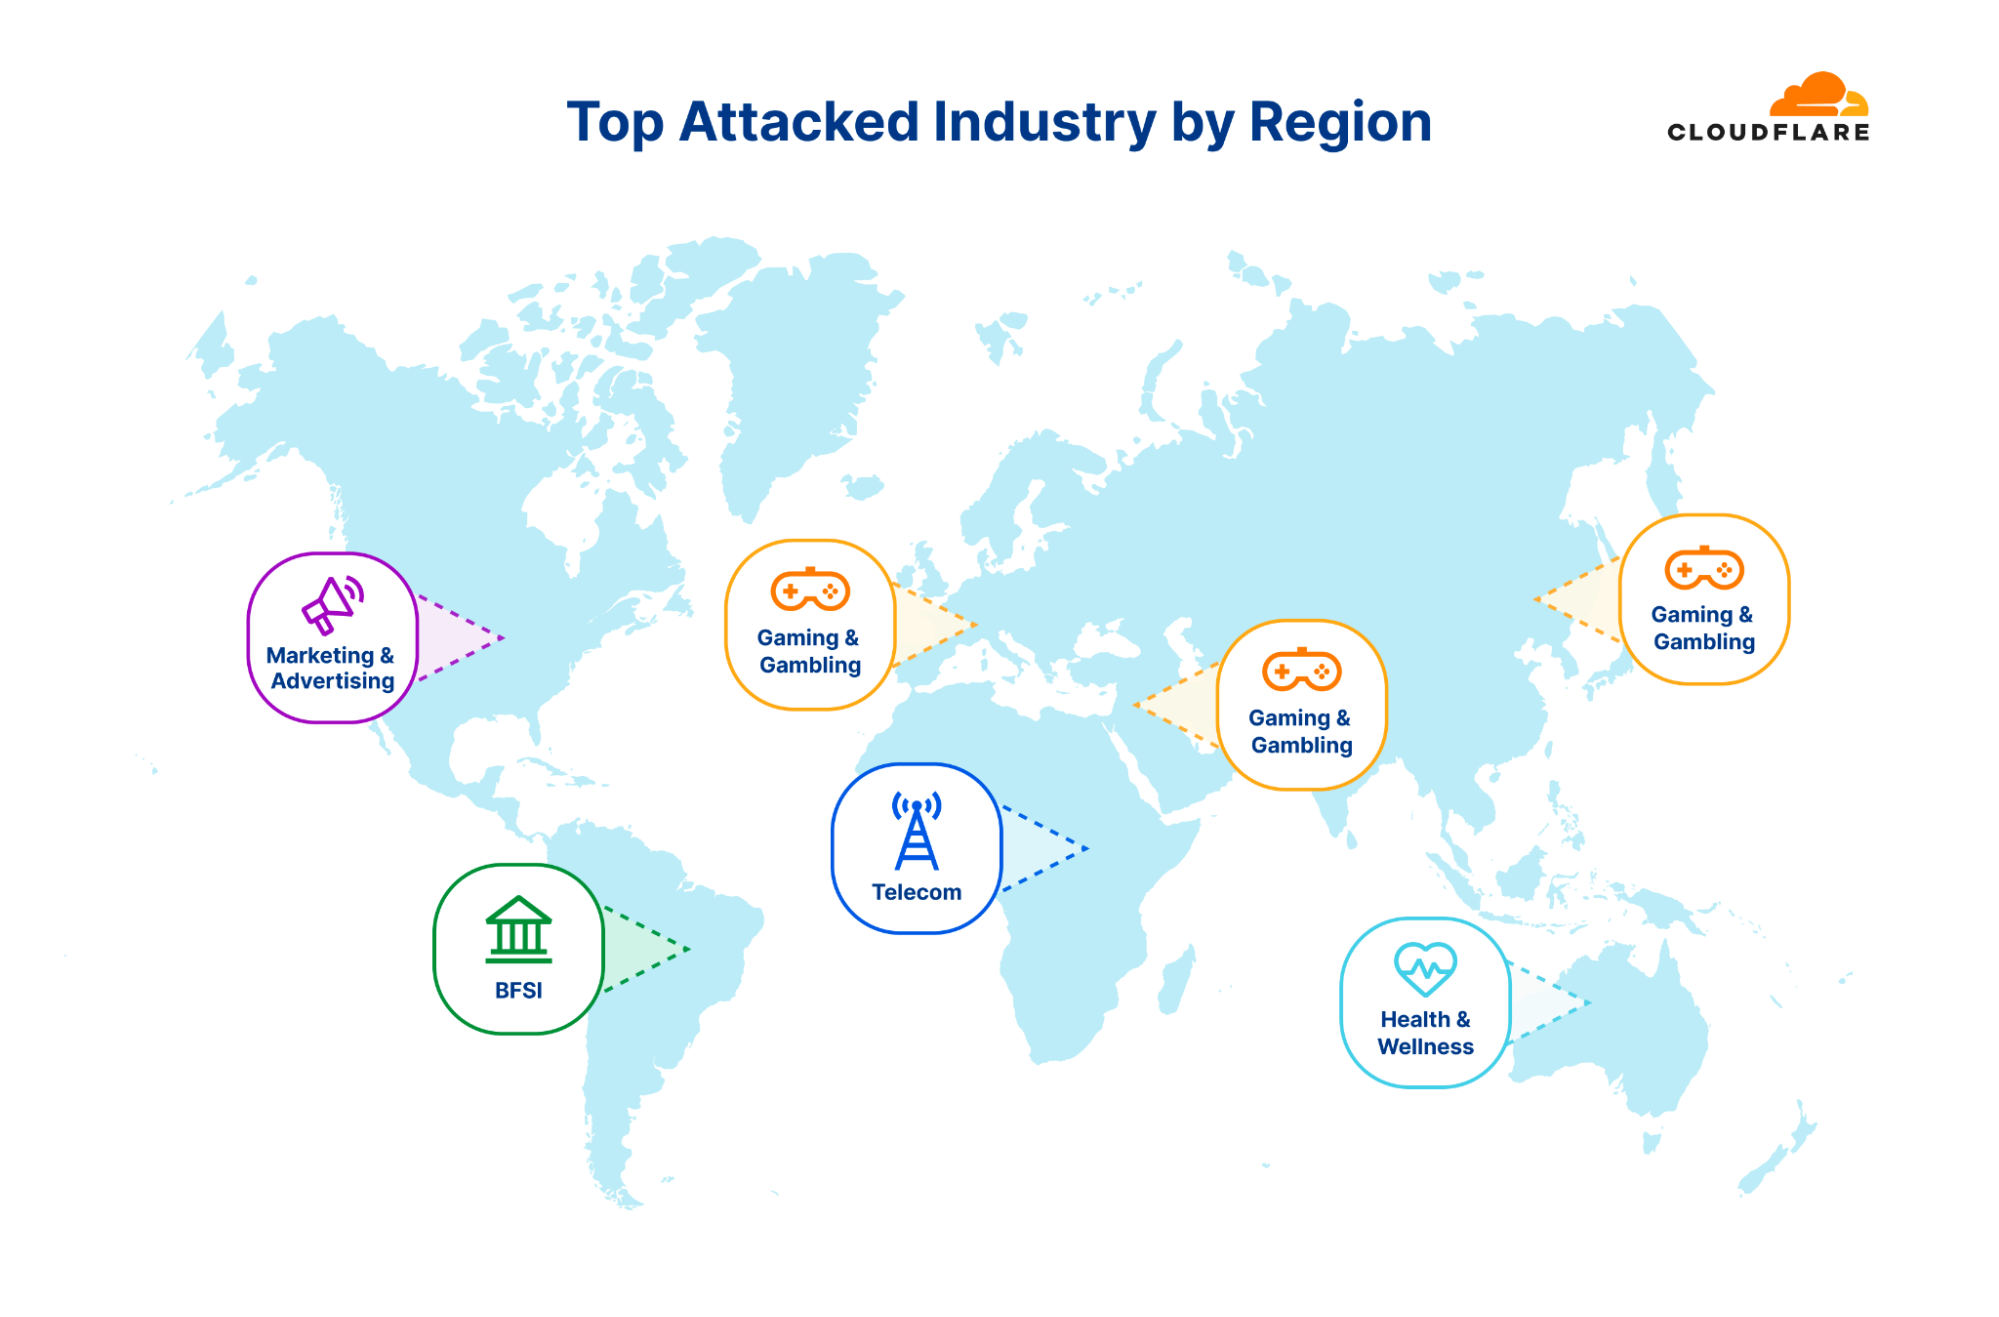
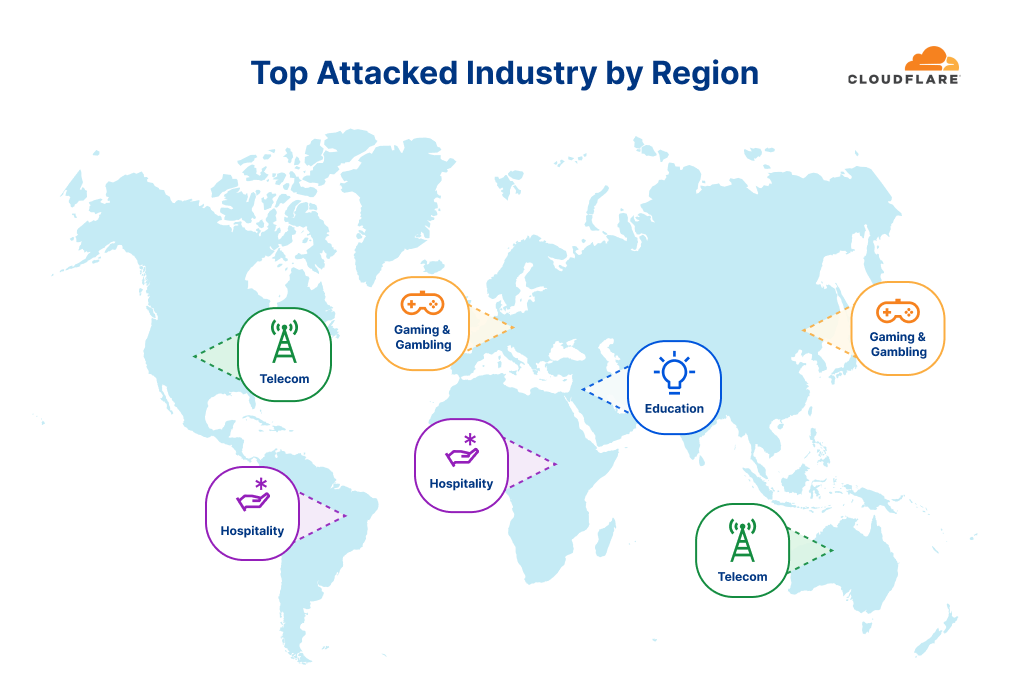
On a regional scale, the Gaming & Gambling industry was the most targeted in Asia, Europe, and the Middle East. In South and Central America, the Banking, Financial Services and Insurance (BFSI) industry was the most targeted. In North America it was the Marketing & Advertising industry followed by Telecommunications — which was also the most attacked industry in Africa. Last by not least, in Oceania, the Health, Wellness and Fitness industry was the most targeted by HTTP DDoS attacks.
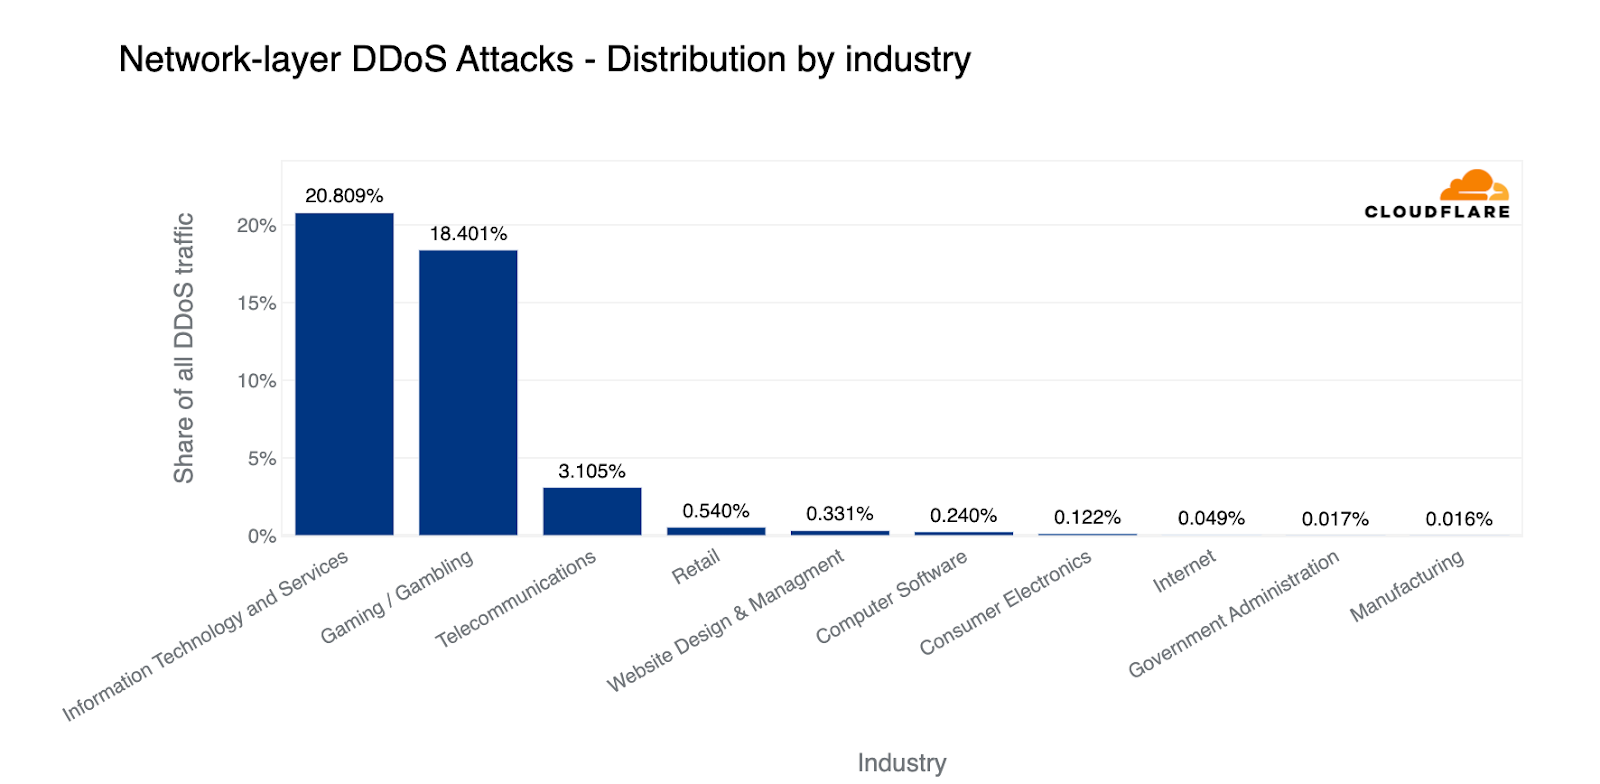
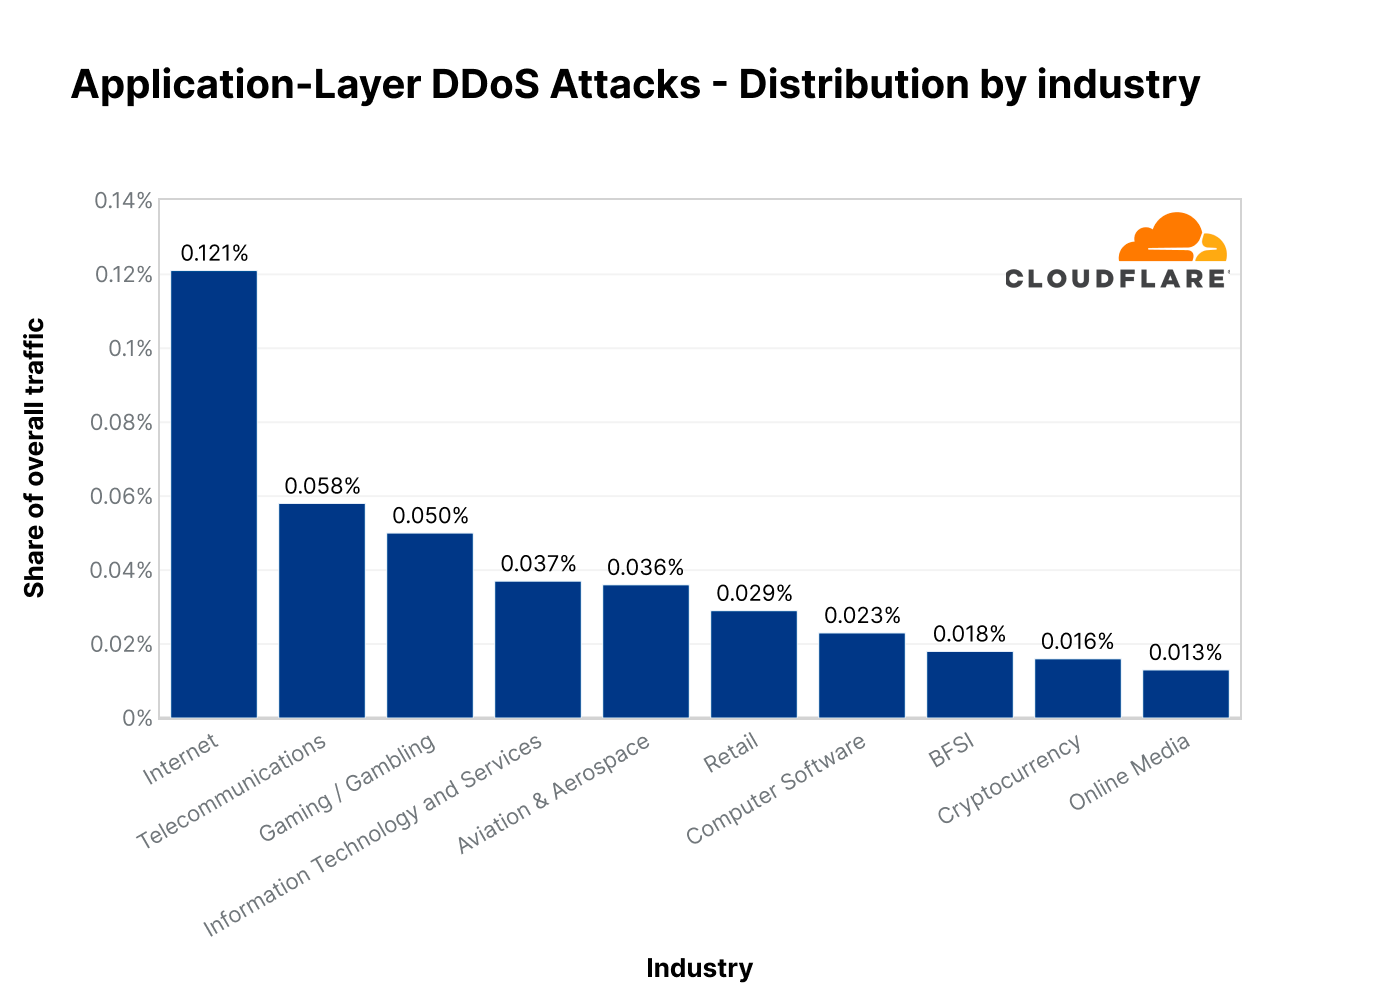
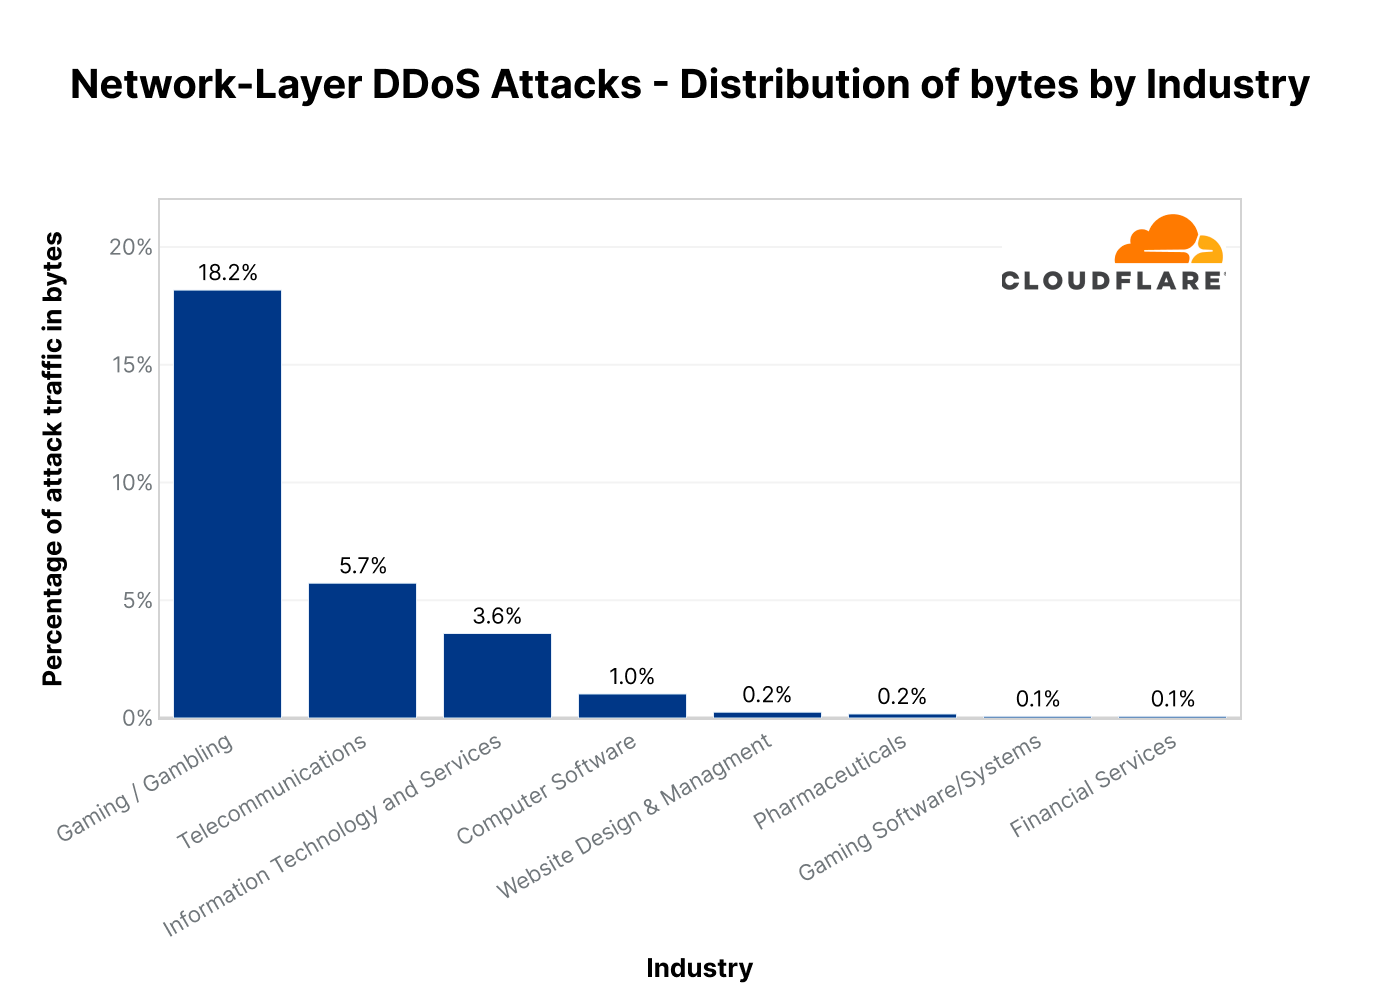
Diving lower in the OSI stack, based on the total volume of L3/4 attack traffic, the most targeted industries were Information Technology and Services, Gaming / Gambling, and Telecommunications.
Top industries targeted by L3/4 DDoS attacks (percentage of attack traffic out of the total DDoS traffic for all industries)
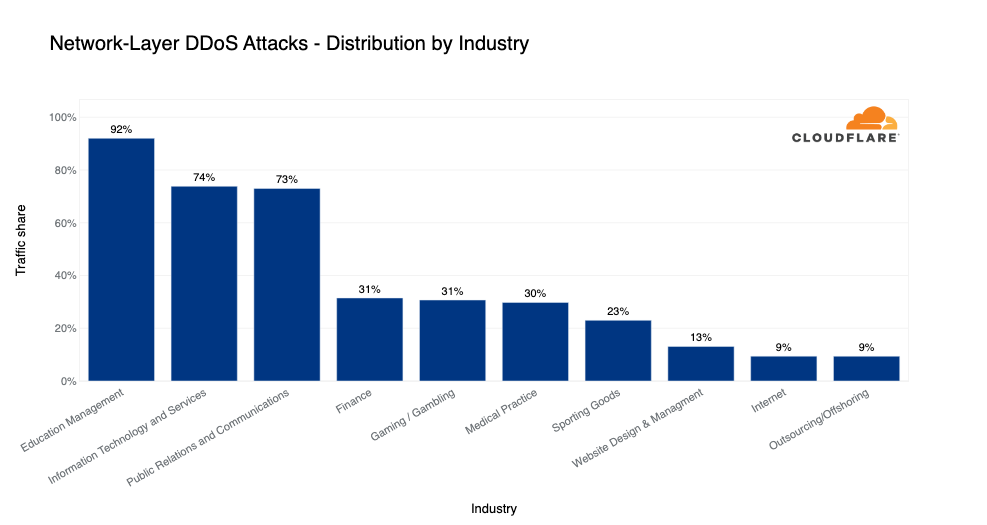
When comparing the attack traffic to the total traffic per industry, we see a different picture. Almost every second byte transmitted to Broadcast Media companies was L3/4 DDoS attack traffic.
Top industries targeted by L3/4 DDoS attacks (percentage of attack traffic out of the total traffic per industry)
Where attacks are coming from
Top source countries
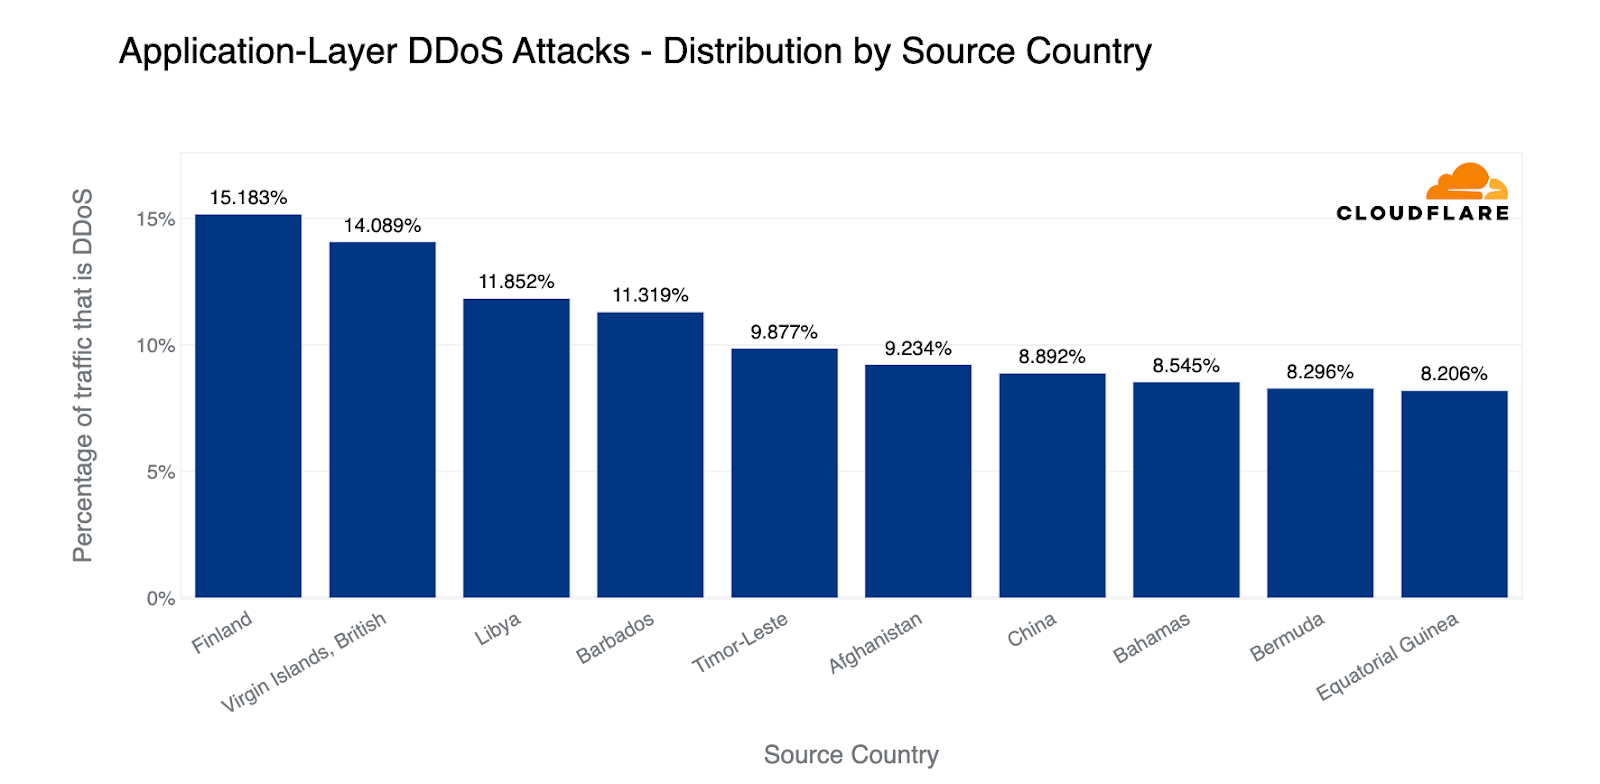
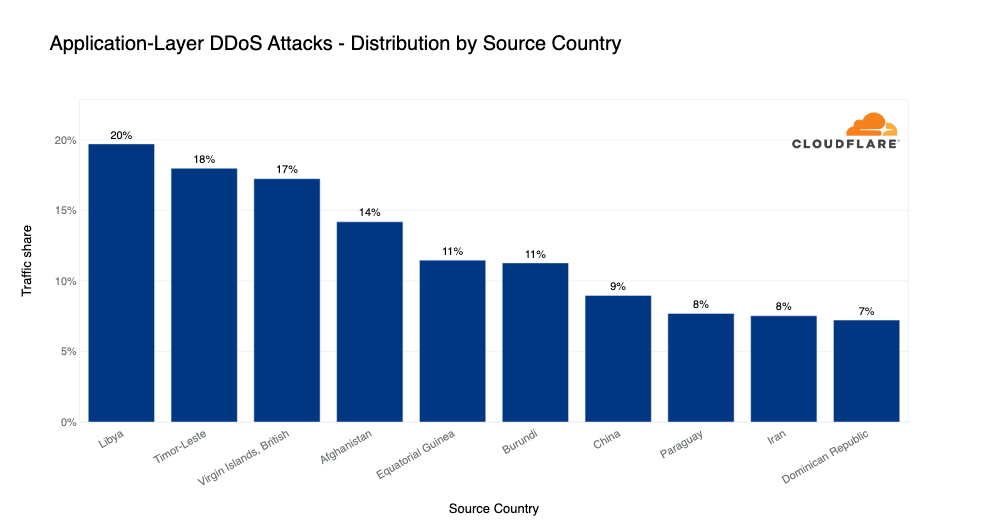
In the first quarter of 2023, Finland was the largest source of HTTP DDoS attacks in terms of the percentage of attack traffic out of all traffic per country. Closely after Finland, the British Virgin Islands came in second place, followed by Libya and Barbados.
Top source countries of HTTP DDoS attacks (percentage of attack traffic out of the total traffic per country)
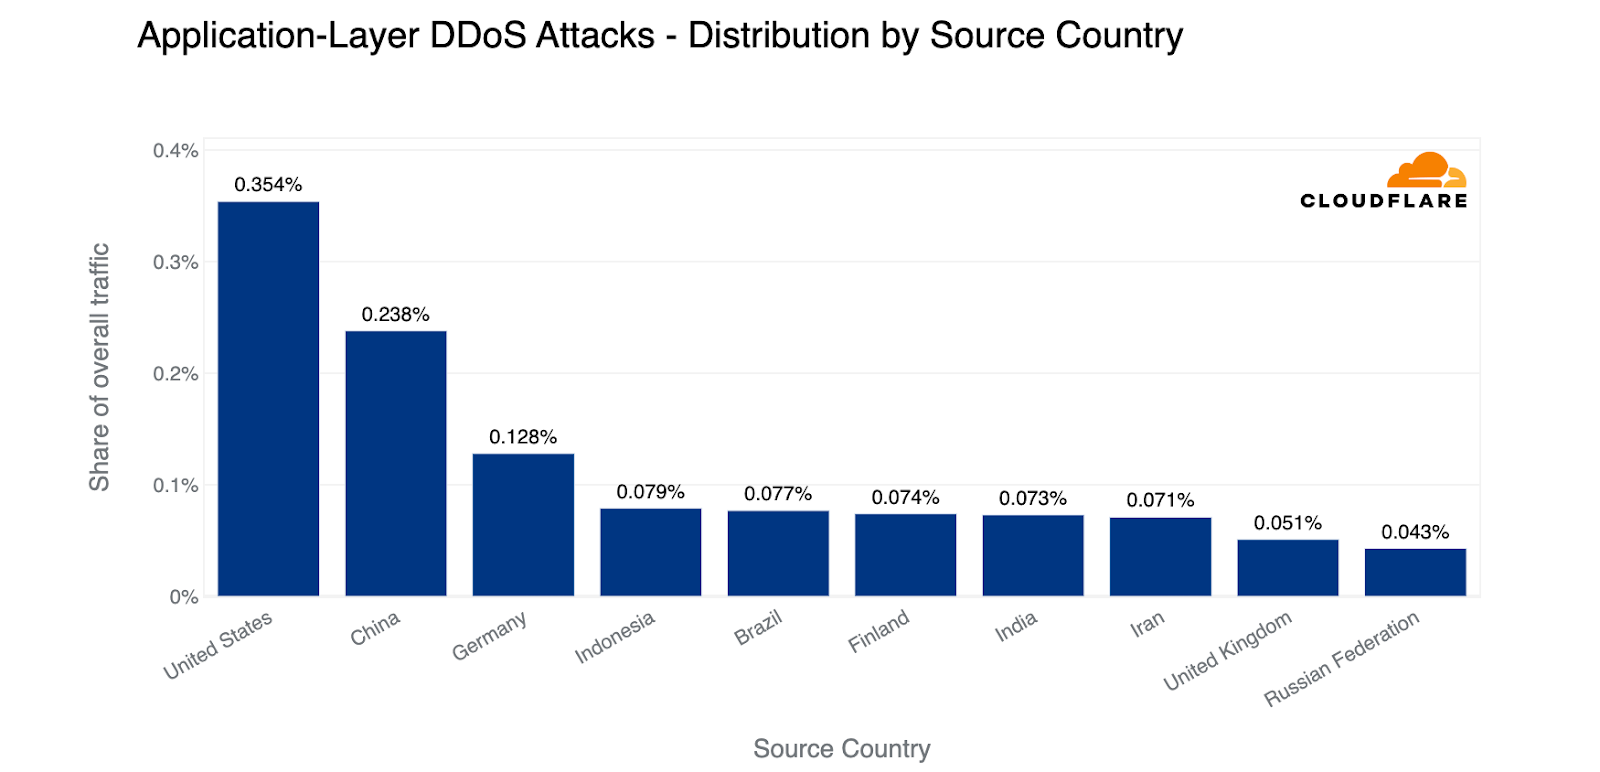
In terms of absolute volumes, the most HTTP DDoS attack traffic came from US IP addresses. China came in second, followed by Germany, Indonesia, Brazil, and Finland.
Top source countries of HTTP DDoS attacks (percentage of attack traffic out of the total traffic worldwide)
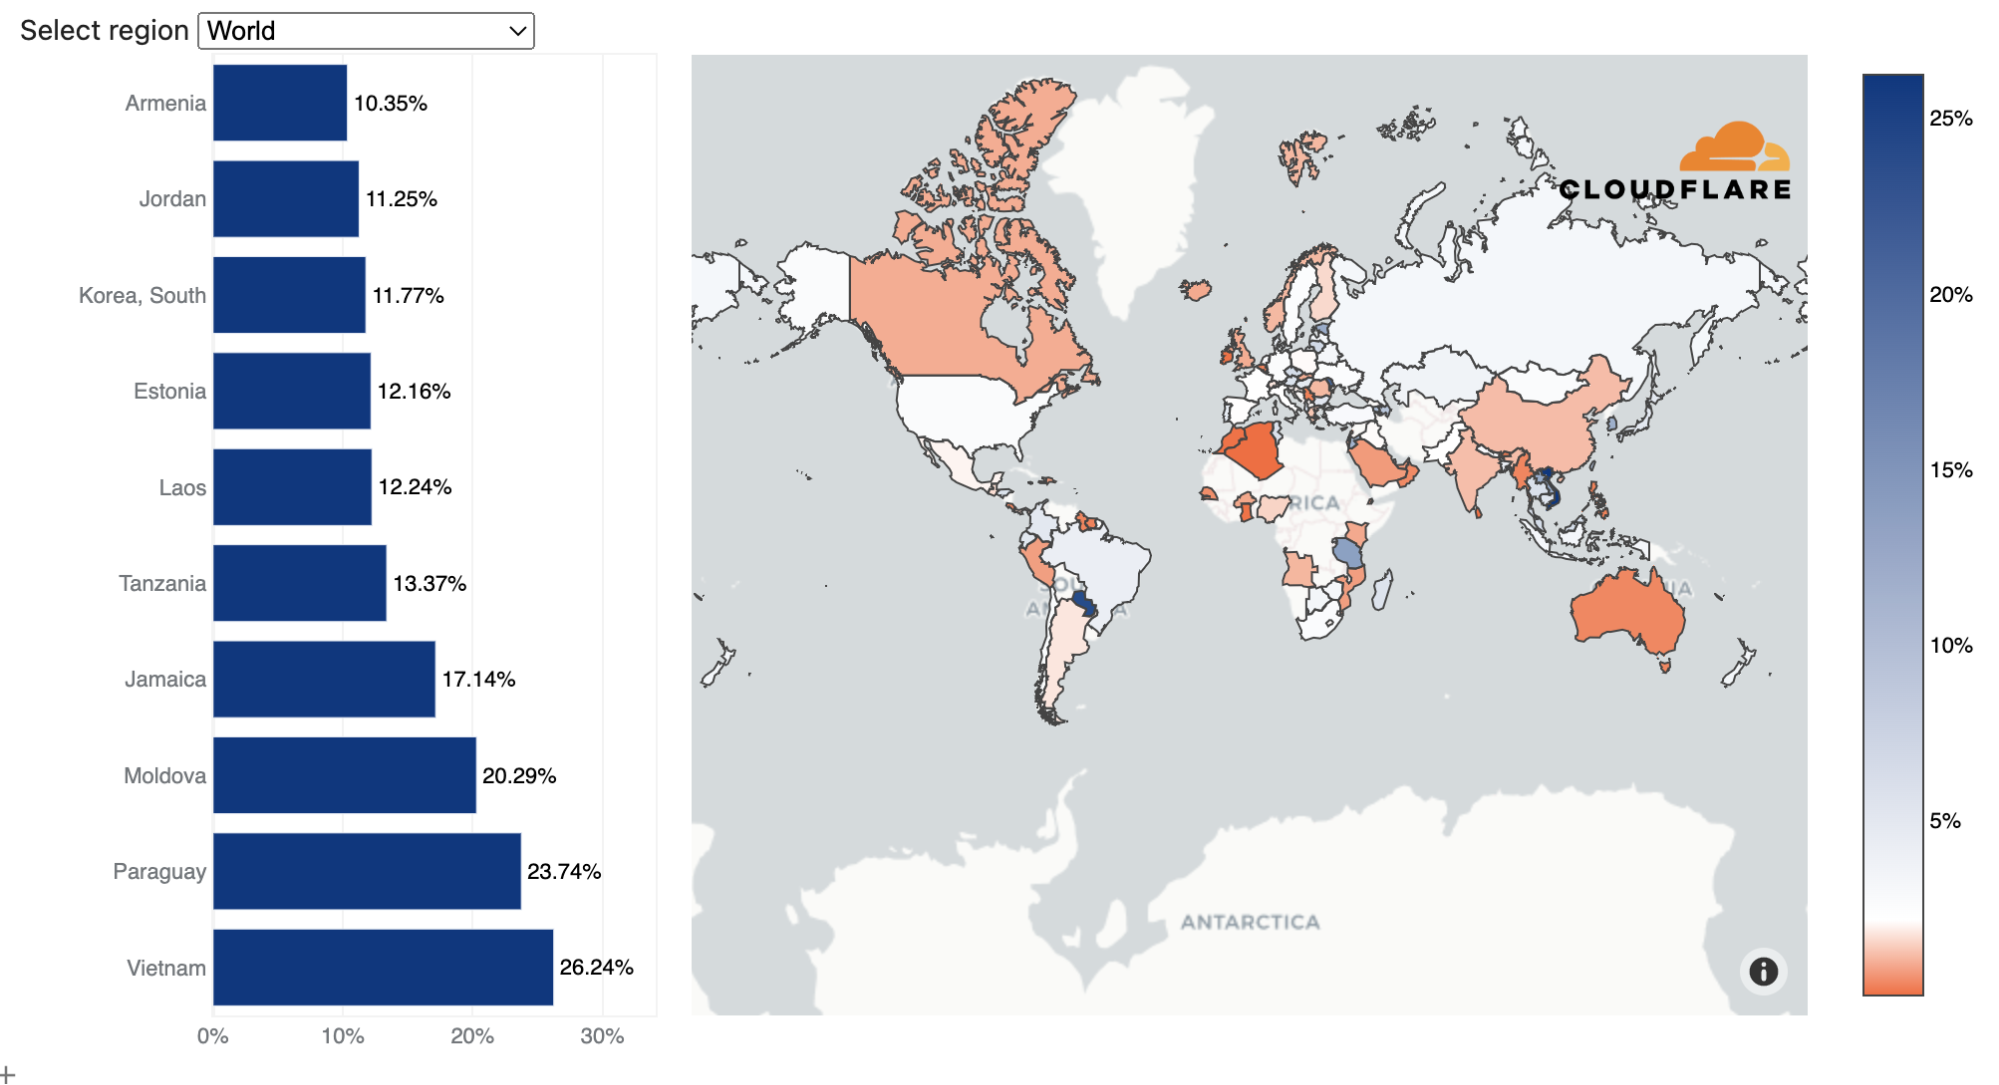
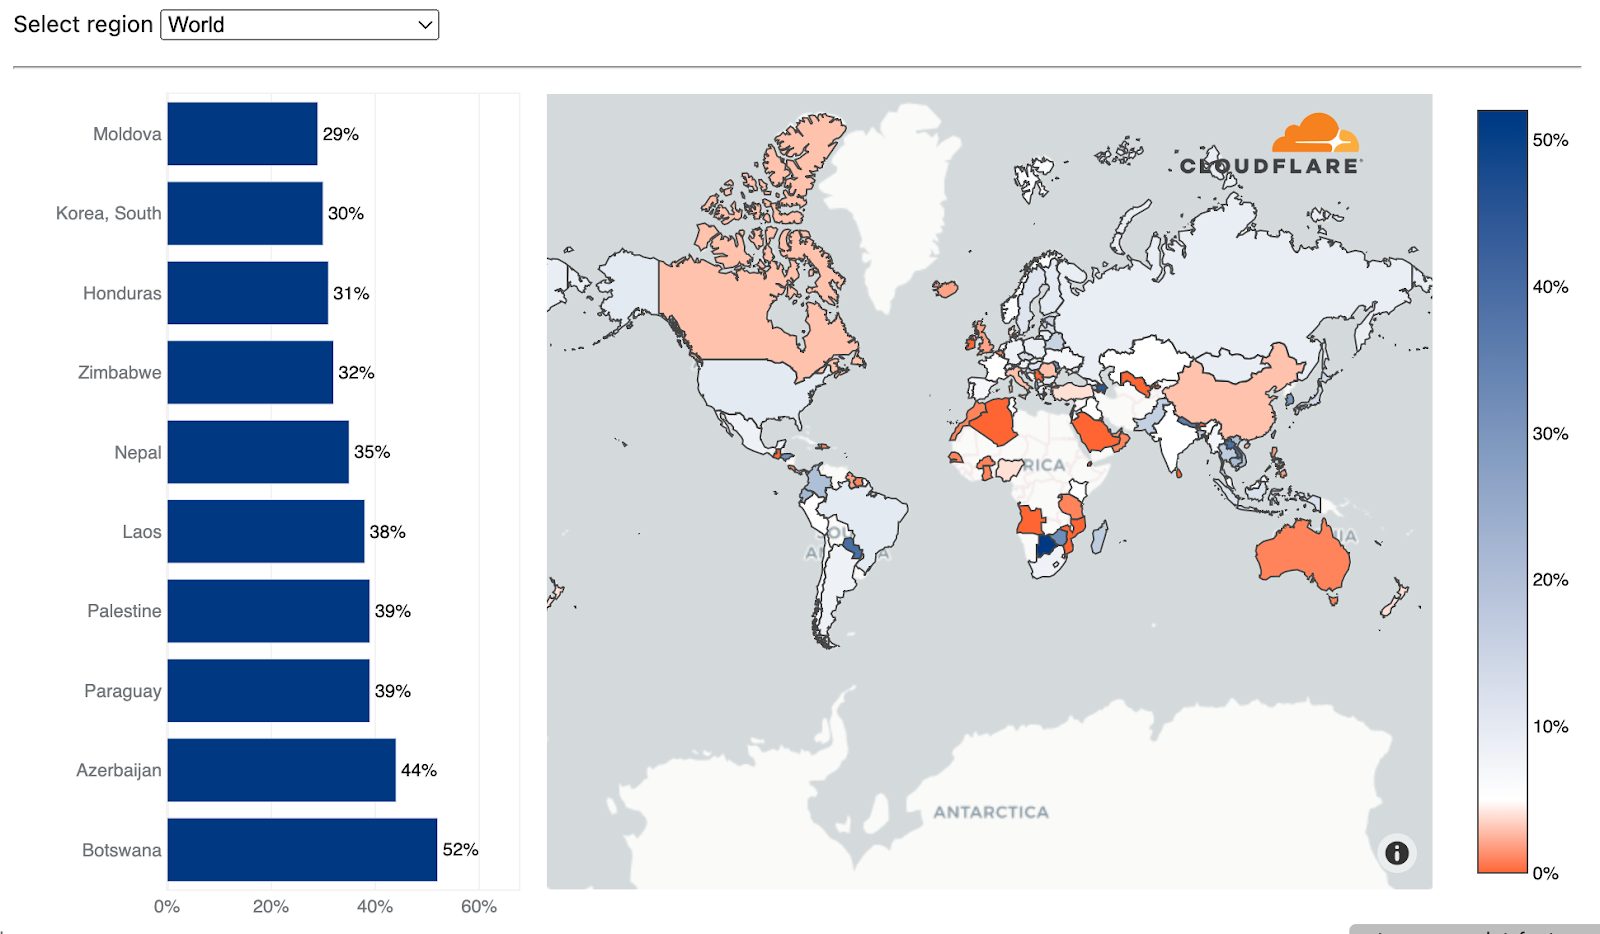
On the L3/4 side of things, Vietnam was the largest source of L3/4 DDoS attack traffic. Almost a third of all L3/4 traffic we ingested in our Vietnam data centers was attack traffic. Following Vietnam were Paraguay, Moldova, and Jamaica.
Top source countries of L3/4 DDoS attacks (percentage of attack traffic out of the total traffic per country)
What attack types and sizes we see
Attack size and duration
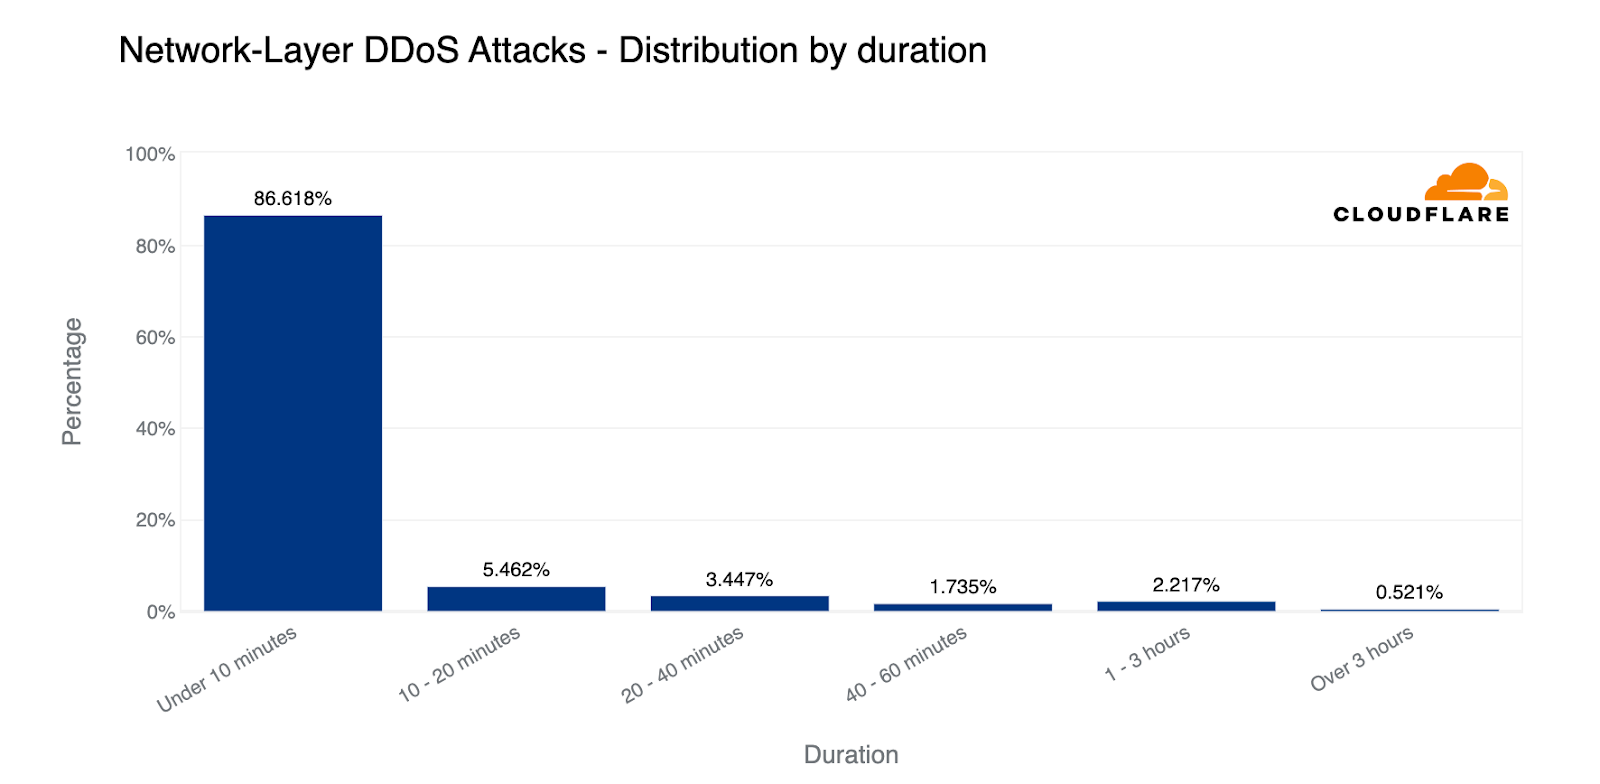
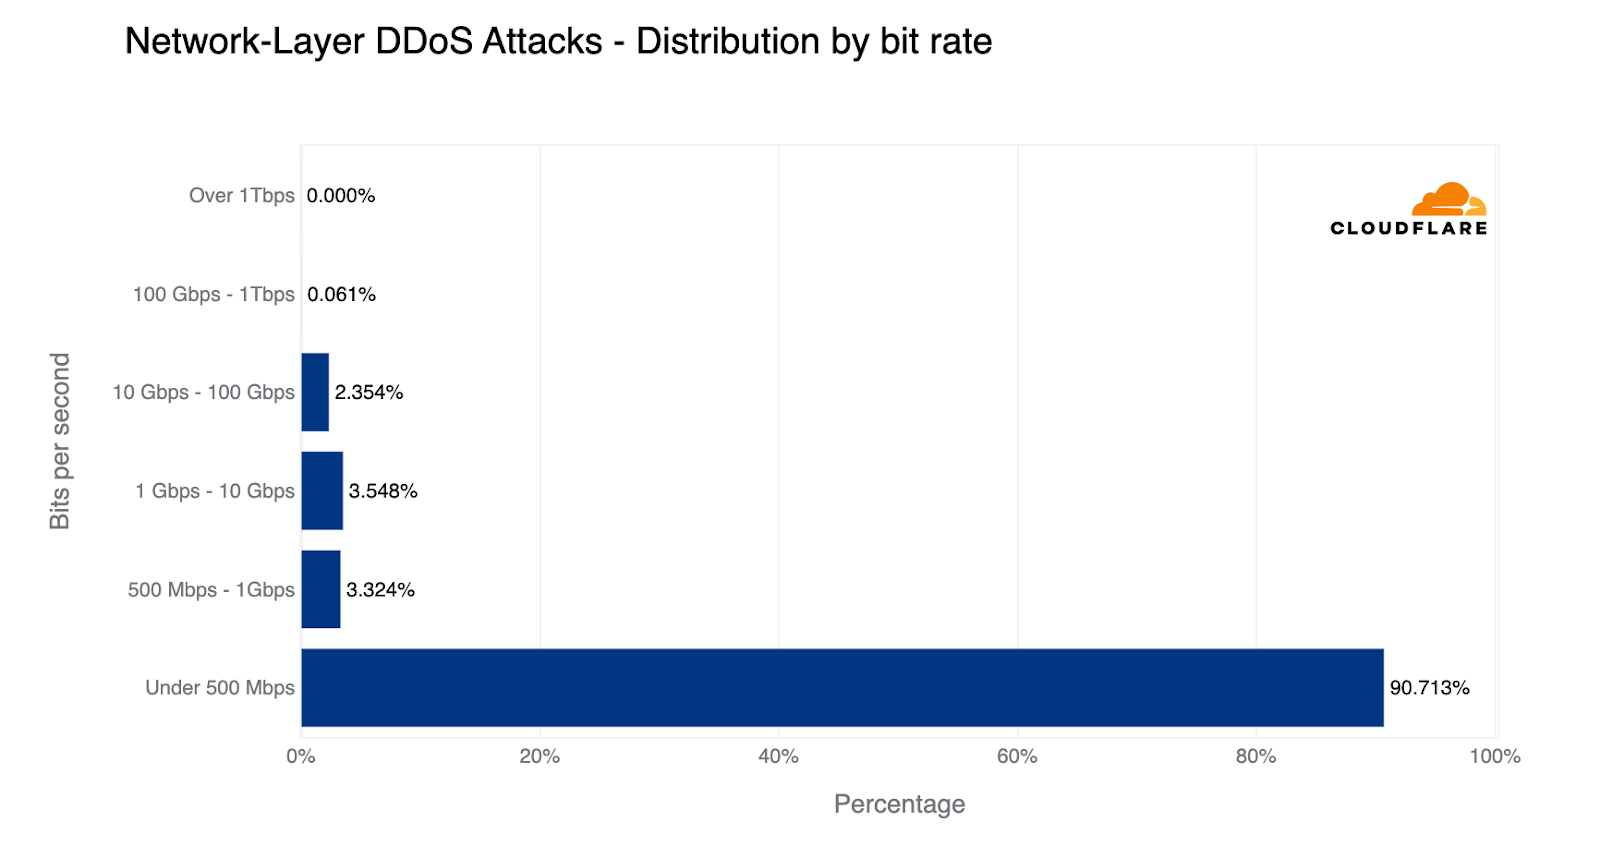
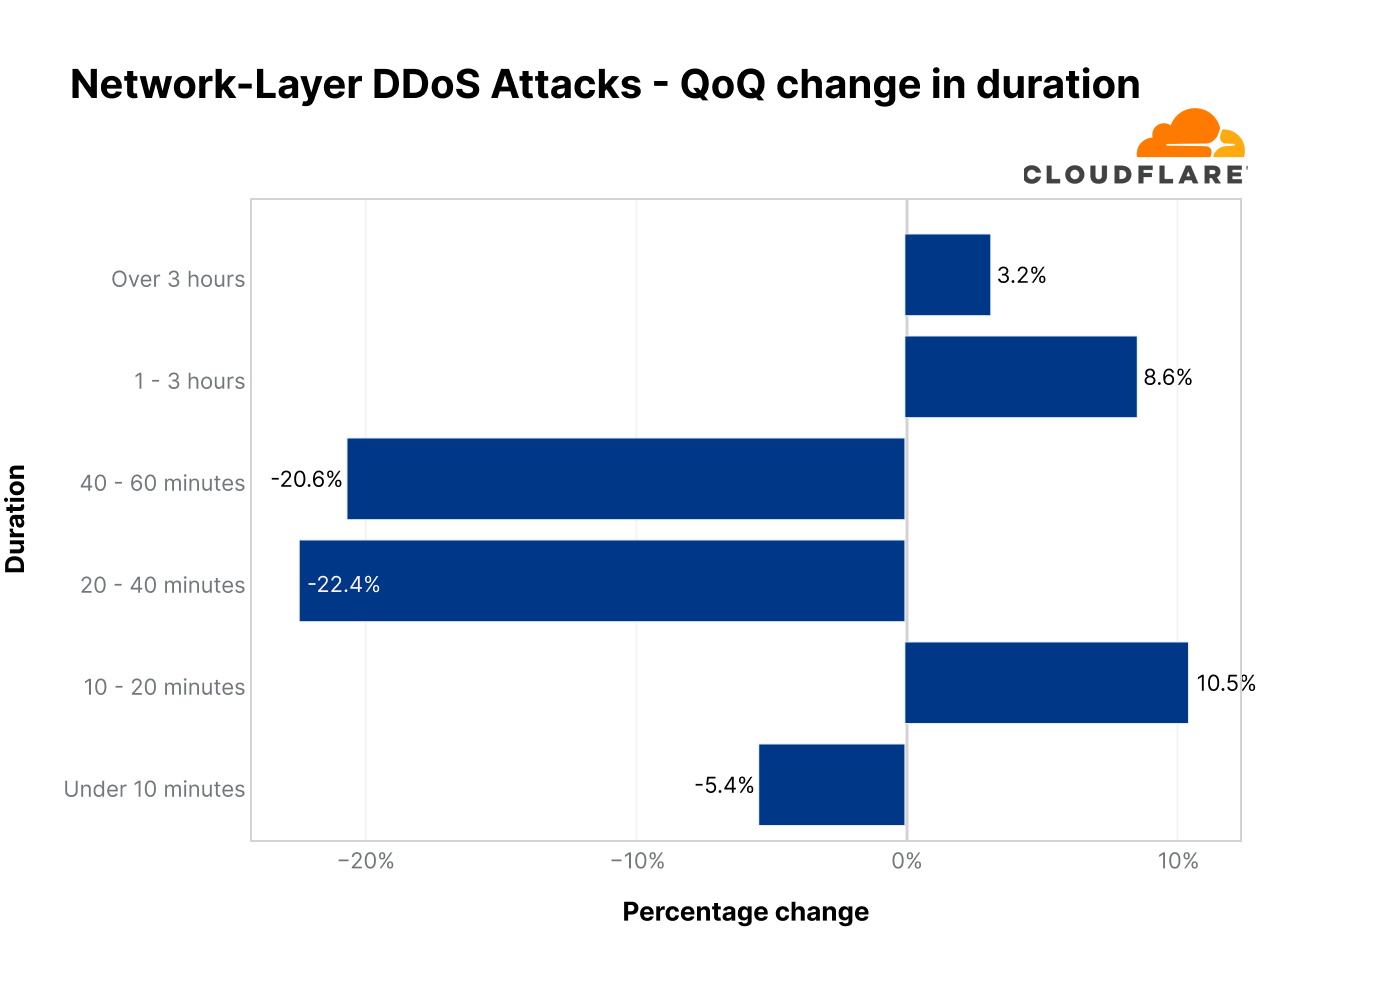
When looking at the types of attacks that are launched against our customers and our own network and applications, we can see that the majority of attacks are short and small; 86% of network-layer DDoS attacks end within 10 minutes, and 91% of attacks never exceed 500 Mbps.
Network-layer DDoS attacks by duration
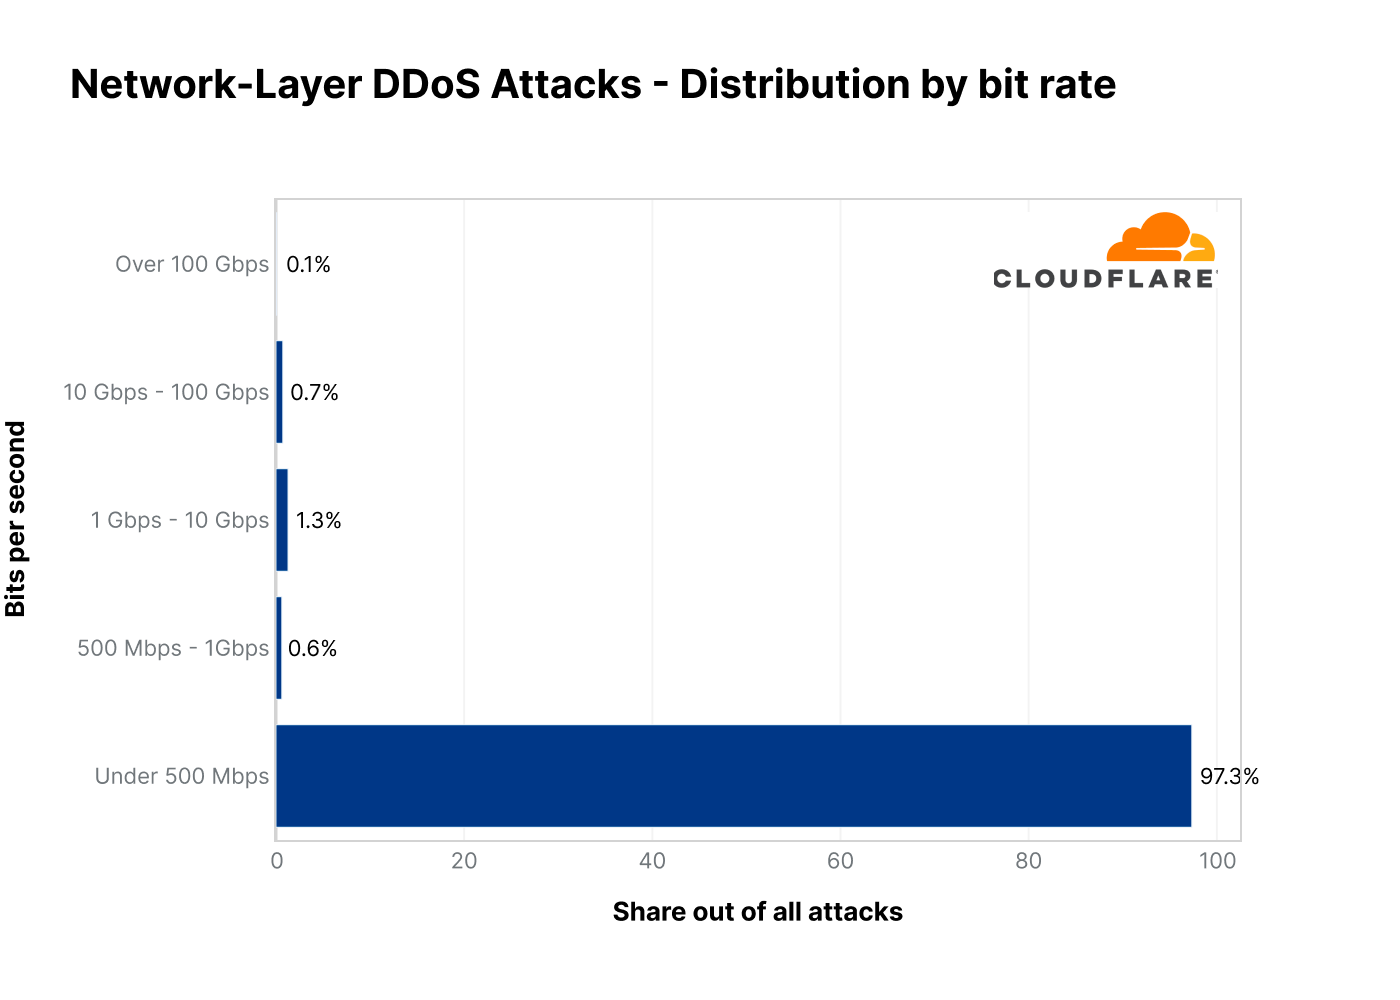
Only one out of every fifty attacks ever exceeds 10 Gbps, and only one out of every thousand attacks exceeds 100 Gbps.
Network-layer DDoS attacks by bitrate
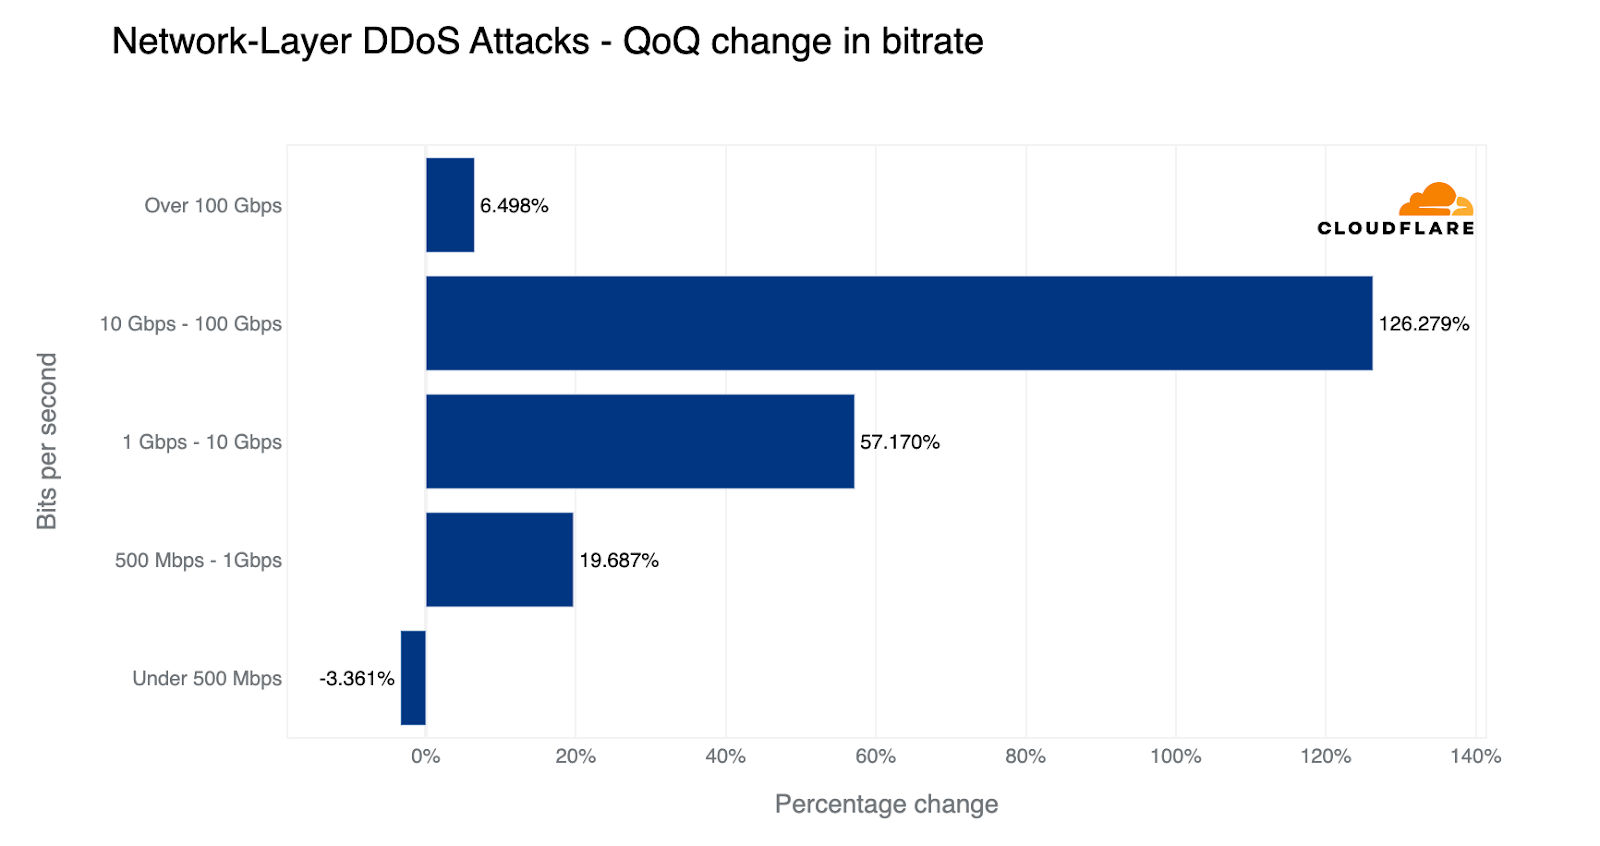
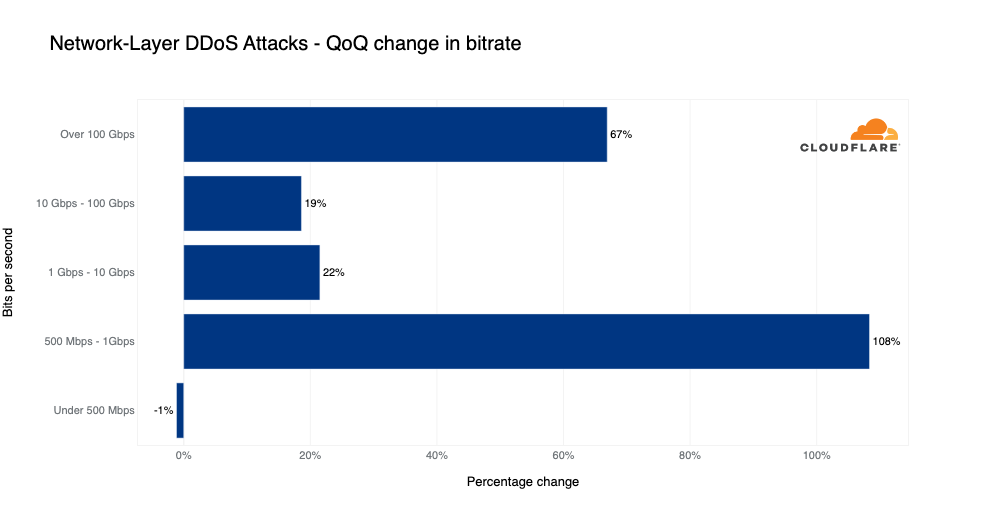
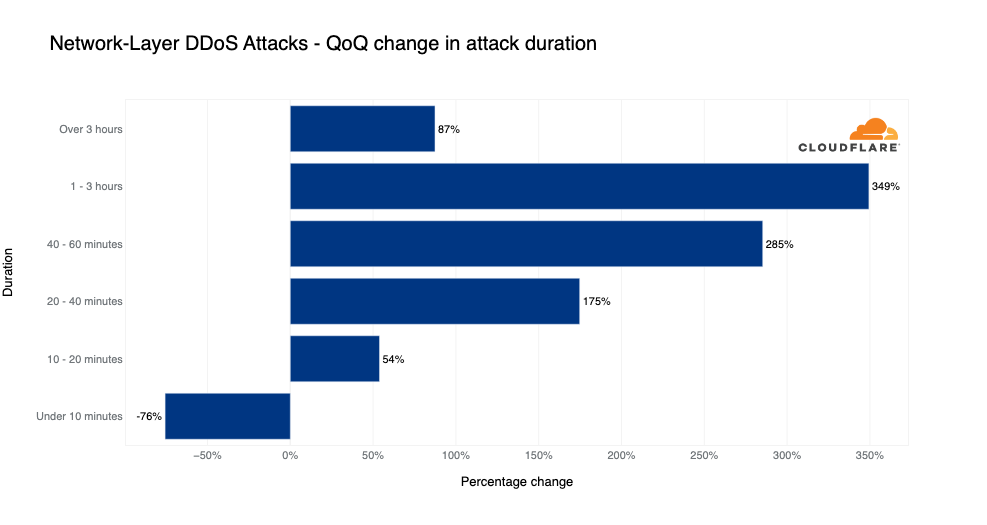
Having said that, larger attacks are slowly increasing in quantity and frequency. Last quarter, attacks exceeding 100 Gbps saw a 67% increase QoQ in their quantity. This quarter, the growth has slowed down a bit to 6%, but it’s still growing. In fact, there was an increase in all volumetric attacks excluding the ‘small’ bucket where the majority fall into — as visualized in the graph below. The largest growth was in the 10-100 Gbps range; an 89% increase QoQ.
Network-layer DDoS attacks by size: quarter-over-quarter change
Attack vectors
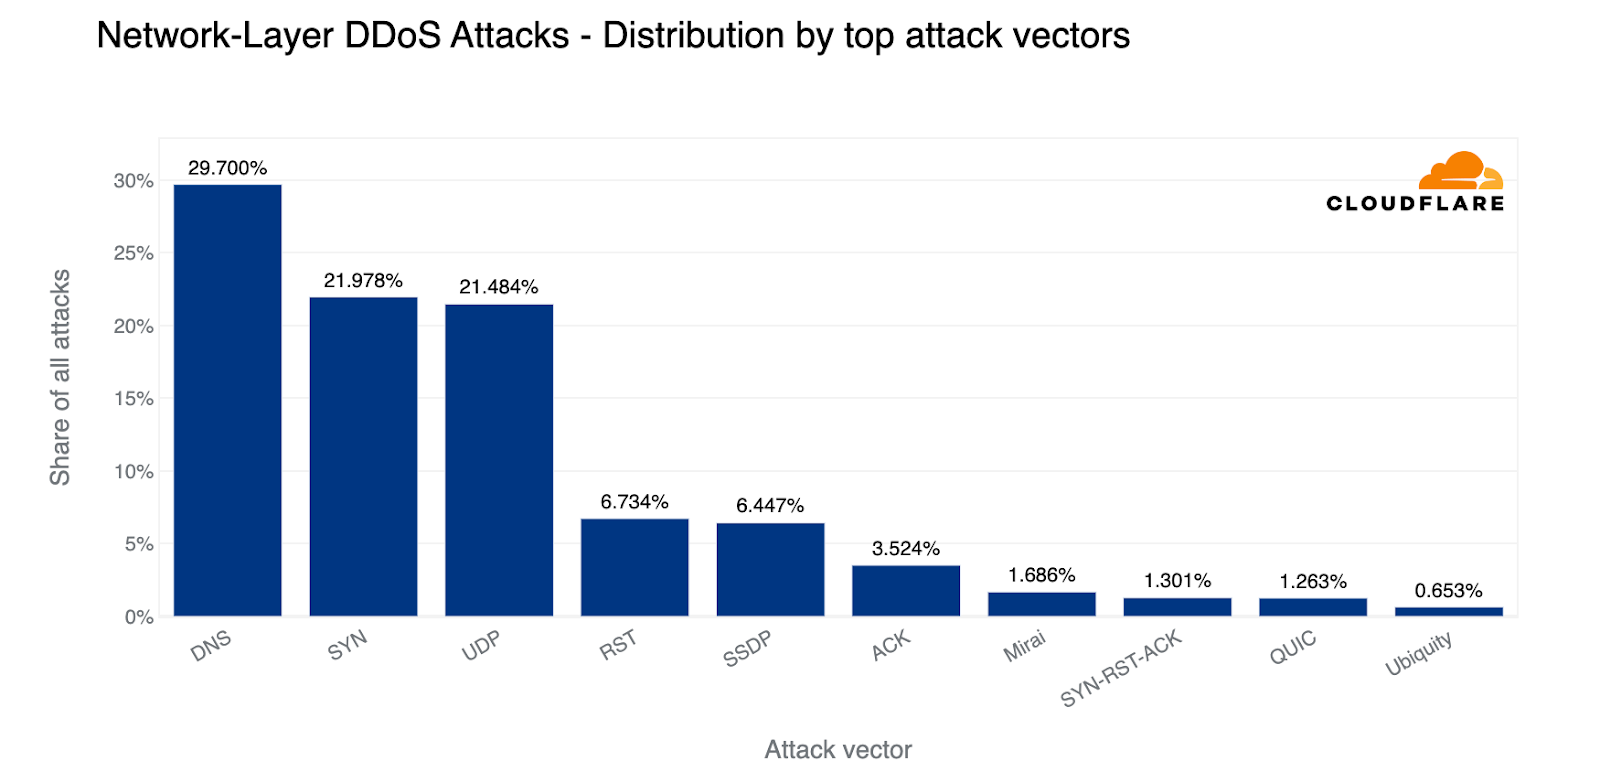
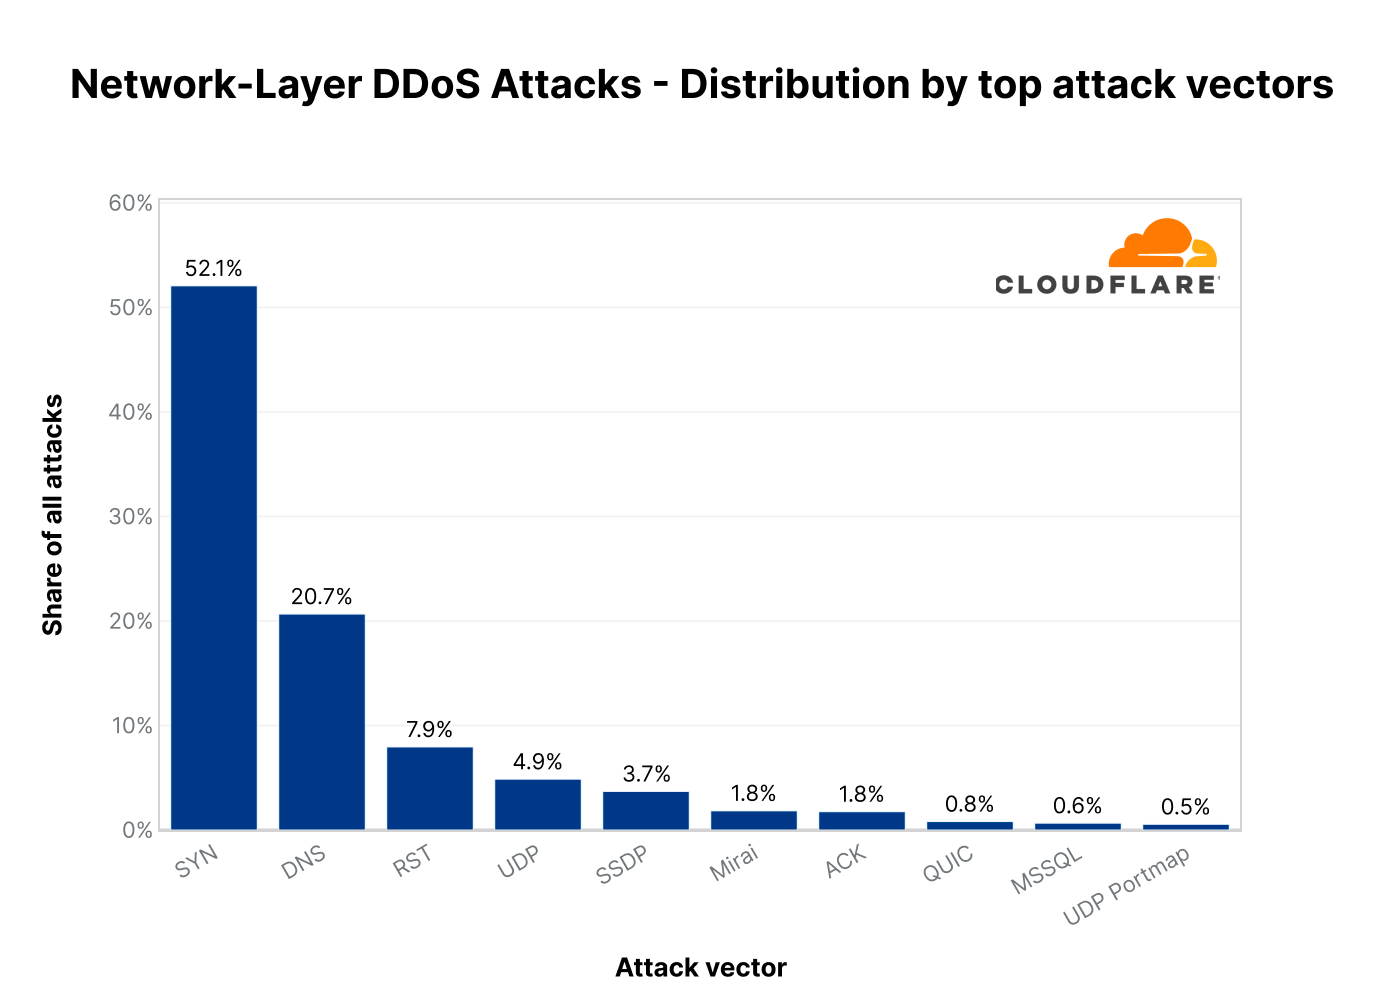
This quarter we saw a tectonic shift. With a 22% share, SYN floods scooched to the second place, making DNS-based DDoS attacks the most popular attack vector (30%). Almost a third of all L3/4 DDoS attacks were DNS-based; either DNS floods or DNS amplification/reflection attacks. Not far behind, UDP-based attacks came in third with a 21% share.
Top DDoS attack vectors
Emerging threats
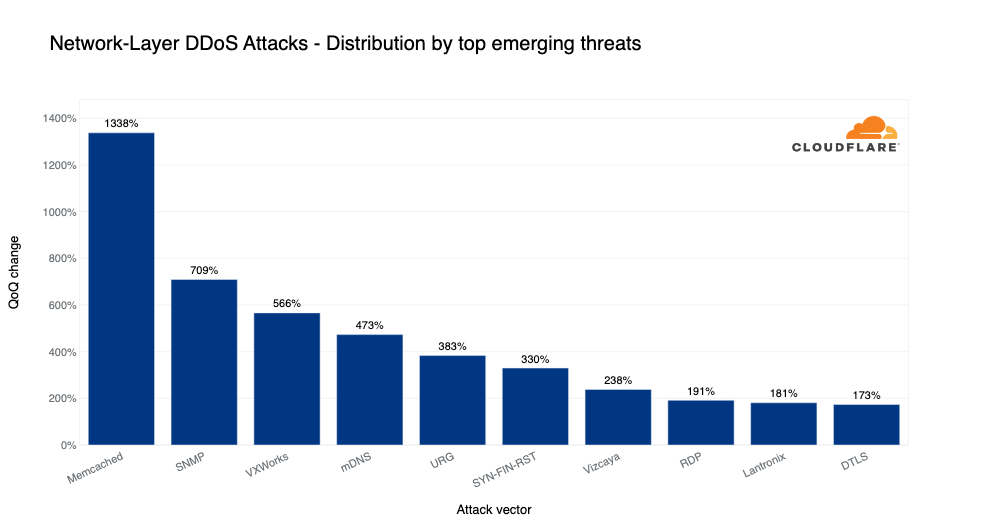
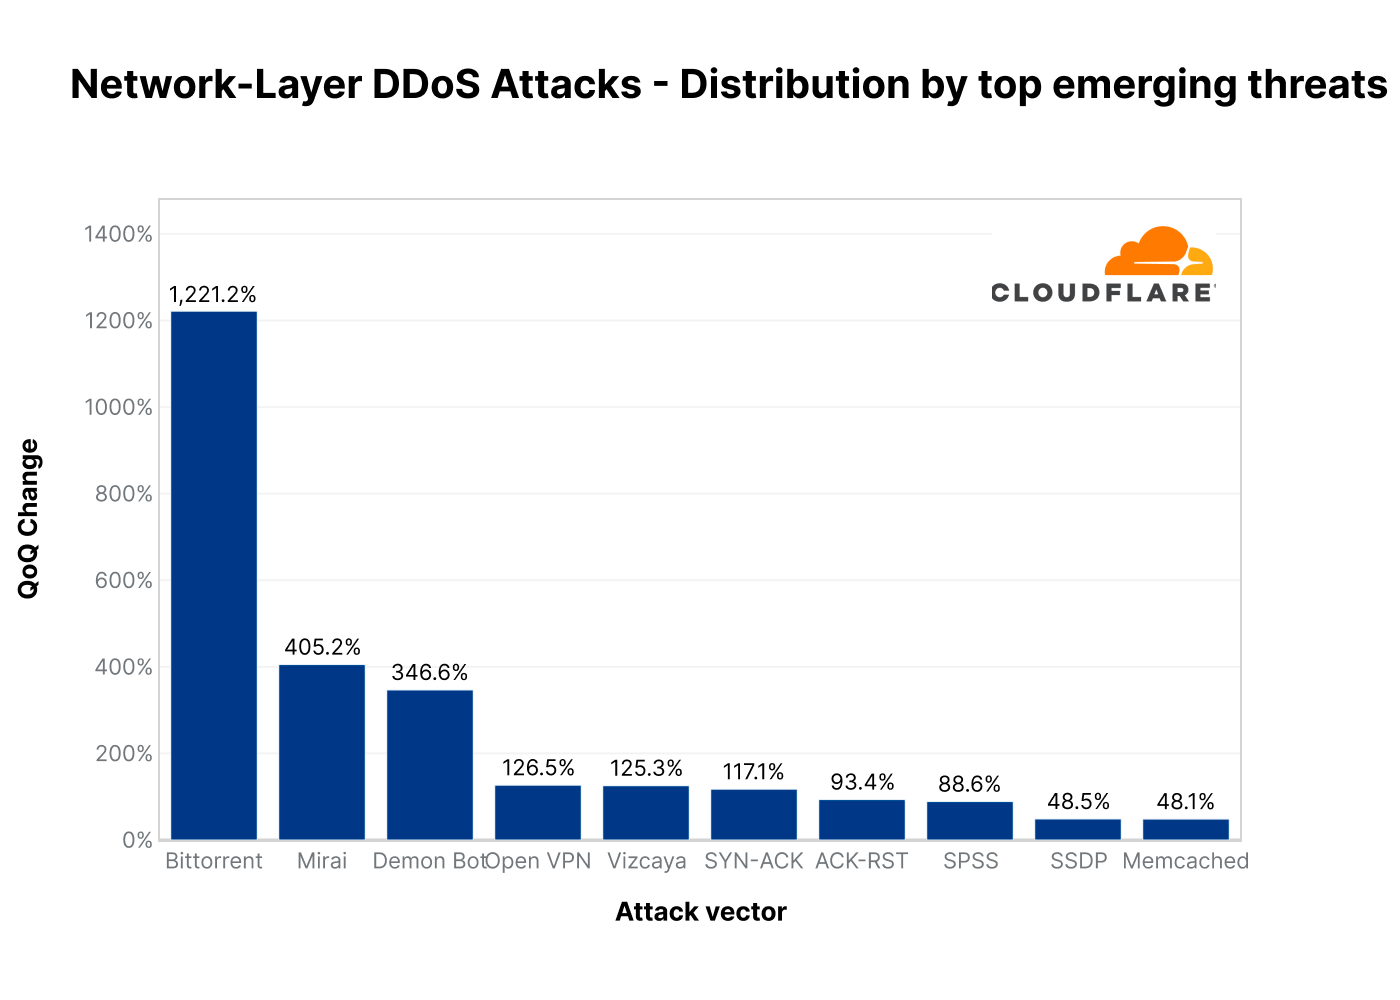
Every quarter we see the reemergence of old and sometimes even ancient attack vectors. What this tells us is that even decade-old vulnerabilities are still being exploited to launch attacks. Threat actors are recycling and reusing old methods — perhaps hoping that organizations have dropped those protections against older methods.
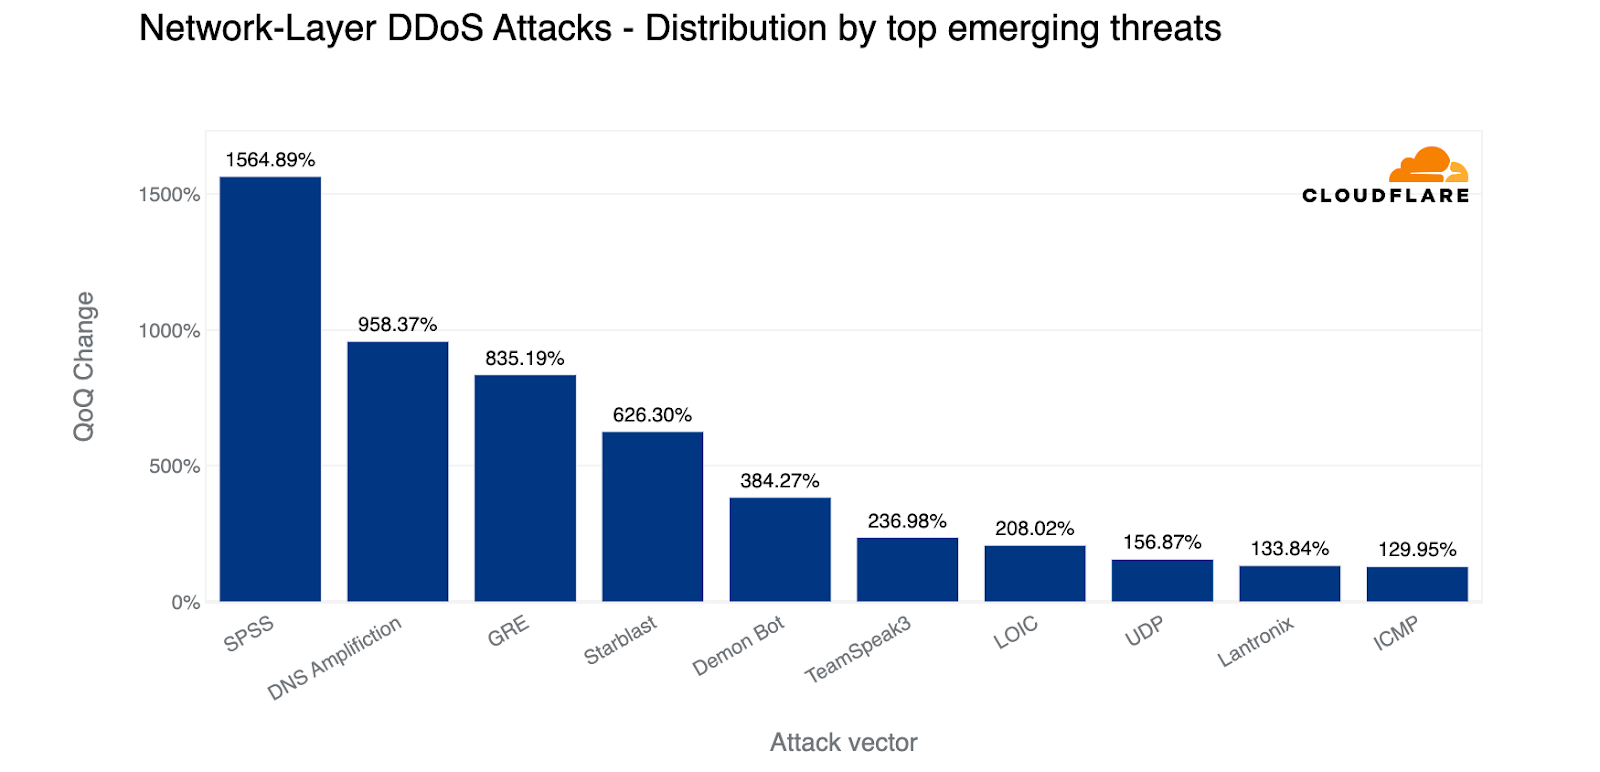
In the first quarter of 2023, there was a massive surge in SPSS-based DDoS attacks, DNS amplification attacks and GRE-based DDoS attacks.
Top DDoS emerging threats
SPSS-based DDoS attacks increased by 1,565% QoQ
The Statistical Product and Service Solutions (SPSS) is an IBM-developed software suite for use cases such as data management, business intelligence, and criminal investigation. The Sentinel RMS License Manager server is used to manage licensing for software products such as the IBM SPSS system. Back in 2021, two vulnerabilities (CVE-2021-22713 and CVE-2021-38153) were identified in the Sentinel RMS License Manager server which can be used to launch reflection DDoS attacks. Attackers can send large amounts of specially crafted license requests to the server, causing it to generate a response that is much larger than the original request. This response is sent back to the victim’s IP address, effectively amplifying the size of the attack and overwhelming the victim’s network with traffic. This type of attack is known as a reflection DDoS attack, and it can cause significant disruption to the availability of software products that rely on the Sentinel RMS License Manager, such as IBM SPSS Statistics. Applying the available patches to the license manager is essential to prevent these vulnerabilities from being exploited and to protect against reflection DDoS attacks.
DNS amplification DDoS attacks increased by 958% QoQ
DNS amplification attacks are a type of DDoS attack that involves exploiting vulnerabilities in the Domain Name System (DNS) infrastructure to generate large amounts of traffic directed at a victim’s network. Attackers send DNS requests to open DNS resolvers that have been misconfigured to allow recursive queries from any source, and use these requests to generate responses that are much larger than the original query. The attackers then spoof the victim’s IP address, causing the large responses to be directed at the victim’s network, overwhelming it with traffic and causing a denial of service. The challenge of mitigating DNS amplification attacks is that the attack traffic can be difficult to distinguish from legitimate traffic, making it difficult to block at the network level. To mitigate DNS amplification attacks, organizations can take steps such as properly configuring DNS resolvers, implementing rate-limiting techniques, and using traffic filtering tools to block traffic from known attack sources.
GRE-based DDoS attacks increased by 835% QoQ
GRE-based DDoS attacks involve using the Generic Routing Encapsulation (GRE) protocol to flood a victim’s network with large amounts of traffic. Attackers create multiple GRE tunnels between compromised hosts to send traffic to the victim’s network. These attacks are difficult to detect and filter, as the traffic appears as legitimate traffic on the victim’s network. Attackers can also use source IP address spoofing to make it appear that the traffic is coming from legitimate sources, making it difficult to block at the network level. GRE-based DDoS attacks pose several risks to targeted organizations, including downtime, disruption of business operations, and potential data theft or network infiltration. Mitigating these attacks requires the use of advanced traffic filtering tools that can detect and block attack traffic based on its characteristics, as well as techniques such as rate limiting and source IP address filtering to block traffic from known attack sources.
The DDoS threat landscape
In recent months, there has been an increase in longer and larger DDoS attacks across various industries, with volumetric attacks being particularly prominent. Non-profit and Broadcast Media companies were some of the top targeted industries. DNS DDoS attacks also became increasingly prevalent.
As DDoS attacks are typically carried out by bots, automated detection and mitigation are crucial for effective defense. Cloudflare’s automated systems provide constant protection against DDoS attacks for our customers, allowing them to focus on other aspects of their business. We believe that DDoS protection should be easily accessible to organizations of all sizes, and have been offering free and unlimited protection since 2017.
At Cloudflare, our mission is to help build a better Internet — one that is more secure and faster Internet for all.
We invite you to join our DDoS Trends Webinar to learn more about emerging threats and effective defense strategies.
A note about methodologies
How we calculate Ransom DDoS attack insights Cloudflare’s systems constantly analyze traffic and automatically apply mitigation when DDoS attacks are detected. Each attacked customer is prompted with an automated survey to help us better understand the nature of the attack and the success of the mitigation. For over two years, Cloudflare has been surveying attacked customers. One of the questions in the survey asks the respondents if they received a threat or a ransom note. Over the past two years, on average, we collected 164 responses per quarter. The responses of this survey are used to calculate the percentage of Ransom DDoS attacks.
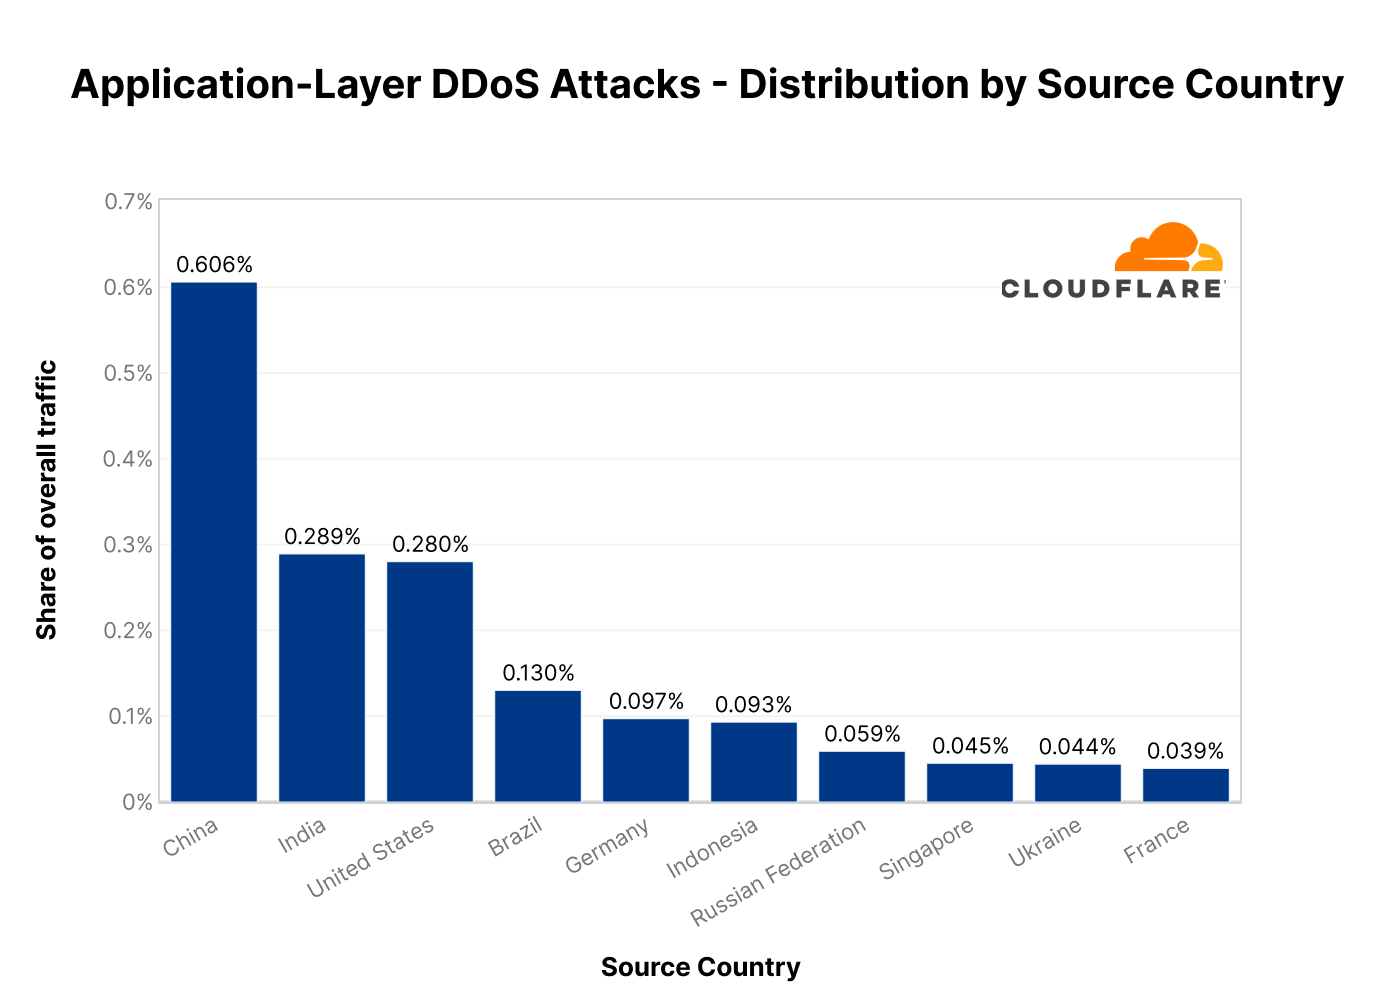
How we calculate geographical and industry insights Source country At the application-layer, we use the attacking IP addresses to understand the origin country of the attacks. That is because at that layer, IP addresses cannot be spoofed (i.e., altered). However, at the network layer, source IP addresses can be spoofed. So, instead of relying on IP addresses to understand the source, we instead use the location of our data centers where the attack packets were ingested. We’re able to get geographical accuracy due to our large global coverage in over 285 locations around the world.
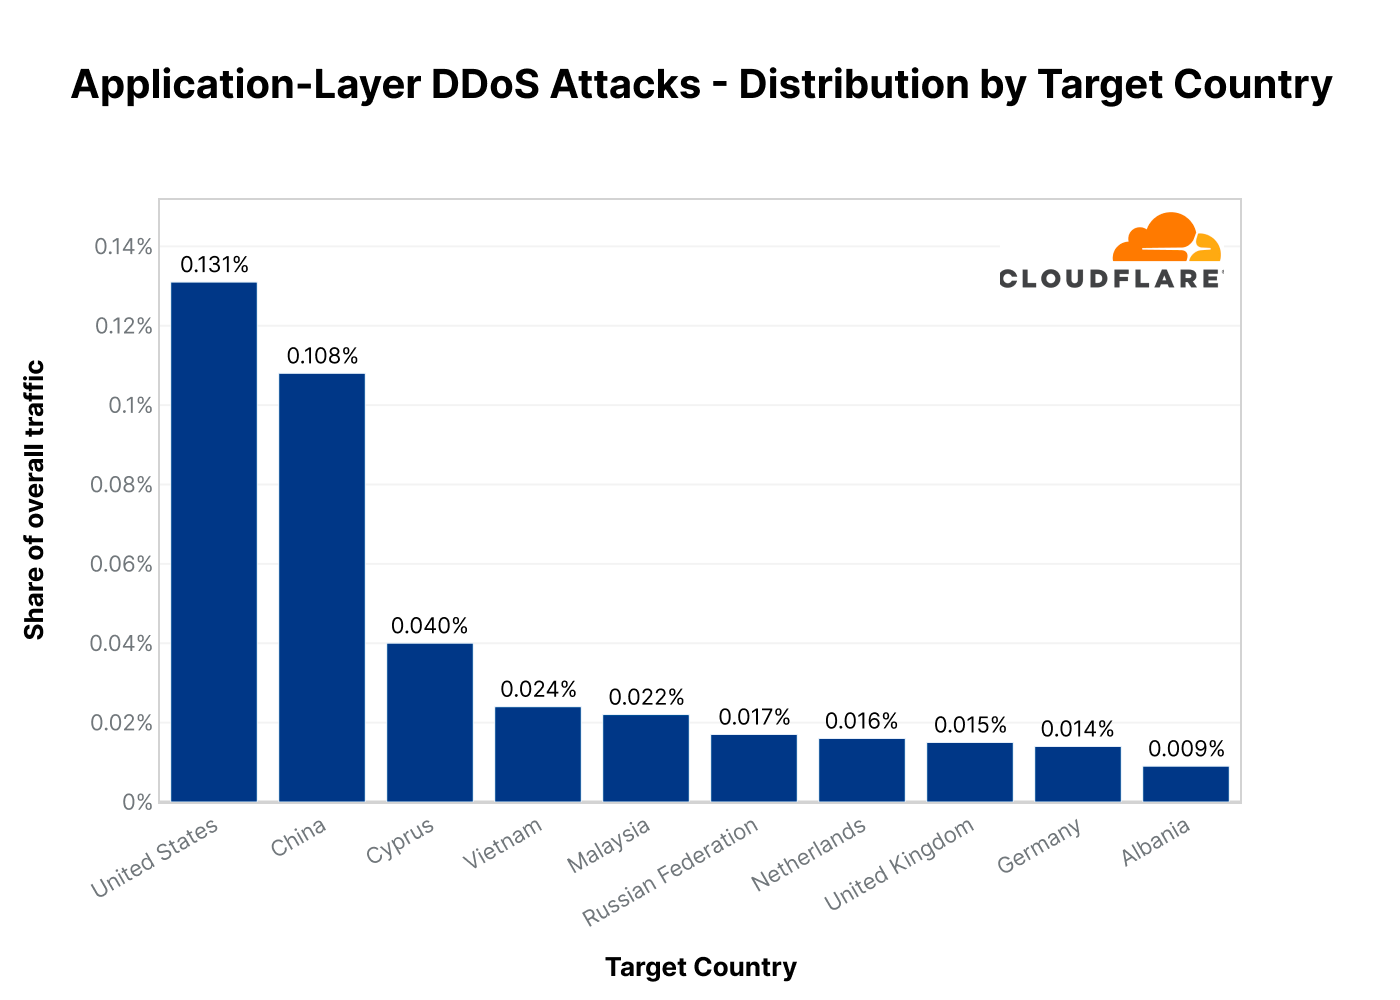
Target country For both application-layer and network-layer DDoS attacks, we group attacks and traffic by our customers’ billing country. This lets us understand which countries are subject to more attacks.
Target industry For both application-layer and network-layer DDoS attacks, we group attacks and traffic by our customers’ industry according to our customer relations management system. This lets us understand which industries are subject to more attacks.
Total volume vs. percentage For both source and target insights, we look at the total volume of attack traffic compared to all traffic as one data point. Additionally, we also look at the percentage of attack traffic towards or from a specific country, to a specific country or to a specific industry. This gives us an “attack activity rate” for a given country/industry which is normalized by their total traffic levels. This helps us remove biases of a country or industry that normally receives a lot of traffic and therefore a lot of attack traffic as well.
How we calculate attack characteristics To calculate the attack size, duration, attack vectors and emerging threats, we bucket attacks and then provide the share of each bucket out of the total amount for each dimension.
General disclaimer and clarification When we describe ‘top countries’ as the source or target of attacks, it does not necessarily mean that that country was attacked as a country, but rather that organizations that use that country as their billing country were targeted by attacks. Similarly, attacks originating from a country does not mean that that country launched the attacks, but rather that the attack was launched from IP addresses that have been mapped to that country. Threat actors operate global botnets with nodes all over the world, and in many cases also use Virtual Private Networks and proxies to obfuscate their true location. So if anything, the source country could indicate the presence of exit nodes or botnet nodes within that country.
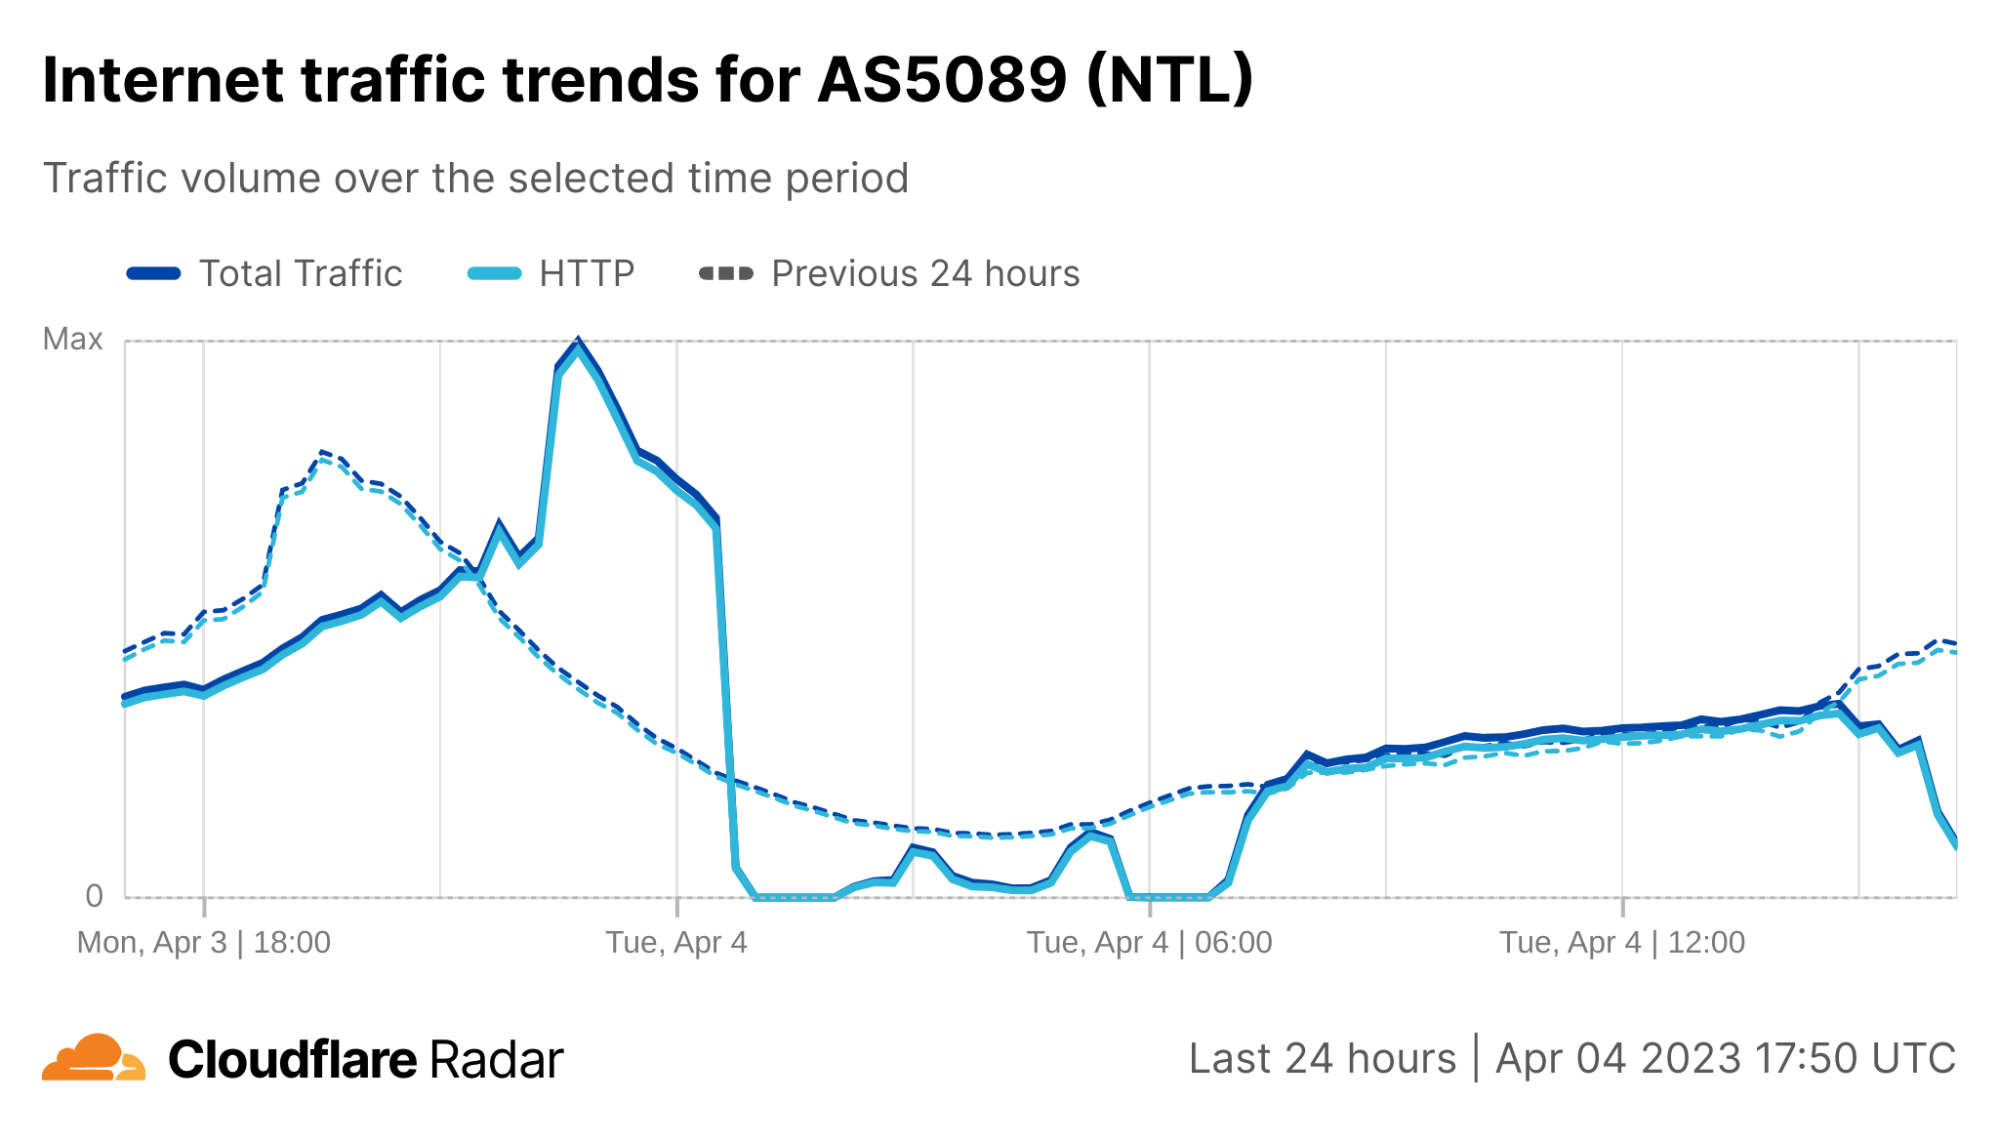
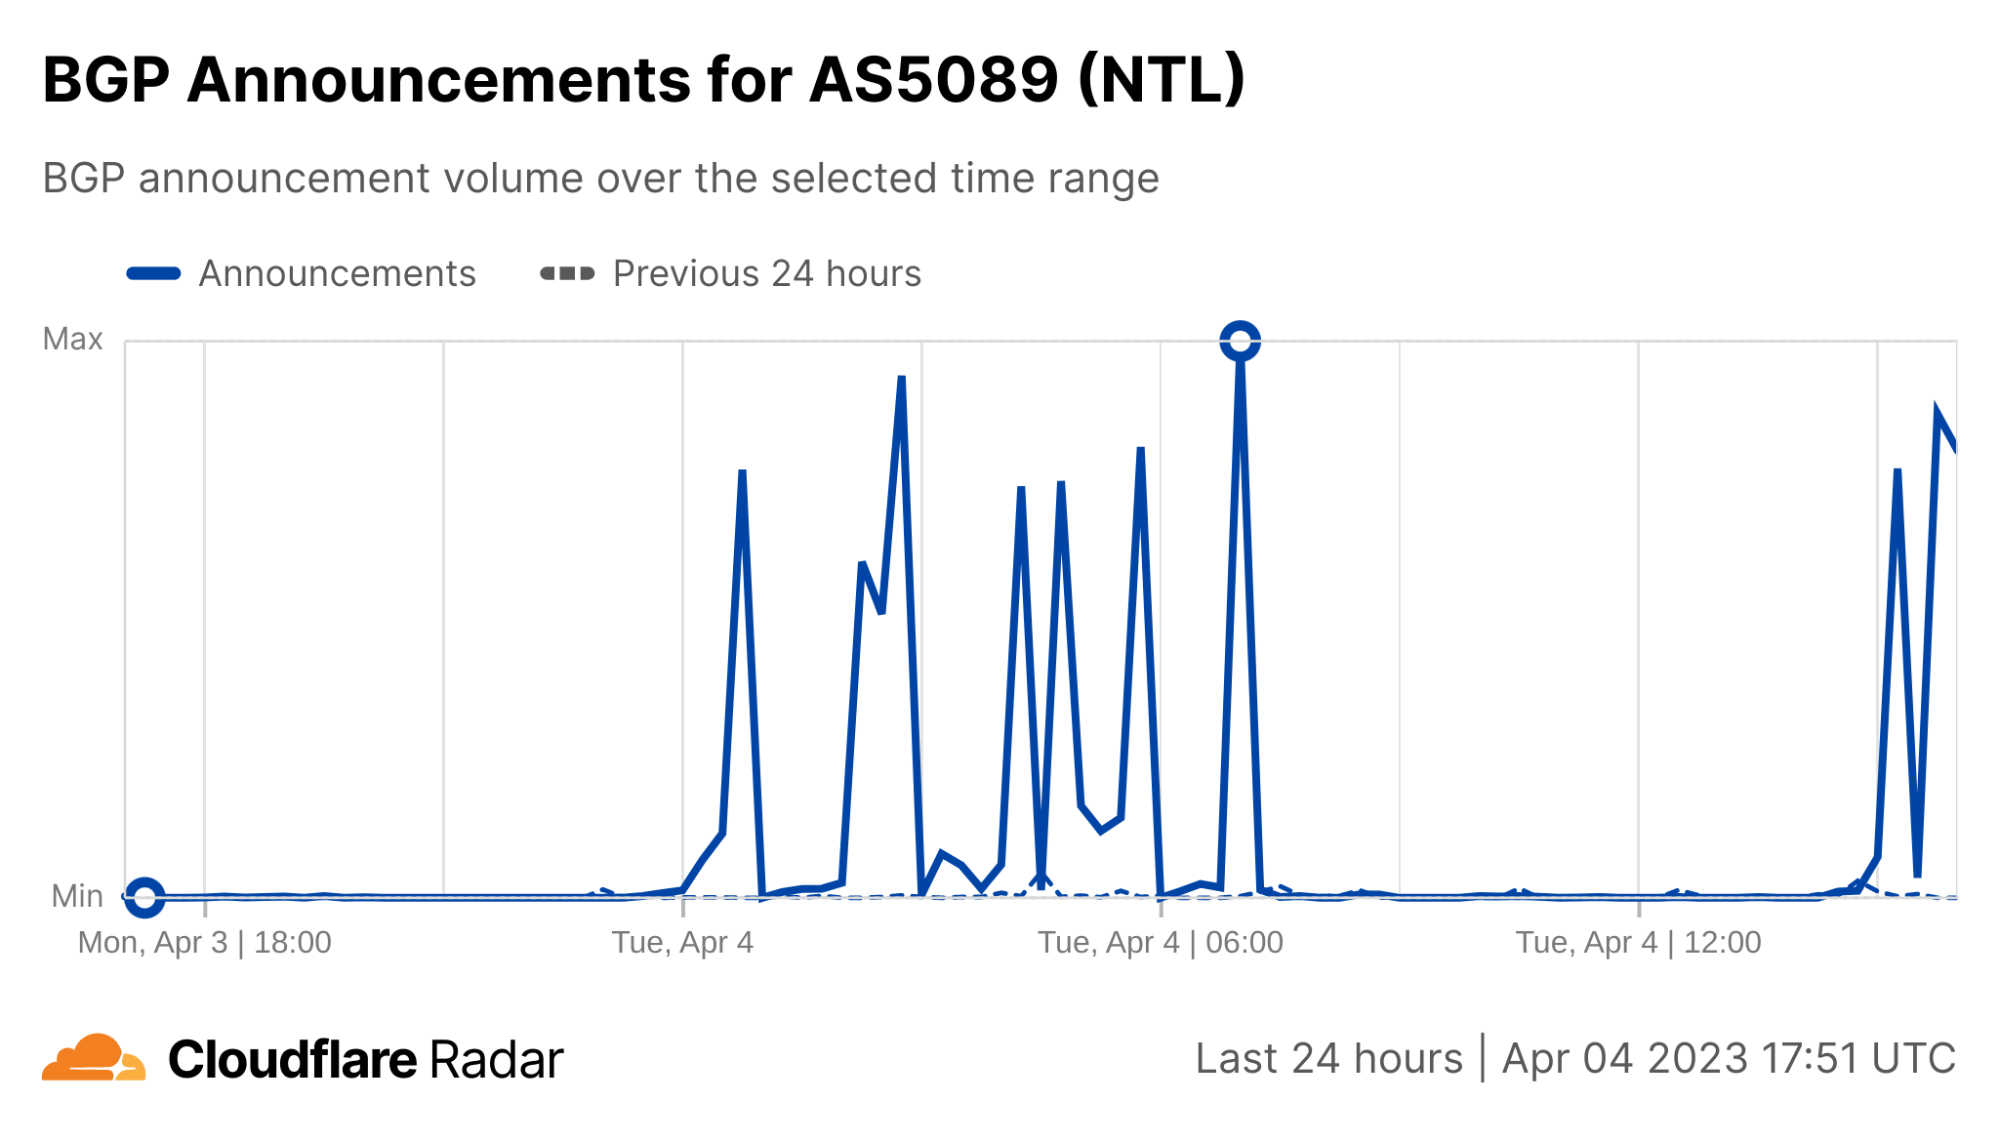
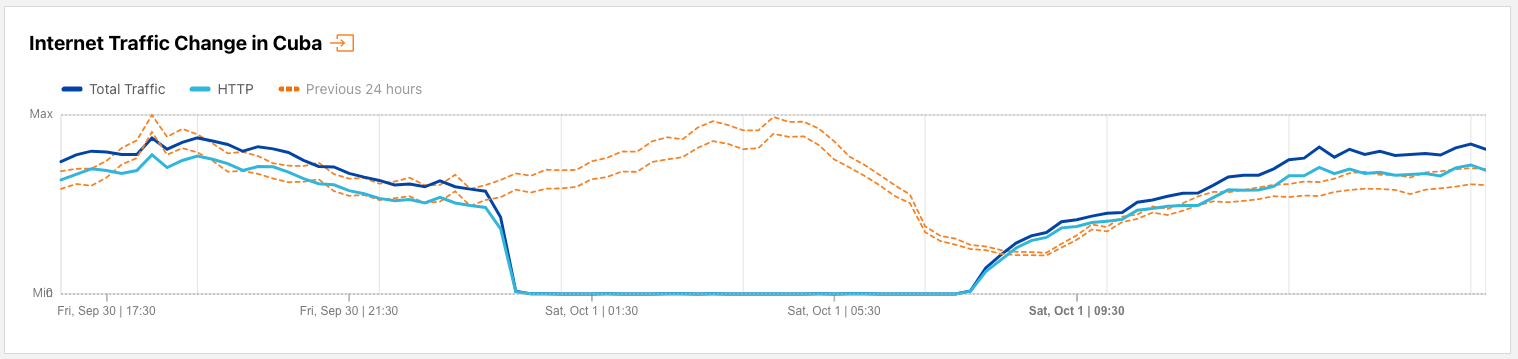
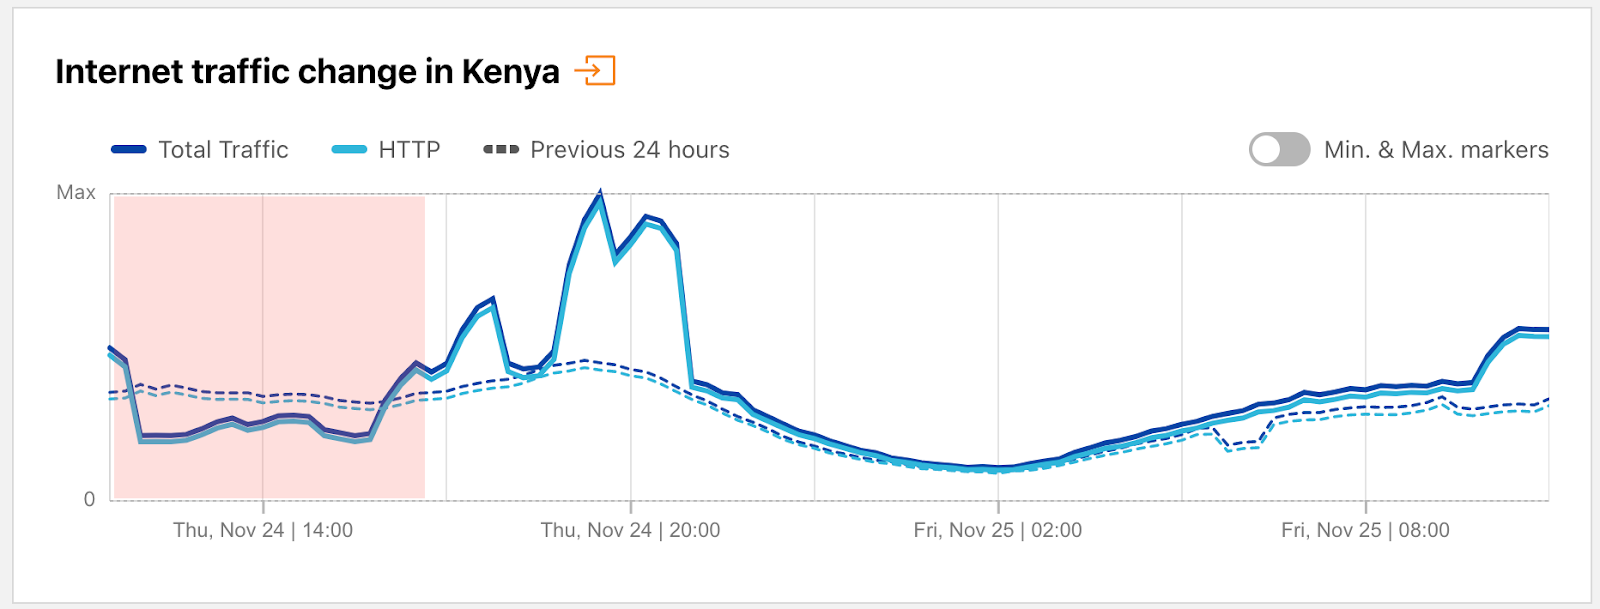
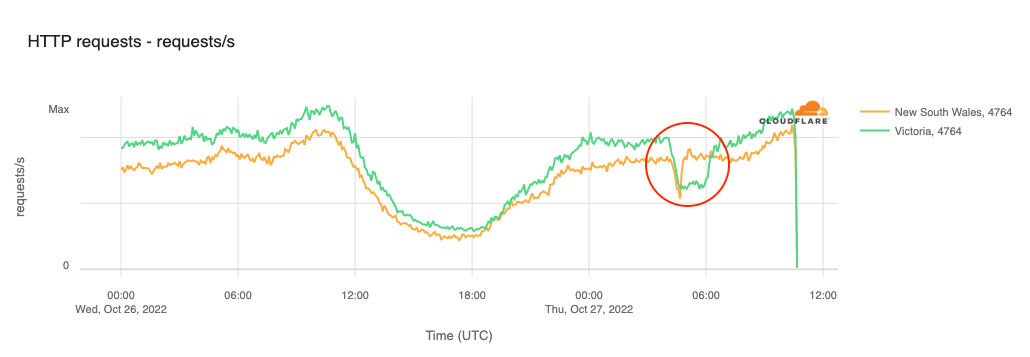
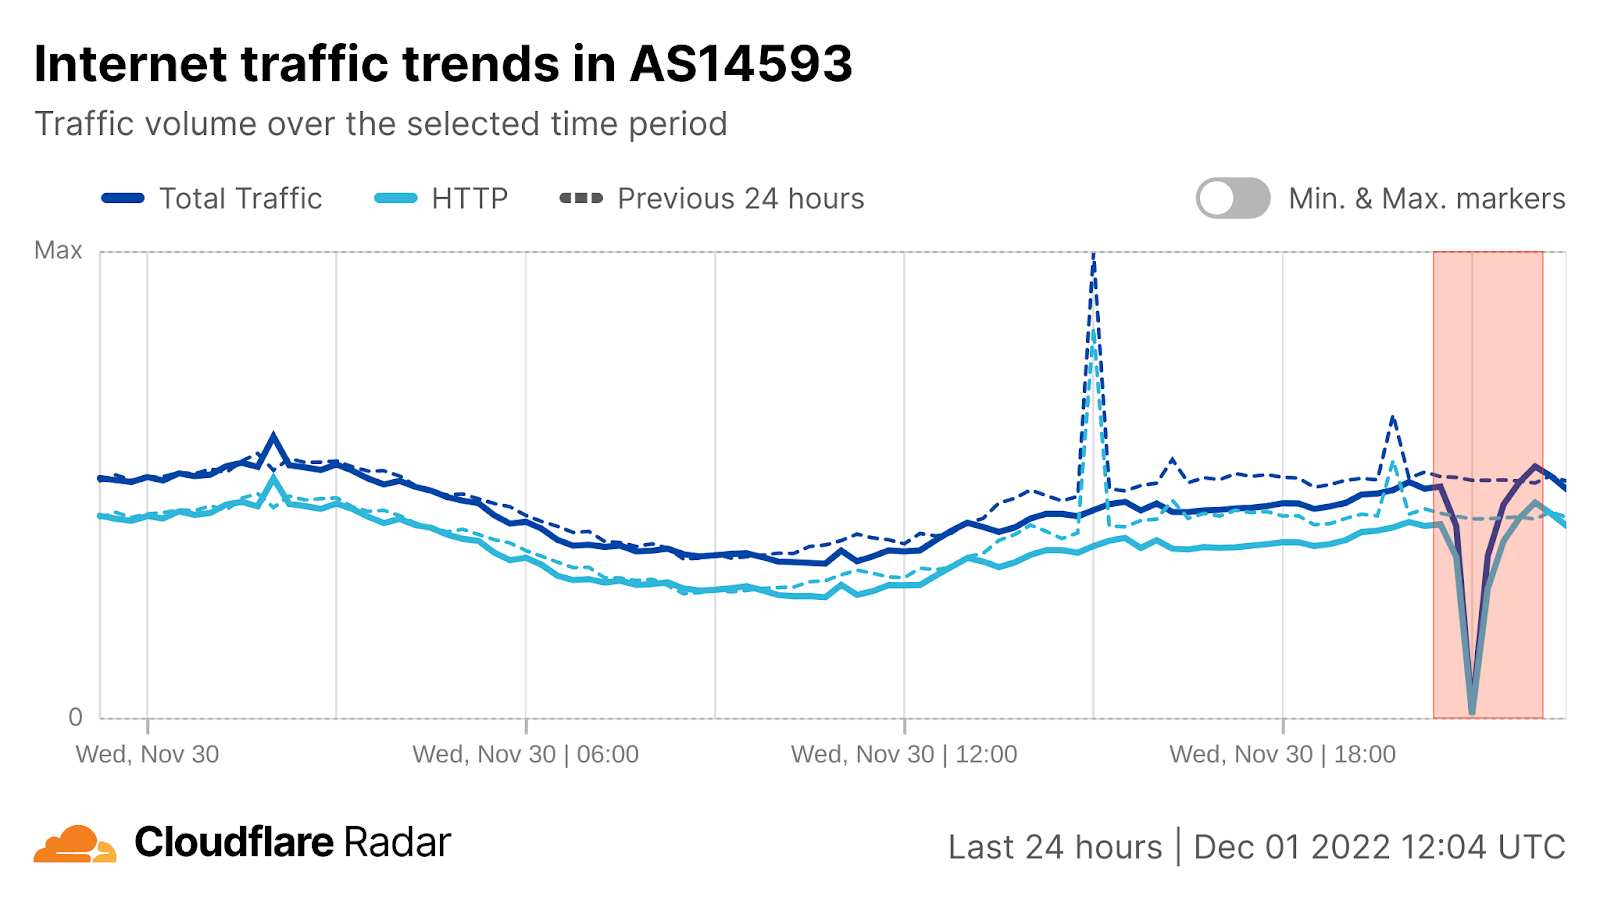
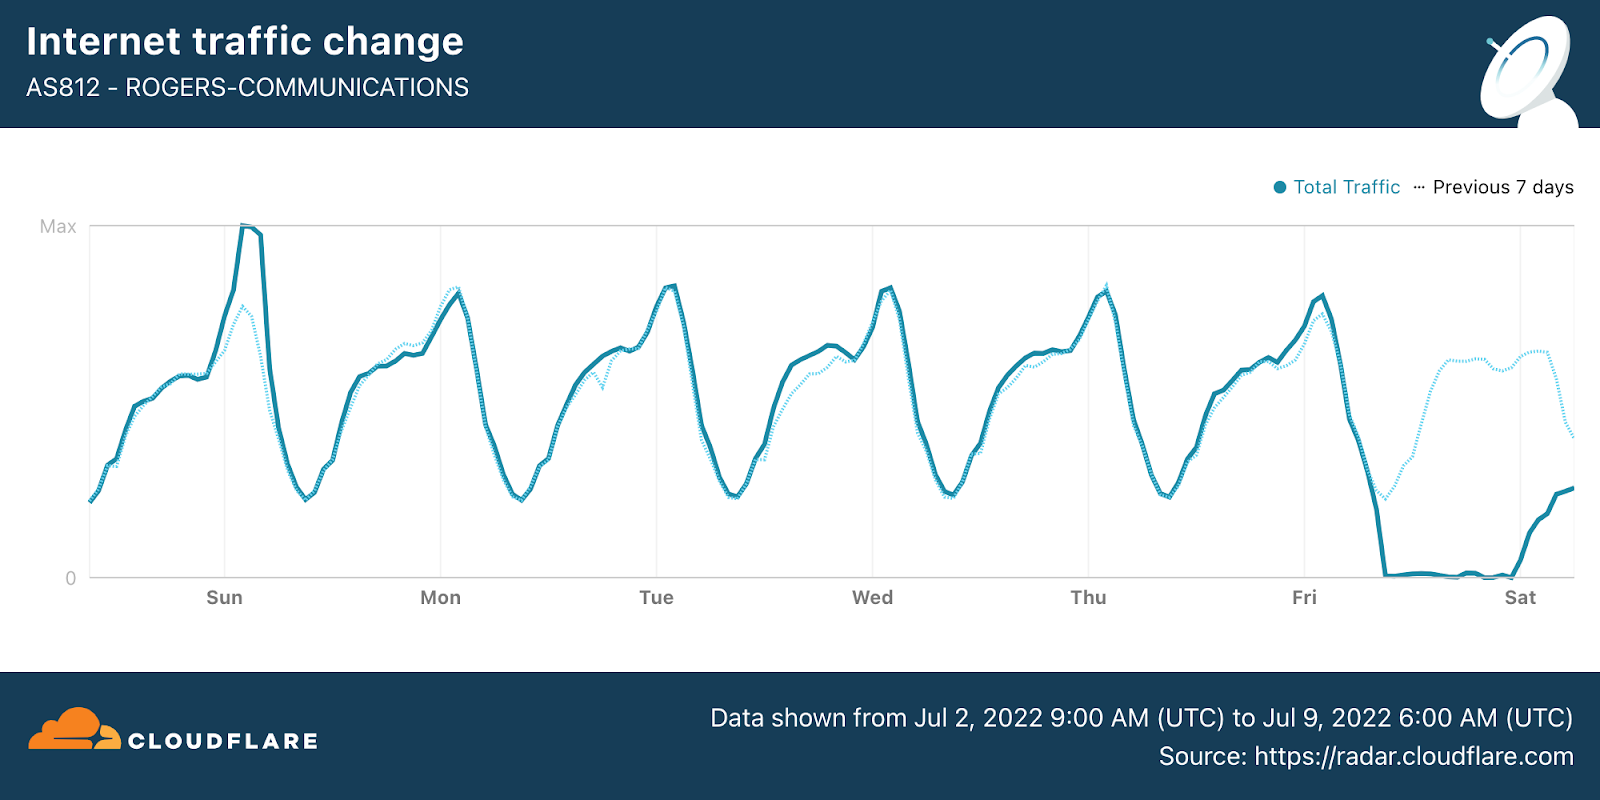
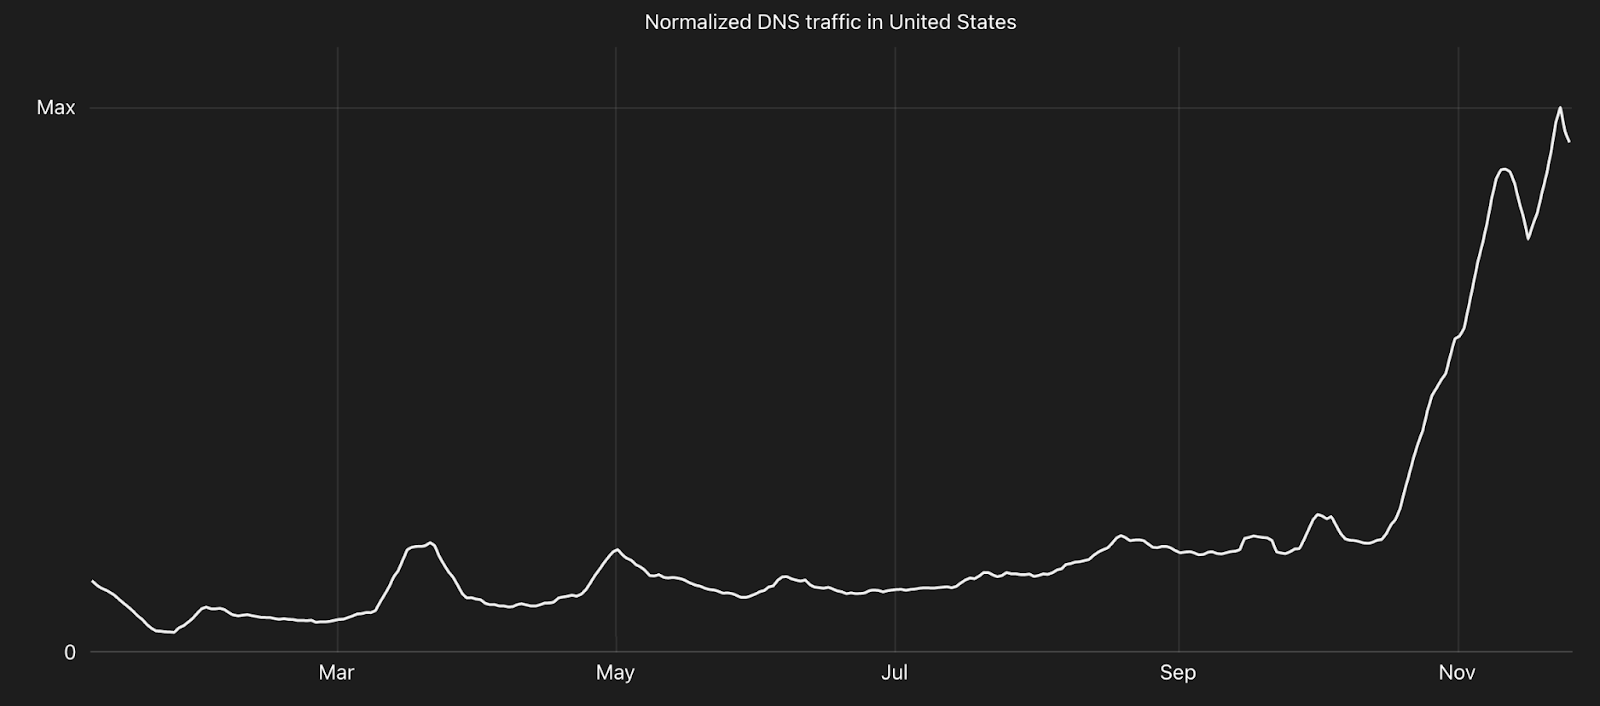
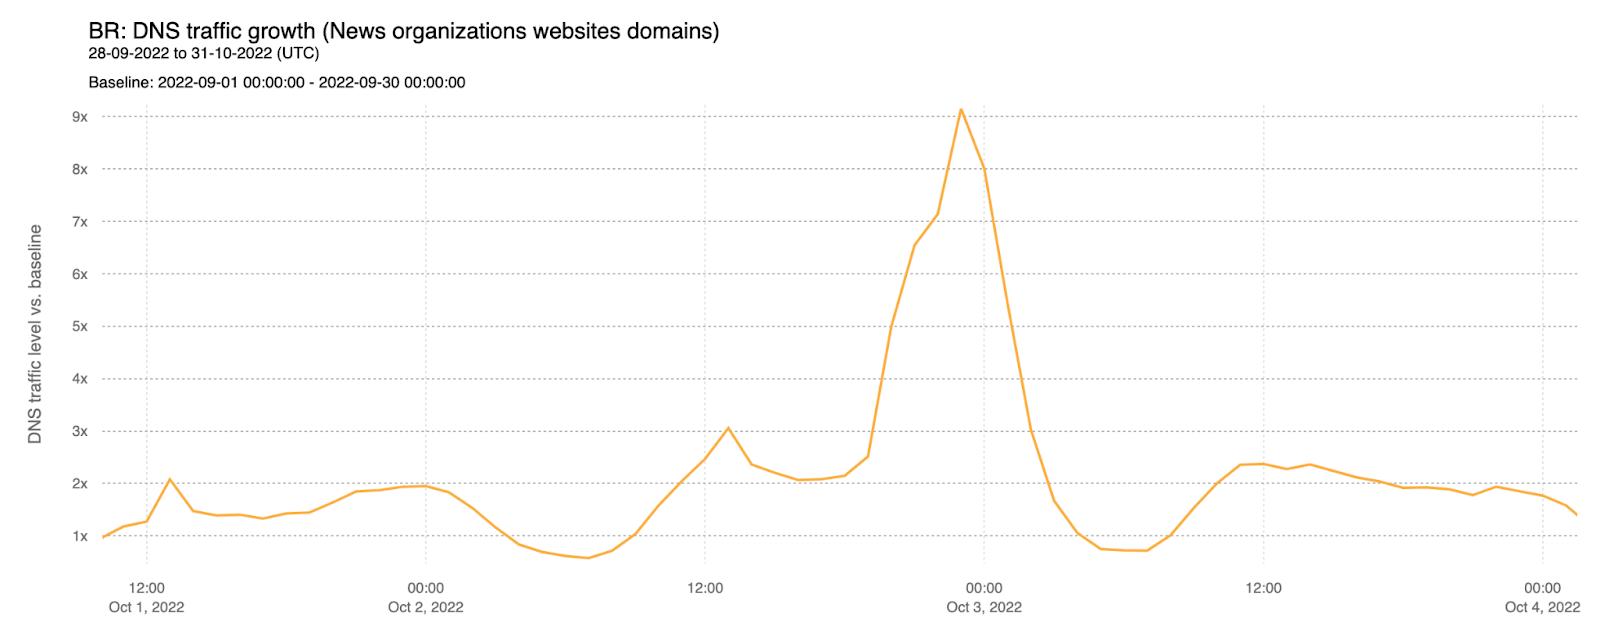
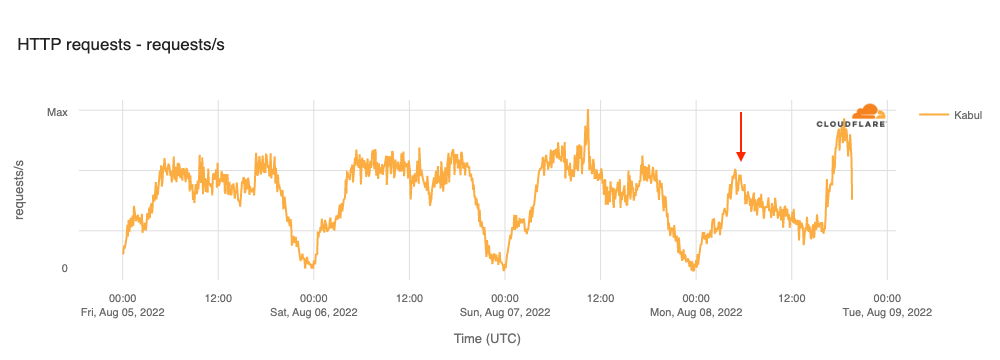
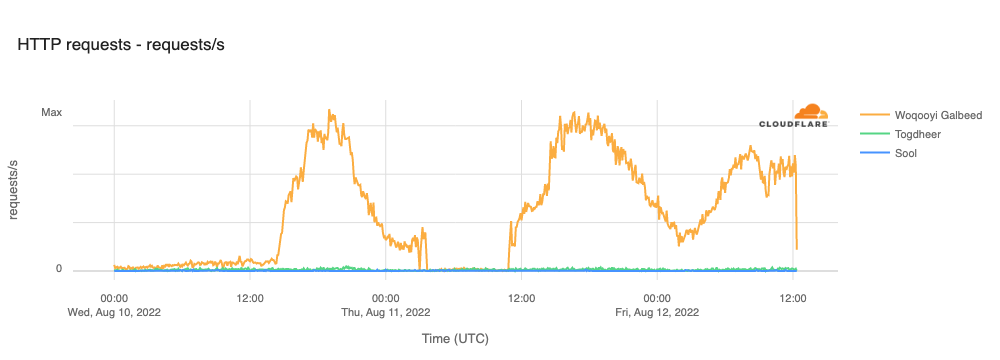
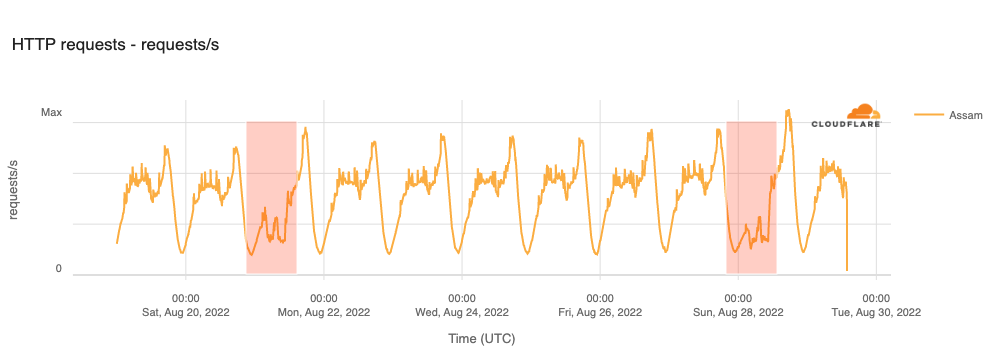
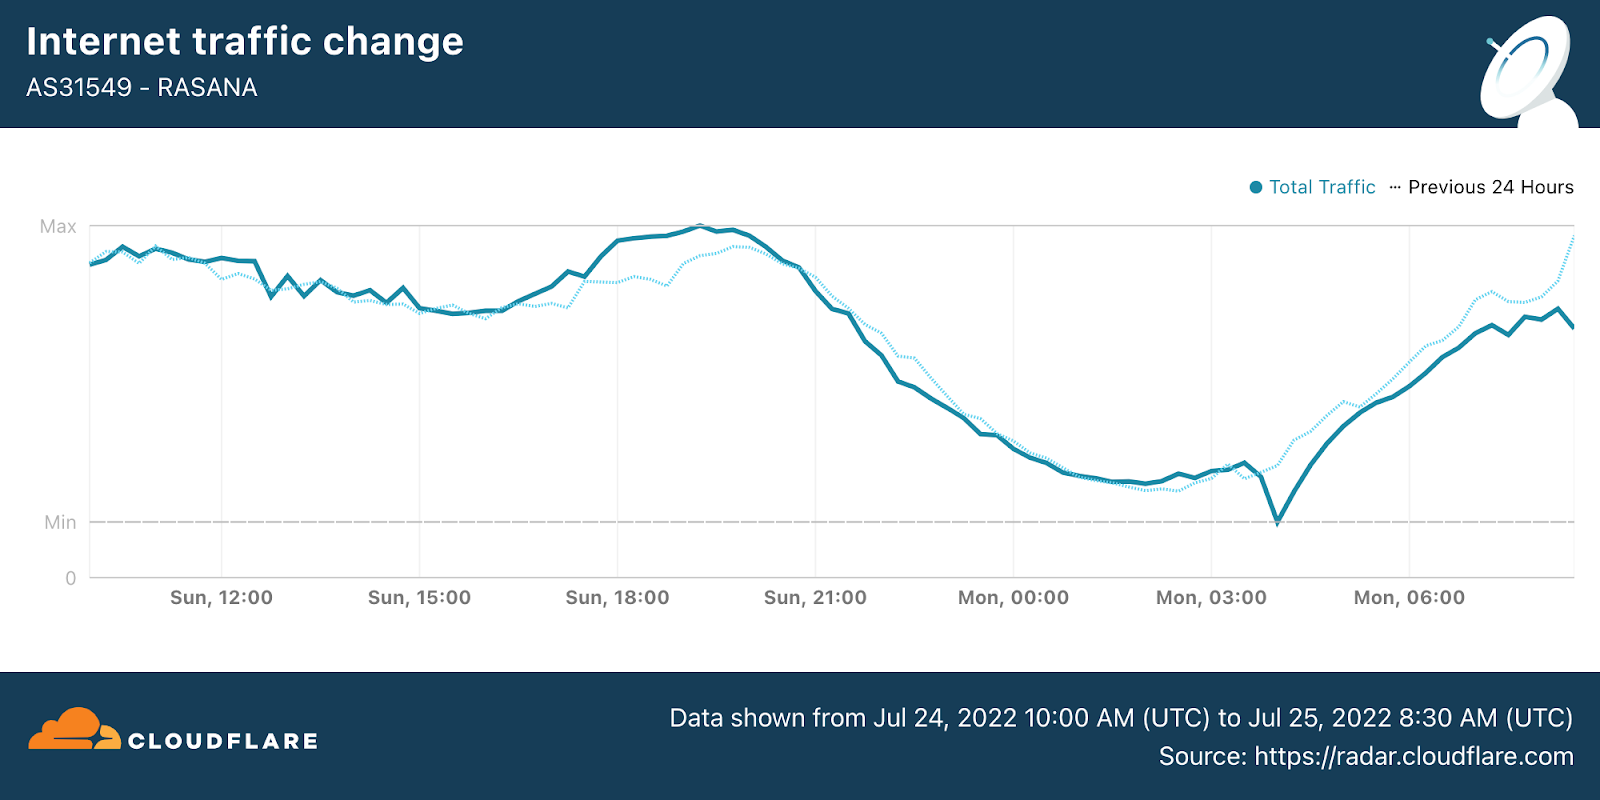
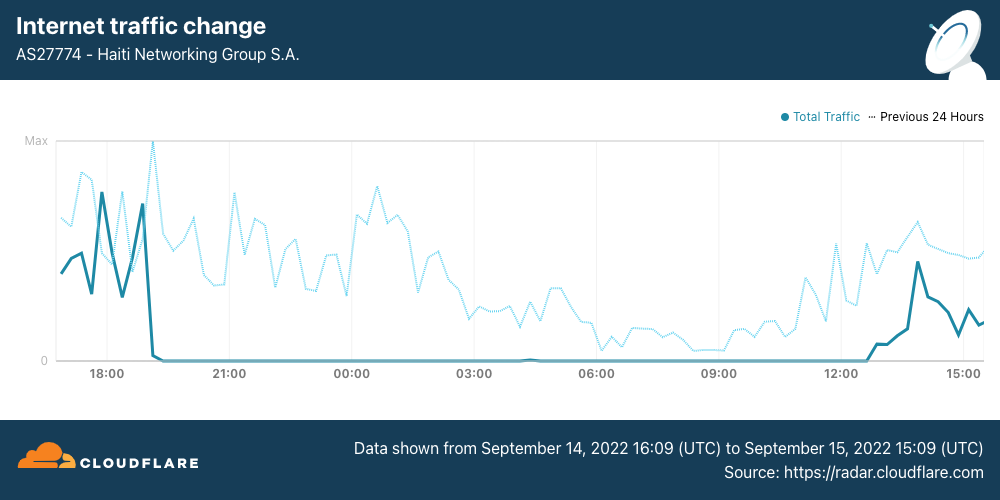
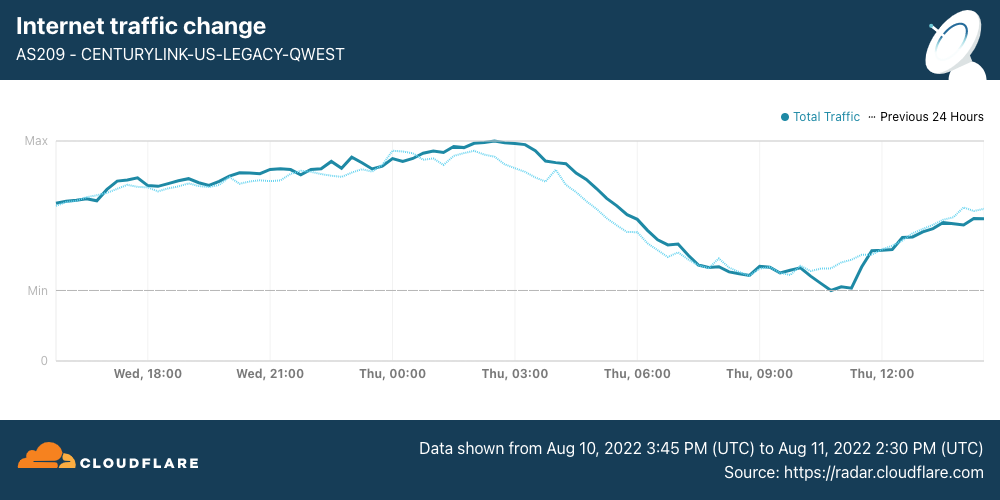
Just after midnight (UTC) on April 4, subscribers to UK ISP Virgin Media (AS5089) began experiencing an Internet outage, with subscriber complaints multiplying rapidly on platforms including Twitter and Reddit.
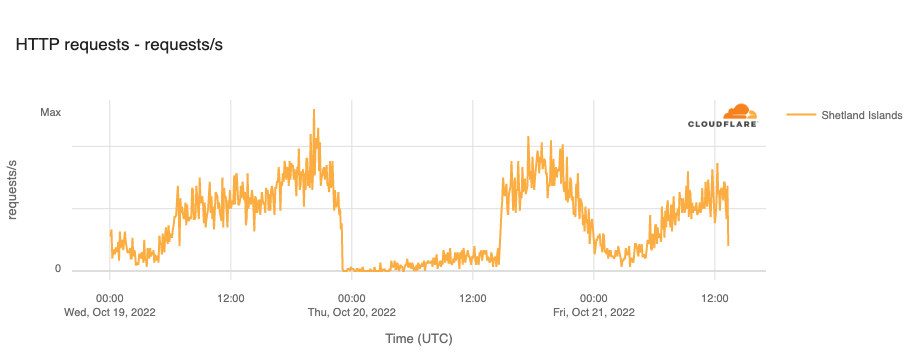
Cloudflare Radar data shows Virgin Media traffic dropping to near-zero around 00:30 UTC, as seen in the figure below. Connectivity showed some signs of recovery around 02:30 UTC, but fell again an hour later. Further nominal recovery was seen around 04:45 UTC, before again experiencing another complete outage between around 05:45-06:45 UTC, after which traffic began to recover, reaching expected levels around 07:30 UTC.
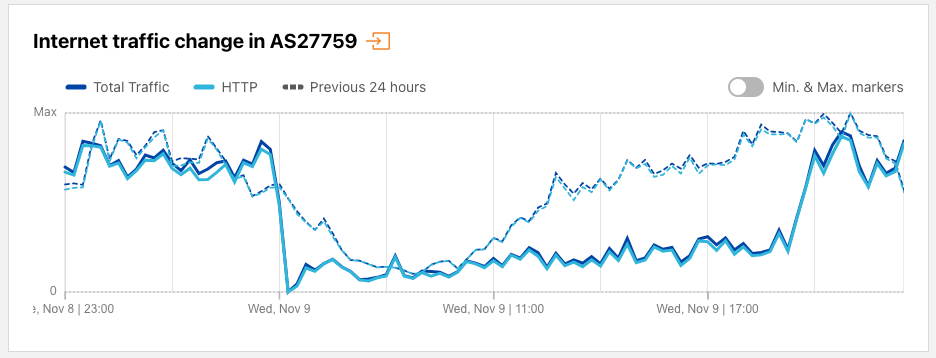
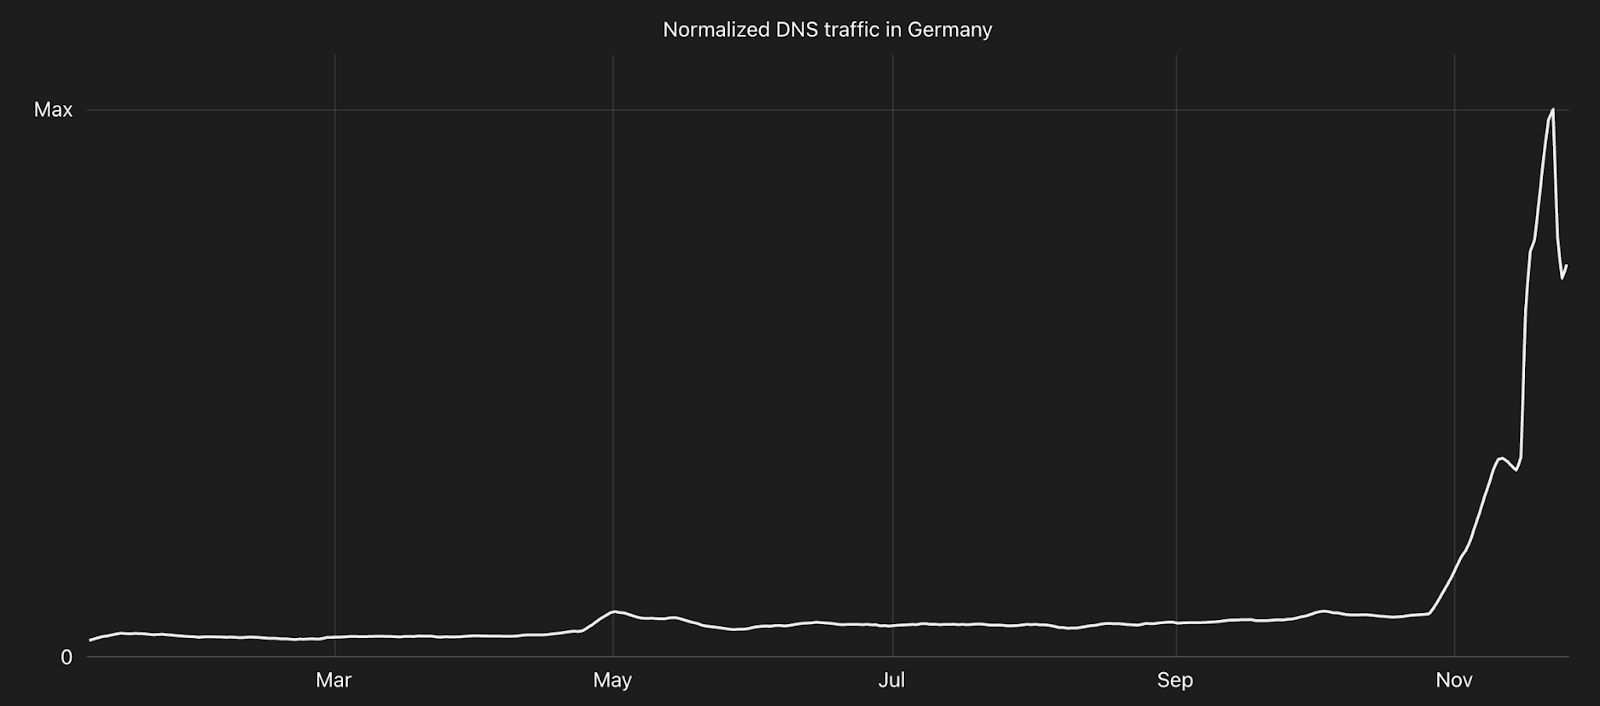
After the initial set of early-morning disruptions, Virgin Media experienced another round of issues in the afternoon. Cloudflare observed instability in traffic from Virgin Media’s network (called an autonomous system in Internet jargon) AS5089 starting around 15:00 UTC, with a significant drop just before 16:00 UTC. However in this case, it did not appear to be a complete outage, with traffic recovering approximately a half hour later.
Virgin Media’s Twitter account acknowledged the early morning disruption several hours after it began, posting responses stating “We’re aware of an issue that is affecting broadband services for Virgin Media customers as well as our contact centres. Our teams are currently working to identify and fix the problem as quickly as possible and we apologise to those customers affected.” Further responses after service restoration noted “We’ve restored broadband services for customers but are closely monitoring the situation as our engineers continue to investigate. We apologise for any inconvenience caused.”
However, the second disruption was acknowledged on Virgin Media’s Twitter account much more rapidly, with a post at 16:25 UTC stating “Unfortunately we have seen a repeat of an earlier issue which is causing intermittent broadband connectivity problems for some Virgin Media customers. We apologise again to those impacted, our teams are continuing to work flat out to find the root cause of the problem and fix it.”
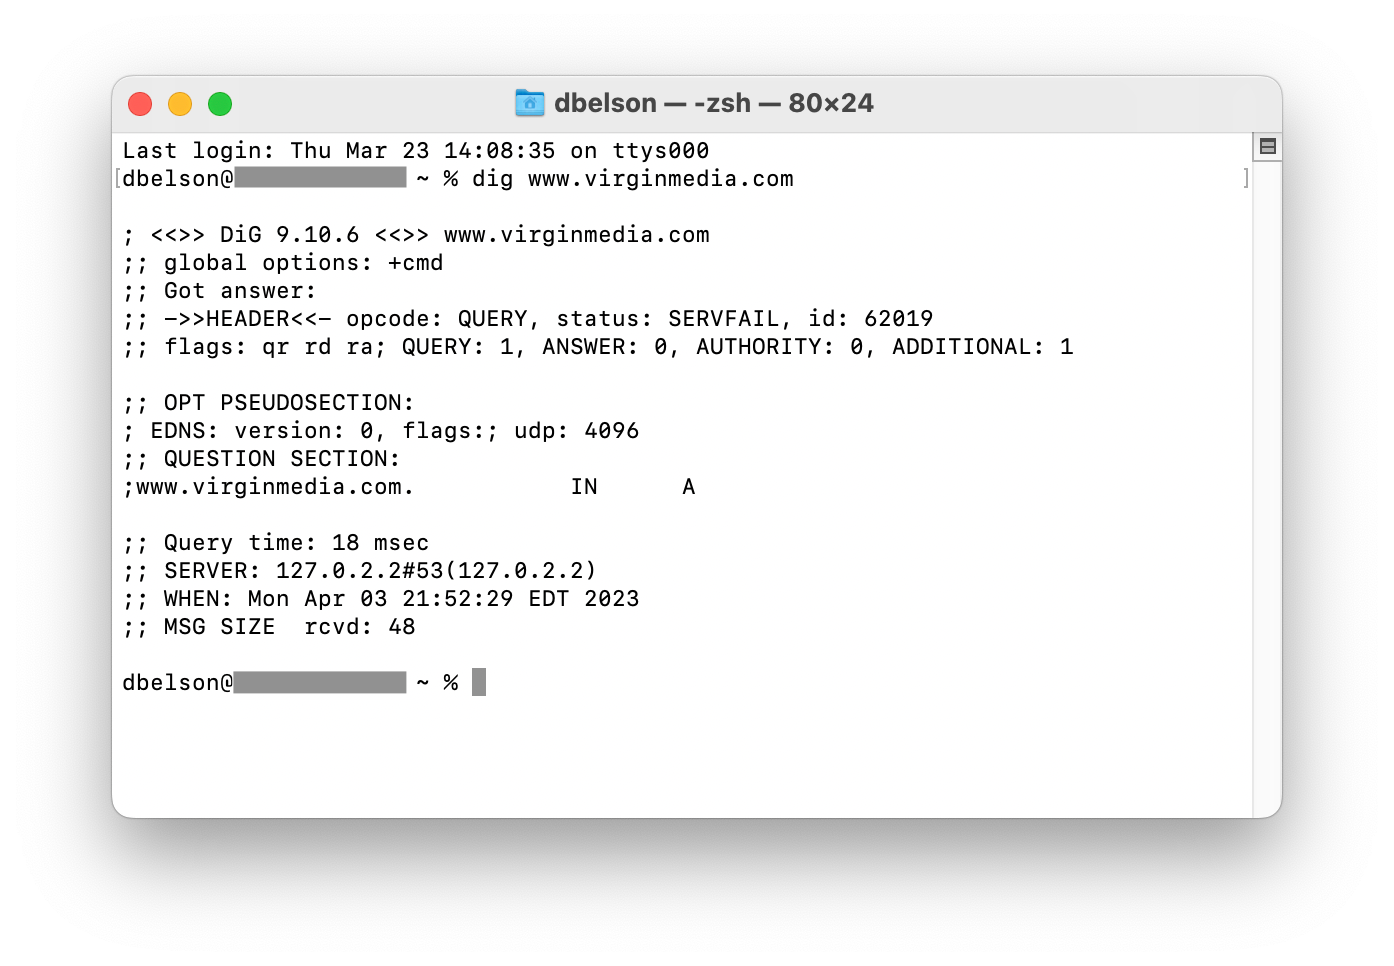
At the time of the outages, www.virginmedia.com, which includes the provider’s status page, was unavailable. As seen in the figure below, a DNS lookup for the hostname resulted in a SERVFAIL error, indicating that the lookup failed to return a response. This is because the authoritative nameservers for virginmedia.com are listed as ns{1-4}.virginmedia.net, and these nameservers are all hosted within Virgin Media’s network (AS5089) and thus are not accessible during the outage.
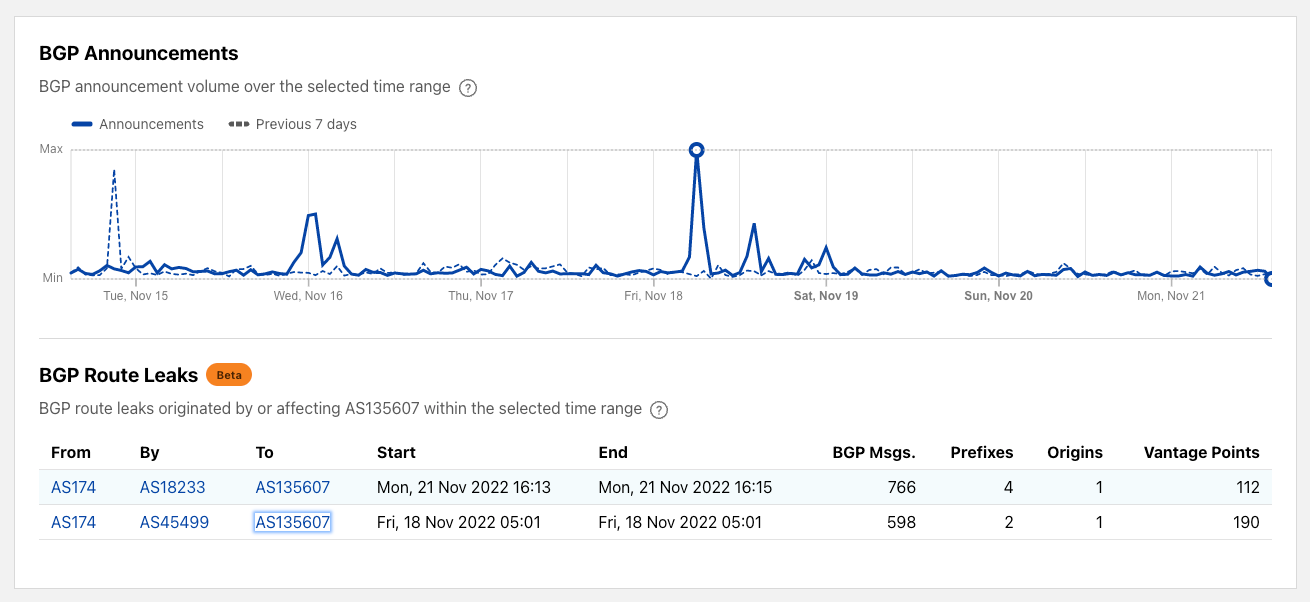
Although Virgin Media has not publicly released a root cause for the series of disruptions that its network has experienced, looking at BGP activity can be instructive.
BGP is a mechanism to exchange routing information between networks on the Internet. The big routers that make the Internet work have huge, constantly updated lists of the possible routes that can be used to deliver each network packet to its final destination. Without BGP, the Internet routers wouldn’t know what to do, and the Internet wouldn’t exist.
The Internet is literally a network of networks, or for math fans, a graph, with each individual network a node in it, and the edges representing the interconnections. All of this is bound together by BGP, which allows one network (Virgin Media, for instance) to advertise its presence to other networks that form the Internet. When Virgin Media is not advertising its presence, other networks can’t find its network and it becomes effectively unavailable.
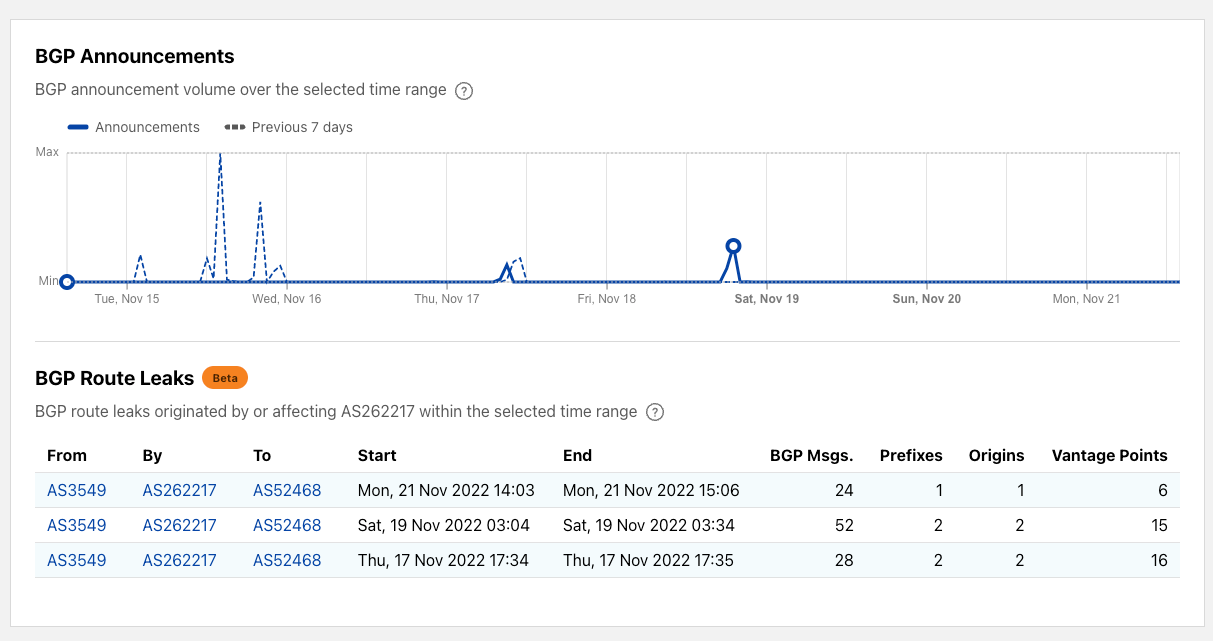
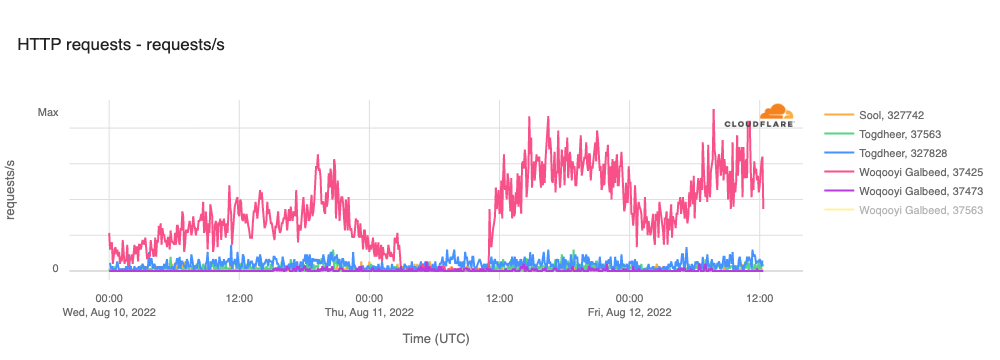
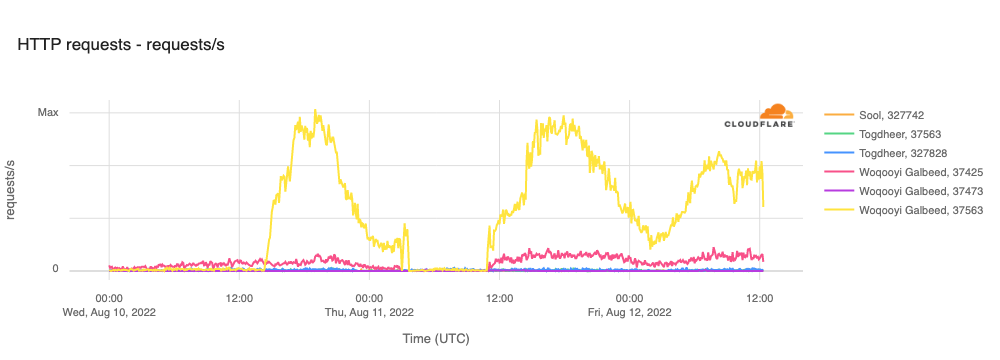
BGP announcements inform a router of changes made to the routing of a prefix (a group of IP addresses) or entirely withdraws the prefix, removing it from the routing table. The figure below shows aggregate BGP announcement activity from AS5089 with spikes that align with the decreases and increases seen in the traffic graph above, suggesting that the underlying cause may in fact be BGP-related, or related to problems with core network infrastructure.
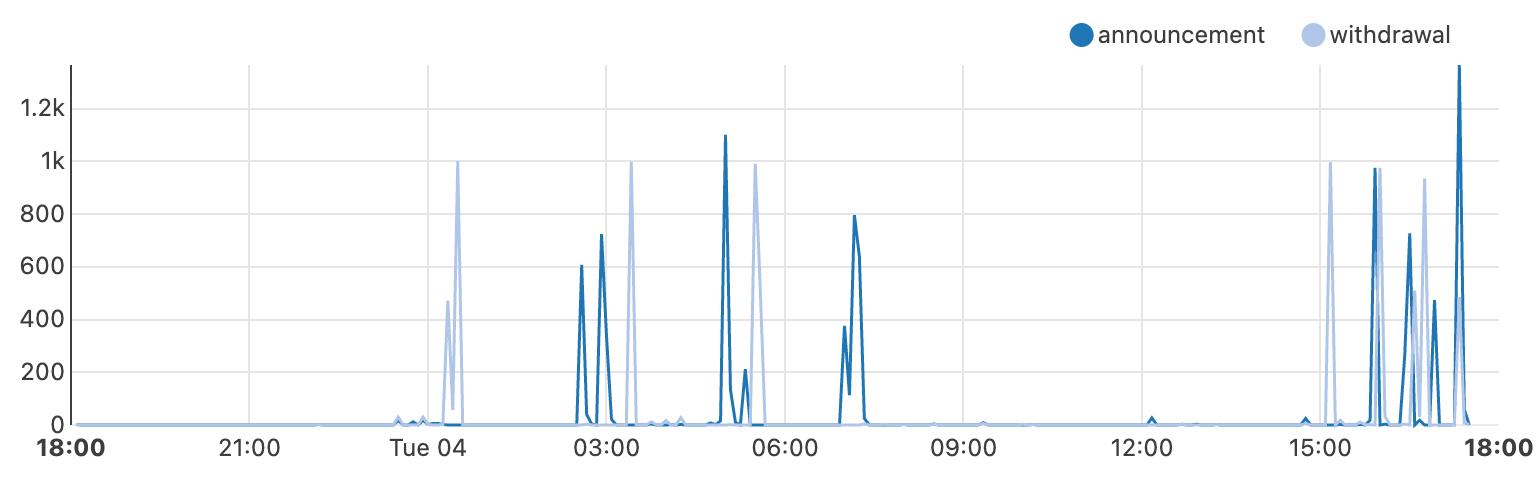
We can drill down further to break out the observed activity between BGP announcements (dark blue) and withdrawals (light blue) seen in the figure below, with key activity coincident with the loss and return of traffic. An initial set of withdrawals are seen just after midnight, effectively removing Virgin Media from the Internet resulting in the initial outage.
A set of announcements occurred just before 03:00 UTC, aligning with the nominal increase in traffic noted above, but those were followed quickly by another set of withdrawals. A similar announcement/withdrawal exchange was observed at 05:00 and 05:30 UTC respectively, before a final set of announcements restored connectivity at 07:00 UTC.
Things remained relatively stable through the morning into the afternoon, before another set of withdrawals presaged the afternoon’s connectivity problems, with a spike of withdrawals at 15:00 UTC, followed by additional withdrawal/announcement exchanges over the next several hours.
One of the first steps in an information security investigation is to gather as much context as possible. But compiling that information can become a sprawling task.
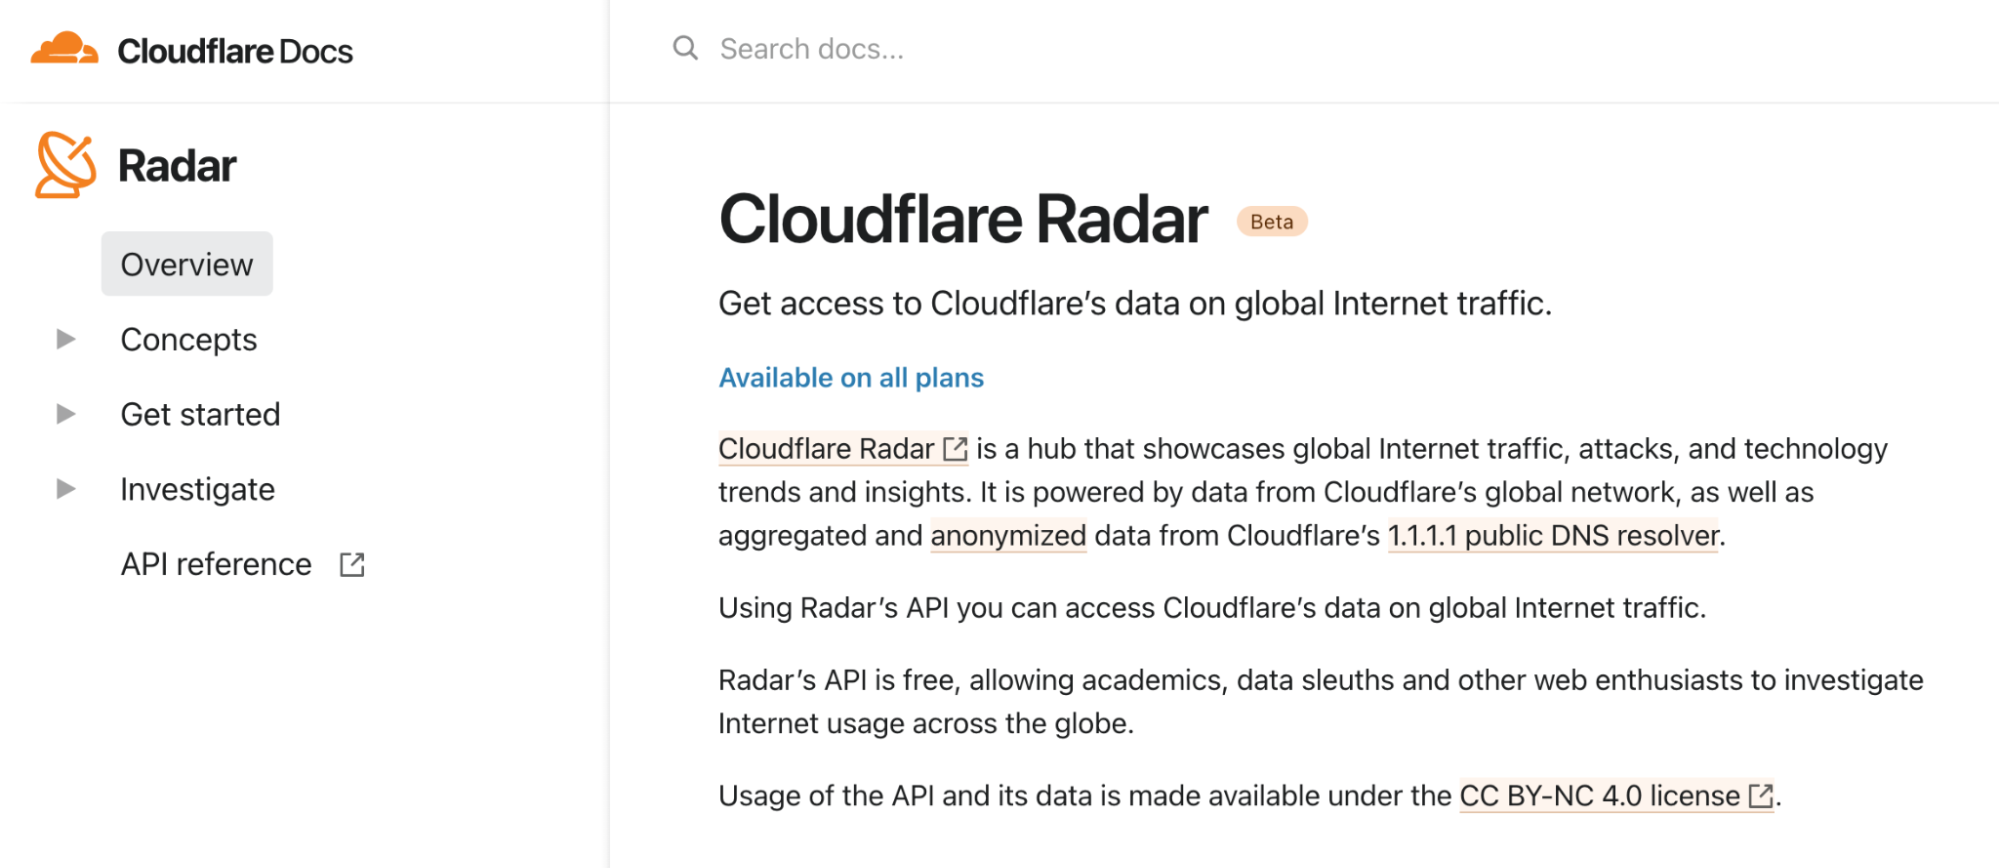
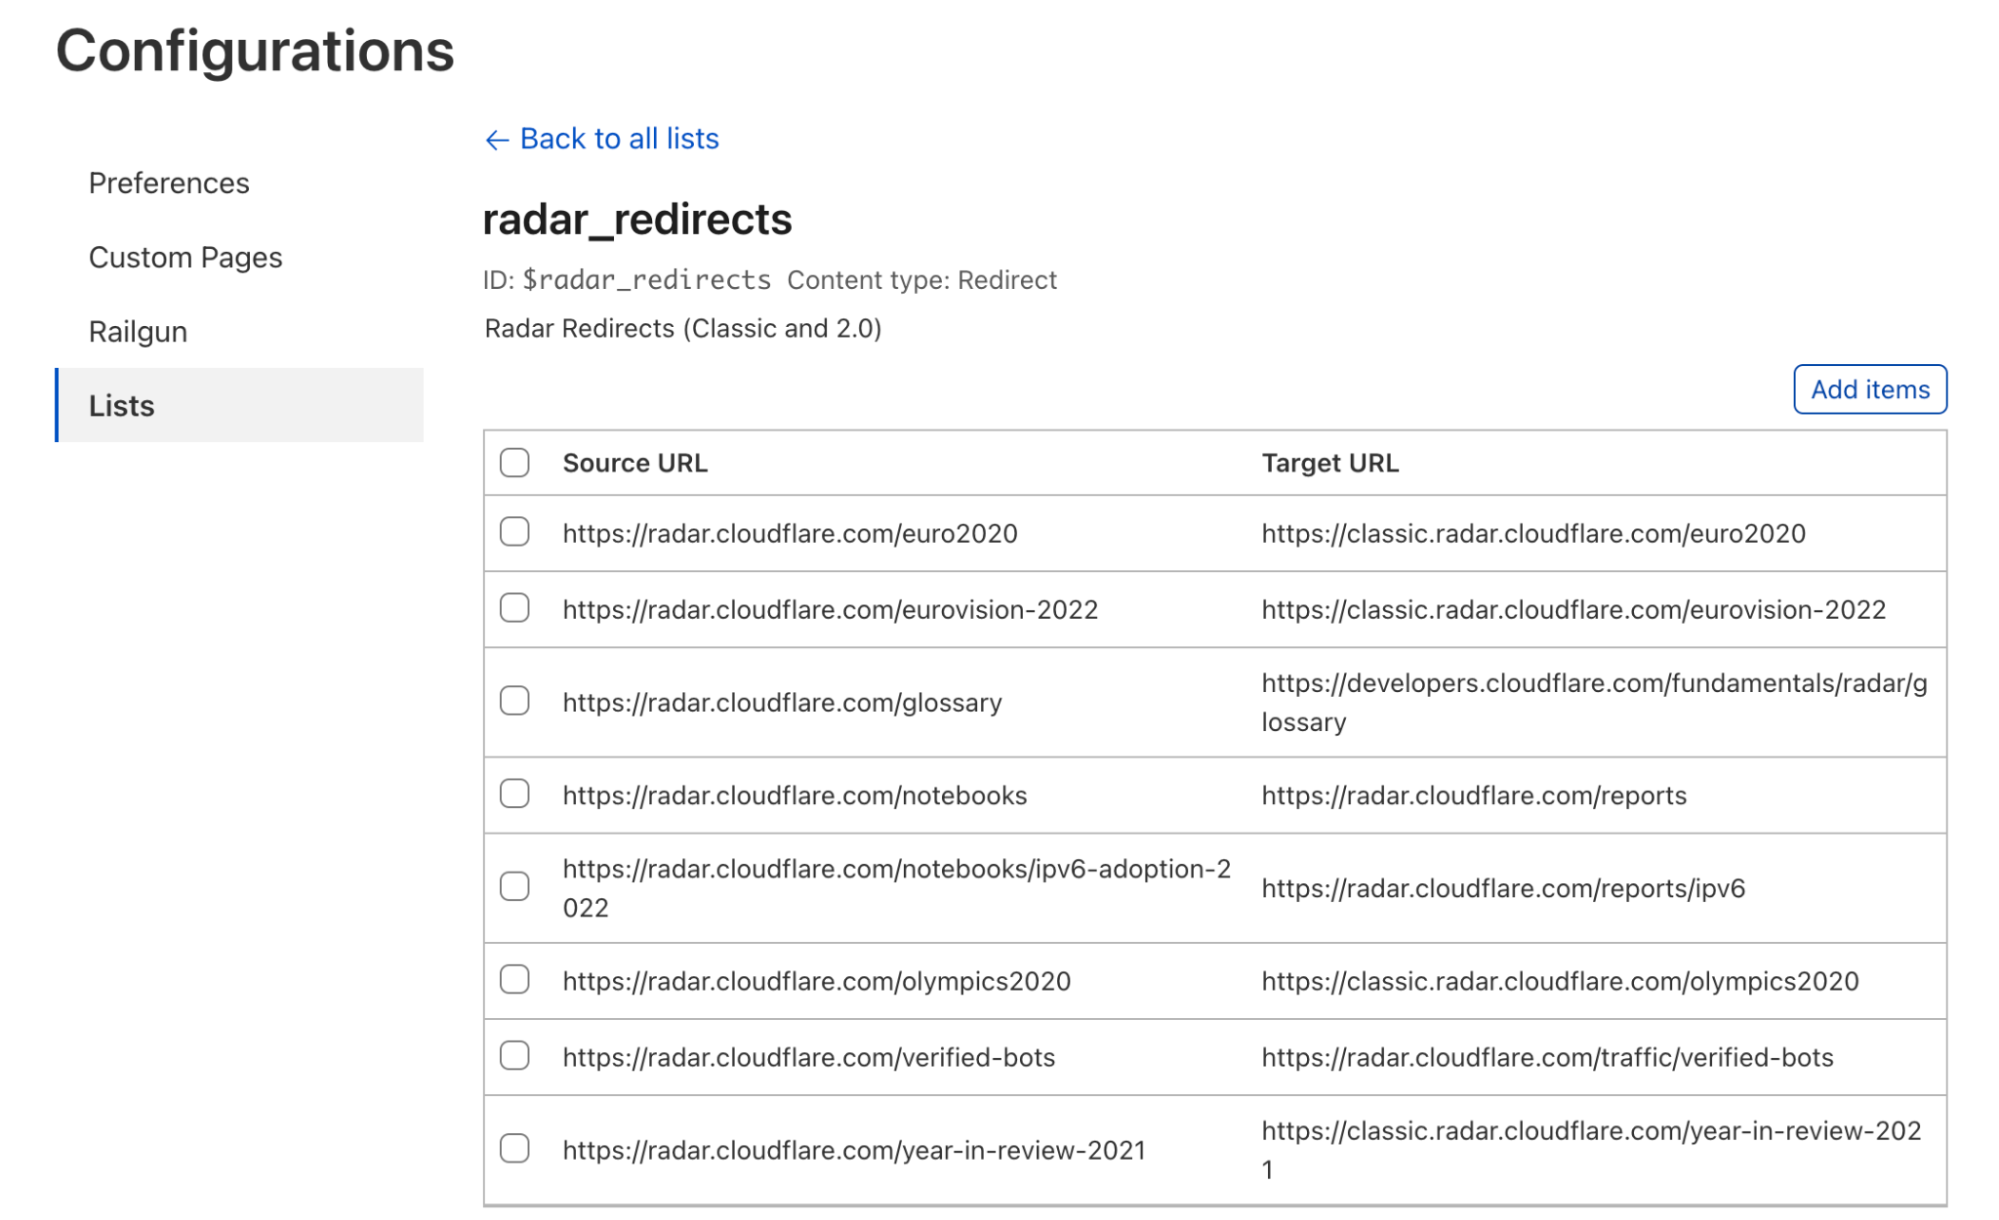
Cloudflare is excited to announce early access to a new, free tool — the Radar URL Scanner. Provide us a URL, and our scanner will compile a report containing a myriad of technical details: a phishing scan, SSL certificate data, HTTP request and response data, page performance data, DNS records, whether cookies are set to secure and HttpOnly, what technologies and libraries the page uses, and more.
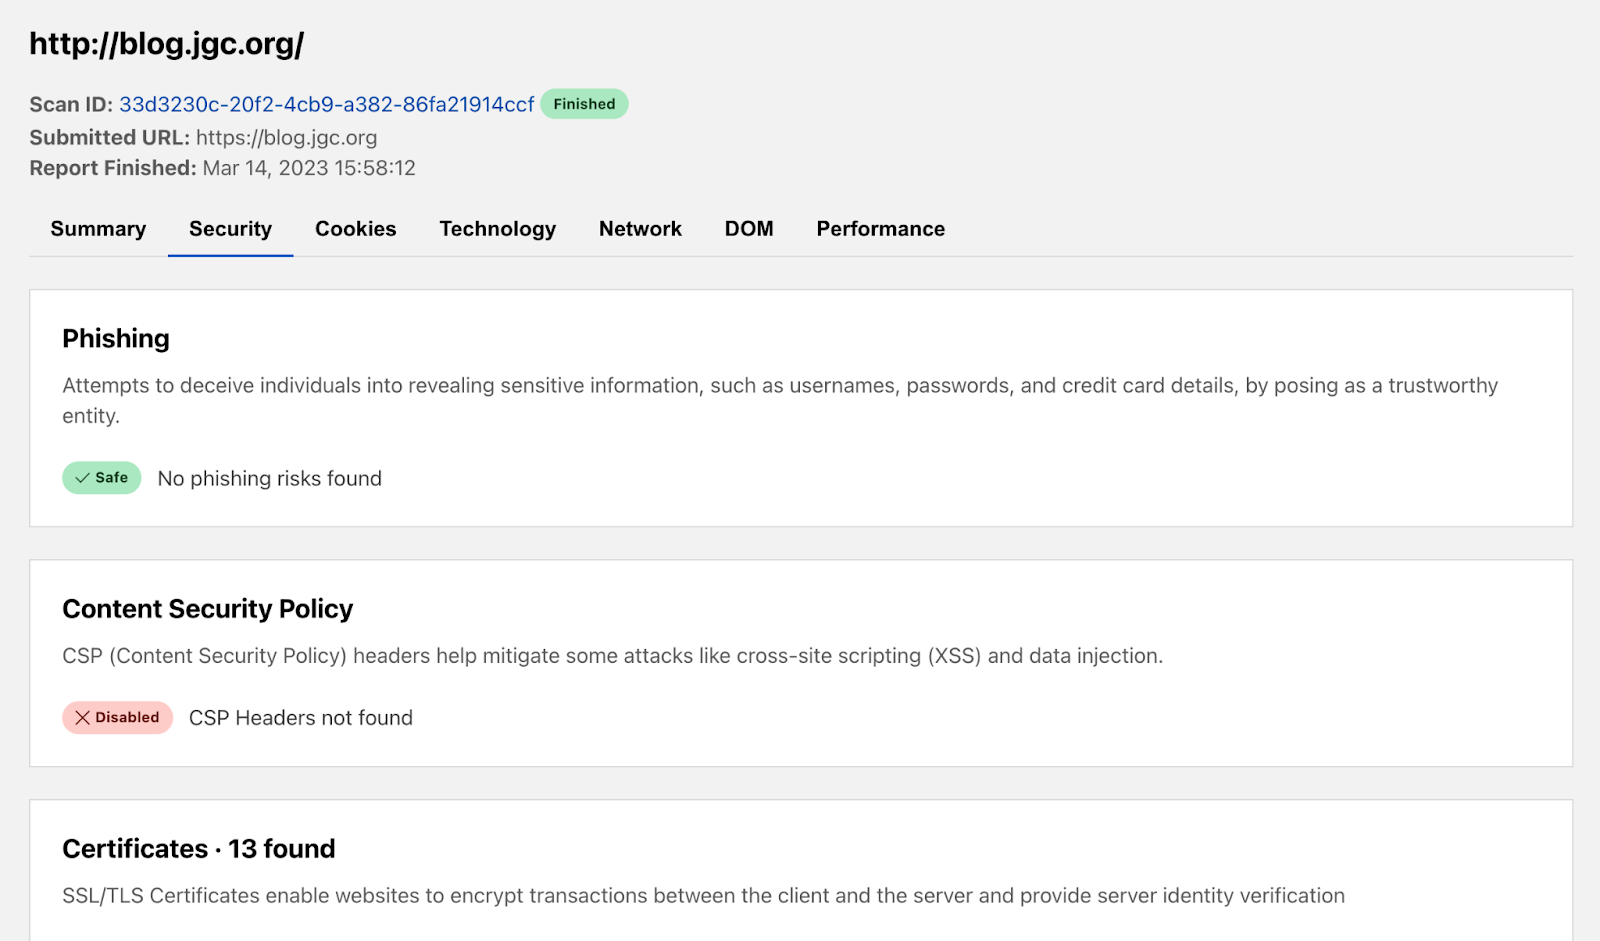
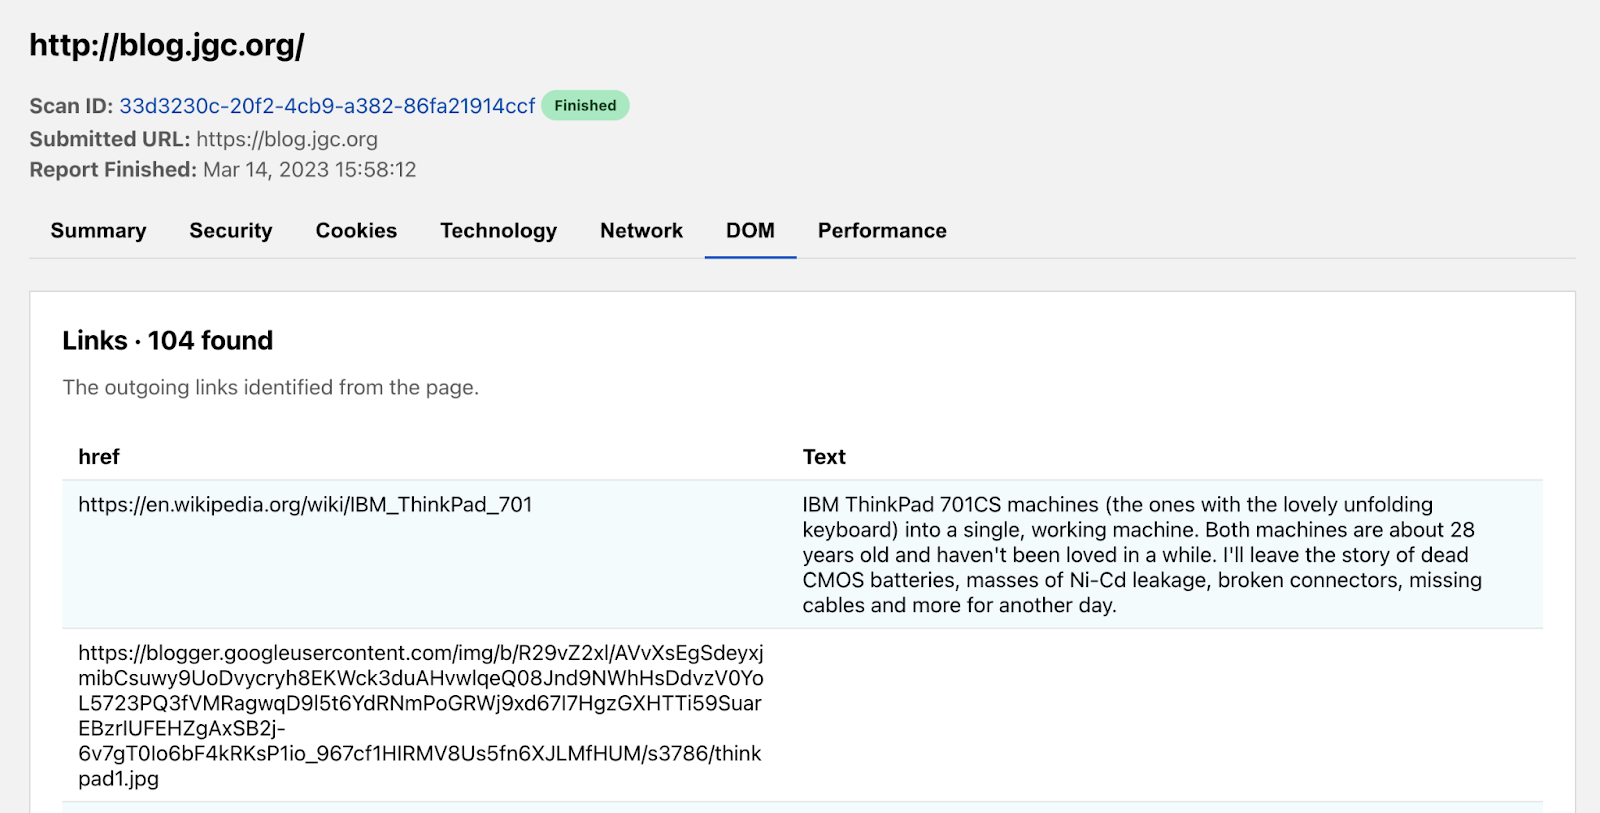
Let’s walk through a report on John Graham-Cumming’s blog as an example. Conveniently, all reports generated will be publicly accessible.
The first page is the summary tab, and you’ll see we’ve broken all the available data into the following categories: Security, Cookies, Network, Technology, DOM, and Performance. It’s a lot of content so we will jump through some highlights.
In the Summary tab itself, you’ll notice the submitted URL was https://blog.jgc.org. If we had received a URL short link, the scanner would have followed the redirects and generated a report for the final URL.
The Security tab presents information to help determine whether a page is safe to visit with a phishing and certificates section. In our blog example, the report confirms the link we provided is not a phishing link, but there could easily be phishing scams trying to harvest personal information. We’re excited to enable wider access to our security infrastructure with this free tool.
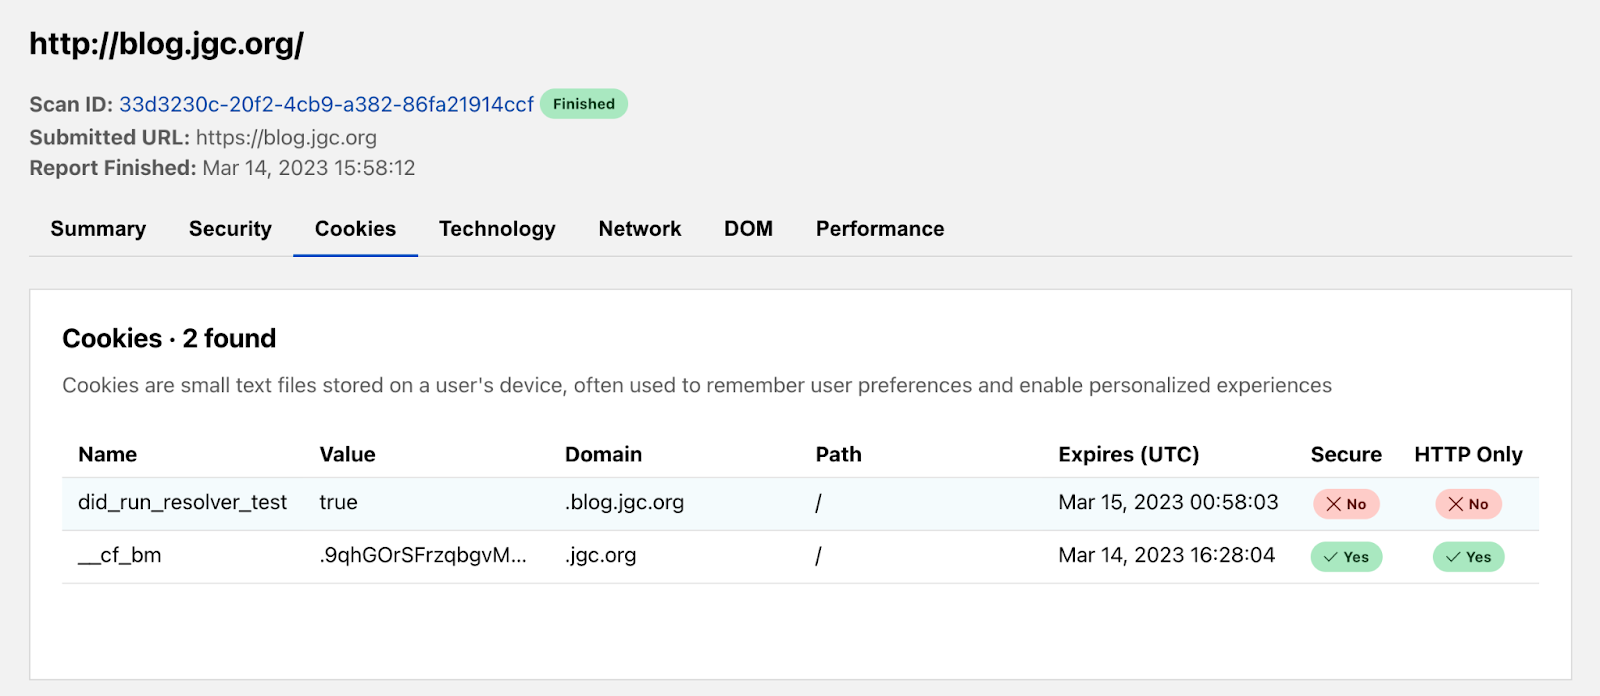
The Cookies tab can indicate how privacy friendly a website is to its users. We show all the cookies set and their attribute values to do this. In this report, the blog loaded 2 cookies. There’s the Secure flag. You’ll want that set to true as often as possible because this means the cookie may only be transmitted over HTTPS, preventing it from being observed by unauthorized parties. Additionally, cookies set to HttpOnly will be inaccessible to the JavaScript API, potentially mitigating XSS attacks from third-party scripts.
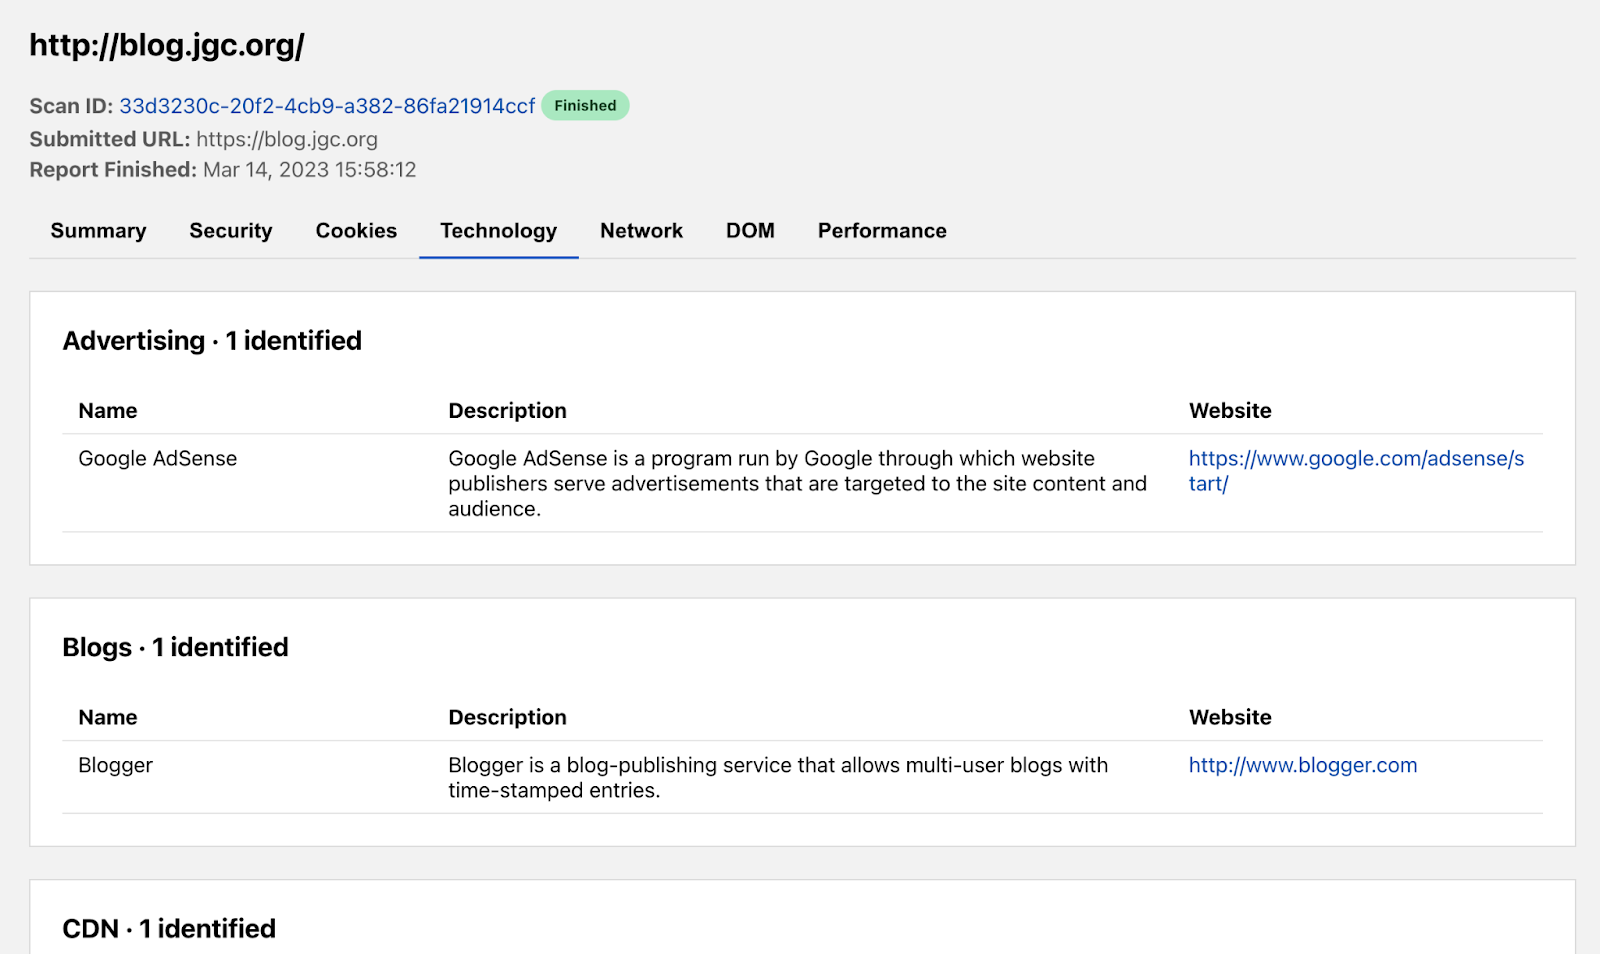
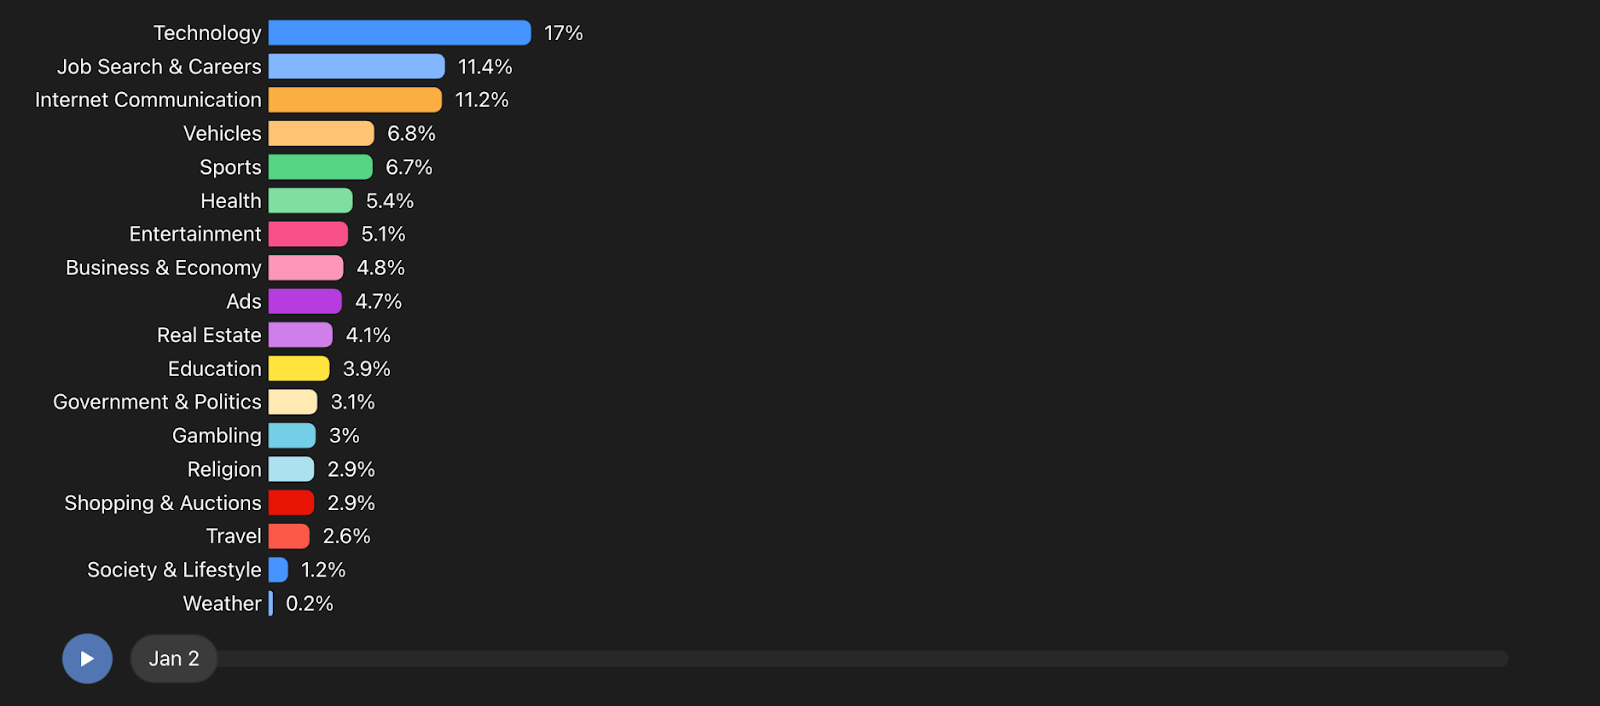
The Technology tab enumerates the technologies, frameworks, libraries, etc that are used to power the page being scanned. Understanding the technology stack of a page can be very useful for when there are outages in a particular service, when exploits in popular libraries are discovered, or simply to understand what tools are most popular in the industry. John’s blog appears to use 7 different technologies including Google AdSense, Blogger, and Cloudflare.
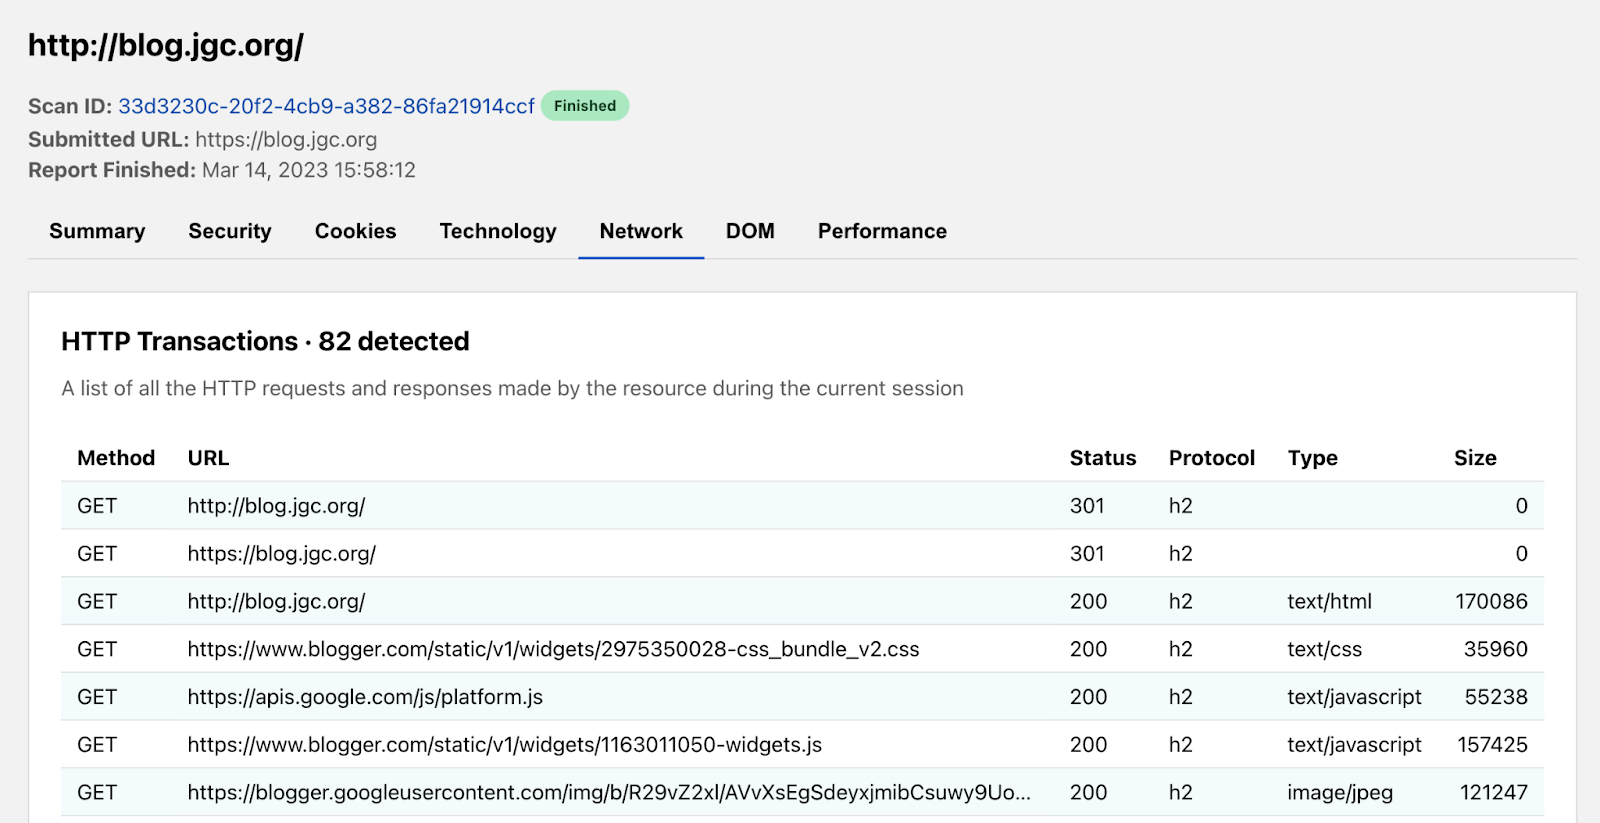
The Network tab shows all the HTTP transactions that occur on the page as well as the hostname’s associated DNS records. HTTP transactions are the requests and responses the page makes to load all its content. This tells engineers where the website is going to load its content. Our report of John’s blog shows a total of 82 requests.
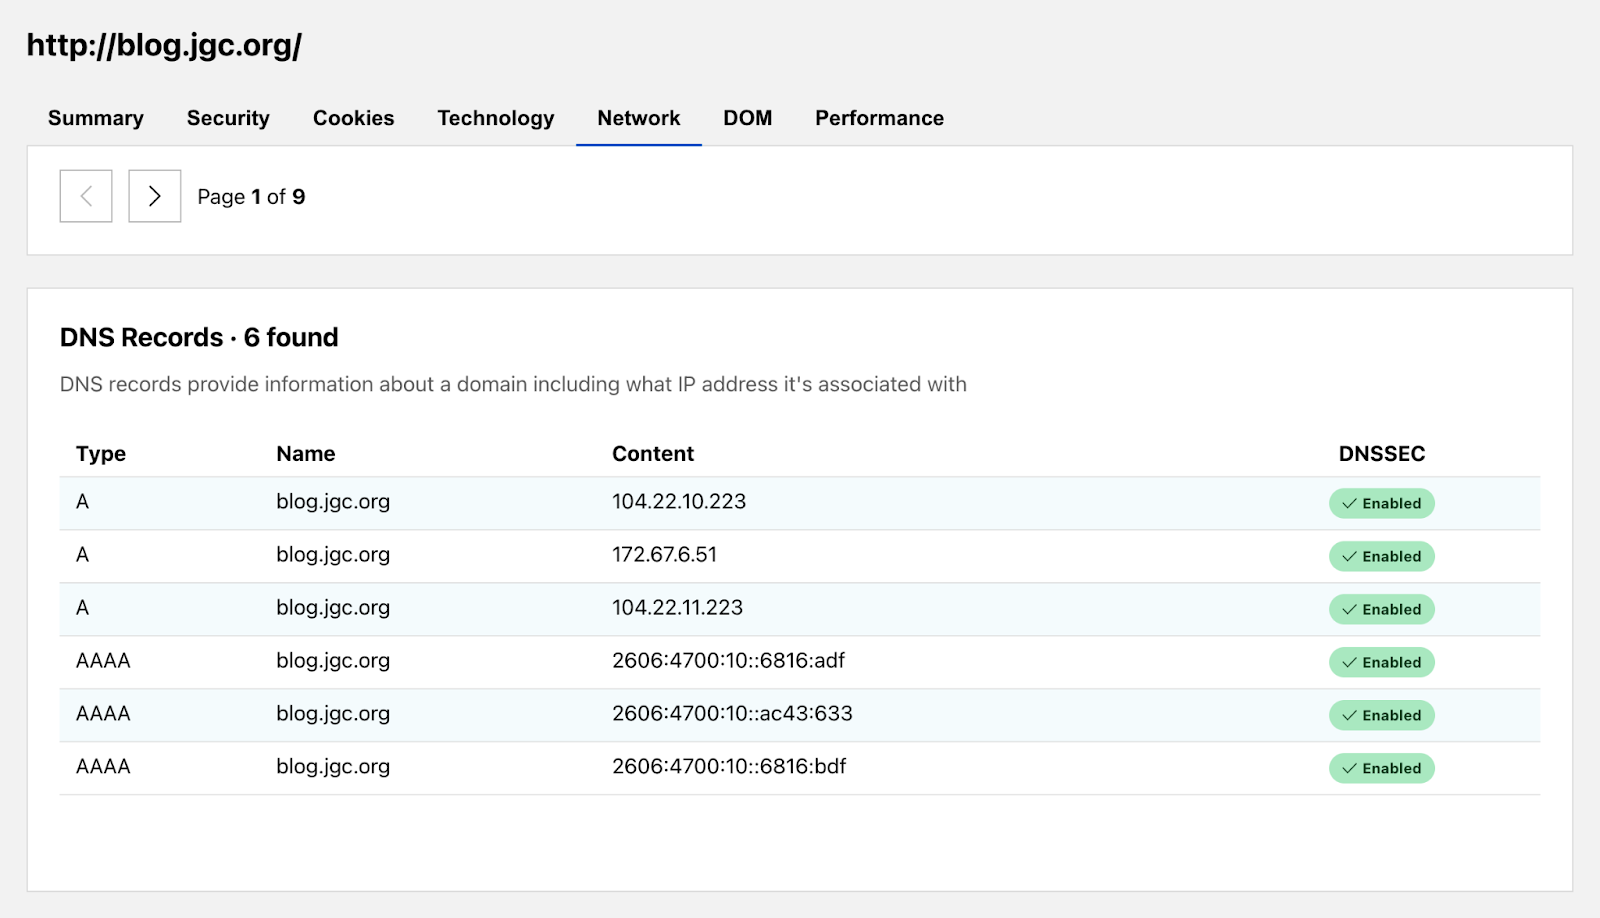
The tab also contains DNS records which are a great way to understand more about the fundamentals of the page. And of course, we at Cloudflare are big advocates for enabling DNSSEC.
The DOM (Document Object Model) tab conveniently collates common information you may be looking for from within the page. We grouped together lists of all hyperlinks and global JavaScript variables. Additionally, we provide the raw HTML of the page for you to further analyze. Our report shows the blog’s landing page has 104 hyperlinks going off to other websites.
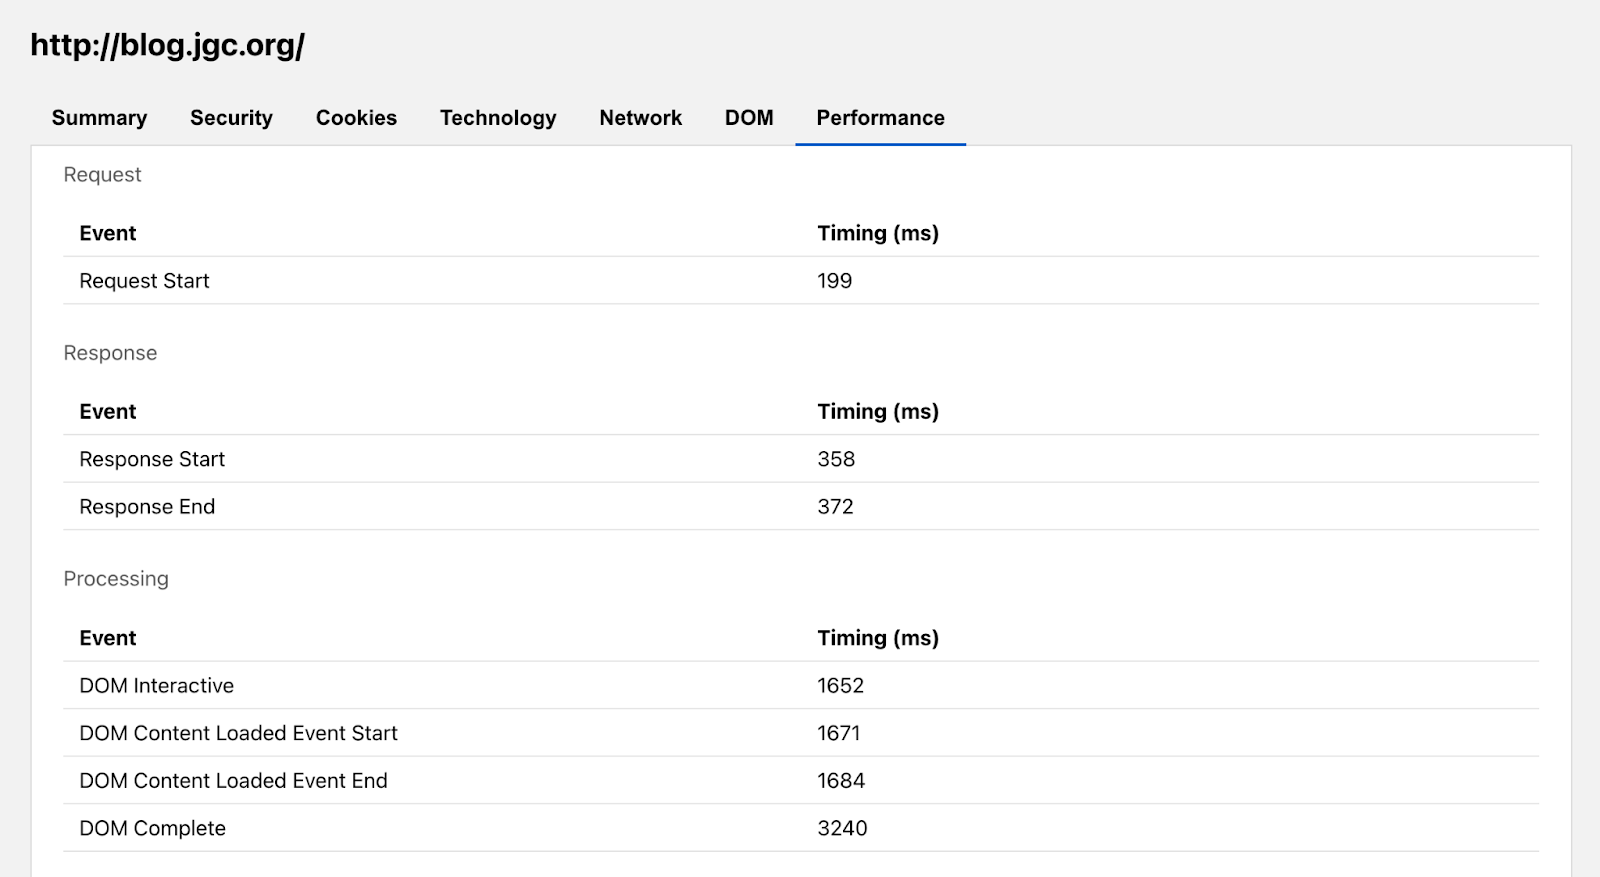
The Performance tab presents a breakdown of the time it takes for the website to load. It’s not enough for a page to be secure for users. It must also be usable, and load speeds are a big factor in the overall experience. That’s why we’ve also included Performance Navigation Timing metrics alongside our more security and privacy oriented tabs.
Under the hood, one of the great things about this tool is that the underlying scanning technology uses Cloudflare’s homegrown Workers Browser Rendering API to run all our headless scans. You can follow that link to join the waitlist and try it out for yourself.
In the future, we envision adding features to our scanner to complement the ones from this launch: API endpoints so you don’t need to rely on a GUI, private scans for more sensitive or recurring reports, and also security recommendations with integrations with the Cloudflare Security Center. And since this is a Radar product, not only can users expect the data generated to further enhance our security threat modeling, they can also look forward to us providing back insights and visualizations from the aggregate trends we observe.
The Radar URL Scanner tool’s journey to helping make the Internet more transparent and secure has only just begun, but we’re excited for you all to try it out here. If you have any questions or would like to discuss enterprise level features on your wishlist, feel free to reach out via Twitter at @CloudflareRadar or email us at [email protected].
One year ago we published our first Application Security Report. For Security Week 2023, we are providing updated insights and trends around mitigated traffic, bot and API traffic, and account takeover attacks.
Cloudflare has grown significantly over the last year. In February 2023, Netcraft noted that Cloudflare had become the most commonly used web server vendor within the top million sites at the start of 2023, and continues to grow, reaching a 21.71% market share, up from 19.4% in February 2022.
This continued growth now equates to Cloudflare handling over 45 million HTTP requests/second on average (up from 32 million last year), with more than 61 million HTTP requests/second at peak. DNS queries handled by the network are also growing and stand at approximately 24.6 million queries/second. All of this traffic flow gives us an unprecedented view into Internet trends.
Before we dive in, we need to define our terms.
Definitions
Throughout this report, we will refer to the following terms:
Mitigated traffic: any eyeball HTTP* request that had a “terminating” action applied to it by the Cloudflare platform. These include the following actions: BLOCK, CHALLENGE, JS_CHALLENGE and MANAGED_CHALLENGE. This does not include requests that had the following actions applied: LOG, SKIP, ALLOW. In contrast to last year, we now exclude requests that had CONNECTION_CLOSE and FORCE_CONNECTION_CLOSE actions applied by our DDoS mitigation system, as these technically only slow down connection initiation. They also accounted for a relatively small percentage of requests. Additionally, we improved our calculation regarding the CHALLENGE type actions to ensure that only unsolved challenges are counted as mitigated. A detailed description of actions can be found in our developer documentation.
Bot traffic/automated traffic: any HTTP* request identified by Cloudflare’s Bot Management system as being generated by a bot. This includes requests with a bot score between 1 and 29 inclusive. This has not changed from last year’s report.
API traffic: any HTTP* request with a response content type of XML or JSON. Where the response content type is not available, such as for mitigated requests, the equivalent Accept content type (specified by the user agent) is used instead. In this latter case, API traffic won’t be fully accounted for, but it still provides a good representation for the purposes of gaining insights.
Unless otherwise stated, the time frame evaluated in this post is the 12 month period from March 2022 through February 2023 inclusive.
Finally, please note that the data is calculated based only on traffic observed across the Cloudflare network and does not necessarily represent overall HTTP traffic patterns across the Internet.
*When referring to HTTP traffic we mean both HTTP and HTTPS.
Global traffic insights
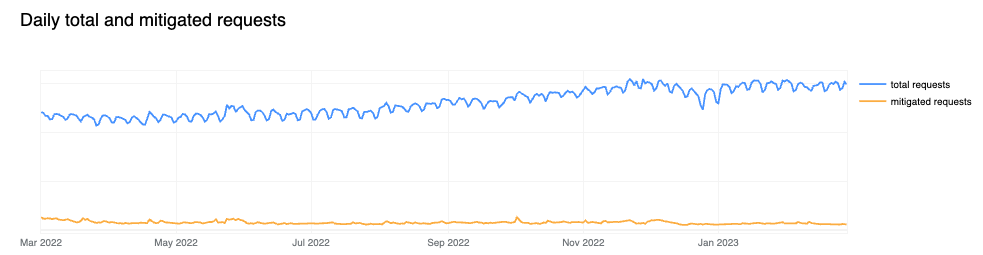
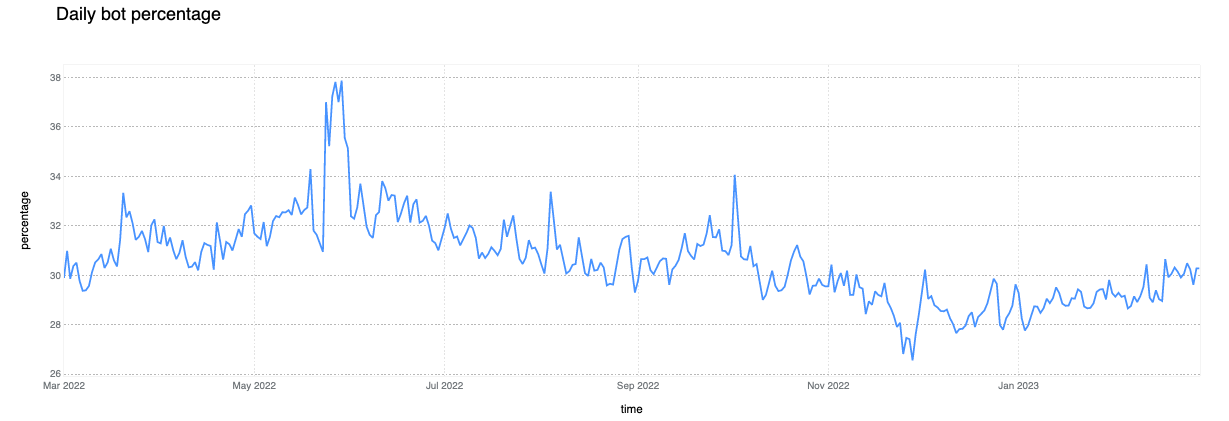
6% of daily HTTP requests are mitigated on average
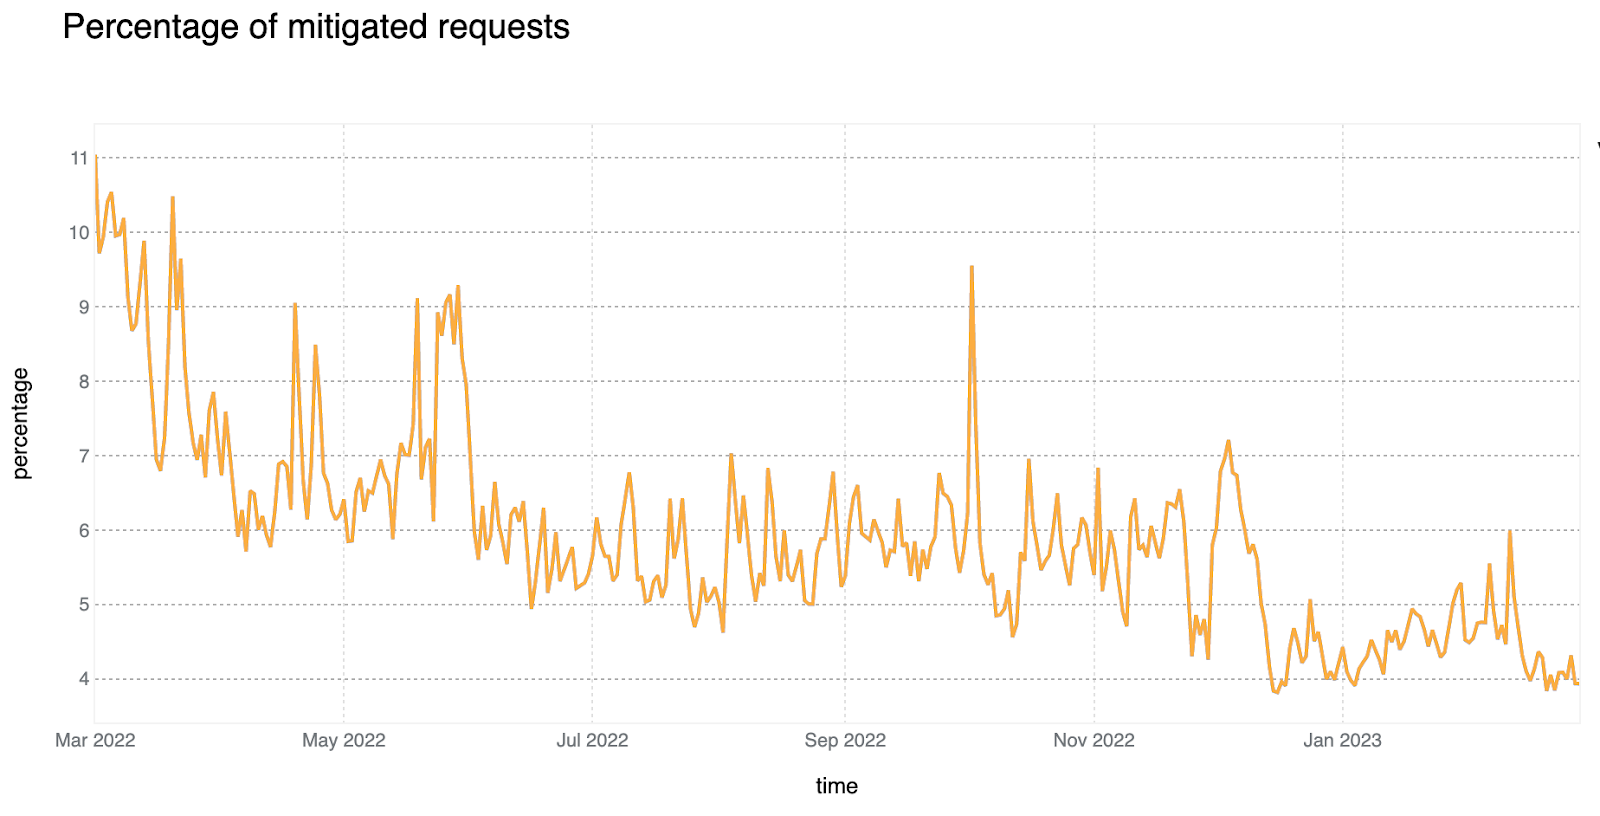
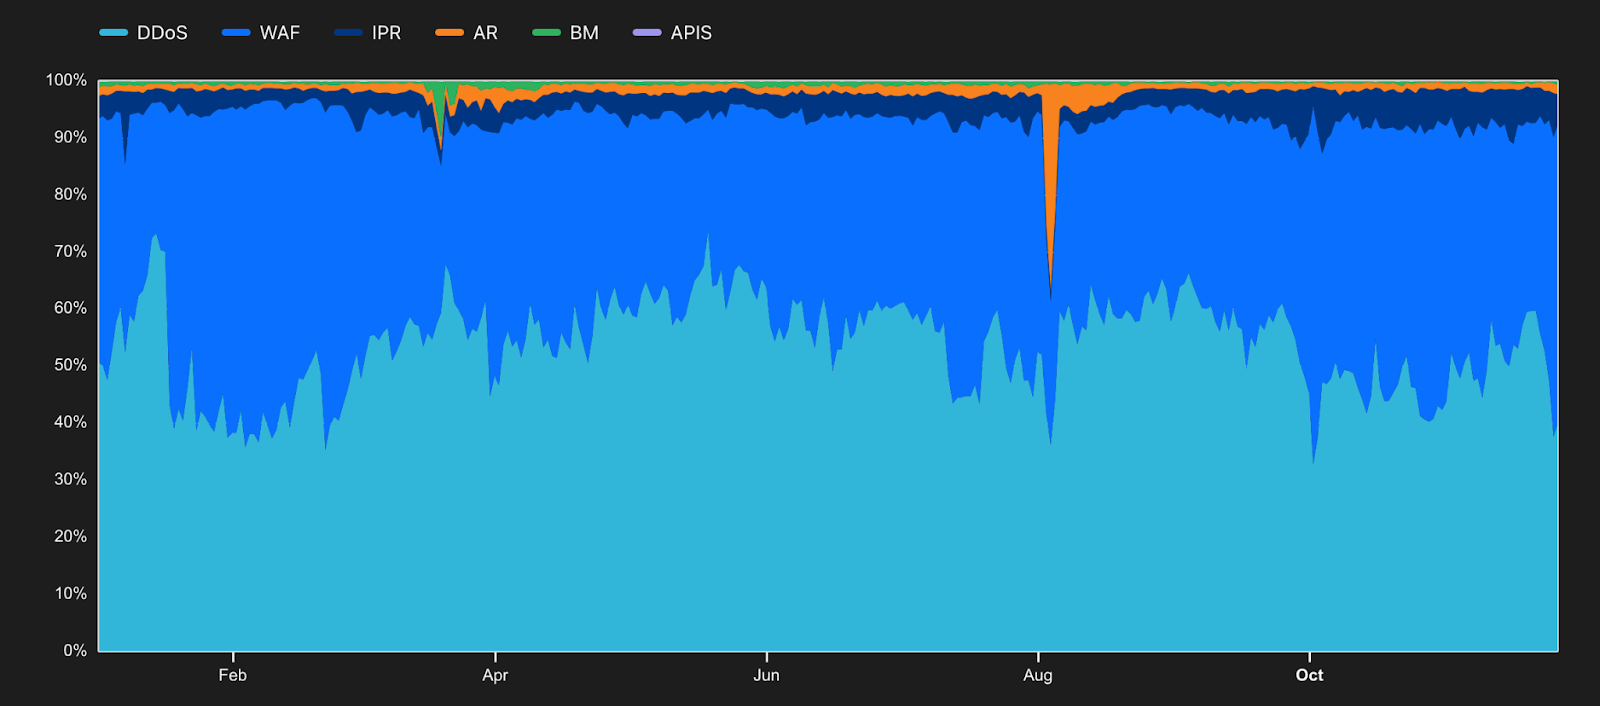
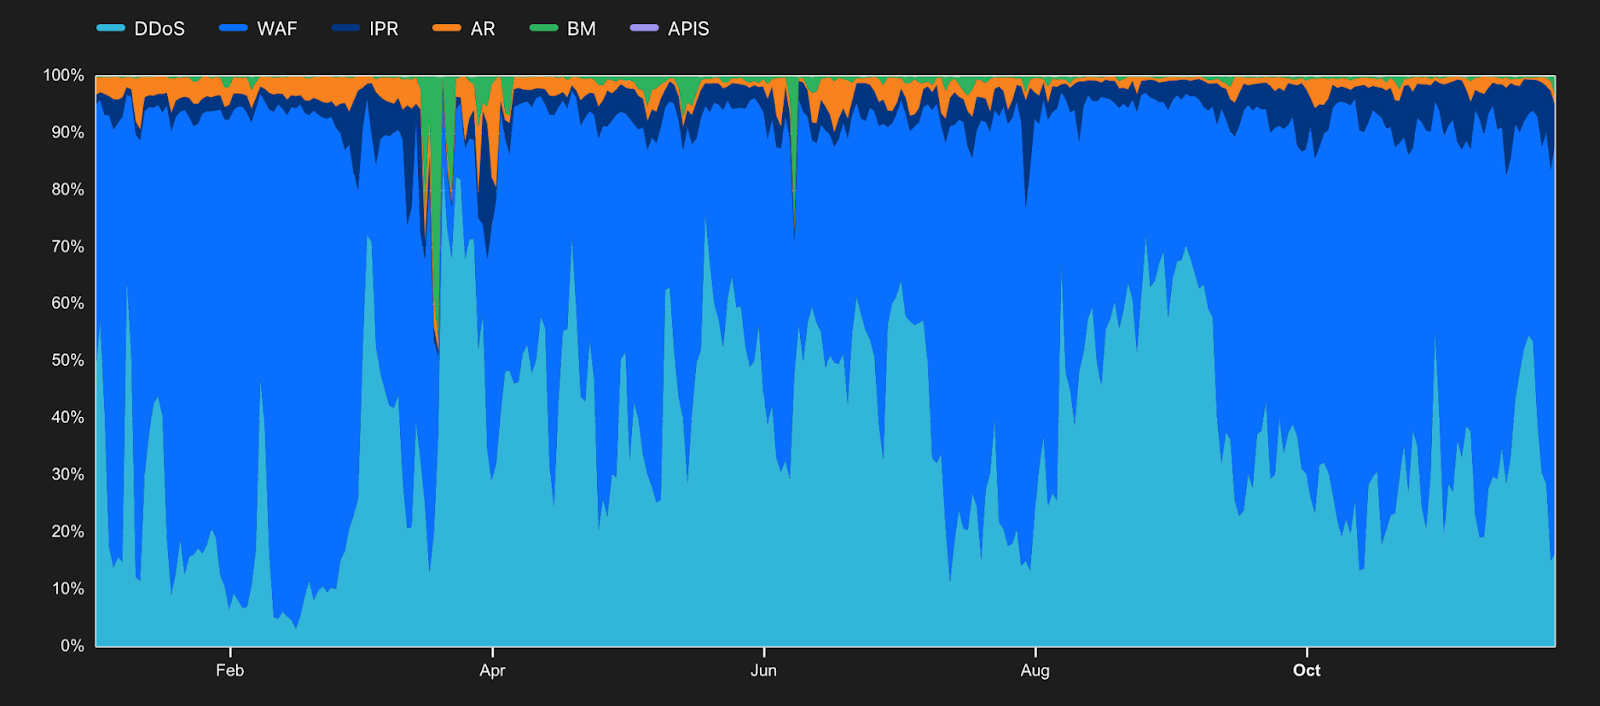
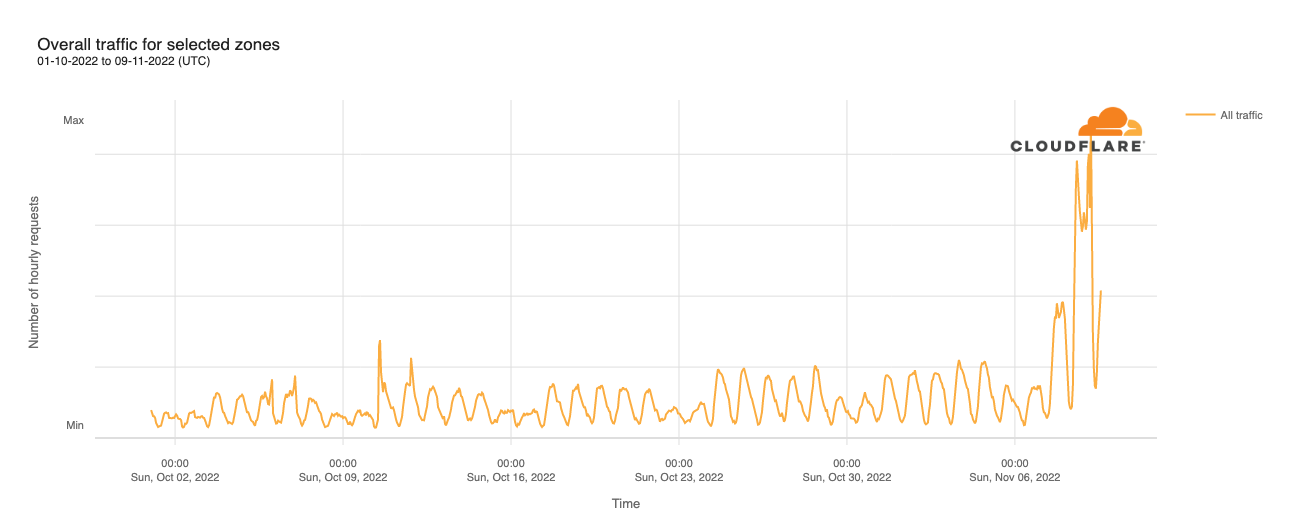
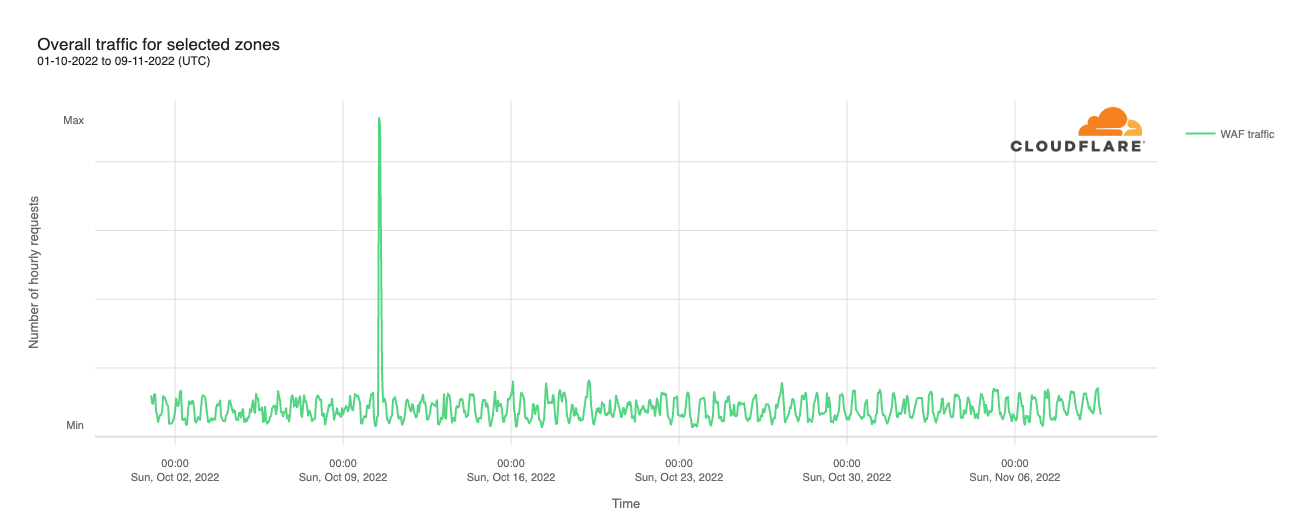
In looking at all HTTP requests proxied by the Cloudflare network, we find that the share of requests that are mitigated has dropped to 6%, down two percentage points compared to last year. Looking at 2023 to date, we see that mitigated request share has fallen even further, to between 4-5%. Large spikes visible in the chart below, such as those seen in June and October, often correlate with large DDoS attacks mitigated by Cloudflare. It is interesting to note that although the percentage of mitigated traffic has decreased over time, the total mitigated request volume has been relatively stable as shown in the second chart below, indicating an increase in overall clean traffic globally rather than an absolute decrease in malicious traffic.
81% of mitigated HTTP requests were outright BLOCKed, with mitigations for the remaining set split across the various CHALLENGE type actions.
DDoS mitigation accounts for more than 50% of all mitigated traffic
Cloudflare provides various security features that customers can configure to keep their applications safe. Unsurprisingly, DDoS mitigation is still the largest contributor to mitigated layer 7 (application layer) HTTP requests. Just last month (February 2023), we reported the largest known mitigated DDoS attack by HTTP requests/second volume (This particular attack is not visible in the graphs above because they are aggregated at a daily level, and the attack only lasted for ~5 minutes).
Compared to last year, however, mitigation by the Cloudflare WAF has grown significantly, and now accounts for nearly 41% of mitigated requests. This can be partially attributed to advances in our WAF technology that enables it to detect and block a larger range of attacks.
Tabular format for reference:
Source
Percentage %
DDoS Mitigation
52%
WAF
41%
IP reputation
4%
Access Rules
2%
Other
1%
Please note that in the table above, in contrast to last year, we are now grouping our products to match our marketing materials and the groupings used in the 2022 Radar Year in Review. This mostly affects our WAF product that comprises the combination of WAF Custom Rules, WAF Rate Limiting Rules, and WAF Managed Rules. In last year’s report, these three features accounted for an aggregate 31% of mitigations.
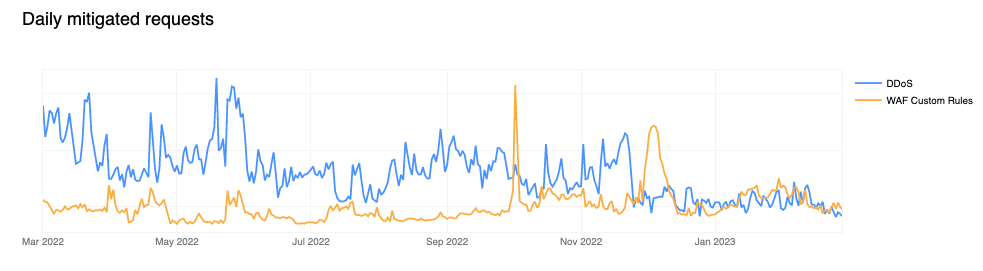
To understand the growth in WAF mitigated requests over time, we can look one level deeper where it becomes clear that Cloudflare customers are increasingly relying on WAF Custom Rules (historically referred to as Firewall Rules) to mitigate malicious traffic or implement business logic blocks. Observe how the orange line (firewallrules) in the chart below shows a gradual increase over time while the blue line (l7ddos) clearly trends lower.
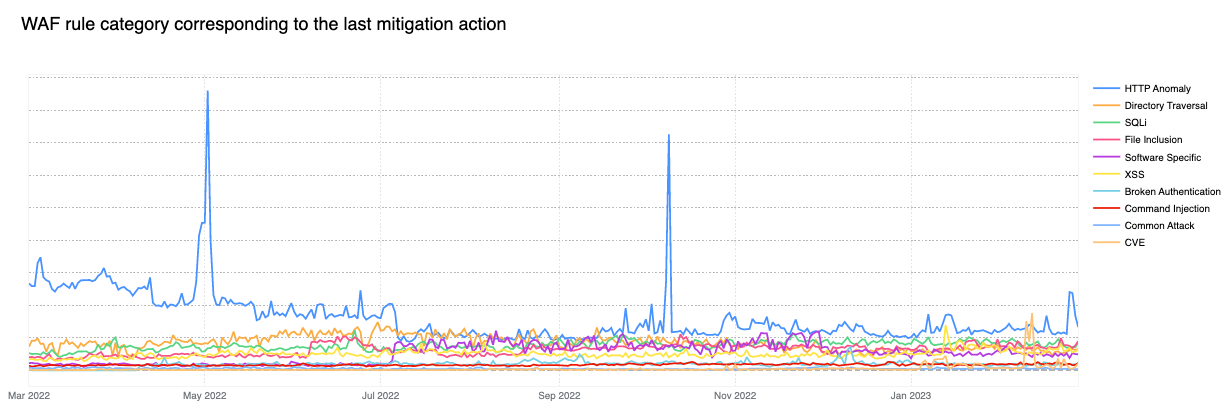
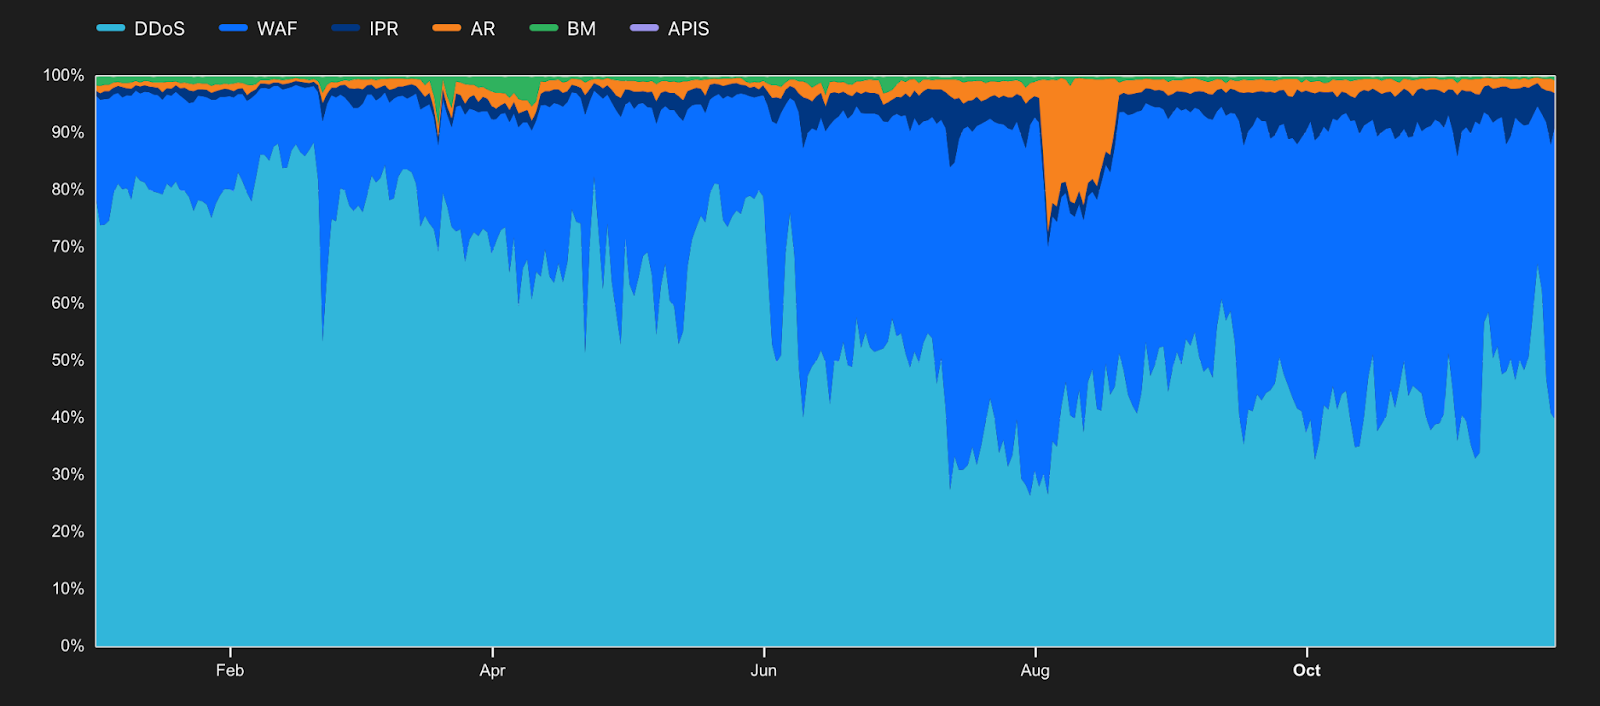
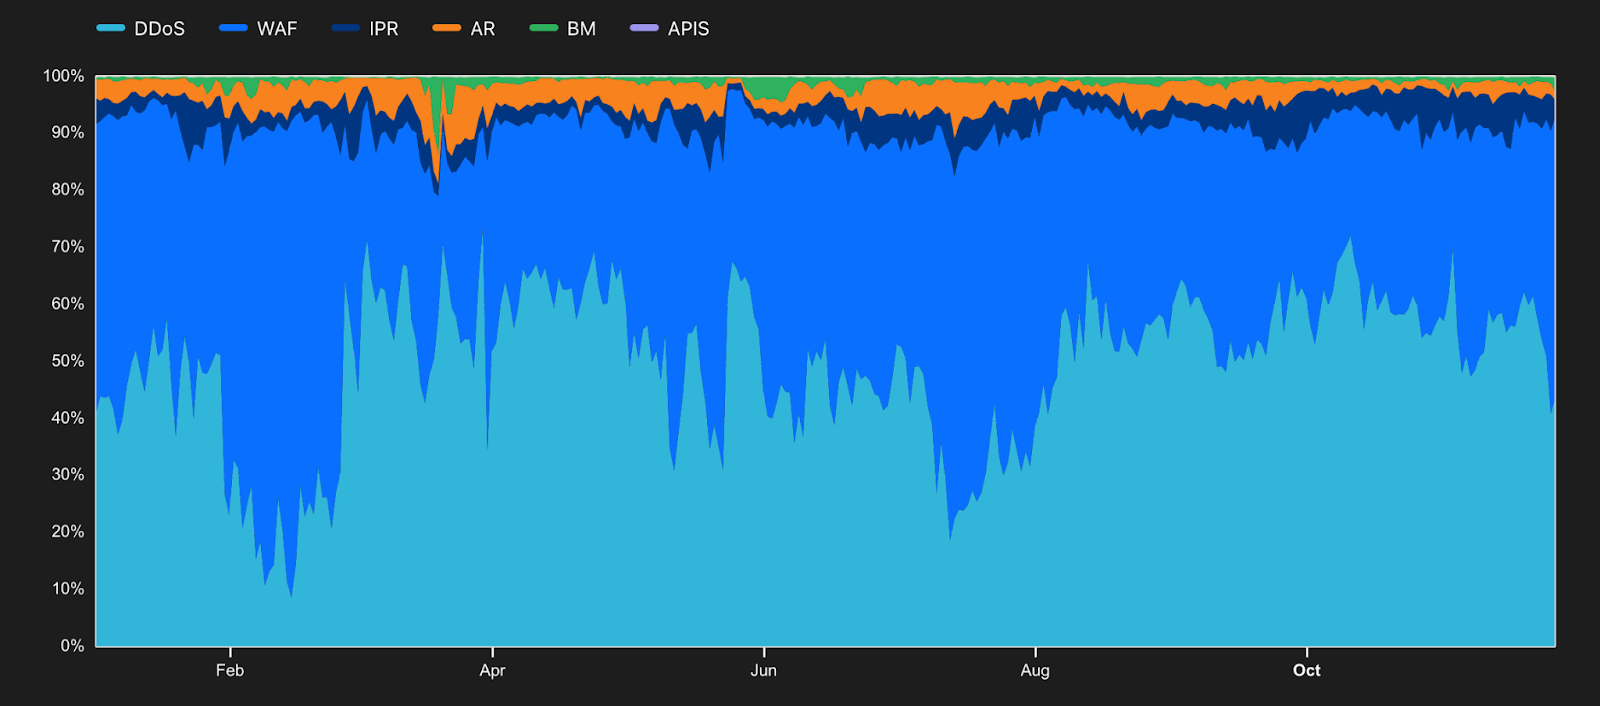
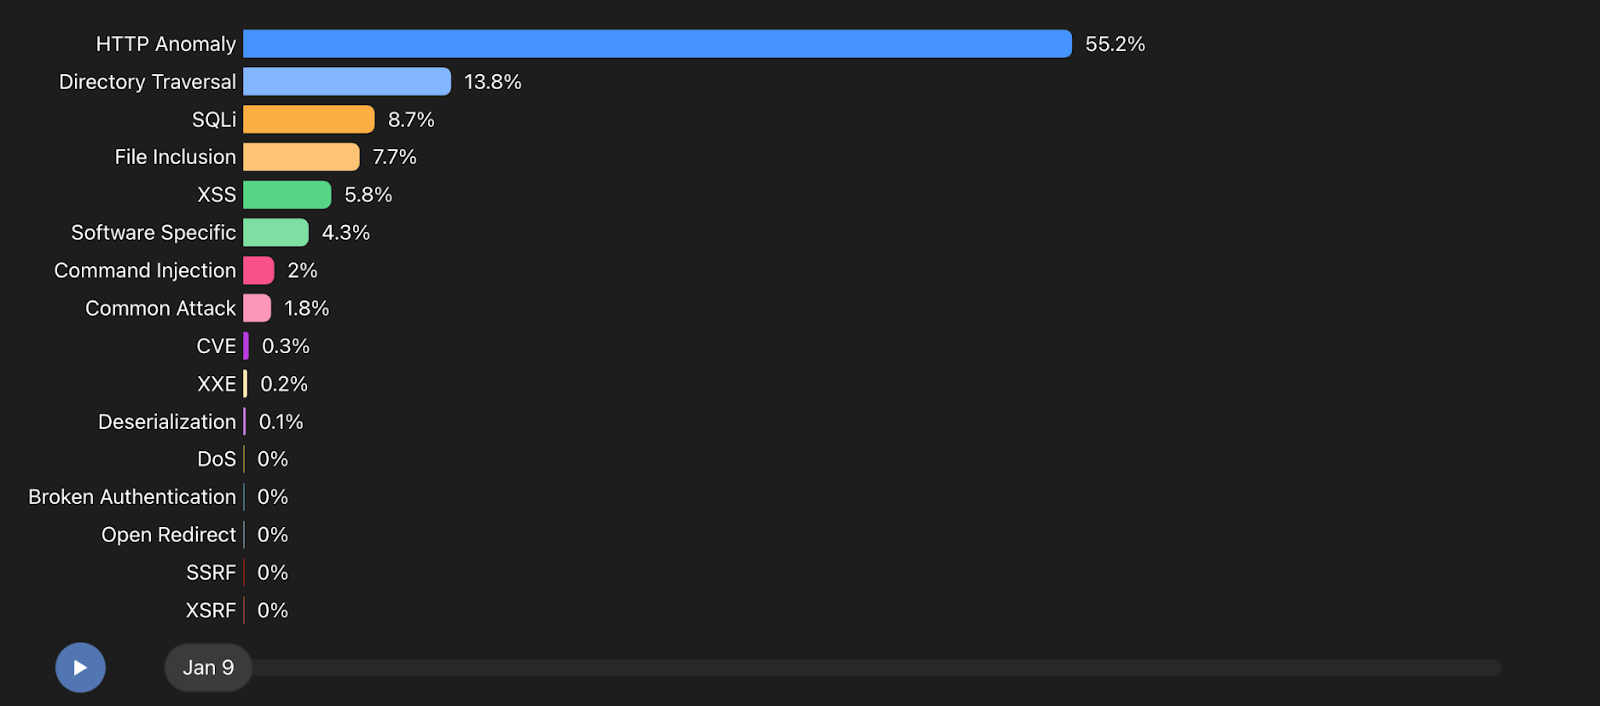
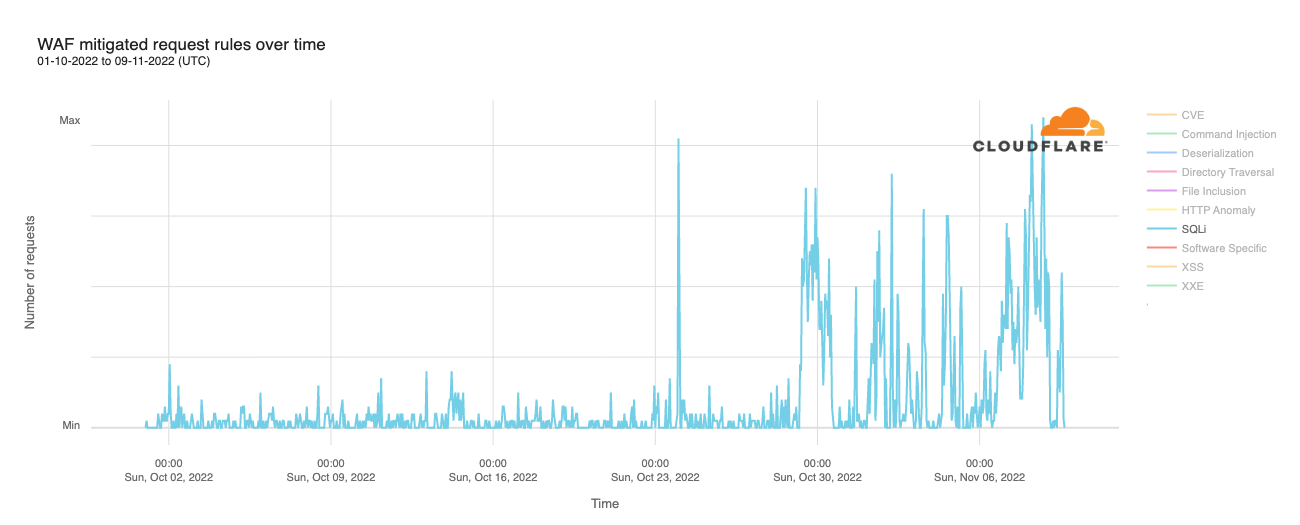
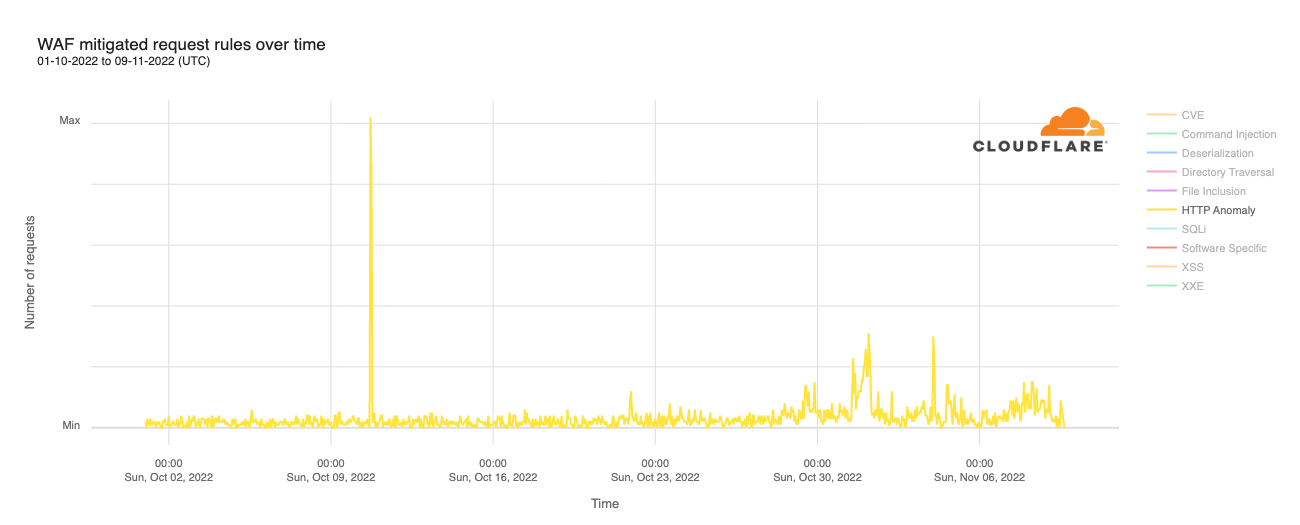
HTTP Anomaly is the most frequent layer 7 attack vector mitigated by the WAF
Contributing 30% of WAF Managed Rules mitigated traffic overall in March 2023, HTTP Anomaly’s share has decreased by nearly 25 percentage points as compared to the same time last year. Examples of HTTP anomalies include malformed method names, null byte characters in headers, non-standard ports or content length of zero with a POST request. This can be attributed to botnets matching HTTP anomaly signatures slowly changing their traffic patterns.
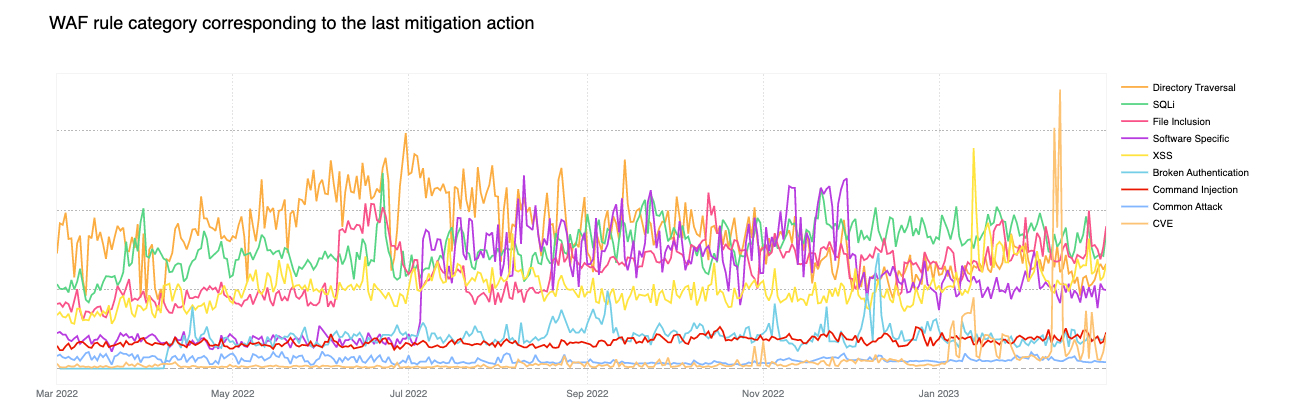
Removing the HTTP anomaly line from the graph, we can see that in early 2023, the attack vector distribution looks a lot more balanced.
Tabular format for reference (top 10 categories):
Source
Percentage % (last 12 months)
HTTP Anomaly
30%
Directory Traversal
16%
SQLi
14%
File Inclusion
12%
Software Specific
10%
XSS
9%
Broken Authentication
3%
Command Injection
3%
Common Attack
1%
CVE
1%
Of particular note is the orange line spike seen towards the end of February 2023 (CVE category). The spike relates to a sudden increase of two of our WAF Managed Rules:
These two rules are also tagged against CVE-2018-14774, indicating that even relatively old and known vulnerabilities are still often targeted in an effort to exploit potentially unpatched software.
Bot traffic insights
Cloudflare’s Bot Management solution has seen significant investment over the last twelve months. New features such as configurable heuristics, hardened JavaScript detections, automatic machine learning model updates, and Turnstile, Cloudflare’s free CAPTCHA replacement, make our classification of human vs. bot traffic improve daily.
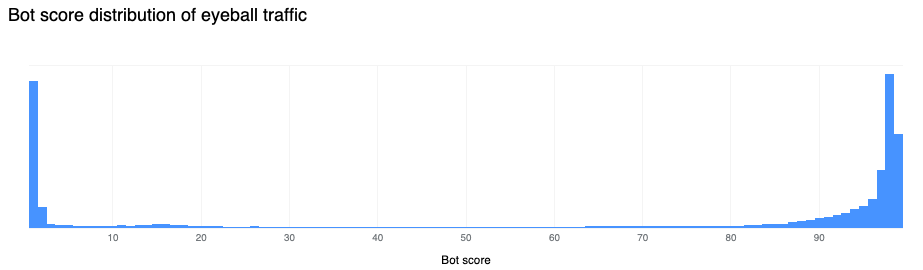
Our confidence in the classification output is very high. If we plot the bot scores across the traffic from the last week of February 2023, we find a very clear distribution, with most requests either being classified as definitely bot (less than 30) or definitely human (greater than 80) with most requests actually scoring less than 2 or greater than 95.
30% of HTTP traffic is automated
Over the last week of February 2023, 30% of Cloudflare HTTP traffic was classified as automated, equivalent to about 13 million HTTP requests/second on the Cloudflare network. This is 8 percentage points less than at the same time last year.
Looking at bot traffic only, we find that only 8% is generated by verified bots, comprising 2% of total traffic. Cloudflare maintains a list of known good (verified) bots to allow customers to easily distinguish between well-behaved bot providers like Google and Facebook and potentially lesser known or unwanted bots. There are currently 171 bots in the list.
16% of non-verified bot HTTP traffic is mitigated
Non-verified bot traffic often includes vulnerability scanners that are constantly looking for exploits on the web, and as a result, nearly one-sixth of this traffic is mitigated because some customers prefer to restrict the insights such tools can potentially gain.
Although verified bots like googlebot and bingbot are generally seen as beneficial and most customers want to allow them, we also see a small percentage (1.5%) of verified bot traffic being mitigated. This is because some site administrators don’t want portions of their site to be crawled, and customers often rely on WAF Custom Rules to enforce this business logic.
The most common action used by customers is to BLOCK these requests (13%), although we do have some customers configuring CHALLENGE actions (3%) to ensure any human false positives can still complete the request if necessary.
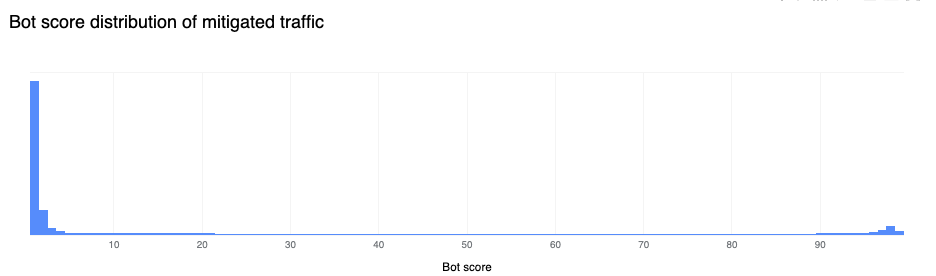
On a similar note, it is also interesting that nearly 80% of all mitigated traffic is classified as a bot, as illustrated in the figure below. Some may note that 20% of mitigated traffic being classified as human is still extremely high, but most mitigations of human traffic are generated by WAF Custom Rules, and are frequently due to customers implementing country-level or other related legal blocks on their applications. This is common, for example, in the context of US-based companies blocking access to European users for GDPR compliance reasons.
API traffic insights
55% of dynamic (non cacheable) traffic is API related
Just like our Bot Management solution, we are also investing heavily in tools to protect API endpoints. This is because a lot of HTTP traffic is API related. In fact, if you count only HTTP requests that reach the origin and are not cacheable, up to 55% of traffic is API related, as per the definition stated earlier. This is the same methodology used in last year’s report, and the 55% figure remains unchanged year-over-year.
If we look at cached HTTP requests only (those with a cache status of HIT, UPDATING, REVALIDATED and EXPIRED) we find that, maybe surprisingly, nearly 7% is API related. Modern API endpoint implementations and proxy systems, including our own API Gateway/caching feature set, in fact, allow for very flexible cache logic allowing both caching on custom keys as well as quick cache revalidation (as often as every second) allowing developers to reduce load on back end endpoints.
Including cacheable assets and other requests in the total count, such as redirects, the number goes down, but is still 25% of traffic. In the graph below we provide both perspectives on API traffic:
Yellow line: % of API traffic against all HTTP requests. This will include redirects, cached assets and all other HTTP requests in the total count;
Blue line: % of API traffic against dynamic traffic returning HTTP 200 OK response code only;
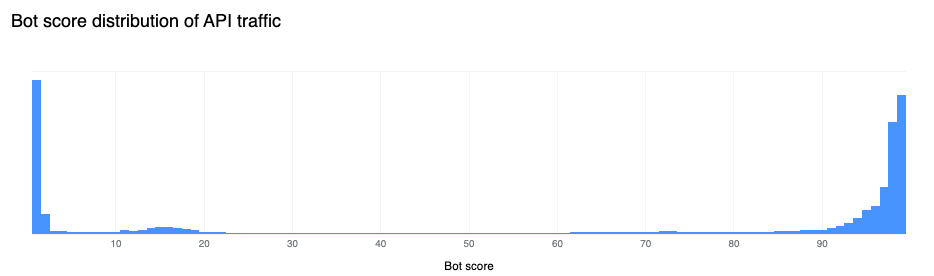
65% of global API traffic is generated by browsers
A growing number of web applications nowadays are built “API first”. This means that the initial HTML page load only provides the skeleton layout, and most dynamic components and data are loaded via separate API calls (for example, via AJAX). This is the case for Cloudflare’s own dashboard. This growing implementation paradigm is visible when analyzing the bot scores for API traffic. We can see in the figure below that a large amount of API traffic is generated by user-driven browsers classified as “human” by our system, with nearly two-thirds of it clustered at the high end of the “human” range.
Calculating mitigated API traffic is challenging, as we don’t forward the request to origin servers, and therefore cannot rely on the response content type. Applying the same calculation that was used last year, a little more than 2% of API traffic is mitigated, down from 10.2% last year.
HTTP Anomaly surpasses SQLi as most common attack vector on API endpoints
Compared to last year, HTTP anomalies now surpass SQLi as the most popular attack vector attempted against API endpoints (note the blue line being higher at the start of the graph just when last year’s report was published). Attack vectors on API traffic are not consistent throughout the year and show more variation as compared to global HTTP traffic. For example, note the spike in file inclusion attack attempts in early 2023.
Exploring account takeover attacks
Since March 2021, Cloudflare has provided a leaked credential check feature as part of its WAF. This allows customers to be notified (via an HTTP request header) whenever an authentication request is detected with a username/password pair that is known to be leaked. This tends to be an extremely effective signal at detecting botnets performing account takeover brute force attacks.
Customers also use this signal, on valid username/password pair login attempts, to issue two factor authentication, password reset, or in some cases, increased logging in the event the user is not the legitimate owner of the credentials.
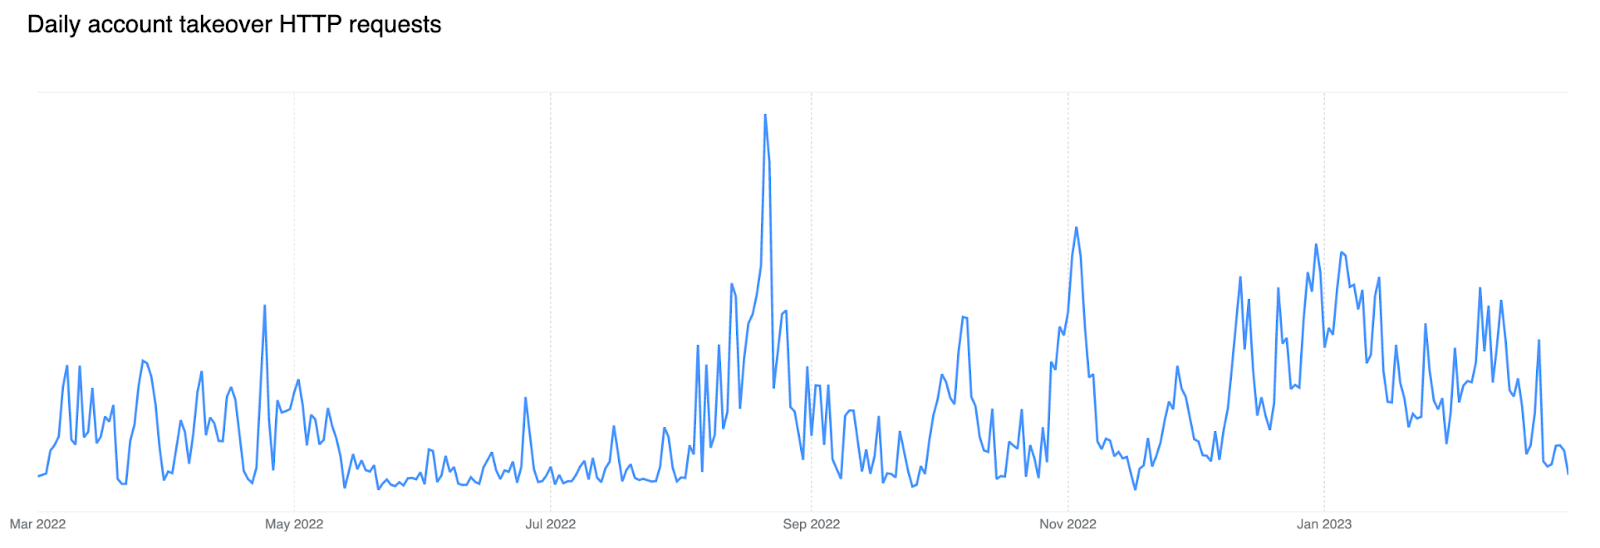
Brute force account takeover attacks are increasing
If we look at the trend of matched requests over the past 12 months, an increase is noticeable starting in the latter half of 2022, indicating growing fraudulent activity against login endpoints. During large brute force attacks we have observed matches against HTTP requests with leaked credentials at a rate higher than 12k per minute.
Our leaked credential check feature has rules matching authentication requests for the following systems:
Drupal
Ghost
Joomla
Magento
Plone
WordPress
Microsoft Exchange
Generic rules matching common authentication endpoint formats
This allows us to compare activity from malicious actors, normally in the form of botnets, attempting to “break into” potentially compromised accounts.
Microsoft Exchange is attacked more than WordPress
Mostly due to its popularity, you might expect WordPress to be the application most at risk and/or observing most brute force account takeover traffic. However, looking at rule matches from the supported systems listed above, we find that after our generic signatures, the Microsoft Exchange signature is the most frequent match.
Most applications experiencing brute force attacks tend to be high value assets, and Exchange accounts being the most likely targeted according to our data reflects this trend.
If we look at leaked credential match traffic by source country, the United States leads by a fair margin. Potentially notable is the absence of China in top contenders given network size. The only exception is Ukraine leading during the first half of 2022 towards the start of the war — the yellow line seen in the figure below.
Looking forward
Given the amount of web traffic carried by Cloudflare, we observe a broad spectrum of attacks. From HTTP anomalies, SQL injection attacks, and cross-site scripting (XSS) to account takeover attempts and malicious bots, the threat landscape is constantly changing. As such, it is critical that any business operating online is investing in visibility, detection, and mitigation technologies so that they can ensure their applications, and more importantly, their end user’s data, remains safe.
We hope that you found the findings in this report interesting, and at the very least, gave you an appreciation on the state of application security on the Internet. There are a lot of bad actors online, and there is no indication that Internet security is getting easier.
We are already planning an update to this report including additional data and insights across our product portfolio. Keep an eye on Cloudflare Radar for more frequent application security reports and insights.
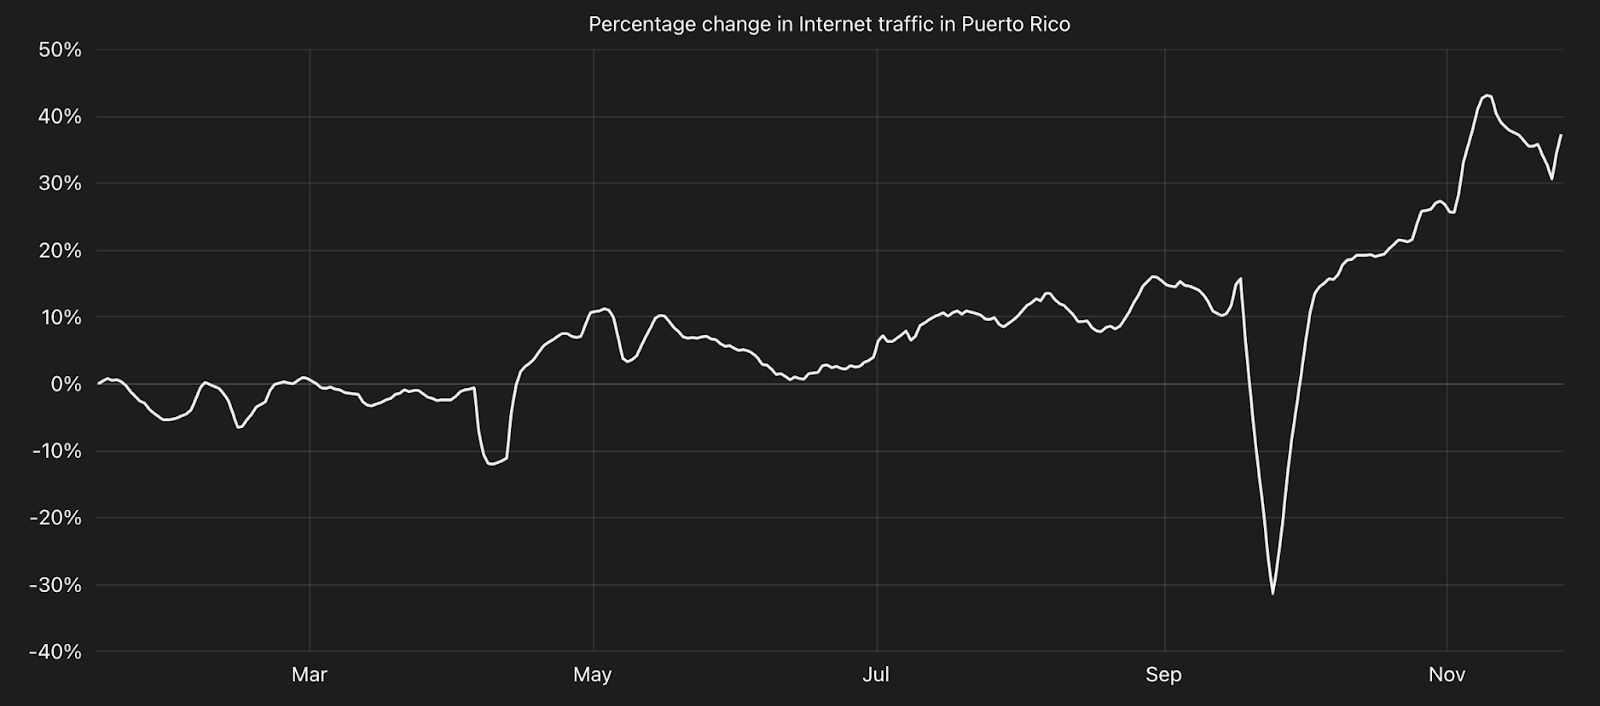
The Internet has become a significant factor in geopolitical conflicts, such as the ongoing war in Ukraine. Tomorrow marks one year since the Russian invasion of that country. This post reports on Internet insights and discusses how Ukraine’s Internet remained resilient in spite of dozens of disruptions in three different stages of the conflict.
Key takeaways:
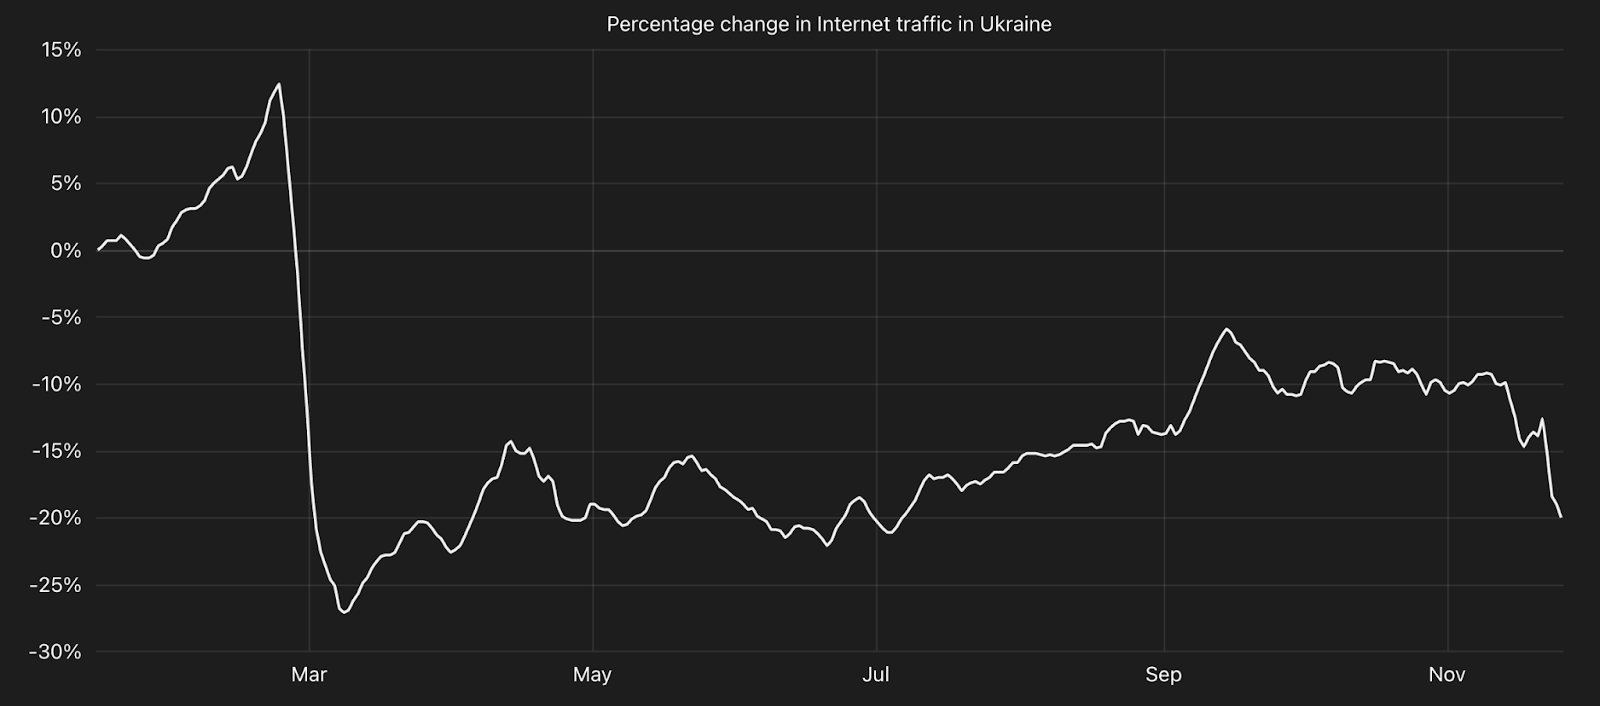
Internet traffic shifts in Ukraine are clearly visible from east to west as Ukrainians fled the war, with country-wide traffic dropping as much as 33% after February 24, 2022.
Air strikes on energy infrastructure starting in October led to widespread Internet disruptions that continue in 2023.
Application-layer cyber attacks in Ukraine rose 1,300% in early March 2022 compared to pre-war levels.
Government administration, financial services, and the media saw the most attacks targeting Ukraine.
Traffic from a number of networks in Kherson was re-routed through Russia between June and October, subjecting traffic to Russia’s restrictions and limitations, including content filtering. Even after traffic ceased to reroute through Russia, those Ukrainian networks saw major outages through at least the end of the year, while two networks remain offline.
Through efforts on the ground to repair damaged fiber optics and restore electrical power, Ukraine’s networks have remained resilient from both an infrastructure and routing perspective. This is partly due to Ukraine’s widespread connectivity to networks outside the country and large number of IXPs.
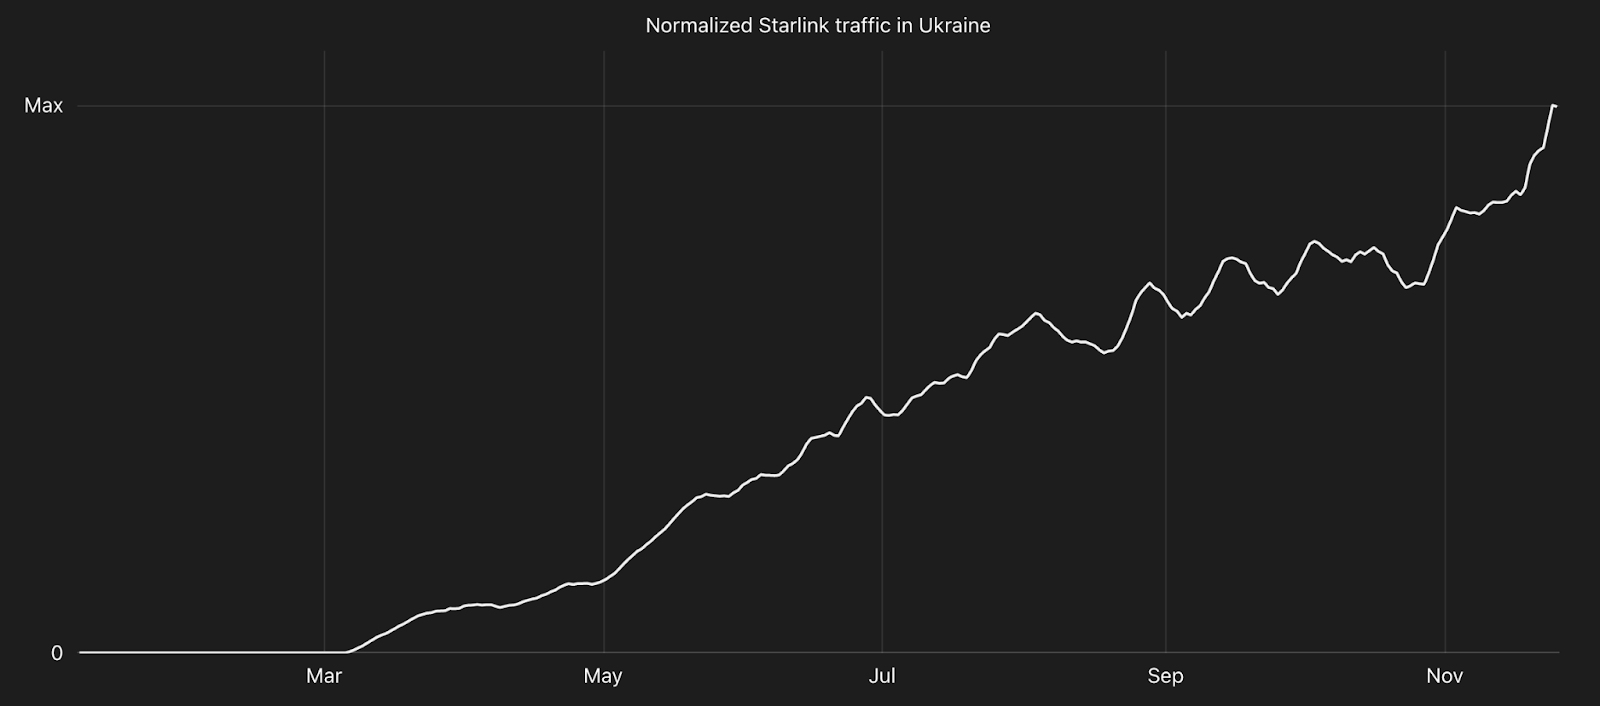
Starlink traffic in Ukraine grew over 500% between mid-March and mid-May, and continued to grow from mid-May through mid-November, increasing nearly 300% over that six-month period. For the full period from mid-March (two weeks after it was made available) to mid-December, it was over a 1,600% increase, dropping a bit after that.
Internet changes and disruptions
An Internet shock after February 24, 2022
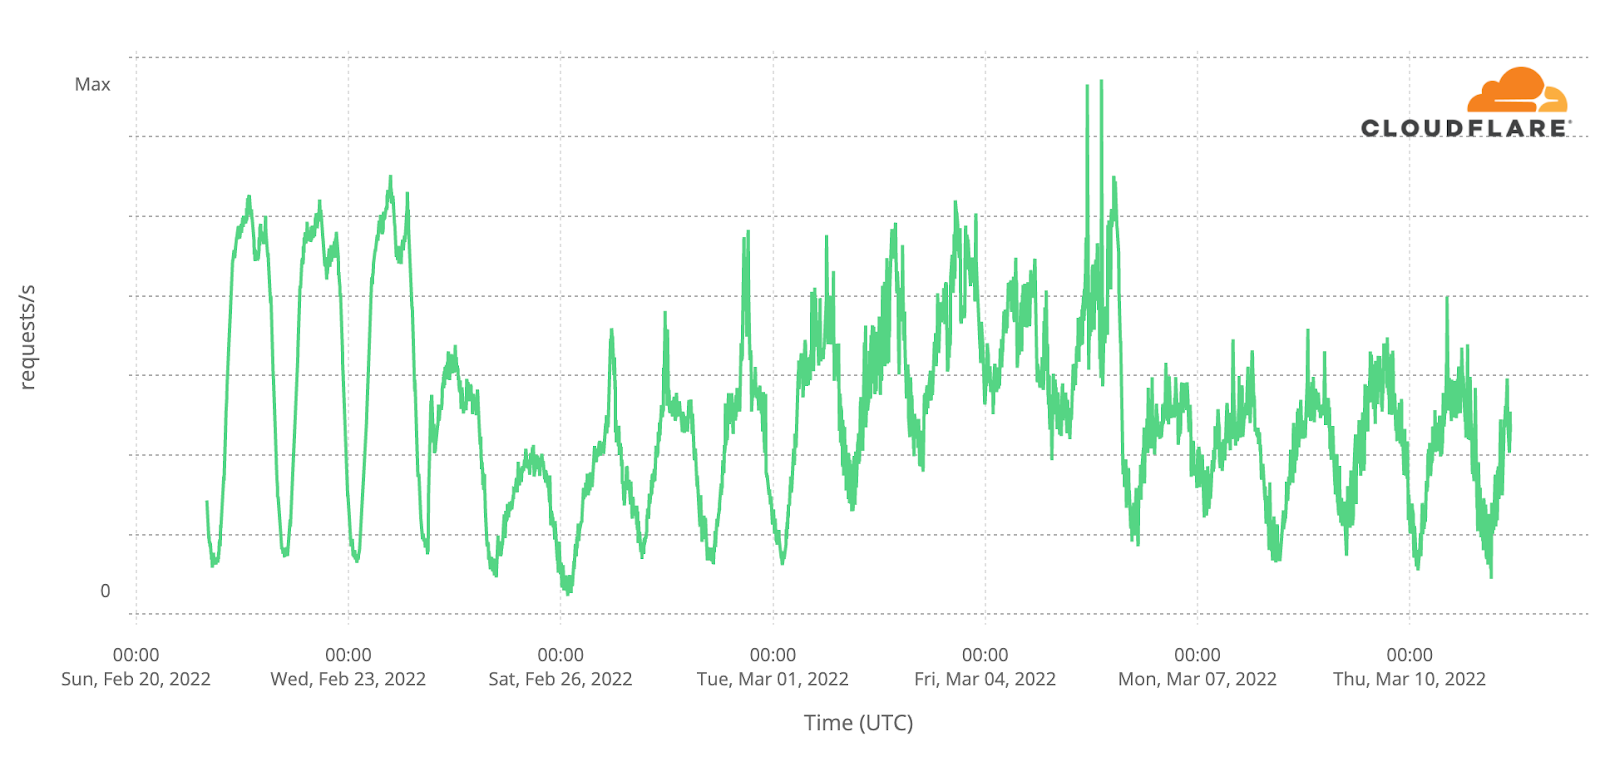
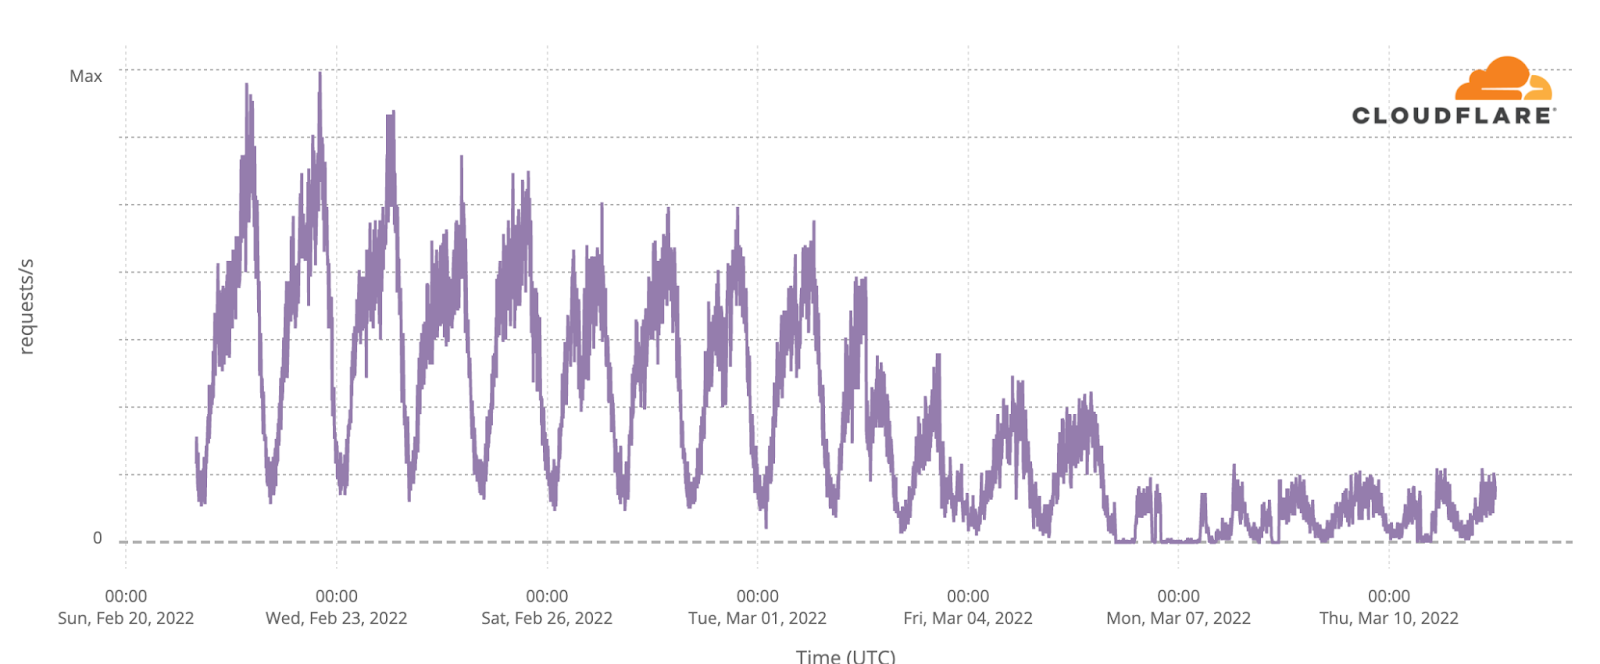
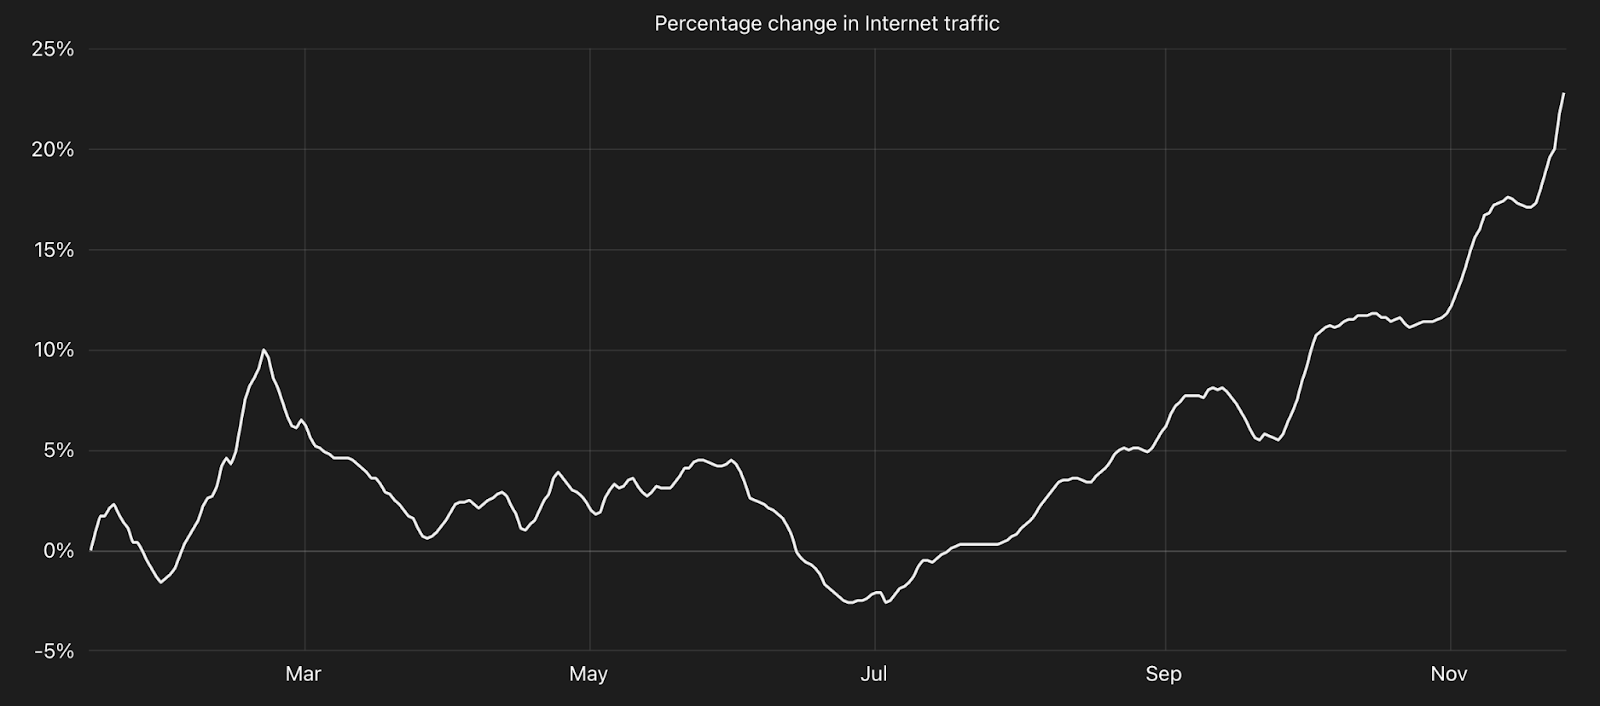
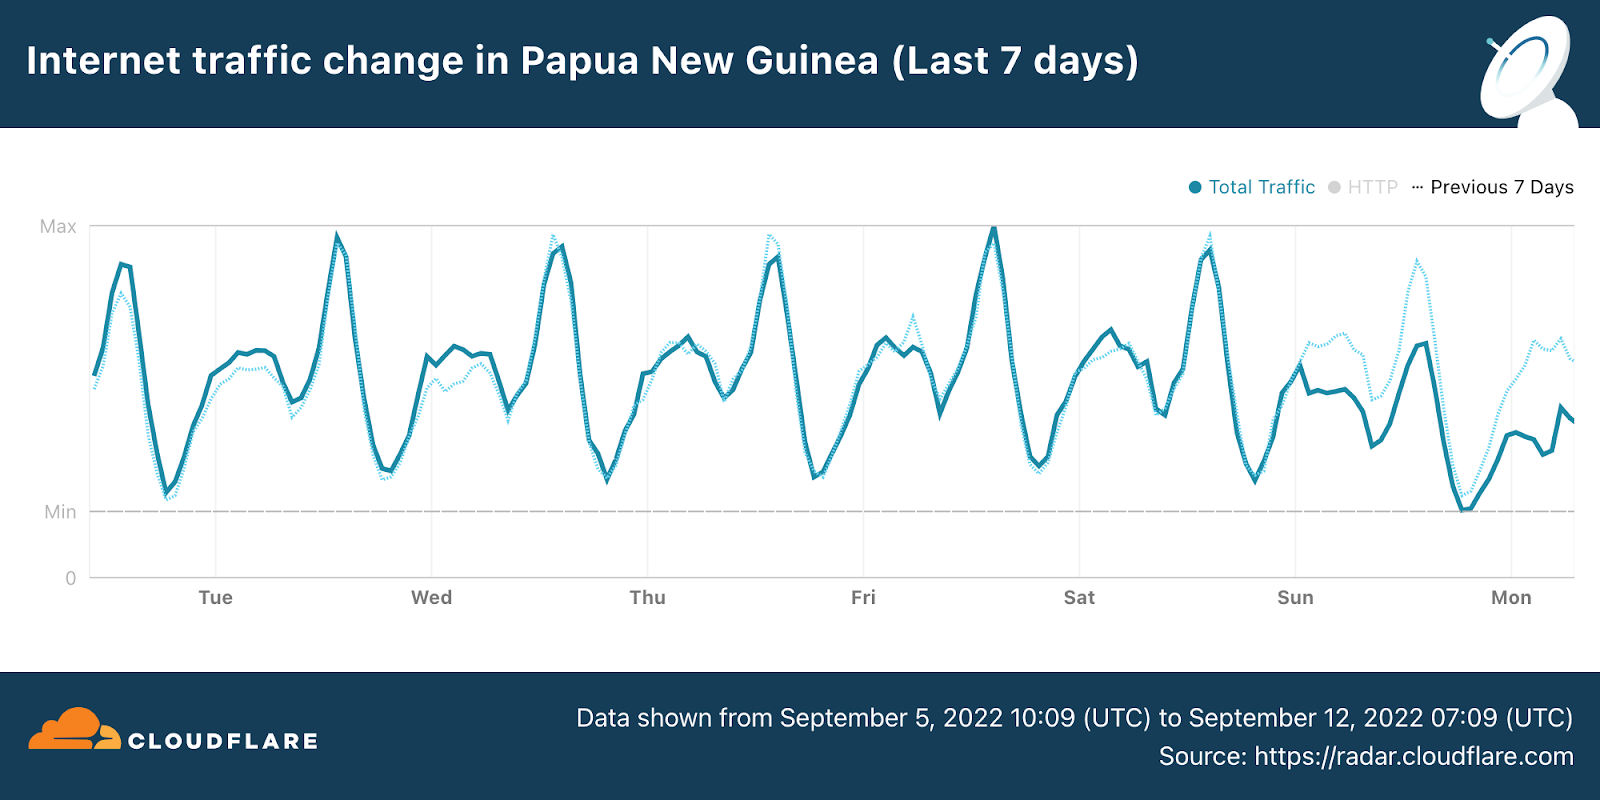
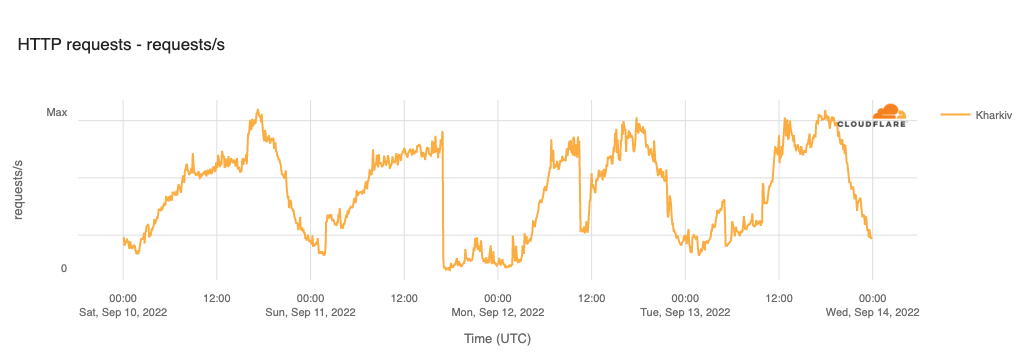
In Ukraine, human Internet traffic dropped as much as 33% in the weeks following February 24. The following chart shows Cloudflare’s perspective on daily traffic (by number of requests).
Internet traffic levels recovered over the next few months, including strong growth seen in September and October, when many Ukrainian refugees returned to the country. That said, there were also country-wide outages, mostly after October, that are discussed below.
14% of total traffic from Ukraine (including traffic from Crimea and other occupied regions) was mitigated as potential attacks, while 10% of total traffic to Ukraine was mitigated as potential attacks in the last 12 months.
Before February 24, 2022, typical weekday Internet traffic in Ukraine initially peaked after lunch, around 15:00 local time, dropped between 17:00 and 18:00 (consistent with people leaving work), and reached the biggest peak of the day at around 21:00 (possibly after dinner for mobile and streaming use).
After the invasion started, we observed less variation during the day in a clear change in the usual pattern given the reported disruption and “exodus” from the country. During the first few days after the invasion began, peak traffic occurred around 19:00, at a time when nights for many in cities such as Kyiv were spent in improvised underground bunkers. By late March, the 21:00 peak had returned, but the early evening drop in traffic did not return until May.
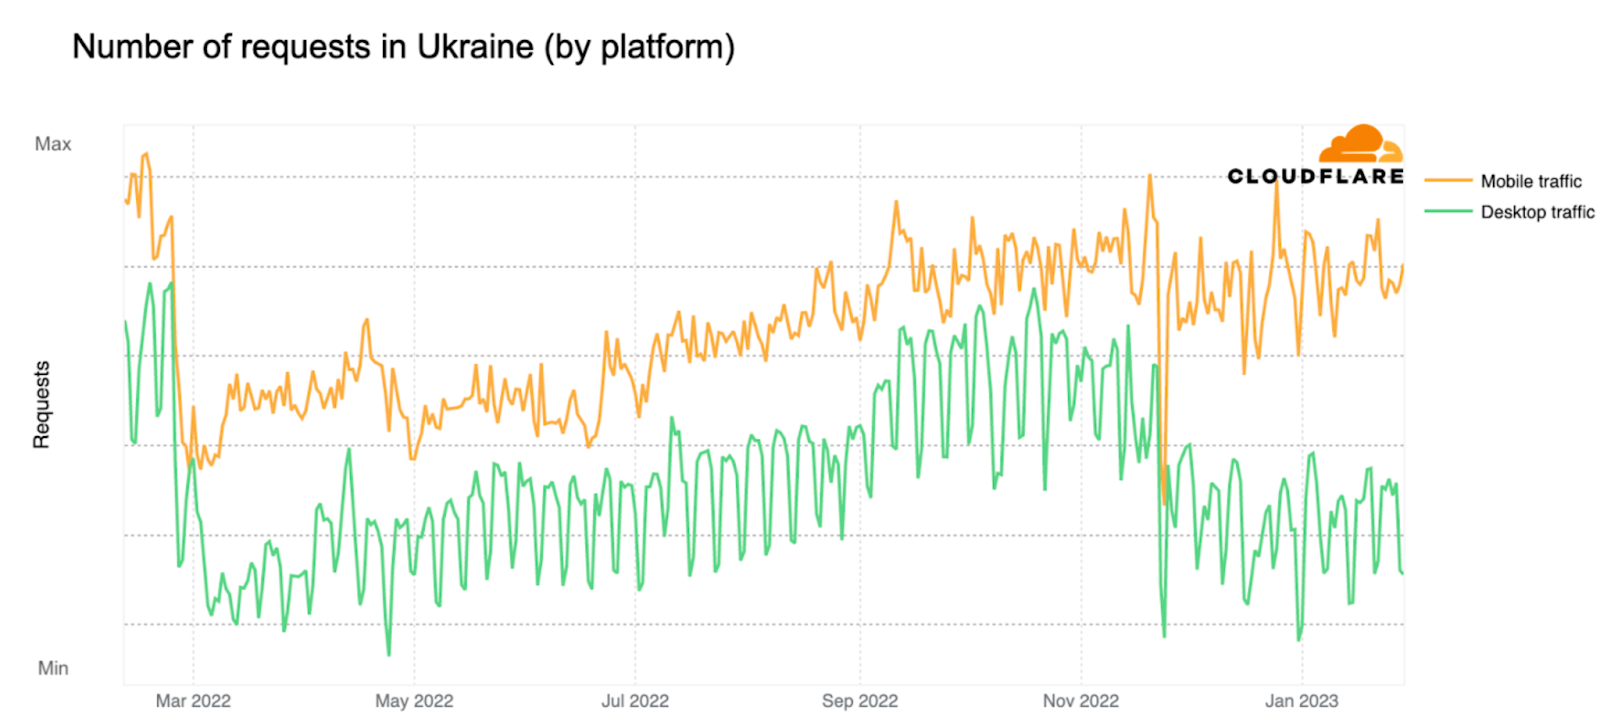
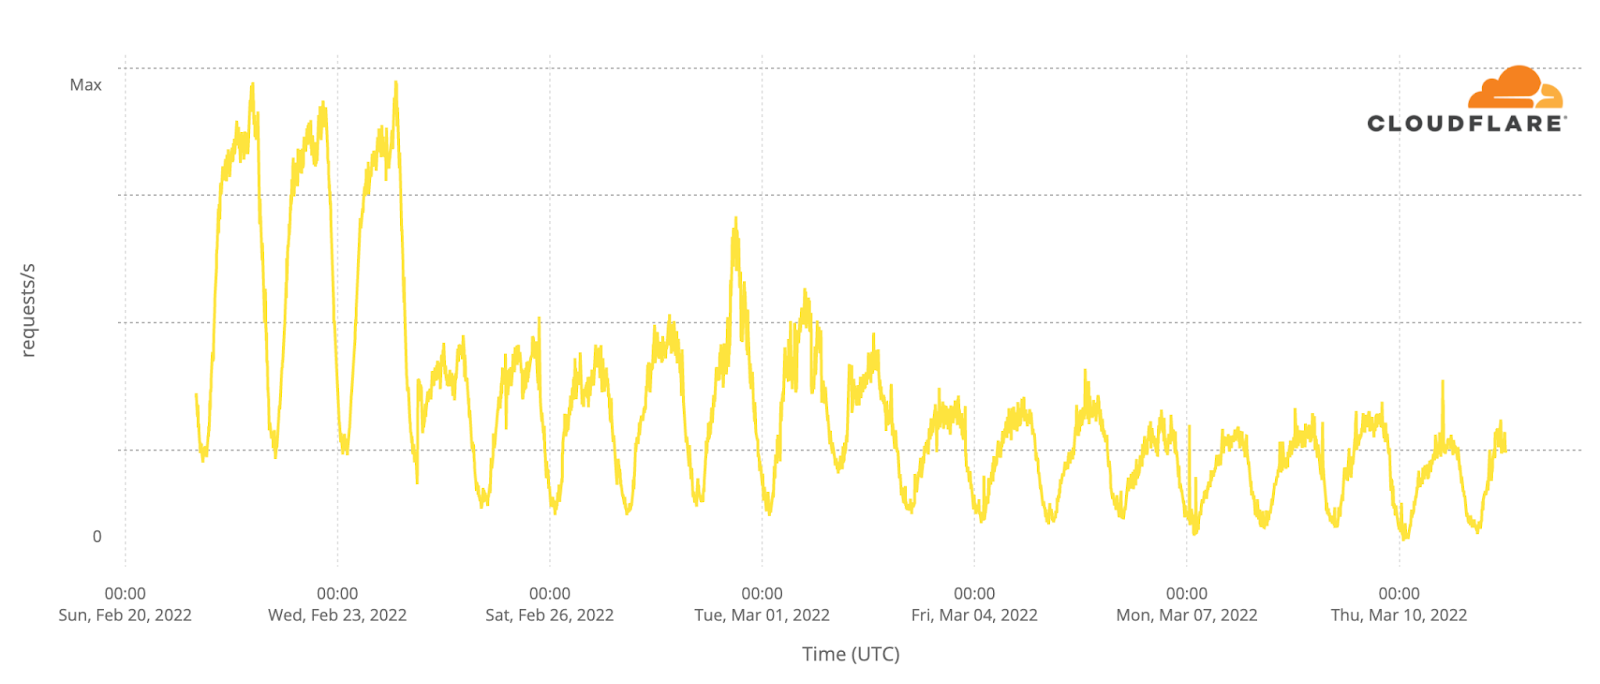
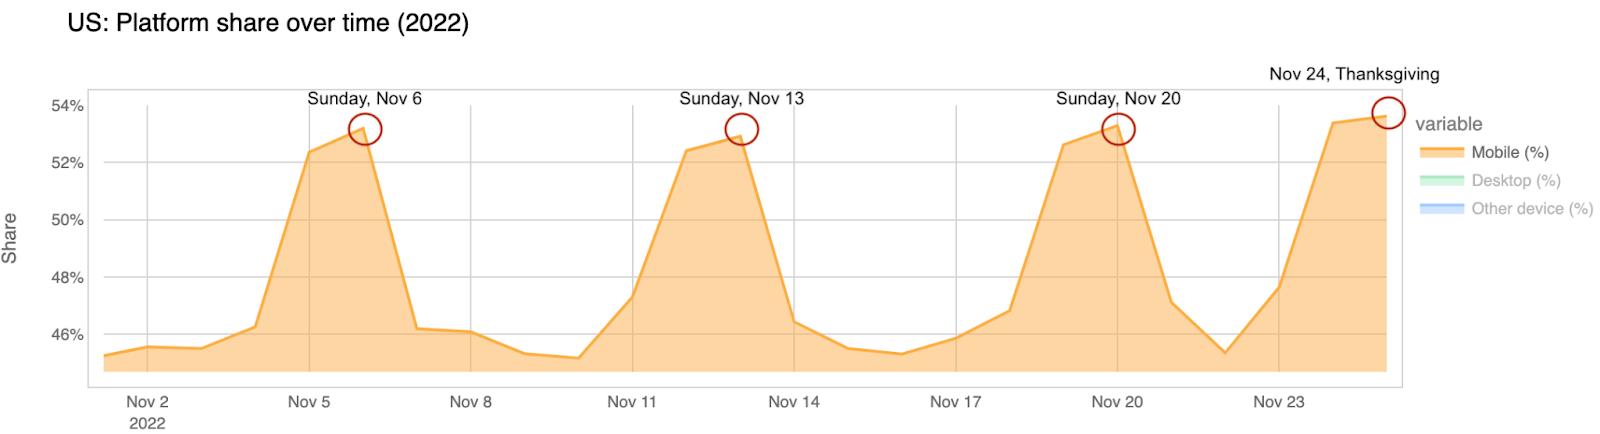
When looking at Ukraine Internet requests by type of trafficin the chart below (from February 10, 2022, through February 2023), we observe that while traffic from both mobile and desktop devices dropped after the invasion, request volume from mobile devices has remained higher over the past year. Pre-war, mobile devices accounted for around 53% of traffic, and grew to around 60% during the first weeks of the invasion. By late April, it had returned to typical pre-war levels, falling back to around 54% of traffic. There’s also a noticeable December drop/outage that we’ll go over below.
Millions moving from east to west in Ukraine
The invasion brought attacks and failing infrastructure across a number of cities, but the target in the early days wasn’t the country’s energy infrastructure, as it was in October 2022. In the first weeks of the war, Internet traffic changes were largely driven by people evacuating conflict zones with their families. Over eight million Ukrainians left the country in the first three months, and many more relocated internally to safer cities, although many returned during the summer of 2022. The Internet played a critical role during this refugee crisis, supporting communications and access to real-time information that could save lives, as well as apps providing services, among others.
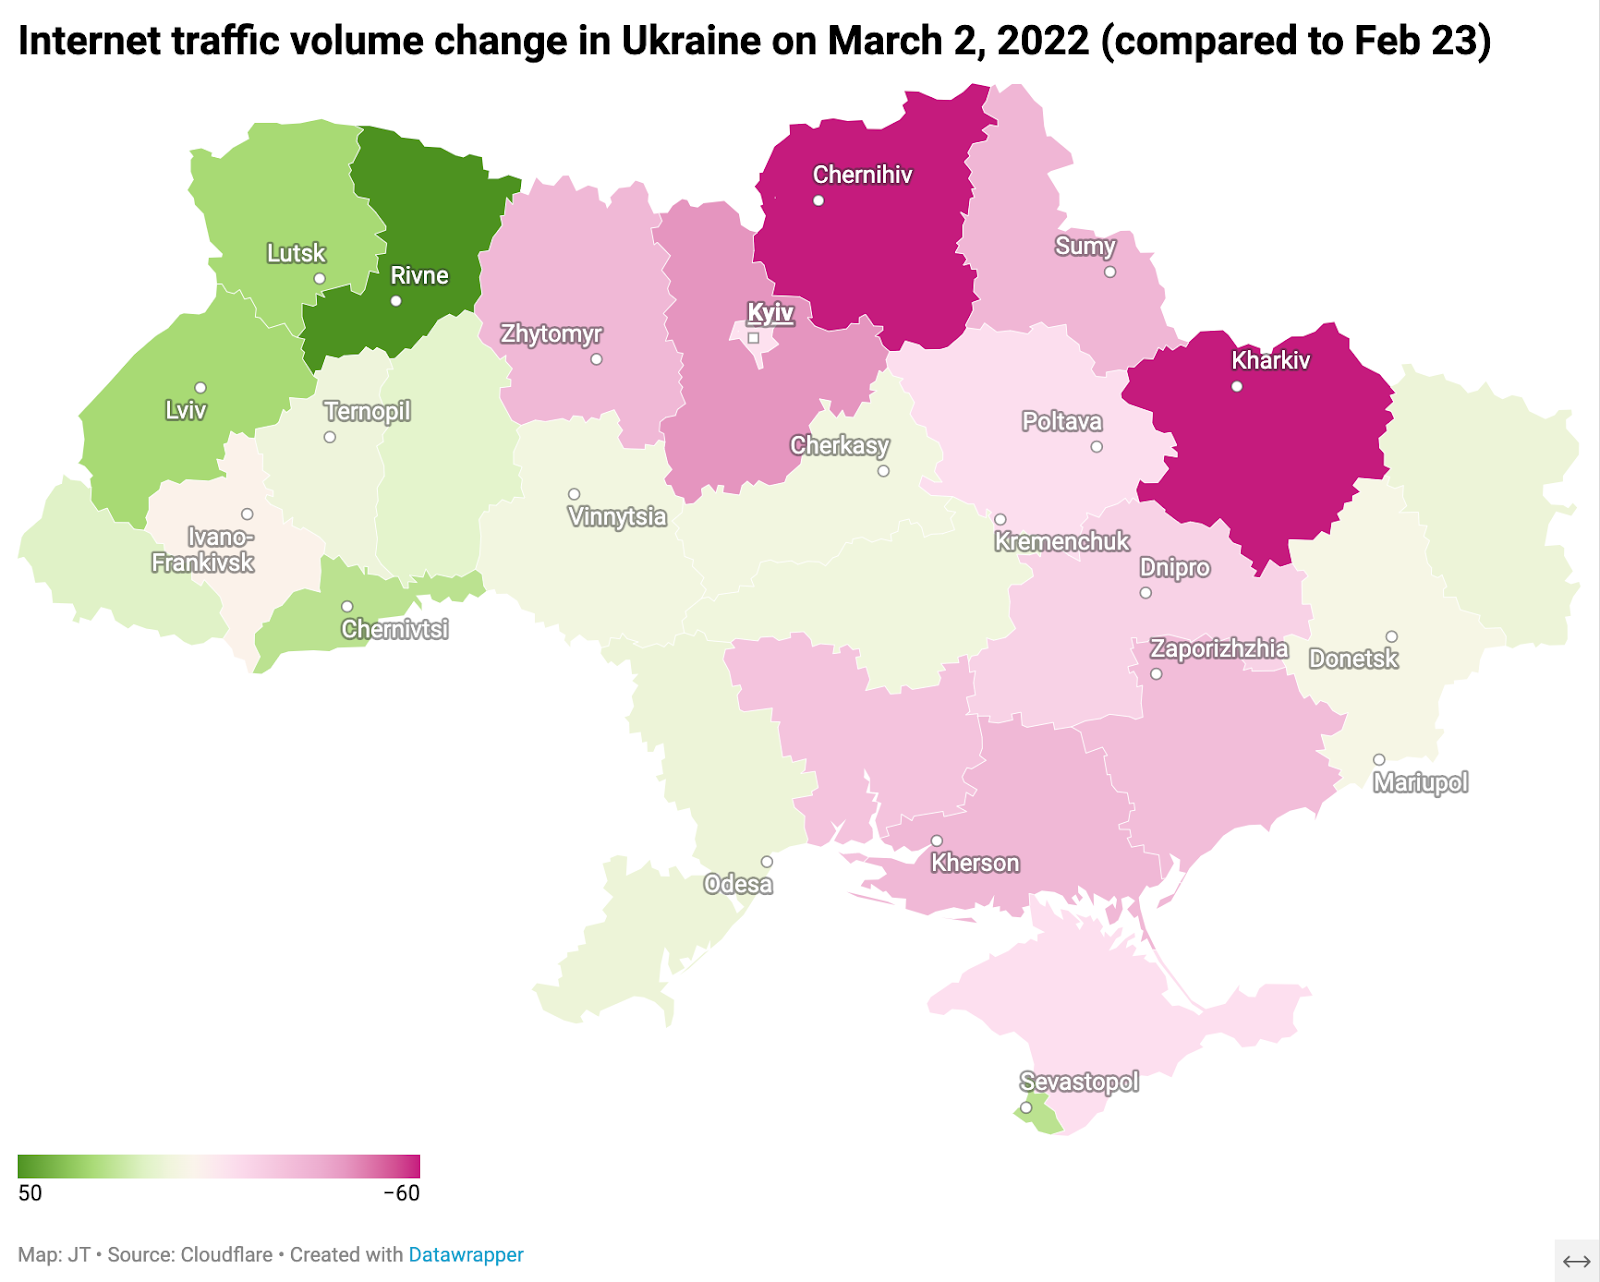
There was also an increase in traffic in the western part of Ukraine, in areas such as Lviv (further away from the conflict areas), and a decrease in the east, in areas like Kharkiv, where the Russian military was arriving and attacks were a constant threat. The figure below provides a view of how Internet traffic across Ukraine changed in the week after the war began (a darker pink means a drop in traffic — as much as 60% — while a darker green indicates an increase in Internet traffic — as much as 50%).
The biggest drops in Internet traffic observed in Ukraine in the first days of the war were in Kharkiv Oblast in the east, and Chernihiv in the north, both with a 60% decrease, followed by Kyiv Oblast, with traffic 40% lower on March 2, 2022, as compared with February 23.
In western Ukraine, traffic surged. The regions with the highest observed traffic growth included Rivne (50%), Volyn (30%), Lviv (28%), Chernivtsi (25%), and Zakarpattia (15%).
At the city level, analysis of Internet traffic in Ukraine gives us some insight into usage of the Internet and availability of Internet access in those first weeks, with noticeable outages in places where direct conflict was going on or that was already occupied by Russian soldiers.
North of Kyiv, the city of Chernihiv had a significant drop in traffic the first week of the war and residual traffic by mid-March, with traffic picking up only after the Russians retreated in early April.
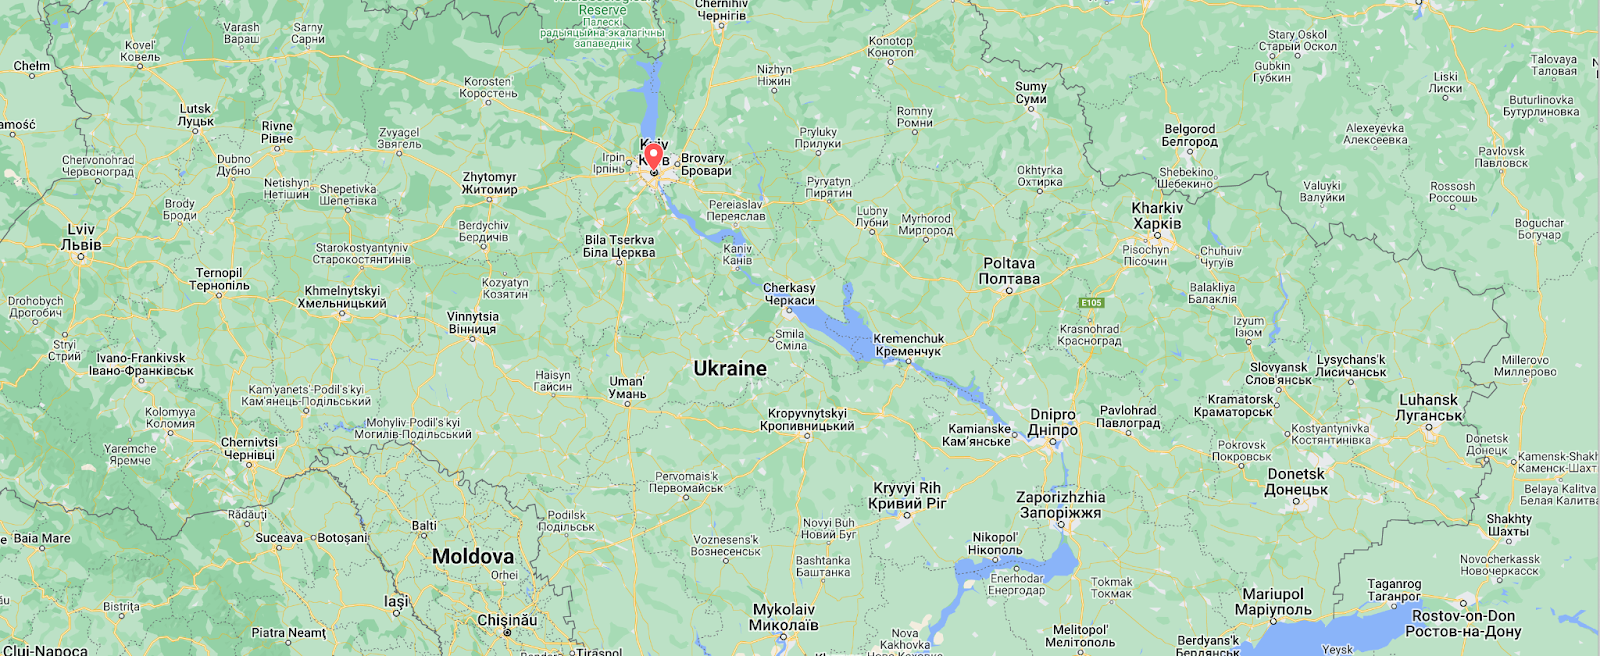
In the capital city of Kyiv, there is a clear disruption in Internet traffic right after the war started, possibly caused by people leaving, attacks and use of underground shelters.
Near Kyiv, we observed a clear outage in early March in Bucha. After April 1, when the Russians withdrew, Internet traffic started to come back a few weeks later.
In Irpin, just outside Kyiv, close to the Hostomel airport and Bucha, a similar outage pattern to Bucha was observed. Traffic only began to come back more clearly in late May.
In the east, in the city of Kharkiv, traffic dropped 50% on March 3, with a similar scenario seen not far away in Sumy. The disruption was related to people leaving and also by power outages affecting some networks.
Other cities in the south of Ukraine, like Berdyansk, had outages. This graph shows Enerhodar, the small city where Europe’s largest nuclear plant, Zaporizhzhya NPP, is located, with residual traffic compared to before.
In the cities located in the south of Ukraine, there were clear Internet disruptions. The Russians laid siege to Mariupol on February 24. Energy infrastructure strikes and shutdowns had an impact on local networks and Internet traffic, which fell to minimal levels by March 1. Estimates indicate that 95% of the buildings in the city were destroyed, and by mid-May, the city was fully under Russian control. While there was some increase in traffic by the end of April, it reached only ~22% of what it was before the war’s start.
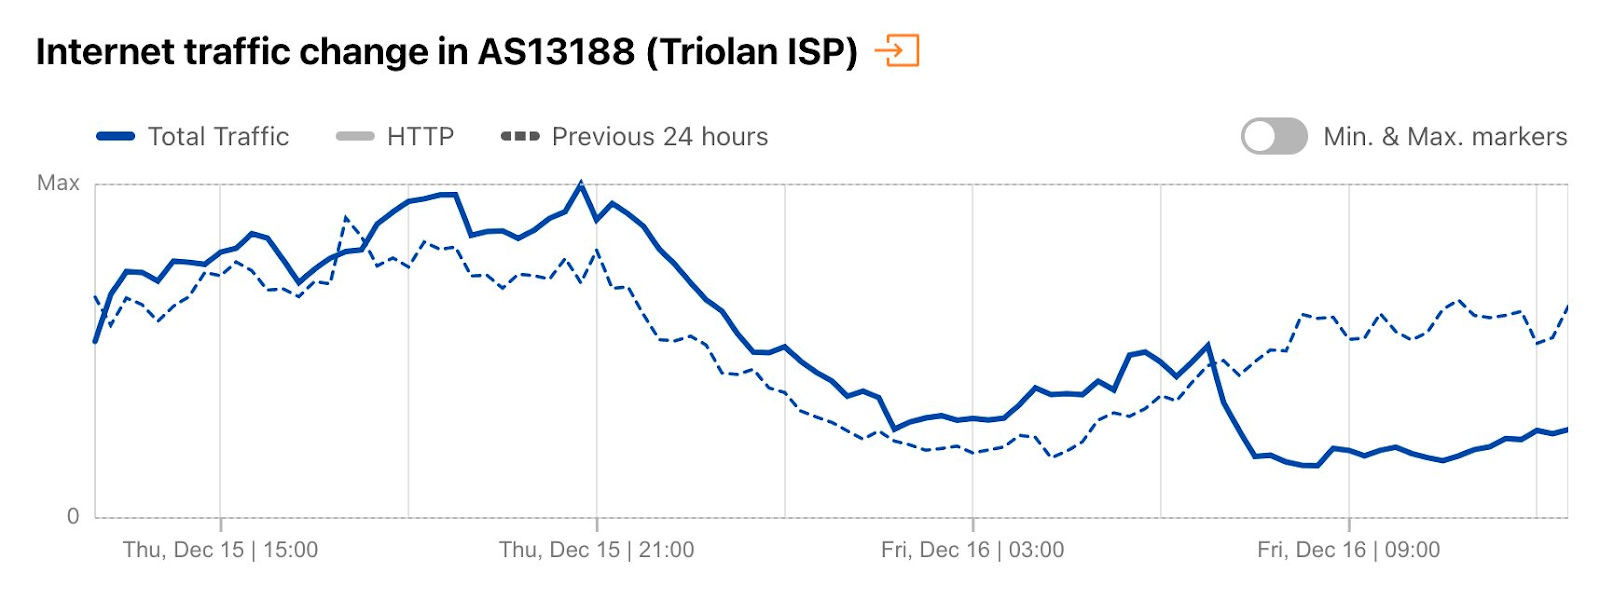
When looking at Ukrainian Internet Service Providers (ISPs) or the autonomous systems (ASNs) they use, we observed more localized disruptions in certain regions during the first months of the war, but recovery was almost always swift. AS6849 (Ukrtel) experienced problems with very short-term outages in mid-March. AS13188 (Triolan), which services Kyiv, Chernihiv, and Kharkiv, was another provider experiencing problems (they reported a cyberattack on March 9), as could be observed in the next chart:
We did not observe a clear national outage in Ukraine’s main ISP, AS15895 (Kyivstar) until the October-November attacks on energy infrastructure, which also shows some early resilience of Ukrainian networks.
Ukraine’s counteroffensive and its Internet impact
As Russian troops retreated from the northern front in Ukraine, they shifted their efforts to gain ground in the east (Battle of Donbas) and south (occupation of the Kherson region) after late April. This resulted in Internet disruptions and traffic shifts, which are discussed in more detail in a section below. However, Internet traffic in the Kherson region was intermittent and included outages after May, given the battle for Internet control. News reports in June revealed that ISP workers damaged their own equipment to thwart Russia’s efforts to control the Ukrainian Internet.
Before the September Ukrainian counteroffensive, another example of the war’s impact on a city’s Internet traffic occurred during the summer, when Russian troops seized Lysychansk in eastern Ukraine in early July after what became known as the Battle of Lysychansk. Internet traffic in Lysychansk clearly decreased after the war started. That slide continues during the intense fighting that took place after April, which led to most of the city’s population leaving. By May, traffic was almost residual (with a mid-May few days short term increase).
In early September the Ukrainian counteroffensive took off in the east, although the media initially reported a south offensive in Kherson Oblast that was a “deception” move. The Kherson offensive only came to fruition in late October and early November. Ukraine was able to retake in September over 500 settlements and 12,000 square kilometers of territory in the Kharkiv region. At that time, there were Internet outages in several of those settlements.
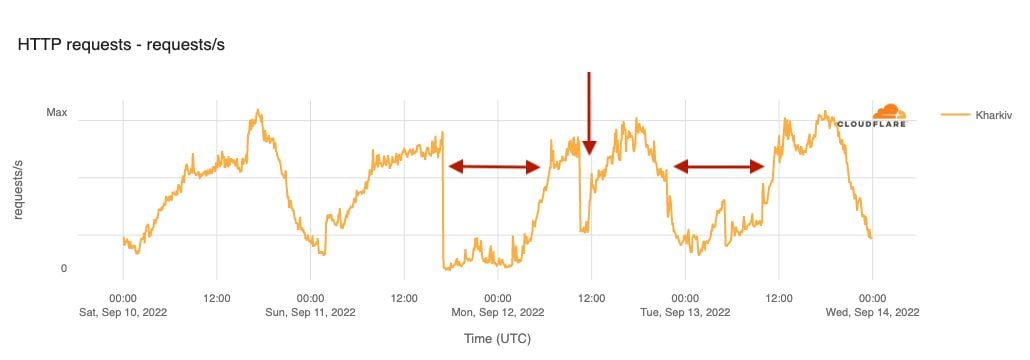
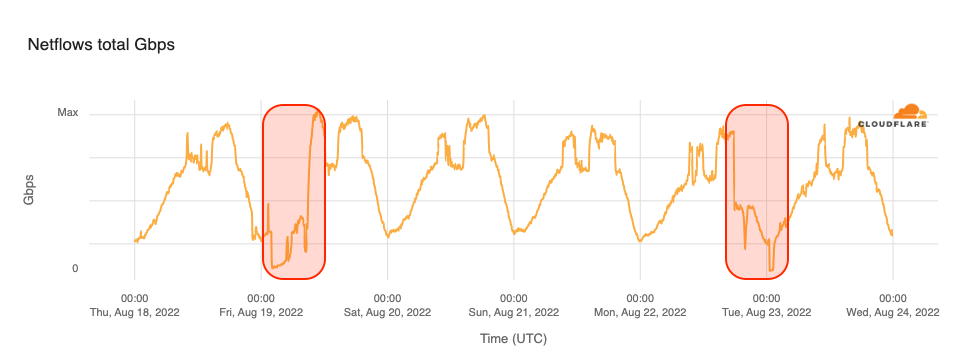
In response to the successful Ukrainian counteroffensive, Russian airstrikes caused power outages and Internet disruptions in the region. That was the case in Kharkiv on September 11, 12, and 13. The figure below shows a 12-hour near-complete outage on September 11, followed by two other periods of drop in traffic.
When nuclear inspectors arrive, so do Internet outages
In the Zaporizhzhia region, there were also outages. On September 1, 2022, the day the International Atomic Energy Agency (IAEA) inspectors arrived at the Russian-controlled Zaporizhzhia nuclear power plant in Enerhodar, there were Internet outages in two local ASNs that service the area: AS199560 (Engrup) and AS197002(OOO Tenor). Those outages lasted until September 10, as shown in the charts below.
More broadly, the city of Enerhodar, where the nuclear power plant is located, experienced a four-day outage after September 6.
Mid-September traffic drop in Crimea
In mid-September, following Ukraine’s counteroffensive, there were questions as to when Crimea might be targeted by Ukrainian forces, with news reports indicating that there was an evacuation of the Russian population from Crimea around September 13. We saw a clear drop in traffic on that Tuesday, compared with the previous day, as seen in the map of Crimea below (red is decrease in traffic, green is increase).
October brings energy infrastructure attacks and country-wide disruptions
As we have seen, the Russian air strikes targeting critical energy infrastructure began in September as a retaliation to Ukraine’s counteroffensive. The following month, the Crimean Bridge explosion on Saturday, October 8 (when a truck-borne bomb destroyed part of the bridge) led to more air strikes that affected networks and Internet traffic across Ukraine.
On Monday, October 10, Ukraine woke up to air strikes on energy infrastructure and experienced severe electricity and Internet outages. At 07:35 UTC, traffic in the country was 35% below its usual level compared with the previous week and only fully recovered more than 24 hours later. The impact was particularly significant in regions like Kharkiv, where traffic was down by around 80%, and Lviv, where it dropped by about 60%. The graph below shows how new air strikes in Lviv Oblast the following day affected Internet traffic.
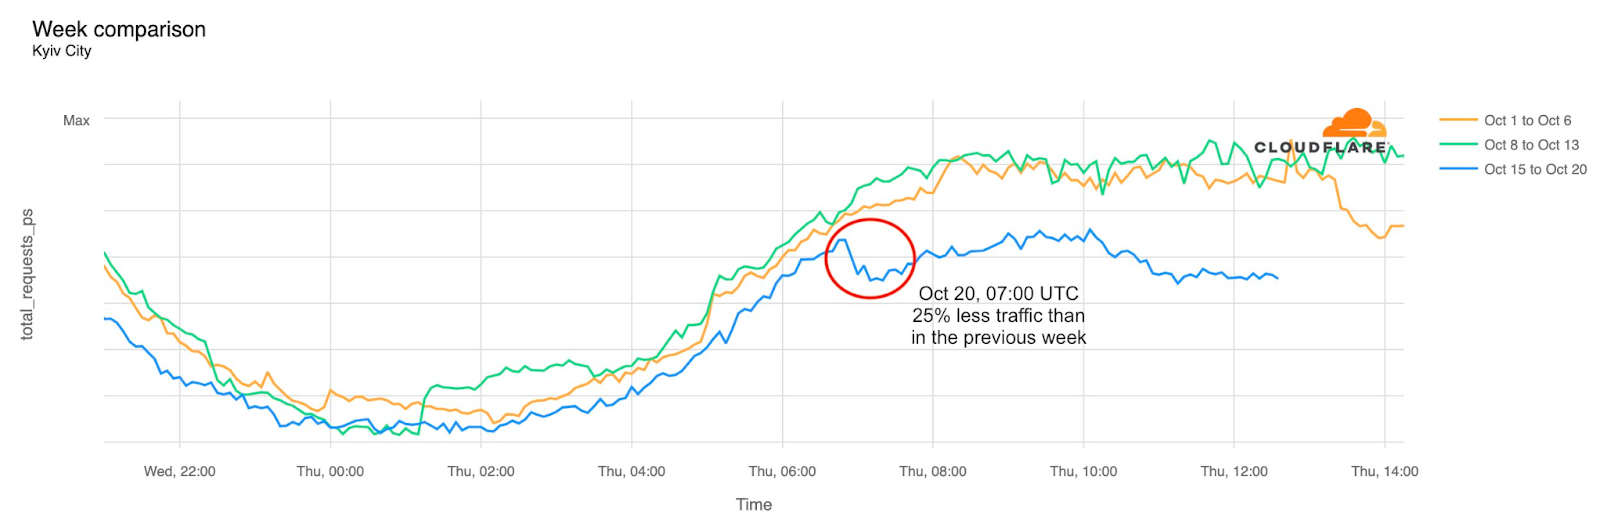
There were clear disruptions in Internet connectivity in several regions on October 17, but also on October 20, when the destruction of several power stations in Kyiv resulted in a 25% drop in Internet traffic from Kyiv City as compared to the two previous weeks. It lasted 12 hours, and was followed the next day by a shorter partial outage as seen in the graph below.
In late October, according to Ukrainian officials, 30% of Ukraine’s power stations were destroyed. Self-imposed power limitations because of this destruction resulted in drops in Internet traffic observed in places like Kyiv and the surrounding region.
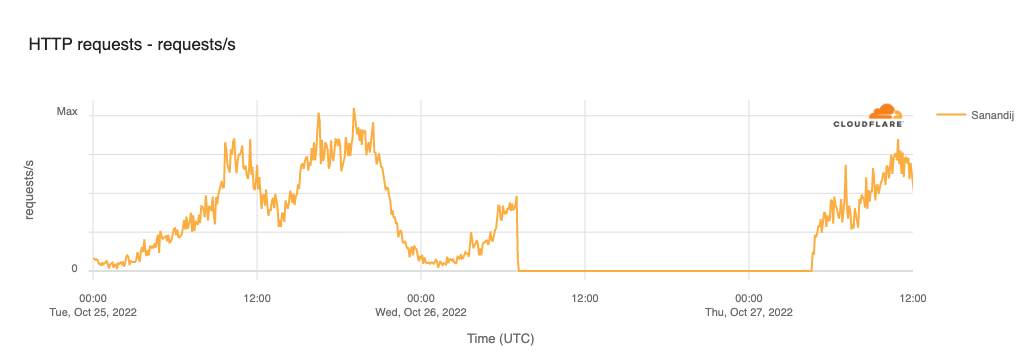
The start of a multi-week Internet disruption in Kherson Oblast can be seen in the graph below, showing ~70% lower traffic than in previous weeks. The disruption began on Saturday, October 22, when Ukrainians were gaining ground in the Kherson region.
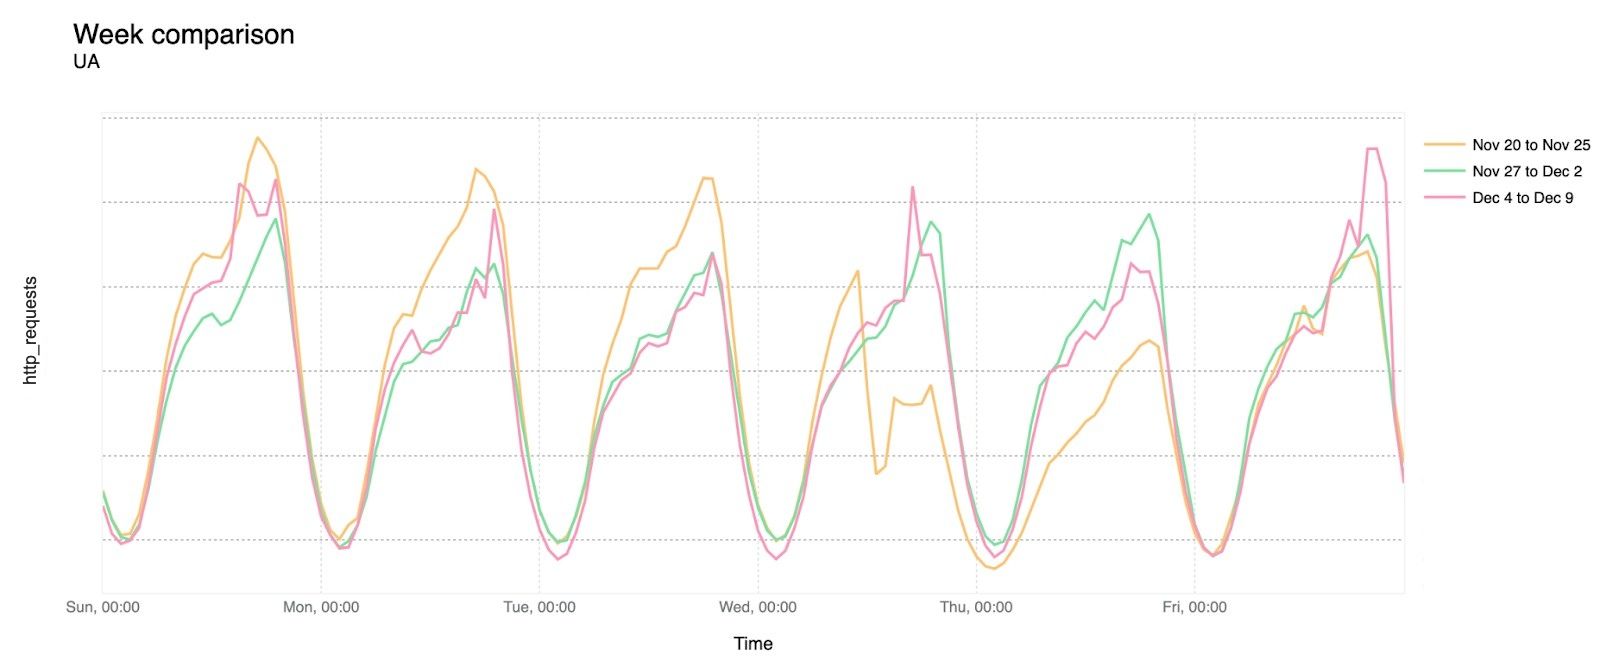
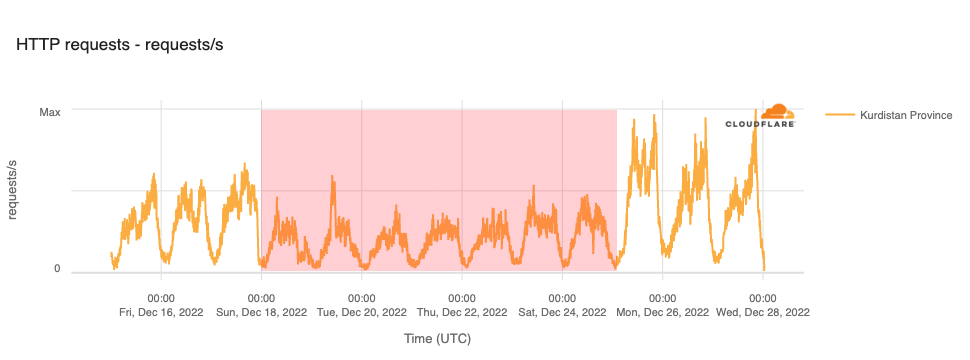
Traffic began to return after Ukrainian forces took Kherson city on November 11, 2022. The graph below shows a week-over-week comparison for Kherson Oblast for the weeks of November 7, November 28, and December 19 for better visualization in the chart while showing the evolution through a seven-week period.
Ongoing strikes and Internet disruptions
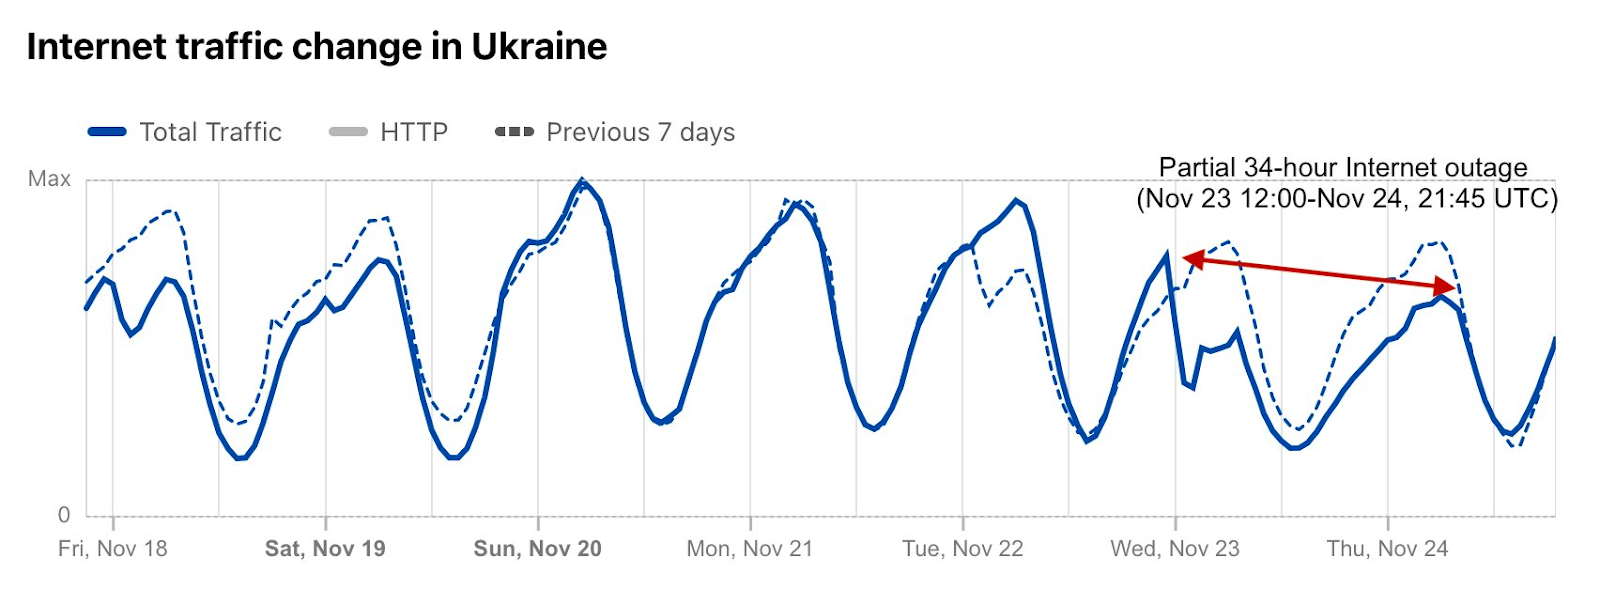
Throughout the rest of the year and into 2023, Ukraine has continued to face intermittent Internet disruptions. On November 23, 2022, the country experienced widespread power outages after Russian strikes, causing a nearly 50% decrease in Internet traffic in Ukraine. This disruption lasted for almost a day and a half, further emphasizing the ongoing impact of the conflict on Ukraine’s infrastructure.
Although there was a recovery after that late November outage, only a few days later traffic seemed closer to normal levels. Below is a chart of the week-over-week evolution of Internet traffic in Ukraine at both a national and local level during that time:
In Kyiv Oblast:
In the Odessa region:
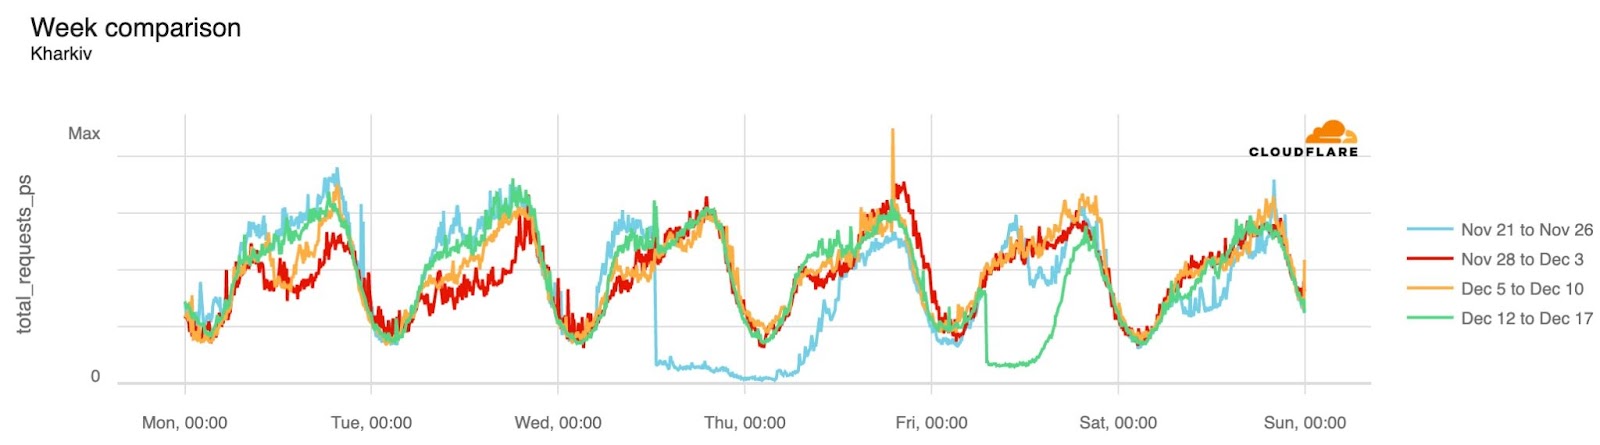
And Kharkiv (where a December 16 outage is also clear — in the green line):
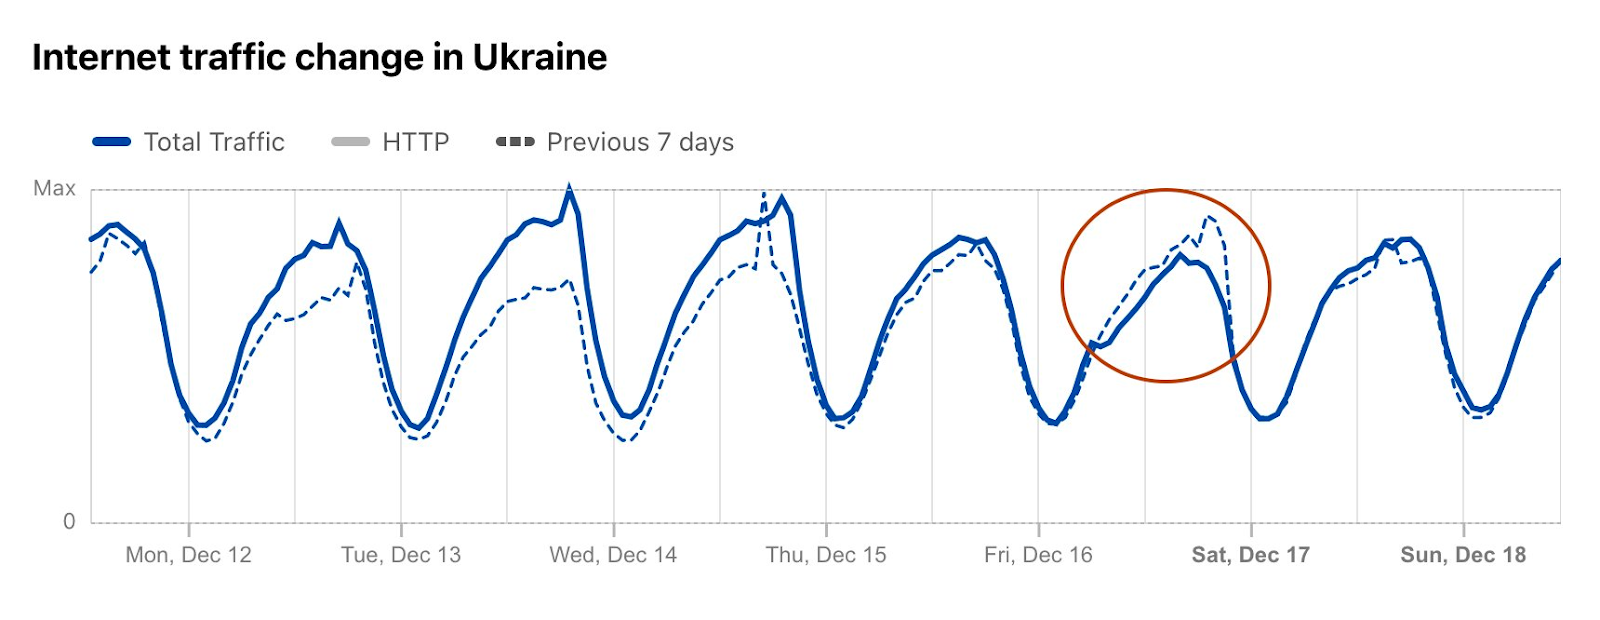
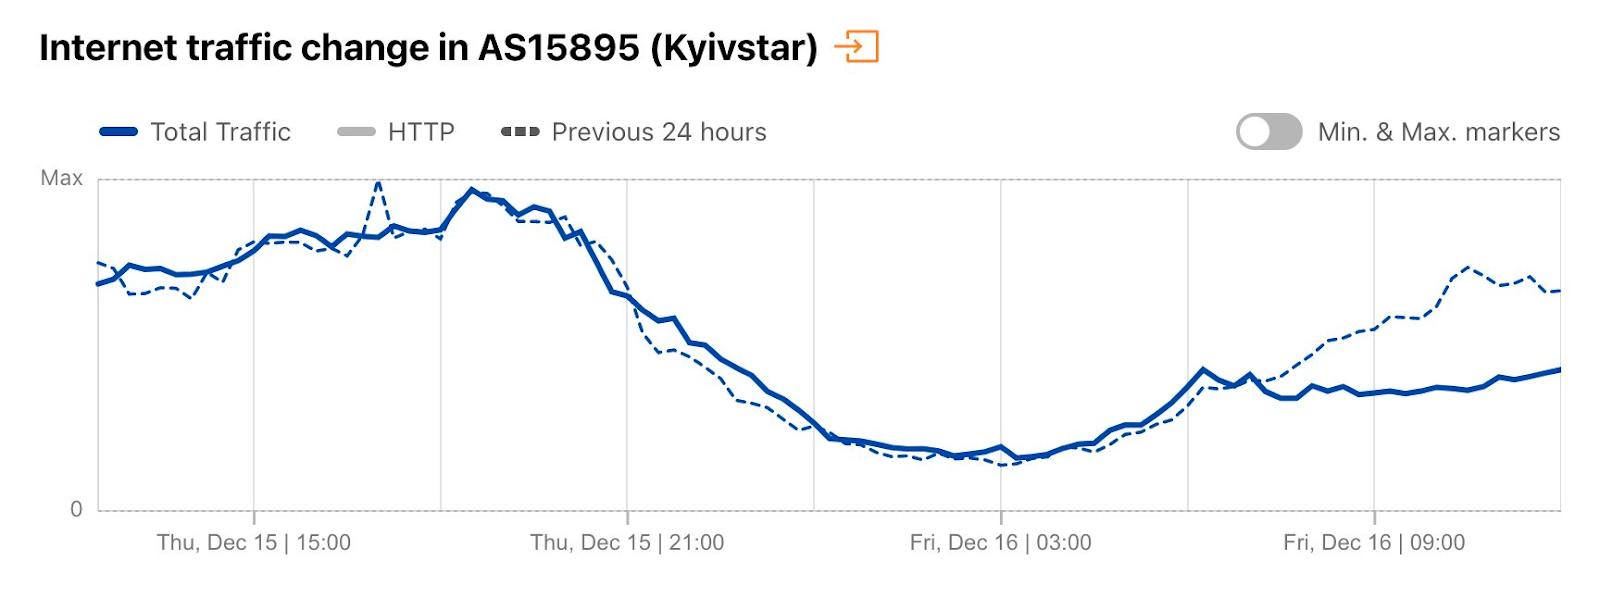
On December 16, there was another country-level Internet disruption caused by air strikes targeting energy infrastructure. Traffic at a national level dropped as much as 13% compared with the previous week, but Ukrainian networks were even more affected. AS13188 (Triolan) had a 70% drop in traffic, and AS15895 (Kyivstar) a 40% drop, both shown in the figures below.
In January 2023, air strikes caused additional Internet disruptions. One such recent event was in Odessa, where traffic dropped as low as 54% compared with the previous week during an 18-hour disruption.
A cyber war with global impact
“Shields Up” on cyber attacks
The US government and the FBI issued warnings in March to all citizens, businesses, and organizations in the country, as well as allies and partners, to be aware of the need to “enhance cybersecurity.” The US Cybersecurity and Infrastructure Security Agency (CISA) launched the Shields Up initiative, noting that “Russia’s invasion of Ukraine could impact organizations both within and beyond the region.” The UK and Japan, among others, also issued warnings.
Below, we discuss Web Application Firewall (WAF) mitigations and DDoS attacks. A WAF helps protect web applications by filtering and monitoring HTTP traffic between a web application and the Internet. A WAF is a protocol layer 7 defense (in the OSI model), and is not designed to defend against all types of attacks. Distributed Denial of Service (DDoS) attacks are cyber attacks that aim to take down Internet properties and make them unavailable for users.
Cyber attacks rose 1,300% in Ukraine by early March
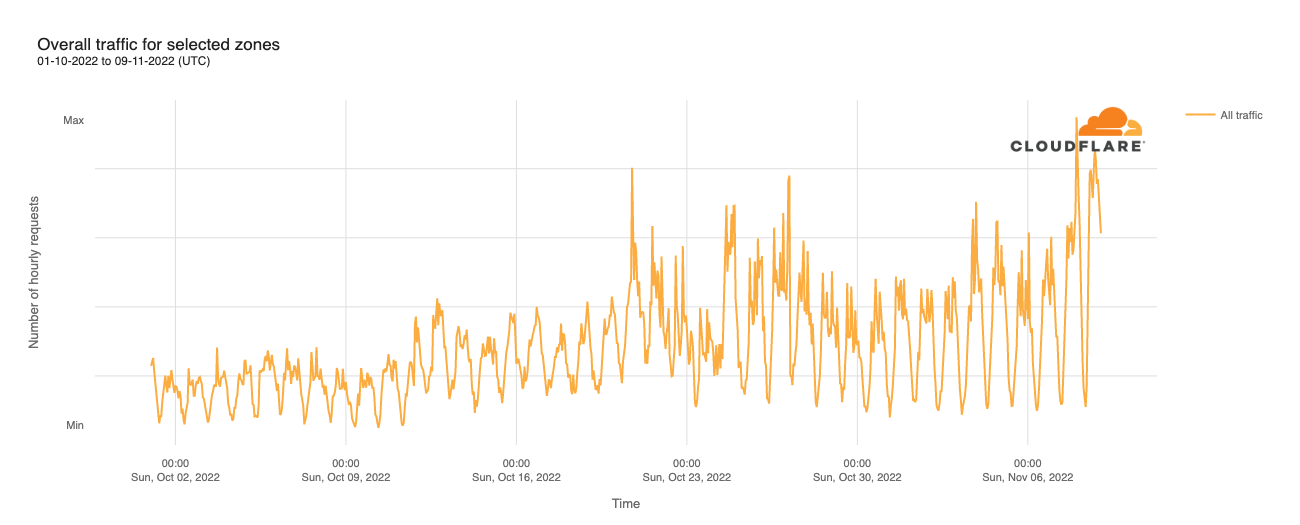
The charts below are based on normalized data, and show threats mitigated by our WAF.
Mitigated application-layer threats blocked by our WAF skyrocketed after the war started on February 24. Mitigated requests were 105% higher on Monday, February 28 than in the previous (pre-war) Monday, and peaked on March 8, reaching 1,300% higher than pre-war levels.
Between February 2022 and February 2023, an average of 10% of all traffic to Ukraine was mitigations of potential attacks.
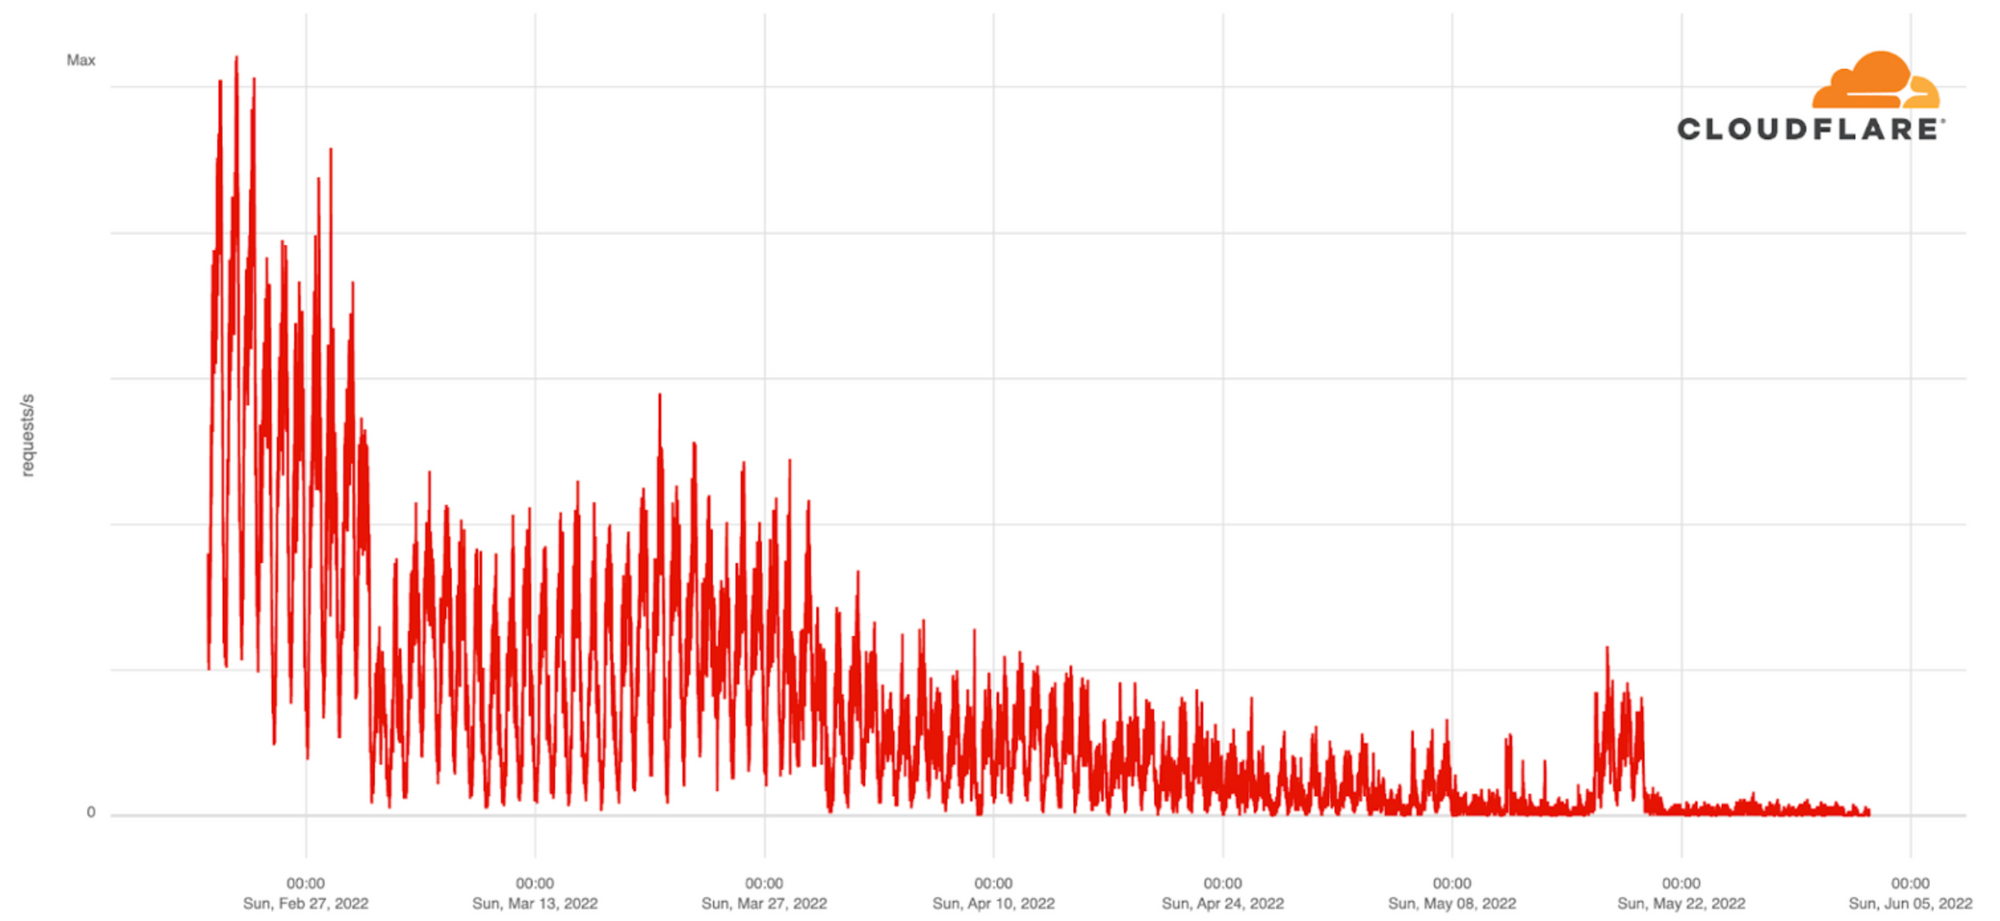
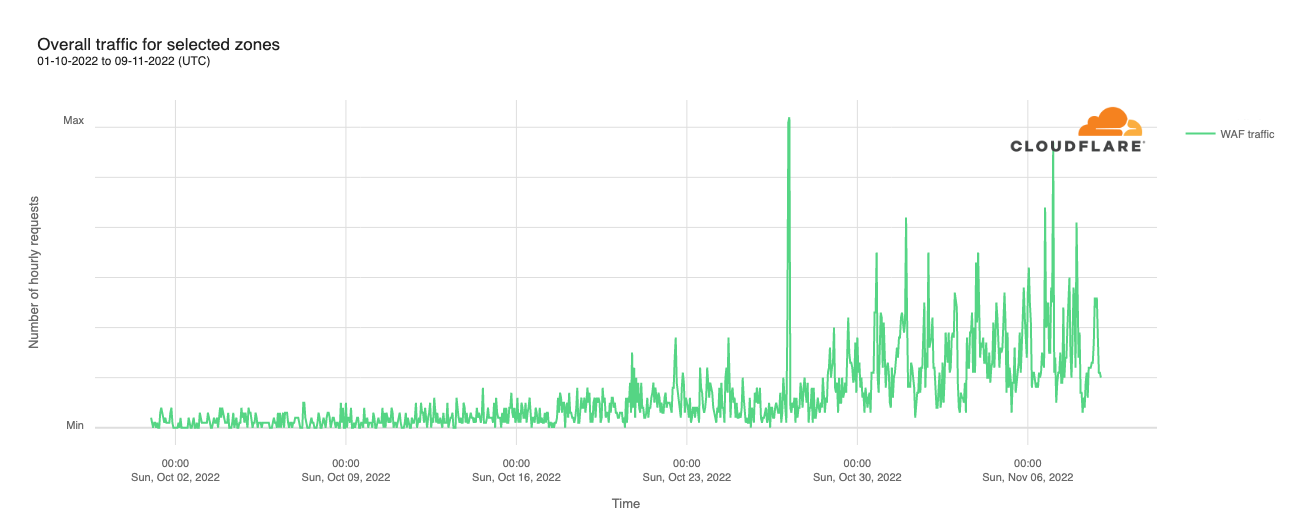
The graph below shows the daily percentage of application layer traffic to Ukraine that Cloudflare mitigated as potential attacks. In early March, 30% of all traffic was mitigated. This fell in April, and remained low for several months, but it picked up in early September around the time of the Ukrainian counteroffensive in east and south Ukraine. The peak was reached on October 29 when DDoS attack traffic constituted 39% of total traffic to Cloudflare’s Ukrainian customer websites.
This trend is more evident when looking at all traffic to sites on the “.ua” top-level domain (from Cloudflare’s perspective). The chart below shows that DDoS attack traffic accounted for over 80% of all traffic by early March 2022. The first clear spikes occurred on February 16 and 19, with around 25% of traffic mitigated. There was no moment of rest after the war started, except towards the end of November and December, but the attacks resumed just before Christmas. An average of 13% of all traffic to “.ua”, between February 2022 and February 2023 was mitigations of potential attacks. The following graph provides a comprehensive view of DDoS application layer attacks on “.ua” sites:
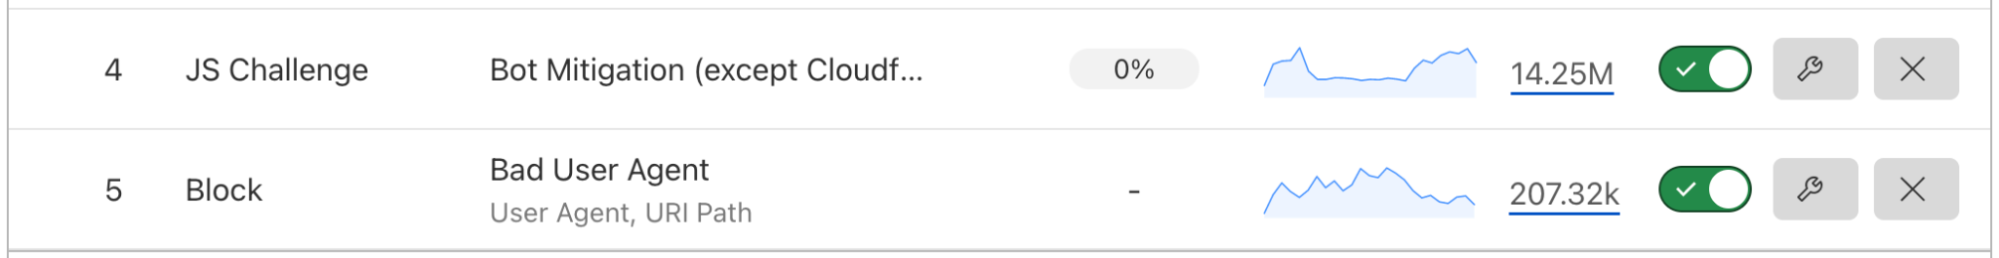
Moving on to types of mitigations of product groups that were used (related to “.ua” sites), as seen in the next chart, around 57% were done by the ruleset which automatically detects and mitigates HTTP DDoS attacks (DDoS Mitigation), 31% were being mitigated by firewall rules put in place (WAF), and 10% were blocking requests based on our IP threat reputation database (IP Reputation).
It’s important to note that WAF rules in the graph above are also associated with custom firewall rules created by customers to provide a more tailored protection. “DDoS Mitigation” (application layer DDoS protection) and “Access Rules” (rate limiting) are specifically used for DDoS protection.
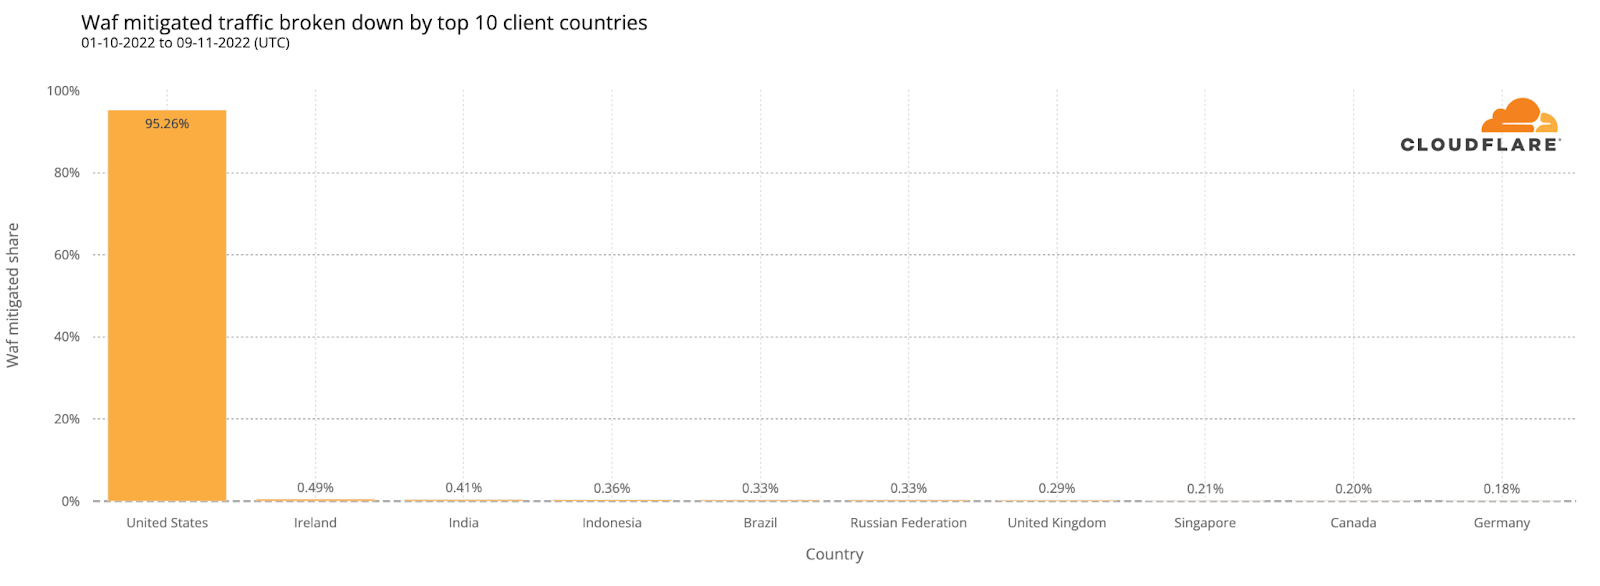
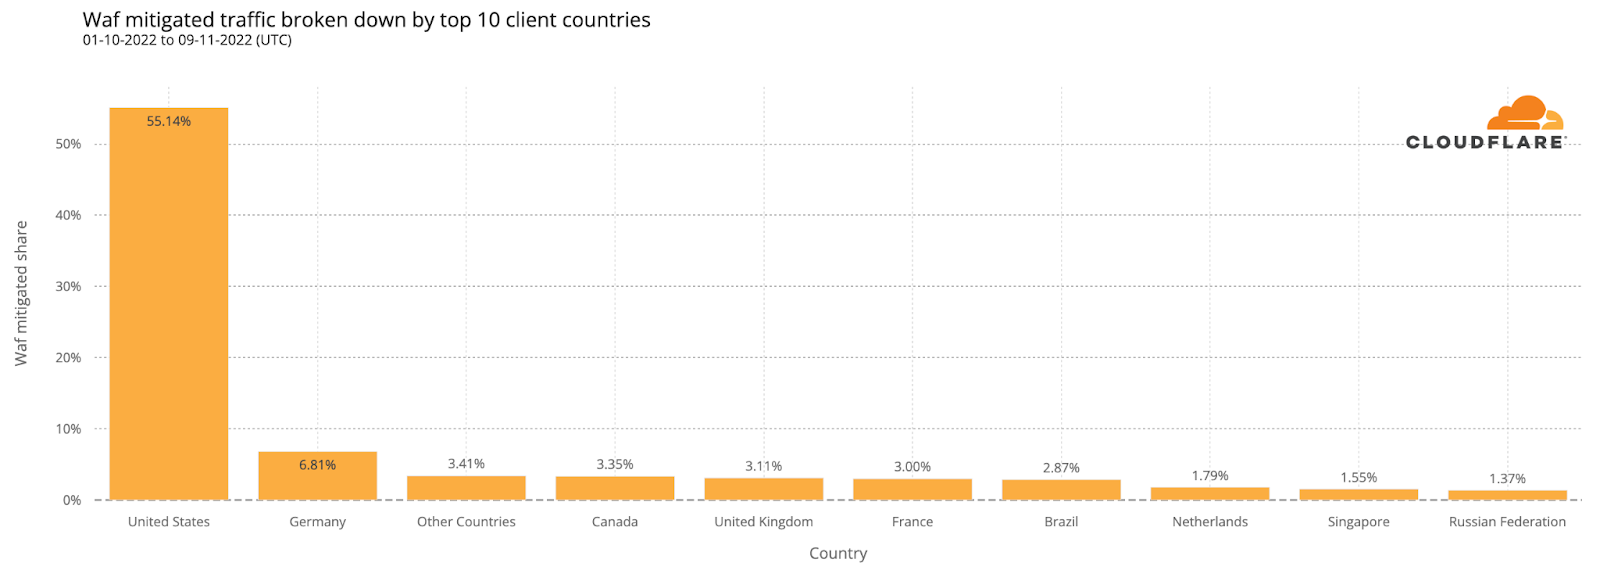
In contrast to the first graph shown in this section, which looked at mitigated attack traffic targeting Ukraine, we can also look at mitigated attack traffic originating in Ukraine. The graph below also shows that the share of mitigated traffic from Ukraine also increased considerably after the invasion started.
Top attacked industries: from government to news media
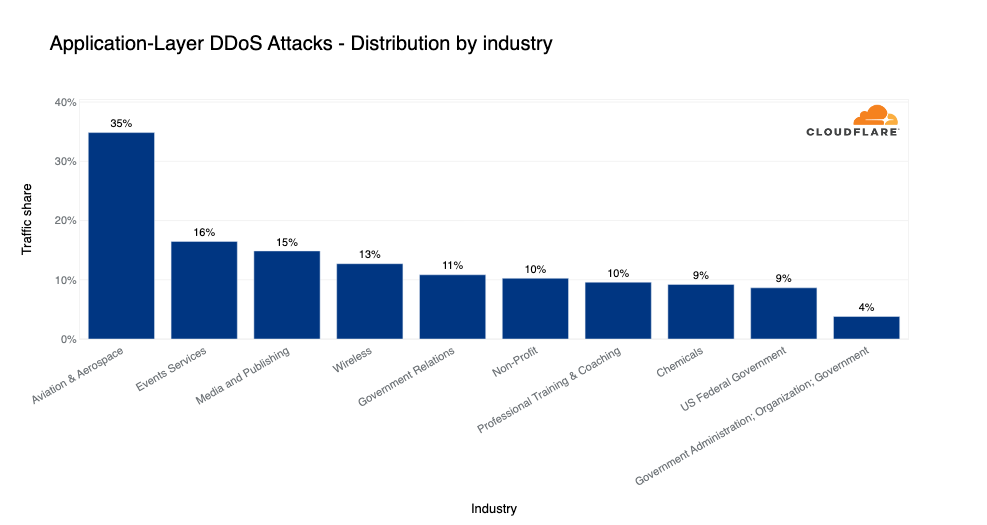
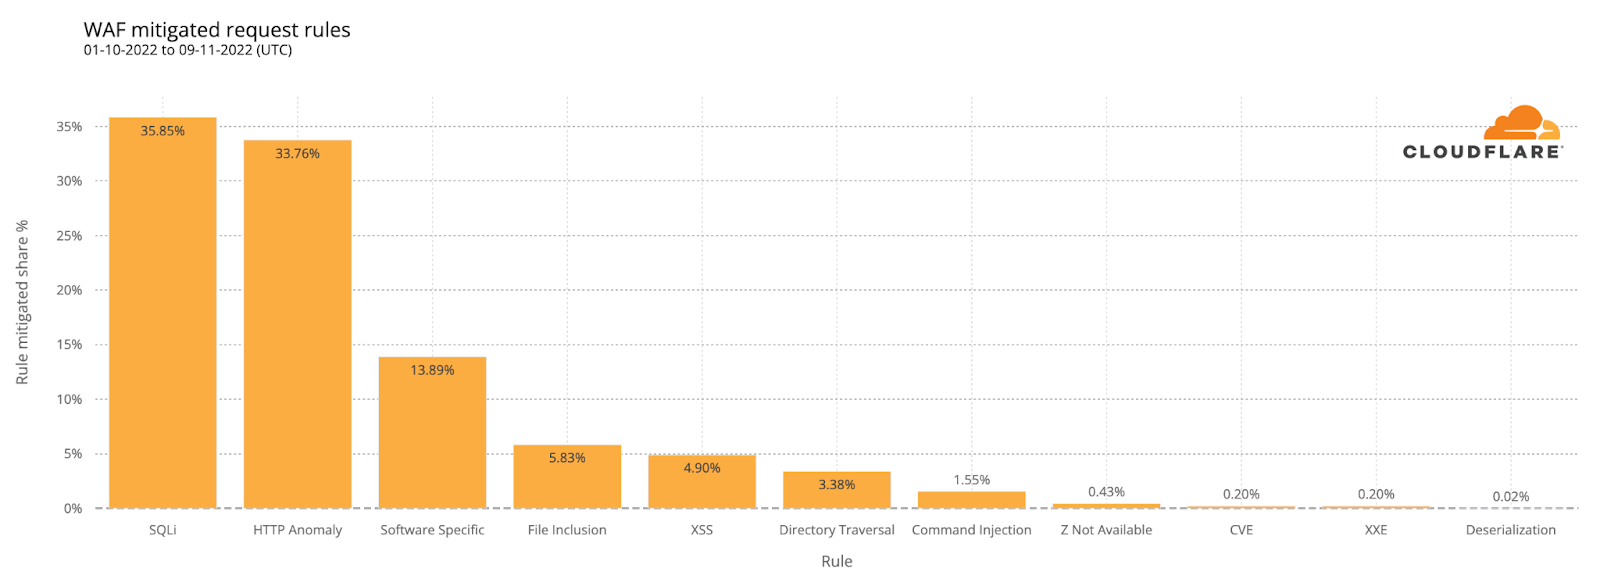
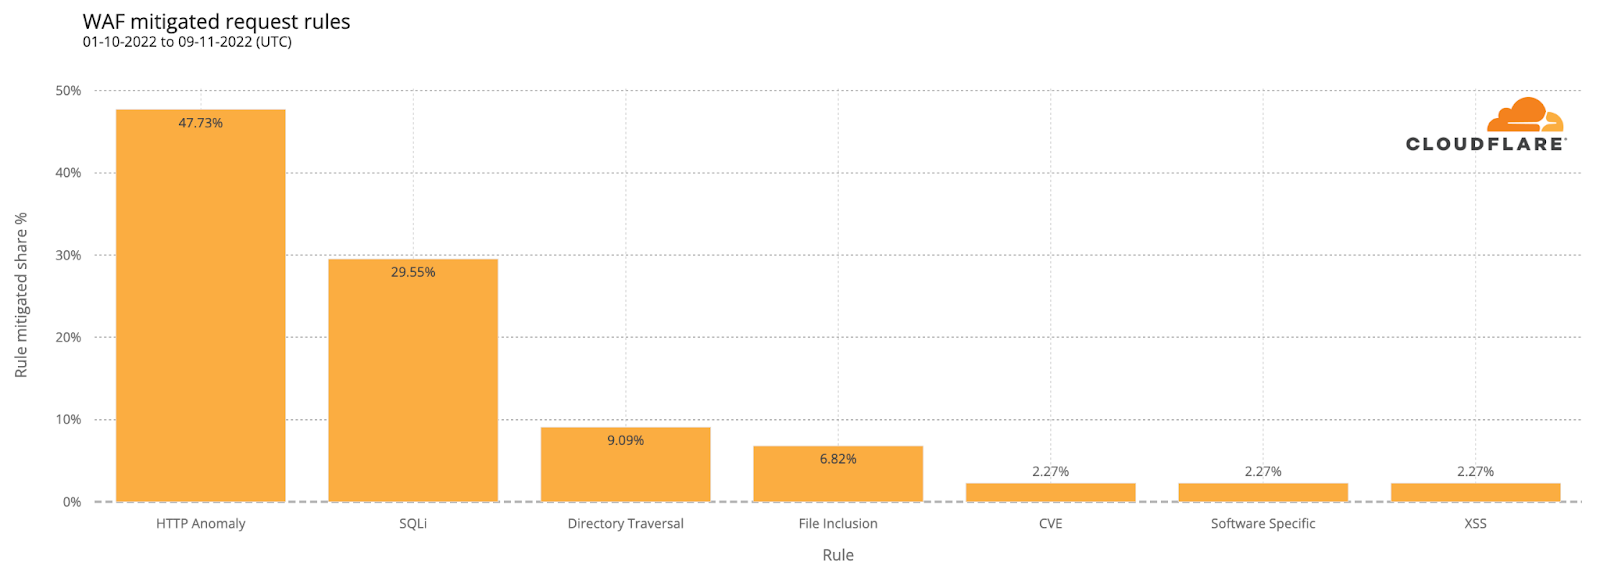
The industries sectors that had a higher share of WAF mitigations were government administration, financial services, and the media, representing almost half of all WAF mitigations targeting Ukraine during 2022.
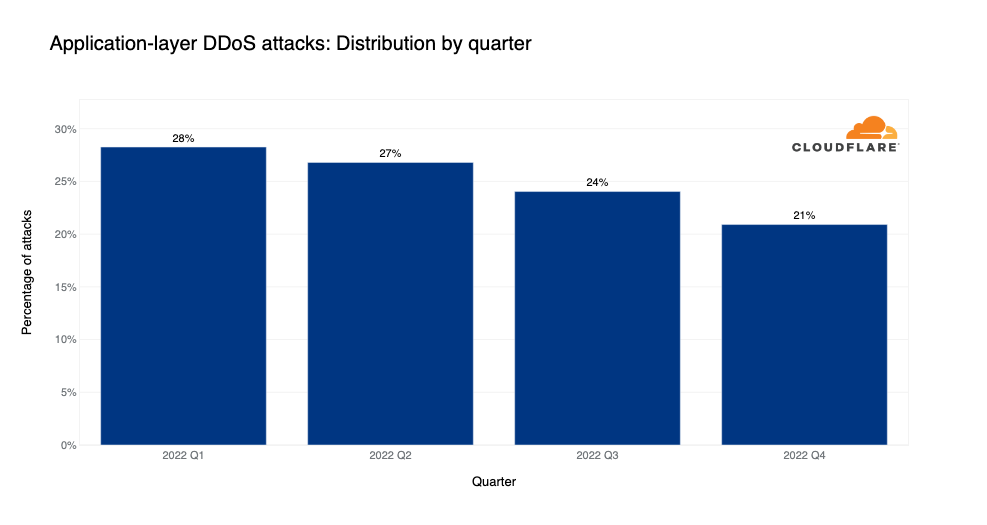
Looking at DDoS attacks, there was a surge in attacks on media and publishing companies during 2022 in Ukraine. Entities targeting Ukrainian companies appeared to be focused on information-related websites. The top five most attacked industries in the Ukraine in the first two quarters of 2022 were all in broadcasting, Internet, online media, and publishing, accounting for almost 80% of all DDoS attacks targeting Ukraine.
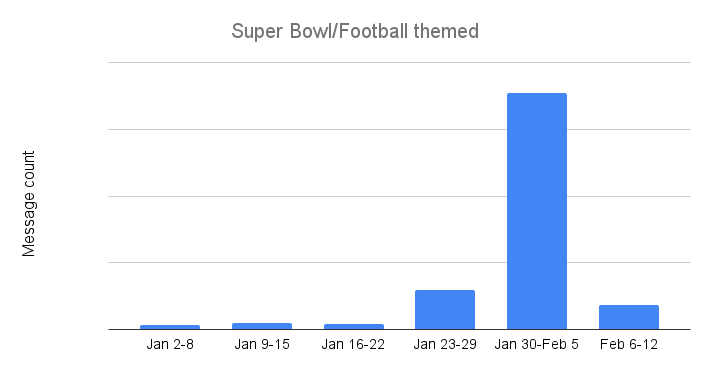
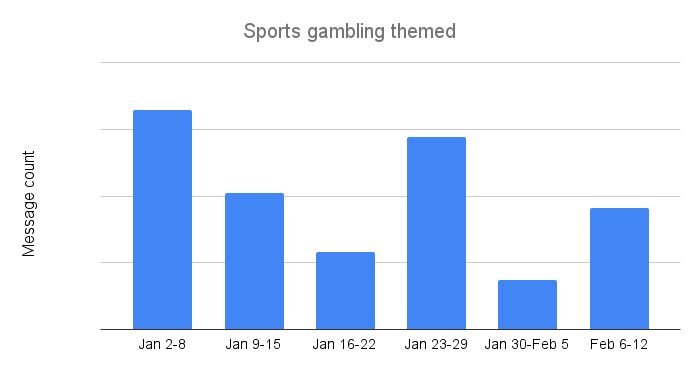
In a more focused look at the type of websites Cloudflare has protected throughout the war, the next two graphs provide a view of mitigated application layer attacks by the type of “.ua” sites we helped to protect. In the first days of the war, mitigation spikes were observed at a news service, a TV channel, a government website, and a bank.
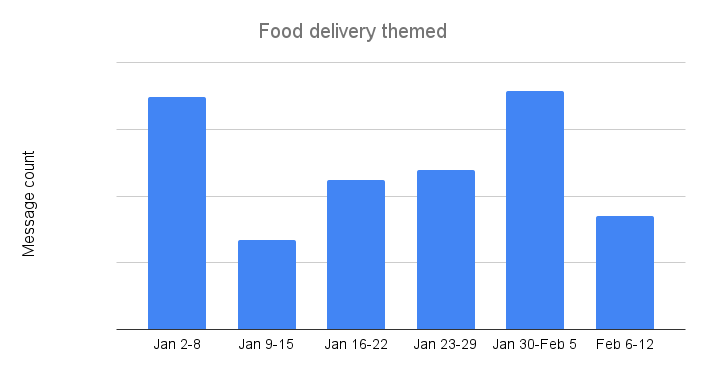
In July, spikes in mitigations we observed across other types of “.ua” websites, including food delivery, e-commerce, auto parts, news, and government.
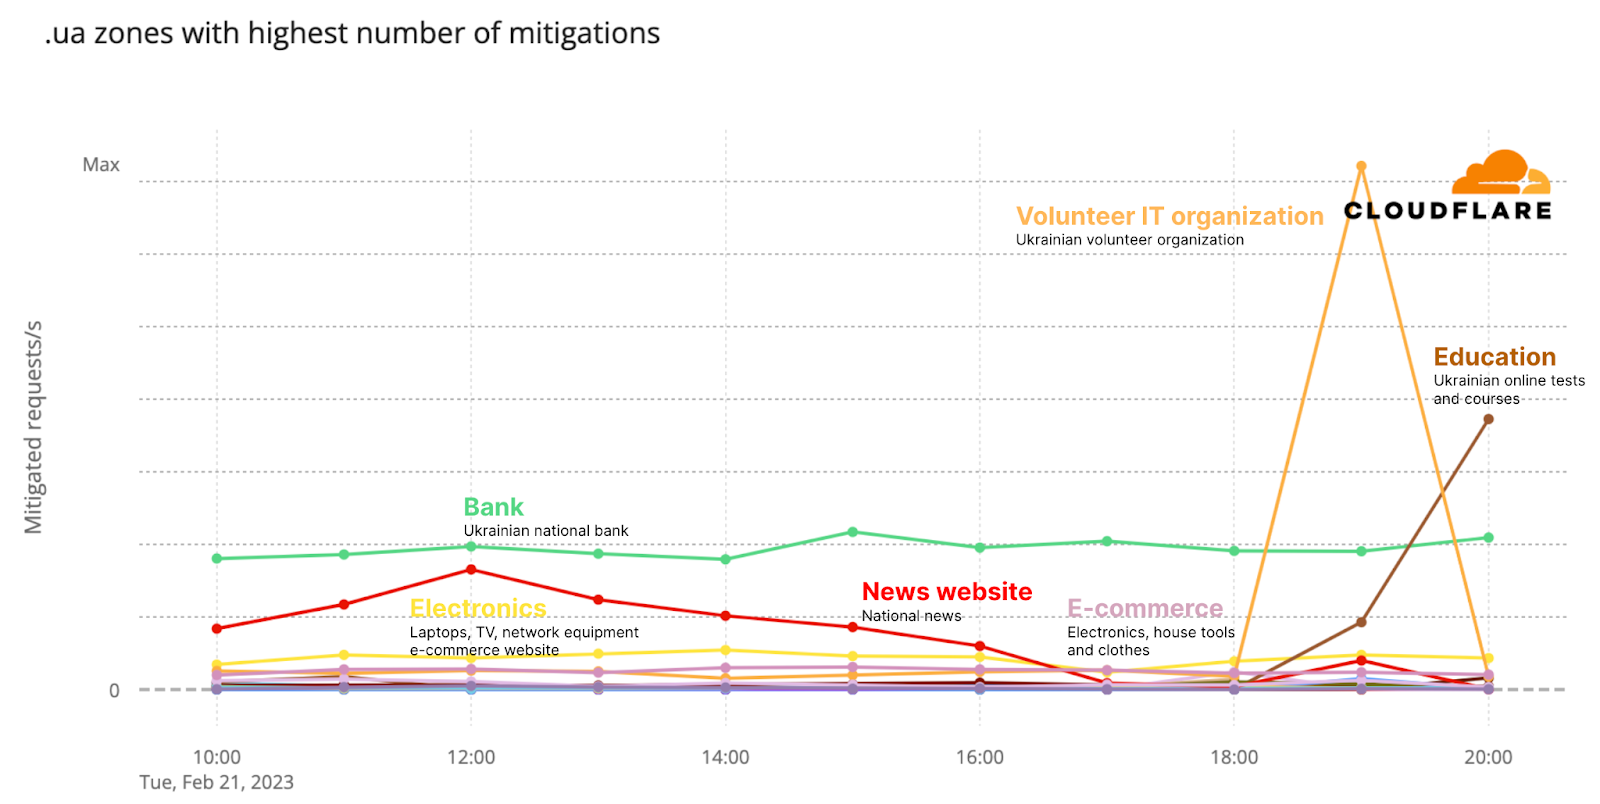
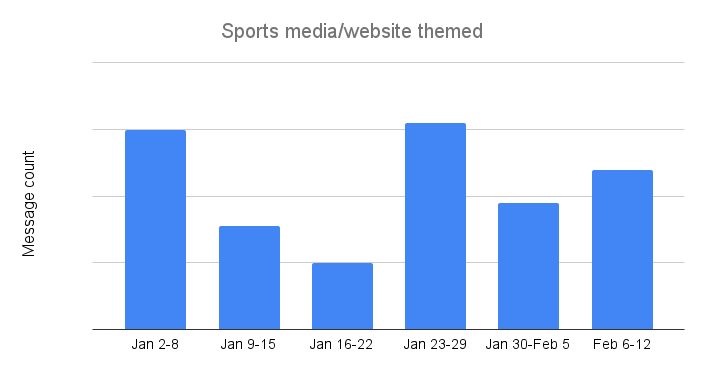
More recently, in February 2023, the spikes in mitigations were somewhat similar to what we saw one year ago, including electronics, e-commerce, IT, and education websites.
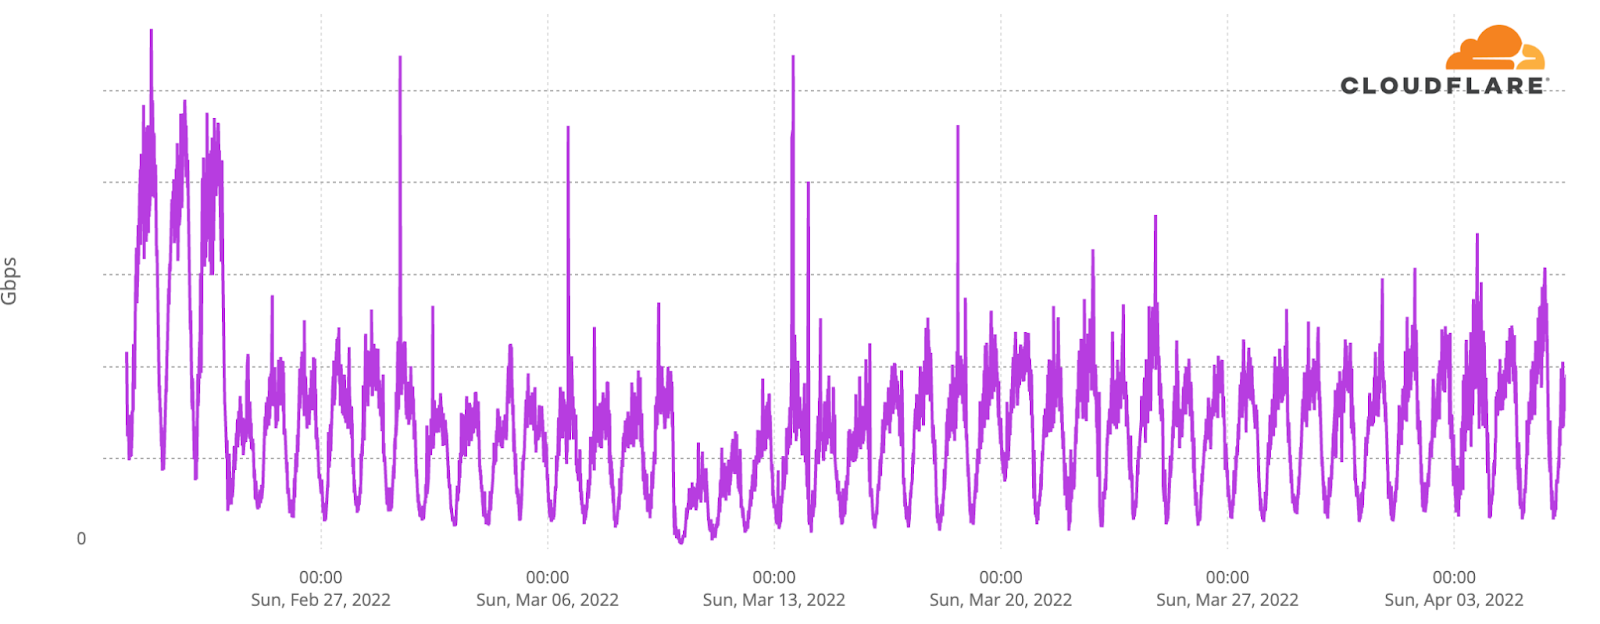
12.6% of network-layer traffic was DDoS activity in Q1 2022
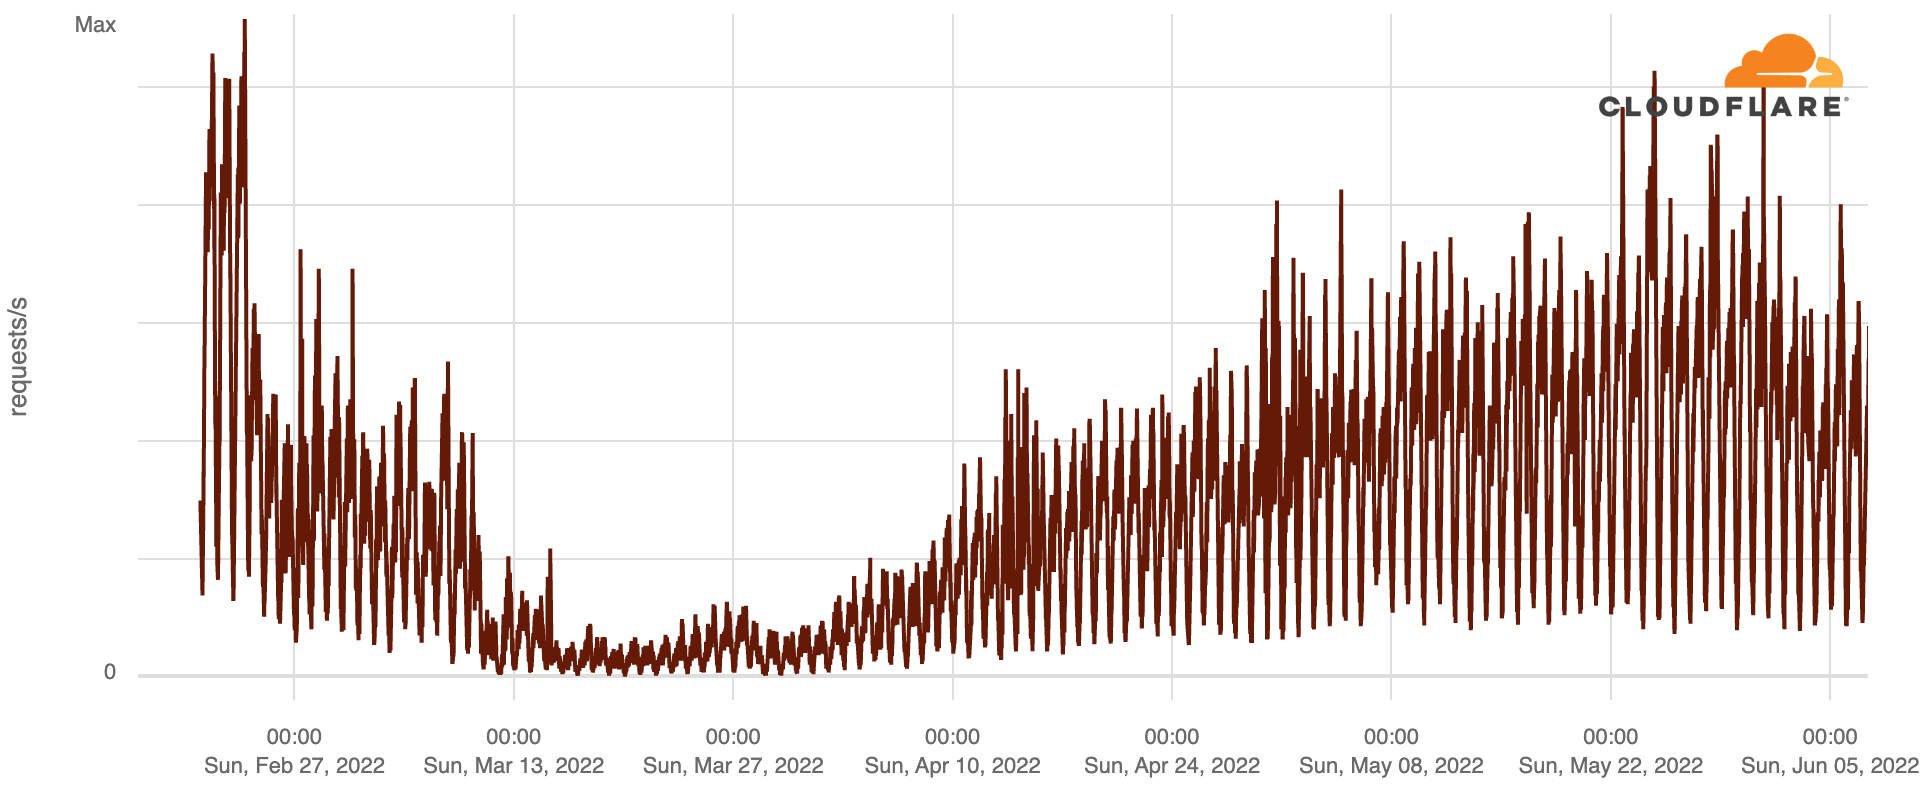
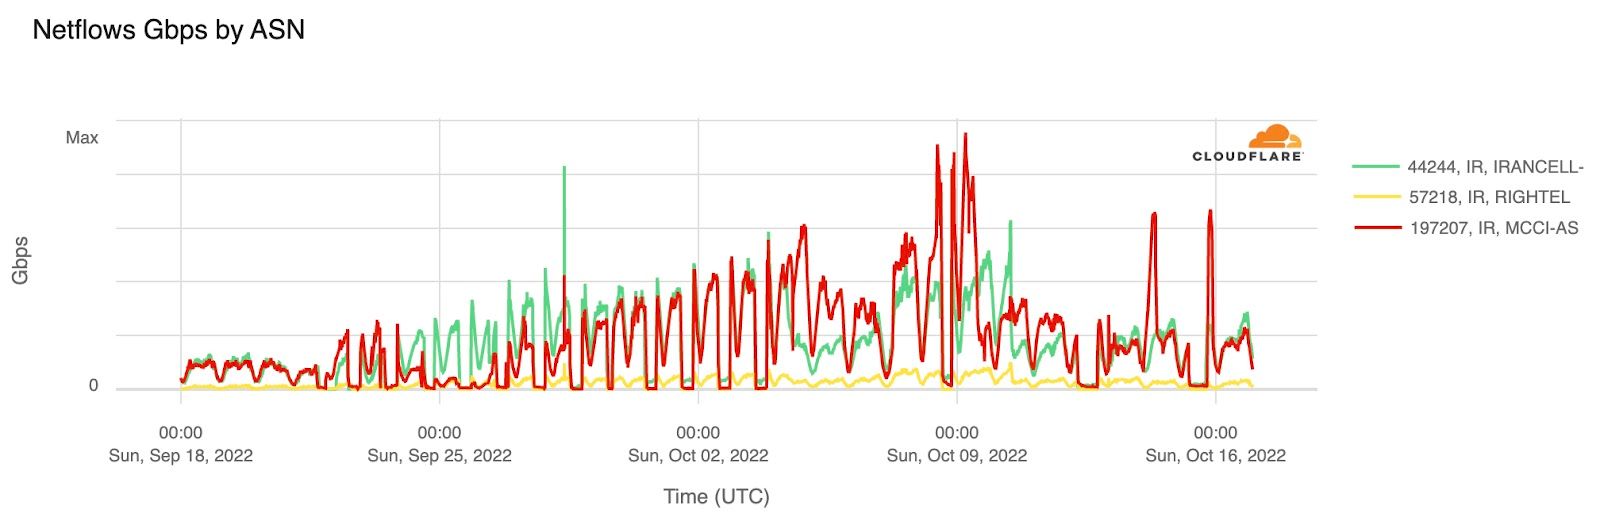
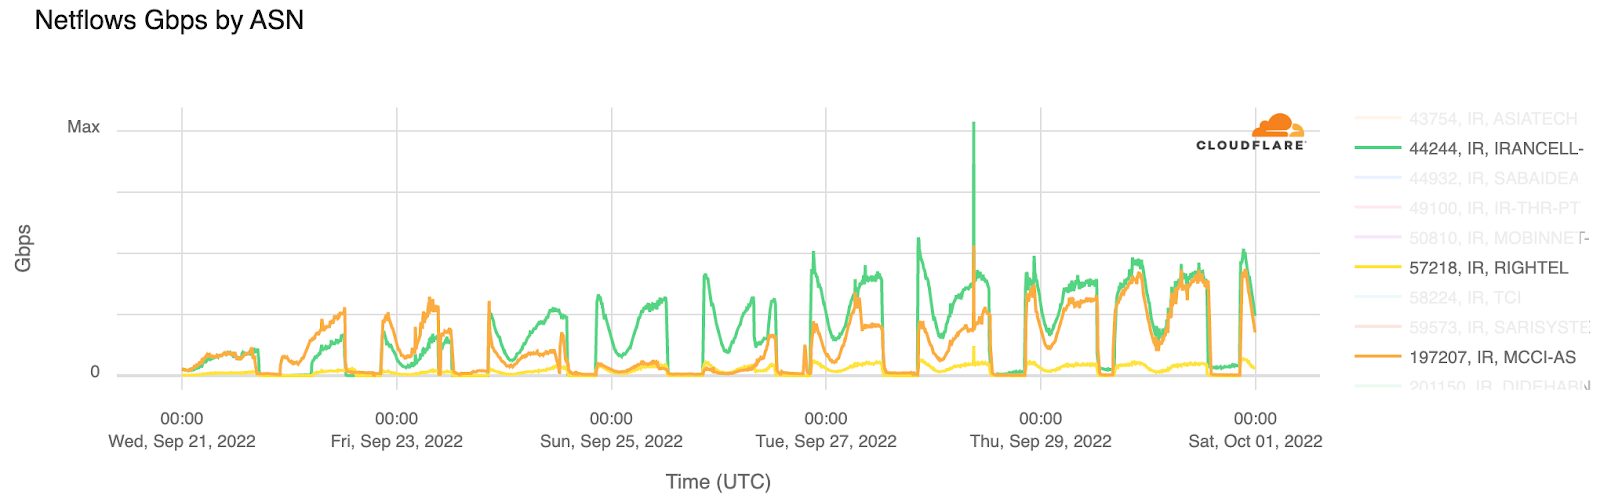
Network-layer (layer 3 and 4) traffic is harder to attribute to a specific domain or target because IP addresses are shared across different customers. Looking at network-level DDoS traffic hitting our Kyiv data center, we saw peaks of DDoS traffic higher than before the war in early March, but they were much higher in June and August.
Several of our quarterly DDoS reports from 2022 include attack trends related to the war in Ukraine, with quarter over quarter interactive comparisons.
Network re-routing in Kherson
On February 24, 2022, Russian forces invaded Ukraine’s Kherson Oblast region. The city of Kherson was captured on March 2, as the first major city and only regional capital to be captured by Russian forces during the initial invasion. The Russian occupation of Kherson Oblast continued until Ukrainian forces resumed control on November 11, after launching a counteroffensive at the end of August.
On May 4, 2022, we published Tracking shifts in Internet connectivity in Kherson, Ukraine, a blog post that explored a re-routing event that impacted AS47598 (Khersontelecom), a telecommunications provider in Kherson Oblast. Below, we summarize this event, and explore similar activity across other providers in Kherson that has taken place since then.
On May 1, 2022, we observed a shift in routing for the IPv4 prefix announced by Ukrainian network AS47598 (Khersontelecom). During April, it reached the Internet through several other Ukrainian network providers, including AS12883 (Vega Telecom) and AS3326 (Datagroup). However, after the shift, its routing path now showed a Russian network, AS201776 (Miranda-Media), as the sole upstream provider. With traffic from KhersonTelecom passing through a Russian network, it was subject to the restrictions and limitations imposed on any traffic transiting Russian networks, including content filtering.
The flow of traffic from Khersontelecom before and after May 1, with rerouting through Russian network provider Miranda-Media, is illustrated in the chart below. This particular re-routing event was short-lived, as a routing update for AS47598 on May 4 saw it return to reaching the Internet through other Ukrainian providers.
As a basis for our analysis, we started with a list of 15 Autonomous System Numbers (ASNs) belonging to networks in Kherson Oblast. Using that list, we analyzed routing information collected by route-views2 over the past year, from February 1, 2022, to February 15, 2023. route-views2 is a BGP route collector run by the University of Oregon Route Views Project. Note that with respect to the discussions of ASNs in this and the following section, we are treating them equally, and have not specifically factored estimated user population into these analyses.
The figure below illustrates the result of this analysis, showing that re-routing of Kherson network providers (listed along the y-axis) through Russian upstream networks was fairly widespread, and for some networks, has continued into 2023. During the analysis time frame, there were three primary Russian networks that appeared as upstream providers: AS201776 (Miranda-Media), AS52091 (Level-MSK Ltd.), and AS8492 (OBIT Ltd.).
Within the graph, black bars indicate periods when the ASN effectively disappeared from the Internet; white segments indicate the ASN was dependent on other Ukraine networks as immediate upstreams; and red indicates the presence of Russian networks in the set of upstream providers. The intensity of the red shading corresponds to the percentage of announced prefixes for which a Russian network provider is present in the routing path as observed from networks outside Ukraine. Bright red shading, equivalent to “1” in the legend, indicates the presence of a Russian provider in all routing paths for announced prefixes.
In the blog post linked above, we referenced an outage that began on April 30. This is clearly visible in the figure as a black bar that runs for several days across all the listed ASNs. In this instance, AS47598 (KhersonTelecom) recovered a day later, but was sending traffic through AS201776 (Miranda-Media), a Russian provider, as discussed above.
Another Ukrainian network, AS49168 (Brok-X), recovered from the outage on May 2, and was also sending traffic through Miranda-Media. By May 4, most of the other Kherson networks recovered from the outage, and both AS47598 and AS49168 returned to using Ukrainian networks as immediate upstream providers. Routing remained “normal” until May 30. Then, a more widespread shift to routing traffic through Russian providers began, although it appears that this shift was preceded by a brief outage for a few networks. For the most part, this re-routing lasted through the summer and into October. Some networks saw a brief outage on October 17, but most stopped routing directly through Russia by October 22.
However, this shift away from Russia was followed by periods of extended outages. KhersonTelecom suffered such an outage, and has remained offline since October, except for the first week of November when all of its traffic routed through Russia. Many other networks rejoined the Internet in early December, relying mostly on other Ukrainian providers for Internet connectivity. However, since early December, AS204485 (PE Berislav Cable Television), AS56359 (CHP Melnikov Roman Sergeevich), and AS49465 (Teleradiocompany RubinTelecom Ltd.) have continued to use Miranda-Media as an upstream provider, in addition to experiencing several brief outages. In addition, over the last several months, AS25082 (Viner Telecom) has used both a Ukrainian network and Miranda-Media as upstream providers.
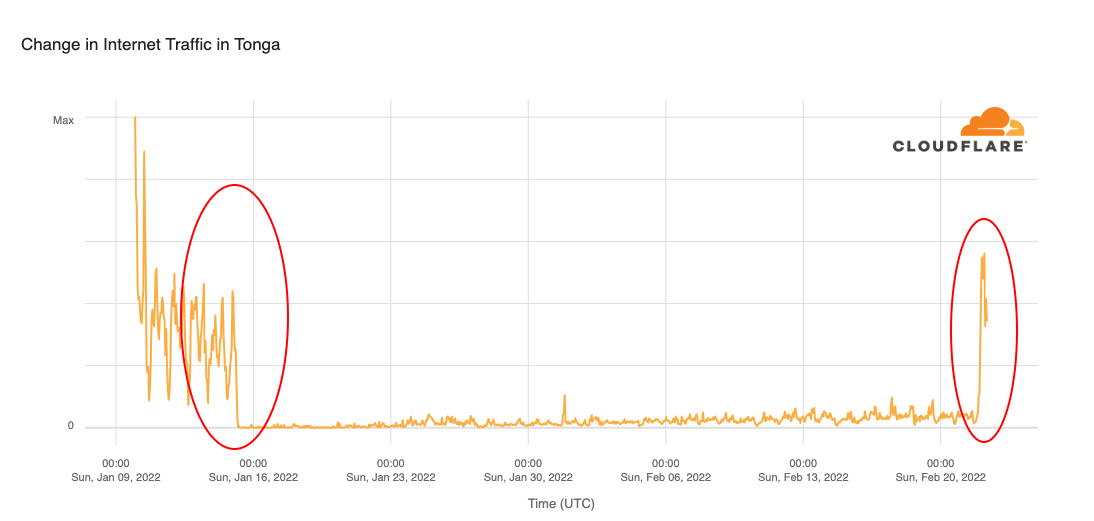
Internet resilience in Ukraine
In the context of the Internet, “resilience” refers to the ability of a network to operate continuously in a manner that is highly resistant to disruption. This includes the ability of a network to: (1) operate in a degraded mode if damaged, (2) rapidly recover if failure does occur, and (3) scale to meet rapid or unpredictable demands. Throughout the Russia-Ukraine conflict, media coverage (VICE, Bloomberg, Washington Post) has highlighted the work done in Ukraine to repair damaged fiber-optic cables and mobile network infrastructure to keep the country online. This work has been critically important to maintaining the resilience of Ukrainian Internet infrastructure.
According to PeeringDB, as of February 2023, there are 25 Internet Exchange Points (IXPs) in Ukraine and 50 interconnection facilities. (An IXP may span multiple physical facilities.) Within this set of IXPs, Autonomous Systems (ASes) belonging to international providers are currently present in over half of them. The number of facilities, IXPs, and international ASes present in Ukraine points to a resilient interconnection fabric, with multiple locations for both domestic and international providers to exchange traffic.
To better understand these international interconnections, we first analyze the connectivity of ASes in Ukraine, and we classify the links to domestic networks (links where both ASes are registered in Ukraine) and international networks (links between ASes in Ukraine and ASes outside Ukraine). To determine which ASes are domestic in Ukraine, we can use information from the extended delegation reports from the Réseaux IP Européens Network Coordination Centre (RIPE NCC), the Regional Internet Registry that covers Ukraine. We also parsed collected BGP data to extract the AS-level links between Ukrainian ASes and ASes registered in a different country, and we consider these the international connectivity of the domestic ASes.
A March 2022 article in The Economist noted that “For one thing, Ukraine boasts an unusually large number of internet-service providers—by one reckoning the country has the world’s fourth-least-concentrated Internet market. This means the network has few choke points, so is hard to disable.” As of the writing of this blog post, there are 2,190 ASes registered in Ukraine (UA ASes), and 1,574 of those ASes appear in the BGP routing table as active. These counts support the article’s characterization, and below we discuss several additional observations that reinforce Ukraine’s Internet resilience.
The figure above is a cumulative distribution function showing the fraction of domestic Ukrainian ASes that have direct connections to international networks. In February 2023, approximately 50% had more than one (100) international link, while approximately 10% had more than 10, and approximately 2% had 100 or more. Although these numbers have dropped slightly over the last year, they underscore the lack of centralized choke points in the Ukrainian Internet.
For the networks with international connectivity, we can also look at the distribution of “next-hop” countries – countries with which those international networks are associated. (Note that some networks may have a global footprint, and for these, the associated country is the one recorded in their autonomous system registration.) Comparing the choropleth maps below illustrates how this set of countries, and their fraction of international paths, have changed between February 2022 and February 2023. The data underlying these maps shows that international connectivity from Ukraine is distributed across 18 countries — unsurprisingly, mostly in Europe.
In February 2022, these countries/locations accounted for 77% of Ukraine’s next-hop international paths. The top four all had 7.8% each. However, in February 2023, the top 10 next-hop countries/locations dropped slightly to 76% of international paths. While just a slight change from the previous year, the set of countries/locations and many of their respective fractions saw considerable change.
February 2022
February 2023
1
Germany
7.85%
Russia
11.62%
2
Netherlands
7.85%
Germany
11.43%
3
United Kingdom
7.83%
Hong Kong
8.38%
4
Hong Kong
7.81%
Poland
7.93%
5
Sweden
7.77%
Italy
7.75%
6
Romania
7.72%
Turkey
6.86%
7
Russia
7.67%
Bulgaria
6.20%
8
Italy
7.64%
Netherlands
5.31%
9
Poland
7.60%
United Kingdom
5.30%
10
Hungary
7.54%
Sweden
5.26%
Russia’s share grew by 50% year to 11.6%, giving it the biggest share of next-hop ASes. Germany also grew to account for more than 11% of paths.
Satellite Internet connectivity
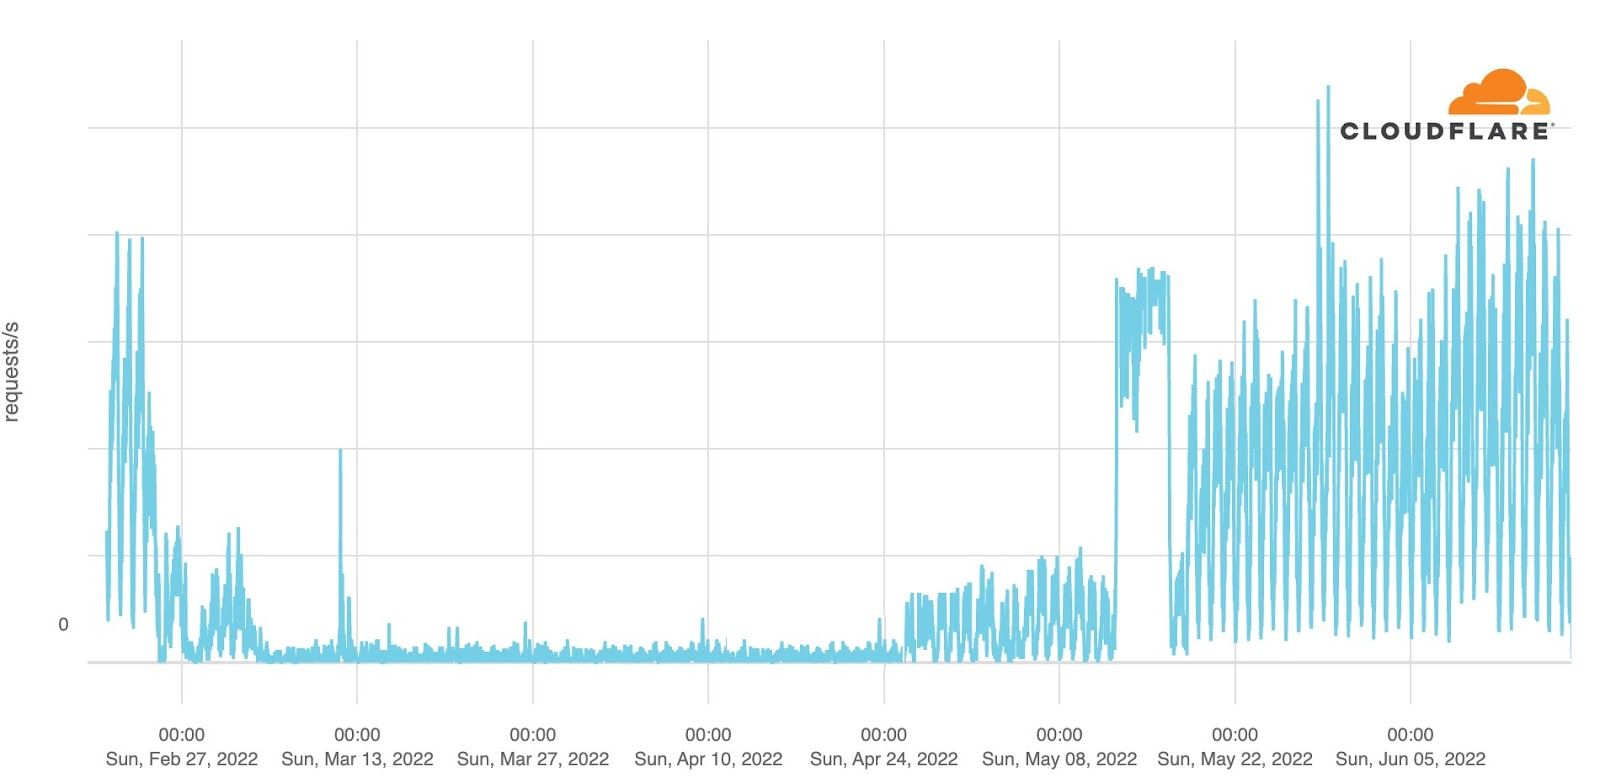
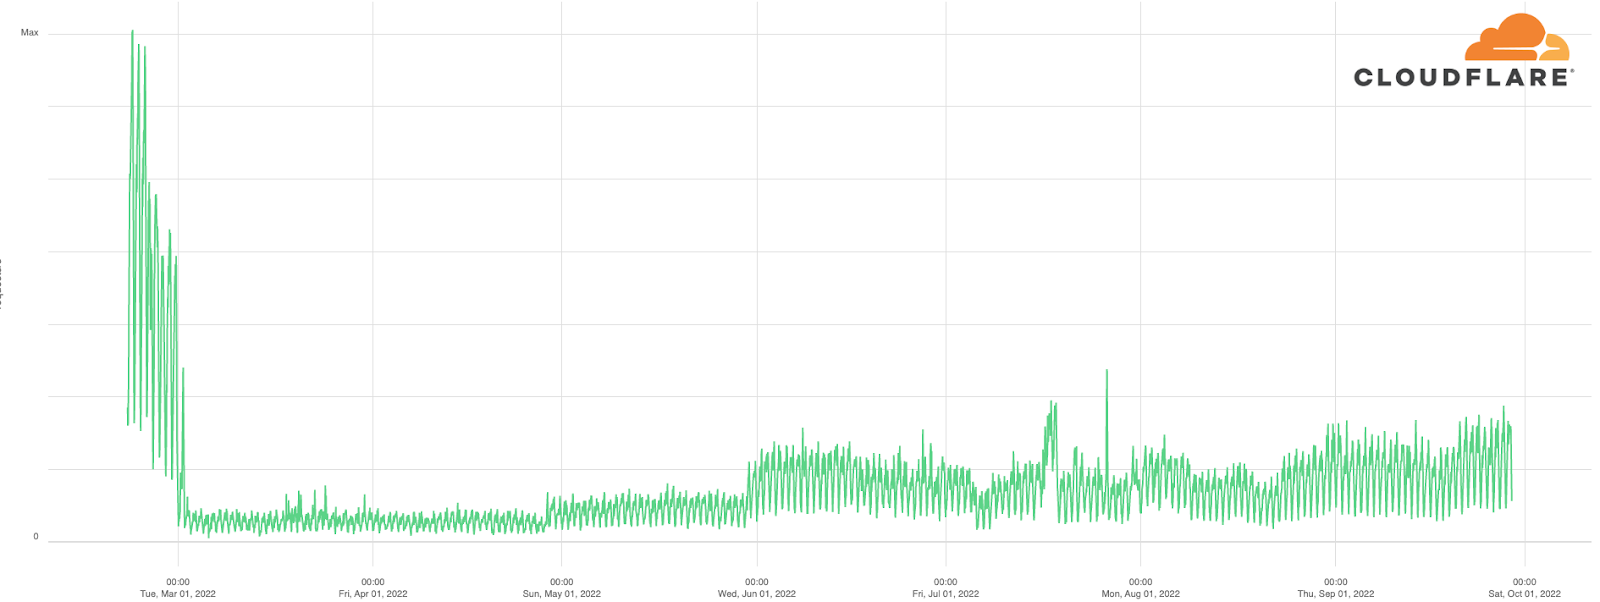
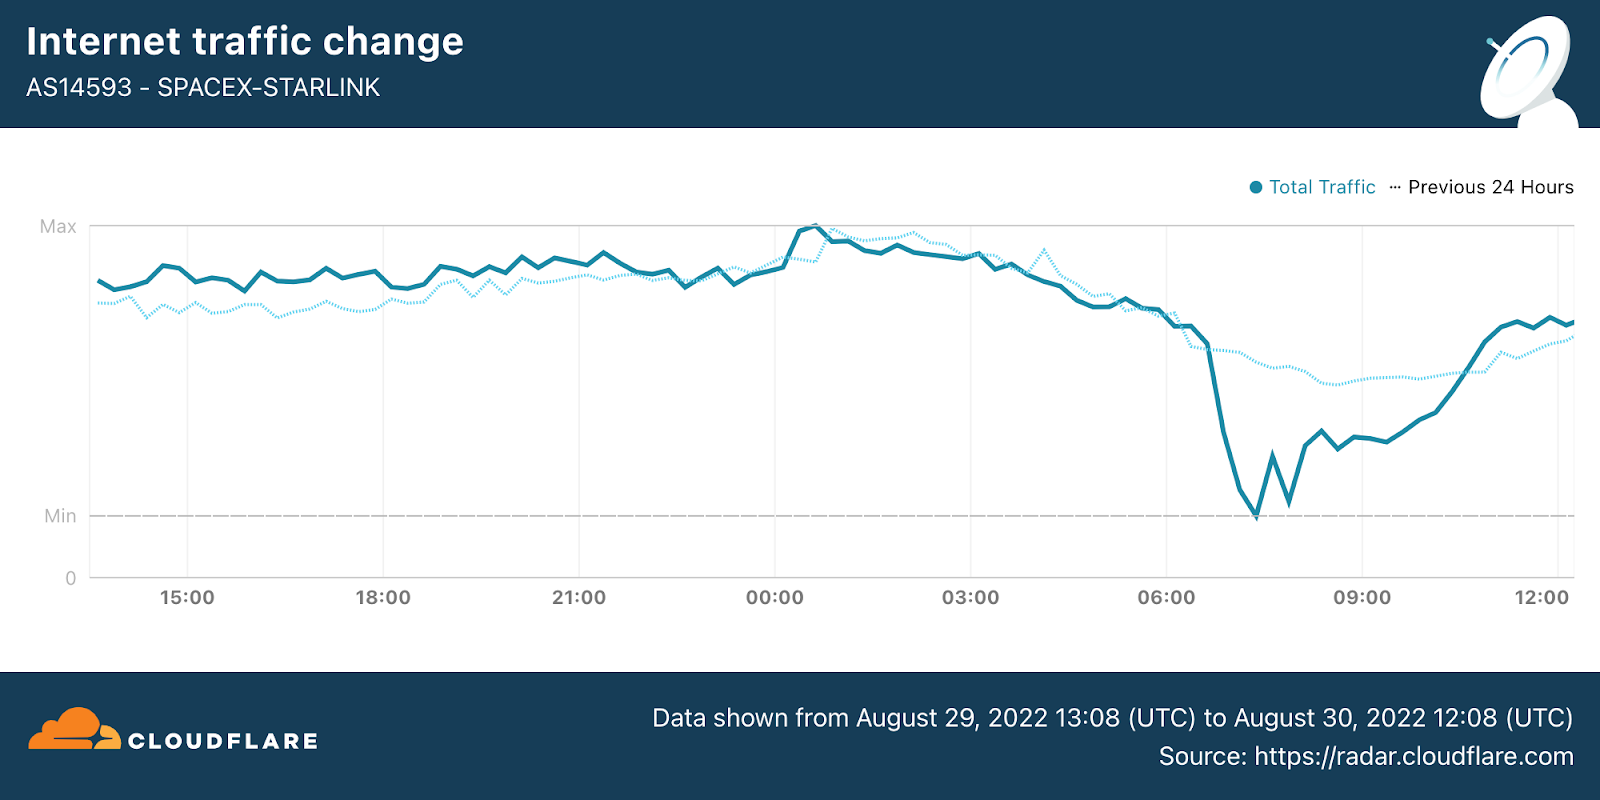
Cloudflare observed a rapid growth in Starlink’s ASN (AS14593) traffic to Ukraine during 2022 and into 2023. Between mid-March and mid-May, Starlink’s traffic in the country grew over 530%, and continued to grow from mid-May up until mid-November, increasing nearly 300% over that six-month period — from mid-March to mid-December the growth percentage was over 1600%. After that, traffic stabilized and even dropped a bit during January 2023.
Our data shows that between November and December 2022, Starlink represented between 0.22% and 0.3% of traffic from Ukraine, but that number is now lower than 0.2%.
Conclusion
One year in, the war in Ukraine has taken an unimaginable humanitarian toll. The Internet in Ukraine has also become a battleground, suffering attacks, re-routing, and disruptions. But it has proven to be exceptionally resilient, recovering time and time again from each setback.
We know that the need for a secure and reliable Internet there is more critical than ever. At Cloudflare, we’re committed to continue providing tools that protect Internet services from cyber attack, improve security for those operating in the region, and share information about Internet connectivity and routing inside Ukraine.
The Super Bowl has been happening since the end of the 1966 season, the same year that the ARPANET project, which gave birth to the Internet, was initiated. Around 20 years ago, 50% of the US population were Internet users, and that number is now around 92%. So, it’s no surprise that interest in an event like Super Bowl LVII resulted in a noticeable dip in Internet traffic in the United States at the time of the game’s kickoff, dropping to around 5% lower than the previous Sunday. During the game, Rihanna’s halftime show also caused a significant drop in Internet traffic across most states, with Pennsylvania and New York feeling the biggest impact, but messaging and video platforms saw a surge of traffic right after her show ended.
In this blog post, we will dive into who the biggest winners were among Super Bowl advertisers, as well as examine how traffic to food delivery services, social media and sports and betting websites changed during the game. In addition, we look at traffic trends seen at city and state levels during the game, as well as email threat volume across related categories in the weeks ahead of the game.
Cloudflare Radar uses a variety of sources to provide aggregate information about Internet traffic and attack trends. In this blog post, as we did last year and the year before, we use DNS name resolution data from our 1.1.1.1 resolver to estimate traffic to websites. We can’t see who visited the websites mentioned, or what anyone did on the websites, but DNS can give us an estimate of the interest generated by the ads or across a set of sites in the categories listed above.
Ads: are URLs no longer cool?
In contrast to Super Bowl commercials of the past 25 years, many of this year’s advertisements didn’t include a URL, possibly suggesting strong confidence by brands in their search engine results placement, or an assumption that the viewer would engage with the brand through an app on their phone, rather than a website. To that end, several ads did include an app store-related call to action, encouraging the viewer to download the associated mobile app. And possibly in an effort to capitalize on the success of Coinbase’s QR code commercial during Super Bowl LVI, a number of brands, including Toyota, Michelob Ultra, and Mr. Peanut included QR codes as a way for viewers to get additional information or see more.
As we did last year, we again tracked DNS request traffic to our 1.1.1.1 resolver in United States data centers for domains associated with the advertised products or brands. Traffic growth is plotted against a baseline calculated as the mean request volume for the associated domains between 1200-1500 EST on Sunday, February 12 (Super Bowl Sunday.) Although over 50 brands advertised during the game, the brands highlighted below were chosen because their advertisements drove some of the largest percentage traffic spikes, as well as one interesting tale.
BlueMoon
Although the commercial initially seemed to be for sibling beer brands Coors Light and Miller Lite, there was a twist at the end, This twist was only fitting, as the ad was actually for Blue Moon, which is often served with a twist of orange on the rim of the glass. Although beer ads don’t usually drive significant traffic spikes, this one did, reaching 76,400% above baseline for Blue Moon’s site. Coors Light saw a 275% bump in DNS traffic coincident with the ad, while Miller Lite grew 120%. However, traffic for Coors and Miller was fairly volatile at other times during the game.
LimitBreak
Although last year’s advertisements included a number of cryptocurrency-related brands, they were all but absent from this year’s slate of ads. The closest we got during this year’s game was a commercial from LimitBreak, which describes itself as “bringing the free-to-play gaming experience to Web3 and beyond”, in which it promoted a giveaway of thousands of its Dragon series NFTs. This ad featured a QR code and a URL, and given the nearly 54,000% increase in DNS traffic observed, both were effective means of driving traffic to the LimitBreak website.
Temu
Upstart mobile shopping app Temu purchased multiple Super Bowl ad slots to promote its “shop like a billionaire” campaign, urging viewers to download its mobile app. As seen in the graph below, these advertisements drove spikes in traffic, and continued engagement, each time they ran. The first airing at 19:16 EST drove a 222% spike over baseline in DNS traffic. However, the second airing at 21:12 EST apparently resulted in significantly more interest, driving a 475% traffic increase. A third airing at 22:20 EST reached 169% over baseline, with another one just after that reaching over 200%.
Dunkin’
In early January, Boston-area media blew up with the news that local celebrity Ben Affleck was spotted working the drive-through window at one of the coffee chain’s Medford locations, raising some speculation that he was filming a Super Bowl commercial. That speculation turned out to be true, as the commercial aired at 18:53 EST. But the commercial had a side effect: DNS traffic for dunkin.com, associated with DunkinWorks (a small personal coaching and training business), spiked 8,000% when the commercial aired, as shown in the graph below. (It isn’t clear what drove the later three spikes for dunkin.com, as the advertisement didn’t air again nationally during the remainder of the game.) We can only hope that the dunkin.com system administrators were fueled with plenty of coffee and donuts as they dealt with the rapid growth in traffic.
Site categories: touchdowns bring attention
As we saw last year, there are two factors that bring a surge of traffic to the websites of Super Bowl participants: touchdowns and winning. However, nothing is more impactful than the sweet taste of victory. Both the Kansas City Chiefs’ and Philadelphia Eagles’ websites experienced a surge in DNS traffic just before the game started, as compared to a baseline calculated as the mean request volume for the associated domains between 12:00-15:00 EST on Sunday, February 12 (Super Bowl Sunday.). The Eagles website had its peak just around the time of the kickoff, with 828% growth over baseline, and continued to grow more rapidly than traffic to the Chiefs’ website until 20:55 EST, when traffic to chiefs.com began to pull ahead.
What happened at that time? That was the moment of the Chiefs’ third touchdown of the game, when DNS traffic to the team’s website had its first peak of the evening, at 514% above baseline. There was a clear spike during another Chiefs touchdown at 21:42 EST, at 454% above baseline, but that was nothing compared to the end of the game, when the Kansas City Chiefs were once again, after their 2019 victory, the winners. At 22:15 EST, when the game ended, DNS traffic to the Chiefs’ website was 871% higher, and peaked 10 minutes later at 890%, as compared to the baseline. At this same time, DNS traffic for the Eagles’ website dropped significantly. As we saw last year as well, winning the Super Bowl clearly drives increased traffic to the victor’s website.
Sports websites trends also followed the in-game events. There was a clear spike to approximately 90% above baseline when the game started at 18:30 EST, with further growth to 120% over baseline at 19:00 EST during the Kansas City Chiefs’ first touchdown. There were also clear spikes at 21:30 and 21:40 EST coinciding with the two more Chiefs touchdowns. The Super Bowl peak for these websites was reached during the final break at 22:00 EST, reaching 145% above baseline, just before the Chiefs’ game-winning field goal. After a brief drop as the game ended, there was an additional spike to 134%.
Rihanna’s impact on messaging and social media sites
What happened following Rihanna’s performance during the Super Bowl halftime show? As the game resumed, we saw a clear increase in traffic for messaging websites, with a first peak right after the end of the show at around 20:45 EST, 22% over baseline. The biggest peak, however, was when the game ended. At 22:15 EST, DNS traffic for messaging sites was 30% higher than the earlier baseline.
Rihanna’s announcement of her second pregnancy, which made news after her performance, also impacted traffic to social media platforms. After a small increase when halftime started, there was a clear drop during Rihanna’s show, followed by a jump from 6% below baseline back to 0% right after the show. An additional 3% of traffic growth was reached during the final break at 22:00 EST, just before the Kansas City Chiefs’ winning field goal. After a brief drop, traffic reached 2% above baseline as the game ended.
Is halftime also a time for rewatching ads?
The arrival of halftime at 20:21 EST also brought a surge in DNS traffic for video platforms. The first peak was reached at 18:00 EST, before the game started, at 12% above baseline. The peak during halftime was reached at 20:25 EST with 13% growth above baseline, suggesting that viewers may have been looking at that time to Super Bowl related videos or just using the time to browse those platforms.
Food delivery websites saw flat to lower DNS traffic just before the game as compared to the earlier baseline, suggesting that food orders were placed/scheduled earlier in the afternoon, hours before the game. At kickoff, traffic was 19% below baseline, but there was a clear spike at the time of the first break and right after the first Kansas City touchdown at 18:55 EST. After falling again during the game, there was a small increase in traffic observed just after the game ended.
What about betting sites? They expected a big day during the Super Bowl, given that more states have recently legalized gambling on sports. The peak was reached at 19:00 EST, as DNS traffic reached 295% over baseline, when the Chiefs had their first touchdown, The first Eagles touchdown, minutes before, resulted in a 233% spike. The lowest traffic for betting sites during the Super Bowl was during the halftime show. In the second half of the game, two other clear spikes in traffic are visible. The first was at 20:55 EST at 167% above baseline when the Chiefs pulled ahead with a touchdown, and then a jump to 278% over baseline when the game ended.
Rihanna runs this town city
While the so-called NFL cities across the country are loyal to their local teams, looking at traffic trends across cities from both conferences makes it clear that fans everywhere find joy, not division, in the unknown pleasures of a good halftime show. The drop visible in both graphs below between 20:30-20:50 EST coincides with Rihanna’s return to live performance, as she last performed live in January 2018. Based on the observed drop in traffic, viewers apparently turned away from their computers and devices, giving their attention to Rihanna, or at least stopped their general Internet surfing during the halftime show. As the graphs show, traffic recovered as soon as halftime was over.
Zooming in to individual cities, we examined the traffic patterns observed in both Philadelphia and Kansas City. While both teams have fans across the country, we can use their home cities as a proxy. In this case, we compared normalized Internet traffic levels between 17:00-22:30 EST on Super Bowl Sunday (February 12) with the same time frame on the prior Sunday (February 5).
In Kansas City last Sunday, traffic volumes remained fairly consistent across the surveyed time period. However, on Super Bowl Sunday, traffic levels were initially similar, but by the start of the game were 84% lower than the same time the previous week. Slight drops in traffic are visible coincident with Chiefs touchdowns, but don’t stand out from the overall noisiness of the graph. The graph reached its nadir at 22:13 EST when the Chiefs broke the tie and kicked the game-winning field goal, with the significant drop in traffic likely due to an increased shift in focus towards the outcome of the game, even by those that hadn’t previously been paying close attention.
As the graph below shows, last Sunday saw Internet traffic in Philadelphia gradually decline as the evening wore on. On Super Bowl Sunday, traffic started out slightly lower than the week prior, and also diverged as game time approached, reaching nearly 50% lower at kickoff. As the Eagles took an early lead, their first touchdown resulted in a noticeable drop in traffic from Philadelphia, seen at 18:52 EST, less than 10 minutes after the start of the game. Visible drops in traffic are also coincident with the Eagles’ other three touchdowns, although they don’t stand out against the volatility of the graph. Traffic began to drop towards the end of the game, as the tie score added tension, and reached its lowest point when it became clear that the Eagles were not going to emerge victorious in Super Bowl LVII.
State-level traffic trends: the winning impact
In addition to looking at traffic impacts at a city level, we can also zoom out to examine Internet traffic trends in the Super Bowl states. Arizona, which hosted the big game at State Farm Stadium in Glendale, saw a drop in state-level traffic starting around 13:00 EST. At the time of the kickoff, traffic was 25% lower than the previous Sunday, but the biggest impact was during the wildly popular halftime show by Rihanna. At 20:30 EST, traffic was 29% lower than the same time on the previous Sunday. After the game ended, traffic levels returned to normal around 23:30 EST.
In Pennsylvania, home of the Philadelphia Eagles, traffic began to dip after 15:00 EST and reached its first low point around kickoff, when it was 28% lower than the previous Sunday. Just like in Arizona, the biggest difference was during Rihanna’s halftime show, when it was a whopping 33% lower than usual. However, just a few minutes after the game ended at 22:30 EST, traffic returned to normal.
What about the winning team’s state of Missouri? There, traffic started to decrease only after 17:00 EST and was actually higher than the previous Sunday before that point. With the kickoff came a clear drop, resulting in 28% less traffic than the previous Sunday at the same time. Traffic increased a bit heading towards halftime, but dropped again during Rihanna’s show, when it was 30% lower than usual. The biggest drop in traffic, not surprisingly, was during the exciting moment of the Kansas City Chiefs’ winning field goal. At 22:15 EST, traffic was 33% lower than the previous Sunday. However, after 22:50 EST, Internet traffic in Missouri was back on the fast track, with traffic increasing to levels higher than the previous Sunday.
Rihanna’s halftime performance had a clear impact on Internet traffic at a state level, which dropped across all states with NFL teams at the time of her show. Below we take a closer look at the most populous states, among which Pennsylvania, New York and Arizona were winners, with the largest traffic declines. The impacts in Pennsylvania and Arizona are shown above, and the graph below shows the traffic trends seen in New York.
California, Texas, Florida, and New York all had their fair share of Internet traffic dropping before and throughout the game, but it was during the halftime show when things really got interesting. At the time of Rihanna’s performance, Internet traffic in California was 24% lower than the previous Sunday, while in Texas it was 21% below a week earlier, and Florida also saw a 21% drop. Meanwhile, New York had a clear 30% decrease in traffic during the show and, as shown above, Pennsylvania took the cake with a 33% drop. Illinois, Ohio, Georgia, North Carolina, and Michigan were close behind with 23%, 27%, 22%, 25%, and 22% drops respectively.
This seems to be a clear indication that the Super Bowl in general, but also the much-anticipated halftime shows, and the winning celebrations, all have a massive impact on the Internet, causing a noticeable dip in Internet traffic, especially in the state of the winning team.
Do email spammers and scammers take advantage of “The Big Game”?
Spammers and scammers will frequently try to take advantage of the popularity of major events when running their campaigns, hoping the tie-in will entice the user to open the message and click on a malicious link, or visit a malicious website where they give up a password or credit card number. Cloudflare Area 1 Email Security analyzed the subject lines of email messages processed by the service in the weeks leading up to the Super Bowl to identify malicious, suspicious, and spam messages across four topic areas: Super Bowl/football, sports gambling, sports media/websites, and food delivery.
As the “regular” season NFL games wrapped up, Super Bowl and football themed email threat volume remained relatively low. However, campaigns clearly picked up between January 23-29 as the message count grew sevenfold. However, campaigns kicked into high gear once the Chiefs and Eagles were headed to the Super Bowl, as the number of identified messages between January 30 and February 5 was nearly six times higher than the previous week. These campaigns quickly ended in the week before the big game, though, as Super Bowl and football themed suspicious, malicious, and spam email volume dropped by nearly 90%.
Overall, the number of sports gambling themed subject lines remained fairly low over the survey period. This is somewhat surprising, given that an increasing number of US states have recently legalized betting on sporting events. Interestingly, the trend was highest at the beginning of the year, although that first week was too late to capture potential interest in college football “bowl” games. However, the weeks ahead of the NFL conference championship games (January 23-29) and the Super Bowl (February 6-12) saw message volume increase to levels nearly 2.5x higher than previous weeks.
Sports media and website themed suspicious, malicious, and spam email messages apparently don’t draw the clicks, because the volume of such messages seen by Cloudflare Area 1 has remained extremely low since the start of the year, but peaked during the week of January 23-29. And although lower in volume, the observed trends were similar to those seen for sports gambling, with peaks during the same weeks.
For many people, the Super Bowl is less about the football game than it is about the commercials and the food, and the growth of food delivery services over the last few years have made it easier to ensure that the snacks and libations never run out during the game. Scammers and spammers have apparently learned to take advantage of this hunger, as food delivery themed email messages saw the highest counts across the four categories reviewed here. Peak message counts were seen the weeks of January 2-8 and January 30-February 5. Message volume the weeks following these peaks fell by over 50% in both cases.
Conclusion
As we have seen time and again, advertising during the Super Bowl can drive significant traffic spikes, and apparently this holds true even if a URL isn’t included as a call to action within the commercial. In addition, the trends observed during the game remain a clear reminder that human behavior drives Internet traffic, especially when the halftime show features a popular singer that last performed live five years ago.
Visit Cloudflare Radar for up to date Internet traffic and attack trends, and follow the Cloudflare Radar Twitter and Mastodon accounts for regular insights on Internet events.
Cloudflare operates in more than 250 cities in over 100 countries, where we interconnect with over 10,000 network providers in order to provide a broad range of services to millions of customers. The breadth of both our network and our customer base provides us with a unique perspective on Internet resilience, enabling us to observe the impact of Internet disruptions.
While Internet disruptions are never convenient, online interest in the 2022 World Cup in mid-November and the growth in online holiday shopping in many areas during November and December meant that connectivity issues could be particularly disruptive. Having said that, the fourth quarter appeared to be a bit quieter from an Internet disruptions perspective, although Iran and Ukraine continued to be hotspots, as we discuss below.
Government directed
Multi-hour Internet shutdowns are frequently used by authoritarian governments in response to widespread protests as a means of limiting communications among protestors, as well preventing protestors from sharing information and video with the outside world. During the fourth quarter Cuba and Sudan again implemented such shutdowns, while Iran continued the series of “Internet curfews” across mobile networks it started in mid-September, in addition to implementing several other regional Internet shutdowns.
Cuba
In late September, Hurricane Ian knocked out power across Cuba. While officials worked to restore service as quickly as possible, some citizens responded to perceived delays with protests that were reportedly the largest since anti-government demonstrations over a year earlier. In response to these protests, the Cuban government reportedly cut off Internet access several times. A shutdown on September 29-30 was covered in the Internet disruptions overview for Q3 2022, and the impact of the shutdown that occurred on October 1 (UTC) is shown in the figure below. The timing of this one was similar to the previous one, taking place between 1900 on September 30 and 0245 on October 1 (0000-0745 UTC on October 1).
Sudan
October 25 marked the first anniversary of a coup in Sudan that derailed the country’s transition to civilian rule, and thousands of Sudanese citizens marked the anniversary by taking to the streets in protest. Sudan’s government has a multi-year history of shutting down Internet access during times of civil unrest, and once again implemented an Internet shutdown in response to these protests. The figure below shows a near complete loss of Internet traffic from Sudan on October 25 between 0945-1740 local time (0745 – 1540 UTC).
Iran
As we covered in last quarter’s blog post, the Iranian government implemented daily Internet “curfews”, generally taking place between 1600 and midnight local time (1230-2030 UTC) across three mobile network providers — AS44244 (Irancell), AS57218 (RighTel), and AS197207 (MCCI) — in response to protests surrounding the death of Mahsa Amini. These multi-hour Internet curfew shutdowns continued into early October, with additional similar outages also observed on October 8, 12 and 15 as seen in the figure below. (The graph’s line for AS57218 (Rightel), the smallest of the three mobile providers, suggests that the shutdowns on this network were not implemented after the end of September.)
In addition to the mobile network shutdowns, several regional Internet disruptions were also observed in Iran during the fourth quarter, two of which we review below. The first was in Sanandaj, Kurdistan Province on October 26, where a complete Internet shutdown was implemented in response to demonstrations marking the 40th day since the death of Mahsa Amini. The figure below shows a complete loss of traffic starting at 1030 local time (0700 UTC), with the outage lasting until 0805 local time on October 27 (0435 UTC). In December, a province-level Internet disruption was observed starting on December 18, lasting through December 25.
The Internet disruptions that have taken place in Iran over the last several months have had a significant economic impact on the country. A December post from Filterwatch shared concerns stated in a letter from mobile operator Rightel:
The letter, signed by the network’s Managing Director Yasser Rezakhah, states that “during the past few weeks, the company’s resources and income have significantly decreased during Internet shutdowns and other restrictions, such as limiting Internet bandwidth from 21 September. They have also caused a decrease in data use from subscribers, decreasing data traffic by around 50%.” The letter also states that the “continued lack of compensation for losses could lead to bankruptcy.”
The post also highlighted economic concerns shared by Iranian officials:
Some Iranian officials have expressed concern about the cost of Internet shutdowns, including Valiollah Bayati, MP for Tafresh and Ashtian in Markazi province. In a public session in Majles (parliament), he stated that continued Internet shutdowns have led to the closure of many jobs and people are worried, the government and the President must provide necessary measures.
Since the 30th of Shahrivar month and with the beginning of the government disruption in the Internet, the country’s businesses have been damaged daily at least 50 million tomans and at most 500 million tomans. More than 41% of companies have lost 25-50% of their income during this period, and about 47% have had more than 50% reduction in sales. A review of the data of the research assistant of the country’s tax affairs organization shows that the Internet outage in Iran has caused 3000 billion tomans of damage per day. That is, the cost of 3 months of Internet outage in Iran is equal to 43% of one year’s oil revenue of the country ($25 billion).
Power outages
Bangladesh, October 4
Over 140 million people in Bangladesh were left without electricity on October 4 as the result of a reported grid failure caused by a failure by power distribution companies to follow instructions from the National Load Dispatch Centre to shed load. The resultant power outage resulted in an observed drop in Internet traffic from the country, starting at 1405 local time (0805 UTC), as shown in the figure below. The disruption lasted approximately seven hours, with traffic returning to expected levels around 1900 local time (1500 UTC).
Pakistan
Over a week later, a similar issue in Pakistan caused power outages across the southern part of the country, including Sindh, Punjab, and Balochistan. The power outages were caused by a fault in the national grid’s southern transmission system, reportedly due to faulty equipment and sub-standard maintenance. As expected, the power outages resulted in disruptions to Internet connectivity, and the figure below illustrates the impact observed in Sindh, where traffic dropped nearly 30% as compared to the previous week starting at 0935 local time (0435 UTC) on October 6. The disruption lasted over 15 hours, with traffic returning to expected levels at 0100 on October 7 (2000 UTC on October 6).
On November 24, a Tweet from Kenya Power at 1525 local time noted that they had “lost bulk power supply to various parts of the country due to a system disturbance”. A subsequent Tweet published just over six hours later at 2150 local time stated that “normal power supply has been restored to all parts of the country.” The time stamps on these notifications align with the loss of Internet traffic visible in the figure below, which lasted between 1500-2050 local time (1200-1750 UTC).
United States (Moore County, North Carolina)
On December 3, two electrical substations in Moore County, North Carolina were targeted by gunfire, with the resultant damage causing localized power outages that took multiple days to resolve. The power outages reportedly began just after 1900 local time (0000 UTC on December 4), resulting in the concurrent loss of Internet traffic from communities within Moore County, as seen in the figure below.
Internet traffic within the community of West End appeared to return midday (UTC) on December 5, but that recovery was apparently short-lived, as it fell again during the afternoon of December 6. In Pinehurst, traffic began to slowly recover after about a day, but returned to more normal levels around 0800 local time (1300 UTC) on December 7.
The war in Ukraine has been going on since February 24, and Cloudflare has covered the impact of the war on the country’s Internet connectivity in a number of blog posts across the year (March, March, April, May, June, July, October, December). Throughout the fourth quarter of 2022, Russian missile strikes causedwidespreaddamage to electrical infrastructure, resulting in power outages and disruptions to Internet connectivity. Below, we highlight several examples of the Internet disruptions observed in Ukraine during the fourth quarter, but they are just a few of the many disruptions that occurred.
On October 20, the destruction of several power stations in Kyiv resulted in a 25% drop in Internet traffic from Kyiv City as compared to the two previous weeks. The disruption began around 0900 local time (0700 UTC).
On November 23, widespread power outages after Russian strikes caused a nearly 50% decrease in Internet traffic in Ukraine, starting just after 1400 local time (1200 UTC). This disruption lasted for nearly a day and a half, with traffic returning to expected levels around 2345 local time on November 24 (2145 UTC).
On December 16, power outages resulting from Russian air strikes targeting power infrastructure caused country-level Internet traffic to drop around 13% at 0915 local time (0715 UTC), with the disruption lasting until midnight local time (2200 UTC). However, at a network level, the impact was more significant, with AS13188 (Triolan) seeing a 70% drop in traffic, and AS15895 (Kyivstar) a 40% drop, both shown in the figures below.
Cable cuts
Shetland Islands, United Kingdom
The Shetland Islands are primarily dependent on the SHEFA-2 submarine cable system for Internet connectivity, connecting through the Scottish mainland. Late in the evening of October 19, damage to this cable knocked the Shetland Islands almost completely offline. At the time, there was heightened concern about the potential sabotage of submarine cables due to the reported sabotage of the Nord Stream natural gas pipelines in late September, but authorities believed that this cable damage was due to errant fishing vessels, and not sabotage.
The figure below shows that the impact of the damage to the cable was relatively short-lived, compared to the multi-day Internet disruptions often associated with submarine cable cuts. Traffic dropped just after 2300 local time (2200 UTC) on October 19, and recovered 14.5 hours later, just after 1430 local time (1330 UTC) on October 20.
Earthquakes frequently cause infrastructure damage and power outages in affected areas, resulting in disruptions to Internet connectivity. We observed such a disruption in the Solomon Islands after a magnitude 7.0 earthquake occurred near there on November 22. The figure below shows Internet traffic from the country dropping significantly at 1300 local time (0200 UTC), and recovering 11 hours later at around 2000 local time (0900 UTC).
Technical problems
Kyrgyzstan
On October 24, a three-hour Internet disruption was observed in Kyrgyzstan lasting between 1100-1400 local time (0500-0800 UTC), as seen in the figure below. According to the country’s Ministry of Digital Development, the issue was caused by “an accident on one of the main lines that supply the Internet”, but no additional details were provided regarding the type of accident or where it had occurred.
Australia (Aussie Broadband)
Customers of Australian broadband Internet provider Aussie Broadband in Victoria and New South Wales suffered brief Internet disruptions on October 27. As shown in the figure below, AS4764 (Aussie Broadband) traffic from Victoria dropped by approximately 40% between 1505-1745 local time (0405-0645 UTC). A similar, but briefer, loss of traffic from New South Wales was also observed, lasting between 1515-1550 local time (0415-0450 UTC). A representative of Aussie Broadband provided insight into the underlying cause of the disruption, stating “A config change was made which was pushed out through automation to the DHCP servers in those states. … The change has been rolled back but getting the sessions back online is taking time for VIC, and we are now manually bringing areas up one at a time.”
In Haiti, customers of Internet service provider Access Haiti experienced disrupted service for more than half a day on November 9. The figure below shows that Internet traffic for AS27759 (Access Haiti) fell precipitously around midnight local time (0500 UTC), remaining depressed until 1430 local time (1930 UTC), at which time it recovered quickly. A Facebook post from Access Haiti explained to customers that “Due to an intermittent outage on one of our international circuits, our network is experiencing difficulties that cause your Internet service to slow down.” While Access Haiti didn’t provide additional details on which international circuit was experiencing an outage, submarinecablemap.com shows that two submarine cables provide international Internet connectivity to Haiti — the Bahamas Domestic Submarine Network (BDSNi), which connects Haiti to the Bahamas, and Fibralink, which connects Haiti to the Dominican Republic and Jamaica.
Unknown
Many Internet disruptions can be easily tied to an underlying cause, whether through coverage in the press, a concurrent weather or natural disaster event, or communication from an impacted provider. However, the causes of other observed disruptions remain unknown as the impacted providers remain silent about what caused the problem.
United States (Wide Open West)
On November 15, customers of Wide Open West, an Internet service provider with a multi-state footprint in the United States, experienced an Internet service disruption that lasted a little over an hour. The figure below illustrates the impact of the disruption in Alabama and Michigan on AS12083 (Wide Open West), with traffic dropping at 1150 local time (1650 UTC) and recovering just after 1300 local time (1800 UTC).
Cuba
Cuba is no stranger to Internet disruptions, whether due to government-directed shutdowns (such as the one discussed above), fiber cuts, or power outages. However, no underlying cause was ever shared for the seven-hour disruption in the country’s Internet traffic observed between 2345 on November 25 and 0645 on November 26 local time (0445-1145 UTC on November 26). Traffic was down as much as 75% from previous levels during the disruption.
SpaceX Starlink
As a provider of low earth orbit (LEO) satellite Internet connectivity services, disruptions to SpaceX Starlink’s service can have a global impact. On November 30, a disruption was observed on AS14593 (SPACEX-STARLINK) between 2050-2130 UTC, with traffic volume briefly dropping to near zero. Unfortunately, Starlink did not acknowledge the incident, nor did they provide any reason for the disruption.
Conclusion
Looking back at the Internet disruptions observed during 2022, a number of common themes can be found. In countries with more authoritarian governments, the Internet is often weaponized as a means of limiting communication within the country and with the outside world through network-level, regional, or national Internet shutdowns. As noted above, this approach was used aggressively in Iran during the last few months of the year.
Internet connectivity quickly became a casualty of war in Ukraine. Early in the conflict, network-level outages were common, and some Ukrainian networks ultimately saw traffic re-routed through upstream Russian Internet service providers. Later in the year, as electrical power infrastructure was increasingly targeted by Russian attacks, widespread power outages resulted in multi-hour disruptions of Internet traffic across the country.
While the volcanic eruption in Tonga took the country offline for over a month due to its reliance on a single submarine cable for Internet connectivity, the damage caused by earthquakes in other countries throughout the year resulted in much shorter and more limited disruptions.
And while submarine cable issues can impact multiple countries along its route, the advent of services with an increasingly global footprint like SpaceX Starlink mean that service disruptions will ultimately have a much broader impact. (Starlink’s subscriber base is comparatively small at the moment, but it currently has a service footprint in over 30 countries around the world.)
Welcome to our DDoS Threat Report for the fourth and final quarter of 2022. This report includes insights and trends about the DDoS threat landscape – as observed across Cloudflare’s global network.
In the last quarter of the year, as billions around the world celebrated holidays and events such as Thanksgiving, Christmas, Hanukkah, Black Friday, Singles’ Day, and New Year, DDoS attacks persisted and even increased in size, frequency, and sophistication whilst attempting to disrupt our way of life.
Cloudflare’s automated DDoS defenses stood firm and mitigated millions of attacks in the last quarter alone. We’ve taken all of those attacks, aggregated, analyzed, and prepared the bottom lines to help you better understand the threat landscape.
Global DDoS insights
In the last quarter of the year, despite a year-long decline, the amount of HTTP DDoS attack traffic still increased by 79% YoY. While most of these attacks were small, Cloudflare constantly saw terabit-strong attacks, DDoS attacks in the hundreds of millions of packets per second, and HTTP DDoS attacks peaking in the tens of millions of requests per second launched by sophisticated botnets.
Volumetric attacks surged; the number of attacks exceeding rates of 100 gigabits per second (Gbps) grew by 67% quarter-over-quarter (QoQ), and the number of attacks lasting more than three hours increased by 87% QoQ.
Ransom DDoS attacks steadily increased this year. In Q4, over 16% of respondents reported receiving a threat or ransom demand as part of the DDoS attack that targeted their Internet properties.
Industries most targeted by DDoS attacks
HTTP DDoS attacks constituted 35% of all traffic to Aviation and Aerospace Internet properties.
Similarly, over a third of all traffic to the Gaming/Gambling and Finance industries was network-layer DDoS attack traffic.
A whopping 92% of traffic to Education Management companies was part of network-layer DDoS attacks. Likewise, 73% of traffic to the Information Technology and Services and the Public Relations & Communications industries were also network-layer DDoS attacks.
Source and targets of DDoS attacks
In Q4, 93% of network-layer traffic to Chinese Internet properties behind Cloudflare were part of network-layer DDoS attacks. Similarly, over 86% of traffic to Cloudflare customers in Lithuania and 80% of traffic to Cloudflare customers in Finland was attack traffic.
On the application-layer, over 42% of all traffic to Georgian Internet properties behind Cloudflare was part of HTTP DDoS attacks, followed by Belize with 28%, and San Marino in third place with just below 20%. Almost 20% of all traffic from Libya that Cloudflare saw was application-layer DDoS attack traffic.
Over 52% of all traffic recorded in Cloudflare’s data centers in Botswana was network-layer DDoS attack traffic. Similarly, in Cloudflare’s data centers in Azerbaijan, Paraguay, and Palestine, network-layer DDoS attack traffic constituted approximately 40% of all traffic.
Quick note: this quarter, we’ve made a change to our algorithms to improve the accuracy of our data which means that some of these data points are incomparable to previous quarters. Read more about these changes in the next section Changes to the report methodologies.
Sign up to the DDoS Trends Webinar to learn more about the emerging threats and how to defend against them.
Changes to the report methodologies
Since our first report in 2020, we’ve always used percentages to represent attack traffic, i.e., the percentage of attack traffic out of all traffic including legitimate/user traffic. We did this to normalize the data, avoid data biases, and be more flexible when it comes to incorporating new mitigation system data into the report.
In this report, we’ve introduced changes to the methods used to calculate some of those percentages when we bucket attacks by certain dimensions such as target country, source country, or target industry. In the application-layer sections, we previously divided the amount of attack HTTP/S requests to a given dimension by all the HTTP/S requests to all dimensions. In the network-layer section, specifically in Target industries and Target countries, we used to divide the amount of attack IP packets to a given dimension by the total attack packets to all dimensions.
From this report onwards, we now divide the attack requests (or packets) to a given dimension only by the total requests (or packets) to that given dimension. We made these changes in order to align our calculation methods throughout the report and improve the data accuracy so it better represents the attack landscape.
For example, the top industry attacked by application-layer DDoS attacks using the previous method was the Gaming and Gambling industry. The attack requests towards that industry accounted for 0.084% of all traffic (attack and non-attack) to all industries. Using that same old method, the Aviation and Aerospace industry came in 12th place. Attack traffic towards the Aviation and Aerospace industry accounted for 0.0065% of all traffic (attack and non-attack) to all industries. However, using the new method, the Aviation and Aerospace industry came in as the number one most attacked industry — attack traffic formed 35% of all traffic (attack and non-attack) towards that industry alone. Again using the new method, the Gaming and Gambling industry came in 14th place — 2.4% of its traffic was attack traffic.
The old calculation method used in previous reports to calculate the percentage of attack traffic for each dimension was the following:
The new calculation method used from this report onwards is the following:
The changes apply to the following metrics:
Target industries of application-layer DDoS attacks
Target countries of application-layer DDoS attacks
Source of application-layer DDoS attacks
Target industries of network-layer DDoS attacks
Target countries of network-layer DDoS attacks
No other changes were made in the report. The Source of network-layer DDoS attacks metrics already use this method since the first report. Also, no changes were made to the Ransom DDoS attacks, DDoS attack rate, DDoS attack duration, DDoS attack vectors, and Top emerging threats sections. These metrics do not take legitimate traffic into consideration and no methodology alignment was needed.
With that in mind, let’s dive in deeper and explore these insights and trends. You can also view an interactive version of this report on Cloudflare Radar.
Ransom DDoS attacks
As opposed to Ransomware attacks, where the victim is tricked into downloading a file or clicking on an email link that encrypts and locks their computer files until they pay a ransom fee, Ransom DDoS attacks can be much easier for attackers to launch. Ransom DDoS attacks don’t require tricking the victim into opening an email or clicking a link, nor do they require a network intrusion or a foothold to be carried out.
In a Ransom DDoS attack, the attacker doesn’t need access to the victim’s computer but rather just floods them with enough traffic to negatively impact their Internet services. The attacker will demand a ransom payment, usually in the form of Bitcoin, to stop and/or avoid further attacks.
In the last quarter of 2022, 16% of Cloudflare customers that responded to our survey reported being targeted by HTTP DDoS attacks accompanied by a threat or a ransom note. This represents a 14% increase QoQ but a 16% decrease YoY in reported Ransom DDoS attacks.
Distribution of Ransom DDoS attacks over 2021 and 2022 by quarter (each column represents the percentage of users reporting a ransom attack)
How we calculate Ransom DDoS attack trends Cloudflare’s systems constantly analyze traffic and automatically apply mitigation when DDoS attacks are detected. Each DDoS’d customer is prompted with an automated survey to help us better understand the nature of the attack and the success of the mitigation. For over two years, Cloudflare has been surveying attacked customers. One of the questions in the survey asks the respondents if they received a threat or a ransom note. Over the past two years, on average, we collected 187 responses per quarter. The responses of this survey are used to calculate the percentage of Ransom DDoS attacks.
Application-layer DDoS attack landscape
Application-layer DDoS attacks, specifically HTTP/S DDoS attacks, are cyber attacks that usually aim to disrupt web servers by making them unable to process legitimate user requests. If a server is bombarded with more requests than it can process, the server will drop legitimate requests and – in some cases – crash, resulting in degraded performance or an outage for legitimate users.
Application-layer DDoS attack trends
When we look at the graph below, we can see a clear downward trend in attacks each quarter this year. However, despite the downward trend, HTTP DDoS attacks still increased by 79% when compared to the same quarter of previous year.
Distribution of HTTP DDoS attacks over the last year by quarter
Target industries of application-layer DDoS attacks
In the quarter where many people travel for the holidays, the Aviation and Aerospace was the most attacked industry. Approximately 35% of traffic to the industry was part of HTTP DDoS attacks. In second place, the Events Services industry saw over 16% of its traffic as HTTP DDoS attacks.
In the following places were the Media and Publishing, Wireless, Government Relations, and Non-profit industries. To learn more about how Cloudflare protects non-profit and human rights organizations, read our recent Impact Report.
Top industries targeted by HTTP DDoS attacks in 2022 Q4
When we break it down regionally, and after excluding generic industry buckets like Internet and Software, we can see that in North America and Oceania the Telecommunications industry was the most targeted. In South America and Africa, the Hospitality industry was the most targeted. In Europe and Asia, Gaming & Gambling industries were the most targeted. And in the Middle East, the Education industry saw the most attacks.
Top industries targeted by HTTP DDoS attacks in 2022 Q4, by region
Target countries of application-layer DDoS attacks
Bucketing attacks by our customers’ billing address helps us understand which countries are more frequently attacked. In Q4, over 42% of all traffic to Georgian HTTP applications behind Cloudflare was DDoS attack traffic.
In second place, Belize-based companies saw almost a third of their traffic as DDoS attacks, followed by San Marino in third with just below 20% of its traffic being DDoS attack traffic.
Top countries targeted by HTTP DDoS attacks in 2022 Q4
Source of application-layer DDoS attacks
Quick note before we dive in. If a country is found to be a major source of DDoS attacks, it doesn’t necessarily mean that it is that country that launches the attacks. Most often with DDoS attacks, attackers are launching attacks remotely in an attempt to hide their true location. Top source countries are more often indicators that there are botnet nodes operating from within that country, perhaps hijacked servers or IoT devices.
In Q4, almost 20% of all HTTP traffic originating from Libya was part of HTTP DDoS attacks. Similarly, 18% of traffic originating from Timor-Leste, an island country in Southeast Asia just north of Australia, was attack traffic. DDoS attack traffic also accounted for 17% of all traffic originating from the British Virgin Islands and 14% of all traffic originating from Afghanistan.
Top source countries of HTTP DDoS attacks in 2022 Q4
Network-layer DDoS attacks
While application-layer attacks target the application (Layer 7 of the OSI model) running the service that end users are trying to access (HTTP/S in our case), network-layer DDoS attacks aim to overwhelm network infrastructure, such as in-line routers and servers, and the Internet link itself.
Network-layer DDoS attack trends
After a year of steady increases in network-layer DDoS attacks, in the fourth and final quarter of the year, the amount of attacks actually decreased by 14% QoQ and 13% YoY.
Distribution of Network-layer DDoS attacks over the last year by quarter
Now let’s dive a little deeper to understand the various attack properties such as the attack volumetric rates, durations, attack vectors, and emerging threats.
DDoS attack rate While the vast majority of attacks are relatively short and small, we did see a spike in longer and larger attacks this quarter. The amount of volumetric network-layer DDoS attacks with a rate exceeding 100 Gbps increased by 67% QoQ. Similarly, attacks in the range of 1-100 Gbps increased by ~20% QoQ, and attacks in the range of 500 Mbps to 1 Gbps increased by 108% QoQ.
QoQ change in DDoS attack rates in 2022 Q4
Below is an example of one of those attacks exceeding 100 Gbps that took place the week after Thanksgiving. This was a 1 Tbps DDoS attack targeted at a Korean-based hosting provider. This particular attack was an ACK flood, and it lasted roughly one minute. Since the hosting provider was using Magic Transit, Cloudflare’s L3 DDoS protection service, the attack was automatically detected and mitigated.
Graph of a 1 Tbps DDoS attack
While bit-intensive attacks usually aim to clog up the Internet connection to cause a denial of service event, packet-intensive attacks attempt to crash in-line devices. If an attack sends more packets than you can handle, the servers and other in-line appliances might not be able to process legitimate user traffic, or even crash altogether.
DDoS attack duration In Q4, the amount of shorter attacks lasting less than 10 minutes decreased by 76% QoQ, and the amount of longer attacks increased. Most notably, attacks lasting 1-3 hours increased by 349% QoQ and the amount of attacks lasting more than three hours increased by 87% QoQ. Most of the attacks, over 67% of them, lasted 10-20 minutes.
QoQ change in the duration of DDoS attacks in 2022 Q4
DDoS attack vectors The attack vector is a term used to describe the attack method. In Q4, SYN floods remained the attacker’s method of choice — in fact, almost half of all network-layer DDoS attacks were SYN floods.
As a recap, SYN floods are a flood of SYN packets (TCP packets with the Synchronize flag turned on, i.e., the bit set to 1). SYN floods take advantage of the statefulness of the Three-way TCP handshake — which is the way to establish a connection between a server and a client.
The Three-way TCP Handshake
The client starts off by sending a SYN packet, the server responds with a Synchronize-acknowledgement (SYN/ACK) packet and waits for the client’s Acknowledgement (ACK) packet. For every connection, a certain amount of memory is allocated. In the SYN flood, the source IP addresses may be spoofed (altered) by the attacker, causing the server to respond with the SYN/ACK packets to the spoofed IP addresses — which most likely ignore the packet. The server then naively waits for the never arriving ACK packets to complete the handshake. After a while, the server times out and releases those resources. However, given a sufficient amount of SYN packets in a short amount of time, they may be enough to drain the server’s resources and render it unable to handle legitimate user connections or even crash altogether.
After SYN floods, with a massive drop in share, DNS floods and amplification attacks came in second place, accounting for ~15% of all network-layer DDoS attacks. And in third UDP-based DDoS attacks and floods with a 9% share.
Top attack vectors in 2022 Q4
Emerging DDoS threats In Q4, Memcached-based DDoS attacks saw the highest growth — a 1,338% increase QoQ. Memcached is a database caching system for speeding up websites and networks. Memcached servers that support UDP can be abused to launch amplification/reflection DDoS attacks. In this case, the attacker would request content from the caching system and spoof the victim’s IP address as the source IP in the UDP packets. The victim will be flooded with the Memcache responses which can be amplified by a factor of up to 51,200x.
In second place, SNMP-based DDoS attacks increased by 709% QoQ. Simple Network Management Protocol (SNMP) is a UDP-based protocol that is often used to discover and manage network devices such as printers, switches, routers, and firewalls of a home or enterprise network on UDP well-known port 161. In an SNMP reflection attack, the attacker sends out numerous SNMP queries while spoofing the source IP address in the packet as the targets to devices on the network that, in turn, reply to that target’s address. Numerous responses from the devices on the network results in the target network being DDoSed.
In third place, VxWorks-based DDoS attacks increased by 566% QoQ. VxWorks is a real-time operating system (RTOS) often used in embedded systems such as Internet of Things (IoT) devices. It also is used in networking and security devices, such as switches, routers, and firewalls. By default, it has a debug service enabled which not only allows anyone to do pretty much anything to those systems, but it can also be used for DDoS amplification attacks. This exploit (CVE-2010-2965) was exposed as early as 2010 and as we can see it is still being used in the wild to generate DDoS attacks.
Top emerging threats in 2022 Q4
Target industries of network-layer DDoS attacks
In Q4, the Education Management industry saw the highest percentage of network-layer DDoS attack traffic — 92% of all traffic routed to the industry was network-layer DDoS attack traffic.
Not too far behind, in the second and third places, the Information Technology and Services alongside the Public Relations and Communications industries also saw a significant amount of network-layer DDoS attack traffic (~73%). With a high margin, the Finance, Gaming / Gambling, and Medical Practice industries came in next with approximately a third of their traffic flagged as attack traffic.
Top industries targeted by network-layer DDoS attacks in 2022 Q4
Target countries of network-layer DDoS attacks
Grouping attacks by our customers’ billing country lets us understand which countries are subject to more attacks. In Q4, a staggering 93% of traffic to Chinese Internet properties behind Cloudflare was network-layer DDoS attack traffic.
In second place, Lithuanian Internet properties behind Cloudflare saw 87% of their traffic belonging to network-layer DDoS attack traffic. Following were Finland, Singapore, and Taiwan with the highest percentage of attack traffic.
Top countries targeted by network-layer DDoS attacks in 2022 Q4
Source of network-layer DDoS attacks
In the application-layer, we used the attacking IP addresses to understand the origin country of the attacks. That is because at that layer, IP addresses cannot be spoofed (i.e., altered). However, in the network layer, source IP addresses can be spoofed. So, instead of relying on IP addresses to understand the source, we instead use the location of our data centers where the attack packets were ingested. We’re able to get geographical accuracy due to our large global coverage in over 275+ locations around the world.
In Q4, over 52% of the traffic we ingested in our Botswana-based data center was attack traffic. Not too far behind, over 43% of traffic in Azerbaijan was attack traffic, followed by Paraguay, Palestine, Laos, and Nepal.
Top Cloudflare data center locations with the highest percentage of DDoS attack traffic in 2022 Q4
Please note: Internet Service Providers may sometimes route traffic differently which may skew results. For example, traffic from China may be hauled through California due to various operational considerations.
Understanding the DDoS threat landscape
This quarter, longer and larger attacks became more frequent. Attack durations increased across the board, volumetric attacks surged, and Ransom DDoS attacks continued to rise. During the 2022 holiday season, the top targeted industries for DDoS attacks at the application-layer were Aviation/Aerospace and Events Services. Network-layer DDoS attacks targeted Gaming/Gambling, Finance, and Education Management companies. We also saw a shift in the top emerging threats, with Memcashed-based DDoS attacks continuing to increase in prevalence.
Defending against DDoS attacks is critical for organizations of all sizes. While attacks may be initiated by humans, they are executed by bots — and to play to win, you must fight bots with bots. Detection and mitigation must be automated as much as possible, because relying solely on humans puts defenders at a disadvantage. Cloudflare’s automated systems constantly detect and mitigate DDoS attacks for our customers, so they don’t have to.
Over the years, it has become easier, cheaper, and more accessible for attackers and attackers-for-hire to launch DDoS attacks. But as easy as it has become for the attackers, we want to make sure that it is even easier – and free – for defenders of organizations of all sizes to protect themselves against DDoS attacks of all types. We’ve been providing unmetered and unlimited DDoS protection for free to all of our customers since 2017 — when we pioneered the concept. Cloudflare’s mission is to help build a better Internet. A better Internet is one that is more secure, faster, and reliable for everyone – even in the face of DDoS attacks.
Sign up to the DDoS Trends Webinar to learn more about the emerging threats and how to defend against them.
In 2022, with nearly five billion people around the world (as well as an untold number of “bots”) using the Internet, analyzing aggregate data about this usage can uncover some very interesting trends. To that end, we’re excited to present the Cloudflare Radar 2022 Year In Review, featuring interactive charts, graphs, and maps you can use to explore notable Internet trends observed throughout this past year. The Year In Review website is part of Cloudflare Radar, which celebrated its second birthday in September with the launch of Radar 2.0.
We have organized the trends we observed around three different topic areas: Traffic, Adoption, and Security. The content covered within each of these areas is described in more detail in their respective sections below. Building on the 2021 Year In Review, we have incorporated several additional metrics this year, and have also improved the underlying methodology. (As such, the charts are not directly comparable to develop insights into year-over-year changes.)
Website visualizations shown at a weekly granularity cover the period from January 2 through November 26, 2022 (the start of the first full week of the year through the end of the last full week of November). We plan to update the underlying data sets through the end of the year in early 2023. Trends for nearly 200 locations are available on the website, with some smaller or less populated locations excluded due to insufficient data.
Before we jump in, we urge anyone who prefers to see the headline stats up front and to explore the data themselves to go ahead and visit the website. Anyone who wants a more lengthy, but curated set of observations should continue reading below. Regardless, we encourage you to consider how the trends presented within this post and the website’s various sections impact your business or organization, and to think about how these insights can inform actions that you can take to improve user experience or enhance your security posture.
Traffic
Anyone following recent technology headlines might assume that the Internet’s decades-long trend of incredible growth would have finally begun to falter. In times like these, data is key. Our data indicates that global Internet traffic, which grew at 23% this year, is as robust as ever.
To determine the traffic trends over time, we first established a baseline, calculated as the average daily traffic volume (excluding bot traffic) over the second full calendar week (January 9-15) of 2022. We chose the second calendar week to allow time for people to get back into their “normal” routines (school, work, etc.) after the winter holidays and New Year’s Day. The percent change shown on the trend lines in our charts are calculated relative to the baseline value, and represents a seven-day trailing average — it does not represent absolute traffic volume for a location. The seven-day averaging is done to smooth the sharp changes seen with a daily granularity.
In addition to calculating traffic growth, our 1.1.1.1 public DNS resolver and broad global customer base enables us to have a unique view into online activity. This includes insights into the most popular types of Internet content and the most popular Internet services in general and across specific categories, as well as the impact of bots. Of course, none of this matters if connectivity is unavailable, so we also drill down into major Internet disruptions observed in 2022.
Traffic trends
After an initial dip, worldwide Internet traffic saw nominal growth coinciding with the 2022 Olympic Winter Games in Beijing, but slipped again in the weeks after their conclusion. After a couple of months of slight growth, traffic again dipped below baseline heading into July. However, after reaching that nadir, Internet traffic experienced a fairly consistent rate of growth through the back part of the year. An upwards inflection at the end of November is visible in the worldwide traffic graph as well as the traffic graphs of a number of locations. Traffic analysis showed that this increase resulted from the convergence of early holiday shopping traffic (to e-commerce sites) with the run-up to and early days of FIFA World Cup Qatar 2022.
The An Update on Cloudflare’s assistance to Ukraine blog post published during Impact Week looked at the conflict from an attack perspective. Viewing Ukraine through an Internet traffic lens provides unique insights into the impacts of the war’s damage and destruction to Internet connectivity within the country. After starting the year with some nominal traffic growth, that trend was quickly reversed once the Russian invasion began on February 24, with traffic quickly falling as infrastructure was damaged and the populace focused on finding safety and shelter. Although traffic started to grow again after that initial steep decline, drops in May and June appear to be correlated with significant outages observed by Cloudflare. After returning to growth during August, several additional disruptions were visible in September, October, and November coincident with widespread power outages across the country resulting from Russian attacks.
Reliable electric power is critical for reliable Internet connectivity, both for the core network infrastructure in data centers, as well as for last-mile infrastructure like cell towers and Wi-Fi routers, as well as laptops, cellphones, and other devices used to access the Internet. For several years, the residents of Puerto Rico have struggled to contend with an unreliable electric grid, resulting in frequent power outages and slow restoration times. In 2022, the island suffered two multi-day power outages that clearly impacted otherwise strong traffic growth. In April, a fire at a power plant caused an outage that lasted three days, disrupting Internet connectivity during that period. In September, widespread power outages resulting from damage from Hurricane Fiona resulted in a rapid drop in Internet traffic with the disruption lasting over a week until power restoration work and infrastructure repair was completed.
Top categories
Cloudflare’s global customer base spans a range of industry categories, including technology, e-commerce, and entertainment, among others. Analysis of the traffic to our customers’ websites and applications reveals which categories of content were most popular throughout the year, and can be broken out by user location. The domains associated with each customer zone have one or more associated categories — these can be viewed on Cloudflare Radar. To calculate the distribution of traffic across the set of categories for each location, we divided the number of requests for domains associated with a given category seen over the course of a week by the total number of requests mapped to a category seen over that week, filtering out bot traffic. If a domain is associated with multiple categories, then the associated request was included in the aggregate count for each category. The chart shows how the distribution of requests across the selected categories changes over the course of the year.
Globally, sites in the Technology category were the most popular, accounting for approximately one-third of traffic throughout the year. The next most popular category was Business & Economy, which drove approximately 15% of traffic. Shopping & Auctions also saw a bump in traffic in November, as consumers began their holiday shopping.
In sharp contrast to other Asian countries, in South Korea, Internet Communication was consistently the second most popular category during the year. Elsewhere, Internet Communication was occasionally among the top five, but usually within the top 10. Internet Communication was followed closely by Entertainment and Business & Economy. The former saw multiple periods of increased traffic through the year, in contrast to other categories, which saw traffic share remain fairly consistent over time.
Traffic distribution in Turkey represented a rare departure from most other locations around the world. Although Technology started the year as the most popular category, its popularity waned during the back half of the year, ending below Shopping & Auctions and Society & Lifestyle. These latter two saw gradual growth starting in September, and posted larger increases in November. Business & Economy and Entertainment sites were comparatively less popular here, in contrast to many other locations.
Armenia’s traffic distribution also ran counter to that seen in most other locations. Entertainment was the most popular category for nearly the entire year, except for the final week of November. Technology was generally the second most popular category, although it was surpassed by Gambling several times throughout the year. However, Gambling saw its popularity fall significantly in November, as it was surpassed by the Shopping & Auctions and Business & Economy categories.
Most popular Internet services
The luxury of being a popular Internet service is that the service’s brand becomes very recognizable, so it will be no surprise that Google was #1 in our General ranking.
Top 10 — General, late 2022 ranking 1. Google 2. Facebook 3. Apple, TikTok (tie) 5. YouTube 6. Microsoft 7. Amazon Web Services 8. Instagram 9. Amazon 10. iCloud, Netflix, Twitter, Yahoo (tie)
Last year TikTok was at the top of our ranking. However, the results between the two years aren’t comparable. As part of our launch of Radar 2.0, we introduced improvements to our domain ranking algorithms, and this year’s rankings are based on those new algorithms. In addition, this year we have grouped domains that all belong to a single Internet service. For example, Google operates google.com, google.pt, and mail.google.com among others, so we aggregated the popularity of each domain under a single “Google” Internet service for simplicity. However, while Meta operates both Facebook and Instagram, consumers typically perceive those brands as distinct, so we decided to group domains associated with those services separately.
Zooming out from our General top 10, the anonymized DNS query data from our 1.1.1.1 public DNS resolver reflects traffic from millions of users around the world, enabling us to offer category specific rankings as well. While you can view them all in the “Most popular Internet services” section of our Year in Review website, we’ve decided to highlight a few of our favorite observations below.
Cryptocurrencies always seem to have as much promise as they have controversy. We couldn’t help but be curious about which cryptocurrency services were the most popular. But before jumping into the Top 10, let’s double-click on one that fell out of the running: FTX. Known as the third largest cryptocurrency exchange in the world, our popularity ranking shows it hovered around 9th place for most of the year. That is, until it filed for bankruptcy in November. At that point, there is a precipitous drop, which also appears to coincide with reports that FTX disabled its users’ ability to make cryptocurrency withdrawals. Moving back to the Top 10, the two other major cryptocurrency exchanges, Binance and Coinbase, ranked #1 and #3 respectively and don’t appear to have been adversely impacted by FTX in our rankings.
The universe has been the hottest place to be since the beginning of time, but some suggest that we’ll all soon be in the metaverse. If that’s true, then the question becomes “Whose metaverse?”. Last year, Facebook changed its name to Meta as it poured billions of dollars into the space, so we were curious about the impact of their efforts on the metaverse landscape one year later. With Meta’s Oculus offering their initial foray into the metaverse, our data indicates that while its popularity saw tangible improvements, rising from 10th to 5th in the back half of the year, Roblox is clearly the champion of the metaverse arena. It is fascinating to see this smaller challenger dominating Oculus, which is operated by Meta, a company ~18x larger in market capitalization. We are excited to check back at the end of 2023 to see whether Oculus’ ascent of the rankings topples Roblox, or if the smaller player retains the crown.
Facebook’s transition to Meta, however, does not appear to have impacted its popularity as a social media platform. Within our ranking of the top social media platforms, Facebook held the top position throughout the year. TikTok and Snapchat also held steady in their places among the top five. Instagram and Twitter traded places several times mid-year, but the photo and video sharing app ultimately knocked Twitter from 3rd place in August. More active volatility was seen in the bottom half of the top 10, as LinkedIn, Discord, and Reddit frequently shifted between sixth, seventh, and eighth position in the rankings.
While those are the most popular sites today, over the last 20+ years, the landscape of social media platforms has been quite dynamic, with new players regularly emerging. Some gained a foothold and became successful, while others became a footnote of Internet history. Although it has actually been around since 2016, Mastodon emerged as the latest potential disruptor in the space. In a landscape where the top social media platforms operate closed-source, centralized platforms, Mastodon offers free, open source software to allow anyone to start their own social networking platform, built around a decentralized architecture, and easily federated with others.
Aggregating the domain names used by 400 top Mastodon instances, this cohort started the year hovering around the #200 rank of most popular services overall. Its position in the overall rankings steadily improved throughout the year, hitting an inflection point in November, moving up about 60 positions. This trend appears to be driven by a spike in interest and usage of Mastodon, which we elaborate on in the Adoption section below.
Bot traffic
Bot traffic describes any non-human traffic to a website or an app. Some bots are useful, such as those that monitor site and application availability or search engine bots that index content for search, and Cloudflare maintains a list of verified bots known to perform such services. However, visibility into other non-verified bot activity is just as, if not more, important as they may be used to perform malicious activities, such as breaking into user accounts or scanning the web for exposed vulnerabilities to exploit. To calculate bot traffic percentages, we used the bot score assigned to each request to identify those made by bots, and then divided the total number of daily requests from these bots by the total number of daily requests. These calculations were done both globally and on a per-location basis. The line shown in the trends graph represents a seven-day trailing average. For the top 10 chart, we calculated the average bot percentage on a monthly basis per location, and then ranked the locations by percentage. The chart illustrates the ranking by month, and how those rankings change across the year.
Globally, bots generally accounted for between 30-35% of traffic over the course of the year. Starting January at around 35%, the percentage of bot traffic dropped by nearly a quarter through the end of February, but then reclaimed some of that loss, staying just above 30% through October. A slight downward trend is evident at the start of November, due to human traffic increasing while bot traffic remained fairly consistent. Despite a couple of nominal spikes/drops, the global trend exhibited fairly low volatility overall throughout the year.
While around one-third of global traffic was from bots, two locations stood out with bot traffic percentages double the global level. Except for two brief mid-year spikes, just under 70% of traffic from Ireland was classified as bot-driven. Similarly, in Singapore, bot traffic consistently ranged between 60-70% across the year. Bots account for the majority share of traffic from these locations due to the presence of local “regions” from multiple cloud platform providers in each. Because doing so is easily automated and free/inexpensive, attackers will frequently spin up ephemeral instances in these clouds in order to launch high volume attacks, such as we saw with the “Mantis” attack in June. (Internal traffic analysis indicates that a significant portion of traffic for these two geographies is from cloud provider networks and that the vast majority of traffic we see from these networks is classified as bot traffic.)
The top 10 list of locations with the highest percentage of bot traffic saw a fair amount of movement throughout the year, with four different locations holding the top slot at some point during the year, although Turkmenistan spent the most time at the top of the list. Overall, 17 locations held a spot among the top 10 at some point during 2022, with greater concentrations in Europe and Asia.
Internet outages
Although the metrics included in the 2022 Year In Review were ultimately driven by Internet traffic to Cloudflare from networks and locations around the world, there are, unfortunately, times when traffic is disrupted. These disruptions can have a number of potential causes, including natural disasters and extreme weather, fiber optic cable cuts, or power outages. However, they can also happen when authoritarian governments order Internet connectivity to be shutdown at a network, regional, or national level.
We saw examples of all of these types of Internet disruptions, and more, during 2022, and aggregated coverage of them in quarterly overview blog posts. With the launch of Radar 2.0 in September, we also began to catalog them on the Cloudflare Radar Outage Center. These disruptions are most often visible as drops in Cloudflare traffic from a given network, region, or country. The 2022 Year In Review website illustrates where these disruptions occurred throughout the year. Some notable outages observed during 2022 are highlighted below.
One of the most significant Internet disruptions of the year took place on AS812 (Rogers), one of Canada’s largest Internet service providers. During the morning of July 8, a near complete loss of traffic was observed, and it took nearly 24 hours for traffic volumes to return to normal levels. A Cloudflare blog post covered the Rogers outage in real-time as the provider attempted to restore connectivity. Data from APNIC estimates that as many as five million users were directly affected, while press coverage noted that the outage also impacted phone systems, retail point of sale systems, automatic teller machines, and online banking services. According to a notice posted by the Rogers CEO, the outage was attributed to “a network system failure following a maintenance update in our core network, which caused some of our routers to malfunction”.
Three of the major mobile network providers — AS44244 (Irancell), AS57218 (RighTel), and AS197207 (MCCI) — started implementing daily Internet “curfews” on September 21, generally taking place between 1600 and midnight local time (1230-2030 UTC), although the start times varied on several days. These regular shutdowns lasted into early October, with several more ad-hoc disruptions taking place through the middle of the month, as well as other more localized shutdowns of Internet connectivity. Over 75 million users were impacted by these shutdowns, based on subscriber figures for MCCI alone.
Cable cuts are also a frequent cause of Internet outages, with an old joke among network engineers that suggested that backhoes were the Internet’s natural enemy. While backhoes may be a threat to terrestrial fiber-optic cable, natural disasters can wreak havoc on submarine cables.
A prime example took Tonga offline earlier this year, when the Hunga Tonga–Hunga Ha’apai volcanic eruption damaged the submarine cable connecting Tonga to Fiji, resulting in a 38-day Internet outage. After the January 14 eruption, only minimal Internet traffic (via limited satellite services) was seen from Tonga. On February 22, Digicel announced that the main island was back online after initial submarine cable repairs were completed, but it was estimated that repairs to the domestic cable, connecting outlying islands, could take an additional six to nine months. We saw rapid growth in traffic from Tonga once the initial cable repairs were completed.
The war in Ukraine is now ten months old, and throughout the time it has been going on, multiple networks across the country have experienced outages. In March, we observed outages in Mariupol and other cities where fighting was taking place. In late May, an extended Internet disruption began in Kherson, coincident with AS47598 (Khersontelecom) starting to route traffic through Russian network provider AS201776 (MIranda), rather than a Ukrainian upstream. And in October, widespread power outages disrupted Internet connectivity in Kharkiv, Lviv, Kyiv, Poltova Oblast, and Zhytomyr. These outages and others were covered in more detail in the quarterly Internet disruption overview blog posts, as well as several other Ukraine-specific blog posts.
Adoption
Working with millions of websites and applications accessed by billions of people as well as providing an industry-leading DNS resolver service gives Cloudflare a unique perspective on the adoption of key technologies and platforms. SpaceX Starlink was frequently in the news this year, and we observed a 15x increase in traffic from the satellite Internet service provider. Social networking platform Mastodon was also in the news this year, and saw significant growth in interest as well.
IPv6 remains increasingly important as connected device growth over the last decade has exhausted available IPv4 address space, but global adoption remained around 35% across the year. And as the Internet-connected population continues to grow, many of those people are using mobile devices as their primary means of access. To that end, we also explore mobile device usage trends across the year.
Starlink adoption
Internet connectivity through satellites in geostationary orbit (GEO) has been around for a number of years, but services have historically been hampered by high latency and slower speeds. However, the launch of SpaceX Starlink’sLow Earth Orbit (LEO) satellite Internet service in 2019 and subsequent expansion of the satellite constellation has made high performance Internet connections available in many locations that were previously unserved or underserved by traditional wired or wireless broadband. To track the growth in usage and availability of Starlink’s service, we analyzed aggregate Cloudflare traffic volumes associated with the service’s autonomous system (AS14593) throughout 2022. Although Starlink is not yet available globally, we did see traffic growth across a number of locations. The request volume shown on the trend line in the chart represents a seven-day trailing average.
Damage from the war in Ukraine has disrupted traditional wired and wireless Internet connectivity since the invasion started in late February. Starlink made headlines that month after the company activated service within the country, and the necessary satellite Internet terminals became more widely available. Within days, Cloudflare began to see Starlink traffic, with volume growing consistently throughout the year.
Latent interest in the service was also apparent in a number of locations where traffic grew quickly after Starlink announced availability. One such example is Romania, which was included in Starlink’s May announcement of an expanded service footprint, and which saw rapid traffic growth after the announcement.
And in the United States, where Starlink has provided service since launch, traffic grew more than 10x through the end of November. Service enhancements announced during the year, like the ability to get Internet connectivity from moving vehicles, boats, and planes will likely drive additional traffic growth in the future.
Mastodon interest
Above, we showed that Mastodon hit an inflection point in its popularity during the last few months of 2022. To better understand how interest in Mastodon evolved during 2022, we analyzed aggregate 1.1.1.1 request volume data for the domain names associated with 400 top Mastodon instances, looking at aggregate request volume by location. The request volume shown on the trend line in the chart represents a seven-day trailing average.
Although interest in Mastodon clearly accelerated over the last few months of the year, this interest was unevenly distributed throughout the world as we saw little to no traffic across many locations. Graphs for those locations are not included within the Year In Review website. However, because Mastodon has been around since 2016, it built a base of early adopters over the last six years before being thrust into the spotlight in 2022.
Those early adopters are visible at a global level, as we see a steady volume of resolver traffic for the analyzed Mastodon instance domain names through the first nine months of the year, with the timing of the increase visible in late April aligning with the announcement that Elon Musk had reached a deal to acquire Twitter for $44 billion. The slope of the graph clearly shifted in October as it became increasingly clear that the acquisition would close shortly, with additional growth into November after the deal was completed. This growth is likely due to a combination of existing but dormant Mastodon accounts once again becoming active, and an influx of new users.
The traffic pattern observed for the United States appears fairly similar to the global pattern, with traffic from an existing set of users seeing massive growth starting in late October as well.
Although the core Mastodon software was developed by a programmer living in Germany, and the associated organization is incorporated as a German not-for-profit, it didn’t appear to have any significant home field advantage. Query volume for Germany was relatively low throughout most of the year, and only started to rapidly increase at the end of October, similar to behavior observed in a number of other countries.
On a global basis, IPv6 adoption hovered around the 35% mark throughout the year, with nominal growth evident in the trend line shown in the graph. While it is encouraging to see one of every three requests for dual stacked content being made over IPv6, this adoption rate demonstrates a clear opportunity for improvement.
To calculate IPv6 adoption for each location, we identified the set of customer zones that had IPv6 enabled (were “dual stacked”) during 2022, and then divided the daily request count for the zones over IPv6 by the daily sum of IPv4 and IPv6 requests for the zones, filtering out bot traffic in both cases. The line shown in the trends graph represents a seven-day trailing average. For the top 10 chart, we calculated the average IPv6 adoption level on a monthly basis per location, and then ranked the locations by percentage. The chart illustrates the ranking by month, and how those rankings change across the year.
One location that has seized that opportunity is India, which recorded the highest IPv6 adoption rate throughout the year. After seeing more than 70% adoption through July, it began to drop slightly in late summer, losing a couple of percentage points over the subsequent months.
One key driver behind India’s leadership in this area is IPv6 support from Jio, India’s largest mobile network operator, as well as being a provider of fiber-to-the-home broadband connectivity. They aggressively started their IPv6 journey in late 2015, and now much of Jio’s core network infrastructure is IPv6-only, while customer-facing mobile and fiber connections are dual-stacked.
Also heading in the right direction are the more than 60 locations around the world that saw IP adoption rates more than double this year. One of the largest increases was seen in the European country of Georgia, which grew more than 3,500% to close out the year at 10% adoption thanks to rapid growth across February and March at Magticom, a leading Georgian telecommunications provider.
Many of the other locations in this set also experienced large gains over a short period of time, likely due to a local network provider enabling subscriber support for IPv6. While significant gains seen in over a quarter of the total surveyed locations is certainly a positive sign, it must be noted that over 50 are under 10% adoption, with more than half of those remaining well under 1%, even after seeing adoption more than double. Internet service providers around the world continue to add or improve IPv6 support for their subscribers, but many have low to non-existent adoption rates, presenting significant opportunity to improve in the future.
As noted above, India had the highest level of IPv6 adoption through 2022. In looking at the remainder of the top 10 list, Saudi Arabia and Malaysia traded places several times during the year as the locations with the second and third-highest adoption rates, at just under 60% and around 55% respectively. The United States appeared towards the bottom of the top 10 list during the first quarter, but ranked lower for the remainder of the year. Belgium proved to be the most consistent, holding the fourth-place spot from March through November, with around 55% IPv6 adoption. Overall, a total of 14 locations appeared among the top 10 at some point during the year.
Mobile device usage
Each year, mobile devices become more and more powerful, and are increasingly being used as the primary onramp to the Internet in many places. In fact, in some parts of the world, so-called “desktop” devices (which includes laptop form factors) are the exception for Internet access, not the rule.
Analysis of the information included with each content request enables us to classify the type of device (mobile or desktop) used to make the request. To calculate the percentage of mobile device usage by location, we divided the number of requests made by mobile devices over the course of a week by the total number of requests seen that week, filtering out bot traffic in both cases. For the top 10 chart, we ranked the locations by the calculated percentage. The chart illustrates the ranking by month, and how those rankings change across the year.
In looking at the top 10 chart, we note that Iran and Sudan held the top two slots for much of the year, bookended by Yemen in January and Mauritania in November. Below the top two spots, however, significant volatility is clear throughout the year within the rest of the top 10. However, this movement was actually concentrated across a relatively small percentage range, with just five to ten percentage points separating the top and bottom ranked locations, depending on the week. The top ranked locations generally saw 80-85% of traffic from mobile devices, while the bottom ranked locations saw 75-80% of traffic from mobile devices.
This analysis reinforces the importance of mobile connectivity in Iran, and underscores why mobile network providers were targeted for Internet shutdowns in September and October, as discussed above. (And the shutdowns subsequently explain why Iran disappears from the top 10 list after September.)
Security
Improving Internet security is a key part of Cloudflare’s drive to help build a better Internet. One way we do that is by protecting customer websites, applications, and network infrastructure from malicious traffic and attacks. Because malicious actors regularly use a variety of techniques and approaches in launching their attacks, we have a number of products within our security solution portfolio that provide customers with flexibility around how they handle these attacks. Below, we explore insights derived from the attack mitigation we do on behalf of customers, including how we are mitigating attacks, what kinds of websites and applications attacks are targeting, and where these attacks appear to be coming from. In addition, with the acquisition of Area 1 earlier in 2022, we are presenting insight into where malicious email originates from. Analysis of this data highlights that there is very much no “one size fits all” security solution, as attackers use a wide variety of techniques, frequently shifting between them. As such, having a broad but flexible portfolio of security solutions at the ready is critical for CISOs and CIOs.
Mitigation sources
Depending on the approach taken by an attacker, and the type of content being targeted, one attack mitigation technique may be preferable over another. Cloudflare refers to these techniques as “mitigation sources”, and they include popular tools and techniques like Web Application Firewall (WAF) and DDoS Mitigation (DDoS), but also lesser known ones like IP Reputation (IPR), Access Rules (AR), Bot Management (BM), and API Shield (APIS). Examining the distribution of mitigation sources applied by location can help us better understand the types of attacks originating from those locations. To calculate the percentage of mitigated traffic associated with each mitigation source by location, we divided the total number of daily mitigated requests for each source by the total number of mitigated requests seen that day. Bot traffic is included in these calculations, given that many attacks originate from bots. A single request can be mitigated by multiple techniques, and here we consider the last technique that mitigated the request.
Across many locations, IP Reputation, Bot Management, and Access Rules accounted for small amounts of mitigated traffic throughout the year, with the volumes varying by country. However, in other locations, IP Reputation and Access Rules were responsible for larger amounts of mitigated traffic, possibly indicating those places had more of their traffic being blocked outright. A number of countries saw a rapid and significant increase in DDoS mitigated traffic during January to the 80-90% range, followed by a rapid drop to the 10-20% range. In that vein, DDoS Mitigation and WAF percentage shifts were frequently very spiky, with only occasional sustained periods of relatively consistent percentages.
Overall, DDoS Mitigation and WAF were the two most frequently used techniques to address attacks. The former’s share on a global basis was highest in mid-January, growing to nearly 80%, while the latter’s peak was during February, when it accounted for almost 60% of mitigated traffic. A spike in the usage of Access Rules is clearly visible in August, related to similar spikes observed for the United States, United Arab Emirates, and Malaysia.
Although Access Rules accounted for as much as 20% of mitigated traffic from the United States in August, it saw much lower usage throughout the balance of the year. DDoS Mitigation was the primary technique used to mitigate attack traffic coming from the United States, responsible for over 80% of such traffic during the first quarter, though it steadily declined through August. In a complimentary fashion, WAF drove only ~20% of mitigated traffic early in the year, but that volume steadily grew and had tripled through August. Interestingly, the growth in Access Rules usage followed rapid growth and then similarly rapid decline in WAF, possibly suggesting that more targeted rules were implemented to augment the managed rules applied by the Web Application Firewall against US-originated attacks.
Access Rules and IP Reputation were applied more frequently to mitigate attack traffic coming from Germany, with Bot Management also seeing increased usage in February, March, and June. However, except for periods in February and July, DDoS Mitigation drove the bulk of mitigated traffic, generally ranging between 60-80%. WAF mitigation was clearly most significant during February, with 70-80% of mitigated traffic, and July, at around 60%.
In mitigating attacks coming from Japan, it is interesting to see a couple of notable spikes in Bot Management. In March, it was briefly responsible for upwards of 40% of mitigated traffic, with another spike that was half as big in June. Access Rules also maintained a consistent presence in the graph, with around 5% of mitigated traffic through August, but slightly less in the following months. In dealing with Japanese attack traffic, WAF & DDoS Mitigation frequently traded positions as the largest source of mitigated traffic, although there was no clear pattern or apparent cycle. Both reached as much as 90% of mitigated traffic at times throughout the year – WAF in February and DDoS Mitigation in March. DDoS Mitigation’s periods of “dominance” tended to be more sustained, lasting for several weeks, but were punctuated by brief WAF spikes.
WAF rules
As noted above, Cloudflare’s WAF is frequently used to mitigate application layer attacks. There are hundreds of individually managed rules that can be applied by the WAF depending on the characteristics of the mitigated request, but these rules can be grouped into over a dozen types. Examining the distribution of WAF rules by location can help us better understand the techniques that attacks coming from that location are using. (For example, are attackers trying to inject SQL code into a form field, or exploit a published CVE?) To calculate the distribution of WAF mitigated traffic across the set of rule types for each location, we divided the number of requests mitigated by a particular type of WAF rule seen over the course of a week by the total number of WAF mitigated requests seen over that week. A single request can be mitigated by multiple rules and here we consider the last rule in a sequence that mitigated the request. The chart shows how the distribution of mitigated requests across the selected rule types changes over the course of the year. Bot traffic is included in these calculations.
At a worldwide level, during the first few months of the year, approximately half of HTTP requests blocked by our Managed WAF Rules contained HTTP anomalies, such as malformed method names, null byte characters in headers, non-standard ports, or content length of zero with a POST request. During that period, Directory Traversal and SQL Injection (SQLi) rules both accounted for just over 10% of mitigated requests as well. Attackers began to further vary their approach starting in May, as Cross Site Scripting (XSS) and File Inclusion both grew to over 10% of mitigations, while HTTP anomalies dropped to below 30%. Use of Software Specific rules grew above 10% in July, as attackers apparently ramped their efforts to exploit vendor-specific vulnerabilities. Broken Authentication and Command Injection rulesets also saw some growth in activity during the last several months, suggesting that attackers increased their efforts to find vulnerabilities in login/authentication systems or to execute commands on vulnerable systems in an attempt to gain access.
Although HTTP Anomaly was the most frequently applied rule when mitigations are aggregated at a global level, there were a number of locations where it held the top spot only briefly, if at all, as discussed below.
Attacks originating in Australia were WAF-mitigated using a number of rulesets, with the most applied ruleset changing frequently during the first half of the year. In contrast to the global overview, HTTP Anomaly was the top ruleset for only a single week in February, when it accounted for just over 30% of mitigations. Otherwise, attacks were most frequently mitigated with Software Specific, Directory Traversal, File Inclusion, and SQLi rules, generally accounting for 25-35% of mitigations. This pattern shifted starting in July, though, as Directory Traversal attacks became the most common, staying that way through the balance of the year. After peaking in June, SQLi attacks became significantly less common, rapidly falling and staying below 10% of mitigations.
WAF mitigations of attacks originating in Canada also demonstrated a pattern that differed from the global one. Although the HTTP Anomaly ruleset started the year accounting for approximately two thirds of mitigated requests, it was half that by the end of January, and saw significant volatility throughout the balance of the year. SQLi mitigations of Australian traffic effectively saw an opposite pattern, starting the year below 10% of mitigations but growing rapidly, accounting for 60% or more of mitigated traffic at multiple times throughout the year. Interestingly, SQLi attacks from Canada appeared to come in multi-week waves, becoming the most applied ruleset during those waves, and then receding for a brief period.
For attacks originating in Switzerland, the HTTP Anomaly ruleset was never the most frequently invoked, although it remained among the top five throughout the year. Instead, Directory Traversal and XSS rules were most frequently used, accounting for as much as 40% of mitigations. Directory Traversal most consistently held the top spot, though XSS attacks were the most prevalent during August. SQLi attacks saw peaks in April, July/August, and then again at the end of November. The Software Specific ruleset also breakout growth in September to as much as 20% of mitigated requests.
Target categories
Above, we discussed how traffic distribution across a set of categories provides insights into the types of content that users are most interested in. By performing similar analysis through a mitigation lens, we can gain insights into the types of websites and applications that are being most frequently targeted by attackers. To calculate the distribution of mitigated traffic across the set of categories for each location, we divided the number of mitigated requests for domains associated with a given category seen over the course of a week by the total number of requests mapped to that category during that week. The chart shows how the distribution of mitigated requests across each category changes over the course of the year. (As such, percentages will not sum to 100%). Bot traffic is included in these calculations. The percentage of traffic that was mitigated as an attack varied widely across industries and originating locations. In some places, a nominal percentage of traffic across all categories was mitigated, while in others, multiple categories experienced spikes in mitigated traffic at multiple times during 2022.
When aggregated at a global level, there was significant variance over the course of the year in the industry categories that attracted the most attacks as a fraction of their overall traffic. Through January and February, Technology sites had the largest percentage of mitigated requests, ranging between 20-30%. After that, a variety of categories moved in and out of the top slot, with none holding it for more than a few weeks. The biggest spike in attacks was targeted at Travel sites in mid-April, when more than half of the category’s traffic was mitigated. Coincident with the start of the 2022 World Cup in the last week of November, Gambling and Entertainment sites saw the largest percentages of mitigated traffic.
For attacks coming from the United Kingdom, Technology sites consistently saw around 20% of mitigated traffic through the year. During those times that it was not the most mitigated category, half a dozen other categories topped the list. Travel sites experienced two significant bursts of attacks, with nearly 60% of traffic mitigated in April, and nearly 50% in October. Other categories, including Government & Politics, Real Estate, Religion, and Education had the largest shares of mitigated traffic at various times throughout the year. UK-originated attacks on Entertainment sites jumped significantly in late November, with 40% of traffic mitigated at the end of the month.
Similar to the trends seen at the global level, Technology sites accounted for the largest percentage of mitigated attacks from the United States in January and February, clocking in between 30-40%. After that, attackers shifted their focus to target other industry categories. In mid-April, Travel sites had over 60% of requests mitigated as attacks. However, starting in May, Gambling sites most frequently had the highest percentage of traffic being mitigated, generally ranging between 20-40%, but spiking up to 70% in late October/early November.
In contrast, significantly smaller percentages of traffic across the surveyed categories from Japan was mitigated as attacks throughout 2022. Most categories saw mitigation shares of less than 10%, although there were a number of brief spikes observed at times. In late March, traffic to sites in the Government & Politics category briefly jumped to a nearly 80% mitigation share, while Travel sites spiked to nearly 70% of requests mitigated as attacks, similar to the behavior seen in other locations. In late June, Religion sites had a mitigation share of over 60%, and a couple of months later, Gambling sites experienced a rapid increase in mitigated traffic, reaching just over 40%. These attacks targeting Gambling sites then receded for a few months before starting to aggressively increase again in October.
Phishing email sources
Phishing emails are ultimately intended to trick users into providing attackers with login credentials for important websites and applications. At a consumer level, this could include an e-commerce site or banking application, while for businesses, this could include code repositories or employee information systems. For customers protected by Cloudflare Area 1 Email Security, we can identify the location that these phishing emails are being sent from. IP address geolocation is used to identify origination location, and the aggregate email counts apply to emails processed by Area 1 only. For the top 10 chart, we aggregated the number of phishing emails seen on a weekly basis per location, and then ranked the locations by phishing email volume. The chart illustrates the ranking by week, and how those rankings change across the year.
Reviewing the top 10 list, we find that the United States was the top source of phishing emails observed by Area 1 during 2022. It held the top spot for nearly the entire year, ceding it only once to Germany in November. The balance of the top 10 saw a significant amount of volatility over time, with a total of 23 locations holding a spot in the rankings for at least one month during the year. These locations were well-distributed geographically across the Americas, Europe, and Asia, highlighting that no one region of the world is a greater threat than others. Obviously, distrusting or rejecting all email originating from these locations is not a particularly practical response, but applying additional scrutiny can help keep your organization, and the Internet, safer.
Conclusion
Attempting to concisely summarize our “year in review” observations is challenging, especially as we only looked at trends in this blog post across a small fraction of the nearly 200 locations included in the website’s visualizations. Having said that, we will leave you with the following brief thoughts:
Attack traffic comes from everywhere, with constantly shifting targets, using widely varied techniques. Ensure that your security solutions provider offers a comprehensive portfolio of services to help keep your sites, applications, and infrastructure safe.
Internet service providers around the world need to improve support for IPv6 — it is no longer a “new” technology, and available IPv4 address space will become both increasingly scarce and increasingly expensive. Support for IPv6 needs to become the default going forward.
Internet shutdowns are being increasingly used by governments to limit communications within a country, as well as limiting communications with the rest of the world. As the United Nations stated in a May 2022 report, “Blanket shutdowns in particular inherently impose unacceptable consequences for human rights and should never be imposed.”
As we said in the introduction, we encourage you to visit the full Cloudflare Radar 2022 Year In Review website and explore the trends relevant to locations and industries of interest, and to consider how they impact your organization so that you are appropriately prepared for 2023.
It truly took a village to produce the Cloudflare Radar 2022 Year In Review, and we would be remiss if we didn’t acknowledge the contributions of colleagues that were instrumental in making this project possible. Thank you to: Sabina Zejnilovic, Carlos Azevedo, Jorge Pacheco (Data Science); Ricardo Baeta, Syeef Karim (Design); Nuno Pereira, Tiago Dias, Junior Dias de Oliveira (Front End Development); João Tomé (Most popular Internet services); and Davide Marques, Paula Tavares, Celso Martinho (Project/Engineering Management).
The Border Gateway Protocol (BGP) is the glue that keeps the entire Internet together. However, despite its vital function, BGP wasn’t originally designed to protect against malicious actors or routing mishaps. It has since been updated to account for this shortcoming with the Resource Public Key Infrastructure (RPKI) framework, but can we declare it to be safe yet?
If the question needs asking, you might suspect we can’t. There is a shortage of reliable data on how much of the Internet is protected from preventable routing problems. Today, we’re releasing a new method to measure exactly that: what percentage of Internet users are protected by their Internet Service Provider from these issues. We find that there is a long way to go before the Internet is protected from routing problems, though it varies dramatically by country.
Why RPKI is necessary to secure Internet routing
The Internet is a network of independently-managed networks, called Autonomous Systems (ASes). To achieve global reachability, ASes interconnect with each other and determine the feasible paths to a given destination IP address by exchanging routing information using BGP. BGP enables routers with only local network visibility to construct end-to-end paths based on the arbitrary preferences of each administrative entity that operates that equipment. Typically, Internet traffic between a user and a destination traverses multiple AS networks using paths constructed by BGP routers.
BGP, however, lacks built-in security mechanisms to protect the integrity of the exchanged routing information and to provide authentication and authorization of the advertised IP address space. Because of this, AS operators must implicitly trust that the routing information exchanged through BGP is accurate. As a result, the Internet is vulnerable to the injection of bogus routing information, which cannot be mitigated by security measures at the client or server level of the network.
An adversary with access to a BGP router can inject fraudulent routes into the routing system, which can be used to execute an array of attacks, including:
Denial-of-Service (DoS) through traffic blackholing or redirection,
Impersonation attacks to eavesdrop on communications,
Machine-in-the-Middle exploits to modify the exchanged data, and subvert reputation-based filtering systems.
Additionally, local misconfigurations and fat-finger errors can be propagated well beyond the source of the error and cause major disruption across the Internet.
Such an incident happened on June 24, 2019. Millions of users were unable to access Cloudflare address space when a regional ISP in Pennsylvania accidentally advertised routes to Cloudflare through their capacity-limited network. This was effectively the Internet equivalent of routing an entire freeway through a neighborhood street.
The most prominent proposals to secure BGP routing, standardized by the IETF focus on validating the origin of the advertised routes using Resource Public Key Infrastructure (RPKI) and verifying the integrity of the paths with BGPsec. Specifically, RPKI (defined in RFC 7115) relies on a Public Key Infrastructure to validate that an AS advertising a route to a destination (an IP address space) is the legitimate owner of those IP addresses.
RPKI has been defined for a long time but lacks adoption. It requires network operators to cryptographically sign their prefixes, and routing networks to perform an RPKI Route Origin Validation (ROV) on their routers. This is a two-step operation that requires coordination and participation from many actors to be effective.
The two phases of RPKI adoption: signing origins and validating origins
RPKI has two phases of deployment: first, an AS that wants to protect its own IP prefixes can cryptographically sign Route Origin Authorization (ROA) records thereby attesting to be the legitimate origin of that signed IP space. Second, an AS can avoid selecting invalid routes by performing Route Origin Validation (ROV, defined in RFC 6483).
With ROV, a BGP route received by a neighbor is validated against the available RPKI records. A route that is valid or missing from RPKI is selected, while a route with RPKI records found to be invalid is typically rejected, thus preventing the use and propagation of hijacked and misconfigured routes.
One issue with RPKI is the fact that implementing ROA is meaningful only if other ASes implement ROV, and vice versa. Therefore, securing BGP routing requires a united effort and a lack of broader adoption disincentivizes ASes from commiting the resources to validate their own routes. Conversely, increasing RPKI adoption can lead to network effects and accelerate RPKI deployment. Projects like MANRS and Cloudflare’s isbgpsafeyet.com are promoting good Internet citizenship among network operators, and make the benefits of RPKI deployment known to the Internet. You can check whether your own ISP is being a good Internet citizen by testing it on isbgpsafeyet.com.
Measuring the extent to which both ROA (signing of addresses by the network that controls them) and ROV (filtering of invalid routes by ISPs) have been implemented is important to evaluating the impact of these initiatives, developing situational awareness, and predicting the impact of future misconfigurations or attacks.
Measuring ROAs is straightforward since ROA data is readily available from RPKI repositories. Querying RPKI repositories for publicly routed IP prefixes (e.g. prefixes visible in the RouteViews and RIPE RIS routing tables) allows us to estimate the percentage of addresses covered by ROA objects. Currently, there are 393,344 IPv4 and 86,306 IPv6 ROAs in the global RPKI system, covering about 40% of the globally routed prefix-AS origin pairs1.
Measuring ROV, however, is significantly more challenging given it is configured inside the BGP routers of each AS, not accessible by anyone other than each router’s administrator.
Measuring ROV deployment
Although we do not have direct access to the configuration of everyone’s BGP routers, it is possible to infer the use of ROV by comparing the reachability of RPKI-valid and RPKI-invalid prefixes from measurement points within an AS2.
Consider the following toy topology as an example, where an RPKI-invalid origin is advertised through AS0 to AS1 and AS2. If AS1 filters and rejects RPKI-invalid routes, a user behind AS1 would not be able to connect to that origin. By contrast, if AS2 does not reject RPKI invalids, a user behind AS2 would be able to connect to that origin.
While occasionally a user may be unable to access an origin due to transient network issues, if multiple users act as vantage points for a measurement system, we would be able to collect a large number of data points to infer which ASes deploy ROV.
If, in the figure above, AS0 filters invalid RPKI routes, then vantage points in both AS1 and AS2 would be unable to connect to the RPKI-invalid origin, making it hard to distinguish if ROV is deployed at the ASes of our vantage points or in an AS along the path. One way to mitigate this limitation is to announce the RPKI-invalid origin from multiple locations from an anycast network taking advantage of its direct interconnections to the measurement vantage points as shown in the figure below. As a result, an AS that does not itself deploy ROV is less likely to observe the benefits of upstream ASes using ROV, and we would be able to accurately infer ROV deployment per AS3.
Note that it’s also important that the IP address of the RPKI-invalid origin should not be covered by a less specific prefix for which there is a valid or unknown RPKI route, otherwise even if an AS filters invalid RPKI routes its users would still be able to find a route to that IP.
The measurement technique described here is the one implemented by Cloudflare’s isbgpsafeyet.com website, allowing end users to assess whether or not their ISPs have deployed BGP ROV.
The isbgpsafeyet.com website itself doesn’t submit any data back to Cloudflare, but recently we started measuring whether end users’ browsers can successfully connect to invalid RPKI origins when ROV is present. We use the same mechanism as is used for global performance data4. In particular, every measurement session (an individual end user at some point in time) attempts a request to both valid.rpki.cloudflare.com, which should always succeed as it’s RPKI-valid, and invalid.rpki.cloudflare.com, which is RPKI-invalid and should fail when the user’s ISP uses ROV.
This allows us to have continuous and up-to-date measurements from hundreds of thousands of browsers on a daily basis, and develop a greater understanding of the state of ROV deployment.
The state of global ROV deployment
The figure below shows the raw number of ROV probe requests per hour during October 2022 to valid.rpki.cloudflare.com and invalid.rpki.cloudflare.com. In total, we observed 69.7 million successful probes from 41,531 ASNs.
Based on APNIC’s estimates on the number of end users per ASN, our weighted5 analysis covers 96.5% of the world’s Internet population. As expected, the number of requests follow a diurnal pattern which reflects established user behavior in daily and weekly Internet activity6.
We can also see that the number of successful requests to valid.rpki.cloudflare.com (gray line) closely follows the number of sessions that issued at least one request (blue line), which works as a smoke test for the correctness of our measurements.
As we don’t store the IP addresses that contribute measurements, we don’t have any way to count individual clients and large spikes in the data may introduce unwanted bias. We account for that by capturing those instants and excluding them.
Overall, we estimate thatout of the four billion Internet users, only 261 million (6.5%) are protected by BGP Route Origin Validation, but the true state of global ROV deployment is more subtle than this.
The following map shows the fraction of dropped RPKI-invalid requests from ASes with over 200 probes over the month of October. It depicts how far along each country is in adopting ROV but doesn’t necessarily represent the fraction of protected users in each country, as we will discover.
Sweden and Bolivia appear to be the countries with the highest level of adoption (over 80%), while only a few other countries have crossed the 50% mark (e.g. Finland, Denmark, Chad, Greece, the United States).
ROV adoption may be driven by a few ASes hosting large user populations, or by many ASes hosting small user populations. To understand such disparities, the map below plots the contrast between overall adoption in a country (as in the previous map) and median adoption over the individual ASes within that country. Countries with stronger reds have relatively few ASes deploying ROV with high impact, while countries with stronger blues have more ASes deploying ROV but with lower impact per AS.
In the Netherlands, Denmark, Switzerland, or the United States, adoption appears mostly driven by their larger ASes, while in Greece or Yemen it’s the smaller ones that are adopting ROV.
The following histogram summarizes the worldwide level of adoption for the 6,765 ASes covered by the previous two maps.
Most ASes either don’t validate at all, or have close to 100% adoption, which is what we’d intuitively expect. However, it’s interesting to observe that there are small numbers of ASes all across the scale. ASes that exhibit partial RPKI-invalid drop rate compared to total requests may either implement ROV partially (on some, but not all, of their BGP routers), or appear as dropping RPKI invalids due to ROV deployment by other ASes in their upstream path.
To estimate the number of users protected by ROV we only considered ASes with an observed adoption above 95%, as an AS with an incomplete deployment still leaves its users vulnerable to route leaks from its BGP peers.
If we take the previous histogram and summarize by the number of users behind each AS, the green bar on the right corresponds to the 261 million users currently protected by ROV according to the above criteria (686 ASes).
Looking back at the country adoption map one would perhaps expect the number of protected users to be larger. But worldwide ROV deployment is still mostly partial, lacking larger ASes, or both. This becomes even more clear when compared with the next map, plotting just the fraction of fully protected users.
To wrap up our analysis, we look at two world economies chosen for their contrasting, almost symmetrical, stages of deployment: the United States and the European Union.
112 million Internet users are protected by 111 ASes from the United States with comprehensive ROV deployments. Conversely, more than twice as many ASes from countries making up the European Union have fully deployed ROV, but end up covering only half as many users. This can be reasonably explained by end user ASes being more likely to operate within a single country rather than span multiple countries.
Conclusion
Probe requests were performed from end user browsers and very few measurements were collected from transit providers (which have few end users, if any). Also, paths between end user ASes and Cloudflare are often very short (a nice outcome of our extensive peering) and don’t traverse upper-tier networks that they would otherwise use to reach the rest of the Internet.
In other words, the methodology used focuses on ROV adoption by end user networks (e.g. ISPs) and isn’t meant to reflect the eventual effect of indirect validation from (perhaps validating) upper-tier transit networks. While indirect validation may limit the “blast radius” of (malicious or accidental) route leaks, it still leaves non-validating ASes vulnerable to leaks coming from their peers.
As with indirect validation, an AS remains vulnerable until its ROV deployment reaches a sufficient level of completion. We chose to only consider AS deployments above 95% as truly comprehensive, and Cloudflare Radar will soon begin using this threshold to track ROV adoption worldwide, as part of our mission to help build a better Internet.
When considering only comprehensive ROV deployments, some countries such as Denmark, Greece, Switzerland, Sweden, or Australia, already show an effective coverage above 50% of their respective Internet populations, with others like the Netherlands or the United States slightly above 40%, mostly driven by few large ASes rather than many smaller ones.
Worldwide we observe a very low effective coverage of just 6.5% over the measured ASes, corresponding to 261 million end users currently safe from (malicious and accidental) route leaks, which means there’s still a long way to go before we can declare BGP to be safe.
…… 1https://rpki.cloudflare.com/ 2Gilad, Yossi, Avichai Cohen, Amir Herzberg, Michael Schapira, and Haya Shulman. "Are we there yet? On RPKI’s deployment and security." Cryptology ePrint Archive (2016). 3Geoff Huston. “Measuring ROAs and ROV”. https://blog.apnic.net/2021/03/24/measuring-roas-and-rov/ 4Measurements are issued stochastically when users encounter 1xxx error pages from default (non-customer) configurations. 5Probe requests are weighted by AS size as calculated from Cloudflare’s worldwide HTTP traffic. 6Quan, Lin, John Heidemann, and Yuri Pradkin. "When the Internet sleeps: Correlating diurnal networks with external factors." In Proceedings of the 2014 Conference on Internet Measurement Conference, pp. 87-100. 2014.
Internet shutdowns have long been a tool in government toolboxes when it comes to silencing opposition and cutting off access from the outside world. The KeepItOn campaign by Access Now, a group that defends the digital rights of global Internet users, documented at least 182 Internet shutdowns in 34 countries in 2021. Many of these shutdowns occurred during public protests, elections, and wars as an extreme form of censorship in places like Afghanistan, Democratic Republic of the Congo, Ukraine, India, and Iran.
There are a range of ways governments block or slow communications, including throttling, IP blocking, DNS interference, mobile data shutoffs, and deep packet inspection, all with similar goals: exerting control over information.
Although Internet shutdowns are largely public, it is difficult to document and track the ways in which governments implement them. The shutdowns not only impact people’s ability to participate in civil and political life and the economy but also have grave consequences for trust in democratic institutions.
We have reported on these shutdowns in the past, and for Cloudflare Impact Week, we want to tell you more about how we work with civil society organizations to provide tools to track and document the scope of these disruptions. We want to support their critical work and provide the tools they need so they can demand accountability and condemn the use of shutdowns to silence dissent.
Radar Internet shutdown alerts for civil society
We launched Radar in 2020 to shine light on the Internet’s patterns, insights, threats, and trends based on aggregated data from our network. Once we launched Radar, we found that many civil society organizations and those who work in democracy-building use Radar to track trends in countries to better understand the rise and fall of Internet usage.
Internally, we had an alert system for potential Internet disruptions that we use as an early warning regarding shifts in network patterns and incidents. When we engaged with these organizations that use Radar to track Internet trends, we learned more about how our internal tool to identify traffic distributions could be useful for organizations that work with human rights defenders on the ground that are impacted by these shutdowns.
To determine the best way to provide a tool to alert organizations when Cloudflare has seen these disruptions, we spoke with organizations such as Access Now, Internews, The Carter Center, National Democratic Institute, Internet Society, and the International Foundation for Electoral Systems. After our conversations, we launched Radar Internet shutdown alerts in 2021 to provide alerts on when Cloudflare has detected significant drops in traffic with the hope that the information is used to document, track, and hold institutions accountable for these human rights violations.
Since 2021, we have been providing these alerts to civil society partners to track these shutdowns. As we have collected feedback to improve the alerts, we have seen many partners looking for more ways to integrate Radar and the alerts into their existing tracking mechanisms. With this, we announced Radar 2.0 with API access for free so academics, data sleuths, civil society, human rights organizations, and other web enthusiasts can analyze, visualize, and investigate Internet usage across the globe, based on data from our global network. In addition, we launched Cloudflare Radar Outage Center to archive Internet outages and make it easier for civil society organizations, journalists/news media, and impacted parties to track past shutdowns.
Highlighting the work of our civil society partners to track Internet shutdowns
We believe our job at Cloudflare is to build tools that improve privacy and security for a range of players on the Internet. With this, we want to highlight the work of our civil society partners. These organizations are pushing back against targeted shutdowns that inflict lasting damage to democracies around the world. Here are their stories.
Access Now’s #KeepItOn coalition was launched in 2016 to help unite and organize the efforts of activists and organizations across the world to end Internet shutdowns. It now represents more than 280 organizations from 105 countries across the globe. The goal of STOP Project (Shutdown Tracker Optimization Project) is ultimately to document and report shutdowns accurately, which requires diligent verification. Access Now regularly uses multiple sources to identify and understand the shutdown, the choice and combination of which depends on where and how the shutdown occurred.
The tracker uses both quantitative and qualitative data to record the number of Internet shutdowns in the world in a given year and to characterize the nature of the shutdowns, including their magnitude, scope, and causes.
Zach Rosson, #KeepItOn Data Analyst, Access Now, details, “Sometimes, we confirm an Internet shutdown through means such as technical measurement, while at other times we rely upon contextual information, such as news reports or personal accounts. We also work hard to document how a particular shutdown was ordered and how it impacted society, including why and how it happened.”
On how Access Now’s #KeepItOn coalition uses Cloudflare Radar, Rosson says, “We use Radar Internet shutdown alerts in both email and tweet form, as a trusted source to help verify a shutdown occurrence. These alerts and their underlying measurements are used as primary sources in our dataset when compiling shutdowns for our annual report, so they are used in an archival sense as well. Cloudflare Radar is sometimes the first place that we hear about a shutdown, which is quite useful in a rapid response context, since we can quickly mobilize to verify the shutdown and have strong evidence when advocating against it.”
The recorded instances of shutdowns include events reported through local or international news sources that are included in the dataset, from local actors through Access Now’s Digital Security Helpline or the #KeepItOn Coalition email list, or directly from telecommunication and Internet companies.
Rosson notes, “When it comes to Radar 2.0 and API, we plan to use these resources to speed up our response, verification, and publication of shutdown data as compiled from different sources. Thus, the Cloudflare Radar Outage Center (CROC) and related API endpoint will be very useful for us to access timely information on shutdowns, either through visual inspection of the CROC in the short term or through using the API to pull data into a centralized database in the long term.”
On the Internet Society Pulse platform, Susannah Gray, Director, Communications, Internet Society, explains that they strive to curate meaningful information around a government-mandated Internet shutdown by using data from multiple trusted sources, and making it available to everyone, everywhere in an easy-to-understand manner. ISOC does this by monitoring Internet traffic using various tools, including Radar. When they see something that might indicate that an Internet shutdown is in progress, they check if the shutdown meets their criteria. For a shutdown to appear on the Pulse Shutdowns Tracker it needs to meet all the following requirements. It must:
Be artificially induced, as evident from reputable sources, including government statements and orders.
ISOC uses many resources to track shutdowns. Gray explains, “Radar Internet shutdown alerts are incredibly useful for bringing incidents to our attention as they are happening. The easy access to the data provided helps us assess the nature of an outage. If an outage is established as a government-mandated shutdown, we often use screenshots of Radar charts on the Pulse shutdowns tracker incident page to help illustrate how traffic stopped flowing in and out of a country during the shutdown. We provide a link back to the Radar platform so that people interested in getting more in-depth data can find out more.”
ISOC’s aim has never been to be the first to report a government-mandated shutdown: instead, their mission is to report accurate and meaningful information about the shutdown and explore its impact on the economy and society.
Gray adds, “For Radar 2.0 and the API, we plan to use it as part of the data aggregation tool we are developing. This internal tool will combine several outage alert and monitoring tools and sources into one single system so that we are able to track incidents more efficiently.”
OONI is a nonprofit that measures Internet censorship, including the blocking of websites, instant messaging apps, and circumvention tools. Cloudflare Radar is one of the main public data sources that they use when examining reported Internet connectivity shutdowns. For example, OONI relied on Radar data when reporting on shutdowns in Iran amid ongoing protests. In 2022, the team launched the Measurement Aggregation Toolkit (MAT), which enables the public to track censorship worldwide and create their own charts based on real-time OONI data. OONI also forms partnerships with multiple digital rights organizations that use OONI tools and data to monitor and respond to censorship events in their regions.
Maria Xynou, OONI Research and Partnerships Director, explains “Cloudflare Radar is one of the main public data sources that OONI has referred to when examining reported internet connectivity shutdowns. Specifically, OONI refers to Cloudflare Radar to check whether the platform provides signals of a reported internet connectivity shutdown; compare Cloudflare Radar signals with those visible in other, relevant public data sources (such as IODA, and Google traffic data).”
Tracking the shutdowns of tomorrow
As we work with more organizations in the human rights space and learn how our global network can be used for good, we are eager to improve and create new tools to protect human rights in the digital age.
“The more you practice the art of thankfulness, the more you have to be thankful for.”
— Norman Vincent Peale, American author
The turkey. The sweet potatoes. The stuffing. The pumpkin pie. Yesterday, November 24, 2022, was Thanksgiving Day in the US. A time for families and loved ones to be together and thankful, according to the tradition. Last year, we saw how the US paused shopping (and browsing) for Thanksgiving. So, how was it this year? Not only did we see Internet traffic go down (by 13%) during Thanksgiving dinner, but it was much higher than usual the day before and the day after (the Black Friday effect… so far). There was also a clear, but short, Thanksgiving day effect on e-commerce DNS trends.
We’ll have to wait to see what Black Friday looks like.
Let’s start with Internet traffic at the time of Thanksgiving dinner. Although every family is different, a 2018 survey of US consumers showed that for 42% early afternoon (between 13:00 and 15:00 is the preferred time to sit at the table and start to dig in). But 16:00 seems to be the “correct time” — The Atlantic explains why.
That said, Cloudflare Radar shows that between 21:00 and 01:00 UTC (we use that as the standard timezone in Radar) there was a clear drop in Internet traffic, mostly between 21:00 and 22:00 UTC, when traffic dropped 13%, compared with the week before. That time period is “translated” for the East Coast to between 16:00 and 20:00 EST and for the West Coast the time between 13:00 to 17:00 PST. Similar to what we saw last year.
Radar also allows anyone to focus on the last 24 hours and check the traffic volume change compared with the previous period. The more granular view in the next graph shows not only the 13% drop during Thanksgiving dinner, but also the clear increase after. At around 01:00 EST (22:00 PST), traffic was 15% higher than the day before, and today, November 25, Black Friday morning (08:00 EST, 05:00 PST), was growing ~16% more in traffic at 09:00 EST (06:00 PST).
It’s a similar perspective when we look at the last seven days, a filter that also shows the night before Thanksgiving in the US, traffic was 15% higher than the week before at around 01:00-03:00 EST (22:00-00:00 PST). And there’s a general increase in traffic this week, probably related to the fact it is also “Black Friday Week” (more on e-commerce trends at the end).
In terms of Internet traffic growth (made by humans, not bots) in November, there’s a clear increase throughout the month, but mostly this week. The next chart aggregates traffic by day. So far, Tuesday, November 22, 2022, was the day of the month with most traffic in the US — +13% than what we saw on Tuesday, November 1.
It’s also clear in the previous graph that weekends in the US have less traffic, especially Saturdays, but that Thanksgiving Day was the one with less traffic of the past two weeks — 10% less traffic than the same day the week before.
We’ve been focused on human Internet traffic. Bots, on the other hand, are not that interested in the Thanksgiving and Black Friday, and there was actually more bot traffic in the US last week than in this one. So far.
To wrap up this Internet traffic section, let’s look at mobile device trends. In the last four weeks, we saw an average of 48% of Internet traffic in the US coming from mobile devices. But on Thanksgiving Day that average was 55%. That was actually the day in November when people in the US were most online using their mobile devices.
Here’s the view that shows the mobile percentage difference from the past two weeks, with an up to 9% increase (compared with the previous week) in mobile devices’ predominance in Internet traffic, between 10:00 and 16:00 EST (07:00-13:00 PST).
E-commerce interest: growing (but with a Thanksgiving dip)
Now, let’s look at DNS query trends (from our globally used 1.1.1.1 DNS resolver) to e-commerce websites in the US. First, the Thanksgiving Day effect.
Aggregating several e-commerce domains, we can see not only that there are several spikes in the last two weeks, but that during Thanksgiving, there was a clear dip in DNS traffic between 15:00 and 17:00 EST (12:00-14:00 PST). How much? At 17:00 EST, Thanksgiving Day, there was 13% less DNS traffic than in the previous week.
Using a smoothed seven day rolling average to those e-commerce domains (only in the US), the growth trend for the past 30 days is even more clear in the past two weeks (after a clear dip in early November). From November 13 to November 22, the rolling average grew ~5%.
Last year, Cyber Monday was the biggest day for online shopping, in terms of DNS queries that we saw. Next week, we’ll see how it was this year.
Japan: A different kind of Thanksgiving
Also this week, Japan had its Labor Thanksgiving, an annual public holiday that was celebrated on Wednesday, November 23, 2022. And there was also a clear impact, but because, in Japan, this is a day full of events held throughout the country, there was an increase in traffic during the day. How much?
The peak was at around 01:00 UTC (10:00 in local time), when Internet traffic was 60% higher than in the previous week (and it continued to remain high during Labor Thanksgiving Day).
You can check Cloudflare Radar, but also our Twitter account where we continue to see country patterns related to the FIFA World Cup in Qatar (Internet traffic does shift, depending on the country, when national teams are playing), but also e-commerce DNS trends.
Today we’re introducing Cloudflare Radar’s route leak data and API so that anyone can get information about route leaks across the Internet. We’ve built a comprehensive system that takes in data from public sources and Cloudflare’s view of the Internet drawn from our massive global network. The system is now feeding route leak data on Cloudflare Radar’s ASN pages and via the API.
This blog post is in two parts. There’s a discussion of BGP and route leaks followed by details of our route leak detection system and how it feeds Cloudflare Radar.
About BGP and route leaks
Inter-domain routing, i.e., exchanging reachability information among networks, is critical to the wellness and performance of the Internet. The Border Gateway Protocol (BGP) is the de facto routing protocol that exchanges routing information among organizations and networks. At its core, BGP assumes the information being exchanged is genuine and trust-worthy, which unfortunately is no longer a valid assumption on the current Internet. In many cases, networks can make mistakes or intentionally lie about the reachability information and propagate that to the rest of the Internet. Such incidents can cause significant disruptions of the normal operations of the Internet. One type of such disruptive incident is route leaks.
We consider route leaks as the propagation of routing announcements beyond their intended scope (RFC7908). Route leaks can cause significant disruption affecting millions of Internet users, as we have seen in many past notable incidents. For example, in June 2016 a misconfiguration in a small network in Pennsylvania, US (AS396531 – Allegheny Technologies Inc) accidentally leaked a Cloudflare prefix to Verizon, which proceeded to propagate the misconfigured route to the rest of its peers and customers. As a result, the traffic of a large portion of the Internet was squeezed through the limited-capacity links of a small network. The resulting congestion caused most of Cloudflare traffic to and from the affected IP range to be dropped.
A similar incident in November 2018 caused widespread unavailability of Google services when a Nigerian ISP (AS37282 – Mainone) accidentally leaked a large number of Google IP prefixes to its peers and providers violating the valley-free principle.
These incidents illustrate not only that route leaks can be very impactful, but also the snowball effects that misconfigurations in small regional networks can have on the global Internet.
Despite the criticality of detecting and rectifying route leaks promptly, they are often detected only when users start reporting the noticeable effects of the leaks. The challenge with detecting and preventing route leaks stems from the fact that AS business relationships and BGP routing policies are generally undisclosed, and the affected network is often remote to the root of the route leak.
In the past few years, solutions have been proposed to prevent the propagation of leaked routes. Such proposals include RFC9234 and ASPA, which extends the BGP to annotate sessions with the relationship type between the two connected AS networks to enable the detention and prevention of route leaks.
An alternative proposal to implement similar signaling of BGP roles is through the use of BGP Communities; a transitive attribute used to encode metadata in BGP announcements. While these directions are promising in the long term, they are still in very preliminary stages and are not expected to be adopted at scale soon.
At Cloudflare, we have developed a system to detect route leak events automatically and send notifications to multiple channels for visibility. As we continue our efforts to bring more relevant data to the public, we are happy to announce that we are starting an open data API for our route leak detection results today and integrate results to Cloudflare Radar pages.
Route leak definition and types
Before we jump into how we design our systems, we will first do a quick primer on what a route leak is, and why it is important to detect it.
> A route leak is the propagation of routing announcement(s) beyond their intended scope.
The intended scope is often concretely defined as inter-domain routing policies based on business relationships between Autonomous Systems (ASes). These business relationships are broadly classified into four categories: customers, transit providers, peers and siblings, although more complex arrangements are possible.
In a customer-provider relationship the customer AS has an agreement with another network to transit its traffic to the global routing table. In a peer-to-peer relationship two ASes agree to free bilateral traffic exchange, but only between their own IPs and the IPs of their customers. Finally, ASes that belong under the same administrative entity are considered siblings, and their traffic exchange is often unrestricted. The image below illustrates how the three main relationship types translate to export policies.
By categorizing the types of AS-level relationships and their implications on the propagation of BGP routes, we can define multiple phases of a prefix origination announcements during propagation:
upward: all path segments during this phase are customer to provider
peering: one peer-peer path segment
downward: all path segments during this phase are provider to customer
An AS path that follows valley-free routing principle will have upward, peering, downward phases, all optional but have to be in that order. Here is an example of an AS path that conforms with valley-free routing.
> A multihomed AS learns a route from one upstream ISP and simply propagates it to another upstream ISP (the turn essentially resembling a hairpin). Neither the prefix nor the AS path in the update is altered.
An AS path that contains a provider-customer and customer-provider segment is considered a type 1 leak. The following example: AS4 → AS5 → AS6 forms a type 1 leak.
Type 1 is the most recognized type of route leaks and is very impactful. In many cases, a customer route is preferable to a peer or a provider route. In this example, AS6 will likely prefer sending traffic via AS5 instead of its other peer or provider routes, causing AS5 to unintentionally become a transit provider. This can significantly affect the performance of the traffic related to the leaked prefix or cause outages if the leaking AS is not provisioned to handle a large influx of traffic.
In June 2015, Telekom Malaysia (AS4788), a regional ISP, leaked over 170,000 routes learned from its providers and peers to its other provider Level3 (AS3549, now Lumin). Level3 accepted the routes and further propagated them to its downstream networks, which in turn caused significant network issues globally.
Type 2: Lateral ISP-ISP-ISP Leak
Type 2 leak is defined as propagating routes obtained from one peer to another peer, creating two or more consecutive peer-to-peer path segments.
Here is an example: AS3 → AS4 → AS5 forms a type 2 leak.
However, in the real world, it is not unusual to see multiple small peering networks exchanging routes and passing on to each other. Legit business reasons exist for having this type of network path. We are less concerned about this type of route leak as compared to type 1.
Type 3 and 4: Provider routes to peer; peer routes to provider
These two types involve propagating routes from a provider or a peer not to a customer, but to another peer or provider. Here are the illustrations of the two types of leaks:
As in the previously mentioned example, a Nigerian ISP who peers with Google accidentally leaked its route to its provider AS4809, and thus generated a type 4 route leak. Because routes via customers are usually preferred to others, the large provider (AS4809) rerouted its traffic to Google via its customer, i.e. the leaking ASN, overwhelmed the small ISP and took down Google for over one hour.
Route leak summary
So far, we have looked at the four types of route leaks defined in RFC7908. The common thread of the four types of route leaks is that they’re all defined using AS-relationships, i.e., peers, customers, and providers. We summarize the types of leaks by categorizing the AS path propagation based on where the routes are learned from and propagate to. The results are shown in the following table.
Routes from / propagates to
To provider
To peer
To customer
From provider
Type 1
Type 3
Normal
From peer
Type 4
Type 2
Normal
From customer
Normal
Normal
Normal
We can summarize the whole table into one single rule: routes obtained from a non-customer AS can only be propagated to customers.
Note: Type 5 and type 6 route leaks are defined as prefix re-origination and announcing of private prefixes. Type 5 is more closely related to prefix hijackings, which we plan to expand our system to as the next steps, while type 6 leaks are outside the scope of this work. Interested readers can refer to sections 3.5 and 3.6 of RFC7908 for more information.
The Cloudflare Radar route leak system
Now that we know what a route leak is, let’s talk about how we designed our route leak detection system.
From a very high level, we compartmentalize our system into three different components:
Raw data collection module: responsible for gathering BGP data from multiple sources and providing BGP message stream to downstream consumers.
Leak detection module: responsible for determining whether a given AS-level path is a route leak, estimate the confidence level of the assessment, aggregating and providing all external evidence needed for further analysis of the event.
Storage and notification module: responsible for providing access to detected route leak events and sending out notifications to relevant parties. This could also include building a dashboard for easy access and search of the historical events and providing the user interface for high-level analysis of the event.
Data collection module
There are three types of data input we take into consideration:
Historical: BGP archive files for some time range in the past
a. RouteViews and RIPE RIS BGP archives
Semi-real-time: BGP archive files as soon as they become available, with a 10-30 minute delay.
a. RouteViews and RIPE RIS archives with data broker that checks new files periodically (e.g. BGPKIT Broker)
Real-time: true real-time data sources
a. RIPE RIS Live
b. Cloudflare internal BGP sources
For the current version, we use the semi-real-time data source for the detection system, i.e., the BGP updates files from RouteViews and RIPE RIS. For data completeness, we process data from all public collectors from these two projects (a total of 63 collectors and over 2,400 collector peers) and implement a pipeline that’s capable of handling the BGP data processing as the data files become available.
For data files indexing and processing, we deployed an on-premises BGPKIT Broker instance with Kafka feature enabled for message passing, and a custom concurrent MRT data processing pipeline based on BGPKIT Parser Rust SDK. The data collection module processes MRT files and converts results into a BGP messages stream at over two billion BGP messages per day (roughly 30,000 messages per second).
Route leak detection
The route leak detection module works at the level of individual BGP announcements. The detection component investigates one BGP message at a time, and estimates how likely a given BGP message is a result of a route leak event.
We base our detection algorithm mainly on the valley-free model, which we believe can capture most of the notable route leak incidents. As mentioned previously, the key to having low false positives for detecting route leaks with the valley-free model is to have accurate AS-level relationships. While those relationship types are not publicized by every AS, there have been over two decades of research on the inference of the relationship types using publicly observed BGP data.
While state-of-the-art relationship inference algorithms have been shown to be highly accurate, even a small margin of errors can still incur inaccuracies in the detection of route leaks. To alleviate such artifacts, we synthesize multiple data sources for inferring AS-level relationships, including CAIDA/UCSD’s AS relationship data and our in-house built AS relationship dataset. Building on top of the two AS-level relationships, we create a much more granular dataset at the per-prefix and per-peer levels. The improved dataset allows us to answer the question like what is the relationship between AS1 and AS2 with respect to prefix P observed by collector peer X. This eliminates much of the ambiguity for cases where networks have multiple different relationships based on prefixes and geo-locations, and thus helps us reduce the number of false positives in the system. Besides the AS-relationships datasets, we also apply the AS Hegemony dataset from IHR IIJ to further reduce false positives.
Route leak storage and presentation
After processing each BGP message, we store the generated route leak entries in a database for long-term storage and exploration. We also aggregate individual route leak BGP announcements and group relevant leaks from the same leak ASN within a short period together into route-leak events. The route leak events will then be available for consumption by different downstream applications like web UIs, an API, or alerts.
Route leaks on Cloudflare Radar
At Cloudflare, we aim to help build a better Internet, and that includes sharing our efforts on monitoring and securing Internet routing. Today, we are releasing our route leak detection system as public beta.
Starting today, users going to the Cloudflare Radar ASN pages will now find the list of route leaks that affect that AS. We consider that an AS is being affected when the leaker AS is one hop away from it in any direction, before or after.
The Cloudflare Radar ASN page is directly accessible via https://radar.cloudflare.com/as{ASN}. For example, one can navigate to https://radar.cloudflare.com/as174 to view the overview page for Cogent AS174. ASN pages now show a dedicated card for route leaks detected relevant to the current ASN within the selected time range.
There is a lot more we are planning to do with route-leak detection. More features like a global view page, route leak notifications, more advanced APIs, custom automations scripts, and historical archive datasets will begin to ship on Cloudflare Radar over time. Your feedback and suggestions are also very important for us to continue improving on our detection results and serve better data to the public.
Furthermore, we will continue to expand our work on other important topics of Internet routing security, including global BGP hijack detection (not limited to our customer networks), RPKI validation monitoring, open-sourcing tools and architecture designs, and centralized routing security web gateway. Our goal is to provide the best data and tools for routing security to the communities so that we can build a better and more secure Internet together.
In the meantime, we opened a Radar room on our Developers Discord Server. Feel free to join and talk to us; the team is eager to receive feedback and answer questions.
Visit Cloudflare Radar for more Internet insights. You can also follow us on Twitter for more Radar updates.
Radar 2.0 was built on the learnings of Radar 1.0 and was launched last month during Cloudflare’s Birthday Week as a complete product revamp. We wanted to make it easier for our users to find insights and navigate our data, and overall provide a better and faster user experience.
We’re building a Supercloud. Cloudflare’s products now include hundreds of features in networking, security, access controls, computing, storage, and more.
This blog will explain how we built the new Radar from an engineering perspective. We wanted to do this to demonstrate that anyone could build a somewhat complex website that involves demanding requirements and multiple architectural layers, do it on top of our stack, and how easy it can be.
Hopefully, this will inspire other developers to switch from traditional software architectures and build their applications using modern, more efficient technologies.
High level architecture
The following diagram is a birds-eye view of the Radar 2.0 architecture. As you can see, it’s divided into three main layers:
The Core layer is where we keep our data lake, data exploration tools, and backend API.
The Cloudflare network layer is where we host and run Radar and serve the public APIs.
The Client layer is essentially everything else that runs in your browser. We call it the Radar Web app.
As you can see, there are Cloudflare products everywhere. They provide the foundational resources to host and securely run our code at scale, but also other building blocks necessary to run the application end to end.
By having these features readily available and tightly integrated into our ecosystem and tools, at the distance of a click and a few lines of code, engineering teams don’t have to reinvent the wheel constantly and can use their time on what is essential: their app logic.
Let’s dig in.
Cloudflare Pages
Radar 2.0 is deployed using Cloudflare Pages, our developer-focused website hosting platform. In the early days, you could only host static assets on Pages, which was helpful for many use cases, including integrating with static site generators like Hugo, Jekyll, or Gatsby. Still, it wouldn’t solve situations where your application needs some sort of server-side computing or advanced logic using a single deployment.
Luckily Pages recently added support to run custom Workers scripts. With Functions, you can now run server-side code and enable any kind of dynamic functionality you’d typically implement using a separate Worker.
Cloudflare Pages Functions also allow you to use Durable Objects, KV, R2, or D1, just like a regular Worker would. We provide excellent documentation on how to do this and more in our Developer Documentation. Furthermore, the team wrote a blog on how to build a full-stack application that describes all the steps in detail.
Radar 2.0 needs server-side functions for two reasons:
To render Radar and run the server side of Remix.
To implement and serve our frontend API.
Remix and Server-side Rendering
We use Remix with Cloudflare Pages on Radar 2.0.
Remix follows a server/client model and works under the premise that you can’t control the user’s network, so web apps must reduce the amount of Javascript, CSS, and JSON they send through the wire. To do this, they move some of the logic to the server.
In this case, the client browser will get pre-rendered DOM components and the result of pre-fetched API calls with just the right amount of JSON, Javascript, and CSS code, rightfully adjusted to the UI needs. Here’s the technical explanation with more detail.
Typically, Remix would need a Node.js server to do all of this, but guess what: It can also run on Cloudflare Workers and Pages.
Here’s the code to get the Remix server running on Workers, using Cloudflare Pages:
import { createPagesFunctionHandler } from "@remix-run/cloudflare-pages";
import * as build from "@remix-run/dev/server-build";

const handleRequest = createPagesFunctionHandler({
  build: {
    ...build,
    publicPath: "/build/",
    assetsBuildDirectory: "public/build",
  },
  mode: process.env.NODE_ENV,
  getLoadContext: (context) => ({
    ...context.env,
    CF: (context.request as any).cf as IncomingRequestCfProperties | undefined,
  }),
});

const handler: ExportedHandler<Env> = {
  fetch: async (req, env, ctx) => {
    const r = new Request(req);
    return handleRequest({
      env,
      params: {},
      request: r,
      waitUntil: ctx.waitUntil,
      next: () => {
        throw new Error("next() called in Worker");
      },
      functionPath: "",
      data: undefined,
    });
  },
};
In Remix, routes handle changes when a user interacts with the app and changes it (clicking on a menu option, for example). A Remix route can have a loader, an action and a default export. The loader handles API calls for fetching data (GET method). The action handles submissions to the server (POST, PUT, PATCH, DELETE methods) and returns the response. The default export handles the UI code in React that’s returned for that route. A route without a default export returns only data.
Because Remix runs both on the server and the client, it can get smart and know what can be pre-fetched and computed server-side and what must go through the network connection, optimizing everything for performance and responsiveness.
Here’s an example of a Radar route, simplified for readability, for the Outage Center page.
Another project porting their app to Remix is Cloudflare TV. This is how their metrics looked before and after the changes.
Radar’s Desktop Lighthouse score is now nearly 100% on Performance, Accessibility, Best Practices, and SEO.
Another Cloudflare product that we use extensively on Radar 2.0 is Speed. In particular, we want to mention the Early Hints feature. Early Hints is a new web standard that defines a new HTTP 103 header the server can use to inform the browser which assets will likely be needed to render the web page while it’s still being requested, resulting in dramatic load times improvements.
Radar has two APIs. The backend which has direct access to our data sources, and the frontend, which is available on the Internet.
Backend API
The backend API was written using Python, Pandas and FastAPI and is protected by Cloudflare Access, JWT tokens and an authenticated origin pull (AOP) configuration. Using Python allows anyone on the team, engineers or data scientists, to collaborate easily and contribute to improving and expanding the API, which is great. Our data science team uses JupyterHub and Jupyter Notebooks as part of their data exploration workflows, which makes prototyping and reusing code, algorithms and models particularly easy and fast.
It then talks to the upstream frontend API via a Strawberry based GraphQL server. Using GraphQL makes it easy to create complex queries, giving internal users and analysts the flexibility they need when building reports from our vast collection of data.
Frontend API
We built Radar’s frontend API on top of Cloudflare Workers. This worker has two main functions:
It fetches data from the backend API using GraphQL, and then transforms it.
It provides a public REST API that anyone can use, including Radar.
Using a worker in front of our core API allows us to easily add and separate microservices, and also adds notable features like:
Cloudflare’s Cache API allows finer control over what to cache and for how long and supports POST requests and customizable cache control headers, which we use.
Stale responses using R2. When the backend API cannot serve a request for some reason, and there’s a stale response cached, it’ll be served directly from R2, giving end users a better experience.
CSV and JSON output formats. The CSV format is convenient and makes it easier for data scientists, analysts, and others to use the API and consume our API data directly from other tools.
Open sourcing our OpenAPI 3 schema generator and validator
One last feature on the frontend API is OpenAPI 3 support. We automatically generate an OpenAPI schema and validate user input with it. This is done through a custom library that we built on top of itty-router, which we also use. Today we’re open sourcing this work.
itty-router-openapi provides an easy and compact OpenAPI 3 schema generator and validator for Cloudflare Workers. Check our GitHub repository for more information and details on how to use it.
Developer’s Documentation
Today we’re also launching our developer’s documentation pages for the Radar API where you can find more information about our data license, basic concepts, how to get started and the available API methods. Cloudflare Radar’s API is free, allowing academics, data sleuths and other web enthusiasts to investigate Internet usage across the globe, based on data from our global network.
To facilitate using our API, we also put together a Colab Notebook template that you can play with, copy and expand to your use case.
The Radar App
The Radar App is the code that runs in your browser. We’ve talked about Remix, but what else do we use?
Radar relies on a lot of data visualizations. Things like charts and maps are essential to us. We decided to build our reusable library of visualization components on top of two other frameworks: visx, a “collection of expressive, low-level visualization primitives for React,” D3, a powerful JavaScript library for manipulating the DOM based on data, and MapLibre, an open-source map visualization stack.
Here’s one of our visualization components in action. We call it the “PewPew map”.
And here’s the Remix React code for it, whenever we need to use it in a page:
Another change we made to Radar was switching our images and graphical assets to Scalable Vector Graphics. SVGs are great because they’re essentially a declarative graphics language. They’re XML text files with vectorial information. And so, they can be easily manipulated, transformed, stored, or indexed, and of course, they can be rendered at any size, producing beautiful, crisp results on any device and resolution.
SVGs are also extremely small and efficient in size compared to bitmap formats and support internationalization, making them easier to translate to other languages (localization), thus providing better accessibility.
Here’s an example of a Radar Bubble Chart, inspected, where you can see the SVG code and the <text/> strings embedded.
Cosmos
React Cosmos is a “sandbox for developing and testing UI components in isolation.” We wanted to use Cosmos with Radar 2.0 because it’s the perfect project for it:
It has a lot of visual components; some are complex and have many configuration options and features.
The components are highly reusable across multiple pages in different contexts with different data.
We have a multidisciplinary team; everyone can send a pull request and add or change code in the frontend.
Cosmos acts as a component library where you can see our palette of ready-to-use visualizations and widgets, from simple buttons to complex charts, and you play with their options in real-time and see what happens. Anyone can do it, not only designers or engineers but also other project stakeholders. This effectively improves team communications and makes contributing and iterating quickly.
Here’s a screenshot of our Cosmos in action:
Continuous integration and development
Continuous integration is important for any team doing modern software. Cloudflare Pages provides multiple options to work with CI tools using direct uploads, out of the box. The team has put up documentation and examples on how to do that with GitHub Actions, CircleCI, and Travis, but you can use others.
In our case, we use BitBucket and TeamCity internally to build and deploy our releases. Our workflow automatically builds, tests, and deploys Radar 2.0 within minutes on an approved PR and follow-up merge.
Furthermore, we have multiple environments to stage and test our releases before they go live to production. Our CI/CD setup makes it easy to switch from one environment to the other or quickly roll back any undesired deployment.
Radar 1.0 wasn’t particularly fast doing CI/CD, we confess. We had a few episodes when a quick fix could take some good 30 minutes from committing the code to deployment, and we felt frustrated about it.
So we invested a lot in ensuring that the new CI would be fast, efficient, and furious.
One cool thing we ended up doing was fast preview links on any commit pushed to the code repository. Using a combination of intelligent caching during builds and doing asynchronous tests when the commit is outside the normal release branches, we were able to shorten the deployment time to seconds.
This is the notification we get in our chat when anyone pushes code to any branch:
Anyone can follow a thread for a specific branch in the chat and get notified on new changes when they happen.
Blazing-fast builds, preview links and notifications are game-changers. An engineer can go from an idea or a quick fix to showing the result on a link to a product manager or another team member. Anyone can quickly click the link to see the changes on a fully working end-to-end version of Radar.
Accessibility and localization
Cloudflare is committed to web accessibility. Recently we announced how we upgraded Cloudflare’s Dashboard to adhere to industry accessibility standards, but this premise is valid for all our properties. The same is true for localization. In 2020, we internationalized our Dashboard and added support for new languages and locales.
Accessibility and localization go hand in hand and are both important, but they are also different. The Web Content Accessibility Guidelines define many best practices around accessibility, including using color and contrast, tags, SVGs, shortcuts, gestures, and many others. The A11Y project page is an excellent resource for learning more.
Localization, though, also known as L10n, is more of a technical requirement when you start a new project. It’s about making sure you choose the right set of libraries and frameworks that will make it easier to add new translations without engineering dependencies or code rewrites.
We wanted Radar to perform well on both fronts. Our design system takes Cloudflare’s design and brand guidelines seriously and adds as many A11Y good practices as possible, and the app is fully aware of localization strings across its pages and UI components.
Adding a new language is as easy as translating a single JSON file. Here’s a snippet of the en-US.json file with the default American English strings:
{
  "abbr.asn": "Autonomous System Number",
  "actions.chart.download.csv": "Download chart data in CSV",
  "actions.chart.download.png": "Download chart in PNG Format",
  "actions.chart.download.svg": "Download chart in SVG Format",
  "actions.chart.download": "Download chart",
  "actions.chart.maximize": "Maximize chart",
  "actions.chart.minimize": "Minimize chart",
  "actions.chart.share": "Share chart",
  "actions.download.csv": "Download CSV",
  "actions.download.png": "Download PNG",
  "actions.download.svg": "Download SVG",
  "actions.share": "Share",
  "alert.beta.link": "Radar Classic",
  "alert.beta.message": "Radar 2.0 is currently in Beta. You can still use {link} during the transition period.",
  "card.about.cloudflare.p1": "Cloudflare, Inc. ({website} / {twitter}) is on a mission to help build a better Internet. Cloudflare's suite of products protects and accelerates any Internet application online without adding hardware, installing software, or changing a line of code. Internet properties powered by Cloudflare have all web traffic routed through its intelligent global network, which gets smarter with every request. As a result, they see significant improvement in performance and a decrease in spam and other attacks. Cloudflare was named to Entrepreneur Magazine's Top Company Cultures 2018 list and ranked among the World's Most Innovative Companies by Fast Company in 2019.",
  "card.about.cloudflare.p2": "Headquartered in San Francisco, CA, Cloudflare has offices in Austin, TX, Champaign, IL, New York, NY, San Jose, CA, Seattle, WA, Washington, D.C., Toronto, Dubai, Lisbon, London, Munich, Paris, Beijing, Singapore, Sydney, and Tokyo.",
  "card.about.cloudflare.title": "About Cloudflare",
...
You can expect us to release Radar in other languages soon.
Radar Reports and Jupyter notebooks
Radar Reports are documents that use data exploration and storytelling to analyze a particular theme in-depth. Some reports tend to get updates from time to time. Examples of Radar Reports are our quarterly DDoS Attack Trends, or the IPv6 adoption.
The source of these Reports is Jupyter Notebooks. Our Data Science team works on some use-case or themes with other stakeholders using our internal Jupyter Hub tool. After all the iteration and exploration are done, and the work is signed off, a notebook is produced.
A Jupyter Notebook is a JSON document containing text, source code, rich media such as images or charts, and other metadata. It is the de facto standard for presenting data science projects, and every data scientist uses it.
With Radar 1.0, converting a Jupyter Notebook to a Radar page was a lengthy and manual process implicating many engineering and design resources and causing much frustration to everyone involved. Even updating an already-published notebook would frequently cause trouble for us.
Radar 2.0 changed all of this. We now have a fully automated process that takes a Jupyter Notebook and, as long as it’s designed using a list of simple rules and internal guidelines, converts it automatically, hosts the resulting HTML and assets in an R2 bucket, and publishes it on the Reports page.
The conversion to HTML takes into account our design system and UI components, and the result is a beautiful document, usually long-form, perfectly matching Radar’s look and feel.
We will eventually open-source this tool so that anyone can use it.
More Cloudflare, less to worry about
We gave examples of using Cloudflare’s products and features to build your next-gen app without worrying too much about things that aren’t core to your business or logic. A few are missing, though.
Once the app is up and running, you must protect it from bad traffic and malicious actors. Cloudflare offers you DDoS, WAF, and Bot Management protection out of the box at a click’s distance.
For example, here are some of our security rules. This is traffic we don’t have to worry about in our app because Cloudflare detects it and acts on it according to our rules.
Another thing we don’t need to worry about is redirects from the old site to the new one. Cloudflare has a feature called Bulk Redirects, where you can easily create redirect lists directly on the dashboard.
It’s also important to mention that every time we talk about what you can do using our Dashboard, we’re, in fact, also saying you can do precisely the same using Cloudflare’s APIs. Our Dashboard is built entirely on top of them. And if you’re the infrastructure as code kind of person, we have you covered, too; you can use the Cloudflare Terraform provider.
Deploying and managing Workers, R2 buckets, or Pages sites is obviously scriptable too. Wrangler is the command-line tool to do this and more, and it goes the extra mile to allow you to run your full app locally, emulating our stack, on your computer, before deploying.
Final words
We hope you enjoyed this Radar team write-up and were inspired to build your next app on top of our Supercloud. We will continue improving and innovating on Radar 2.0 with new features, share our findings and open-sourcing our tools with you.
In the meantime, we opened a Radar room on our Developers Discord Server. Feel free to join it and ask us questions; the team is eager to receive feedback and discuss web technology with you.
You can also follow us on Twitter for more Radar updates.
Through Cloudflare’s Impact programs, we provide cyber security products to help protect access to authoritative voting information and the security of sensitive voter data. Two core programs in this space are the Athenian Project, dedicated to protecting state and local governments that run elections, and Cloudflare for Campaigns, a project with a suite of Cloudflare products to secure political campaigns’ and state parties’ websites and internal teams.
However, the weeks ahead of the elections, and Election Day itself, were not entirely devoid of attacks. Using data from Cloudflare Radar, which showcases global Internet traffic, attack, and technology trends and insights, we can explore traffic patterns, attack types, and top attack sources associated with both Athenian Project and Cloudflare for Campaigns participants.
For both programs, overall traffic volume unsurprisingly ramped up as Election Day approached. SQL Injection (SQLi) and HTTP Anomaly attacks were the two largest categories of attacks mitigated by Cloudflare’s Web Application Firewall (WAF), and the United States was the largest source of observed attacks — see more on this last point below.
Below, we explore the trends seen across both customer sets from October 1, 2022, through Election Day on November 8.
Athenian Project
Throughout October, daily peak traffic volumes effectively doubled over the course of the month, with a weekday/weekend pattern also clearly visible. However, significant traffic growth is visible on Monday, November 7, and Tuesday, November 8 (Election Day), with Monday’s peak just under 2x October’s peaks, while Tuesday saw two peaks, one just under 4x higher than October peaks, while the other was just over 4x higher. Zooming in, the first peak was at 1300 UTC (0800 Eastern time, 0500 Pacific time), while the second was at 0400 UTC (2300 Eastern time, 2000 Pacific time). The first one appears to be aligned with the polls opening on the East Coast, while the second appears to be aligned with the time that the polls closed on the West Coast.
However, aggregating the traffic here presents a somewhat misleading picture. While both spikes were due to increased traffic across multiple customer sites, the second one was exacerbated by a massive increase in traffic for a single customer. Regardless, the increased traffic clearly shows that voters turned to local government sites around Election Day.
Despite this increase in overall traffic, attack traffic mitigated by Cloudflare’s Web Application Firewall (WAF) remained remarkably consistent throughout October and into November, as seen in the graph below. The obvious exception was an attack that occurred on Monday, October 10. This attack targeted a single Athenian Project participant, and was mitigated by rate limiting the requests.
SQL injection (SQLi) attacks saw significant growth in volume in the week and a half ahead of Election Day, along with an earlier significant spike on October 24. While the last weekend in October (October 29 and 30) saw significant SQLi attack activity, the weekend of November 5 and 6 was comparatively quiet. However, those attacks ramped up again heading into and on Election Day, as seen in the graph below.
Attempted attacks mitigated with the HTTP Anomaly ruleset also ramped up in the week ahead of Election Day, though to a much lesser extent than SQLi attacks. As the graph below shows, the biggest spikes were seen on October 31/November 1, and just after midnight UTC on November 4 (late afternoon to early evening in the US). Related request volume also grew heading into Election Day, but without significant short-duration spikes. There is also a brief but significant attack clearly visible on the graph on October 10. However, it occurred several hours after the rate limited attack referenced above — it is not clear if the two are related.
The distribution of attacks over the surveyed period from October 1 through November 9 shows that those categorized as SQLi and HTTP Anomaly were responsible for just over two-thirds of WAF-mitigated requests. Nearly 14% were categorized as “Software Specific,” which includes attacks related to specific CVEs. The balance of the attacks were mitigated by WAF rules in categories including File Inclusion, XSS (Cross Site Scripting), Directory Traversal, and Command Injection.
Media reports suggest that foreign adversaries actively try to interfere with elections in the United States. While this may be the case, analysis of the mitigated attacks targeting Athenian Project customers found that over 95% of the mitigated requests (attacks) came from IP addresses that geolocate to the United States. However, that does not mean that the attackers themselves are necessarily located in the country, but rather that they appear to be using compromised systems and proxies within the United States to launch their attacks against these sites protected by Cloudflare.
Cloudflare for Campaigns
In contrast to Athenian Project participants, traffic to candidate sites that are participants in Cloudflare for Campaigns began to grow several weeks ahead of Election Day. The graph below shows a noticeable increase (~50%) in peak traffic volumes starting on October 12, with an additional growth (50-100%) starting a week later. Traffic to these sites appeared to quiet a bit toward the end of October, but saw significant growth again heading into, and during, Election Day.
However, once again, this aggregate traffic data presents something of a misleading picture, as one candidate site saw multiple times more traffic than the other participating sites. While those other sites saw similar shifts in traffic as well, they were dwarfed by those experienced by the outlier site.
The WAF-mitigated traffic trend for campaign sites followed a similar pattern to the overall traffic. As the graph below shows, attack traffic also began to increase around October 19, with a further ramp near the end of the month. The October 27 spike visible in the graph was due to an attack targeting a single customer’s site, and was addressed using “Security Level” mitigation techniques, which uses IP reputation information to decide if and how to present challenges for incoming requests.
The top two rule categories, HTTP Anomaly and SQLi, together accounted for nearly three-quarters of the mitigated requests, and Directory Traversal attacks were just under 10% of mitigated requests for this customer set. The HTTP Anomaly and Directory Traversal percentages were higher than those for attacks targeting Athenian Project participants, while the SQLi percentage was slightly lower.
Once again, a majority of the WAF-mitigated attacks came from IP addresses in the United States. However, among Cloudflare for Campaigns participants, the United States only accounted for 55% of attacks, significantly lower than the 95% seen for Athenian Project participants. The balance is spread across a long tail of countries, with allies including Germany, Canada, and the United Kingdom among the top five. As noted above, however, the attackers may be elsewhere, and are using botnets or other compromised systems in these countries to launch attacks.
Improving security with data
We are proud to be trusted by local governments, campaigns, state parties, and voting rights organizations to protect their websites and provide uninterrupted access to information and trusted election results. Sharing information about the threats facing these websites helps us further support their valuable work by enabling them, and other participants in the election space, to take proactive steps to improve site security.
Brasil, sei lá Ou o meu coração se engana Ou uma terra igual não há — From Tom Jobim’s song, Brasil Nativo
Brazil’s recent presidential election got significant attention from both global and national media outlets, not only because of the size of the country, but also because of premature allegations of electoral fraud. The first round of the Brazilian 2022 general election was held on October 2, and the runoff was held on Sunday, October 30. With 124 million votes counted, former president Lula da Silva (2003-2010) won with 50.9% of the votes, beating incumbent Jair Bolsonaro, who had 49.1% of the votes.
The final results of the elections as published by the official Tribunal Super Eleitoral, with more than 124 million votes counted.)
Using Cloudflare’s data, we can explore the impact that this election had on Internet traffic patterns in Brazil, as well as interest in content from election-related websites, news organizations, social media platforms, and video platforms.
Here are a few highlights: while the runoff generated much more interest to election related websites (we actually have a view to DNS queries, a proxy to websites), the first round showed bigger increases in traffic to news organizations.
For the candidate’s domains, Lula’s win had the higher impact.
Also: official results came earlier on the runoff than the first round, and spikes in traffic were higher earlier that day (October 30).
(Note: we’re using local times — that means UTC-3, that is related to the more populated regions of Brazil — in this blog, although some charts have x-axis UTC).
Let’s start by looking at general Internet traffic in Brazil.
On election days, traffic goes down (during the day)
Using Cloudflare Radar, we can see something that has also been observed in other countries that hold Sunday elections: when most people are getting outside to vote, Internet traffic goes down (in comparison with previous Sundays). We saw this in the two rounds of the Presidential elections in France back in April 2022, in Portugal’s legislative elections in January 2022 and now, in Brazil.
We can also compare Sundays in October. There were five weekends. The two that had elections show the same pattern of lower traffic during the day, as seen in the previous chart. Comparing the two election days, there was a bigger drop in traffic on October 30 (down 21% at around 18:00 local time), than on October 2 (down 10% at around 20:00). Related or not, there was a bigger turnout on the runoff (124 million votes) than on the first round (123 million). Here’s the view on October 30:
And here’s October 2:
A more clear view in comparing the October weekends, and where you can see how the October 2 and 30 Sundays have the same pattern and different from the others three of the month, is this one (bear in mind that the x-axis is showing UTC time, it’s -3 hours in Brazil):
If we look at the main network providers (ASNs) in Brazil, the trend is the same. Claro (AS28573) also shows the drop in traffic on October 30, as does Telefonica (AS27699):
Here’s Telefonica:
We observed a similar impact from the October 30 runoff election to traffic from different states in Brazil, including São Paulo, Rio de Janeiro, Rio Grande do Norte, Minas Gerais, and Bahia.
Mobile device usage greater on weekends (and on election days)
When we look at the share of Brazil’s Internet traffic from mobile devices during October, we find that the highest percentages were on October 2 (first round of the elections, 66.3%), October 9 (66.4%) and October 30 (runoff election, 65%). We’ve seen this in other elections, an increase in mobile device traffice, so this seems to follow the same trend.
This chart also shows how mobile device usage in Brazil is at its highest on the weekends (all the main spikes for percentage of mobile devices are over the weekend, and more on Sundays).
Now, let’s look at anonymized and aggregated DNS traffic data from our 1.1.1.1 resolver. This data provides a proxy for traffic to, and thus interest in, different categories of sites from users in Brazil around the election.
Election-related sites: higher interest in the runoff
Brazil has government websites related to elections, but also its own Tribunal Superior Eleitoral (Electoral Superior Court) that includes a website and app with live updates on the results of the elections for everyone to check. Looking at those related domains and using mean hourly traffic in September as a baseline, we can see that the October 2 first round spiked to 16x more DNS queries at 20:00 local time. However, DNS query traffic during the runoff election peaked at 18:00 local time on October 30 with 17.4x more DNS traffic as compared to the September baseline.
We can look more closely at each one of those two election days. On October 2, traffic had its first significant increase at around 17:00 local time, reaching 15x more requests to election-related domains as compared to the September baseline. This initial peak occurred at the same time the polling stations were closing. However, the peak that day, at 16x above baseline, was reached at 20:00 local time, as seen in the figure below.
On Sunday, October 30, 2022, the pattern is similar, although the peak was reached earlier, given that results started to arrive earlier than on the first round. The peak was reached at around 18:00 local time, with request traffic 17.4x above baseline.
As seen in the figure below, Lula first led in the official results at 18:45 local time, with votes from 67% of the polling stations counted at that time. Around 20:00 Lula was considered the winner (the peak seen in the previous chart was at that time).
Candidate websites: in the end, winner takes all?
For Lula-related domains, there are clear spikes around the first round of elections on October 2. A 13x spike was observed on October 1 at around 21:00 local time. Two notable spikes were observed on October 2 — one at 16.7x above baseline at 09:00 local time, and the other at 10.7x above baseline at 21:00 local time. During the October 30 runoff election, only one clear spike was observed. The spike, at 16.7x above baseline, occurred at around 20:00, coincident with the time Lula was being announced as the winner.
For Bolsonaro-related domains, we observed a different pattern. Increased traffic as compared to the baseline is visible in the days leading up to the first round election, reaching 10x on September 30. On October 2, a 8x spike above baseline was seen at 18:00 local time. However, the two most significant spikes seen over the course of the month were observed on October 16, at 20x above baseline, a few hours after the first Lula-Bolsonaro television debate, and on October 25, at around 20:00, at 22x above baseline. That was the last week of campaigning before the October 30 runoff and when several polling predictions were announced. The second and last Bolsonaro-Lula debate was on October 28, and there’s a spike at 22:00 to Lula’s websites, and a smaller but also clear one at 21:00 to Bolsonaro’s websites).
News websites: more interest in the first round
With official election results being available more rapidly, DNS traffic for Brazilian news organization websites peaked much earlier in the evening than what we saw in France, for example, where more definitive election results arrived much later on election day. But another interesting trend here is how the first round, on October 2, had 9.1x more DNS traffic (compared with the September baseline), than what we saw during the runoff on October 30 (6.1x).
The way the results arrived faster also had an impact on the time of the peak, occurring at around 19:00 local time on October 30, as compared to around 20:00 on October 2.
At 19:45 local time on October 30, Lula was already the winner with more than 98% of the votes counted. After 20:00 there was a clear drop in DNS traffic to news organizations.
On October 2, it was only around 22:00 that it became official that there would be a runoff between Lula and Bolsonaro. Peak request volume was reached at 20:00 (9x), but traffic remained high (8x) at around 21:00 and until 22:00, like the following chart shows:
Conclusion: Real world events impact the Internet
Cloudflare Radar, our tool for Internet insights, can provide a unique perspective on how major global or national events impact the Internet. It is interesting to not only see that a real world event can impact Internet traffic (and different types of websites) for a whole country, but also see how much that impact is represented at specific times. It’s all about human behavior at relevant moments in time, like elections as a collective event is.
Cloudflare operates in more than 275 cities in over 100 countries, where we interconnect with over 10,000 network providers in order to provide a broad range of services to millions of customers. The breadth of both our network and our customer base provides us with a unique perspective on Internet resilience, enabling us to observe the impact of Internet disruptions. In many cases, these disruptions can be attributed to a physical event, while in other cases, they are due to an intentional government-directed shutdown. In this post, we review selected Internet disruptions observed by Cloudflare during the third quarter of 2022, supported by traffic graphs from Cloudflare Radar and other internal Cloudflare tools, and grouped by associated cause or common geography. The new Cloudflare Radar Outage Center provides additional information on these, and other historical, disruptions.
Government directed shutdowns
Unfortunately, for the last decade, governments around the world have turned to shutting down the Internet as a means of controlling or limiting communication among citizens and with the outside world. In the third quarter, this was an all too popular cause of observed disruptions, impacting countries and regions in Africa, the Middle East, Asia, and the Caribbean.
Iraq
As mentioned in our Q2 summary blog post, on June 27, the Kurdistan Regional Government in Iraq began to implement twice-weekly (Mondays and Thursday) multi-hour regional Internet shutdowns over the following four weeks, intended to prevent cheating on high school final exams. As seen in the figure below, these shutdowns occurred as expected each Monday and Thursday through July 21, with the exception of July 21. They impacted three governorates in Iraq, and lasted from 0630–1030 local time (0330–0730 UTC) each day.
In Cuba, an Internet disruption was observed between 0055-0150 local time (0455-0550 UTC) on July 15 amid reported anti-government protests in Los Palacios and Pinar del Rio.
Closing out the quarter, another significant disruption was observed in Cuba, reportedly in response to protests over the lack of electricity in the wake of Hurricane Ian. A complete outage is visible in the figure below between 2030 on September 29 and 0315 on September 30 local time (0030-0715 UTC on September 30).
Afghanistan
Telecommunications services were reportedly shut down in part of Kabul, Afghanistan on the morning of August 8. The figure below shows traffic dropping starting around 0930 local time (0500 UTC), recovering 11 hours later, around 2030 local time (1600 UTC).
Protests in Freetown, Sierra Leone over the rising cost of living likely drove the Internet disruptions observed within the country on August 10 & 11. The first one occurred between 1200-1400 local time (1200-1400 UTC) on August 10. While this outage is believed to have been government directed as a means of quelling the protests, Zoodlabs, which manages Sierra Leone Cable Limited, claimed that the outage was the result of “emergency technical maintenance on some of our international routes”.
A second longer outage was observed between 0100-0730 local time (0100-0730 UTC) on August 11, as seen in the figure below. These shutdowns follow similar behavior in years past, where Internet connectivity was shut off following elections within the country.
In Somaliland, local authorities reportedly cut off Internet service on August 11 ahead of scheduled opposition demonstrations. The figure below shows a complete Internet outage in Woqooyi Galbeed between 0645-1355 local time (0345-1055 UTC.)
At a network level, the observed outage was due to a loss of traffic from AS37425 (SomCable) and AS37563 (Somtel), as shown in the figures below. Somtel is a mobile services provider, while SomCable is focused on providing wireline Internet access.
India
India is no stranger to government-directed Internet shutdowns, taking such action hundreds of times over the last decade. This may be changing in the future, however, as the country’s Supreme Court ordered the Ministry of Electronics and Information Technology (MEITY) to reveal the grounds upon which it imposes or approves Internet shutdowns. Until this issue is resolved, we will continue to see regional shutdowns across the country.
One such example occurred in Assam, where mobile Internet connectivity was shut down to prevent cheating on exams. The figure below shows that these shutdowns were implemented twice daily on August 21 and August 28. While the shutdowns were officially scheduled to take place between 1000-1200 and 1400-1600 local time (0430-0630 and 0830-1030 UTC), some providers reportedly suspended connectivity starting in the early morning.
In addition to multi-hour outages in Sanadij and Tehran province on September 19 and 21 that were covered in a blog post, three mobile network providers — AS44244 (Irancell), AS57218 (RighTel), and AS197207 (MCCI) — implemented daily Internet “curfews”, generally taking place between 1600 and midnight local time (1230-2030 UTC), although the start times varied on several days. These regular shutdowns are clearly visible in the figure below, and continued into early October.
As noted in the blog post, access to DNS-over-HTTPS (DoH) and DNS-over-TLS (DoT) services was also blocked in Iran starting on September 20, and in a move that is likely related, connections over HTTP/3 and QUIC were blocked starting on September 22, as shown in the figure below from Cloudflare Radar.
Natural disasters
Natural disasters such as earthquakes and hurricanes wreak havoc on impacted geographies, often causing loss of life, as well as significant structural damage to buildings of all types. Infrastructure damage is also extremely common, with widespread loss of both electrical power and telecommunications infrastructure.
Papua New Guinea
On September 11, a 7.6 magnitude earthquake struck Papua New Guinea, resulting in landslides, cracked roads, and Internet connectivity disruptions. Traffic to the country dropped by 26% just after 1100 local time (0100 UTC) . The figure below shows that traffic volumes remained lower into the following day as well. An announcement from PNG DataCo, a local provider, noted that the earthquake “has affected the operations of the Kumul Submarine Cable Network (KSCN) Express Link between Port Moresby and Madang and the PPC-1 Cable between Madang and Sydney.” This damage, they stated, resulted in the observed outage and degraded service.
Several major hurricanes plowed their way up the east coast of North America in late September, causing significant damage, resulting in Internet disruptions. On September 18, island-wide power outages caused by Hurricane Fiona disrupted Internet connectivity on Puerto Rico. As the figure below illustrates, it took over 10 days for traffic volumes to return to expected levels. Luma Energy, the local power company, kept customers apprised of repair progress through regular updates to its Twitter feed.
Two days later, Hurricane Fiona slammed the Turks and Caicos islands, causing flooding and significant damage, as well as disrupting Internet connectivity. The figure below shows traffic starting to drop below expected levels around 1245 local time (1645 UTC) on September 20. Recovery took approximately a day, with traffic returning to expected levels around 1100 local time (1500 UTC) on September 21.
Continuing to head north, Hurricane Fiona ultimately made landfall in the Canadian province of Nova Scotia on September 24, causing power outages and disrupting Internet connectivity. The figure below shows that the most significant impact was seen in Nova Scotia. As Nova Scotia Power worked to restore service to customers, traffic volumes gradually increased, as seen in the figure below. By September 29, traffic volumes on the island had returned to normal levels.
Hurricane Ian
On September 28, Hurricane Ian made landfall in Florida, and was the strongest hurricane to hit Florida since Hurricane Michael in 2018. With over four million customers losing power due to damage from the storm, a number of cities experienced associated Internet disruptions. Traffic from impacted cities dropped significantly starting around 1500 local time (1900 UTC), and as the figure below shows, recovery has been slow, with traffic levels still not back to pre-storm volumes more than two weeks later.
In addition to power outages caused by earthquakes and hurricanes, a number of other power outages caused multi-hour Internet disruptions during the third quarter.
Iran
A reported power outage in a key data center building disrupted Internet connectivity for customers of local ISP Shatel in Iran on July 25. As seen in the figure below, traffic dropped significantly at approximately 0715 local time (0345 UTC). Recovery began almost immediately, with traffic nearing expected levels by 0830 local time (0500 UTC).
Venezuela
Electrical issues frequently disrupt Internet connectivity in Venezuela, and the independent @vesinfiltro Twitter account tracks these events closely. One such example occurred on August 9, when electrical issues disrupted connectivity across multiple states, including Mérida, Táchira, Barinas, Portuguesa, and Estado Trujillo. The figure below shows evidence of two disruptions, the first around 1340 local time (1740 UTC) and the second a few hours later, starting at around 1615 local time (2015 UTC). In both cases, traffic volumes appeared to recover fairly quickly.
On September 5, a power outage in Oman impacted energy, aviation, and telecommunications services. The latter is evident in the figure below, which shows the country’s traffic volume dropping nearly 60% when the outage began just before 1515 local time (0915 UTC). Although authorities claimed that “the electricity network would be restored within four hours,” traffic did not fully return to normal levels until 0400 local time on September 6 (2200 UTC on September 5) the following day, approximately 11 hours later.
Ukraine
Over the last seven-plus months of war in Ukraine, we have observed multiple Internet disruptions due to infrastructure damage and power outages related to the fighting. We have covered these disruptions in our first and second quarter summary blog posts, and continue to do so on our @CloudflareRadar Twitter account as they occur. Power outages were behind Internet disruptions observed in Kharkiv on September 11, 12, and 13.
The figure below shows that the first disruption started around 2000 local time (1700 UTC) on September 11. This near-complete outage lasted just over 12 hours, with traffic returning to normal levels around 0830 local time (0530 UTC) on the 12th. However, later that day, another partial outage occurred, with a 50% traffic drop seen at 1330 local time (1030 UTC). This one was much shorter, with recovery starting approximately an hour later. Finally, a nominal disruption is visible at 0800 local time (0500 UTC) on September 13, with lower than expected traffic volumes lasting for around five hours.
Cable damage
Damage to both terrestrial and submarine cables have caused many Internet disruptions over the years. The recent alleged sabotage of the sub-sea Nord Stream natural gas pipelines has brought an increasing level of interest from European media (including Swiss and French publications) around just how important submarine cables are to the Internet, and an increasing level of concern among policymakers about the safety of these cable systems and the potential impact of damage to them. However, the three instances of cable damage reviewed below are all related to terrestrial cable.
Iran
On August 1, a reported “fiber optic cable” problem caused by a fire in a telecommunications manhole disrupted connectivity across multiple network providers, including AS31549 (Aria Shatel), AS58224 (TIC), AS43754 (Asiatech), AS44244 (Irancell), and AS197207 (MCCI). The disruption started around 1215 local time (0845 UTC) and lasted for approximately four hours. Because it impacted a number of major wireless and wireline networks, the impact was visible at a country level as well, as seen in the figure below.
Pakistan
Cable damage due to heavy rains and flooding caused several Internet disruptions in Pakistan in August. The first notable disruption occurred on August 19, starting around 0700 local time (0200 UTC) and lasted just over six and a half hours. On August 22, another significant disruption is also visible, starting at 2250 local time (1750 UTC), with a further drop at 0530 local time (0030 UTC) on the 23rd. The second more significant drop was brief, lasting only 45 minutes, after which traffic began to recover.
Haiti
Amidst protests over fuel price hikes, fiber cuts in Haiti caused Internet outages on multiple network providers. Starting at 1500 local time (1900 UTC) on September 14, traffic on AS27759 (Access Haiti) fell to zero. According to a (translated) Twitter post from the provider, they had several fiber optic cables that were cut in various areas of the country, and blocked roads made it “really difficult” for their technicians to reach the problem areas. Repairs were eventually made, with traffic starting to increase again around 0830 local time (1230 UTC) on September 15, as shown in the figure below.
Access Haiti provides AS27774 (Haiti Networking Group) with Internet connectivity (as an “upstream” provider), so the fiber cut impacted their connectivity as well, causing the outage shown in the figure below.
Technical problems
As a heading, “technical problems” can be a catch-all, referring to multiple types of issues, including misconfigurations and routing problems. However, it is also sometimes the official explanation given by a government or telecommunications company for an observed Internet disruption.
Rogers
Arguably the most significant Internet disruption so far this year took place on AS812 (Rogers), one of Canada’s largest Internet service providers. At around 0845 UTC on July 8, a near complete loss of traffic was observed, as seen in the figure below.
The figure below shows that small amounts of traffic were seen from the network over the course of the outage, but it took nearly 24 hours for traffic to return to normal levels.
A notice posted by the Rogers CEO explained that “We now believe we’ve narrowed the cause to a network system failure following a maintenance update in our core network, which caused some of our routers to malfunction early Friday morning. We disconnected the specific equipment and redirected traffic, which allowed our network and services to come back online over time as we managed traffic volumes returning to normal levels.” A Cloudflare blog post covered the Rogers outage in real-time, highlighting related BGP activity and small increases of traffic.
Chad
A four-hour near-complete Internet outage took place in Chad on August 12, occurring between 1045 and 1300 local time (0945 to 1400 UTC). Authorities in Chad said that the disruption was due to a “technical problem” on connections between Sudachad and networks in Cameroon and Sudan.
Unknown
In many cases, observed Internet disruptions are attributed to underlying causes thanks to statements by service providers, government officials, or media coverage of an associated event. However, for some disruptions, no published explanation or associated event could be found.
On August 11, a multi-hour outage impacted customers of US telecommunications provider Centurylink in states including Colorado, Iowa, Missouri, Montana, New Mexico, Utah, and Wyoming, as shown in the figure below. The outage was also visible in a traffic graph for AS209, the associated autonomous system.
Starlink
On August 30, satellite Internet provider suffered a global service disruption, lasting between 0630-1030 UTC as seen in the figure below.
Conclusion
As part of Cloudflare’s Birthday Week at the end of September, we launched the Cloudflare Radar Outage Center (CROC). The CROC is a section of our new Radar 2.0 site that archives information about observed Internet disruptions. The underlying data that powers the CROC is also available through an API, enabling interested parties to incorporate data into their own tools, sites, and applications. For regular updates on Internet disruptions as they occur and other Internet trends, follow @CloudflareRadar on Twitter.
Welcome to our DDoS Threat Report for the third quarter of 2022. This report includes insights and trends about the DDoS threat landscape – as observed across Cloudflare’s global network.
Multi-terabit strong DDoS attacks have become increasingly frequent. In Q3, Cloudflare automatically detected and mitigated multiple attacks that exceeded 1 Tbps. The largest attack was a 2.5 Tbps DDoS attack launched by a Mirai botnet variant, aimed at the Minecraft server, Wynncraft. This is the largest attack we’ve ever seen from the bitrate perspective.
It was a multi-vector attack consisting of UDP and TCP floods. However, Wynncraft, a massively multiplayer online role-playing game Minecraft server where hundreds and thousands of users can play on the same server, didn’t even notice the attack, since Cloudflare filtered it out for them.
The 2.5 Tbps DDoS attack that targeted Wynncraft — launched by Mirai
General DDoS attack trends
Overall this quarter, we’ve seen:
An increase in DDoS attacks compared to last year.
Longer-lasting volumetric attacks, a spike in attacks generated by the Mirai botnet and its variants.
Surges in attacks targeting Taiwan and Japan.
Application-layer DDoS attacks
HTTP DDoS attacks increased by 111% YoY, but decreased by 10% QoQ.
HTTP DDoS attacks targeting Taiwan increased by 200% QoQ; attacks targeting Japan increased by 105% QoQ.
Reports of Ransom DDoS attacks increased by 67% YoY and 15% QoQ.
Network-layer DDoS attacks
L3/4 DDoS attacks increased by 97% YoY and 24% QoQ.
L3/4 DDoS attacks by Mirai botnets increased by 405% QoQ.
The Gaming / Gambling industry was the most targeted by L3/4 DDoS attacks including a massive 2.5 Tbps DDoS attack.
This report is based on DDoS attacks that were automatically detected and mitigated by Cloudflare’s DDoS Protection systems. To learn more about how it works, check out this deep-dive blog post.
Ransom attacks
Ransom DDoS attacks are attacks where the attacker demands a ransom payment, usually in the form of Bitcoin, to stop/avoid the attack. In Q3, 15% of Cloudflare customers that responded to our survey reported being targeted by HTTP DDoS attacks accompanied by a threat or a ransom note. This represents a 15% increase QoQ and 67% increase YoY of reported ransom DDoS attacks.
Distribution of Ransom DDoS attacks by quarter
Diving into Q3, we can see that since June 2022, there was a steady decline in reports of ransom attacks. However, in September, the reports of ransom attacks spiked again. In the month of September, almost one out of every four respondents reported receiving a ransom DDoS attack or threat — the highest month in 2022 so far.
Distribution of Ransom DDoS attacks by month
How we calculate Ransom DDoS attack trends Our systems constantly analyze traffic and automatically apply mitigation when DDoS attacks are detected. Each DDoS’d customer is prompted with an automated survey to help us better understand the nature of the attack and the success of the mitigation. For over two years, Cloudflare has been surveying attacked customers. One of the questions in the survey asks the respondents if they received a threat or a ransom note demanding payment in exchange to stop the DDoS attack. Over the past year, on average, we collected 174 responses per quarter. The responses of this survey are used to calculate the percentage of Ransom DDoS attacks.
Application-layer DDoS attacks
Application-layer DDoS attacks, specifically HTTP DDoS attacks, are attacks that usually aim to disrupt a web server by making it unable to process legitimate user requests. If a server is bombarded with more requests than it can process, the server will drop legitimate requests and – in some cases – crash, resulting in degraded performance or an outage for legitimate users.
Application-layer DDoS attack trends
When we look at the graph below, we can see a clear trend of approximately 10% decrease in attacks each quarter since 2022 Q1. However, despite the downward trend, when comparing Q3 of 2022 to Q3 of 2021, we can see that HTTP DDoS attacks still increased by 111% YoY.
Distribution of HTTP DDoS attacks by quarter
When we dive into the months of the quarter, attacks in September and August were fairly evenly distributed; 36% and 35% respectively. In July, the amount of attacks was the lowest for the quarter (29%).
Distribution of HTTP DDoS attacks by month in 2022 Q3
Application-layer DDoS attacks by industry
By bucketing the attacks by our customers’ industry of operation, we can see that HTTP applications operated by Internet companies were the most targeted in Q3. Attacks on the Internet industry increased by 131% QoQ and 300% YoY.
The second most attacked industry was the Telecommunications industry with an increase of 93% QoQ and 2,317% (!) YoY. In third place was the Gaming / Gambling industry with a more conservative increase of 17% QoQ and 36% YoY.
Top industries targeted by HTTP DDoS attacks in 2022 Q3
Application-layer DDoS attacks by target country
Bucketing attacks by our customers’ billing address gives us an understanding of which countries are more attacked. HTTP applications operated by US companies were the most targeted in Q3. US-based websites saw an increase of 60% QoQ and 105% YoY in attacks targeting them. After the US, was China with a 332% increase QoQ and an 800% increase YoY.
Looking at Ukraine, we can see that attacks targeting Ukrainian websites increased by 67% QoQ but decreased by 50% YoY. Furthermore, attacks targeting Russian websites increased by 31% QoQ and 2,400% (!) YoY.
In East Asia, we can see that attacks targeting Taiwanese companies increased by 200% QoQ and 60% YoY, and attacks targeting Japanese companies increased by 105% QoQ.
Top countries targeted by HTTP DDoS attacks in 2022 Q3
When we zoom in on specific countries, we can identify the below trends that may reveal interesting insights regarding the war in Ukraine and geopolitical events in East Asia:
In Ukraine, we see a surprising change in the attacked industries. Over the past two quarters, Broadcasting, Online Media and Publishing companies were targeted the most in what appeared to be an attempt to silence information and make it unavailable to civilians. However, this quarter, those industries dropped out of the top 10 list. Instead, the Marketing & Advertising industry took the lead (40%), followed by Education companies (20%), and Government Administration (8%).
In Russia, attacks on the Banking, Financial Services and Insurance (BFSI) industry continue to persist (25%). Be that as it may, attacks on the BFSI sector still decreased by 44% QoQ. In second place is the Events Services industry (20%), followed by Cryptocurrency (16%), Broadcast Media (13%), and Retail (11%). A significant portion of the attack traffic came from Germany-based IP addresses, and the rest were globally distributed.
In Taiwan, the two most attacked industries were Online Media (50%) and Internet (23%). Attacks to those industries were globally distributed indicating the usage of botnets.
In Japan, the most attacked industry was Internet/Media & Internet (52%), Business Services (12%), and Government – National (11%).
Application-layer DDoS attack traffic by source country
Before digging into specific source country metrics, it is important to note that while country of origin is interesting, it is not necessarily indicative of where the attacker is located. Oftentimes with DDoS attacks, they are launched remotely, and attackers will go to great lengths to hide their actual location in an attempt to avoid being caught. If anything, it is indicative of where botnet nodes are located. With that being said, by mapping the attacking IP address to their location, we can understand where attack traffic is coming from.
After two consecutive quarters, China replaced the US as the main source of HTTP DDoS attack traffic. In Q3, China was the largest source of HTTP DDoS attack traffic. Attack traffic from China-registered IP addresses increased by 29% YoY and 19% QoQ. Following China was India as the second-largest source of HTTP DDoS attack traffic — an increase of 61% YoY. After India, the main sources were the US and Brazil.
Looking at Ukraine, we can see that this quarter there was a drop in attack traffic originating from Ukrainian and Russian IP addresses — a decrease of 29% and 11% QoQ, respectively. However, YoY, attack traffic from within those countries still increased by 47% and 18%, respectively.
Another interesting data point is that attack traffic originating from Japanese IP addresses increased by 130% YoY.
Top source countries of HTTP DDoS attacks in 2022 Q3
Network-layer DDoS attacks
While application-layer attacks target the application (Layer 7 of the OSI model) running the service that end users are trying to access (HTTP/S in our case), network-layer attacks aim to overwhelm network infrastructure (such as in-line routers and servers) and the Internet link itself.
Network-layer DDoS attack trends
In Q3, we saw a large surge in L3/4 DDoS attacks — an increase of 97% YoY and a 24% QoQ. Furthermore, when we look at the graph we can see a clear trend, over the past three quarters, of an increase in attacks.
Distribution of L3/4 DDoS attacks by quarter
Drilling down into the quarter, it’s apparent that the attacks were, for the most part, evenly distributed throughout the quarter — with a slightly larger share for July.
Distribution of L3/4 DDoS attacks by month in 2022 Q3
Network-layer DDoS attacks by Industry
The Gaming / Gambling industry was hit by the most L3/4 DDoS attacks in Q3. Almost one out of every five bytes Cloudflare ingested towards Gaming / Gambling networks was part of a DDoS attack. This represents a whopping 381% increase QoQ.
The second most targeted industry was Telecommunications — almost 6% of bytes towards Telecommunications networks were part of DDoS attacks. This represents a 58% drop from the previous quarter where Telecommunications was the top most attacked industry by L3/4 DDoS attacks.
Following were the Information Technology and Services industry along with the Software industry. Both saw significant growth in attacks — 89% and 150% QoQ, respectively.
Top industries targeted by L3/4 DDoS attacks in 2022 Q3
Network-layer DDoS attacks by target country
In Q3, Singapore-based companies saw the most L3/4 DDoS attacks — over 15% of all bytes to their networks were associated with a DDoS attack. This represents a dramatic 1,175% increase QoQ.
The US comes in second after a 45% decrease QoQ in attack traffic targeting US networks. In third, China, with a 62% QoQ increase. Attacks on Taiwan companies also increased by 200% QoQ.
Top countries targeted by L3/4 DDoS attacks in 2022 Q3
Network-layer DDoS attacks by ingress country
In Q3, Cloudflare’s data centers in Azerbaijan saw the largest percentage of attack traffic. More than a third of all packets ingested there were part of a L3/4 DDoS attack. This represents a 44% increase QoQ and a huge 59-fold increase YoY.
Similarly, our data centers in Tunisia saw a dramatic increase in attack packets – 173x the amount in the previous year. Zimbabwe and Germany also saw significant increases in attacks.
Zooming into East Asia, we can see that our data centers in Taiwan saw an increase of attacks — 207% QoQ and 1,989% YoY. We saw similar numbers in Japan where attacks increased by 278% QoQ and 1,921% YoY.
Looking at Ukraine, we actually see a dip in the amount of attack packets we observed in our Ukraine-based and Russia-based data centers — 49% and 16% QoQ, respectively.
Top Cloudflare data center locations with the highest percentage of DDoS attack traffic in 2022 Q3
Attack vectors & Emerging threats
An attack vector is the method used to launch the attack or the method of attempting to achieve denial-of-service. With a combined share of 71%, SYN floods and DNS attacks remain the most popular DDoS attack vectors in Q3.
Top attack vectors in 2022 Q3
Last quarter, we saw a resurgence of attacks abusing the CHARGEN protocol, the Ubiquity Discovery Protocol, and Memcached reflection attacks. While the growth in Memcached DDoS attacks also slightly grew (48%), this quarter, there was a more dramatic increase in attacks abusing the BitTorrent protocol (1,221%), as well as attacks launched by the Mirai botnet and its variants.
BitTorrent DDoS attacks increased by 1,221% QoQ The BitTorrent protocol is a communication protocol that’s used for peer to peer file sharing. To help the BitTorrent clients find and download the files efficiently, BitTorrent clients may use BitTorrent Trackers or Distributed Hash Tables (DHT) to identify the peers that are seeding the desired file. This concept can be abused to launch DDoS attacks. A malicious actor can spoof the victim’s IP address as a seeder IP address within Trackers and DHT systems. Then clients would request the files from those IPs. Given a sufficient number of clients requesting the file, it can flood the victim with more traffic than it can handle.
Mirai DDoS attacks increased by 405% QoQ Mirai is malware that infects smart devices that run on ARC processors, turning them into a network of bots that can be used to launch DDoS attacks. This processor runs a stripped-down version of the Linux operating system. If the default username-and-password combo is not changed, Mirai is able to log in to the device, infect it, and take over. The botnet operator can instruct the botnet to launch a flood of UDP packets at the victim’s IP address to bombard them.
Top emerging threats in 2022 Q3
Network-layer DDoS attacks by Attack Rates & Duration
While Terabit-strong attacks are becoming more frequent, they are still the outliers. The majority of attacks are tiny (in terms of Cloudflare scale). Over 95% of attacks peaked below 50,000 packets per second (pps) and over 97% below 500 Megabits per second (Mbps). We call this “cyber vandalism”.
What is cyber vandalism? As opposed to “classic” vandalism where the purpose is to cause deliberate destruction of or damage to public or private physical property — such as graffiti on the side of a building — in the cyberworld, cyber vandalism is the act of causing deliberate damage to Internet properties. Today the source codes for various botnets are available online and there are a number of free tools that can be used to launch a flood of packets. By directing those tools to Internet properties, any script-kid can use those tools to launch attacks against their school during exam season or any other website they desire to take down or disrupt. This is as opposed to organized crime, Advanced Persistent Threat actors, and state-level actors that can launch much larger and sophisticated attacks.
Distribution of DDoS attacks by bitrate in 2022 Q3
Similarly, most of the attacks are very short and end within 20 minutes (94%). This quarter we did see an increase of 9% in attacks of 1-3 hours, and a 3% increase in attacks over 3 hours — but those are still the outliers.
QoQ change in the duration of DDoS attacks in 2022 Q3
Even with the largest attacks, such as the 2.5 Tbps attack we mitigated earlier this quarter, and the 26M request per second attack we mitigated back in the summer, the peak of the attacks were short-lived. The entire 2.5 Tbps attack lasted about 2 minutes, and the peak of the 26M rps attack only 15 seconds. This emphasizes the need for automated, always-on solutions. Security teams can’t respond quick enough. By the time the security engineer looks at the PagerDuty notification on their phone, the attack has subsided.
Summary
Attacks may be initiated by humans, but they are executed by bots — and to play to win, you must fight bots with bots. Detection and mitigation must be automated as much as possible, because relying solely on humans puts defenders at a disadvantage. Cloudflare’s automated systems constantly detect and mitigate DDoS attacks for our customers, so they don’t have to.
Over the years, it has become easier, cheaper, and more accessible for attackers and attackers-for-hire to launch DDoS attacks. But as easy as it has become for the attackers, we want to make sure that it is even easier – and free – for defenders of organizations of all sizes to protect themselves against DDoS attacks of all types. We’ve been providing unmetered and unlimited DDoS protection for free to all of our customers since 2017 — when we pioneered the concept.
Cloudflare’s mission is to help build a better Internet. A better Internet is one that is more secure, faster, and reliable for everyone – even in the face of DDoS attacks.
Historically, Cloudflare has covered large-scale Internet outages with timely blog posts, such as those published for Iran, Sudan, Facebook, and Syria. While we still explore such outages on the Cloudflare blog, throughout 2022 we have ramped up our monitoring of Internet outages around the world, posting timely information about those outages to @CloudflareRadar on Twitter.
Furthermore, this initial release is also laying the groundwork for the CROC to become a first stop and key resource for civil society organizations, journalists/news media, and impacted parties to get information on, or corroboration of, reported or observed Internet outages.
What information does the CROC contain?
At launch, the CROC includes summary information about observed outage events. This information includes:
Location: Where was the outage?
ASN: What autonomous system experienced a disruption in connectivity?
Type: How broad was the outage? Did connectivity fail nationwide, or at a sub-national level? Did just a single network provider have an outage?
Scope: If it was a sub-national/regional outage, what state or city was impacted? If it was a network-level outage, which one?
Cause: Insight into the likely cause of the outage, based on publicly available information. Historically, some have been government directed shutdowns, while others are caused by severe weather or natural disasters, or by infrastructure issues such as cable cuts, power outages, or filtering/blocking.
Start time: When did the outage start?
End time: When did the outage end?
Using the CROC
Radar pages, including the main landing page, include a card displaying information about the most recently observed outage, along with a link to the CROC. The CROC will also be linked from the left-side navigation bar
Within the CROC, we have tried to keep the interface simple and easily understandable. Based on the selected time period, the global map highlights locations where Internet outages have been observed, along with a tooltip showing the number of outages observed during that period. Similarly, the table includes information (as described above) about each observed outage, along with a link to more information. The linked information may be a Twitter post, a blog post, or a custom Radar graph.
As mentioned in the Radar 2.0 launch blog post, we launched an associated API alongside the new site. Outage information is available through this API as well — in fact, the CROC is built on top of this API. Interested parties, including civil society organizations, data journalists, or others, can use the API to integrate the available outage data with their own data sets, build their own related tools, or even develop a custom interface.
Information about the related API endpoint and how to access it can be found in the Cloudflare API documentation.
We recognize that some users may want to download the whole list of observed outages for local consumption and analysis. They can do so by clicking the “Download CSV” link below the table.
The status page the Internet needs (coming soon)
Today’s launch of the Cloudflare Radar Outage Center is just the beginning, as we plan to improve it over time. This includes increased automation of outage detection, enabling us to publish more timely information through both the API and the CROC tool, which is important for members of the community that track and respond to Internet outages. We are also exploring how we can use synthetic monitoring in combination with other network-level performance and availability information to detect outages of popular consumer and business applications/platforms.
And anyone who uses a cloud platform provider (such as AWS) will know that those companies’ status pages take a surprisingly long time to update when there’s an outage. It’s very common to experience difficulty accessing a service, see hundreds of messages on Twitter and message boards about a service being down, only to go to the cloud platform provider’s status page and see everything green and “All systems normal”.
For the last few months we’ve been monitoring the performance of cloud platform providers to see if we can detect when they go down and provide our own, real time status page for them. We believe we can and Cloudflare Radar Outage Center will be extended to include cloud service providers and give the Internet the status page it needs.
If you have questions about the CROC, or suggestions for features that you would like to see, please reach out to us on Twitter at @CloudflareRadar.
Cloudflare Radar was launched two years ago to give everyone access to the Internet trends, patterns and insights Cloudflare uses to help improve our service and protect our customers.
Until then, these types of insights were only available internally at Cloudflare. However, true to our mission of helping build a better Internet, we felt everyone should be able to look behind the curtain and see the inner workings of the Internet. It’s hard to improve or understand something when you don’t have clear visibility over how it’s working.
On Cloudflare Radar you can find timely graphs and visualizations on Internet traffic, security and attacks, protocol adoption and usage, and outages that might be affecting the Internet. All of these can be narrowed down by timeframe, country, and Autonomous System (AS). You can also find interactive deep dive reports on important subjects such as DDoS and the Meris Botnet. It’s also possible to search for any domain name to see details such as SSL usage and which countries their visitors are coming from.
Since launch, Cloudflare Radar has been used by NGOs to confirm the Internet disruptions their observers see in the field, by journalists looking for Internet trends related to an event in a country of interest or at volume of cyberattacks as retaliation to political sanctions, by analysts looking at the prevalence of new protocols and technologies, and even by brand PR departments using Cloudflare Radar data to analyze the online impact of a major sports event.
Cloudflare Radar has clearly become an important tool for many and, most importantly, we find it has helped shed light on parts of the Internet that deserve more attention and investment.
Introducing Cloudflare Radar 2.0
What has made Cloudflare Radar so valuable is that the data and insights it contains are unique and trustworthy. Cloudflare Radar shows aggregate data from across the massive spectrum of Internet traffic we see every day, presenting you with datasets you won’t find elsewhere.
However, there were still gaps. Today, on the second anniversary of Cloudflare Radar, we are launching Cloudflare Radar 2.0 in beta. It will address three common pieces of feedback from users:
Ease of finding insights and data. The way information was structured on Cloudflare Radar made finding information daunting for some people. We are redesigning Cloudflare Radar so that it becomes a breeze.
Number of insights. We know many users have wanted to see insights about other important parts of the Internet, such as email. We have also completely redesigned the Cloudflare Radar backend so that we can quickly add new insights over the coming months (including insights into email).
Sharing insights.The options for sharing Cloudflare Radar insights were limited. We will now provide you the options you want, including downloadable and embeddable graphs, sharing to social media platforms, and an API.
Finding insights and data
On a first visit to the redesigned Cloudflare Radar homepage one will notice:
Prominent and intuitive filtering capabilities on the top bar. A global search bar is also coming soon.
Content navigation on the sidebar.
Content cards showing glanceable and timely information.
The content you find on the homepage are what we call “quick bytes”. Those link you to more in-depth content for that specific topic, which can also be found through the sidebar navigation.
At the top of the page you can search for a country, autonomous system number (ASN), domain, or report to navigate to a home page for that specific content. For example, the domain page for google.com:
The navigation sidebar allows you to find more detailed insights and data related to Traffic, Security & Attacks, Adoption & Usage, and Domains. (We will be adding additional topic areas in the future.) It also gives you quick access to the Cloudflare Radar Outage Center, a tool for tracking Internet disruptions around the world and to which we are dedicating a separate blog post, and to Radar Reports, which are interactive deep dive reports on important subjects such as DDoS and the Meris Botnet.
Within these topic pages (such as the one for Adoption & Usage shown above), you will find the quick bytes for the corresponding topic at the top, and quick bytes for related topics on the right. The quick bytes on the right allow you to quickly glance at and navigate to related sections.
In the middle of the page are the more detailed charts for the topic you’re exploring.
Sharing insights
Cloudflare Radar’s reason to exist is to make Internet insights available to everyone, but historically we haven’t been as flexible as our users would want. People could download a snapshot of the graph, but not much more.
With Cloudflare Radar 2.0 we will be introducing three major new ways of using Radar insights and data:
Social share. Cloudflare Radar 2.0 charts have a more modern and clean look and feel, and soon you’ll be able to share them directly on the social media platform of your choice. No more dealing with low quality screenshots.
Embeddable charts. The beautiful charts will also be able to be embedded directly into your webpage or blog – it will work just like a widget, always showing up-to-date information.
API. If you like the data on Cloudflare Radar but want to manipulate it further for analysis, visualization, or for posting your own charts, you’ll have the Cloudflare Radar API available to you starting today.
Note: The API is available today. To use the Cloudflare API you need an API token or key (more details here). Embedding charts and sharing directly to social are new features to be released later this year.
Technology changes
Cloudflare Radar 2.0 was built on a new technology stack; we will write a blog post about why and how we did it soon. A lot changed: we now have proper GraphQL data endpoints and a public API, the website runs on top of Cloudflare Pages and Workers, and we’re finally doing server-side rendering using Remix. We adopted SVG whenever possible, built our reusable data visualization components system, and are using Cosmos for visual TDD. These foundational changes will provide a better UX/UI to our users and give us speed when iterating and improving Cloudflare Radar in the future.
We hope you find this update valuable, and recommend you keep an eye on radar.cloudflare.com to see the new insights and topics we’ll be adding regularly. If you have any feedback, please send it to us through the Cloudflare Community.
The collective thoughts of the interwebz
Manage Consent
To provide the best experiences, we use technologies like cookies to store and/or access device information. Consenting to these technologies will allow us to process data such as browsing behavior or unique IDs on this site. Not consenting or withdrawing consent, may adversely affect certain features and functions.
Functional
Always active
The technical storage or access is strictly necessary for the legitimate purpose of enabling the use of a specific service explicitly requested by the subscriber or user, or for the sole purpose of carrying out the transmission of a communication over an electronic communications network.
Preferences
The technical storage or access is necessary for the legitimate purpose of storing preferences that are not requested by the subscriber or user.
Statistics
The technical storage or access that is used exclusively for statistical purposes.The technical storage or access that is used exclusively for anonymous statistical purposes. Without a subpoena, voluntary compliance on the part of your Internet Service Provider, or additional records from a third party, information stored or retrieved for this purpose alone cannot usually be used to identify you.
Marketing
The technical storage or access is required to create user profiles to send advertising, or to track the user on a website or across several websites for similar marketing purposes.