Tag Archives: Industries

Implement anti-money laundering solutions on AWS

Post Syndicated from Yomi Abatan original https://aws.amazon.com/blogs/big-data/implement-anti-money-laundering-solutions-on-aws/

The detection and prevention of financial crime continues to be an important priority for banks. Over the past 10 years, the level of activity in financial crimes compliance in financial services has expanded significantly, with regulators around the globe taking scores of enforcement actions and levying $36 billion in fines. Apart from the fines, the overall cost of compliance for global financial services companies is suspected to have reached $181 billion in 2020. For most banks, know your customer (KYC) and anti-money laundering (AML) constitute the largest area of concern within the broader financial crime compliance. In light of this, there is an urgent need to have effective AML systems that are scalable and fit for purpose in order to manage the risk of money laundering as well as the risk of non-compliance by the banks. Addressing money laundering at a high-level covers the following areas:

  • Client screening and identity
  • Transaction monitoring
  • Extended customer risk profile
  • Reporting of suspicious transactions

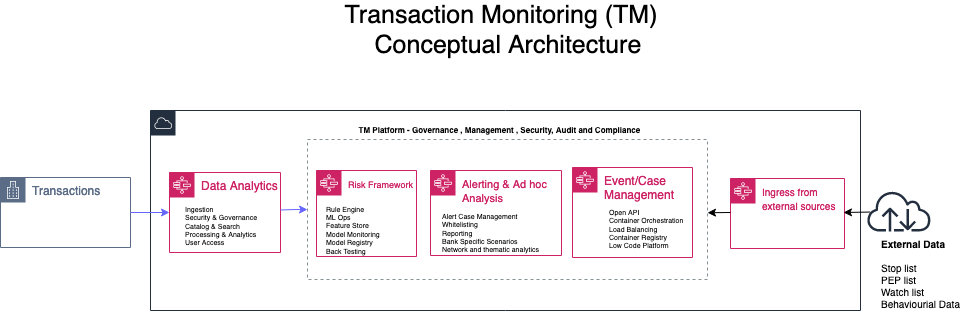
In this post we focus on transaction monitoring by looking at the general challenges with implementing transaction monitoring (TM) solutions and how AWS services can be leveraged to build a solution in the cloud from the perspectives of data analytics; risk management and ad hoc analysis. The following diagram is a conceptual architecture for a transaction monitoring solution on the AWS Cloud.
Current challenges

Due to growing digital channels for facilitating financial transactions, the increasing access to financial services for more people, and the growth in global payments; capturing and processing data related to TM is now considered a big data challenge. The big data challenges and observations include:

  • The volume of data continues to prove to be too expansive for effective processing in a traditional on-premises data center solution.
  • The velocity of banking transactions continues to rise despite the economic challenges of COVID-19.
  • The variety of the data that needs to be processed for TM platforms continues to increase as more data sources with unstructured data become available. These data sources require techniques such as optical character recognition (OCR) and natural language processing (NLP) to automate the process of getting value out of such data without excessive manual effort.
  • Finally, due to the layered nature of complex transactions involved in TM solutions, having data aggregated from multiple financial institutions provides a more comprehensive insight into the flow of financial transactions. Such an aggregation is usually less viable in a traditional on-premises solution.

Data Analytics

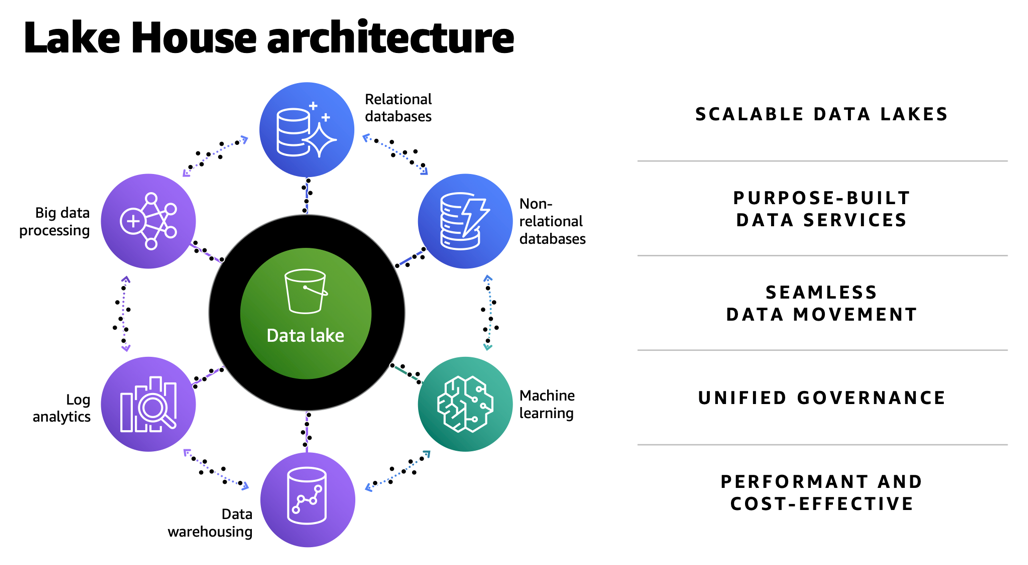
The first challenge with implementing TM solutions is having the tools and services to ingest data into a central store (often called a data lake) that is secure and scalable. Not only does this data lake need to capture terabytes or even petabytes of data, but it also needs to facilitate the process of moving data in and out of purpose-built data stores for time series, graph, data marts, and machine learning (ML) processing. In AWS, we refer to a data architecture which covers data lakes, purpose-built data stores and the data movement across data stores as a lake house architecture.
The following diagram illustrates a TM architecture on the AWS Cloud. This is a more detailed sample architecture of the lake house approach.
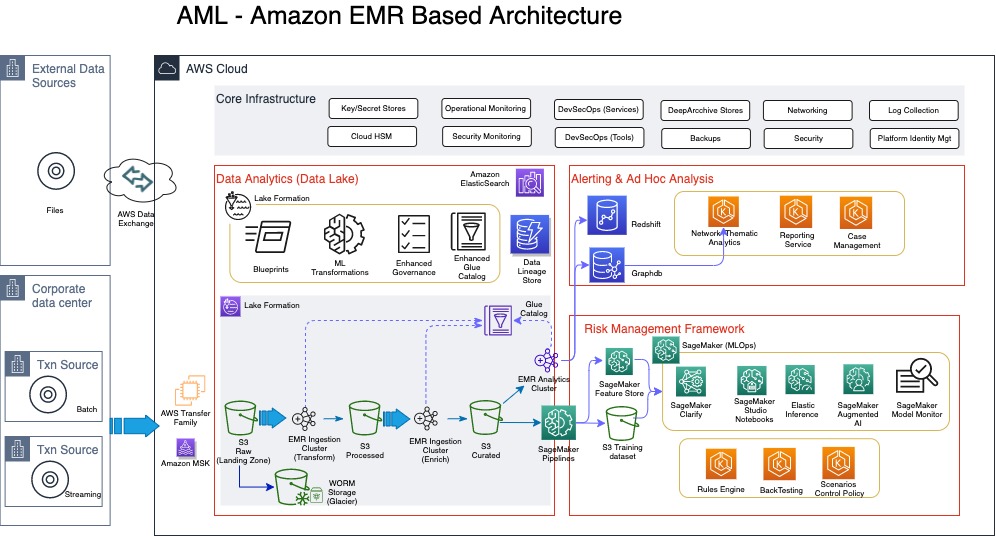
Ingestion of data into the lake house typically comes from a client’s data center (if the client is not already on the cloud), or from different client AWS accounts that host transaction systems or from external sources. For clients with transaction systems still on premises, we notice although several AWS services can be used to transfer data from on premises to the AWS Cloud, a number of our clients with a batch requirement utilize AWS Transfer Family, which provides fully managed support for secure file transfers directly into and out of Amazon Simple Storage Service (Amazon S3) or Amazon Elastic File System (Amazon EFS). With real-time requirements, we see the use of Amazon Managed Streaming for Apache Kafka (Amazon MSK), which is a fully managed service that makes it easy for you to build and run applications that use Apache Kafka to process streaming data. One other way to bring in reference data or external data like politically exposed persons (PEP) lists, watch lists, or stop lists for the AML process is via AWS Data Exchange, which makes it easy to find, subscribe to, and use third-party data in the cloud.

In this architecture, the ingestion process always stores the raw data in Amazon S3, which offers industry-leading scalability, data availability, security, and performance. For those clients already on the AWS Cloud, it’s very likely your data is already stored in Amazon S3.

For TM, the ingestion of the data comes from KYC systems, customer account stores, as well as transaction repositories. Data from KYC systems need to have the entity information, which can relate to a company or individual. For the corporate entities, information on the underlying beneficiary owners (UBOs)—the natural persons who directly or indirectly own or control a certain percentage of company—is also required. Before we discuss the data pipeline (the flow of data from the landing zone to the curated data layer) in detail, it’s important to address some of the security and audit requirements of the sensitive data classes typically used in AML processing.

According to Gartner, “Data governance is the specification of decision rights and an accountability framework to ensure the appropriate behavior in the valuation, creation, consumption, and control of data and analytics.” From an AML perspective, the specification and the accountable framework mentioned in this definition requires several enabling components.

The first is a data catalog, which is sometimes grouped into technical, process, and business catalogs. On the AWS platform, this catalog is provided either directly through AWS Glue or indirectly through AWS Lake Formation. Although the catalog implemented by AWS Glue is fundamentally a technical catalog, you can still extend it to add process and business relevant attributes.

The second enabling component is data lineage. This service should be flexible enough to support the different types of data lineage, namely vertical, horizontal, and physical. From an AML perspective, vertical lineage can provide a trace from AML regulation, which requires the collection of certain data classes, all the way to the data models captured in the technical catalog. Horizontal and physical lineage provide a trace of the data from source to eventual suspicious activity reporting for suspected transactions. Horizonal lineage provides lineage at the metadata level, whereas physical lineage captures trace at the physical level.

The third enabling component of data governance is data security. This covers several aspects of dealing with requirements of encryption of data at rest and in transit, but also de-identification of data during processing. This area requires a range of de-identification techniques depending on the context of use. Some of the techniques include tokenization, encryption, generalization, masking, perturbation, redaction, and even substitution of personally identifiable information (PII) or sensitive data usually at the attribute level. It’s important to use the right de-identification technique to enforce the right level of privacy while still ensuring the data still has sufficient inference signals for use in ML. You can use Amazon Macie, a fully managed data security and data privacy service that uses ML and pattern matching to discover and protect sensitive data, to automate PII discovery prior to applying the right de-identification technique.

Moving data from landing zone (raw data) all the way to curated data involves several steps of processing, including data quality validation, compression, transformation, enrichment, de-duplication, entity resolution, and entity aggregation. Such processing is usually referred to as extract, transform, and load (ETL). In this architecture, we have a choice of using a serverless architecture based on AWS Glue (using Scala or Python programming languages) or implementing Amazon EMR (a cloud big-data platform for processing large datasets using open-source tools such as Apache Spark and Hadoop). Amazon EMR provides the flexibility to run these ETL workloads on Amazon Elastic Compute Cloud (Amazon EC2) instances, Amazon Elastic Kubernetes Service (Amazon EKS) clusters and also on AWS Outposts.

Risk management framework

The risk management framework part of the architecture contains the rules, thresholds, algorithms, models, and control policies that govern the process of detecting and reporting suspicious transactions. Traditionally, most TM solutions have relied solely on rule-based controls to implement AML requirements. However, these rule-based implementations quickly become complex and difficult to maintain, as criminals find new and sophisticated ways to circumvent existing AML controls. Apart from the complexity and maintenance, rule-based approaches usually result in large number of false positives. False positives in this context are when transactions are flagged as suspicious but turn out not to be. Some of the numbers here are quite remarkable, with some studies revealing less than 2% of cases actually turning to be suspicious. The implication of this is the operational costs and the teams of operational resources required to investigate these false positives. Another implication that sometimes get overlooked is the customer experience, in which a customer service like payment or clearing of transactions is delayed or declined due to false positives. This usually leads to a less than satisfactory customer experience. Despite the number of false positives, AML failings and subsequent fines are hardly out of the news; in one case the Financial Conduct Authority (FCA) in the United Kingdom deciding to take the unprecedented step of bringing criminal proceedings against a bank over failed AML processes.

In light of some of the shortcomings of a rule-based AML approach, a lot of research and focus has been performed by financial services customers, including RegTechs, on applying ML to detect suspicious transactions. One comprehensive study on the use of ML techniques in suspicious transaction detection is a paper published by Z. Chen et al. This paper was published in 2018 (which in ML terms is a lifetime ago), but the concepts and findings are still relevant. The paper highlights some of the common algorithms and challenges with using ML for AML. AML data is a high-dimensional space that usually requires dimensionality reduction through the use of algorithms like Principal Component Analysis (PCA) or autoencoders (neural networks used to learn efficient data encodings in an unsupervised manner). As part of feature engineering, most algorithms require the value of transactions (debits and credits) aggregated by time intervals—daily, weekly, and monthly. Clustering algorithms like k-means or some variants of k-means are used to create clusters for customer or transaction profiles. There is also the need to deal with class imbalance usually found in AML datasets.

All of these algorithms referenced in the Z. Chen et al paper are supported by Amazon SageMaker. SageMaker is a fully managed ML service that allows data scientists and developers to easily build, train, and deploy ML models for AML. You can also implement some of the other categories of algorithms that support AML such as behavioral modelling, risk scoring, and anomaly detection with SageMaker. You can use a wide range of algorithms to address AML challenges, including supervised, semi-supervised, and unsupervised models. Some additional factors that determine the suitability of algorithms include high recall and precision rate of the models, and the ability to utilize approaches such as SHapley Additive exPlanation (SHAP) and Local Interpretable Model-Agnostic Explanations (LIME) values to explain the model output. Amazon SageMaker Clarify can detect bias and increases transparency of ML models.

Algorithms that focus on risk scoring enable a risk profile that can span across various data classes such as core customer attributes including industry, geography, bank product, business size, complex ownership structure for entities, as well as transactions (debits and credits) and frequency of such transactions. In addition, external data such as PEP lists, various stop lists and watch lists, and in some cases media coverage related to suspected fraud or corruption can also be weighted into a customer’s risk profile.

Rule-based and ML approaches aren’t mutually exclusive, but it’s likely that rules will continue to play a peripheral role as better algorithms are researched and implemented. One of the reasons why the development of algorithms for AML has been sluggish is the availability of reliable datasets, which include result data indicating when a correct suspicious activity report (SAR) was filed for a given scenario. Unlike other areas of ML in which findings have been openly shared for further research, with AML, a lot of the progress first appears in commercial products belonging to vendors who are protective of their intellectual property.

Ad hoc analysis and reporting

The final part of the architecture includes support for case or event management tooling and a reporting service for the eventual SAR. These services can be AWS Marketplace solutions or developed from scratch using AWS services such as Amazon EKS or Amazon ECS. This part of the architecture also provides support for a very important aspect of AML: network analytics. Network or link analysis has three main components:

  • Clustering – The construction of graphs and representation of money flow. Amazon Neptune is a fast, reliable, fully managed graph database service that makes it easy to build and run applications that work with highly connected datasets.
  • Statistical analysis – Used to assist with finding metrics around centrality, normality, clustering, and eigenvector centrality.
  • Data visualization – An interactive and extensible data visualization platform to support exploratory data analysis. Findings from the network analytics can also feed into customer risk profiles and supervised ML algorithms.

Conclusion

None of the services or architecture layers described in this architecture are tightly coupled; different layers and services can be swapped with AWS Marketplace solutions or other FinTech or RegTech solutions that support cloud-based deployment. This means the AWS Cloud has a powerful ecosystem of native services and third-party solutions that can be deployed on the foundation of a Lake House Architecture on AWS to build a modern TM solution in the cloud. To find out more information about key of parts of the architecture described in this post, refer to the following resources:

For seeding data into a data lake (including taking advantage of ACID compliance):

For using Amazon EMR for data pipeline processing and some of recent updates to the Amazon EMR:

For taking advantage of SageMaker to support financial crime use cases:

Please contact AWS if you need help developing a full-scale AML solution (covering client screening and identity, transaction monitoring, extended customer risk profile and reporting of suspicious transactions) on AWS.


About the Author

Yomi Abatan is a Sr. Solution Architect based in London, United Kingdom. He works with financial services organisations, architecting, designing and implementing various large-scale IT solutions. He, currently helps established financial services AWS customers embark on Digital transformations using AWS cloud as an accelerator. Before joining AWS he worked in various architecture roles with several tier-one investment banks.
How MEDHOST’s cardiac risk prediction successfully leveraged AWS analytic services

Post Syndicated from Pandian Velayutham original https://aws.amazon.com/blogs/big-data/how-medhosts-cardiac-risk-prediction-successfully-leveraged-aws-analytic-services/

MEDHOST has been providing products and services to healthcare facilities of all types and sizes for over 35 years. Today, more than 1,000 healthcare facilities are partnering with MEDHOST and enhancing their patient care and operational excellence with its integrated clinical and financial EHR solutions. MEDHOST also offers a comprehensive Emergency Department Information System with business and reporting tools. Since 2013, MEDHOST’s cloud solutions have been utilizing Amazon Web Services (AWS) infrastructure, data source, and computing power to solve complex healthcare business cases.

MEDHOST can utilize the data available in the cloud to provide value-added solutions for hospitals solving complex problems, like predicting sepsis, cardiac risk, and length of stay (LOS) as well as reducing re-admission rates. This requires a solid foundation of data lake and elastic data pipeline to keep up with multi-terabyte data from thousands of hospitals. MEDHOST has invested a significant amount of time evaluating numerous vendors to determine the best solution for its data needs. Ultimately, MEDHOST designed and implemented machine learning/artificial intelligence capabilities by leveraging AWS Data Lab and an end-to-end data lake platform that enables a variety of use cases such as data warehousing for analytics and reporting.

Since you’re reading this post, you may also be interested in the following:

Getting started

MEDHOST’s initial objectives in evaluating vendors were to:

  • Build a low-cost data lake solution to provide cardiac risk prediction for patients based on health records
  • Provide an analytical solution for hospital staff to improve operational efficiency
  • Implement a proof of concept to extend to other machine learning/artificial intelligence solutions

The AWS team proposed AWS Data Lab to architect, develop, and test a solution to meet these objectives. The collaborative relationship between AWS and MEDHOST, AWS’s continuous innovation, excellent support, and technical solution architects helped MEDHOST select AWS over other vendors and products. AWS Data Lab’s well-structured engagement helped MEDHOST define clear, measurable success criteria that drove the implementation of the cardiac risk prediction and analytical solution platform. The MEDHOST team consisted of architects, builders, and subject matter experts (SMEs). By connecting MEDHOST experts directly to AWS technical experts, the MEDHOST team gained a quick understanding of industry best practices and available services allowing MEDHOST team to achieve most of the success criteria at the end of a four-day design session. MEDHOST is now in the process of moving this work from its lower to upper environment to make the solution available for its customers.

Solution

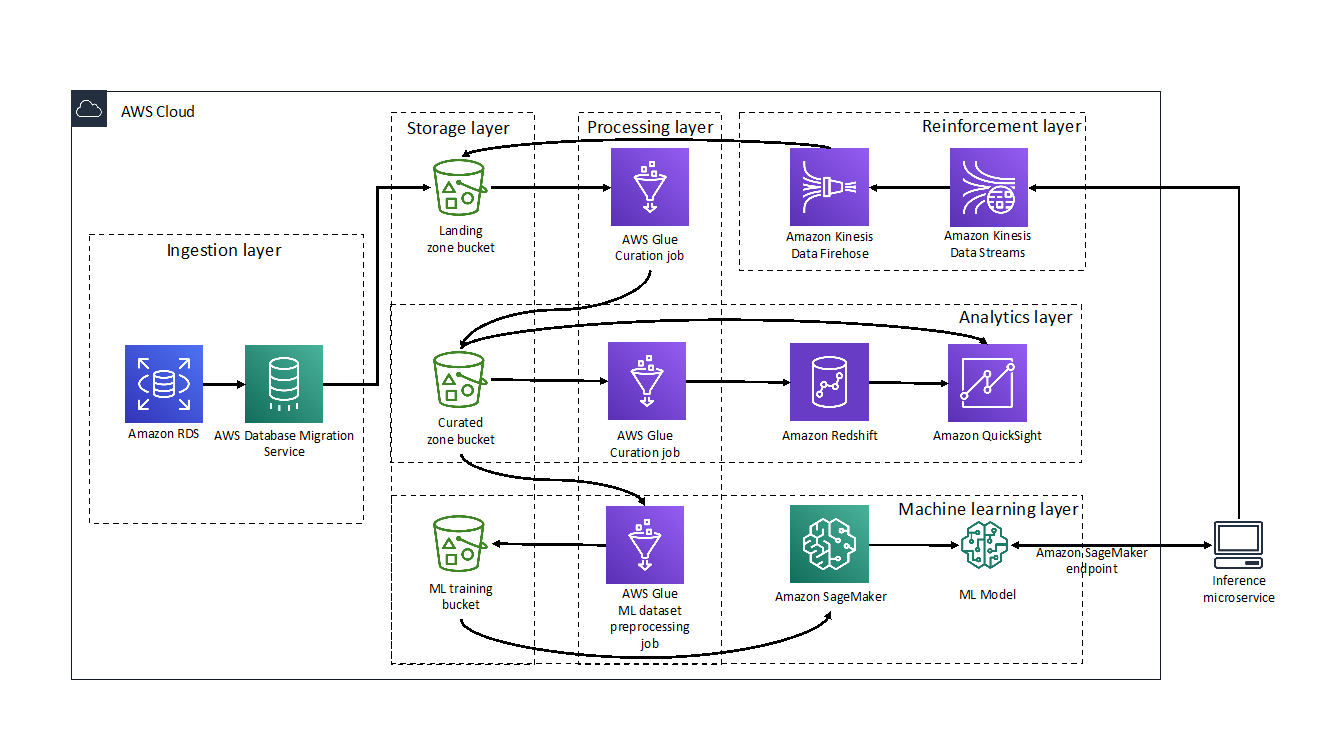
For this solution, MEDHOST and AWS built a layered pipeline consisting of ingestion, processing, storage, analytics, machine learning, and reinforcement components. The following diagram illustrates the Proof of Concept (POC) that was implemented during the four-day AWS Data Lab engagement.

Ingestion layer

The ingestion layer is responsible for moving data from hospital production databases to the landing zone of the pipeline.

The hospital data was stored in an Amazon RDS for PostgreSQL instance and moved to the landing zone of the data lake using AWS Database Migration Service (DMS). DMS made migrating databases to the cloud simple and secure. Using its ongoing replication feature, MEDHOST and AWS implemented change data capture (CDC) quickly and efficiently so MEDHOST team could spend more time focusing on the most interesting parts of the pipeline.

Processing layer

The processing layer was responsible for performing extract, tranform, load (ETL) on the data to curate them for subsequent uses.

MEDHOST used AWS Glue within its data pipeline for crawling its data layers and performing ETL tasks. The hospital data copied from RDS to Amazon S3 was cleaned, curated, enriched, denormalized, and stored in parquet format to act as the heart of the MEDHOST data lake and a single source of truth to serve any further data needs. During the four-day Data Lab, MEDHOST and AWS targeted two needs: powering MEDHOST’s data warehouse used for analytics and feeding training data to the machine learning prediction model. Even though there were multiple challenges, data curation is a critical task which requires an SME. AWS Glue’s serverless nature, along with the SME’s support during the Data Lab, made developing the required transformations cost efficient and uncomplicated. Scaling and cluster management was addressed by the service, which allowed the developers to focus on cleaning data coming from homogenous hospital sources and translating the business logic to code.

Storage layer

The storage layer provided low-cost, secure, and efficient storage infrastructure.

MEDHOST used Amazon S3 as a core component of its data lake. AWS DMS migration tasks saved data to S3 in .CSV format. Crawling data with AWS Glue made this landing zone data queryable and available for further processing. The initial AWS Glue ETL job stored the parquet formatted data to the data lake and its curated zone bucket. MEDHOST also used S3 to store the .CSV formatted data set that will be used to train, test, and validate its machine learning prediction model.

Analytics layer

The analytics layer gave MEDHOST pipeline reporting and dashboarding capabilities.

The data was in parquet format and partitioned in the curation zone bucket populated by the processing layer. This made querying with Amazon Athena or Amazon Redshift Spectrum fast and cost efficient.

From the Amazon Redshift cluster, MEDHOST created external tables that were used as staging tables for MEDHOST data warehouse and implemented an UPSERT logic to merge new data in its production tables. To showcase the reporting potential that was unlocked by the MEDHOST analytics layer, a connection was made to the Redshift cluster to Amazon QuickSight. Within minutes MEDHOST was able to create interactive analytics dashboards with filtering and drill-down capabilities such as a chart that showed the number of confirmed disease cases per US state.

Machine learning layer

The machine learning layer used MEDHOST’s existing data sets to train its cardiac risk prediction model and make it accessible via an endpoint.

Before getting into Data Lab, the MEDHOST team was not intimately familiar with machine learning. AWS Data Lab architects helped MEDHOST quickly understand concepts of machine learning and select a model appropriate for its use case. MEDHOST selected XGBoost as its model since cardiac prediction falls within regression technique. MEDHOST’s well architected data lake enabled it to quickly generate training, testing, and validation data sets using AWS Glue.

Amazon SageMaker abstracted underlying complexity of setting infrastructure for machine learning. With few clicks, MEDHOST started Jupyter notebook and coded the components leading to fitting and deploying its machine learning prediction model. Finally, MEDHOST created the endpoint for the model and ran REST calls to validate the endpoint and trained model. As a result, MEDHOST achieved the goal of predicting cardiac risk. Additionally, with Amazon QuickSight’s SageMaker integration, AWS made it easy to use SageMaker models directly in visualizations. QuickSight can call the model’s endpoint, send the input data to it, and put the inference results into the existing QuickSight data sets. This capability made it easy to display the results of the models directly in the dashboards. Read more about QuickSight’s SageMaker integration here.

Reinforcement layer

Finally, the reinforcement layer guaranteed that the results of the MEDHOST model were captured and processed to improve performance of the model.

The MEDHOST team went beyond the original goal and created an inference microservice to interact with the endpoint for prediction, enabled abstracting of the machine learning endpoint with the well-defined domain REST endpoint, and added a standard security layer to the MEDHOST application.

When there is a real-time call from the facility, the inference microservice gets inference from the SageMaker endpoint. Records containing input and inference data are fed to the data pipeline again. MEDHOST used Amazon Kinesis Data Streams to push records in real time. However, since retraining the machine learning model does not need to happen in real time, the Amazon Kinesis Data Firehose enabled MEDHOST to micro-batch records and efficiently save them to the landing zone bucket so that the data could be reprocessed.

Conclusion

Collaborating with AWS Data Lab enabled MEDHOST to:

  • Store single source of truth with low-cost storage solution (data lake)
  • Complete data pipeline for a low-cost data analytics solution
  • Create an almost production-ready code for cardiac risk prediction

The MEDHOST team learned many concepts related to data analytics and machine learning within four days. AWS Data Lab truly helped MEDHOST deliver results in an accelerated manner.


About the Authors

Pandian Velayutham is the Director of Engineering at MEDHOST. His team is responsible for delivering cloud solutions, integration and interoperability, and business analytics solutions. MEDHOST utilizes modern technology stack to provide innovative solutions to our customers. Pandian Velayutham is a technology evangelist and public cloud technology speaker.


George Komninos is a Data Lab Solutions Architect at AWS. He helps customers convert their ideas to a production-ready data product. Before AWS, he spent 3 years at Alexa Information domain as a data engineer. Outside of work, George is a football fan and supports the greatest team in the world, Olympiacos Piraeus.

Field Notes: Building an automated scene detection pipeline for Autonomous Driving – ADAS Workflow

Post Syndicated from Kevin Soucy original https://aws.amazon.com/blogs/architecture/field-notes-building-an-automated-scene-detection-pipeline-for-autonomous-driving/

This Field Notes blog post in 2020 explains how to build an Autonomous Driving Data Lake using this Reference Architecture. Many organizations face the challenge of ingesting, transforming, labeling, and cataloging massive amounts of data to develop automated driving systems. In this re:Invent session, we explored an architecture to solve this problem using Amazon EMR, Amazon S3, Amazon SageMaker Ground Truth, and more. You learn how BMW Group collects 1 billion+ km of anonymized perception data from its worldwide connected fleet of customer vehicles to develop safe and performant automated driving systems.

Architecture Overview

The objective of this post is to describe how to design and build an end-to-end Scene Detection pipeline which:

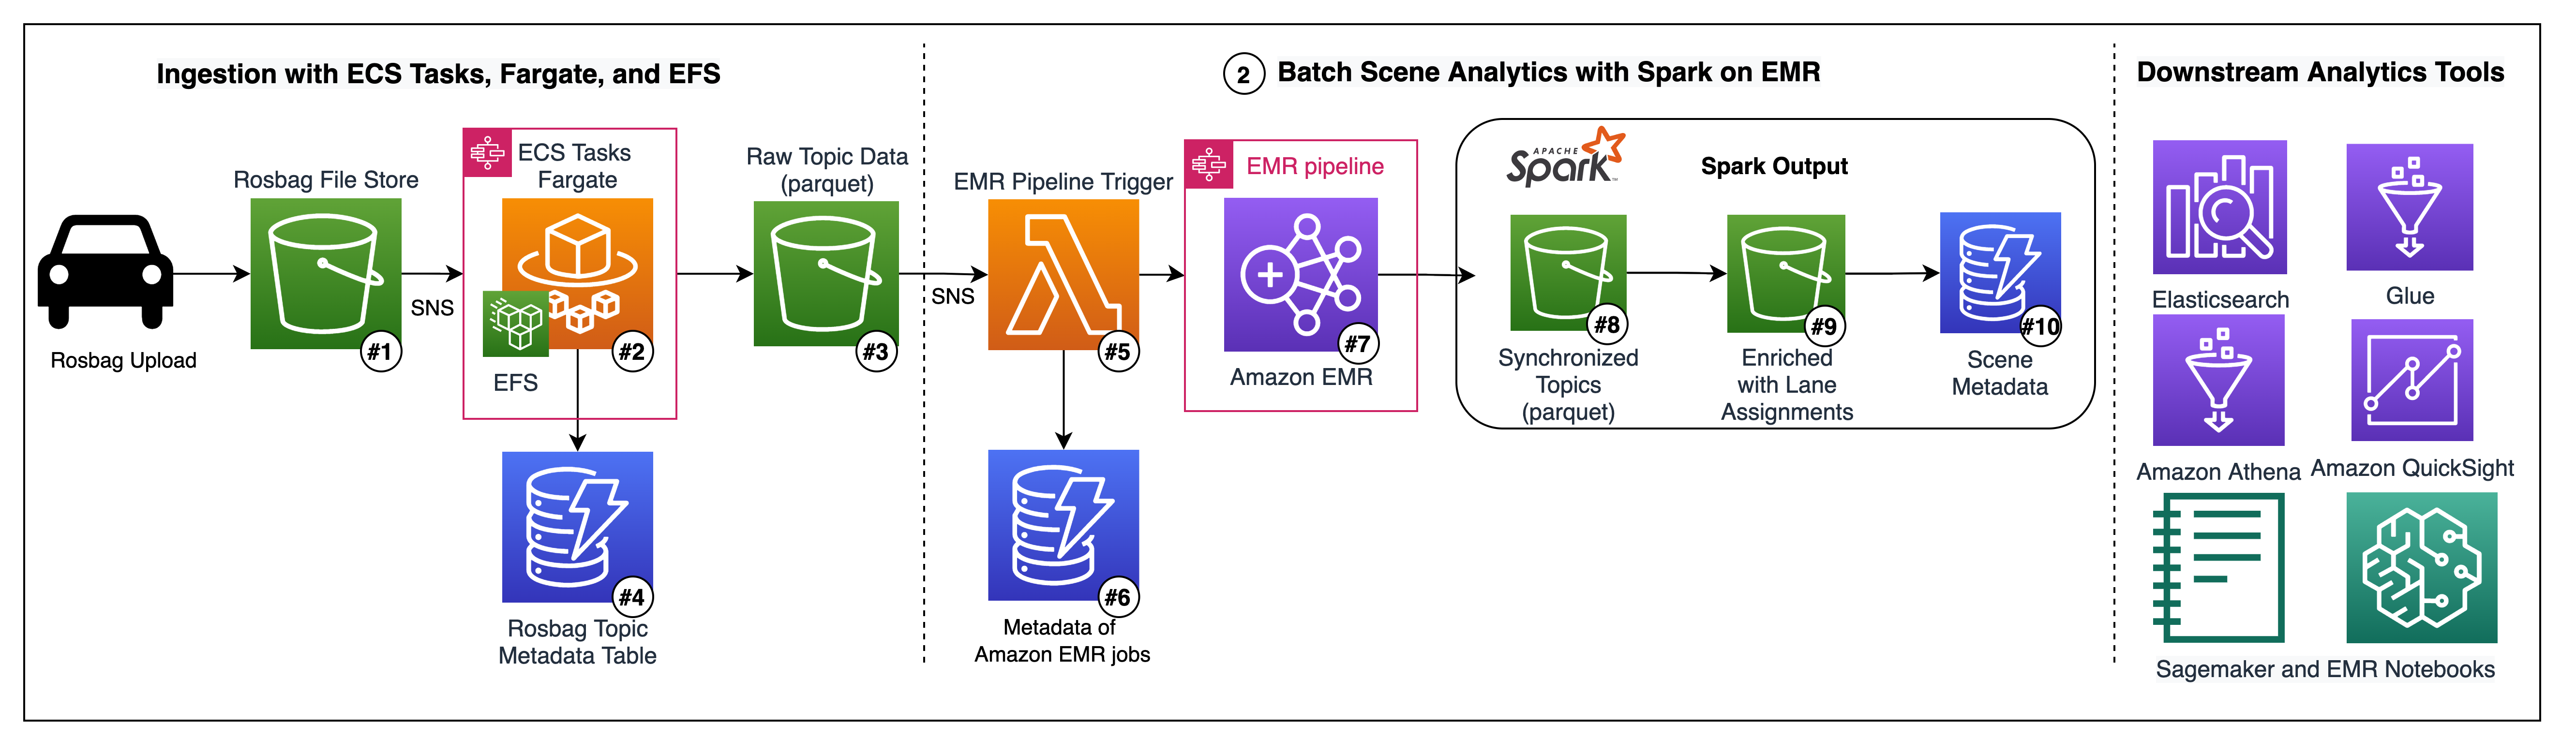
This architecture integrates an event-driven ROS bag ingestion pipeline running Docker containers on Elastic Container Service (ECS). This includes a scalable batch processing pipeline based on Amazon EMR and Spark. The solution also leverages AWS Fargate, Spot Instances, Elastic File System, AWS Glue, S3, and Amazon Athena.

reference architecture - build automated scene detection pipeline - Autonomous Driving

Figure 1 – Architecture Showing how to build an automated scene detection pipeline for Autonomous Driving

The data included in this demo was produced by one vehicle across four different drives in the United States. As the ROS bag files produced by the vehicle’s on-board software contains very complex data, such as Lidar Point Clouds, the files are usually very large (1+TB files are not uncommon).

These files usually need to be split into smaller chunks before being processed, as is the case in this demo. These files also may need to have post-processing algorithms applied to them, like lane detection or object detection.

In our case, the ROS bag files are split into approximately 10GB chunks and include topics for post-processed lane detections before they land in our S3 bucket. Our scene detection algorithm assumes the post processing has already been completed. The bag files include object detections with bounding boxes, and lane points representing the detected outline of the lanes.

Prerequisites

This post uses an AWS Cloud Development Kit (CDK) stack written in Python. You should follow the instructions in the AWS CDK Getting Started guide to set up your environment so you are ready to begin.

You can also use the config.json to customize the names of your infrastructure items, to set the sizing of your EMR cluster, and to customize the ROS bag topics to be extracted.

You will also need to be authenticated into an AWS account with permissions to deploy resources before executing the deploy script.

Deployment

The full pipeline can be deployed with one command: * `bash deploy.sh deploy true` . The progress of the deployment can be followed on the command line, but also in the CloudFormation section of the AWS console. Once deployed, the user must upload 2 or more bag files to the rosbag-ingest bucket to initiate the pipeline.

The default configuration requires two bag files to be processed before an EMR Pipeline is initiated. You would also have to manually initiate the AWS  Glue Crawler to be able to explore the parquet data with tools like Athena or Quicksight.

ROS bag ingestion with ECS Tasks, Fargate, and EFS

This solution provides an end-to-end scene detection pipeline for ROS bag files, ingesting the ROS bag files from S3, and transforming the topic data to perform scene detection in PySpark on EMR. This then exposes scene descriptions via DynamoDB to downstream consumers.

The pipeline starts with an S3 bucket (Figure 1 – #1) where incoming ROS bag files can be uploaded from local copy stations as needed. We recommend, using Amazon Direct Connect for a private, high-throughout connection to the cloud.

This ingestion bucket is configured to initiate S3 notifications each time an object ending in the prefix “.bag” is created. An AWS Lambda function then initiates a Step Function for orchestrating the ECS Task. This passes the bucket and bag file prefix to the ECS task as environment variables in the container.

The ECS Task (Figure 1 – #2) runs serverless leveraging Fargate as the capacity provider, This avoids the need to provision and autoscale EC2 instances in the ECS cluster. Each ECS Task processes exactly one bag file. We use Elastic FileStore to provide virtually unlimited file storage to the container, in order to easily work with larger bag files. The container uses the open-source bagpy python library to extract structured topic data (for example, GPS, detections, inertial measurement data,). The topic data is uploaded as parquet files to S3, partitioned by topic and source bag file. The application writes metadata about each file, such as the topic names found in the file and the number of messages per topic, to a DynamoDB table (Figure 1 – #4).

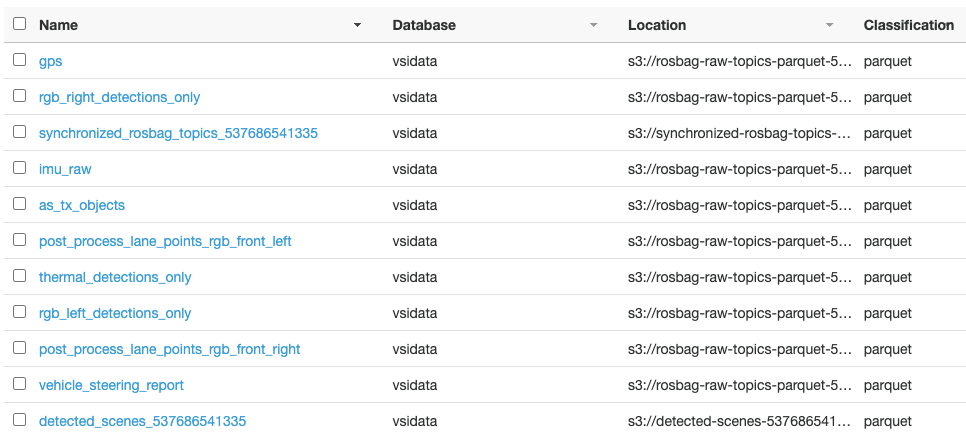
This module deploys an AWS  Glue Crawler configured to crawl this bucket of topic parquet files. These files populate the AWS Glue Catalog with the schemas of each topic table and make this data accessible in Athena, Glue jobs, Quicksight, and Spark on EMR.  We use the AWS Glue Catalog (Figure 1 – #5) as a permanent Hive Metastore.

Glue Data Catalog of parquet datasets on S3

Figure 2 – Glue Data Catalog of parquet datasets on S3


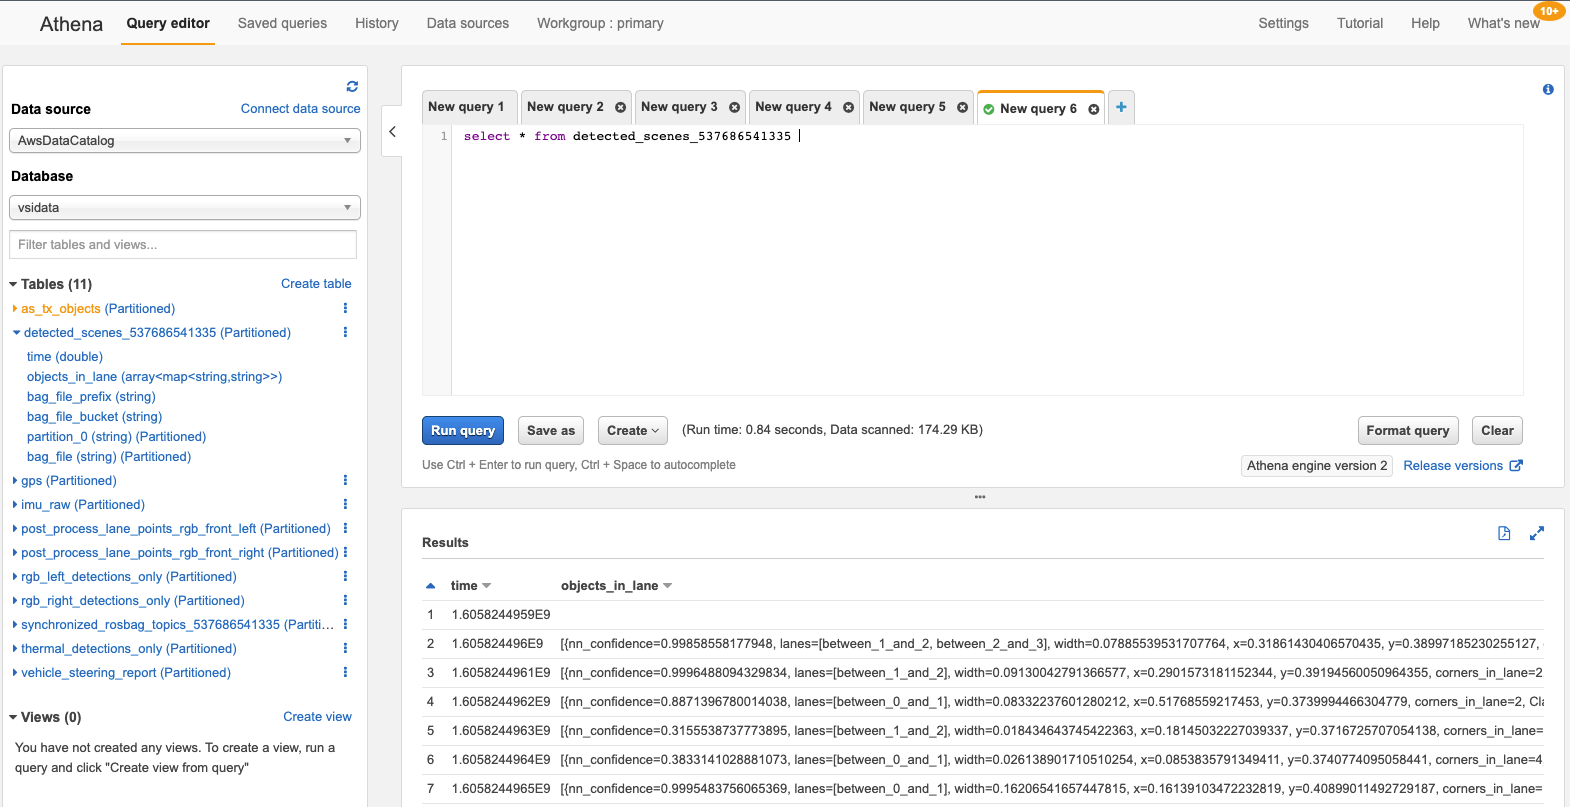
Run ad-hoc queries against the Glue tables using Amazon Athena

Figure 3 – Run ad-hoc queries against the Glue tables using Amazon Athena

The topic parquet bucket also has an S3 Notification configured for all newly created objects, which is consumed by an EMR-Trigger Lambda (Figure 1 – #5). This Lambda function is responsible for keeping track of bag files and their respective parquet files in DynamoDB (Figure 1 – #6). Once in DynamoDB, bag files are assigned to batches, initiating the EMR batch processing step function. Metadata is stored about each batch including the step function execution ARN in DynamoDB.

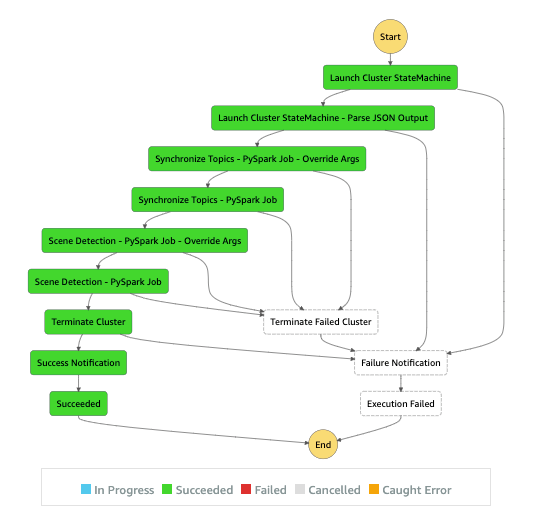
EMR pipeline orchestration with AWS Step Functions

Figure 4 – EMR pipeline orchestration with AWS Step Functions

The EMR batch processing step function (Figure 1 – #7) orchestrates the entire EMR pipeline, from provisioning an EMR cluster using the open-source EMR-Launch CDK library to submitting Pyspark steps to the cluster, to terminating the cluster and handling failures.

Batch Scene Analytics with Spark on EMR

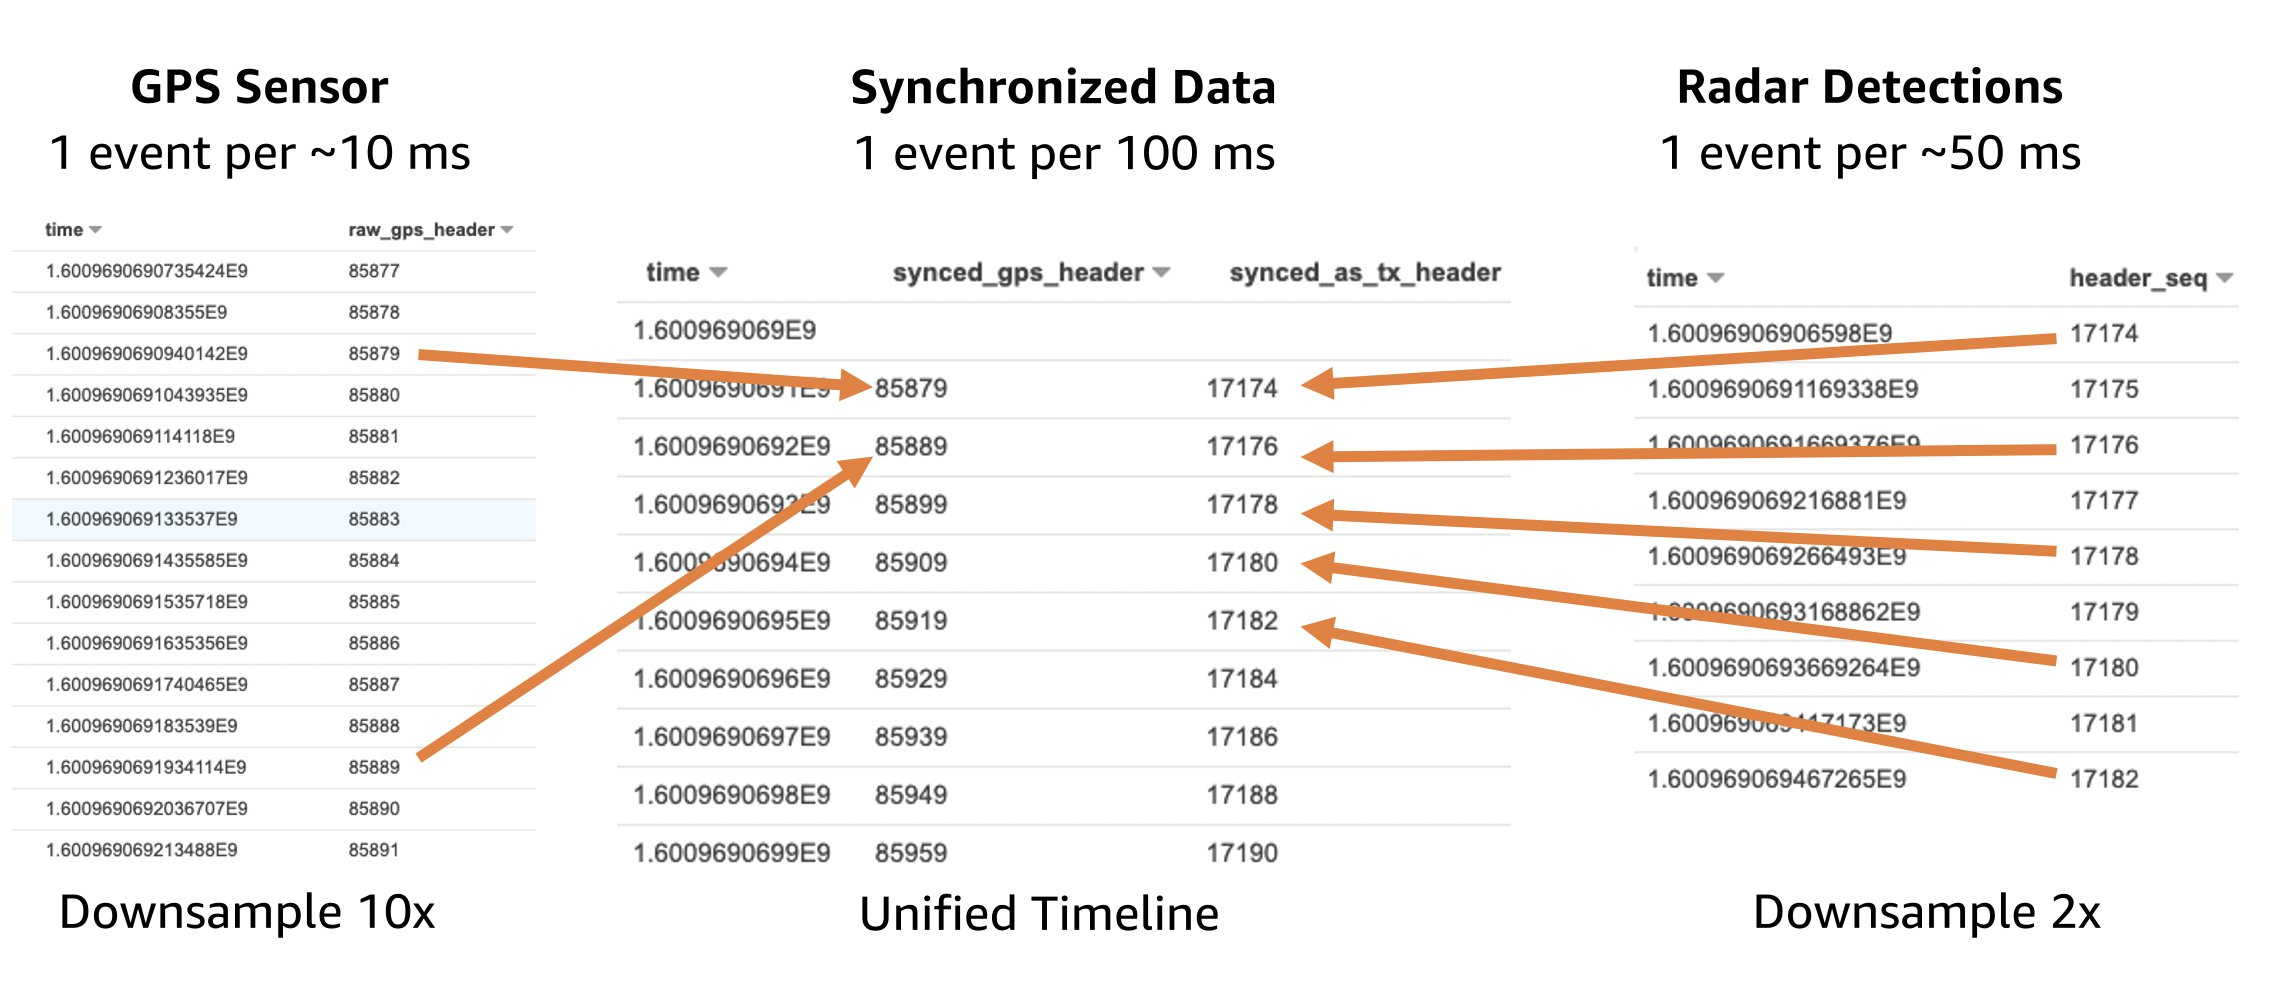
There are two PySpark applications running on our cluster. The first performs synchronization of ROS bag topics for each bagfile. As the various sensors in the vehicle have different frequencies, we synchronize the various frequencies to a uniform frequency of 1 signal per 100 ms per sensor. This makes it easier to work with the data.

We compute the minimum and maximum timestamp in each bag file, and construct a unified timeline. For each 100 ms we take the most recent signal per sensor and assign it to the 100 ms timestamp. After this is performed, the data looks more like a normal relational table and is easier to query and analyze.

Batch Scene Analytics with Spark on EMR

Figure 5 – Batch Scene Analytics with Spark on EMR

Scene Detection and Labeling in PySpark

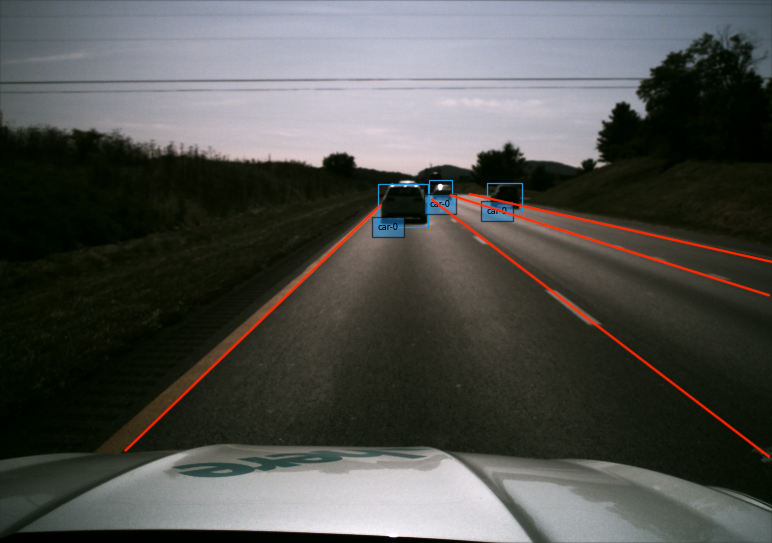
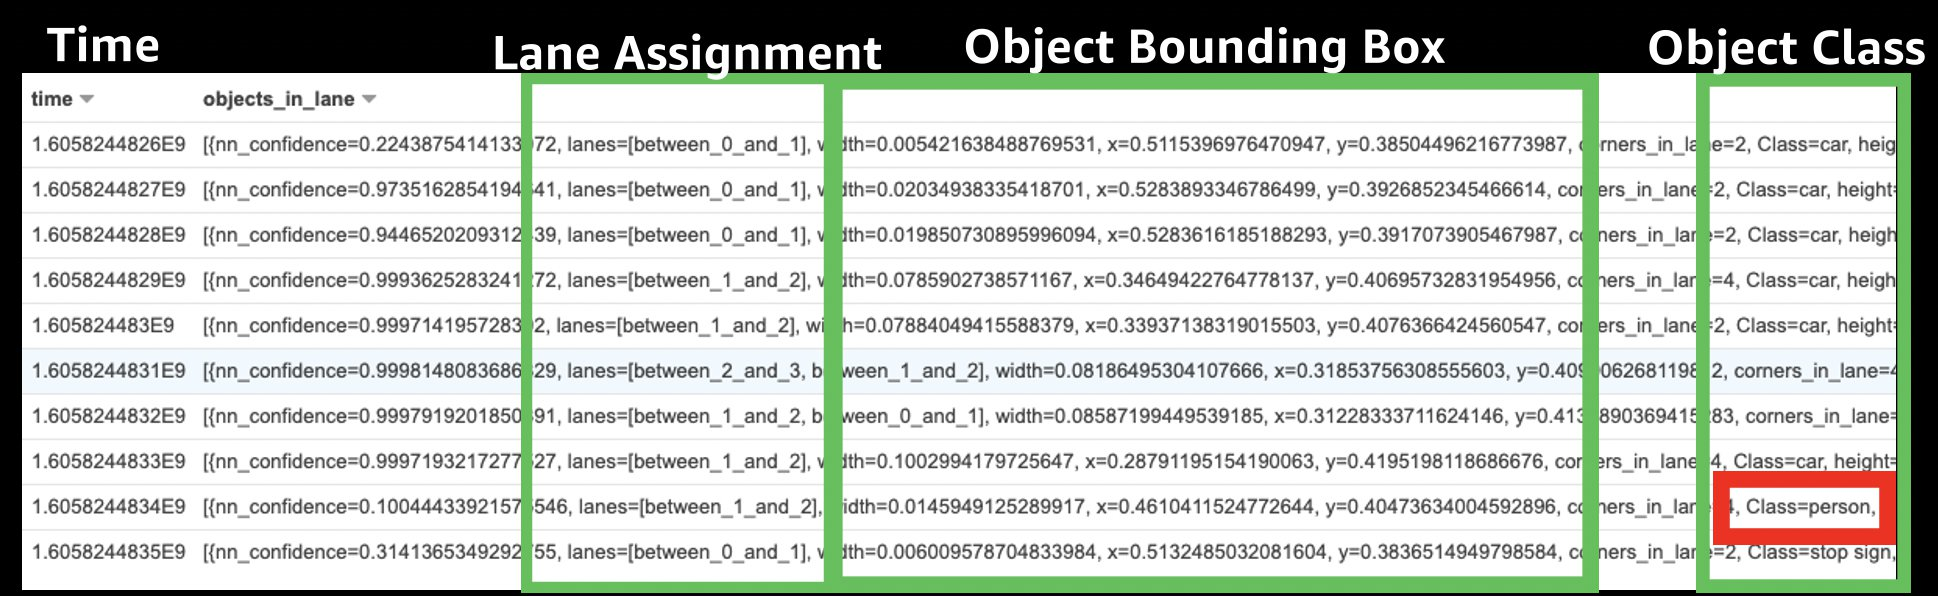
The second spark application enriches the synchronized topic dataset (Figure 1 – #8), analyzing the detected lane points and the object detections. The goal is to perform a simple lane assignment algorithm for objects detected by the on-board ML models and to save this enriched dataset (Figure 1 – #9) back to S3 for easy-access by analysts and data scientists.

Object Lane Assignment Example

Figure 9 – Object Lane Assignment example


Synchronized topics enriched with object lane assignments

Figure 9 – Synchronized topics enriched with object lane assignments

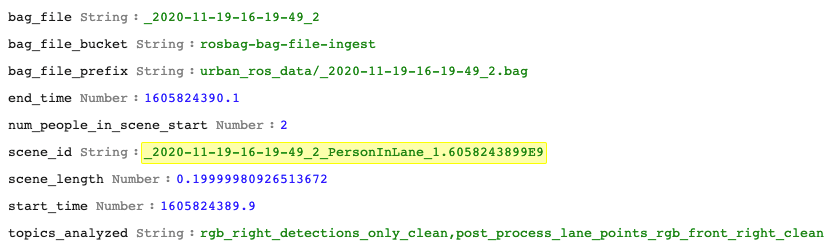
Finally, the last step takes this enriched dataset (Figure 1 – #9) to summarize specific scenes or sequences where a person was identified as being in a lane. The output of this pipeline includes two new tables as parquet files on S3 – the synchronized topic dataset (Figure 1 – #8) and the synchronized topic dataset enriched with object lane assignments (Figure 1 – #9), as well as a DynamoDB table with scene metadata for all person-in-lane scenarios (Figure 1 – #10).

Scene Metadata

The Scene Metadata DynamoDB table (Figure 1 – #10) can be queried directly to find sequences of events, as will be covered in a follow up post for visually debugging scene detection algorithms using WebViz/RViz. Using WebViz, we were able to detect that the on-board object detection model labels Crosswalks and Walking Signs as “person” even when a person is not crossing the street, for example:

Example DynamoDB item from the Scene Metadata table

Example DynamoDB item from the Scene Metadata table

Figure 10 – Example DynamoDB item from the Scene Metadata table

These scene descriptions can also be converted to Open Scenario format and pushed to an ElasticSearch cluster to support more complex scenario-based searches. For example, downstream simulation use cases or for visualization in QuickSight. An example of syncing DynamoDB tables to ElasticSearch using DynamoDB streams and Lambda can be found here (https://aws.amazon.com/blogs/compute/indexing-amazon-dynamodb-content-with-amazon-elasticsearch-service-using-aws-lambda/). As DynamoDB is a NoSQL data store, we can enrich the Scene Metadata table with scene parameters. For example, we can identify the maximum or minimum speed of the car during the identified event sequence, without worrying about breaking schema changes. It is also straightforward to save a dataframe from PySpark to DynamoDB using open-source libraries.

As a final note, the modules are built to be exactly that, modular. The three modules that are easily isolated are:

  1. the ECS Task pipeline for extracting ROS bag topic data to parquet files
  2. the EMR Trigger Lambda for tracking incoming files, creating batches, and initiating a batch processing step function
  3. the EMR Pipeline for running PySpark applications leveraging Step Functions and EMR Launch

Clean Up

To clean up the deployment, you can run bash deploy.sh destroy false. Some resources like S3 buckets and DynamoDB tables may have to be manually emptied and deleted via the console to be fully removed.

Limitations

The bagpy library used in this pipeline does not yet support complex or non-structured data types like images or LIDAR data. Therefore its usage is limited to data that can be stored in a tabular csv format before being converted to parquet.

Conclusion

In this post, we showed how to build an end-to-end Scene Detection pipeline at scale on AWS to perform scene analytics and scenario detection with Spark on EMR from raw vehicle sensor data. In a subsequent blog post, we will cover how how to extract and catalog images from ROS bag files, create a labelling job with SageMaker GroundTruth and then train a Machine Learning Model to detect cars.

Recommended Reading: Field Notes: Building an Autonomous Driving and ADAS Data Lake on AWS

Amazon HealthLake Stores, Transforms, and Analyzes Health Data in the Cloud

Post Syndicated from Harunobu Kameda original https://aws.amazon.com/blogs/aws/new-amazon-healthlake-to-store-transform-and-analyze-petabytes-of-health-and-life-sciences-data-in-the-cloud/

Healthcare organizations collect vast amounts of patient information every day, from family history and clinical observations to diagnoses and medications. They use all this data to try to compile a complete picture of a patient’s health information in order to provide better healthcare services. Currently, this data is distributed across various systems (electronic medical records, laboratory systems, medical image repositories, etc.) and exists in dozens of incompatible formats.

Emerging standards, such as Fast Healthcare Interoperability Resources (FHIR), aim to address this challenge by providing a consistent format for describing and exchanging structured data across these systems. However, much of this data is unstructured information contained in medical records (e.g., clinical records), documents (e.g., PDF lab reports), forms (e.g., insurance claims), images (e.g., X-rays, MRIs), audio (e.g., recorded conversations), and time series data (e.g., heart electrocardiogram) and it is challenging to extract this information.

It can take weeks or months for a healthcare organization to collect all this data and prepare it for transformation (tagging and indexing), structuring, and analysis. Furthermore, the cost and operational complexity of doing all this work is prohibitive for most healthcare organizations.

Many data to analyze

Today, we are happy to announce Amazon HealthLake, a fully managed, HIPAA-eligible service, now in preview, that allows healthcare and life sciences customers to aggregate their health information from different silos and formats into a centralized AWS data lake. HealthLake uses machine learning (ML) models to normalize health data and automatically understand and extract meaningful medical information from the data so all this information can be easily searched. Then, customers can query and analyze the data to understand relationships, identify trends, and make predictions.

How It Works
Amazon HealthLake supports copying your data from on premises to the AWS Cloud, where you can store your structured data (like lab results) as well as unstructured data (like clinical notes), which HealthLake will tag and structure in FHIR. All the data is fully indexed using standard medical terms so you can quickly and easily query, search, analyze, and update all of your customers’ health information.

Overview of HealthLake

With HealthLake, healthcare organizations can collect and transform patient health information in minutes and have a complete view of a patients medical history, structured in the FHIR industry standard format with powerful search and query capabilities.

From the AWS Management Console, healthcare organizations can use the HealthLake API to copy their on-premises healthcare data to a secure data lake in AWS with just a few clicks. If your source system is not configured to send data in FHIR format, you can use a list of AWS partners to easily connect and convert your legacy healthcare data format to FHIR.

HealthLake is Powered by Machine Learning
HealthLake uses specialized ML models such as natural language processing (NLP) to automatically transform raw data. These models are trained to understand and extract meaningful information from unstructured health data.

For example, HealthLake can accurately identify patient information from medical histories, physician notes, and medical imaging reports. It then provides the ability to tag, index, and structure the transformed data to make it searchable by standard terms such as medical condition, diagnosis, medication, and treatment.

Queries on tens of thousands of patient records are very simple. For example, a healthcare organization can create a list of diabetic patients based on similarity of medications by selecting “diabetes” from the standard list of medical conditions, selecting “oral medications” from the treatment menu, and refining the gender and search.

Healthcare organizations can use Juypter Notebook templates in Amazon SageMaker to quickly and easily run analysis on the normalized data for common tasks like diagnosis predictions, hospital re-admittance probability, and operating room utilization forecasts. These models can, for example, help healthcare organizations predict the onset of disease. With just a few clicks in a pre-built notebook, healthcare organizations can apply ML to their historical data and predict when a diabetic patient will develop hypertension in the next five years. Operators can also build, train, and deploy their own ML models on data using Amazon SageMaker directly from the AWS management console.

Let’s Create Your Own Data Store and Start to Test
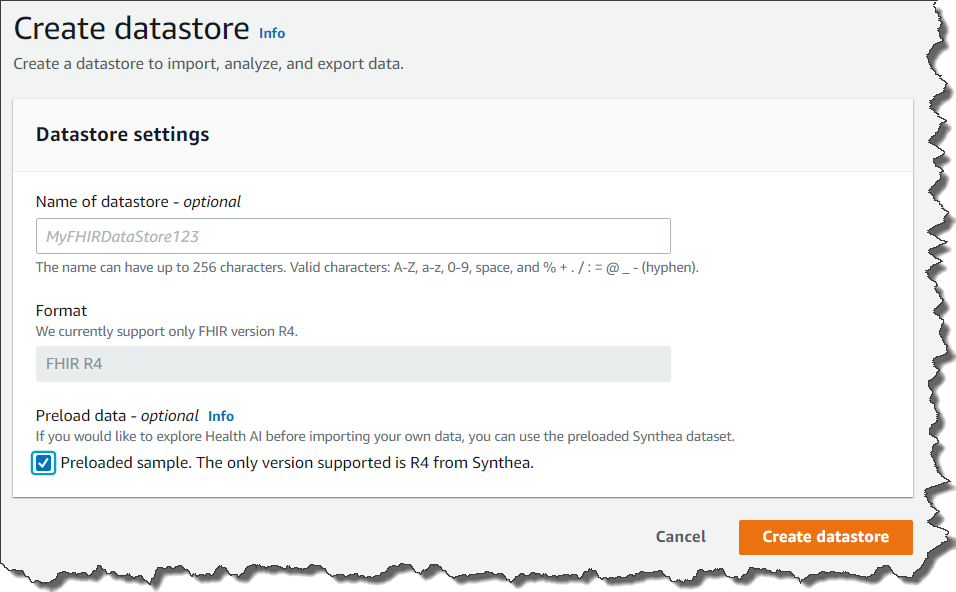
Starting to use HealthLake is simple. You access AWS Management Console, and click select Create a datastore.

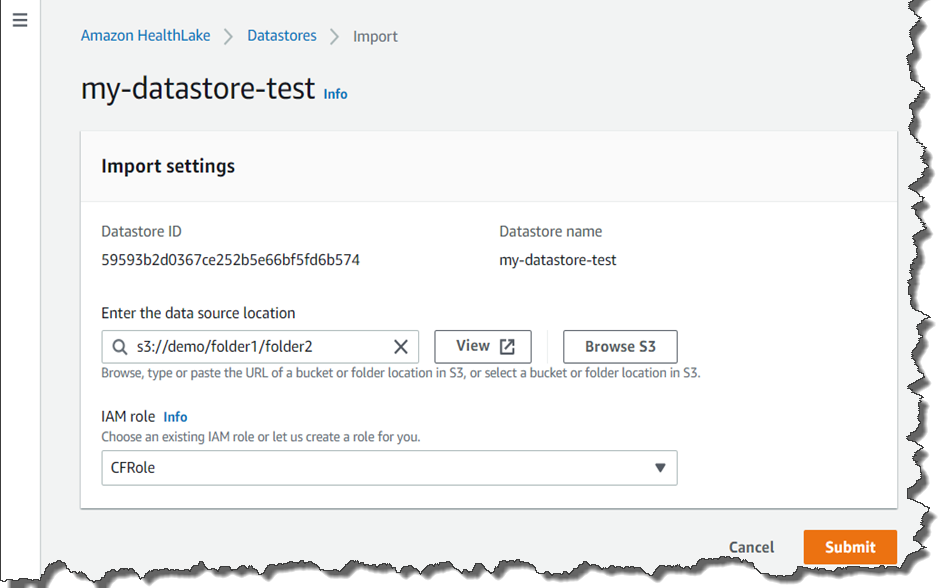
If you click Preload data, HealthLake will load test data and you can start to test its features. You can also upload your own data if you already have FHIR 4 compliant data. You upload it to S3 buckets, and import it to set its bucket name.

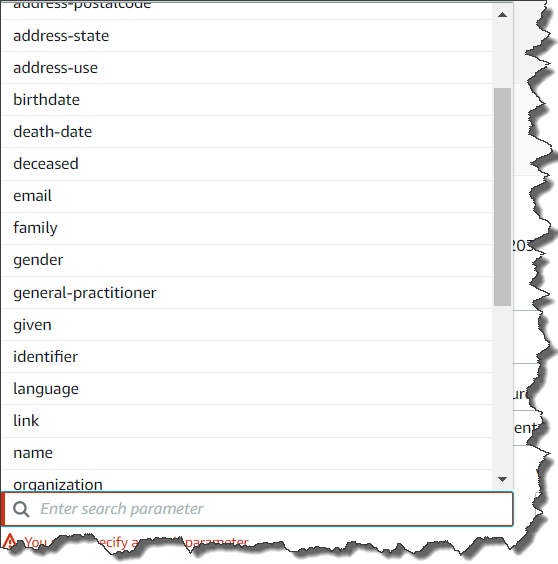
Once your Data Store is created, you can perform a Search, Create, Read, Update or Delete FHIR Query Operation. For example, if you need a list of every patient located in New York, your query setting looks like the screenshots below. As per the FHIR specification, deleted data is only hidden from analysis and results; it is not deleted from the service, only versioned.

Creating Query


You can choose Add search parameter for more nested conditions of the query as shown below.

Amazon HealthLake is Now in Preview
Amazon HealthLake is in preview starting today in US East (N. Virginia). Please check our web site and technical documentation for more information.

– Kame