Tag Archives: Amazon Kinesis Data Firehose

Streaming CloudWatch metrics to VPC-based OpenTelemetry collectors using Lambda

Post Syndicated from Behzad Dastur original https://aws.amazon.com/blogs/architecture/streaming-cloudwatch-metrics-to-vpc-based-opentelemetry-collectors-using-lambda/

Organizations are increasingly drawn to open-source observability frameworks like OpenTelemetry. They seek to reduce costs associated with third-party licensing and avoid vendor lock-in. Combining OpenTelemetry collectors with Amazon CloudWatch Metric Streams helps enterprises pursue their observability goals while eliminating third-party licensing fees and achieving sub-minute latency for real-time alerting. CloudWatch Metric Streams offer built-in support for publishing to OpenTelemetry endpoints, but organizations that self-host OpenTelemetry collectors within their VPC need a way to bridge the gap between metric streams and internal HTTP endpoints.

In this post, we demonstrate an approach we used to address this challenge for a customer by implementing an AWS Lambda transformation function that streams Amazon CloudWatch metrics directly to internal OpenTelemetry collectors running within a VPC.

Common observability challenges overcome with OpenTelemetry

Traditional monitoring becomes expensive and difficult to manage as cloud infrastructure grows. Many enterprises face a choice between expensive third-party observability solutions and the technical limitations of legacy metric collection methods. When organizations adopt cloud-native solutions and transition from monolithic applications to microservices, metric collection for observability becomes even more important.

Many operations and development teams face the challenge of building monitoring solutions that include tools and frameworks from different vendors and open-source projects, with different specifications and protocols, resulting in complex and fragmented landscape that’s difficult to maintain. OpenTelemetry is becoming the primary way to implement observability for many organizations. OpenTelemetry is an open-source framework for collecting traces, metrics, and logs. It works with any observability platform. Amazon CloudWatch, the AWS monitoring service, provides an open source distribution of OpenTelemetry called AWS Distro for OpenTelemetry to help you get started with OpenTelemetry. OpenTelemetry gained industry adoption primarily because of the standardization it provides enterprises through the following benefits:

  • Single set of APIs and libraries to capture distributed traces and metrics that can be sent to any observability platform
  • Future-proofing by avoiding vendor lock-in and enabling flexibility in choosing observability backends
  • Broad vendor support because it is open sourced and natively supported by numerous vendors

Pull vs push-based monitoring architecture

In a pull model like Prometheus, the monitoring server periodically scrapes metrics from endpoints. Although this model provides more control over query frequency, it runs into challenges at scale. Our customer’s current monitoring solution with Prometheus and Amazon CloudWatch exporter using a pull-based approach resulted in higher API throttling. This caused metric loss and created gaps in observability data for business-critical systems. The frequent polling approach in this model also resulted in higher costs from API calls. This polling solution did not satisfy their requirement of sub-minute latency for real-time alerting.

To overcome these challenges, we recommend a push–based architecture. The push-based solution, using CloudWatch Metric Streams to push metrics to OpenTelemetry collector, addresses these challenges by reducing frequent polling and API calls, enabling near real-time data transmission, and potentially eliminating licensing costs from using third-party solutions. Using OpenTelemetry’s push-based model, enterprise applications can send telemetry (traces, metrics, logs) to a collector or backend that offers significant benefits for real-time observability, such as:

  • Event-driven architecture: The push approach transmits data in near real-time by triggering collection based on events, not periodic polling. This is particularly valuable when using OpenTelemetry collectors that can push metrics to multiple services like Amazon Managed Prometheus (AMP), AWS X-Ray, Amazon CloudWatch, and Amazon OpenSearch.
  • Cost efficiency: Push models are significantly more cost-effective than pull models. Instead of continuously scanning large datasets, systems only process and transmit data when relevant events occur, reducing both computational overhead and data transfer costs.
  • Scalability: The OpenTelemetry collector serves as a central hub that can scale horizontally to handle varying traffic volumes while providing at-least-once delivery guarantees with automatic retry mechanisms.
  • No licensing costs: The Apache 2.0 license is free and royalty-free, meaning you can use, modify, and distribute OpenTelemetry without any licensing fees or ongoing costs.
  • No vendor lock-in: The permissive nature of Apache 2.0 means you’re not tied to any specific vendor’s implementation or support model. You can modify the code, switch between different OpenTelemetry distributions (like AWS Distro for OpenTelemetry), or even fork the project if needed.

How we built a scalable push-based observability solution

Our solution involves configuring an Amazon Data Firehose stream, that receives Amazon CloudWatch metrics and sends them to an OpenTelemetry collector within our customer’s VPC. Because of their strict data privacy requirements, our customer required the metric data and the OpenTelemetry collector to be within their VPC. A Network Load Balancer (NLB) serves as the internal endpoint to receive metric streams. Amazon Data Firehose natively supports data delivery to HTTP endpoints, but these endpoints must be public – they cannot be private endpoints inside a VPC. To overcome this limitation, we use the Amazon Data Firehose transform configuration, that invokes a Lambda function synchronously, which then securely pushes the metrics through the NLB endpoint to the collector running within the VPC. With this solution our customer could then aggregate and display all their metrics from AWS, other accounts, and on-prem systems in a single pane of glass dashboard.

The following diagram shows the architectural blocks of the solution:
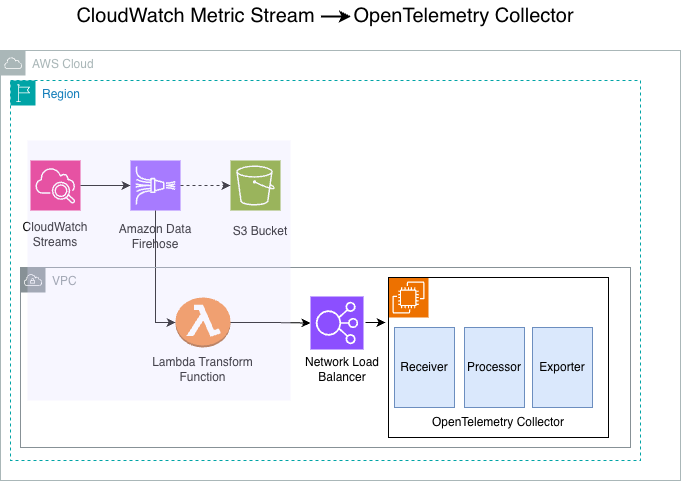
Figure 1: Reference architecture for the Amazon CloudWatch Streams to OpenTelemetry collector solution

The solution consists of 4 main components – CloudWatch Metric Streams, Amazon Data Firehose, AWS Lambda, and the OpenTelemetry collector.

  1. CloudWatch metric streams: CloudWatch Metric streams enables you to stream CloudWatch metrics in near real-time, with minimal setup and without writing code. In this architecture, CloudWatch streams metrics to our configured Amazon Data Firehose stream. With CloudWatch Metric Streams, you can stream metrics in OpenTelemetry 0.7, 1.0, and JSON formats. This architecture uses JSON format as the stream output.
  2. Amazon Data Firehose stream: A fully managed service that reliably captures, transforms, and delivers real-time streaming data to the customer’s internal endpoint.
  3. Lambda transform function: Amazon Data Firehose supports Lambda-based data transformation that allows you to preprocess, enrich, filter, or modify streaming data before delivery to destinations. Because Firehose cannot deliver metrics directly to private VPC endpoints, we use Firehose’s data transformation feature with Lambda to bridge this gap and deliver metrics to internal endpoints. Amazon Data Firehose buffers incoming data before synchronously invoking the Lambda function that streams the metrics to the internal HTTP endpoint.
  4. The OpenTelemetry collector: In this solution, the OpenTelemetry collector runs as a container in an EC2 instance. The collector is a central hub that receives, processes, and forwards telemetry data (metrics, traces, and logs) from various sources to multiple destinations in a vendor-neutral way. The OpenTelemetry collector operates through three primary components that work together in a processing flow: Receivers accept data in specified formats (like Prometheus or OpenTelemetry Protocol (OTLP)) and translate it into OpenTelemetry’s internal format; Processors manipulate and enrich the data as it flows through (filtering unnecessary data, batching for performance, transforming to mask sensitive information, or adding metadata like Kubernetes attributes); and Exporters send the processed data to destination backends such as Grafana Cloud, AWS X-Ray, Lightstep or Honeycomb.

The reference architecture also shows the following components:

  1. Amazon Simple Storage Service (Amazon S3) bucket: The S3 bucket is a redundant destination for the CloudWatch Streams. Because our Lambda transform function sends the data directly to OpenTelemetry endpoint, no metrics are sent to the S3 destination, and it does not incur any cost.
  2. Network Load Balancer: This NLB operates at the transport layer of the Open Systems Interconnection (OSI) model. In this architecture, the NLB distributes TCP traffic to the OpenTelemetry collectors running on EC2 Instances in the internal subnet within the VPC.
  3. Amazon Elastic Compute Cloud (Amazon EC2) instance: In this architecture, we run the OpenTelemetry collector on the EC2 instances. The instances run in the private subnet within our VPC.

The following sections detail the steps for deploying this solution in your own AWS environment. You can deploy this solution using either AWS CloudFormation or the AWS Command Line Interface (AWS CLI). Deployment time and complexity will vary based on your familiarity with these AWS services.

Implementation details

Prerequisites:

Before deploying this solution, verify that you have the following:

  • An AWS account with permissions to create CloudWatch Metric Streams, Amazon Data Firehose, Lambda, and EC2 resources
  • AWS CLI v2 installed and configured.
  • AWS Serverless Application Model (AWS SAM) CLI installed.
  • A VPC with at least two subnets configured in different Availability Zones and security groups to allow necessary inbound and outbound traffic.

We can implement this architecture in two ways: deploying with AWS CloudFormation or deploying with the AWS CLI.

Option 1: Deploying with AWS CloudFormation

This walkthrough creates a CloudFormation stack, that deploys an Amazon Data Firehose stream, Amazon CloudWatch stream, S3 bucket, Lambda function for data transformation.

Access the CloudFormation template by cloning the git repository.

Step 1 – Package the Lambda artifacts for the CloudFormation template.

This step creates the cf-packaged-file.yaml file and publishes the Lambda Layer code packaged to the specified S3 bucket cf-stage-bucket-203918862653:

~> pwd
   sample-cloudwatch-metrics-stream-otel-transformer/cloudformation 
~> ./setup_layer.sh 
~>
~> aws cloudformation package \
    —template-file ./cloudformation-template.yaml \
    —s3-bucket cf-stage-bucket-xxxxx \
    —output-template-file cf-packaged-file.yaml

   Uploading to 9813804ccc99d538f6d4ef06c4857bab 223 / 223.0 (100.00%)
   Successfully packaged artifacts and wrote output template to file cf-packaged-file.yaml.
   Execute the following command to deploy the packaged template
  aws cloudformation deploy —template-file ~/code/sample-cwmetrics-   sep25/sample-cloudwatch-metrics-stream-otel-transformer/cloudformation/cf-packaged-file.yaml —stack-name <YOUR STACK NAME>

Step 2 – Create CloudFormation stack using the console.

  1. Sign in as an administrator to the AWS Management Console and use the navigation bar to select your preferred AWS Region for deployment.
  2. Navigate to the CloudFormation dashboard to create stack.
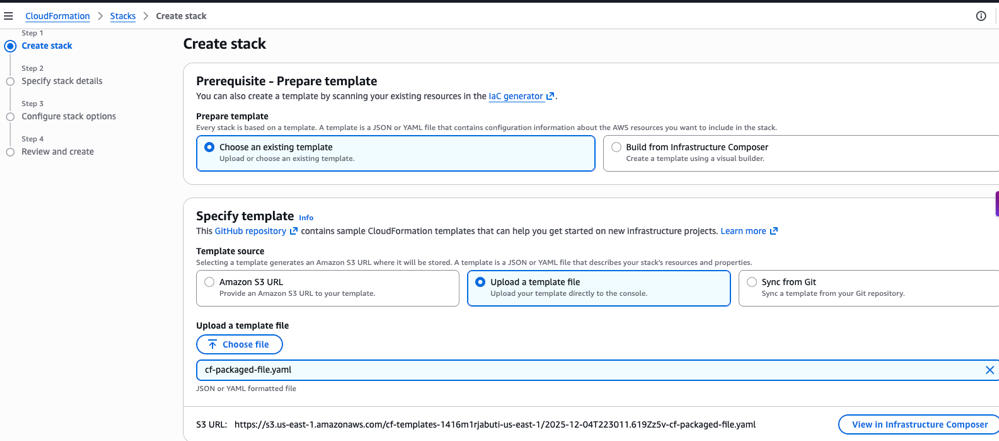
  3. Choose ‘Create Stack’ and choose “Choose an existing template”. Upload the template file and choose the cf-packaged-file.yaml created in the first step.
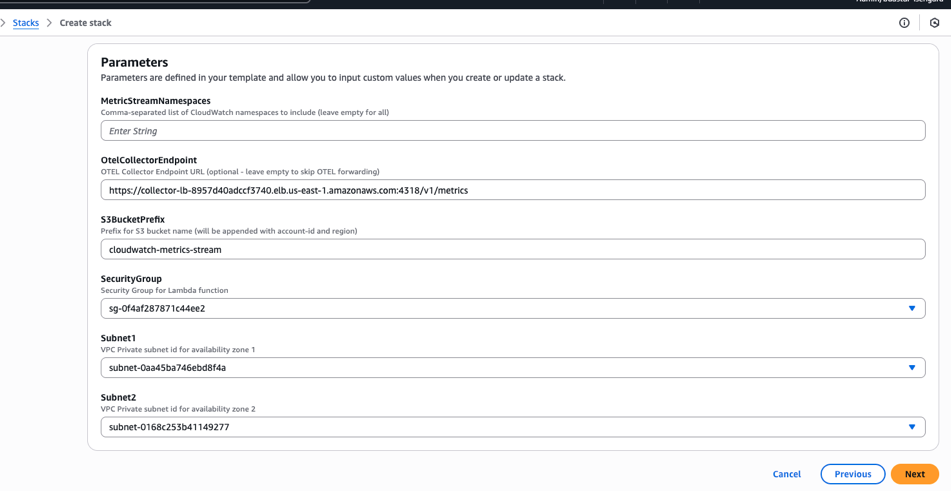
  1. Configure the key parameters.

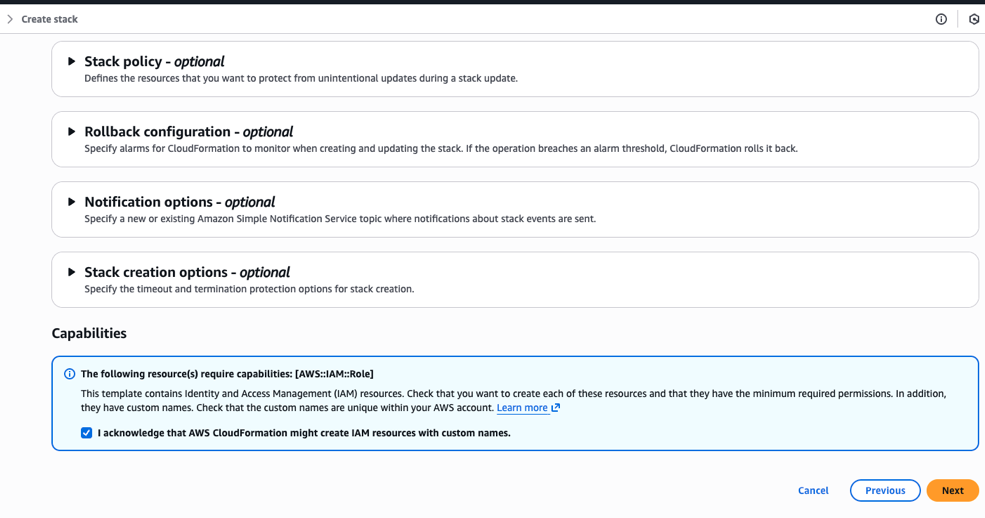
  1. Acknowledge the Capabilities to allow CloudFormation to create the necessary LambdaExecutionRole IAM role with the required permissions.
  1. Finally, review and choose ‘Next’ to create the CloudFormation stack.

Option 2: Deploying with AWS Command Line Interface

Alternatively, you can run the following steps from a terminal using the AWS CLI to package and create your CloudFormation stack.

Access the CloudFormation template by cloning the git repository.

Step 1 – Package the Lambda artifacts for the CloudFormation template.

This step creates the cf-packaged-file.yaml file and publishes the Lambda Layer code packaged to the specified S3 bucket cf-stage-bucket-203918862653.

~> pwd
   sample-cloudwatch-metrics-stream-otel-transformer/cloudformation 
~> ./setup_layer.sh 
~>
~> aws cloudformation package \
    —template-file ./cloudformation-template.yaml \
    —s3-bucket cf-stage-bucket-xxxxxxxxxx \
    —output-template-file cf-packaged-file.yaml

   Uploading to 9813804ccc99d538f6d4ef06c4857bab 223 / 223.0 (100.00%)
   Successfully packaged artifacts and wrote output template to file cf-packaged-file.yaml.
   Execute the following command to deploy the packaged template
  aws cloudformation deploy —template-file ~/code/sample-cwmetrics-   sep25/sample-cloudwatch-metrics-stream-otel-transformer/cloudformation/cf-packaged-file.yaml —stack-name <YOUR STACK NAME>

Step 2 – Create stack using AWS Command Line Interface.

Create a parameters.json file as follows:

%~> cat parameters.json 
[
  {
    "ParameterKey": "Subnet1",
    "ParameterValue": "subnet-xxxxxxxxxx"
  },
  {
    "ParameterKey": "Subnet2",
    "ParameterValue": "subnet-yyyyyyyyyy"
  },
  {
    "ParameterKey": "SecurityGroup",
    "ParameterValue": "sg-xxxxxxxxxx"
  },
  {
    "ParameterKey": "OtelCollectorEndpoint",
    "ParameterValue": "http://your-otel-endpoint:4318/v1/metrics"
  },
  {
    "ParameterKey": "MetricStreamNamespaces",
    "ParameterValue": ""
  },
  {
    "ParameterKey": "S3BucketPrefix",
    "ParameterValue": "cloudwatch-metrics-stream"
  }
]

Run the CloudFormation create-stack CLI as follows:

~> aws cloudformation create-stack \
     --stack-name cw-metrics-demo \
     --template-body "file://cf-packaged-file.yaml" \
     --parameters file://parameters.json \
     --capabilities CAPABILITY_NAMED_IAM \
     --region us-east-1 --profile dev

After you deploy the infrastructure stack, CloudWatch Metric Streams initiates the flow by streaming near real-time metrics from customer applications. Amazon Data Firehose asynchronously invokes the Lambda transform function that sends metrics directly to the OpenTelemetry collector endpoint. You must then configure these collectors to apply additional processing, such as filtering, batching, and enrichment. The collectors forward metrics to one or more observability backends, such as Honeycomb, Jaeger, Grafana Cloud, or other dashboards.

Clean up

To avoid incurring unnecessary charges after testing the proof of concept (POC), clean up the resources. You can do so by deleting the CloudFormation stack to remove all deployed resources.

Option 1: Using the console:

  • Sign in as an administrator to the AWS Management Console and use the navigation bar to select your preferred AWS Region for deployment.
  • Navigate to the CloudFormation dashboard to create stack.
  • Select the ‘cw-metrics-demo’ stack and choose “Delete”.

Option 2: Using AWS CLI:

aws cloudformation delete-stack \ --stack-name cw-metrics-demo \ --region us-east-1 --profile dev

Conclusion

In this post, we showed how moving from third-party observability tools to CloudWatch Metric Streams with OpenTelemetry can reduce costs and improve performance. The solution we implemented combines AWS streaming with the OpenTelemetry standard to create a flexible and scalable monitoring solution that can adapt to changing requirements while maintaining operational excellence. If you face similar challenges with your observability solution, this approach offers a proven path to reduce costs, improve performance, and maintain control over your monitoring data.

About the authors

Run a data processing job on Amazon EMR Serverless with AWS Step Functions

Post Syndicated from Siva Ramani original https://aws.amazon.com/blogs/big-data/run-a-data-processing-job-on-amazon-emr-serverless-with-aws-step-functions/

There are several infrastructure as code (IaC) frameworks available today, to help you define your infrastructure, such as the AWS Cloud Development Kit (AWS CDK) or Terraform by HashiCorp. Terraform, an AWS Partner Network (APN) Advanced Technology Partner and member of the AWS DevOps Competency, is an IaC tool similar to AWS CloudFormation that allows you to create, update, and version your AWS infrastructure. Terraform provides friendly syntax (similar to AWS CloudFormation) along with other features like planning (visibility to see the changes before they actually happen), graphing, and the ability to create templates to break infrastructure configurations into smaller chunks, which allows better maintenance and reusability. We use the capabilities and features of Terraform to build an API-based ingestion process into AWS. Let’s get started!

In this post, we showcase how to build and orchestrate a Scala Spark application using Amazon EMR Serverless, AWS Step Functions, and Terraform. In this end-to-end solution, we run a Spark job on EMR Serverless that processes sample clickstream data in an Amazon Simple Storage Service (Amazon S3) bucket and stores the aggregation results in Amazon S3.

With EMR Serverless, you don’t have to configure, optimize, secure, or operate clusters to run applications. You will continue to get the benefits of Amazon EMR, such as open source compatibility, concurrency, and optimized runtime performance for popular data frameworks. EMR Serverless is suitable for customers who want ease in operating applications using open-source frameworks. It offers quick job startup, automatic capacity management, and straightforward cost controls.

Solution overview

We provide the Terraform infrastructure definition and the source code for an AWS Lambda function using sample customer user clicks for online website inputs, which are ingested into an Amazon Kinesis Data Firehose delivery stream. The solution uses Kinesis Data Firehose to convert the incoming data into a Parquet file (an open-source file format for Hadoop) before pushing it to Amazon S3 using the AWS Glue Data Catalog. The generated output S3 Parquet file logs are then processed by an EMR Serverless process, which outputs a report detailing aggregate clickstream statistics in an S3 bucket. The EMR Serverless operation is triggered using Step Functions. The sample architecture and code are spun up as shown in the following diagram.

emr serverless application

The provided samples have the source code for building the infrastructure using Terraform for running the Amazon EMR application. Setup scripts are provided to create the sample ingestion using Lambda for the incoming application logs. For a similar ingestion pattern sample, refer to Provision AWS infrastructure using Terraform (By HashiCorp): an example of web application logging customer data.

The following are the high-level steps and AWS services used in this solution:

  • The provided application code is packaged and built using Apache Maven.
  • Terraform commands are used to deploy the infrastructure in AWS.
  • The EMR Serverless application provides the option to submit a Spark job.
  • The solution uses two Lambda functions:
    • Ingestion – This function processes the incoming request and pushes the data into the Kinesis Data Firehose delivery stream.
    • EMR Start Job – This function starts the EMR Serverless application. The EMR job process converts the ingested user click logs into output in another S3 bucket.
  • Step Functions triggers the EMR Start Job Lambda function, which submits the application to EMR Serverless for processing of the ingested log files.
  • The solution uses four S3 buckets:
    • Kinesis Data Firehose delivery bucket – Stores the ingested application logs in Parquet file format.
    • Loggregator source bucket – Stores the Scala code and JAR for running the EMR job.
    • Loggregator output bucket – Stores the EMR processed output.
    • EMR Serverless logs bucket – Stores the EMR process application logs.
  • Sample invoke commands (run as part of the initial setup process) insert the data using the ingestion Lambda function. The Kinesis Data Firehose delivery stream converts the incoming stream into a Parquet file and stores it in an S3 bucket.

For this solution, we made the following design decisions:

  • We use Step Functions and Lambda in this use case to trigger the EMR Serverless application. In a real-world use case, the data processing application could be long running and may exceed Lambda’s timeout limits. In this case, you can use tools like Amazon Managed Workflows for Apache Airflow (Amazon MWAA). Amazon MWAA is a managed orchestration service makes it easier to set up and operate end-to-end data pipelines in the cloud at scale.
  • The Lambda code and EMR Serverless log aggregation code are developed using Java and Scala, respectively. You can use any supported languages in these use cases.
  • The AWS Command Line Interface (AWS CLI) V2 is required for querying EMR Serverless applications from the command line. You can also view these from the AWS Management Console. We provide a sample AWS CLI command to test the solution later in this post.

Prerequisites

To use this solution, you must complete the following prerequisites:

  • Install the AWS CLI. For this post, we used version 2.7.18. This is required in order to query the aws emr-serverless AWS CLI commands from your local machine. Optionally, all the AWS services used in this post can be viewed and operated via the console.
  • Make sure to have Java installed, and JDK/JRE 8 is set in the environment path of your machine. For instructions, see the Java Development Kit.
  • Install Apache Maven. The Java Lambda functions are built using mvn packages and are deployed using Terraform into AWS.
  • Install the Scala Build Tool. For this post, we used version 1.4.7. Make sure to download and install based on your operating system needs.
  • Set up Terraform. For steps, see Terraform downloads. We use version 1.2.5 for this post.
  • Have an AWS account.

Configure the solution

To spin up the infrastructure and the application, complete the following steps:

  1. Clone the following GitHub repository.
    The provided exec.sh shell script builds the Java application JAR (for the Lambda ingestion function) and the Scala application JAR (for the EMR processing) and deploys the AWS infrastructure that is needed for this use case.
  2. Run the following commands:
    $ chmod +x exec.sh
    $ ./exec.sh

    To run the commands individually, set the application deployment Region and account number, as shown in the following example:

    $ APP_DIR=$PWD
    $ APP_PREFIX=clicklogger
    $ STAGE_NAME=dev
    $ REGION=us-east-1
    $ ACCOUNT_ID=$(aws sts get-caller-identity | jq -r '.Account')

    The following is the Maven build Lambda application JAR and Scala application package:

    $ cd $APP_DIR/source/clicklogger
    $ mvn clean package
    $ sbt reload
    $ sbt compile
    $ sbt package

  3. Deploy the AWS infrastructure using Terraform:
    $ terraform init
    $ terraform plan
    $ terraform apply --auto-approve

Test the solution

After you build and deploy the application, you can insert sample data for Amazon EMR processing. We use the following code as an example. The exec.sh script has multiple sample insertions for Lambda. The ingested logs are used by the EMR Serverless application job.

The sample AWS CLI invoke command inserts sample data for the application logs:

aws lambda invoke --function-name clicklogger-dev-ingestion-lambda —cli-binary-format raw-in-base64-out —payload '{"requestid":"OAP-guid-001","contextid":"OAP-ctxt-001","callerid":"OrderingApplication","component":"login","action":"load","type":"webpage"}' out

To validate the deployments, complete the following steps:

  1. On the Amazon S3 console, navigate to the bucket created as part of the infrastructure setup.
  2. Choose the bucket to view the files.
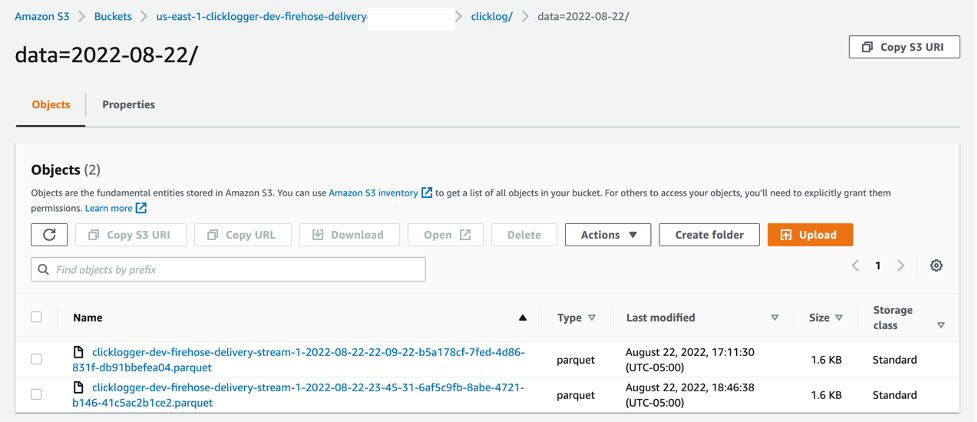
    You should see that data from the ingested stream was converted into a Parquet file.
  3. Choose the file to view the data.
    The following screenshot shows an example of our bucket contents.
    Now you can run Step Functions to validate the EMR Serverless application.
  4. On the Step Functions console, open clicklogger-dev-state-machine.
    The state machine shows the steps to run that trigger the Lambda function and EMR Serverless application, as shown in the following diagram.
  5. Run the state machine.
  6. After the state machine runs successfully, navigate to the clicklogger-dev-output-bucket on the Amazon S3 console to see the output files.
  7. Use the AWS CLI to check the deployed EMR Serverless application:
    $ aws emr-serverless list-applications \
          | jq -r '.applications[] | select(.name=="clicklogger-dev-loggregrator-emr-<Your-Account-Number>").id'

  8. On the Amazon EMR console, choose Serverless in the navigation pane.
  9. Select clicklogger-dev-studio and choose Manage applications.
  10. The Application created by the stack will be as shown below clicklogger-dev-loggregator-emr-<Your-Account-Number>
    Now you can review the EMR Serverless application output.
  11. On the Amazon S3 console, open the output bucket (us-east-1-clicklogger-dev-loggregator-output-).
    The EMR Serverless application writes the output based on the date partition, such as 2022/07/28/response.md.The following code shows an example of the file output:

    |*createdTime*|*callerid*|*component*|*count*
    |------------|-----------|-----------|-------
    *07-28-2022*|OrderingApplication|checkout|2
    *07-28-2022*|OrderingApplication|login|2
    *07-28-2022*|OrderingApplication|products|2

Clean up

The provided ./cleanup.sh script has the required steps to delete all the files from the S3 buckets that were created as part of this post. The terraform destroy command cleans up the AWS infrastructure that you created earlier. See the following code:

$ chmod +x cleanup.sh
$ ./cleanup.sh

To do the steps manually, you can also delete the resources via the AWS CLI:

# CLI Commands to delete the Amazon S3  

aws s3 rb s3://clicklogger-dev-emr-serverless-logs-bucket-<your-account-number> --force
aws s3 rb s3://clicklogger-dev-firehose-delivery-bucket-<your-account-number> --force
aws s3 rb s3://clicklogger-dev-loggregator-output-bucket-<your-account-number> --force
aws s3 rb s3://clicklogger-dev-loggregator-source-bucket-<your-account-number> --force

# Destroy the AWS Infrastructure 
terraform destroy --auto-approve

Conclusion

In this post, we built, deployed, and ran a data processing Spark job in EMR Serverless that interacts with various AWS services. We walked through deploying a Lambda function packaged with Java using Maven, and a Scala application code for the EMR Serverless application triggered with Step Functions with infrastructure as code. You can use any combination of applicable programming languages to build your Lambda functions and EMR job application. EMR Serverless can be triggered manually, automated, or orchestrated using AWS services like Step Functions and Amazon MWAA.

We encourage you to test this example and see for yourself how this overall application design works within AWS. Then, it’s just the matter of replacing your individual code base, packaging it, and letting EMR Serverless handle the process efficiently.

If you implement this example and run into any issues, or have any questions or feedback about this post, please leave a comment!

References


About the Authors

Sivasubramanian Ramani (Siva Ramani) is a Sr Cloud Application Architect at Amazon Web Services. His expertise is in application optimization & modernization, serverless solutions and using Microsoft application workloads with AWS.

Naveen Balaraman is a Sr Cloud Application Architect at Amazon Web Services. He is passionate about Containers, serverless Applications, Architecting Microservices and helping customers leverage the power of AWS cloud.

How MEDHOST’s cardiac risk prediction successfully leveraged AWS analytic services

Post Syndicated from Pandian Velayutham original https://aws.amazon.com/blogs/big-data/how-medhosts-cardiac-risk-prediction-successfully-leveraged-aws-analytic-services/

MEDHOST has been providing products and services to healthcare facilities of all types and sizes for over 35 years. Today, more than 1,000 healthcare facilities are partnering with MEDHOST and enhancing their patient care and operational excellence with its integrated clinical and financial EHR solutions. MEDHOST also offers a comprehensive Emergency Department Information System with business and reporting tools. Since 2013, MEDHOST’s cloud solutions have been utilizing Amazon Web Services (AWS) infrastructure, data source, and computing power to solve complex healthcare business cases.

MEDHOST can utilize the data available in the cloud to provide value-added solutions for hospitals solving complex problems, like predicting sepsis, cardiac risk, and length of stay (LOS) as well as reducing re-admission rates. This requires a solid foundation of data lake and elastic data pipeline to keep up with multi-terabyte data from thousands of hospitals. MEDHOST has invested a significant amount of time evaluating numerous vendors to determine the best solution for its data needs. Ultimately, MEDHOST designed and implemented machine learning/artificial intelligence capabilities by leveraging AWS Data Lab and an end-to-end data lake platform that enables a variety of use cases such as data warehousing for analytics and reporting.

Since you’re reading this post, you may also be interested in the following:

Getting started

MEDHOST’s initial objectives in evaluating vendors were to:

  • Build a low-cost data lake solution to provide cardiac risk prediction for patients based on health records
  • Provide an analytical solution for hospital staff to improve operational efficiency
  • Implement a proof of concept to extend to other machine learning/artificial intelligence solutions

The AWS team proposed AWS Data Lab to architect, develop, and test a solution to meet these objectives. The collaborative relationship between AWS and MEDHOST, AWS’s continuous innovation, excellent support, and technical solution architects helped MEDHOST select AWS over other vendors and products. AWS Data Lab’s well-structured engagement helped MEDHOST define clear, measurable success criteria that drove the implementation of the cardiac risk prediction and analytical solution platform. The MEDHOST team consisted of architects, builders, and subject matter experts (SMEs). By connecting MEDHOST experts directly to AWS technical experts, the MEDHOST team gained a quick understanding of industry best practices and available services allowing MEDHOST team to achieve most of the success criteria at the end of a four-day design session. MEDHOST is now in the process of moving this work from its lower to upper environment to make the solution available for its customers.

Solution

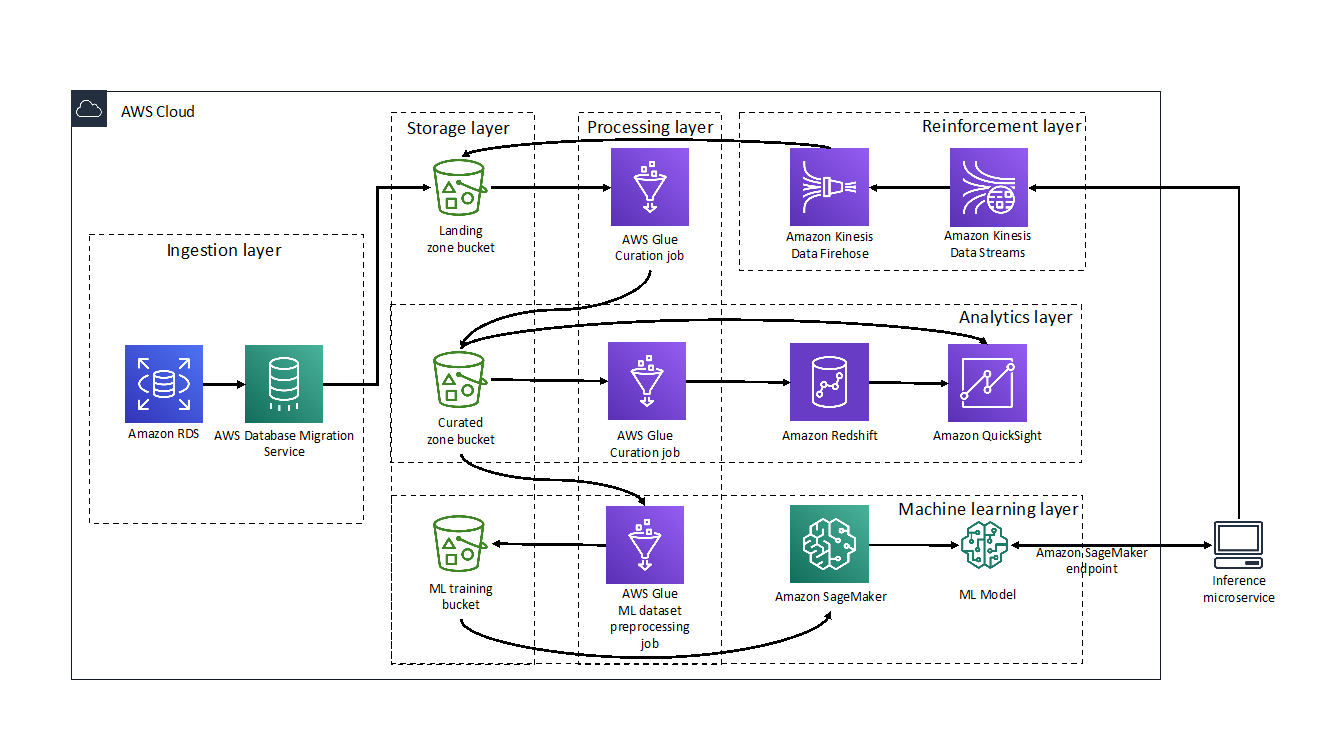
For this solution, MEDHOST and AWS built a layered pipeline consisting of ingestion, processing, storage, analytics, machine learning, and reinforcement components. The following diagram illustrates the Proof of Concept (POC) that was implemented during the four-day AWS Data Lab engagement.

Ingestion layer

The ingestion layer is responsible for moving data from hospital production databases to the landing zone of the pipeline.

The hospital data was stored in an Amazon RDS for PostgreSQL instance and moved to the landing zone of the data lake using AWS Database Migration Service (DMS). DMS made migrating databases to the cloud simple and secure. Using its ongoing replication feature, MEDHOST and AWS implemented change data capture (CDC) quickly and efficiently so MEDHOST team could spend more time focusing on the most interesting parts of the pipeline.

Processing layer

The processing layer was responsible for performing extract, tranform, load (ETL) on the data to curate them for subsequent uses.

MEDHOST used AWS Glue within its data pipeline for crawling its data layers and performing ETL tasks. The hospital data copied from RDS to Amazon S3 was cleaned, curated, enriched, denormalized, and stored in parquet format to act as the heart of the MEDHOST data lake and a single source of truth to serve any further data needs. During the four-day Data Lab, MEDHOST and AWS targeted two needs: powering MEDHOST’s data warehouse used for analytics and feeding training data to the machine learning prediction model. Even though there were multiple challenges, data curation is a critical task which requires an SME. AWS Glue’s serverless nature, along with the SME’s support during the Data Lab, made developing the required transformations cost efficient and uncomplicated. Scaling and cluster management was addressed by the service, which allowed the developers to focus on cleaning data coming from homogenous hospital sources and translating the business logic to code.

Storage layer

The storage layer provided low-cost, secure, and efficient storage infrastructure.

MEDHOST used Amazon S3 as a core component of its data lake. AWS DMS migration tasks saved data to S3 in .CSV format. Crawling data with AWS Glue made this landing zone data queryable and available for further processing. The initial AWS Glue ETL job stored the parquet formatted data to the data lake and its curated zone bucket. MEDHOST also used S3 to store the .CSV formatted data set that will be used to train, test, and validate its machine learning prediction model.

Analytics layer

The analytics layer gave MEDHOST pipeline reporting and dashboarding capabilities.

The data was in parquet format and partitioned in the curation zone bucket populated by the processing layer. This made querying with Amazon Athena or Amazon Redshift Spectrum fast and cost efficient.

From the Amazon Redshift cluster, MEDHOST created external tables that were used as staging tables for MEDHOST data warehouse and implemented an UPSERT logic to merge new data in its production tables. To showcase the reporting potential that was unlocked by the MEDHOST analytics layer, a connection was made to the Redshift cluster to Amazon QuickSight. Within minutes MEDHOST was able to create interactive analytics dashboards with filtering and drill-down capabilities such as a chart that showed the number of confirmed disease cases per US state.

Machine learning layer

The machine learning layer used MEDHOST’s existing data sets to train its cardiac risk prediction model and make it accessible via an endpoint.

Before getting into Data Lab, the MEDHOST team was not intimately familiar with machine learning. AWS Data Lab architects helped MEDHOST quickly understand concepts of machine learning and select a model appropriate for its use case. MEDHOST selected XGBoost as its model since cardiac prediction falls within regression technique. MEDHOST’s well architected data lake enabled it to quickly generate training, testing, and validation data sets using AWS Glue.

Amazon SageMaker abstracted underlying complexity of setting infrastructure for machine learning. With few clicks, MEDHOST started Jupyter notebook and coded the components leading to fitting and deploying its machine learning prediction model. Finally, MEDHOST created the endpoint for the model and ran REST calls to validate the endpoint and trained model. As a result, MEDHOST achieved the goal of predicting cardiac risk. Additionally, with Amazon QuickSight’s SageMaker integration, AWS made it easy to use SageMaker models directly in visualizations. QuickSight can call the model’s endpoint, send the input data to it, and put the inference results into the existing QuickSight data sets. This capability made it easy to display the results of the models directly in the dashboards. Read more about QuickSight’s SageMaker integration here.

Reinforcement layer

Finally, the reinforcement layer guaranteed that the results of the MEDHOST model were captured and processed to improve performance of the model.

The MEDHOST team went beyond the original goal and created an inference microservice to interact with the endpoint for prediction, enabled abstracting of the machine learning endpoint with the well-defined domain REST endpoint, and added a standard security layer to the MEDHOST application.

When there is a real-time call from the facility, the inference microservice gets inference from the SageMaker endpoint. Records containing input and inference data are fed to the data pipeline again. MEDHOST used Amazon Kinesis Data Streams to push records in real time. However, since retraining the machine learning model does not need to happen in real time, the Amazon Kinesis Data Firehose enabled MEDHOST to micro-batch records and efficiently save them to the landing zone bucket so that the data could be reprocessed.

Conclusion

Collaborating with AWS Data Lab enabled MEDHOST to:

  • Store single source of truth with low-cost storage solution (data lake)
  • Complete data pipeline for a low-cost data analytics solution
  • Create an almost production-ready code for cardiac risk prediction

The MEDHOST team learned many concepts related to data analytics and machine learning within four days. AWS Data Lab truly helped MEDHOST deliver results in an accelerated manner.


About the Authors

Pandian Velayutham is the Director of Engineering at MEDHOST. His team is responsible for delivering cloud solutions, integration and interoperability, and business analytics solutions. MEDHOST utilizes modern technology stack to provide innovative solutions to our customers. Pandian Velayutham is a technology evangelist and public cloud technology speaker.


George Komninos is a Data Lab Solutions Architect at AWS. He helps customers convert their ideas to a production-ready data product. Before AWS, he spent 3 years at Alexa Information domain as a data engineer. Outside of work, George is a football fan and supports the greatest team in the world, Olympiacos Piraeus.

Automatically updating AWS WAF Rule in real time using Amazon EventBridge

Post Syndicated from Adam Cerini original https://aws.amazon.com/blogs/security/automatically-updating-aws-waf-rule-in-real-time-using-amazon-eventbridge/

In this post, I demonstrate a method for collecting and sharing threat intelligence between Amazon Web Services (AWS) accounts by using AWS WAF, Amazon Kinesis Data Analytics, and Amazon EventBridge. AWS WAF helps protect against common web exploits and gives you control over which traffic can reach your application.

Attempted exploitation blocked by AWS WAF provides a data source on potential attackers that can be shared proactively across AWS accounts. This solution can be an effective way to block traffic known to be malicious across accounts and public endpoints. AWS WAF managed rules provide an easy way to mitigate and record the details of common web exploit attempts. This solution will use the Admin protection managed rule for demonstration purposes.

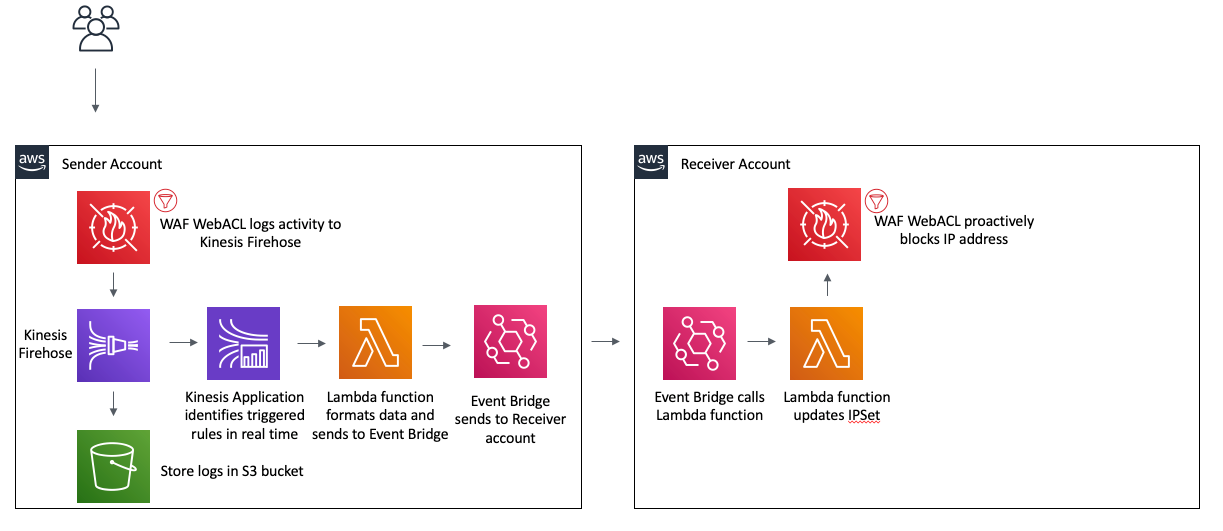
In this post you will see references to the Sender account and the Receiver account. There is only one receiver in this example, but the receiving process can be duplicated multiple times across multiple accounts. This post walks through how to set up the solution. You’ll notice there is also an AWS CloudFormation template that makes it easy to test the solution in your own AWS account. The diagram in figure 1 illustrates how this architecture fits together at a high level.
 

Figure 1: Architecture diagram showing the activity flow of traffic blocked on the Sender AWS WAF

Figure 1: Architecture diagram showing the activity flow of traffic blocked on the Sender AWS WAF

Prerequisites

You should know how to do the following tasks:

Extracting threat intelligence

AWS WAF logs using a Kinesis Data Firehose delivery stream. This allows you to not only log to a destination S3 bucket, but also act on the stream in real time using a Kinesis Data Analytics Application. The following SQL code demonstrates how to extract any unique IP addresses that have been blocked by AWS WAF. While this example returns all blocked IPs, more complex SQL could be used for a more granular result. The full list of log fields is included in the documentation.


CREATE OR REPLACE STREAM "wafstream" (
 "clientIp" VARCHAR(16),
 "action" VARCHAR(8),
 "time_stamp" TIMESTAMP
 );

CREATE OR REPLACE PUMP "WAFPUMP" as
INSERT INTO "wafstream" (
"clientIp",
"action",
"time_stamp"
) 

Select STREAM DISTINCT "clientIp", "action", FLOOR(WAF_001.ROWTIME TO MINUTE) as "time_stamp"
FROM "WAF_001"
WHERE "action" = 'BLOCK';

Proactively blocking unwanted traffic

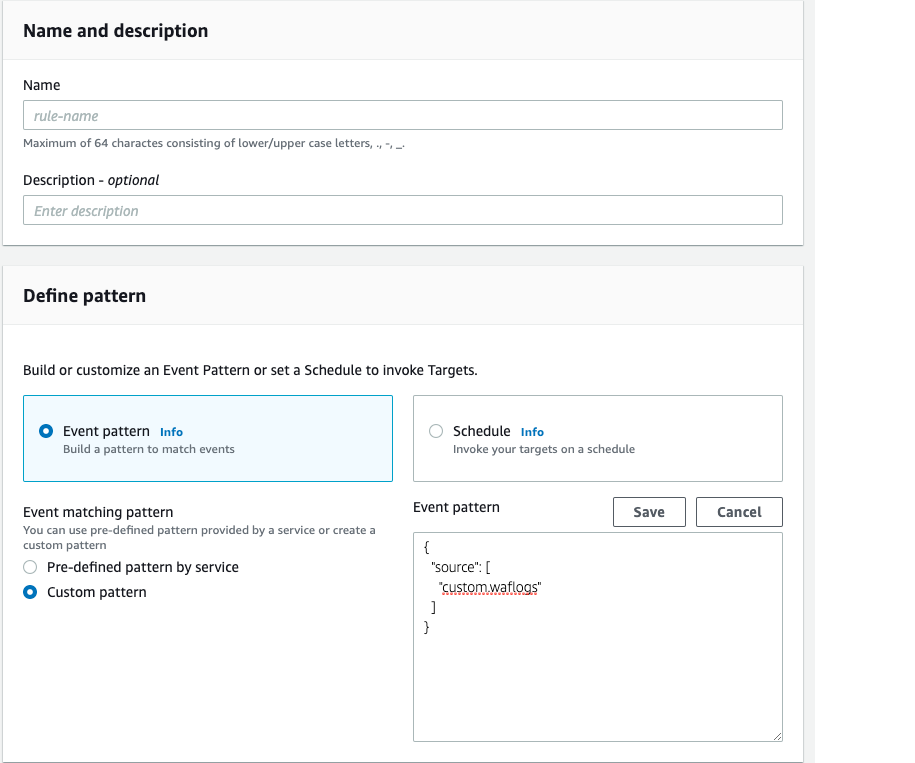
After extracting the IP addresses involved in the abnormal traffic, you will want to proactively block those IPs on your other web facing resources. You can accomplish this in a scalable way using Amazon EventBridge. After the Kinesis Application extracts the IP address, it will use an AWS Lambda function to call PutEvents on an EventBridge event bus. This process will create the event pattern, which is used to determine when to trigger an event bus rule. This example uses a simple pattern, which acts on any event with a source of “custom.waflogs” as shown in Figure 2. A more complex pattern could be used to for finer grain control of when a rule triggers.
 

Figure 2: EventBridge Rule creation

Figure 2: EventBridge Rule creation

Once the event reaches the event bus, the rule will forward the event to an event bus in “Receiver” account, where a second rule will trigger to call a Lambda function to update a WAF IPSet. A Web ACL rule is used to block all traffic sourcing from an IP address contained in the IPSet.

Test the solution by using AWS CloudFormation

Now that you’ve walked through the design of this solution, you can follow these instructions to test it in your own AWS account by using CloudFormation stacks.

To deploy using CloudFormation

  1. Launch the stack to provision resources in the Receiver account.
  2. Provide the account ID of the Sender account. This will correctly configure the permissions for the EventBridge event bus.
  3. Wait for the stack to complete, and then capture the event bus ARN from the output tab.

    This stack creates the following resources:

    • An AWS WAF v2 web ACL
    • An IPSet which will be used to contain the IP addresses to block
    • An AWS WAF rule that will block IP addresses contained in the IPSet
    • A Lambda function to update the IPSet
    • An IAM policy and execution role for the Lambda function
    • An event bus
    • An event bus rule that will trigger the Lambda function
  4. Switch to the Sender account. This should be the account you used in step 2 of this procedure.
  5. Provide the ARN of the event bus that was captured in step 3. This stack will provision the following resources in your account:
    • A virtual private cloud (VPC) with public and private subnets
    • Route tables for the VPC resources
    • An Application Load Balancer (ALB) with a fixed response rule
    • A security group that allows ingress traffic on port 80 to the ALB
    • A web ACL with the AWS Managed Rule for Admin Protection enabled
    • An S3 bucket for AWS WAF logs
    • A Kinesis Data Firehose delivery stream
    • A Kinesis Data Analytics application
    • An EventBridge event bus
    • An event bus rule
    • A Lambda function to send information to the Receiver account event bus
    • A custom CloudFormation resource which enables WAF logging and starts the Kinesis Application
    • An IAM policy and execution role that allows a Lamba function to put events into the event bus
    • An IAM policy and role to allow the custom CloudFormation resource to enable WAF logging and start the Kinesis Application
    • An IAM policy and role that allows the Kinesis Firehose to put logs into S3
    • An IAM policy that allows the WAF Web ACL to put records into the Firehose
    • An IAM policy and role that allows the Kinesis Application to invoke a Lambda function and log to CloudWatch
    • An IAM policy and role that allows the “Sender” account to put events in the “Receiver” event bus

After the CloudFormation stack completes, you should test your environment. To test the solution, check the output tab for the DNS name of the Application Load Balancer and run the following command:

curl ALBDNSname/admin

You should be able to check the Receiver account’s AWS WAF IPSet named WAFBlockIPset and find your IP.

Conclusion

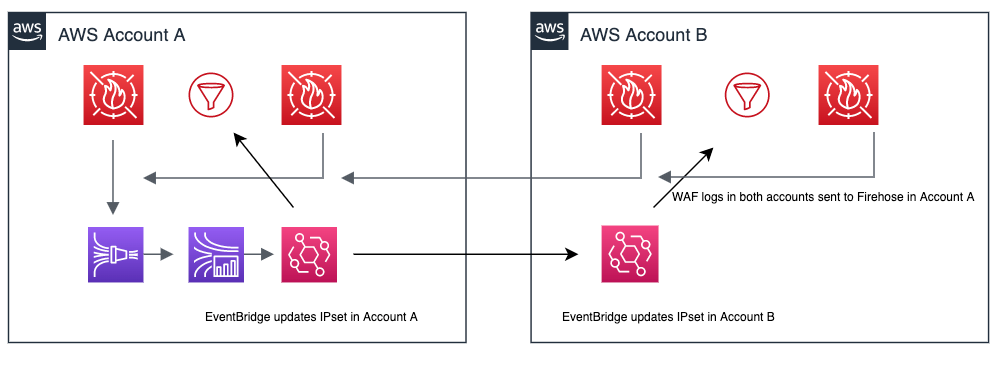
This example is intentionally simple to clearly demonstrate how each component works. You can take these principles and apply them to your own environment. Layering the Amazon managed rules with your own custom rules is the best way to get started with AWS WAF. This example shows how you can use automation to update your WAF rules without needing to rely on humans. A more complete solution would source log data from each Web ACL and update an active IP Set in each account to protect all resources. As seen in Figure 3, a more complete implementation would send all logs in a region to a centralized Kinesis Firehose to be processed by the Kinesis Analytics Application, EventBridge would be used to update a local IPset as well as forward the event to other accounts event buses for processing.
 

Figure 3: Updating across accounts

Figure 3: Updating across accounts

You can also add additional targets to the event bus to do things such as send to a Simple Notification Service topic for notifications, or run additional automation. To learn more about AWS WAF web ACLs, visit the AWS WAF Developer Guide. Using Amazon EventBridge opens up the possibility to send events to partner integrations. Customers or APN Partners like PagerDuty or Zendesk can enrich this solution by taking actions such as automatically opening a ticket or starting an incident. To learn more about the power of Amazon EventBridge, see the EventBridge User Guide.

If you have feedback about this post, submit comments in the Comments section below. If you have questions about this post, start a new thread on the AWS WAF forum or contact AWS Support.

Want more AWS Security how-to content, news, and feature announcements? Follow us on Twitter.

Author

Adam Cerini

Adam is a Senior Solutions Architect with Amazon Web Services. He focuses on helping Public Sector customers architect scalable, secure, and cost effective systems. Adam holds 5 AWS certifications including AWS Certified Solutions Architect – Professional and AWS Certified Security – Specialist.