All posts by Harunobu Kameda

New – VPC Reachability Analyzer

Post Syndicated from Harunobu Kameda original https://aws.amazon.com/blogs/aws/new-vpc-insights-analyzes-reachability-and-visibility-in-vpcs/

With Amazon Virtual Private Cloud (VPC), you can launch a logically isolated customer-specific virtual network on the AWS Cloud. As customers expand their footprint on the cloud and deploy increasingly complex network architectures, it can take longer to resolve network connectivity issues caused by misconfiguration. Today, we are happy to announce VPC Reachability Analyzer, a network diagnostics tool that troubleshoots reachability between two endpoints in a VPC, or within multiple VPCs.

Ensuring Your Network Configuration is as Intended
You have full control over your virtual network environment, including choosing your own IP address range, creating subnets, and configuring route tables and network gateways. You can also easily customize the network configuration of your VPC. For example, you can create a public subnet for a web server that has access to the Internet with Internet Gateway. Security-sensitive backend systems such as databases and application servers can be placed on private subnets that do not have internet access. You can use multiple layers of security, such as security groups and network access control list (ACL), to control access to entities of each subnet by protocol, IP address, and port number.

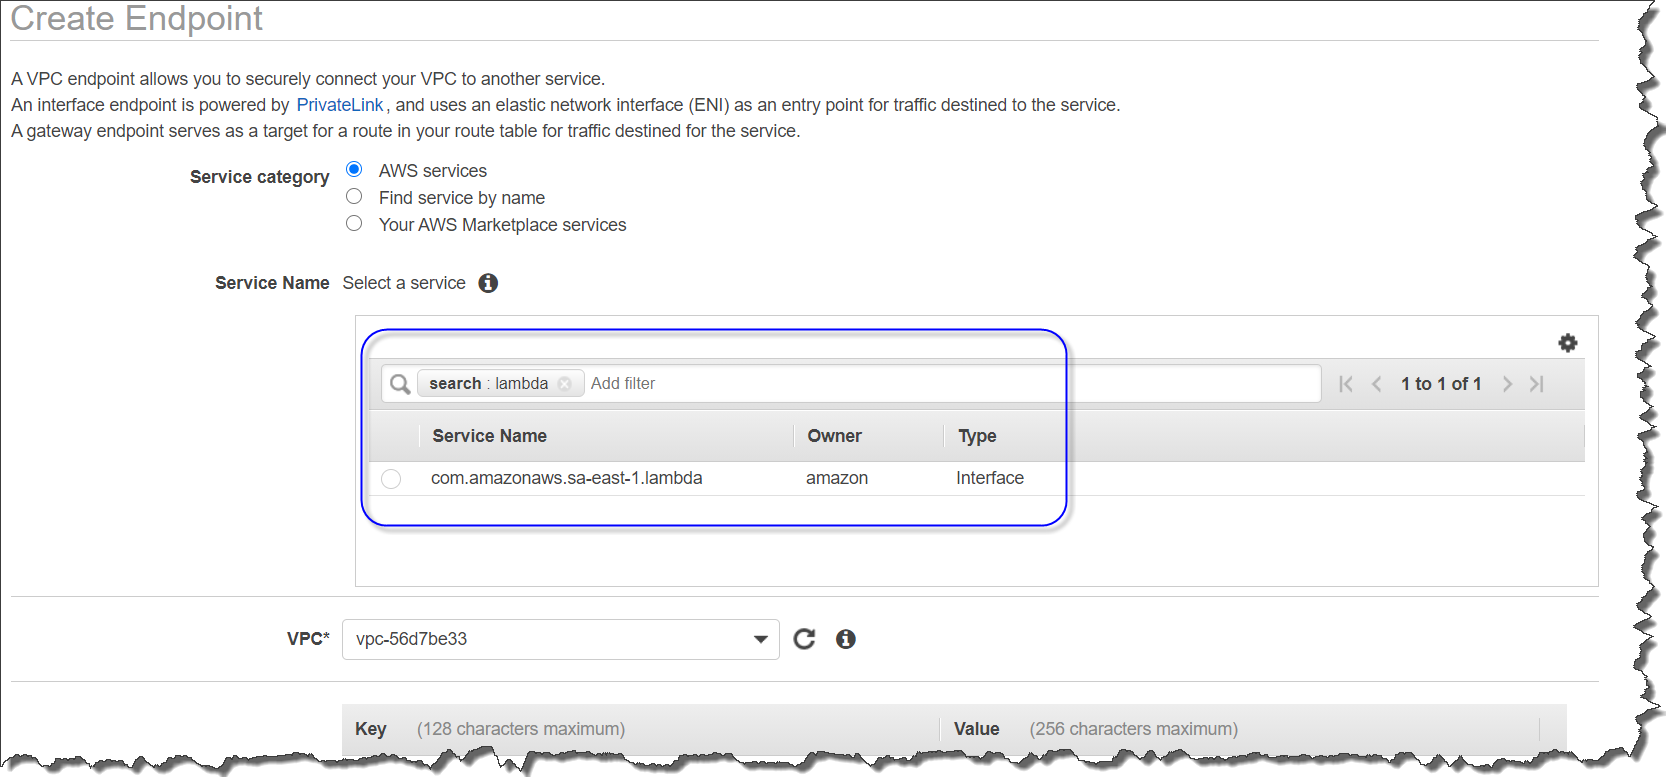
You can also combine multiple VPCs via VPC peering or AWS Transit Gateway for region-wide, or global network connections that can route traffic privately. You can also use VPN Gateway to connect your site with your AWS account for secure communication. Many AWS services that reside outside the VPC, such as AWS Lambda, or Amazon S3, support VPC endpoints or AWS PrivateLink as entities inside the VPC and can communicate with those privately.

When you have such rich controls and feature set, it is not unusual to have unintended configuration that could lead to connectivity issues. Today, you can use VPC Reachability Analyzer for analyzing reachability between two endpoints without sending any packets. VPC Reachability analyzer looks at the configuration of all the resources in your VPCs and uses automated reasoning to determine what network flows are feasible. It analyzes all possible paths through your network without having to send any traffic on the wire. To learn more about how these algorithms work checkout this re:Invent talk or read this paper.

How VPC Reachability Analyzer Works
Let’s see how it works. Using VPC Reachability Analyzer is very easy, and you can test it with your current VPC. If you need an isolated VPC for test purposes, you can run the AWS CloudFormation YAML template at the bottom of this article. The template creates a VPC with 1 subnet, 2 security groups and 3 instances as A, B, and C. Instance A and B can communicate with each other, but those instances cannot communicate with instance C because the security group attached to instance C does not allow any incoming traffic.

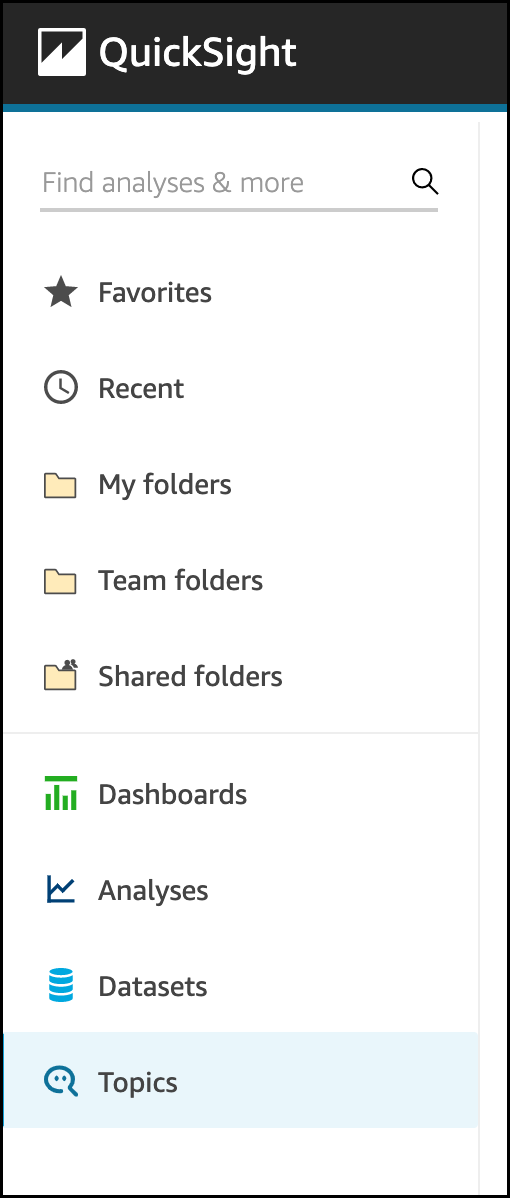
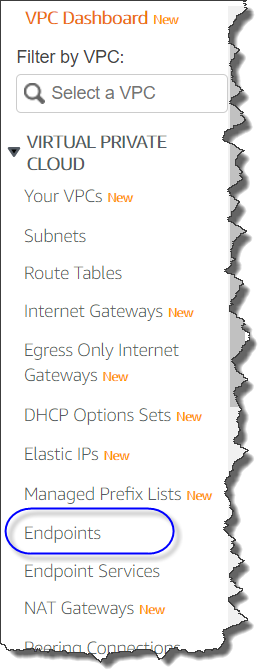
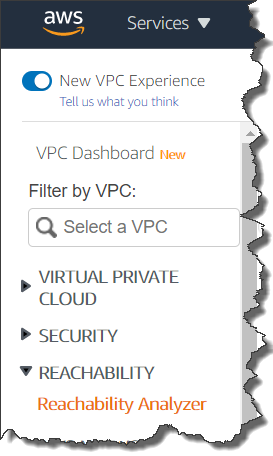
You see Reachability Analyzer in the left navigation of the VPC Management Console.

Click Reachability Analyzer, and also click Create and analyze path button, then you see new windows where you can specify a path between a source and destination, and start analysis.

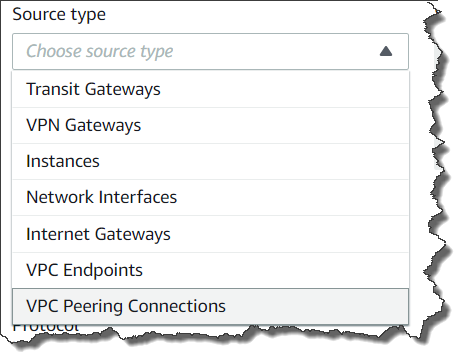
You can specify any of the following endpoint types: VPN Gateways, Instances, Network Interfaces, Internet Gateways, VPC Endpoints, VPC Peering Connections, and Transit Gateways for your source and destination of communication. For example, we set instance A for source and the instance B for destination. You can choose to check for connectivity via either the TCP or UDP protocols. Optionally, you can also specify a port number, or source, or destination IP address.

Configuring test path

Finally, click the Create and analyze path button to start the analysis. The analysis can take up to several minutes depending on the size and complexity of your VPCs, but it typically takes a few seconds.

You can now see the analysis result as Reachable. If you click the URL link of analysis id nip-xxxxxxxxxxxxxxxxx, you can see the route hop by hop.

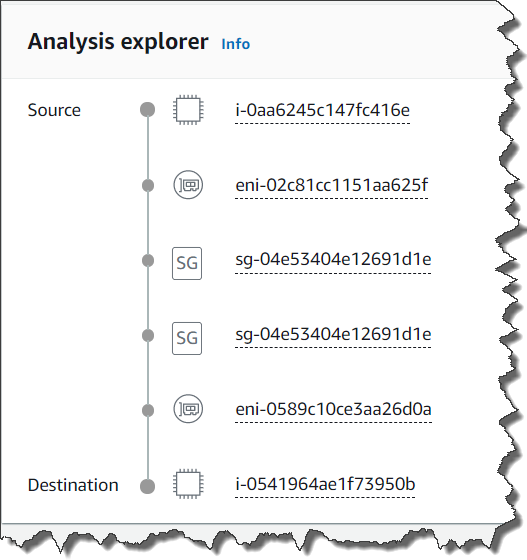
The communication from instance A to instance C is not reachable because the security group attached to instance C does not allow any incoming traffic.

If you click nip-xxxxxxxxxxxxxxxxx for more detail, you can check the Explanations for details.

Result Detail

Here we see the security group that blocked communication. When you click on the security group listed in the upper right corner, you can go directly to the security group editing window to change the security group rules. In this case adding a properly scoped ingress rule will allow the instances to communicate.

Available Today
This feature is available for all AWS commercial Regions except for China (Beijing), and China (Ningxia) regions. More information is available in our technical documentation, and remember that to use this feature your IAM permissions need to be set up as documented here.

– Kame

CloudFormation YAML template for test

---
Description: An AWS VPC configuration with 1 subnet, 2 security groups and 3 instances. When testing ReachabilityAnalyzer, this provides both a path found and path not found scenario.
AWSTemplateFormatVersion: 2010-09-09

Mappings:
  RegionMap:
    us-east-1:
      execution: ami-0915e09cc7ceee3ab
      ecs: ami-08087103f9850bddd

Resources:
  # VPC
  VPC:
    Type: AWS::EC2::VPC
    Properties:
      CidrBlock: 172.0.0.0/16
      EnableDnsSupport: true
      EnableDnsHostnames: true
      InstanceTenancy: default

  # Subnets
  Subnet1:
    Type: AWS::EC2::Subnet
    Properties:
      VpcId: !Ref VPC
      CidrBlock: 172.0.0.0/20
      MapPublicIpOnLaunch: false

  # SGs
  SecurityGroup1:
    Type: AWS::EC2::SecurityGroup
    Properties:
      GroupDescription: Allow all ingress and egress traffic
      VpcId: !Ref VPC
      SecurityGroupIngress:
        - CidrIp: 0.0.0.0/0
          IpProtocol: "-1" # -1 specifies all protocols

  SecurityGroup2:
    Type: AWS::EC2::SecurityGroup
    Properties:
      GroupDescription: Allow all egress traffic
      VpcId: !Ref VPC

  # Instances
  # Instance A and B should have a path between them since they are both in SecurityGroup 1
  InstanceA:
    Type: AWS::EC2::Instance
    Properties:
      ImageId:
        Fn::FindInMap:
          - RegionMap
          - Ref: AWS::Region
          - execution
      InstanceType: 't3.nano'
      SubnetId:
        Ref: Subnet1
      SecurityGroupIds:
        - Ref: SecurityGroup1

  # Instance A and B should have a path between them since they are both in SecurityGroup 1
  InstanceB:
    Type: AWS::EC2::Instance
    Properties:
      ImageId:
        Fn::FindInMap:
          - RegionMap
          - Ref: AWS::Region
          - execution
      InstanceType: 't3.nano'
      SubnetId:
        Ref: Subnet1
      SecurityGroupIds:
        - Ref: SecurityGroup1

  # This instance should not be reachable from Instance A or B since it is in SecurityGroup 2
  InstanceC:
    Type: AWS::EC2::Instance
    Properties:
      ImageId:
        Fn::FindInMap:
          - RegionMap
          - Ref: AWS::Region
          - execution
      InstanceType: 't3.nano'
      SubnetId:
        Ref: Subnet1
      SecurityGroupIds:
        - Ref: SecurityGroup2


Amazon HealthLake Stores, Transforms, and Analyzes Health Data in the Cloud

Post Syndicated from Harunobu Kameda original https://aws.amazon.com/blogs/aws/new-amazon-healthlake-to-store-transform-and-analyze-petabytes-of-health-and-life-sciences-data-in-the-cloud/

Healthcare organizations collect vast amounts of patient information every day, from family history and clinical observations to diagnoses and medications. They use all this data to try to compile a complete picture of a patient’s health information in order to provide better healthcare services. Currently, this data is distributed across various systems (electronic medical records, laboratory systems, medical image repositories, etc.) and exists in dozens of incompatible formats.

Emerging standards, such as Fast Healthcare Interoperability Resources (FHIR), aim to address this challenge by providing a consistent format for describing and exchanging structured data across these systems. However, much of this data is unstructured information contained in medical records (e.g., clinical records), documents (e.g., PDF lab reports), forms (e.g., insurance claims), images (e.g., X-rays, MRIs), audio (e.g., recorded conversations), and time series data (e.g., heart electrocardiogram) and it is challenging to extract this information.

It can take weeks or months for a healthcare organization to collect all this data and prepare it for transformation (tagging and indexing), structuring, and analysis. Furthermore, the cost and operational complexity of doing all this work is prohibitive for most healthcare organizations.

Many data to analyze

Today, we are happy to announce Amazon HealthLake, a fully managed, HIPAA-eligible service, now in preview, that allows healthcare and life sciences customers to aggregate their health information from different silos and formats into a centralized AWS data lake. HealthLake uses machine learning (ML) models to normalize health data and automatically understand and extract meaningful medical information from the data so all this information can be easily searched. Then, customers can query and analyze the data to understand relationships, identify trends, and make predictions.

How It Works
Amazon HealthLake supports copying your data from on premises to the AWS Cloud, where you can store your structured data (like lab results) as well as unstructured data (like clinical notes), which HealthLake will tag and structure in FHIR. All the data is fully indexed using standard medical terms so you can quickly and easily query, search, analyze, and update all of your customers’ health information.

Overview of HealthLake

With HealthLake, healthcare organizations can collect and transform patient health information in minutes and have a complete view of a patients medical history, structured in the FHIR industry standard format with powerful search and query capabilities.

From the AWS Management Console, healthcare organizations can use the HealthLake API to copy their on-premises healthcare data to a secure data lake in AWS with just a few clicks. If your source system is not configured to send data in FHIR format, you can use a list of AWS partners to easily connect and convert your legacy healthcare data format to FHIR.

HealthLake is Powered by Machine Learning
HealthLake uses specialized ML models such as natural language processing (NLP) to automatically transform raw data. These models are trained to understand and extract meaningful information from unstructured health data.

For example, HealthLake can accurately identify patient information from medical histories, physician notes, and medical imaging reports. It then provides the ability to tag, index, and structure the transformed data to make it searchable by standard terms such as medical condition, diagnosis, medication, and treatment.

Queries on tens of thousands of patient records are very simple. For example, a healthcare organization can create a list of diabetic patients based on similarity of medications by selecting “diabetes” from the standard list of medical conditions, selecting “oral medications” from the treatment menu, and refining the gender and search.

Healthcare organizations can use Juypter Notebook templates in Amazon SageMaker to quickly and easily run analysis on the normalized data for common tasks like diagnosis predictions, hospital re-admittance probability, and operating room utilization forecasts. These models can, for example, help healthcare organizations predict the onset of disease. With just a few clicks in a pre-built notebook, healthcare organizations can apply ML to their historical data and predict when a diabetic patient will develop hypertension in the next five years. Operators can also build, train, and deploy their own ML models on data using Amazon SageMaker directly from the AWS management console.

Let’s Create Your Own Data Store and Start to Test
Starting to use HealthLake is simple. You access AWS Management Console, and click select Create a datastore.

If you click Preload data, HealthLake will load test data and you can start to test its features. You can also upload your own data if you already have FHIR 4 compliant data. You upload it to S3 buckets, and import it to set its bucket name.

Once your Data Store is created, you can perform a Search, Create, Read, Update or Delete FHIR Query Operation. For example, if you need a list of every patient located in New York, your query setting looks like the screenshots below. As per the FHIR specification, deleted data is only hidden from analysis and results; it is not deleted from the service, only versioned.

Creating Query


You can choose Add search parameter for more nested conditions of the query as shown below.

Amazon HealthLake is Now in Preview
Amazon HealthLake is in preview starting today in US East (N. Virginia). Please check our web site and technical documentation for more information.

– Kame

New – Fully Serverless Batch Computing with AWS Batch Support for AWS Fargate

Post Syndicated from Harunobu Kameda original https://aws.amazon.com/blogs/aws/new-fully-serverless-batch-computing-with-aws-batch-support-for-aws-fargate/

We launched AWS Batch on December 2016 as a fully managed batch computing service that enables developers, scientists and engineers to easily and efficiently run hundreds of thousands of batch computing jobs on AWS. With AWS Batch, you no longer need to install and manage batch computing software or server clusters to run your jobs. AWS Batch is designed to remove the heavy lifting of batch workload management by creating compute environments, managing queues, and launching the appropriate compute resources to run your jobs quickly and efficiently.

Today, we are happy to introduce the ability to specify AWS Fargate as a computing resource for AWS Batch jobs. AWS Fargate is a serverless computing engine for containers that eliminates the need to provision and manage your own servers. With this enhancement, customers will now have a way to run their jobs on serverless computing resources: Simply submit your analysis, ML inference, map reduce analysis, and other batch workloads, and let Batch and Fargate handle the rest.

Basic Concept
Customers running batch workloads in the cloud have a variety of orchestration needs: for example, workloads need to be queued, submitted to a compute resource, given priorities, dependencies and retries need to be handled, compute needs to be scalable and available, and users need to account for utilization and resource management. While AWS Batch simplifies all the queuing, scheduling, and lifecycle management for customers, and even provisions and manages compute in the customer account, customers are looking for even more simplicity where they can get up and running in minutes. Time spent on image maintenance, right-sizing of compute, and monitoring is time not spent on applications. These customer needs have led us to develop Fargate integration, which we are pleased to announce today.

How It Works
Simply specify Fargate or Fargate Spot as the resource type in Batch and submit a Fargate job definition, and customers can now take advantage of the benefits of serverless computing without the need for image patching, isolation of VM boundaries, and calculation of the correct size.

To start, access the AWS Management Console of AWS Batch. Select Compute environments and Create.Getting startWe now have 2 new options for Provisioning model: Fargate and Fargate Spot.

Selecting FargateWith Fargate or Fargate Spot, you don’t need to worry about Amazon EC2 instances or Amazon Machine Images. Just set Fargate or Fargate Spot, your subnets, and the maximum total vCPU of the jobs running in the compute environment, and you have a ready-to-go Fargate computing environment. With Fargate Spot, you can take advantage of up to 70% discount for your fault-tolerant, time-flexible jobs.

vCPU fro FargateSelect Create compute environment. Then, Batch will create your Fargate-based compute environment.

Created Computing environment

Next step is to create the Job Queue, which is where your jobs live when waiting to be run. Then, Connect that to your Fargate compute environment.

After you finished setting up the job queue, next step is to create Job definitions for your Fargate jobs. Select Job definitions from the left pane, and click the Create button.

Setting up job definitionOnce you’ve selected Fargate for the job definition, you are now ready to submit your job. Batch will handle queueing, submission, and job lifecycle for you! You can access Job definitions by clicking Job definitions in the left pane. After selecting Job Definition, click Submit new job.

Submitting JobYou need to select the Job queue previously set up for your Fargate compute environment.

Submitting new job

You can now submit your new job by pressing the Submit button at the bottom.

Follow the steps below to set up your Fargate-based compute environment using the AWS CLI.

1. Creating Compute Environment

aws batch create-compute-environment --cli-input-json file://below_sample.json

{
    "computeEnvironmentName": "FargateComputeEnvironment",
    "type": "MANAGED",
    "state": "ENABLED",
    "computeResources": {
        "type": "FARGATE", # or FARGATE_SPOT
        "maxvCpus": 40,
        "subnets": [
             "subnet-xxxxxxxx","subnet-xxxxxxxx","subnet-xxxxxxxx"
        ],
        "securityGroupIds": ["sg-xxxxxxxxxxxxxxxx"],
        "tags": {
            "KeyName": "fargate"
        }
    },
"serviceRole": "arn:aws:iam::xxxxxxxxxxxx:role/service-role/AWSBatchServiceRole"
}

2.Creating Job Queue

aws batch create-job-queue --cli-input-json file://below_job_queue.json

{
  "jobQueueName": "FargateJobQueue",
  "state": "ENABLED",
  "priority": 1,
  "computeEnvironmentOrder": [
    {
      "order": 1,
      "computeEnvironment": "FargateComputeEnvironment"
    }
  ]
}

3.Creating and Registering Job Definitions
aws batch-fargate register-job-definition --cli-input-json file://below_job_definition.json

{
    "jobDefinitionName": "FargateJobDefinition",
    "type": "container",
    "propagateTags": true,
     "containerProperties": {
        "image": "xxxxxxxxxxxx.dkr.ecr.us-east-1.amazonaws.com/test:latest",
        "networkConfiguration": {
            "assignPublicIp": "ENABLED"
        },
        "fargatePlatformConfiguration": {
            "platformVersion": "LATEST"
        },
        "resourceRequirements": [
            {
                "value": "0.25",
                "type": "VCPU"
            },
            {
                "value": "512",
                "type": "MEMORY"
            }
        ],
        "jobRoleArn": "arn:aws:iam::xxxxxxxxxxxx:role/ecsTaskExecutionRole",
        "executionRoleArn":"arn:aws:iam::xxxxxxxxxxxx:role/ecsTaskExecutionRole",
        "logConfiguration": {
            "logDriver": "awslogs",
            "options": {
            "awslogs-group": "/ecs/sleepenv",
            "awslogs-region": "us-east-1",
            "awslogs-stream-prefix": "ecs"
            }
        }
     },
   "platformCapabilities": [
        "FARGATE"
    ],
    "tags": {
    "Service": "Batch",
    "Name": "JobDefinitionTag",
    "Expected": "MergeTag"
    }

You can also use other container image registries like Docker Hub in addition to Amazon Elastic Container Registry.

4.Submitting Job
aws batch submit-job --job-name faragteJob --job-queue FargateJobQueue --job-definition FargateJobDefinition

Generally Available Today
AWS Batch support for AWS Fargate is generally available today for all AWS Regions where AWS Batch and AWS Fargate are available. Please visit the AWS Batch page and technical documentation for more details.

– Kame

Managed Entitlements in AWS License Manager Streamlines License Tracking and Distribution for Customers and ISVs

Post Syndicated from Harunobu Kameda original https://aws.amazon.com/blogs/aws/managed-entitlements-for-aws-license-manager-streamlines-license-management-for-customers-and-isvs/

AWS License Manager is a service that helps you easily manage software licenses from vendors such as Microsoft, SAP, Oracle, and IBM across your Amazon Web Services (AWS) and on-premises environments. You can define rules based on your licensing agreements to prevent license violations, such as using more licenses than are available. You can set the rules to help prevent licensing violations or notify you of breaches. AWS License Manager also offers automated discovery of bring your own licenses (BYOL) usage that keeps you informed of all software installations and uninstallations across your environment and alerts you of licensing violations.

License Manager can manage licenses purchased in AWS Marketplace, a curated digital catalog where you can easily find, purchase, deploy, and manage third-party software, data, and services to build solutions and run your business. Marketplace lists thousands of software listings from independent software vendors (ISVs) in popular categories such as security, networking, storage, machine learning, business intelligence, database, and DevOps.

Managed entitlements for AWS License Manager
Starting today, you can use managed entitlements, a new feature of AWS License Manager that lets you distribute licenses across your AWS Organizations, automate software deployments quickly and track licenses – all from a single, central account. Previously, each of your users would have to independently accept licensing terms and subscribe through their own individual AWS accounts. As your business grows and scales, this becomes increasingly inefficient.

Customers can use managed entitlements to manage more than 8,000 listings available for purchase from more than 1600 vendors in the AWS Marketplace. Today, AWS License Manager automates license entitlement distribution for Amazon Machine Image, Containers and Machine Learning products purchased in the Marketplace with a variety of solutions.

How It Works
Managed entitlements provides built-in controls that allow only authorized users and workloads to consume a license within vendor-defined limits. This new license management mechanism also eliminates the need for ISVs to maintain their own licensing systems and conduct costly audits.

overview

Each time a customer purchases licenses from AWS Marketplace or a supported ISV, the license is activated based on AWS IAM credentials, and the details are registered to License Manager.

list of granted license

Administrators distribute licenses to AWS accounts. They can manage a list of grants for each license.

list of grants

Benefits for ISVs
AWS License Manager managed entitlements provides several benefits to ISVs to simplify the automatic license creation and distribution process as part of their transactional workflow. License entitlements can be distributed to end users with and without AWS accounts. Managed entitlements streamlines upgrades and renewals by removing expensive license audits and provides customers with a self-service tracking tool with built-in license tracking capabilities. There are no fees for this feature.

Managed entitlements provides the ability to distribute licenses to end users who do not have AWS accounts. In conjunction with the AWS License Manager, ISVs create a unique long-term token to identify the customer. The token is generated and shared with the customer. When the software is launched, the customer enters the token to activate the license. The software exchanges the long-term customer token for a short-term token that is passed to the API and the setting of the license is completed. For on-premises workloads that are not connected to the Internet, ISVs can generate a host-specific license file that customers can use to run the software on that host.

Now Available
This new enhancement to AWS License Manager is available today for US East (N. Virginia), US West (Oregon), and Europe (Ireland) with other AWS Regions coming soon.

Licenses purchased on AWS Marketplace are automatically created in AWS License Manager and no special steps are required to use managed entitlements. For more details about the new feature, see the managed entitlement pages on AWS Marketplace, and the documentation. For ISVs to use this new feature, please visit our getting started guide.

Get started with AWS License Manager and the new managed entitlements feature today.

– Kame

New – Amazon Lookout for Equipment Analyzes Sensor Data to Help Detect Equipment Failure

Post Syndicated from Harunobu Kameda original https://aws.amazon.com/blogs/aws/new-amazon-lookout-for-equipment-analyzes-sensor-data-to-help-detect-equipment-failure/

Companies that operate industrial equipment are constantly working to improve operational efficiency and avoid unplanned downtime due to component failure. They invest heavily and repeatedly in physical sensors (tags), data connectivity, data storage, and building dashboards over the years to monitor the condition of their equipment and get real-time alerts. The primary data analysis methods are single-variable threshold and physics-based modeling approaches, and while these methods are effective in detecting specific failure types and operating conditions, they can often miss important information detected by deriving multivariate relationships for each piece of equipment.

With machine learning, more powerful technologies have become available that can provide data-driven models that learn from an equipment’s historical data. However, implementing such machine learning solutions is time-consuming and expensive owing to capital investment and training of engineers.

Today, we are happy to announce Amazon Lookout for Equipment, an API-based machine learning (ML) service that detects abnormal equipment behavior. With Lookout for Equipment, customers can bring in historical time series data and past maintenance events generated from industrial equipment that can have up to 300 data tags from components such as sensors and actuators per model. Lookout for Equipment automatically tests the possible combinations and builds an optimal machine learning model to learn the normal behavior of the equipment. Engineers don’t need machine learning expertise and can easily deploy models for real-time processing in the cloud.

Customers can then easily perform ML inference to detect abnormal behavior of the equipment. The results can be integrated into existing monitoring software or AWS IoT SiteWise Monitor to visualize the real-time output or to receive alerts if an asset tends toward anomalous conditions.

How Lookout for Equipment Works
Lookout for Equipment reads directly from Amazon S3 buckets. Customers can publish their industrial data in S3 and leverage Lookout for Equipment for model development. A user determines the value or time period to be used for training and assigns an appropriate label. Given this information, Lookout for Equipment launches a task to learn and creates the best ML model for each customer.

Because Lookout for Equipment is an automated machine learning tool, it gets smarter over time as users use Lookout for Equipment to retrain their models with new data. This is useful for model re-creation when new invisible failures occur, or when the model drifts over time. Once the model is complete and can be inferred, Lookout for Equipment provides real-time analysis.

With the equipment data being published to S3, the user can scheduled inference that ranges from 5 minutes to one hour. When the user data arrives in S3, Lookout for Equipment fetches the new data on the desired schedule, performs data inference, and stores the results in another S3 bucket.

Set up Lookout for Equipment with these simply steps:

  1. Upload data to S3 buckets
  2. Create datasets
  3. Ingest data
  4. Create a model
  5. Schedule inference (if you need real-time analysis)

1. Upload data
You need to upload tag data from equipment to any S3 bucket.

2. Create Datasets

Select Create dataset, and set Dataset name, and set Data Schema. Data schema is like a data design document that defines the data to be fed in later. Then select Create.

creating datasets console

3. Ingest data
After a dataset is created, the next step is to ingest data. If you are familiar with Amazon Personalize or Amazon Forecast, doesn’t this screen feel familiar? Yes, Lookout for Equipment is as easy to use as those are.

Select Ingest data.

Ingesting data consoleSpecify the S3 bucket location where you uploaded your data, and an IAM role. The IAM role has to have a trust relationship to “lookoutequipment.amazonaws.com” You can use the following policy file for the test.

{
  "Version": "2012-10-17",
  "Statement": [
    {
      "Effect": "Allow",
      "Principal": {
        "Service": "lookoutequipment.amazonaws.com"
      },
      "Action": "sts:AssumeRole"
    }
  ]
}

The data format in the S3 bucket has to match the Data Schema you set up in step 2. Please check our technical documents for more detail. Ingesting data takes a few minutes to tens of minutes depending on your data volume.

4. Create a model
After data ingest is completed, you can train your own ML model now. Select Create new model. Fields show us a list of fields in the ingested data. By default, no field is selected. You can select fields you want Lookout for Equipment to learn. Lookout for Equipment automatically finds and trains correlations from multiple specified fields and creates a model.

Image illustrates setting up fields.

If you are sure that your data has some unusual data included, you can optionally set the windows to exclude that data.

setting up maintenance windowOptionally, you can divide ingested data for training and then for evaluation. The data specified during the evaluation period is checked compared to the trained model.

setting up evaluation window

Once you select Create, Lookout for Equipment starts to train your model. This process takes minutes to hours depending on your data volume. After training is finished, you can evaluate your model with the evaluation period data.

model performance console

5. Schedule Inference
Now it is time to analyze your real time data. Select Schedule Inference, and set up your S3 buckets for input.

setting up input S3 bucket

You can also set Data upload frequency, which is actually the same as inferencing frequency, and Offset delay time. Then, you need to set up Output data as Lookout for Equipment outputs the result of inference.

setting up inferenced output S3 bucket

Amazon Lookout for Equipment is In Preview Today
Amazon Lookout for Equipment is in preview today at US East (N. Virginia), Asia Pacific (Seoul), and Europe (Ireland) and you can see the documentation here.

– Kame

New – Amazon QuickSight Q Answers Natural-Language Questions About Business Data

Post Syndicated from Harunobu Kameda original https://aws.amazon.com/blogs/aws/amazon-quicksight-q-to-answer-ad-hoc-business-questions/

We launched Amazon QuickSight as the first Business Intelligence (BI) service with Pay-per-Session pricing. Today, we are happy to announce the preview of Amazon QuickSight Q, a Natural Language Query (NLQ) feature powered by machine learning (ML). With Q, business users can now use QuickSight to ask questions about their data using everyday language and receive accurate answers in seconds.

For example, in response to questions such as, “What is my year-to-date year-over-year sales growth?” or “Which products grew the most year-over-year?” Q automatically parses the questions to understand the intent, retrieves the corresponding data and returns the answer in the form of a number, chart, or table in QuickSight. Q uses state-of-the art ML algorithms to understand the relationships across your data and build indexes to provide accurate answers. Also, since Q does not require BI teams to pre-build data models on specific datasets, you can ask questions across all your data.

The Need for Q
Traditionally, BI engineers and analysts create dashboards to make it easier for business users to view and monitor key metrics. When a new business question arises and no answers are found in the data displayed on an existing dashboard, the business user must submit a data request to the BI Team, which is often thinly staffed, and wait several weeks for the question to be answered and added to the dashboard.

A sales manager looking at a dashboard that outlines daily sales trends may want to know what their overall sales were for last week, in comparison to last month, the previous quarter, or the same time last year. They may want to understand how absolute sales compare to growth rates, or how growth rates are broken down by different geographies, product lines, or customer segments to identify new opportunities for growth. This may require a BI team to reconstruct the data, create new data models, and answer additional questions. This process can take from a few days to a few weeks. Such specific data requests increase the workload for BI teams that may be understaffed, increases the time spent waiting for answers, and frustrates business users and executives who need the data to make timely decisions.

How Q Works
To ask a question, you simply type your question into the QuickSight Q search bar. Once you start typing in your question, Q provides autocomplete suggestions with key phrases and business terms to speed up the process. It also automatically performs spell check, and acronym and synonym matching, so you don’t have to worry about typos or remember the exact business terms in the data. Q uses natural language understanding techniques to extract business terms (e.g., revenue, growth, allocation, etc.) and intent from your questions, retrieves the corresponding data from the source, and returns the answers in the form of numbers and graphs.

Q further learns from user interactions from within the organization to continually improve accuracy. For example, if Q doesn’t understand a phrase in a question, such as what “my product” refers to, Q prompts the user to choose from a drop-down menu of suggested options in the search bar. Q then remembers the phrase for next time, thus improving accuracy with use. If you ask a question about all your data, Q provides an answer using that data. Users are not limited to asking questions that are confined to a pre-defined dashboard and can ask any questions relevant to your business.

Let’s see a demo. We assume that there is a dashboard of sales for a company.

Dashboard of Quicksight

The business users of the dashboard can drill down and slice and dice the data simply by typing their questions on the Q search bar above.

Let’s use the Q search bar to ask a question, “Show me last year’s weekly sales in California.” Q generates numbers and a graph within seconds.

Generated dashboard

You can click “Looks good” or “Not quite right” on the answer. When clicking “Not quite right,” you can submit your feedback to your BI team to help improve Q. You can also investigate the answer further. Let’s add “versus New York” to the end of the question and hit enter. A new answer will pop up.

Generated new graph

Next, let’s investigate further in California. Type in “What are the best selling categories in California.

categories detail

With Q, you can easily change the presentation. Let’s see another diagram for the same question.

line start

Next, let’s take a look at the biggest industry, “Finance.” Type in “Show me the sales growth % week over week in the Finance sector” to Q, and specify “Line chart” to check weekly sales revenue growth.

The sales revenue shows growth, but it has peak and off-peak spikes. With these insights, you might now consider how to stabilize for a better profit structure.

Getting Started with Amazon QuickSight Q
A new “Q Topics” link will appear on the left navigation bar. Topics are a collection of one or more datasets and are meant to represent a subject area that users can ask questions about. For example, a marketing team may have Q Topics for “Ad Spending,” “Email Campaign,” “Website Analytics,” and others. Additionally, as an author, you can:

  • Add friendly names, synonyms, and descriptions to datasets and columns to improve Q’s answers.
  • Share the Topic to your users so they can ask questions about the Topic.
  • See questions your users are asking, how Q answered these questions, and improve upon the answer.

topic tool barSelect Topics, and set Topic name and its Description.

setting up topics

After clicking the Continue button, you can add datasets to a topic in two ways: You can add one or more datasets directly to your topic by selecting Add datasets, or you can import all the datasets in an existing dashboard into your topic by selecting Import dashboard.

The next step is to make your datasets natural-language friendly. Generally, names of datasets and columns are based on technical naming conventions and do not reflect how they are referred to by end users. Q relies heavily on names to match the right dataset and column with the terms used in questions. Therefore, such technical names must be converted to user-friendly names to ensure that they can be mapped correctly. Below are examples:

  • Dataset Name – D_CUST_DLY_ORD_DTL → Friendly Name: Customer Daily Order Details.
  • Column Name: pdt_cd Column → Friendly name: Product Code

Also, you can set up synonyms for each column so users can use the terms they are most comfortable with. For example, some users might input the term “client” or “segment” instead of “industry.” Q provides a feature to correct to the right name when typing the query, but BI operators can also set up synonyms for frequently used words. Click “Topics” in the left pane and choose the dashboard where you want to set synonyms.

Then, choose “datasets.

Now, we can set a Friendly Name or synonyms as Aliases, such as “client” for “Customer,” or “Segment” for “Industry.”

setting up Friendly Name

After adding synonyms, a user can save the changes and start asking questions in the Q search bar.

Amazon QuickSight Q Preview Available Today
Q is available in preview for US East (N. Virginia), US West (Oregon), US East (Ohio) and Europe (Ireland). Getting started with Q is just a few clicks away from QuickSight. You can use Q with AWS data sources such as Amazon Redshift, Amazon RDS, Amazon Aurora, Amazon Athena, and Amazon S3, or third-party commercial sources such as SQL Server, Teradata, and Snowflake. Salesforce, ServiceNow, and Adobe automatically integrate with all data sources supported by QuickSight, including business applications such as Analytics or Excel.

Learn more about Q and get started with the preview today.

– Kame


New- Amazon DevOps Guru Helps Identify Application Errors and Fixes

Post Syndicated from Harunobu Kameda original https://aws.amazon.com/blogs/aws/amazon-devops-guru-machine-learning-powered-service-identifies-application-errors-and-fixes/

Today, we are announcing Amazon DevOps Guru, a fully managed operations service that makes it easy for developers and operators to improve application availability by automatically detecting operational issues and recommending fixes. DevOps Guru applies machine learning informed by years of operational excellence from Amazon.com and Amazon Web Services (AWS) to automatically collect and analyze data such as application metrics, logs, and events to identify behavior that deviates from normal operational patterns.

Once a behavior is identified as an operational problem or risk, DevOps Guru alerts developers and operators to the details of the problem so they can quickly understand the scope of the problem and possible causes. DevOps Guru provides intelligent recommendations for fixing problems, saving you time resolving them. With DevOps Guru, there is no hardware or software to deploy, and you only pay for the data analyzed; there is no upfront cost or commitment.

Distributed/Complex Architecture and Operational Excellence
As applications become more distributed and complex, operators need more automated practices to maintain application availability and reduce the time and effort spent on detecting, debugging, and resolving operational issues. Application downtime, for example, as caused by misconfiguration, unbalanced container clusters, or resource depletion, can result in significant revenue loss to an enterprise.

In many cases, companies must invest developer time in deploying and managing multiple monitoring tools, such as metrics, logs, traces, and events, and storing them in various locations for analysis. Developers or operators also spend time developing and maintaining custom alarms to alert them to issues such as sudden spikes in load balancer errors or unusual drops in application request rates. When a problem occurs, operators receive multiple alerts related to the same issue and spend time combining alerts to prioritize those that need immediate attention.

How DevOps Guru Works
The DevOps Guru machine learning models leverages AWS expertise in running highly available applications for the world’s largest e-commerce business for the past 20 years. DevOps Guru automatically detects operational problems, details the possible causes, and recommends remediation actions. DevOps Guru provides customers with a single console experience to search and visualize operational data by integrating data across multiple sources supporting Amazon CloudWatch, AWS Config, AWS CloudTrail, AWS CloudFormation, and AWS X-Ray and reduces the need to use multiple tools.

Getting Started with DevOps Guru
Activating DevOps Guru is as easy as accessing the AWS Management Console and clicking Enable. When enabling DevOps Guru, you can select the IAM role. You’ll then choose the AWS resources to analyze, which may include all resources in your AWS account or just specified CloudFormation StackSets. Finally, you can set an Amazon SNS topic if you want to send notifications from DevOps Guru via SNS.

DevOps Guru starts to accumulate logs and analyze your environment; it can take up to several hours. Let’s assume we have a simple serverless architecture as shown in this illustration.

When the system has an error, the operator needs to investigate if the error came from Amazon API Gateway, AWS Lambda, or AWS DynamoDB. They must then determine the root cause and how to fix the issue. With DevOps Guru, the process is now easy and simple.

When a developer accesses the management console of DevOps Guru, they will see a list of insights which is a collection of anomalies that are created during the analysis of the AWS resources configured within your application. In this case, Amazon API Gateway, AWS Lambda, and Amazon DynamoDB. Each insight contains observations, recommendations, and contextual data you can use to better understand and resolve the operational problem.

The list below shows the insight name, the status (closed or ongoing), severity, and when the insight was created. Without checking any logs, you can immediately see that in the most recent issue (line1), a problem with a Lambda function within your stack was the cause of the issue, and it was related to duration. If the issue was still occurring, the status would be listed as Ongoing. Since this issue was temporary, the status is showing Closed.

Insights

Let’s look deeper at the most recent anomaly by clicking through the first insight link. There are two tabs: Aggregated metrics and Graphed anomalies.

Aggregated metrics display metrics that are related to the insight. Operators can see which AWS CloudFormation stack created the resource that emitted the metric, the name of the resource, and its type. The red lines on a timeline indicate spans of time when a metric emitted unusual values. In this case, the operator can see the specific time of day on Nov 24 when the anomaly occurred for each metric.

Graphed anomalies display detailed graphs for each of the insight’s anomalies. Operators can investigate and look at an anomaly at the resource level and per statistic. The graphs are grouped by metric name.

metrics

By reviewing aggregated and graphed anomalies, an operator can see when the issue occurred, whether it is still ongoing, as well as the resources impacted. It appears the increased Lambda duration had a corresponding impact on API Gateway causing timeouts and resulted in 5XX errors in API Gateway.

Dev Ops Guru also provides Relevant events which are related to activities that changed your application’s configuration as illustrated below.

Events

We can now see that a configuration change happened 2 hours before this issue occurred. If we click the point on the graph at 20:30 on 11/24, we can learn more and see the details of that change.

If you click through to the Ops event, the AWS CloudTrail logs would show that the configuration change was twofold: 1) a change in the concurrency provisioned capacity on a Lambda function and 2) the reduction in the integration timeout on an API integration latency.

recommendations to fix

The recommendations tell the operator to evaluate the provisioned concurrency for Lambda and how to troubleshoot errors in API Gateway. After further evaluation, the operator will discover this is exactly correct. The root cause is a mismatch between the Lambda provisioned concurrency setting and the API Gateway integration latency timeout. When the Lambda configuration was updated in the last deployment, it altered how this application responded to burst traffic, and it no longer fit within the API Gateway timeout window. This error is unlikely to have been found in unit testing and will occur repeatedly if the configurations are not updated.

DevOps Guru can send alerts of anomalies to operators via Amazon SNS, and it is integrated with AWS Systems Manager OpsCenter, enabling customers to receive insights directly within OpsCenter as quickly diagnose and remediate issues.

Available for Preview Today
Amazon DevOps Guru is available for preview in US East (N. Virginia), US East (Ohio), US West (Oregon), Europe (Ireland), and Asia Pacific (Tokyo). To learn more about DevOps Guru, please visit our web site and technical documentation, and get started today.

– Kame


New – Amazon EBS gp3 Volume Lets You Provision Performance Apart From Capacity

Post Syndicated from Harunobu Kameda original https://aws.amazon.com/blogs/aws/new-amazon-ebs-gp3-volume-lets-you-provision-performance-separate-from-capacity-and-offers-20-lower-price/

Amazon Elastic Block Store (EBS) is an easy-to-use, high-performance block storage service designed for use with Amazon EC2 instances for both throughput and transaction-intensive workloads of all sizes. Using existing general purpose solid state drive (SSD) gp2 volumes, performance scales with storage capacity. By provisioning larger storage volume sizes, you can improve application input / output operations per second (IOPS) and throughput.

However some applications, such as MySQL, Cassandra, and Hadoop clusters, require high performance but not high storage capacity. Customers want to meet the performance requirements of these types of applications without paying for more storage volumes than they need.

Today I would like to tell you about gp3, a new type of SSD EBS volume that lets you provision performance independent of storage capacity, and offers a 20% lower price than existing gp2 volume types.

New gp3 Volume Type

With EBS, customers can choose from multiple volume types based on the unique needs of their applications. We introduced general purpose SSD gp2 volumes in 2014 to offer SSD performance at a very low price. gp2 provides an easy and cost-effective way to meet the performance and throughput requirements of many applications our customers use such as virtual desktops, medium-sized databases such as SQLServer and OracleDB, and development and testing environments.

That said, some customers need higher performance. Because the basic idea behind gp2 is that the larger the capacity, the faster the IOPS, customers may end up provisioning more storage capacity than desired. Even though gp2 offers a low price point, customers end up paying for storage they don’t need.

The new gp3 is the 7th variation of EBS volume types. It lets customers independently increase IOPS and throughput without having to provision additional block storage capacity, paying only for the resources they need.

gp3 is designed to provide predictable 3,000 IOPS baseline performance and 125 MiB/s regardless of volume size. It is ideal for applications that require high performance at a low cost such as MySQL, Cassandra, virtual desktops and Hadoop analytics. Customers looking for higher performance can scale up to 16,000 IOPS and 1,000 MiB/s for an additional fee. The top performance of gp3 is 4 times faster than max throughput of gp2 volumes.

How to Switch From gp2 to gp3

If you’re currently using gp2, you can easily migrate your EBS volumes to gp3 using Amazon EBS Elastic Volumes, an existing feature of Amazon EBS. Elastic Volumes allows you to modify the volume type, IOPS, and throughput of your existing EBS volumes without interrupting your Amazon EC2 instances. Also, when you create a new Amazon EBS volume, Amazon EC2 instance, or Amazon Machine Image (AMI), you can choose the gp3 volume type. New AWS customers receive 30GiB of gp3 storage with the baseline performance at no charge for 12 months.

Available Today

The gp3 volume type is available for all AWS Regions. You can access the AWS Management Console to launch your first gp3 volume.

For more information, see Amazon Elastic Block Store and get started with gp3 today.

– Kame


New – Amazon EC2 R5b Instances Provide 3x Higher EBS Performance

Post Syndicated from Harunobu Kameda original https://aws.amazon.com/blogs/aws/new-amazon-ec2-r5b-instances-providing-3x-higher-ebs-performance/

In July 2018, we announced memory-optimized R5 instances for the Amazon Elastic Compute Cloud (Amazon EC2). R5 instances are designed for memory-intensive applications such as high-performance databases, distributed web scale in-memory caches, in-memory databases, real time big data analytics, and other enterprise applications.

R5 instances offer two different block storage options. R5d instances offer up to 3.6TB of NMVe instance storage for applications that need access to high-speed, low latency local storage. In addition, all R5b instances work with Amazon Elastic Block Store. Amazon EBS is an easy-to-use, high-performance and highly available block storage service designed for use with Amazon EC2 for both throughput- and transaction-intensive workloads at any scale. A broad range of workloads, such as relational and non-relational databases, enterprise applications, containerized applications, big data analytics engines, file systems, and media workflows are widely deployed on Amazon EBS.

Today, we are happy to announce the availability of R5b, a new addition to the R5 instance family. The new R5b instance is powered by the AWS Nitro System to provide the best network-attached storage performance available on EC2. This new instance offers up to 60Gbps of EBS bandwidth and 260,000 I/O operations per second (IOPS).

Amazon EC2 R5b Instance
Many customers use R5 instances with EBS for large relational database workloads such as commerce platforms, ERP systems, and health record systems, and they rely on EBS to provide scalable, durable, and high availability block storage. These instances provide sufficient storage performance for many use cases, but some customers require higher EBS performance on EC2.

R5 instances provide bandwidth up to 19Gbps and maximum EBS performance of 80K IOPS, while the new R5b instances support bandwidth up to 60Gbps and EBS performance of 260K IOPS, providing 3x higher EBS-Optimized performance compared to R5 instances, enabling customers to lift and shift large relational databases applications to AWS. R5b and R5 vCPU to memory ratio and network performance are the same.

Instance Name vCPUs Memory EBS Optimized Bandwidth (Mbps) EBS Optimized IOPs@16KiB (IO/s)
r5b.large 2 16 GiB Up to 10,000 Up to 43,333
r5b.xlarge 4 32 GiB Up to 10,000 Up to 43,333
r5b.2xlarge 8 64 GiB Up to 10,000 Up to 43,333
r5b.4xlarge 16 128 GiB 10,000 43,333
r5b.8xlarge 32 256 GiB 20,000 86,667
r5b.12xlarge 48 384 GiB 30,000 130,000
r5b.16xlarge 64 512 GiB 40,000 173,333
r5b.24xlarge 96 768 GiB 60,000 260,000
r5b.metal 96 768 GiB 60,000 260,000

Customers operating storage performance sensitive workloads can migrate from R5 to R5b to consolidate their existing workloads into fewer or smaller instances. This can reduce the cost of both infrastructure and licensed commercial software working on those instances. R5b instances are supported by Amazon RDS for Oracle and Amazon RDS for SQL Server, simplifying the migration path for large commercial database applications and improving storage performance for current RDS customers by up to 3x.

All Nitro compatible AMIs support R5b instances, and the EBS-backed HVM AMI must have NVMe 1.0e and ENA drivers installed at R5b instance launch. R5b supports io1, io2 Block Express (in preview), gp2, gp3, sc1, st1 and standard volumes. R5b does not support io2 volumes and io1 volumes that have multi-attach enabled, which are coming soon.

Available Today

R5b instances are available in the following regions: US West (Oregon), Asia Pacific (Tokyo), US East (N. Virginia), US East (Ohio), Asia Pacific (Singapore), and Europe (Frankfurt). RDS on r5b is available in US East (Ohio), Asia Pacific (Singapore), and Europe (Frankfurt), and support in other regions is coming soon.

Learn more about EC2 R5 instances and get started with Amazon EC2 today.

– Kame;

New – Use AWS PrivateLink to Access AWS Lambda Over Private AWS Network

Post Syndicated from Harunobu Kameda original https://aws.amazon.com/blogs/aws/new-use-aws-privatelink-to-access-aws-lambda-over-private-aws-network/

AWS Lambda is a serverless computing service that lets you run code without provisioning or managing servers. You simply upload your code and Lambda does all the work to execute and scale your code for high availability. Many AWS customers today use this serverless computing platform to significantly improve their productivity while developing and operating applications.

Today, I am happy to announce that AWS Lambda now supports AWS PrivateLink which lets you invoke Lambda functions securely from inside your virtual private cloud (VPC) or on-premises data centers without exposing traffic to the public Internet.

Until now, in order to call Lambda functions, a VPC required an Internet Gateway, network address translation (NAT) gateway, and/or public IP address. With this update, PrivateLink routes the call through the AWS private network, eliminating the need for Internet access. Additionally, you can now call the Lambda API directly from your on-premises data centers by connecting to a VPC using AWS Direct Connect or AWS VPN Connections.

Some customers wanted to manage and call Lambda functions from a VPC that doesn’t have internet access due to internal IT governance requirements. With this update, you will be able to use Lambda. Also, customer who have maintained NAT Gateway to access Lambda from a VPC, can use a VPC endpoint instead of the NAT Gateway thus saving the cost of NAT Gateway. Security is further improved because you no longer need to allow Internet access to your VPC to call Lambda functions, and network architecture becomes more simple, and easily manageable. Previously, in the case of VPC-enabled Lambda function calling another Lambda function, such a call had to go through a NAT GW but now customer’s can use a VPC endpoint instead.

How to Get Started With AWS PrivateLink

AWS PrivateLink uses an elastic network interface called the “Interface VPC endpoint” to act as an entry point for traffic targeting AWS services. Interface endpoints limit all network traffic to AWS internal network and provide secure access to your services. The Interface VPC endpoint is a redundant, highly available VPC component that has a private IP address and is scaled horizontally.

Getting Started Using the AWS Management Console

To get started, you can use the AWS Management Console, AWS CLI, or AWS CloudFormation. In this first example, I’ll show the Management Console.

First, you access the VPC management console, and click “Endpoints.”

Click “Create Endpoint” button.

Type “lambda” in the search bar, and you’ll see Service Name. Select it, and choose the VPC where you want to create the interface endpoint.

After that, you are prompted to specify subnets where you may want to create endpoints.

If you want, you can set your own DNS name to the endpoint with Amazon Route53 private hosted zones when you enable “Enable DNS name” option. With this option enabled, any request for Lambda functions in your public subnet can not invoke Lambda via your Internet Gateway, and communications has to go through via VPC endpoints in Private subnet.

Next, specify “Security Group” for protocols, port, and source/target IP address control.

Then, set the policy to control who has access to the VPC endpoint. By default, “Full Access” is selected, but we always recommend you first grant access only to the minimum necessary principal; you can modify this later.

Following is a sample you can customize to create your “Policy.” With this sample, only the IAM user “MyUser” can invoke a Lambda function of “my-function.”

{
    "Statement": [
        {
            "Principal": "arn:aws:iam::123412341234:user/MyUser",
            "Action": [
                "lambda:InvokeFunction"
            ],
            "Effect": "Allow",
            "Resource": [
               "arn:aws:lambda:us-east-2:123456789012:function:my-function:1”
            ]
        }
    ]
}

Now, it’s time for the final step. Click the “Create endpoint” button. You’ll see the success dialog shown below.

Now you can invoke Lambda functions with the endpoint DNS name. You can also invoke Lambda functions from another VPC connected to the original VPC via VPC peering, AWS Transit Gateway, or you can even do so from another AWS account.

Getting Started Using the AWS Command Line Interface (CLI)

Using AWS CLI is more precise and easy if you already have the AWS CLI environment. 

aws ec2 create-vpc-endpoint --vpc-id vpc-ec43eb89 \
        --vpc-endpoint-type Interface --service-name lambda.<region code>.amazonaws.com \
        --subnet-id subnet-abababab --security-group-id sg-1a2b3c4d

Available Today

AWS PrivateLink support by AWS Lambda is now available in all AWS Regions except for Africa (Cape Town) and Europe (Milan). Supporting those regions are on our roadmap, and is coming soon. Standard AWS PrivateLink pricing apply to Lambda interface endpoints. You will be billed each hour the interface endpoint is provisioned in each Availability Zone, and for the data processed through the interface endpoint. No additional fee is required for AWS Lambda. See the AWS PrivateLink pricing page, and documentation for more detail.

– Kame;