Tag Archives: infrastructure

How GitHub engineers tackle platform problems

Post Syndicated from Fabian Aguilar Gomez original https://github.blog/engineering/infrastructure/how-github-engineers-tackle-platform-problems/


In my spare time I enjoy building Gundam models, which are model kits to build iconic mechas from the Gundam universe. You might be wondering what this has to do with software engineering. Product engineers can be seen as the engineers who take these kits and build the Gundam itself. They are able to utilize all pieces and build a working product that is fun to collect or even play with!

Platform engineers, on the other hand, supply the tools needed to build these kits (like clippers and files) and maybe even build a cool display so everyone can see the final product. They ensure that whoever is constructing it has all the necessary tools, even if they don’t physically build the Gundam themselves.

A photograph of several Gundam models on a shelf.

About a year ago, my team at GitHub moved to the infrastructure organization, inheriting new roles and Areas of Responsibility (AoRs). Previously, the team had tackled external customer problems, such as building the new deployment views across environments. This involved interacting with users who depend on GitHub to address challenges within their respective industries. Our new customers as a platform engineering team are internal, which makes our responsibilities different from the product-focused engineering work we were doing before.

Going back to my Gundam example, rather than constructing kits, we’re now responsible for building the components of the kits. Adapting to this change meant I had to rethink my approach to code testing and problem solving.

Whether you’re working on product engineering or on the platform side, here are a few best practices to tackle platform problems.

Understanding your domain

One of the most critical steps before tackling problems is understanding the domain. A “domain” is the business and technical subject area in which a team and platform organization operate. This requires gaining an understanding of technical terms and how these systems interact to provide fast and reliable solutions. Here’s how to get up to speed: 

  • Talk to your neighbors: Arrange a handover meeting with a team that has more knowledge and experience with the subject matter. This meeting provides an opportunity to ask questions about terminology and gain a deeper understanding of the problems the team will be addressing. 
  • Investigate old issues: If there is a backlog of issues that are either stale or still persistent, they may give you a better understanding of the system’s current limitations and potential areas for improvement.
  • Read the docs: Documentation is a goldmine of knowledge that can help you understand how the system works. 

Bridging concepts to platform-specific skills

While the preceding advice offers general guidance applicable to both product and platform teams, platform teams — serving as the foundational layer — necessitate a more in-depth understanding.

  • Networks: Understanding network fundamentals is crucial for all engineers, even those not directly involved in network operations. This includes concepts like TCP, UDP, and L4 load balancing, as well as debugging tools such as dig. A solid grasp of these areas is essential to comprehend how network traffic impacts your platform.
  • Operating systems and hardware: Selecting appropriate virtual machines (VMs) or physical hardware is vital for both scalability and cost management. Making well-informed choices for particular applications requires a strong grasp of both. This is closely linked to choosing the right operating system for your machines, which is important to avoid systems with vulnerabilities or those nearing end of life.
  • Infrastructure as Code (IaC): Automation tools like Terraform, Ansible, and Consul are becoming increasingly essential. Proficiency in these tools is becoming a necessity as they significantly decrease human error during infrastructure provisioning and modifications. 
  • Distributed systems: Dealing with platform issues, particularly in distributed systems, necessitates a deep understanding that failures are inevitable. Consequently, employing proactive solutions like failover and recovery mechanisms is crucial for preserving system reliability and preventing adverse user experiences. The optimal approach for this depends entirely on the specific problem and the desired system behavior.

Knowledge sharing

By sharing lessons and ideas, engineers can introduce new perspectives that lead to breakthroughs and innovations. Taking the time to understand why a project or solution did or didn’t work and sharing those findings provides new perspectives that we can use going forward.

Here are three reasons why knowledge sharing is so important: 

  • Teamwork makes the dream work: Collaboration often results in quicker problem resolution and fosters new solution innovation, as engineers have the opportunity to learn from each other and expand upon existing ideas.
  • Prevent lost knowledge: If we don’t share our lessons learned, we prevent the information from being disseminated across the team or organization. This becomes a problem if an engineer leaves the company or is simply unavailable.
  • Improve our customer success: As engineers, our solutions should effectively serve our customers. By sharing our knowledge and lessons learned, we can help the team build reliable, scalable, and secure platforms, which will enable us to create better products that meet customer needs and expectations!

But big differences start to appear between product engineering and infrastructure engineering when it comes to the impact radius and the testing process.

Impact radius

With platforms being the fundamental building blocks of a system, any change (small or large) can affect a wide range of products. Our team is responsible for DNS, a foundational service that impacts numerous products. Even a minor alteration to this service can have extensive repercussions, potentially disrupting access to content across our site and affecting products ranging from GitHub Pages to GitHub Copilot. 

  • Understand the radius: Or understand the downstream dependencies. Direct communication with teams that depend on our service provides valuable insights into how proposed changes may affect other services.
  • Postmortems: By looking at past incidents related to our platform and asking “What is the impact of this incident?”, we can form more context around what change or failure was introduced, how our platform played a role in it, and how it was fixed.
  • Monitoring and telemetry: Condense important monitoring and logging into a small and quickly digestible medium to give you the general health of the system. This could be a Single Availability Metric (SAM), for example. The ability to quickly glance at a single dashboard allows engineers to rapidly pinpoint the source of an issue and streamlines the debugging and incident mitigation process, as compared to searching through and interpreting detailed monitors or log messages.

Testing changes

Testing changes in a distributed environment can be challenging, especially for services like DNS. A crucial step in solving this issue is utilizing a test site as a “real” machine where you can implement and assess all your changes. 

  • Infrastructure as Code (IaC): When using tools like Terraform or Ansible, it’s crucial to test fundamental operations like provisioning and deprovisioning machines. There are circumstances where a machine will need to be re-provisioned. In these cases, we want to ensure the machine is not accidentally deleted and that we retain the ability to create a new one if needed.
  • End-to-End (E2E): Begin directing some network traffic to these servers. Then the team can observe host behavior by directly interacting with it, or we can evaluate functionality by diverting a small portion of traffic.
  • Self-healing: We want to test the platform’s ability to recover from unexpected loads and identify bottlenecks before they impact our users. Early identification of bottlenecks or bugs is crucial for maintaining the health of our platform.

Ideally changes will be implemented on a host-by-host basis once testing is complete. This approach allows for individual machine rollback and prevents changes from being applied to unaffected hosts.

What to remember

Platform engineering can be difficult. The systems GitHub operates with are complex and there are a lot of services and moving parts. However, there’s nothing like seeing everything come together. All the hard work our engineering teams do behind the scenes really pays off when the platform is running smoothly and teams are able to ship faster and more reliably — which allows GitHub to be the home to all developers.

Want to dive deeper? Check out our infrastructure related blog posts.

The post How GitHub engineers tackle platform problems appeared first on The GitHub Blog.

Communications Backdoor in Chinese Power Inverters

Post Syndicated from Bruce Schneier original https://www.schneier.com/blog/archives/2025/05/communications-backdoor-in-chinese-power-inverters.html

This is a weird story:

U.S. energy officials are reassessing the risk posed by Chinese-made devices that play a critical role in renewable energy infrastructure after unexplained communication equipment was found inside some of them, two people familiar with the matter said.

[…]

Over the past nine months, undocumented communication devices, including cellular radios, have also been found in some batteries from multiple Chinese suppliers, one of them said.

Reuters was unable to determine how many solar power inverters and batteries they have looked at.

The rogue components provide additional, undocumented communication channels that could allow firewalls to be circumvented remotely, with potentially catastrophic consequences, the two people said.

The article is short on fact and long on innuendo. Both more details and credible named sources would help a lot here.

China Sort of Admits to Being Behind Volt Typhoon

Post Syndicated from Bruce Schneier original https://www.schneier.com/blog/archives/2025/04/china-sort-of-admits-to-being-behind-volt-typhoon.html

The Wall Street Journal has the story:

Chinese officials acknowledged in a secret December meeting that Beijing was behind a widespread series of alarming cyberattacks on U.S. infrastructure, according to people familiar with the matter, underscoring how hostilities between the two superpowers are continuing to escalate.

The Chinese delegation linked years of intrusions into computer networks at U.S. ports, water utilities, airports and other targets, to increasing U.S. policy support for Taiwan, the people, who declined to be named, said.

The admission wasn’t explicit:

The Chinese official’s remarks at the December meeting were indirect and somewhat ambiguous, but most of the American delegation in the room interpreted it as a tacit admission and a warning to the U.S. about Taiwan, a former U.S. official familiar with the meeting said.

No surprise.

Cloud Efficiency at Netflix

Post Syndicated from Netflix Technology Blog original https://netflixtechblog.com/cloud-efficiency-at-netflix-f2a142955f83

By J Han, Pallavi Phadnis

Context

At Netflix, we use Amazon Web Services (AWS) for our cloud infrastructure needs, such as compute, storage, and networking to build and run the streaming platform that we love. Our ecosystem enables engineering teams to run applications and services at scale, utilizing a mix of open-source and proprietary solutions. In turn, our self-serve platforms allow teams to create and deploy, sometimes custom, workloads more efficiently. This diverse technological landscape generates extensive and rich data from various infrastructure entities, from which, data engineers and analysts collaborate to provide actionable insights to the engineering organization in a continuous feedback loop that ultimately enhances the business.

One crucial way in which we do this is through the democratization of highly curated data sources that sunshine usage and cost patterns across Netflix’s services and teams. The Data & Insights organization partners closely with our engineering teams to share key efficiency metrics, empowering internal stakeholders to make informed business decisions.

Data is Key

This is where our team, Platform DSE (Data Science Engineering), comes in to enable our engineering partners to understand what resources they’re using, how effectively and efficiently they use those resources, and the cost associated with their resource usage. We want our downstream consumers to make cost conscious decisions using our datasets.

To address these numerous analytic needs in a scalable way, we’ve developed a two-component solution:

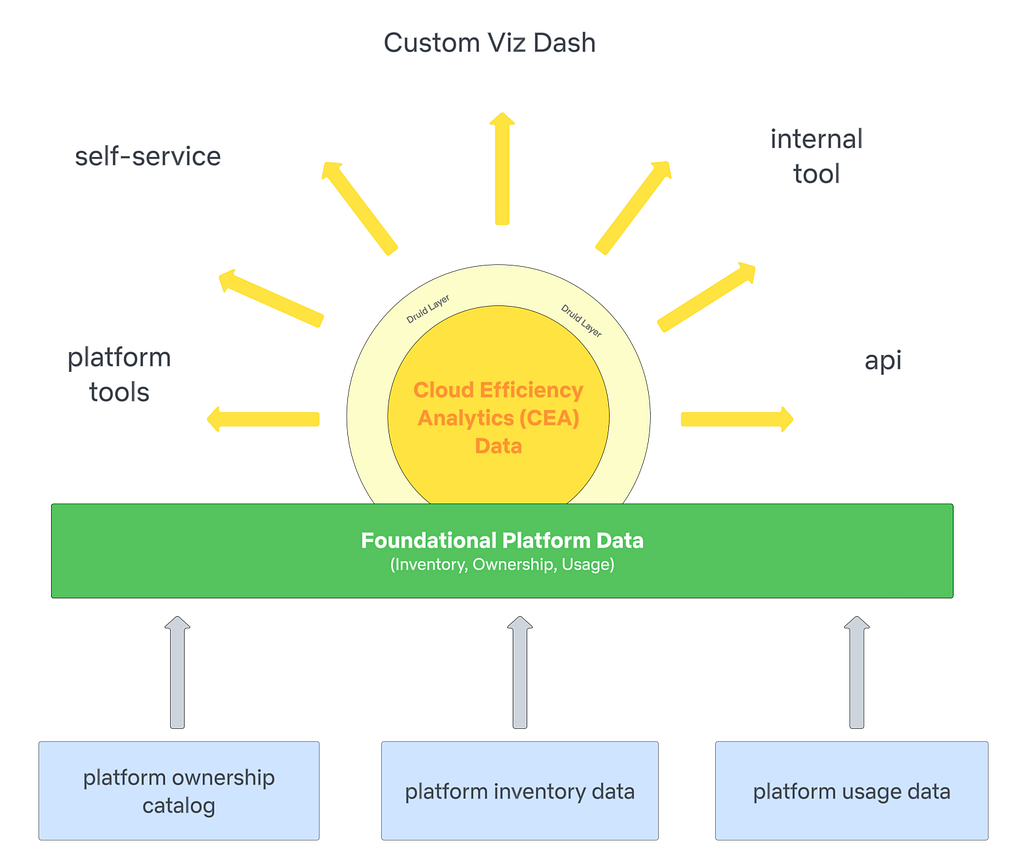
  1. Foundational Platform Data (FPD): This component provides a centralized data layer for all platform data, featuring a consistent data model and standardized data processing methodology.
  2. Cloud Efficiency Analytics (CEA): Built on top of FPD, this component offers an analytics data layer that provides time series efficiency metrics across various business use cases.

Foundational Platform Data (FPD)

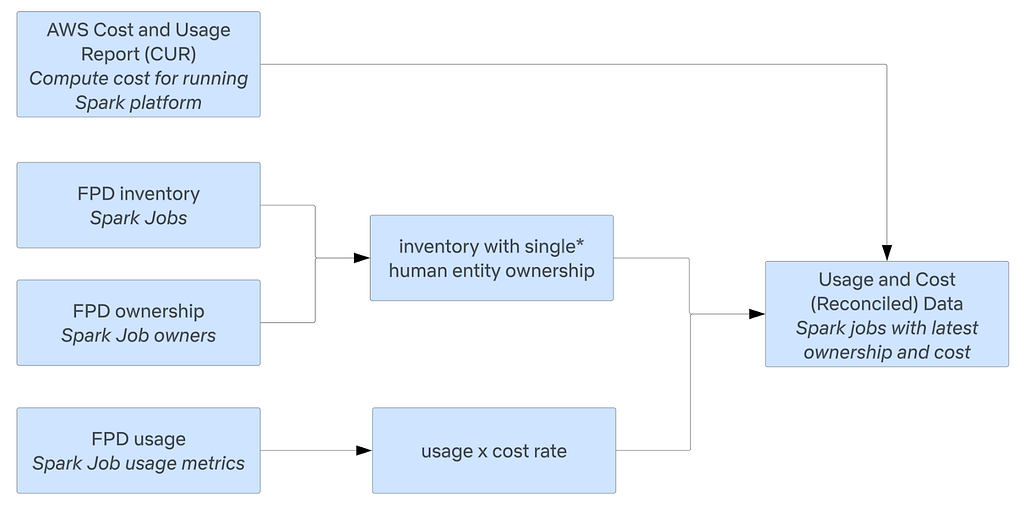
We work with different platform data providers to get inventory, ownership, and usage data for the respective platforms they own. Below is an example of how this framework applies to the Spark platform. FPD establishes data contracts with producers to ensure data quality and reliability; these contracts allow the team to leverage a common data model for ownership. The standardized data model and processing promotes scalability and consistency.

Cloud Efficiency Analytics (CEA Data)

Once the foundational data is ready, CEA consumes inventory, ownership, and usage data and applies the appropriate business logic to produce cost and ownership attribution at various granularities. The data model approach in CEA is to compartmentalize and be transparent; we want downstream consumers to understand why they’re seeing resources show up under their name/org and how those costs are calculated. Another benefit to this approach is the ability to pivot quickly as new or changes in business logic is/are introduced.

* For cost accounting purposes, we resolve assets to a single owner, or distribute costs when assets are multi-tenant. However, we do also provide usage and cost at different aggregations for different consumers.

Data Principles

As the source of truth for efficiency metrics, our team’s tenants are to provide accurate, reliable, and accessible data, comprehensive documentation to navigate the complexity of the efficiency space, and well-defined Service Level Agreements (SLAs) to set expectations with downstream consumers during delays, outages or changes.

While ownership and cost may seem straightforward, the complexity of the datasets is considerably high due to the breadth and scope of the business infrastructure and platform specific features. Services can have multiple owners, cost heuristics are unique to each platform, and the scale of infra data is large. As we work on expanding infrastructure coverage to all verticals of the business, we face a unique set of challenges:

A Few Sizes to Fit the Majority

Despite data contracts and a standardized data model on transforming upstream platform data into FPD and CEA, there is usually some degree of customization that is unique to that particular platform. As the centralized source of truth, we feel the constant tension of where to place the processing burden. Decision-making involves ongoing transparent conversations with both our data producers and consumers, frequent prioritization checks, and alignment with business needs as informed captains in this space.

Data Guarantees

For data correctness and trust, it’s crucial that we have audits and visibility into health metrics at each layer in the pipeline in order to investigate issues and root cause anomalies quickly. Maintaining data completeness while ensuring correctness becomes challenging due to upstream latency and required transformations to have the data ready for consumption. We continuously iterate our audits and incorporate feedback to refine and meet our SLAs.

Abstraction Layers

We value people over process, and it is not uncommon for engineering teams to build custom SaaS solutions for other parts of the organization. Although this fosters innovation and improves development velocity, it can create a bit of a conundrum when it comes to understanding and interpreting usage patterns and attributing cost in a way that makes sense to the business and end consumer. With clear inventory, ownership, and usage data from FPD, and precise attribution in the analytical layer, we aim to provide metrics to downstream users regardless of whether they utilize and build on top of internal platforms or on AWS resources directly.

Future Forward

Looking ahead, we aim to continue onboarding platforms to FPD and CEA, striving for nearly complete cost insight coverage in the upcoming year. Longer term, we plan to extend FPD to other areas of the business such as security and availability. We aim to move towards proactive approaches via predictive analytics and ML for optimizing usage and detecting anomalies in cost.

Ultimately, our goal is to enable our engineering organization to make efficiency-conscious decisions when building and maintaining the myriad of services that allow us to enjoy Netflix as a streaming service.

Acknowledgments

The FPD and CEA work would not have been possible without the cross functional input of many outstanding colleagues and our dedicated team building these important data assets.

A bit about the authors:

JHan enjoys nature, reading fantasy, and finding the best chocolate chip cookies and cinnamon rolls. She is adamant about writing the SQL select statement with leading commas.

Pallavi enjoys music, travel and watching astrophysics documentaries. With 15+ years working with data, she knows everything’s better with a dash of analytics and a cup of coffee!


Cloud Efficiency at Netflix was originally published in Netflix TechBlog on Medium, where people are continuing the conversation by highlighting and responding to this story.

Is this thing on? Using OpenBMC and ACPI power states for reliable server boot

Post Syndicated from Nnamdi Ajah original https://blog.cloudflare.com/how-we-use-openbmc-and-acpi-power-states-to-monitor-the-state-of-our-servers

Introduction

At Cloudflare, we provide a range of services through our global network of servers, located in 330 cities worldwide. When you interact with our long-standing application services, or newer services like Workers AI, you’re in contact with one of our fleet of thousands of servers which support those services.

These servers which provide Cloudflare services are managed by a Baseboard Management Controller (BMC). The BMC is a special purpose processor  — different from the Central Processing Unit (CPU) of a server — whose sole purpose is ensuring a smooth operation of the server.

Regardless of the server vendor, each server has this BMC. The BMC runs independently of the CPU and has its own embedded operating system, usually referred to as firmware. At Cloudflare, we customize and deploy a server-specific version of the BMC firmware. The BMC firmware we deploy at Cloudflare is based on the Linux Foundation Project for BMCs, OpenBMC. OpenBMC is an open-sourced firmware stack designed to work across a variety of systems including enterprise, telco, and cloud-scale data centers. The open-source nature of OpenBMC gives us greater flexibility and ownership of this critical server subsystem, instead of the closed nature of proprietary firmware. This gives us transparency (which is important to us as a security company) and allows us faster time to develop custom features/fixes for the BMC firmware that we run on our entire fleet.

In this blog post, we are going to describe how we customized and extended the OpenBMC firmware to better monitor our servers’ boot-up processes to start more reliably and allow better diagnostics in the event that an issue happens during server boot-up.

Server subsystems

Server systems consist of multiple complex subsystems that include the processors, memory, storage, networking, power supply, cooling, etc. When booting up the host of a server system, the power state of each subsystem of the server is changed in an asynchronous manner. This is done so that subsystems can initialize simultaneously, thereby improving the efficiency of the boot process. Though started asynchronously, these subsystems may interact with each other at different points of the boot sequence and rely on handshake/synchronization to exchange information. For example, during boot-up, the UEFI (Universal Extensible Firmware Interface), often referred to as the BIOS, configures the motherboard in a phase known as the Platform Initialization (PI) phase, during which the UEFI collects information from subsystems such as the CPUs, memory, etc. to initialize the motherboard with the right settings.


Figure 1: Server Boot Process

When the power state of the subsystems, handshakes, and synchronization are not properly managed, there may be race conditions that would result in failures during the boot process of the host. Cloudflare experienced some of these boot-related failures while rolling out open source firmware (OpenBMC) to the Baseboard Management Controllers (BMCs) of our servers. 

Baseboard Management Controller (BMC) as a manager of the host

A BMC is a specialized microprocessor that is attached to the board of a host (server) to assist with remote management capabilities of the host. Servers usually sit in data centers and are often far away from the administrators, and this creates a challenge to maintain them at scale. This is where a BMC comes in, as the BMC serves as the interface that gives administrators the ability to securely and remotely access the servers and carry out management functions. The BMC does this by exposing various interfaces, including Intelligent Platform Management Interface (IPMI) and Redfish, for distributed management. In addition, the BMC receives data from various sensors/devices (e.g. temperature, power supply) connected to the server, and also the operating parameters of the server, such as the operating system state, and publishes the values on its IPMI and Redfish interfaces.


Figure 2: Block diagram of BMC in a server system.

At Cloudflare, we use the OpenBMC project for our Baseboard Management Controller (BMC).

Below are examples of management functions carried out on a server through the BMC. The interactions in the examples are done over ipmitool, a command line utility for interacting with systems that support IPMI.

# Check the sensor readings of a server remotely (i.e. over a network)
$  ipmitool <some authentication> <bmc ip> sdr
PSU0_CURRENT_IN  | 0.47 Amps         | ok
PSU0_CURRENT_OUT | 6 Amps            | ok
PSU0_FAN_0       | 6962 RPM          | ok
SYS_FAN          | 13034 RPM         | ok
SYS_FAN1         | 11172 RPM         | ok
SYS_FAN2         | 11760 RPM         | ok
CPU_CORE_VR_POUT | 9.03 Watts        | ok
CPU_POWER        | 76.95 Watts       | ok
CPU_SOC_VR_POUT  | 12.98 Watts       | ok
DIMM_1_VR_POUT   | 29.03 Watts       | ok
DIMM_2_VR_POUT   | 27.97 Watts       | ok
CPU_CORE_MOSFET  | 40 degrees C      | ok
CPU_TEMP         | 50 degrees C      | ok
DIMM_MOSFET_1    | 36 degrees C      | ok
DIMM_MOSFET_2    | 39 degrees C      | ok
DIMM_TEMP_A1     | 34 degrees C      | ok
DIMM_TEMP_B1     | 33 degrees C      | ok

…

# check the power status of a server remotely (i.e. over a network)
ipmitool <some authentication> <bmc ip> power status
Chassis Power is off

# power on the server
ipmitool <some authentication> <bmc ip> power on
Chassis Power Control: On

Switching to OpenBMC firmware for our BMCs gives us more control over the software that powers our infrastructure. This has given us more flexibility, customizations, and an overall better uniform experience for managing our servers. Since OpenBMC is open source, we also leverage community fixes while upstreaming some of our own. Some of the advantages we have experienced with OpenBMC include a faster turnaround time to fixing issues, optimizations around thermal cooling, increased power efficiency and supporting AI inference.

While developing Cloudflare’s OpenBMC firmware, however, we ran into a number of boot problems.

Host not booting: When we send a request over IPMI for a host to power on (as in the example above, power on the server), ipmitool would indicate the power status of the host as ON, but we would not see any power going into the CPU nor any activity on the CPU. While ipmitool was correct about the power going into the chassis as ON, we had no information about the power state of the server from ipmitool, and we initially falsely assumed that since the chassis power was on, the rest of the server components should be ON. The System Event Log (SEL), which is responsible for displaying platform-specific events, was not giving us any useful information beyond indicating that the server was in a soft-off state (powered off), working state (operating system is loading and running), or that a “System Restart” of the host was initiated.

# System Event Logs (SEL) showing the various power states of the server
$ ipmitool sel elist | tail -n3
  4d |  Pre-Init  |0000011021| System ACPI Power State ACPI_STATUS | S5_G2: soft-off | Asserted
  4e |  Pre-Init  |0000011022| System ACPI Power State ACPI_STATUS | S0_G0: working | Asserted
  4f |  Pre-Init  |0000011023| System Boot Initiated RESTART_CAUSE | System Restart | Asserted

In the System Event Logs shown above, ACPI is the acronym for Advanced Configuration and Power Interface, a standard for power management on computing systems. In the ACPI soft-off state, the host is powered off (the motherboard is on standby power but CPU/host isn’t powered on); according to the ACPI specifications, this state is called S5_G2. (These states are discussed in more detail below.) In the ACPI working state, the host is booted and in a working state, also known in the ACPI specifications as status S0_G0 (which in our case happened to be false), and the third row indicates the cause of the restart was due to a System Restart. Most of the boot-related SEL events are sent from the UEFI to the BMC. The UEFI has been something of a black box to us, as we rely on our original equipment manufacturers (OEMs) to develop the UEFI firmware for us, and for the generation of servers with this issue, the UEFI firmware did not implement sending the boot progress of the host to the BMC.

One discrepancy we observed was the difference in the power status and the power going into the CPU, which we read with a sensor we call CPU_POWER.

# Check power status
$ ipmitool <some authentication> <bmc ip>  power status
Chassis Power is on

However, checking the power into the CPU shows that the CPU was not receiving any power.

# Check power going into the CPU
$ ipmitool <some authentication> <bmc ip>  sdr | grep CPU_POWER    
CPU_POWER        | 0 Watts           | ok

The CPU_POWER being at 0 watts contradicts all the previous information that the host was powered up and working, when the host was actually completely shut down.

Missing Memory Modules: Our servers would randomly boot up with less memory than expected. Computers can boot up with less memory than installed due to a number of problems, such as a loose connection, hardware problem, or faulty memory. For our case, it happened not to be any of the usual suspects, but instead was due to both the BMC and UEFI trying to simultaneously read from the memory modules, leading to access contentions. Memory modules usually contain a Serial Presence Detect (SPD), which is used by the UEFI to dynamically detect the memory module. This SPD is usually located on an inter-integrated circuit (i2c), which is a low speed, two write protocol for devices to talk to each other. The BMC also reads the temperature of the memory modules via the i2c. When the server is powered on, amongst other hardware initializations, the UEFI also initializes the memory modules that it can detect via their (i.e. each individual memory modules) Serial Presence Detect (SPD), the BMC could also be trying to access the temperature of the memory module at the same time, over the same i2c protocol. This simultaneous attempted read denies one of the parties access. When the UEFI is denied access to the SPD, it thinks the memory module is not available and skips over it. Below is an example of the related i2c-bus contention logs we saw in the journal of the BMC when the host is booting.

kernel: aspeed-i2c-bus 1e78a300.i2c-bus: irq handled != irq. expected 0x00000021, but was 0x00000020

The above logs indicate that the i2c address 1e78a300 (which happens to be connected to the serial presence detect of the memory modules) could not properly handle a signal, known as an interrupt request (irq). When this scenario plays out on the UEFI, the UEFI is unable to detect the memory module.


Figure 3: I2C diagram showing I2C interconnection of the server’s memory modules (also known as DIMMs) with the BMC 

DIMM in Figure 3 refers to Dual Inline Memory Module, which is the type of memory module used in servers.

Thermal telemetry: During the boot-up process of some of our servers, some temperature devices, such as the temperature sensors of the memory modules, would show up as failed, thereby causing some of the fans to enter a fail-safe Pulse Width Modulation (PWM) mode. PWM is a technique to encode information delivered to electronic devices by adjusting the frequency of the waveform signal to the device. It is used in this case to control fan speed by adjusting the frequency of the power signal delivered to the fan. When a fan enters a fail-safe mode, PWM is used to set the fan speeds to a preset value, irrespective of what the optimized PWM setting of the fans should be, and this could negatively affect the cooling of the server and power consumption.

Implementing host ACPI state on OpenBMC

In the process of studying the issues we faced relating to the boot-up process of the host, we learned how the power state of the subsystems within the chassis changes. Part of our learnings led us to investigate the Advanced Configuration and Power Interface (ACPI) and how the ACPI state of the host changed during the boot process.

Advanced Configuration and Power Interface (ACPI) is an open industry specification for power management used in desktop, mobile, workstation, and server systems. The ACPI Specification replaces previous power management methodologies such as Advanced Power Management (APM). ACPI provides the advantages of:

  • Allowing OS-directed power management (OSPM).

  • Having a standardized and robust interface for power management.

  • Sending system-level events such as when the server power/sleep buttons are pressed 

  • Hardware and software support, such as a real-time clock (RTC) to schedule the server to wake up from sleep or to reduce the functionality of the CPU based on RTC ticks when there is a loss of power.

From the perspective of power management, ACPI enables an OS-driven conservation of energy by transitioning components which are not in active use to a lower power state, thereby reducing power consumption and contributing to more efficient power management.

The ACPI Specification defines four global “Gx” states, six sleeping “Sx” states, and four “Dx” device power states. These states are defined as follows:

Gx

Name

Sx

Description

G0

Working

S0

The run state. In this state the machine is fully running

G1

Sleeping

S1

A sleep state where the CPU will suspend activity but retain its contexts.

S2

A sleep state where memory contexts are held, but CPU contexts are lost. CPU re-initialization is done by firmware.

S3

A logically deeper sleep state than S2 where CPU re-initialization is done by device. Equates to Suspend to RAM.

S4

A logically deeper sleep state than S3 in which DRAM is context is not maintained and contexts are saved to disk. Can be implemented by either OS or firmware. 

G2

Soft off but PSU still supplies power

S5

The soft off state. All activity will stop, and all contexts are lost. The Complex Programmable Logic Device (CPLD) responsible for power-up and power-down sequences of various components e.g. CPU, BMC is on standby power, but the CPU/host is off.

G3

Mechanical off


PSU does not supply power. The system is safe for disassembly.

Dx

Name

Description

D0

Fully powered on

Hardware device is fully functional and operational 

D1

Hardware device is partially powered down

Reduced functionality and can be quickly powered back to D0

D2

Hardware device is in a deeper lower power than D1

Much more limited functionality and can only be slowly powered back to D0.

D3

Hardware device is significantly powered down or off

Device is inactive with perhaps only the ability to be powered back on

The states that matter to us are:

  • S0_G0_D0: often referred to as the working state. Here we know our host system is running just fine.

  • S2_D2: Memory contexts are held, but CPU context is lost. We usually use this state to know when the host’s UEFI is performing platform firmware initialization.

  • S5_G2: Often referred to as the soft off state. Here we still have power going into the chassis, however, processor and DRAM context are not maintained, and the operating system power management of the host has no context.

Since the issues we were experiencing were related to the power state changes of the host — when we asked the host to reboot or power on — we needed a way to track the various power state changes of the host as it went from power off to a complete working state. This would give us better management capabilities over the devices that were on the same power domain of the host during the boot process. Fortunately, the OpenBMC community already implemented an ACPI daemon, which we extended to serve our needs. We added an ACPI S2_D2 power state, in which memory contexts are held, but CPU context is lost, to the ACPI daemon running on the BMC to enable us to know when the host’s UEFI is performing firmware initialization, and also set up various management tasks for the different ACPI power states.

An example of a power management task we carry out using the S0_G0_D0 state is to re-export our Voltage Regulator (VR) sensors on S0_G0_D0 state, as shown with the service file below:

cat /lib/systemd/system/Re-export-VR-device.service 
[Unit]
Description=RE Export VR Device Process
Wants=xyz.openbmc_project.EntityManager.service
After=xyz.openbmc_project.EntityManager.service
Conflicts=host-s2-state.target

[Service]
Type=simple
ExecStart=/bin/bash -c 'set -a && source /usr/bin/Re-export-VR-device.sh on'
SyslogIdentifier=Re-export-VR-device.service

[Install]
WantedBy=host-s0-state.target

Having set this up, OpenBMC has a Net Function (ipmiSetACPIState) in phosphor-host-ipmid that is responsible for setting the ACPIState of the host on the BMC. This command is called by the host using the standard ipmi command with the corresponding NetFn=0x06 and Cmd=0x06.

In the event of an immediate power cycle (i.e. host reboots without operating system shutdown), the host is unable to send its S5_G2 state to the BMC. For this case, we created a patch to OpenBMC’s x86-power-control to let the BMC become aware that the host has entered the ACPI S5_G2 state (i.e. soft-off). When the host comes out of the power off state, the UEFI performs the Power On Self Test (POST) and sends the S2_D2 to the BMC, and after the UEFI has loaded the OS on the host, it notifies the BMC by sending the ACPI S0_G0_D0 state.

Fixing the issues

Going back to the boot-up issues we faced, we discovered that they were mostly caused by devices which were in the same power domain of the CPU, interfering with the UEFI/platform firmware initialization phase. Below is a high level description of the fixes we applied.

Servers not booting: After identifying the devices that were interfering with the POST stage of the firmware initialization, we used the host ACPI state to control when we set the appropriate power mode state for those devices so as not to cause POST to fail.

Memory modules missing: During the boot-up process, memory modules (DIMMs) are powered and initialized in S2_D2 ACPI state. During this initialization process, UEFI firmware sends read commands to the Serial Presence Detect (SPD) on the DIMM to retrieve information for DIMM enumeration. At the same time, the BMC could be sending commands to read DIMM temperature sensors. This can cause SMBUS collisions, which could either cause DIMM temperature reading to fail or UEFI DIMM enumeration to fail. The latter case would cause the system to boot up with reduced DIMM capacity, which could be mistaken as a failing DIMM scenario. After we had discovered the race condition issue, we disabled the BMC from reading the DIMM temperature sensors during S2_D2 ACPI state and set a fixed speed for the corresponding fans. This solution allows our UEFI to retrieve all the necessary DIMM subsystems information for enumeration, and our servers now boot up with the correct size of memory.

Thermal telemetry: In S0_G0 power state, when sensors are not reporting values back to the BMC, the BMC assumes that devices may be overheating and puts the fan controller into fail-safe mode where fan speeds are ramped up to maximum speed. However, in S5_G2 state, some thermal sensors like CPU temperature, NIC temperature, etc. are not powered and not available. Our solution is to set these thermal sensors as non-functional in their exported configuration when in S5_G2 state and during the transition from S5_G2 state to S2_D2 state. Setting the affected devices as non-functional in their configuration, instead of waiting for thermal sensor read commands to error out, prevents the controller from entering the fail-safe mode.

Moving forward

Aside from resolving issues, we have seen other benefits from implementing ACPI Power State on our BMC firmware. An example is in the area of our automated firmware regression testing. Various parts of our tests require rebooting/power cycling the servers over a hundred times, during which we monitor the ACPI power state changes of our servers as against using a boolean (running or not running, pingable or not pingable) to assert the status of our servers.

Also, it has given us the opportunity to learn more about the complex subsystems in a server system, and the various power modes of the different subsystems. This is an aspect that we are still actively learning about as we look to further optimize various aspects of the boot sequence of our servers.

In the course of time, implementing ACPI states is helping us achieve the following:

  • All components are enabled by end of boot sequence,

  • BIOS and BMC are able to retrieve component information,

  • And the BMC is aware when thermal sensors are in a non-functional state.

For better observability of the boot progress and “last state” of our systems, we have also started the process of adding the BootProgress object of the Redfish ComputerSystem Schema into our systems. This will give us an opportunity for pre-operating system (OS) boot observability and an easier debug starting point when the UEFI has issues (such as when the server isn’t coming on) during the server platform initialization.

With each passing day, Cloudflare’s OpenBMC team, which is made up of folks from different embedded backgrounds, learns about, experiments with, and deploys OpenBMC across our global fleet. This has been made possible by relying on the OpenBMC community’s contribution (as well as upstreaming some of our own contributions), and our interaction with our various vendors, thereby giving us the opportunity to make our systems more reliable, and giving us the ownership and responsibility of the firmware that powers the BMCs that manage our servers. If you are thinking of embracing open-source firmware in your BMC, we hope this blog post written by a team which started deploying OpenBMC less than 18 months ago has inspired you to give it a try. 

For those who are interested in considering making the jump to open-source firmware, check it out here!

Leveraging Kubernetes virtual machines at Cloudflare with KubeVirt

Post Syndicated from Justin Cichra original https://blog.cloudflare.com/leveraging-kubernetes-virtual-machines-with-kubevirt

Cloudflare runs several multi-tenant Kubernetes clusters across our core data centers. These general-purpose clusters run on bare metal and power our control plane, analytics, and various engineering tools such as build infrastructure and continuous integration.

Kubernetes is a container orchestration platform. It enables software engineers to deploy containerized applications to a cluster of machines. This enables teams to build highly-available software on a scalable and resilient platform.

In this blog post we discuss our Kubernetes architecture, why we needed virtualization, and how we’re using it today.

Multi-tenant clusters

Multi-tenancy is a concept where one system can share its resources among a wide range of customers. This model allows us to build and manage a small number of general purpose Kubernetes clusters for our internal application teams. Keeping the number of clusters small reduces our operational toil. This model shrinks costs and increases computational efficiency by sharing hardware. Multi-tenancy also allows us to scale more efficiently. Scaling is done at either a cluster or application level. Cluster operators scale the platform by adding more hardware. Teams scale their applications by updating their Kubernetes manifests. They can scale vertically by increasing their resource requests or horizontally by increasing the number of replicas.

All of our Kubernetes clusters are multi-tenant with various components enabled for a secure and resilient platform.

Pods are secured using the latest standards recommended by the Kubernetes project. We use Pod Security Admission (PSA) and Pod Security Standards to ensure all workloads are following best practices. By default, all namespaces use the most restrictive profile, and only a few Kubernetes control plane namespaces are granted privileged access. For additional policies not covered by PSA, we built custom Validating Webhooks on top of the controller-runtime framework. PSA and our custom policies ensure clusters are secure and workloads are isolated.

Our need for virtualization

A select number of teams needed tight integration with the Linux kernel. Examples include Docker daemons for build infrastructure and the ability to simulate servers running the software and configuration of our global network. With our pod security requirements, these workloads are not permitted to interface with the host kernel at a deep level (e.g. no iptables or sysctls). Doing so may disrupt other tenants sharing the node and open additional attack vectors if an application was compromised. A virtualization platform would enable these workloads to interact with their own kernel within a secured Kubernetes cluster.

We considered various different virtualization solutions. Running a separate virtualization platform outside of Kubernetes would have worked, but would not tightly integrate containerized workloads with virtual machines. It would also be an additional operational burden on our team, as backups, alerting, and fleet management would have to exist for both our Kubernetes and virtual machine clusters.

We then looked for solutions that run virtual machines within Kubernetes. Teams could already manually deploy QEMU pods, but this was not an elegant solution. We needed a better way. There were several other options, but KubeVirt was the tool that met the majority of our requirements. Other solutions required a privileged container to run a virtual machine, but KubeVirt did not – this was a crucial requirement in our goal of creating a more secure multi-tenant cluster. KubeVirt also uses a feature of the Kubernetes API called Custom Resource Definitions (CRDs), which extends the Kubernetes API with new objects, increasing the flexibility of Kubernetes beyond its built-in types. For KubeVirt, this includes objects such as VirtualMachine and VirtualMachineInstanceReplicaSet. We felt the use of CRDs would allow KubeVirt to grow as more features were added.

What is KubeVirt?

KubeVirt is a virtualization platform that enables users to run virtual machines within Kubernetes. With KubeVirt, virtual machines run alongside containerized workloads on the same platform. Kubernetes primitives such as network policies, configmaps, and services all integrate with virtual machines. KubeVirt scales with our needs and is successfully running hundreds of virtual machines across several clusters. We frequently remediate Kubernetes nodes, so virtual machines and pods are always exercising their startup/shutdown processes.

How Cloudflare uses KubeVirt

There are a number of internal projects leveraging virtual machines at Cloudflare. We’ll touch on a few of our more popular use cases:

  1. Kubernetes scalability testing

  2. Development environments

  3. Kernel and iPXE testing

  4. Build pipelines

Kubernetes scalability testing

Setup process

Our staging clusters are much smaller than our largest production clusters. They also run on bare metal and mirror the configuration we have for each production cluster. This is extremely useful when rolling out new software, operating systems, or kernel changes; however, they miss bugs that only surface at scale. We use KubeVirt to bridge this gap and virtualize Kubernetes clusters with hundreds of nodes and thousands of pods.

The setup process for virtualized clusters differs from our bare metal provisioning steps. For bare metal, we use Salt to provision clusters from start to finish. For our virtualized clusters we use Ansible and kubeadm.  Our bare metal staging clusters are responsible for testing and validating our Salt configuration. The virtualized clusters give us a vanilla Kubernetes environment without any Cloudflare customizations. Having a stock environment in addition to our Salt environment helps us isolate bugs down to a Kubernetes change, a kernel change, or a Cloudflare-specific configuration change.

Our virtualized clusters consist of a KubeVirt VirtualMachine object per node. We create three control-plane nodes and any number of worker nodes. Each virtual machine starts out as a vanilla Debian generic cloud image. Using KubeVirt’s cloud-init support, the virtual machine downloads an internal Ansible playbook which installs a recent kernel, cri-o (the container runtime we use), and kubeadm.

- name: Add the Kubernetes gpg key
  apt_key:
    url: https://pkgs.k8s.io/core:/stable:/{{ kube_version }}/deb/Release.key
    keyring: /etc/apt/keyrings/kubernetes-apt-keyring.gpg
    state: present

- name: Add the Kubernetes repository
  shell: echo "deb [signed-by=/etc/apt/keyrings/kubernetes-apt-keyring.gpg] https://pkgs.k8s.io/core:/stable:/{{ kube_version }}/deb/ /" | tee /etc/apt/sources.list.d/kubernetes.list

- name: Add the CRI-O gpg key
  apt_key:
    url: https://pkgs.k8s.io/addons:/cri-o:/{{ crio_version }}/deb/Release.key
    keyring: /etc/apt/keyrings/cri-o-apt-keyring.gpg
    state: present

- name: Add the CRI-O repository
  shell: echo "deb [signed-by=/etc/apt/keyrings/cri-o-apt-keyring.gpg] https://pkgs.k8s.io/addons:/cri-o:/{{ crio_version }}/deb/ /" | tee /etc/apt/sources.list.d/cri-o.list

- name: Install CRI-O and Kubernetes packages
  apt:
    name:
      - cri-o
      - kubelet
      - kubeadm
      - kubectl
    update_cache: yes
    state: present

- name: Enable and start CRI-O service
  service:
    state: started
    enabled: yes
    name: crio.service

Ansible playbook steps to download and install Kubernetes tooling

Once each node has completed its individual playbook, we can initialize and join nodes to the cluster using another playbook that runs kubeadm. From there the cluster can be accessed by logging into a control plane node using kubectl.

Simulating at scale

When losing 10s or 100s of nodes at once, Kubernetes needs to act quickly to minimize downtime. The sooner it recognizes node failure, the faster it can reroute traffic to healthy pods.

Using Kubernetes in KubeVirt we are able to simulate a large cluster undergoing a network cut and observe how Kubernetes reacts. The KubeVirt Kubernetes cluster allows us to rapidly iterate on configuration changes and code patches.

The following Ansible playbook task simulates a network segmentation failure where only the control-plane nodes remain online.

- name: Disable network interfaces on all workers
  command: ifconfig enp1s0 down
  async: 5
  poll: 0
  ignore_errors: yes
  when: inventory_hostname in groups['kube-node']

An Ansible role which disables the network on all worker nodes simultaneously.

This framework allows us to exercise the code in controller-manager, Kubernetes’s daemon that reconciles the fundamental state of the system (Nodes, Pods, etc). Our simulation platform helped us drastically shorten full traffic recovery time when a large number of Kubernetes nodes become unreachable. We upstreamed our changes to Kubernetes and more controller-manager speed improvements are coming soon.

Development environments

Compiling code on your laptop can be slow. Perhaps you’re working on a patch for a large open-source project (e.g. V8 or Clickhouse) or need more bandwidth to upload and download containers. With KubeVirt, we enable our developers to rapidly iterate on software development and testing on powerful server hardware. KubeVirt integrates with Kubernetes Persistent Volumes, which enables teams to persist their development environment across restarts.

There are a number of teams at Cloudflare using KubeVirt for a variety of development and testing environments. Most notably is a project called Edge Test Fleet, which emulates a physical server and all the software that runs Cloudflare’s global network. Teams can test their code and configuration changes against the entire software stack without reserving dedicated hardware. Cloudflare uses Salt to provision systems. It can be difficult to iterate and test Salt changes without a complete virtual environment. Edge Test Fleet makes iterating on Salt easier, ensuring states compile and render the right output. With Edge Test Fleet, new developers can better understand how Cloudflare’s global network works without touching staging or production.

Additionally, one Cloudflare team developed a framework that allows users to build and test changes to Clickhouse using a VSCode environment. This framework is generally applicable to all teams requiring a development environment. Once a template environment is provisioned, CSI Volume Cloning can duplicate a golden volume, separating persistent environments for each developer.

apiVersion: v1
kind: PersistentVolumeClaim
name: devspace-jcichra-rootfs
namespace: dev-clickhouse-vms
spec:
  accessModes:
  - ReadWriteOnce
  storageClassName: rook-ceph-nvme
  dataSource:
    kind: PersistentVolumeClaim
    name: dev-rootfs
  resources:
    requests:
      storage: 500Gi

A PersistentVolumeClaim that clones data from another volume using CSI Volume Cloning

Kernel and iPXE testing

Unlike user space software development, when a kernel crashes, the entire system crashes. The kernel team uses KubeVirt for development. KubeVirt gives all kernel engineers, regardless of laptop OS or architecture, the same x86 environment and hypervisor. Virtual machines on server hardware can be scaled up to more cores and memory than on laptops. The Cloudflare kernel team has also found low-level issues which only surface in environments with many CPUs.

To make testing fast and easy, the kernel team serves iPXE images via an nginx Pod and Service adjacent to the virtual machine. A recent kernel and Debian image are copied to the nginx pod via kubectl cp. The iPXE file can then be referenced in the KubeVirt virtual machine definition via the DNS name for the Kubernetes Service.

interfaces:
  name: default
  masquerade: {}
  model: e1000e
  ports:
    - port: 22
      dhcpOptions:
        bootFileName: http://httpboot.u-$K8S_USER.svc.cluster.local/boot.ipxe

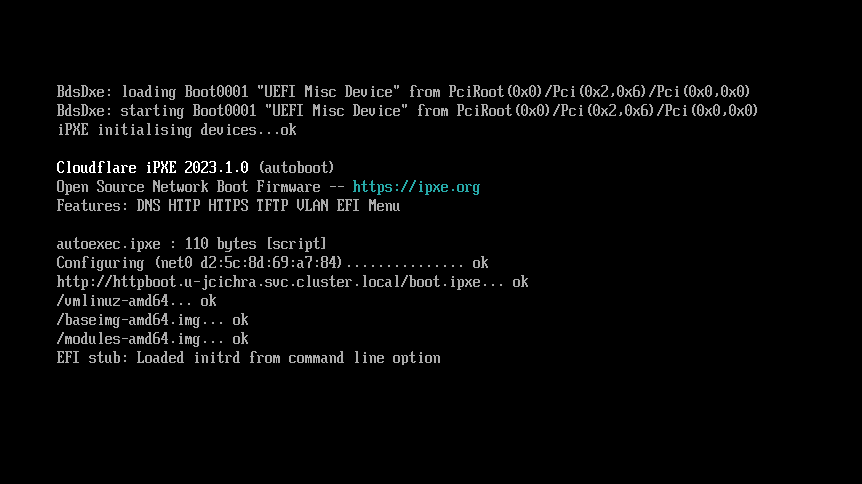
When the virtual machine boots, it will get an IP address on the default interface behind NAT due to our masquerade setting. Then it will download boot.ipxe, which describes what additional files should be downloaded to start the system. In this case, the kernel (vmlinuz-amd64), Debian (baseimg-amd64.img) and additional kernel modules (modules-amd64.img) are downloaded.


UEFI iPXE boot connecting and downloading files from nginx pod in user’s namespace

Once the system is booted, a developer can log in to the system for testing:

linux login: root
Password: 
Linux linux 6.6.35-cloudflare-2024.6.7 #1 SMP PREEMPT_DYNAMIC Mon Sep 27 00:00:00 UTC 2010 x86_64

The programs included with the Debian GNU/Linux system are free software;
the exact distribution terms for each program are described in the
individual files in /usr/share/doc/*/copyright.

Debian GNU/Linux comes with ABSOLUTELY NO WARRANTY, to the extent
permitted by applicable law.
root@linux:~# 

Custom kernels can be copied to the nginx pod via kubectl cp. Restarting the virtual machine will load that new kernel for testing. When a kernel panic occurs, the virtual machine can quickly be restarted with virtctl restart linux and it will go through the iPXE boot process again.

Build pipelines

Cloudflare leverages KubeVirt to build a majority of software at Cloudflare. Virtual machines give build system users full control over their pipeline. For example, Debian packages can easily be installed and separate container daemons (such as Docker) can run all within a Kubernetes namespace using the restricted Pod Security Standard. KubeVirt’s VirtualMachineReplicaSet concept allows us to quickly scale up and down the number of build agents to match demand. We can roll out different sets of virtual machines with varying sizes, kernels, and operating systems.

To scale efficiently, we leverage container disks to store our agent virtual machine images. Container disks allow us to store the virtual machine image (for example, a qcow image) in our container registry. This strategy works well when the state in virtual machines is ephemeral. Liveness probes detect unhealthy or broken agents, shutting down the virtual machine and replacing them with a fresh instance. Other automation limits virtual machine uptime, capping it to 3–4 hours to keep build agents fresh.

Next steps

We’re excited to expand our use of KubeVirt and unlock new capabilities for our internal users. KubeVirt’s Linux ARM64 support will allow us to build ARM64 packages in-cluster and simulate ARM64 systems.

Projects like KubeVirt CDI (Containerized Data Importer) will streamline our user’s virtual machine experience. Instead of users manually building container disks, we can provide a catalog of virtual machine images. It also allows us to copy virtual machine disks between namespaces.

Conclusion

KubeVirt has proven to be a great tool for virtualization in our Kubernetes-first environment. We’ve unlocked the ability to support more workloads with our multi-tenant model. The KubeVirt platform allows us to offer a single compute platform supporting containers and virtual machines. Managing it has been simple, and upgrades have been straightforward and non-disruptive. We’re exploring additional features KubeVirt offers to improve the experience for our users.

Finally, our team is expanding! We’re looking for more people passionate about Kubernetes to join our team and help us push Kubernetes to the next level.

How GitHub reduced testing time for iOS apps with new runner features

Post Syndicated from Stephen Glass original https://github.blog/engineering/infrastructure/how-github-reduced-testing-time-for-ios-apps-with-new-runner-features/


GitHub Actions 🤝 GitHub for iOS

The GitHub iOS and GitHub Actions macOS runner teams are integral parts of each other’s development inner loop. Each team partners on testing new runner images and hardware long before the features land in the hands of developers. GitHub Actions has been working hard at bringing the latest Mac hardware to the community. Apple silicon (M1) macOS runners are available for free in public repositories, along with larger options available for those jobs that need more performance.

The GitHub iOS team has been busy improving the user experience in the app, recently shipping such as GitHub Copilot Chat, code search, localization for German and Korean, and making it easier to work with issues and projects. In this blog, we will discuss how the GitHub iOS team brings the app to developers around the world, the benefits of Apple silicon, and building on GitHub Actions using macOS runners.

How GitHub reduced testing time for iOS apps with new runner features

The GitHub iOS team previously used a single workflow with one job to build and test the entire codebase on GitHub Actions that took 38 minutes to complete with the prior generation runners. The GitHub iOS app consists of about 60 first-party modules, consisting of various targets, such as dynamic frameworks, static libraries, app extensions, or the GitHub app itself. These modules range from networking layers to design system components to entire features or products, helping us maintain the app.

Breaking down the monolith

We decided to leverage the power of Apple silicon to speed up their testing process. We switched to M1 macOS runners (macos-14-xlarge YAML label) on GitHub Actions and split their test suite into separate jobs for each module. This way, they could build and test each module independently and get faster feedback. Some of the smallest modules completed their tests in as little as 2-3 minutes on M1 macOS runners, getting feedback to developers on their pull requests faster than ever before. This also made it easier to identify and fix failures on specific modules without waiting for a monolithic build to finish.

By using Apple silicon, we reduced their testing time by 60%, from 38 minutes to 15 minutes, and improved our productivity and efficiency. The figure below demonstrates how we broke down the monolith into small modules in order to improve our build times.

Image demonstrates the monolith build on tip with the total CI time. The Image below it demonstrates how per-module builds are crafted and the reduction in CI time with the new approach.

As each build is kicked off, GitHub Actions is behind the scenes preparing the required number of machines to execute the workflow. Each request is sent to the GitHub Actions service where it picks up a freshly reimaged virtual machine to execute the required number of jobs. The figure below shows how a request travels from our repository to the Actions Mac servers in Azure.

Image displays the relationship between the request for workflow to run and how a machine is assigned to a job. From left to right, the flow starts at GitHub.com, then the request is sent to Actions. Actions then finds the available macOS VM to execute the workflow.

With shorter build times and a scaling CI fleet, Apple silicon hosts allowed the GitHub iOS team to scale their jobs out across many shorter, faster steps, with GitHub Actions abstracting over the complexity of distributing CI jobs.

Analyzing CI performance

We further investigated the CI performance and divided each module’s CI into two separate steps, build and test, using xcodebuild’s build-without-testing and test-without-building. This helped us identify unit tests that ran for a long time or highlighted fast unit tests that finished in seconds.

Native development and test environments

With Apple silicon powering GitHub Actions runners and the developers’ laptops, our CI now had the same architecture as local development machines. Engineers could identify patterns that took a long time to compile or tests that failed due to the architecture from CI and fix them locally with confidence.

Benefits of Apple silicon

Apple silicon improves build performance, increases reliability, and lets iOS teams test natively for all Apple platforms throughout the software development lifecycle. They can avoid problems from cross-compilation or emulation and use the latest simulators on our GitHub Actions runner image. This ensures that their apps work well with the newest versions of iOS, iPadOS, watchOS, and tvOS. Our GitHub Actions M1 macOS runners help iOS teams leverage these benefits and deliver high-quality apps to their users faster and more efficiently. Additionally, GitHub Actions offers 50 concurrent runners for enterprise accounts and five for GitHub Free and Team plans. The GitHub for iOS team takes full advantage of these concurrent runners and initiates 50 jobs for every pull request to perform modular testing on the app in parallel.

Get started building on GitHub Actions using macOS runners

GitHub-hosted macOS runners are YAML-driven, meaning they are accessed by updating the runs on: key in your workflow file.

The post How GitHub reduced testing time for iOS apps with new runner features appeared first on The GitHub Blog.

Backdoor in XZ Utils That Almost Happened

Post Syndicated from Bruce Schneier original https://www.schneier.com/blog/archives/2024/04/backdoor-in-xz-utils-that-almost-happened.html

Last week, the Internet dodged a major nation-state attack that would have had catastrophic cybersecurity repercussions worldwide. It’s a catastrophe that didn’t happen, so it won’t get much attention—but it should. There’s an important moral to the story of the attack and its discovery: The security of the global Internet depends on countless obscure pieces of software written and maintained by even more obscure unpaid, distractible, and sometimes vulnerable volunteers. It’s an untenable situation, and one that is being exploited by malicious actors. Yet precious little is being done to remedy it.

Programmers dislike doing extra work. If they can find already-written code that does what they want, they’re going to use it rather than recreate the functionality. These code repositories, called libraries, are hosted on sites like GitHub. There are libraries for everything: displaying objects in 3D, spell-checking, performing complex mathematics, managing an e-commerce shopping cart, moving files around the Internet—everything. Libraries are essential to modern programming; they’re the building blocks of complex software. The modularity they provide makes software projects tractable. Everything you use contains dozens of these libraries: some commercial, some open source and freely available. They are essential to the functionality of the finished software. And to its security.

You’ve likely never heard of an open-source library called XZ Utils, but it’s on hundreds of millions of computers. It’s probably on yours. It’s certainly in whatever corporate or organizational network you use. It’s a freely available library that does data compression. It’s important, in the same way that hundreds of other similar obscure libraries are important.

Many open-source libraries, like XZ Utils, are maintained by volunteers. In the case of XZ Utils, it’s one person, named Lasse Collin. He has been in charge of XZ Utils since he wrote it in 2009. And, at least in 2022, he’s had some “longterm mental health issues.” (To be clear, he is not to blame in this story. This is a systems problem.)

Beginning in at least 2021, Collin was personally targeted. We don’t know by whom, but we have account names: Jia Tan, Jigar Kumar, Dennis Ens. They’re not real names. They pressured Collin to transfer control over XZ Utils. In early 2023, they succeeded. Tan spent the year slowly incorporating a backdoor into XZ Utils: disabling systems that might discover his actions, laying the groundwork, and finally adding the complete backdoor earlier this year. On March 25, Hans Jansen—another fake name—tried to push the various Unix systems to upgrade to the new version of XZ Utils.

And everyone was poised to do so. It’s a routine update. In the span of a few weeks, it would have been part of both Debian and Red Hat Linux, which run on the vast majority of servers on the Internet. But on March 29, another unpaid volunteer, Andres Freund—a real person who works for Microsoft but who was doing this in his spare time—noticed something weird about how much processing the new version of XZ Utils was doing. It’s the sort of thing that could be easily overlooked, and even more easily ignored. But for whatever reason, Freund tracked down the weirdness and discovered the backdoor.

It’s a masterful piece of work. It affects the SSH remote login protocol, basically by adding a hidden piece of functionality that requires a specific key to enable. Someone with that key can use the backdoored SSH to upload and execute an arbitrary piece of code on the target machine. SSH runs as root, so that code could have done anything. Let your imagination run wild.

This isn’t something a hacker just whips up. This backdoor is the result of a years-long engineering effort. The ways the code evades detection in source form, how it lies dormant and undetectable until activated, and its immense power and flexibility give credence to the widely held assumption that a major nation-state is behind this.

If it hadn’t been discovered, it probably would have eventually ended up on every computer and server on the Internet. Though it’s unclear whether the backdoor would have affected Windows and macOS, it would have worked on Linux. Remember in 2020, when Russia planted a backdoor into SolarWinds that affected 14,000 networks? That seemed like a lot, but this would have been orders of magnitude more damaging. And again, the catastrophe was averted only because a volunteer stumbled on it. And it was possible in the first place only because the first unpaid volunteer, someone who turned out to be a national security single point of failure, was personally targeted and exploited by a foreign actor.

This is no way to run critical national infrastructure. And yet, here we are. This was an attack on our software supply chain. This attack subverted software dependencies. The SolarWinds attack targeted the update process. Other attacks target system design, development, and deployment. Such attacks are becoming increasingly common and effective, and also are increasingly the weapon of choice of nation-states.

It’s impossible to count how many of these single points of failure are in our computer systems. And there’s no way to know how many of the unpaid and unappreciated maintainers of critical software libraries are vulnerable to pressure. (Again, don’t blame them. Blame the industry that is happy to exploit their unpaid labor.) Or how many more have accidentally created exploitable vulnerabilities. How many other coercion attempts are ongoing? A dozen? A hundred? It seems impossible that the XZ Utils operation was a unique instance.

Solutions are hard. Banning open source won’t work; it’s precisely because XZ Utils is open source that an engineer discovered the problem in time. Banning software libraries won’t work, either; modern software can’t function without them. For years, security engineers have been pushing something called a “software bill of materials”: an ingredients list of sorts so that when one of these packages is compromised, network owners at least know if they’re vulnerable. The industry hates this idea and has been fighting it for years, but perhaps the tide is turning.

The fundamental problem is that tech companies dislike spending extra money even more than programmers dislike doing extra work. If there’s free software out there, they are going to use it—and they’re not going to do much in-house security testing. Easier software development equals lower costs equals more profits. The market economy rewards this sort of insecurity.

We need some sustainable ways to fund open-source projects that become de facto critical infrastructure. Public shaming can help here. The Open Source Security Foundation (OSSF), founded in 2022 after another critical vulnerability in an open-source library—Log4j—was discovered, addresses this problem. The big tech companies pledged $30 million in funding after the critical Log4j supply chain vulnerability, but they never delivered. And they are still happy to make use of all this free labor and free resources, as a recent Microsoft anecdote indicates. The companies benefiting from these freely available libraries need to actually step up, and the government can force them to.

There’s a lot of tech that could be applied to this problem, if corporations were willing to spend the money. Liabilities will help. The Cybersecurity and Infrastructure Security Agency’s (CISA’s) “secure by design” initiative will help, and CISA is finally partnering with OSSF on this problem. Certainly the security of these libraries needs to be part of any broad government cybersecurity initiative.

We got extraordinarily lucky this time, but maybe we can learn from the catastrophe that didn’t happen. Like the power grid, communications network, and transportation systems, the software supply chain is critical infrastructure, part of national security, and vulnerable to foreign attack. The US government needs to recognize this as a national security problem and start treating it as such.

This essay originally appeared in Lawfare.

Maybe the Phone System Surveillance Vulnerabilities Will Be Fixed

Post Syndicated from Bruce Schneier original https://www.schneier.com/blog/archives/2024/04/maybe-the-phone-system-surveillance-vulnerabilities-will-be-fixed.html

It seems that the FCC might be fixing the vulnerabilities in SS7 and the Diameter protocol:

On March 27 the commission asked telecommunications providers to weigh in and detail what they are doing to prevent SS7 and Diameter vulnerabilities from being misused to track consumers’ locations.

The FCC has also asked carriers to detail any exploits of the protocols since 2018. The regulator wants to know the date(s) of the incident(s), what happened, which vulnerabilities were exploited and with which techniques, where the location tracking occurred, and ­ if known ­ the attacker’s identity.

This time frame is significant because in 2018, the Communications Security, Reliability, and Interoperability Council (CSRIC), a federal advisory committee to the FCC, issued several security best practices to prevent network intrusions and unauthorized location tracking.

I have written about this over the past decade.

NIST Cybersecurity Framework 2.0

Post Syndicated from Bruce Schneier original https://www.schneier.com/blog/archives/2024/03/nist-cybersecurity-framework-2-0.html

NIST has released version 2.0 of the Cybersecurity Framework:

The CSF 2.0, which supports implementation of the National Cybersecurity Strategy, has an expanded scope that goes beyond protecting critical infrastructure, such as hospitals and power plants, to all organizations in any sector. It also has a new focus on governance, which encompasses how organizations make and carry out informed decisions on cybersecurity strategy. The CSF’s governance component emphasizes that cybersecurity is a major source of enterprise risk that senior leaders should consider alongside others such as finance and reputation.

[…]

The framework’s core is now organized around six key functions: Identify, Protect, Detect, Respond and Recover, along with CSF 2.0’s newly added Govern function. When considered together, these functions provide a comprehensive view of the life cycle for managing cybersecurity risk.

The updated framework anticipates that organizations will come to the CSF with varying needs and degrees of experience implementing cybersecurity tools. New adopters can learn from other users’ successes and select their topic of interest from a new set of implementation examples and quick-start guides designed for specific types of users, such as small businesses, enterprise risk managers, and organizations seeking to secure their supply chains.

This is a big deal. The CSF is widely used, and has been in need of an update. And NIST is exactly the sort of respected organization to do this correctly.

Some news articles.

Upgrading GitHub.com to MySQL 8.0

Post Syndicated from Jiaqi Liu original https://github.blog/engineering/infrastructure/upgrading-github-com-to-mysql-8-0/


Over 15 years ago, GitHub started as a Ruby on Rails application with a single MySQL database. Since then, GitHub has evolved its MySQL architecture to meet the scaling and resiliency needs of the platform—including building for high availability, implementing testing automation, and partitioning the data. Today, MySQL remains a core part of GitHub’s infrastructure and our relational database of choice.

This is the story of how we upgraded our fleet of 1200+ MySQL hosts to 8.0. Upgrading the fleet with no impact to our Service Level Objectives (SLO) was no small feat–planning, testing and the upgrade itself took over a year and collaboration across multiple teams within GitHub.

Motivation for upgrading

Why upgrade to MySQL 8.0? With MySQL 5.7 nearing end of life, we upgraded our fleet to the next major version, MySQL 8.0. We also wanted to be on a version of MySQL that gets the latest security patches, bug fixes, and performance enhancements. There are also new features in 8.0 that we want to test and benefit from, including Instant DDLs, invisible indexes, and compressed bin logs, among others.

GitHub’s MySQL infrastructure

Before we dive into how we did the upgrade, let’s take a 10,000-foot view of our MySQL infrastructure:

  • Our fleet consists of 1200+ hosts. It’s a combination of Azure Virtual Machines and bare metal hosts in our data center.
  • We store 300+ TB of data and serve 5.5 million queries per second across 50+ database clusters.
  • Each cluster is configured for high availability with a primary plus replicas cluster setup.
  • Our data is partitioned. We leverage both horizontal and vertical sharding to scale our MySQL clusters. We have MySQL clusters that store data for specific product-domain areas. We also have horizontally sharded Vitess clusters for large-domain areas that outgrew the single-primary MySQL cluster.
  • We have a large ecosystem of tools consisting of Percona Toolkit, gh-ost, orchestrator, freno, and in-house automation used to operate the fleet.

All this sums up to a diverse and complex deployment that needs to be upgraded while maintaining our SLOs.

Preparing the journey

As the primary data store for GitHub, we hold ourselves to a high standard for availability. Due to the size of our fleet and the criticality of MySQL infrastructure, we had a few requirements for the upgrade process:

  • We must be able to upgrade each MySQL database while adhering to our Service Level Objectives (SLOs) and Service Level Agreements (SLAs).
  • We are unable to account for all failure modes in our testing and validation stages. So, in order to remain within SLO, we needed to be able to roll back to the prior version of MySQL 5.7 without a disruption of service.
  • We have a very diverse workload across our MySQL fleet. To reduce risk, we needed to upgrade each database cluster atomically and schedule around other major changes. This meant the upgrade process would be a long one. Therefore, we knew from the start we needed to be able to sustain operating a mixed-version environment.

Preparation for the upgrade started in July 2022 and we had several milestones to reach even before upgrading a single production database.

Prepare infrastructure for upgrade

We needed to determine appropriate default values for MySQL 8.0 and perform some baseline performance benchmarking. Since we needed to operate two versions of MySQL, our tooling and automation needed to be able to handle mixed versions and be aware of new, different, or deprecated syntax between 5.7 and 8.0.

Ensure application compatibility

We added MySQL 8.0 to Continuous Integration (CI) for all applications using MySQL. We ran MySQL 5.7 and 8.0 side-by-side in CI to ensure that there wouldn’t be regressions during the prolonged upgrade process. We detected a variety of bugs and incompatibilities in CI, helping us remove any unsupported configurations or features and escape any new reserved keywords.

To help application developers transition towards MySQL 8.0, we also enabled an option to select a MySQL 8.0 prebuilt container in GitHub Codespaces for debugging and provided MySQL 8.0 development clusters for additional pre-prod testing.

Communication and transparency

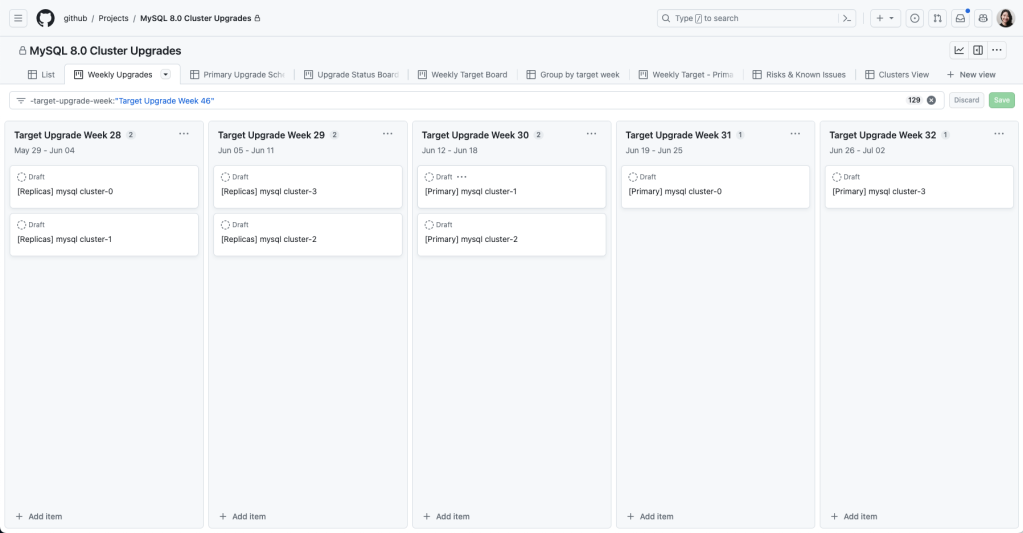
We used GitHub Projects to create a rolling calendar to communicate and track our upgrade schedule internally. We created issue templates that tracked the checklist for both application teams and the database team to coordinate an upgrade.

Project Board for tracking the MySQL 8.0 upgrade schedule

Upgrade plan

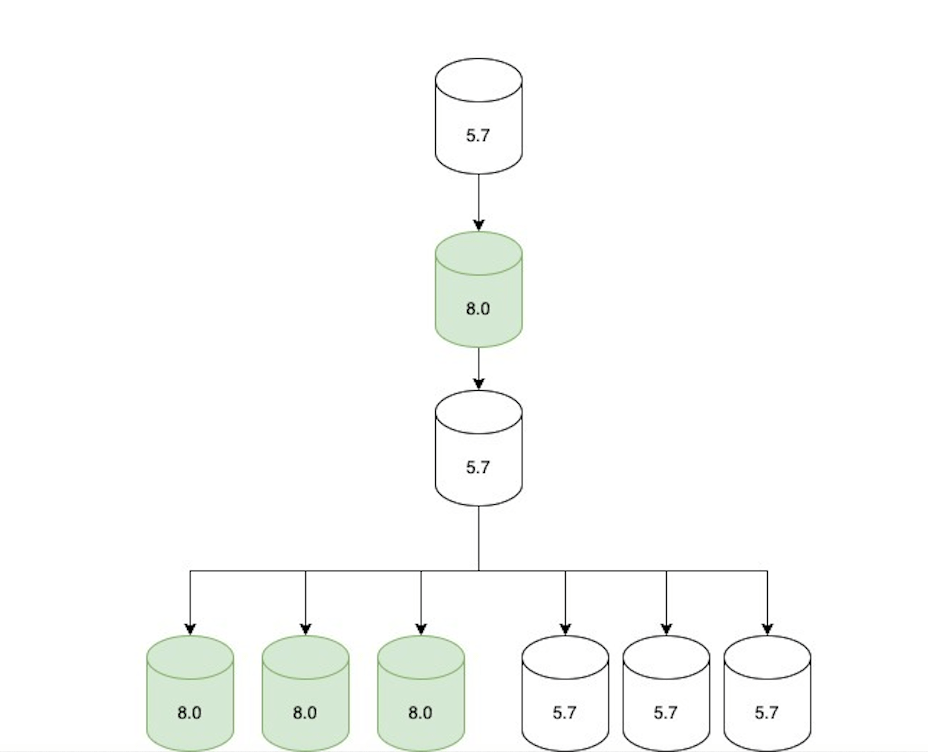
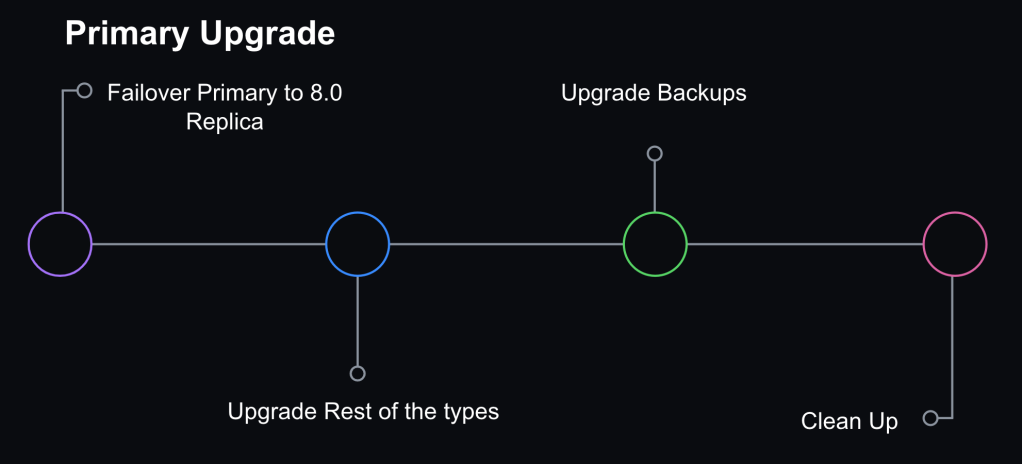
To meet our availability standards, we had a gradual upgrade strategy that allowed for checkpoints and rollbacks throughout the process.

Step 1: Rolling replica upgrades

We started with upgrading a single replica and monitoring while it was still offline to ensure basic functionality was stable. Then, we enabled production traffic and continued to monitor for query latency, system metrics, and application metrics. We gradually brought 8.0 replicas online until we upgraded an entire data center and then iterated through other data centers. We left enough 5.7 replicas online in order to rollback, but we disabled production traffic to start serving all read traffic through 8.0 servers.

The replica upgrade strategy involved gradual rollouts in each data center (DC).

Step 2: Update replication topology

Once all the read-only traffic was being served via 8.0 replicas, we adjusted the replication topology as follows:

  • An 8.0 primary candidate was configured to replicate directly under the current 5.7 primary.
  • Two replication chains were created downstream of that 8.0 replica:
  • A set of only 5.7 replicas (not serving traffic, but ready in case of rollback).
  • A set of only 8.0 replicas (serving traffic).
  • The topology was only in this state for a short period of time (hours at most) until we moved to the next step.
To facilitate the upgrade, the topology was updated to have two replication chains.

Step 3: Promote MySQL 8.0 host to primary

We opted not to do direct upgrades on the primary database host. Instead, we would promote a MySQL 8.0 replica to primary through a graceful failover performed with Orchestrator. At that point, the replication topology consisted of an 8.0 primary with two replication chains attached to it: an offline set of 5.7 replicas in case of rollback and a serving set of 8.0 replicas.

Orchestrator was also configured to blacklist 5.7 hosts as potential failover candidates to prevent an accidental rollback in case of an unplanned failover.

Primary failover and additional steps to finalize MySQL 8.0 upgrade for a database

Step 4: Internal facing instance types upgraded

We also have ancillary servers for backups or non-production workloads. Those were subsequently upgraded for consistency.

Step 5: Cleanup

Once we confirmed that the cluster didn’t need to rollback and was successfully upgraded to 8.0, we removed the 5.7 servers. Validation consisted of at least one complete 24 hour traffic cycle to ensure there were no issues during peak traffic.

Ability to Rollback

A core part of keeping our upgrade strategy safe was maintaining the ability to rollback to the prior version of MySQL 5.7. For read-replicas, we ensured enough 5.7 replicas remained online to serve production traffic load, and rollback was initiated by disabling the 8.0 replicas if they weren’t performing well. For the primary, in order to roll back without data loss or service disruption, we needed to be able to maintain backwards data replication between 8.0 and 5.7.

MySQL supports replication from one release to the next higher release but does not explicitly support the reverse (MySQL Replication compatibility). When we tested promoting an 8.0 host to primary on our staging cluster, we saw replication break on all 5.7 replicas. There were a couple of problems we needed to overcome:

  1. In MySQL 8.0, utf8mb4 is the default character set and uses a more modern utf8mb4_0900_ai_ci collation as the default. The prior version of MySQL 5.7 supported the utf8mb4_unicode_520_ci collation but not the latest version of Unicode utf8mb4_0900_ai_ci.
  2. MySQL 8.0 introduces roles for managing privileges but this feature did not exist in MySQL 5.7. When an 8.0 instance was promoted to be a primary in a cluster, we encountered problems. Our configuration management was expanding certain permission sets to include role statements and executing them, which broke downstream replication in 5.7 replicas. We solved this problem by temporarily adjusting defined permissions for affected users during the upgrade window.

To address the character collation incompatibility, we had to set the default character encoding to utf8 and collation to utf8_unicode_ci.

For the GitHub.com monolith, our Rails configuration ensured that character collation was consistent and made it easier to standardize client configurations to the database. As a result, we had high confidence that we could maintain backward replication for our most critical applications.

Challenges

Throughout our testing, preparation and upgrades, we encountered some technical challenges.

What about Vitess?

We use Vitess for horizontally sharding relational data. For the most part, upgrading our Vitess clusters was not too different from upgrading the MySQL clusters. We were already running Vitess in CI, so we were able to validate query compatibility. In our upgrade strategy for sharded clusters, we upgraded one shard at a time. VTgate, the Vitess proxy layer, advertises the version of MySQL and some client behavior depends on this version information. For example, one application used a Java client that disabled the query cache for 5.7 servers—since the query cache was removed in 8.0, it generated blocking errors for them. So, once a single MySQL host was upgraded for a given keyspace, we had to make sure we also updated the VTgate setting to advertise 8.0.

Replication delay

We use read-replicas to scale our read availability. GitHub.com requires low replication delay in order to serve up-to-date data.

Earlier on in our testing, we encountered a replication bug in MySQL that was patched on 8.0.28:

Replication: If a replica server with the system variable replica_preserve_commit_order = 1 set was used under intensive load for a long period, the instance could run out of commit order sequence tickets. Incorrect behavior after the maximum value was exceeded caused the applier to hang and the applier worker threads to wait indefinitely on the commit order queue. The commit order sequence ticket generator now wraps around correctly. Thanks to Zhai Weixiang for the contribution. (Bug #32891221, Bug #103636)

We happen to meet all the criteria for hitting this bug.

  • We use replica_preserve_commit_order because we use GTID based replication.
  • We have intensive load for long periods of time on many of our clusters and certainly for all of our most critical ones. Most of our clusters are very write-heavy.

Since this bug was already patched upstream, we just needed to ensure we are deploying a version of MySQL higher than 8.0.28.

We also observed that the heavy writes that drove replication delay were exacerbated in MySQL 8.0. This made it even more important that we avoid heavy bursts in writes. At GitHub, we use freno to throttle write workloads based on replication lag.

Queries would pass CI but fail on production

We knew we would inevitably see problems for the first time in production environments—hence our gradual rollout strategy with upgrading replicas. We encountered queries that passed CI but would fail on production when encountering real-world workloads. Most notably, we encountered a problem where queries with large WHERE IN clauses would crash MySQL. We had large WHERE IN queries containing over tens of thousands of values. In those cases, we needed to rewrite the queries prior to continuing the upgrade process. Query sampling helped to track and detect these problems. At GitHub, we use Solarwinds DPM (VividCortex), a SaaS database performance monitor, for query observability.

Learnings and takeaways

Between testing, performance tuning, and resolving identified issues, the overall upgrade process took over a year and involved engineers from multiple teams at GitHub. We upgraded our entire fleet to MySQL 8.0 – including staging clusters, production clusters in support of GitHub.com, and instances in support of internal tools. This upgrade highlighted the importance of our observability platform, testing plan, and rollback capabilities. The testing and gradual rollout strategy allowed us to identify problems early and reduce the likelihood for encountering new failure modes for the primary upgrade.

While there was a gradual rollout strategy, we still needed the ability to rollback at every step and we needed the observability to identify signals to indicate when a rollback was needed. The most challenging aspect of enabling rollbacks was holding onto the backward replication from the new 8.0 primary to 5.7 replicas. We learned that consistency in the Trilogy client library gave us more predictability in connection behavior and allowed us to have confidence that connections from the main Rails monolith would not break backward replication.

However, for some of our MySQL clusters with connections from multiple different clients in different frameworks/languages, we saw backwards replication break in a matter of hours which shortened the window of opportunity for rollback. Luckily, those cases were few and we didn’t have an instance where the replication broke before we needed to rollback. But for us this was a lesson that there are benefits to having known and well-understood client-side connection configurations. It emphasized the value of developing guidelines and frameworks to ensure consistency in such configurations.

Prior efforts to partition our data paid off—it allowed us to have more targeted upgrades for the different data domains. This was important as one failing query would block the upgrade for an entire cluster and having different workloads partitioned allowed us to upgrade piecemeal and reduce the blast radius of unknown risks encountered during the process. The tradeoff here is that this also means that our MySQL fleet has grown.

The last time GitHub upgraded MySQL versions, we had five database clusters and now we have 50+ clusters. In order to successfully upgrade, we had to invest in observability, tooling, and processes for managing the fleet.

Conclusion

A MySQL upgrade is just one type of routine maintenance that we have to perform – it’s critical for us to have an upgrade path for any software we run on our fleet. As part of the upgrade project, we developed new processes and operational capabilities to successfully complete the MySQL version upgrade. Yet, we still had too many steps in the upgrade process that required manual intervention and we want to reduce the effort and time it takes to complete future MySQL upgrades.

We anticipate that our fleet will continue to grow as GitHub.com grows and we have goals to partition our data further which will increase our number of MySQL clusters over time. Building in automation for operational tasks and self-healing capabilities can help us scale MySQL operations in the future. We believe that investing in reliable fleet management and automation will allow us to scale github and keep up with required maintenance, providing a more predictable and resilient system.

The lessons from this project provided the foundations for our MySQL automation and will pave the way for future upgrades to be done more efficiently, but still with the same level of care and safety.

The post Upgrading GitHub.com to MySQL 8.0 appeared first on The GitHub Blog.

EPA Won’t Force Water Utilities to Audit Their Cybersecurity

Post Syndicated from Bruce Schneier original https://www.schneier.com/blog/archives/2023/10/epa-wont-force-water-utilities-to-audit-their-cybersecurity.html

The industry pushed back:

Despite the EPA’s willingness to provide training and technical support to help states and public water system organizations implement cybersecurity surveys, the move garnered opposition from both GOP state attorneys and trade groups.

Republican state attorneys that were against the new proposed policies said that the call for new inspections could overwhelm state regulators. The attorney generals of Arkansas, Iowa and Missouri all sued the EPA—claiming the agency had no authority to set these requirements. This led to the EPA’s proposal being temporarily blocked back in June.

So now we have a piece of our critical infrastructure with substandard cybersecurity. This seems like a really bad outcome.

Hacking Gas Pumps via Bluetooth

Post Syndicated from Bruce Schneier original https://www.schneier.com/blog/archives/2023/10/hacking-gas-pumps-via-bluetooth.html

Turns out pumps at gas stations are controlled via Bluetooth, and that the connections are insecure. No details in the article, but it seems that it’s easy to take control of the pump and have it dispense gas without requiring payment.

It’s a complicated crime to monetize, though. You need to sell access to the gas pump to others.

EDITED TO ADD (10/13): Reader Jeff Hall says that story is not accurate, and that the gas pumps do not have a Bluetooth connection.

December’s Reimagining Democracy Workshop

Post Syndicated from Bruce Schneier original https://www.schneier.com/blog/archives/2023/08/decembers-reimagining-democracy-workshop.html

Imagine that we’ve all—all of us, all of society—landed on some alien planet, and we have to form a government: clean slate. We don’t have any legacy systems from the US or any other country. We don’t have any special or unique interests to perturb our thinking.

How would we govern ourselves?

It’s unlikely that we would use the systems we have today. The modern representative democracy was the best form of government that mid-eighteenth-century technology could conceive of. The twenty-first century is a different place scientifically, technically and socially.

For example, the mid-eighteenth-century democracies were designed under the assumption that both travel and communications were hard. Does it still make sense for all of us living in the same place to organize every few years and choose one of us to go to a big room far away and create laws in our name?

Representative districts are organized around geography, because that’s the only way that made sense 200-plus years ago. But we don’t have to do it that way. We can organize representation by age: one representative for the thirty-one-year-olds, another for the thirty-two-year-olds, and so on. We can organize representation randomly: by birthday, perhaps. We can organize any way we want.

US citizens currently elect people for terms ranging from two to six years. Is ten years better? Is ten days better? Again, we have more technology and therefor more options.

Indeed, as a technologist who studies complex systems and their security, I believe the very idea of representative government is a hack to get around the technological limitations of the past. Voting at scale is easier now than it was 200 year ago. Certainly we don’t want to all have to vote on every amendment to every bill, but what’s the optimal balance between votes made in our name and ballot measures that we all vote on?

In December 2022, I organized a workshop to discuss these and other questions. I brought together fifty people from around the world: political scientists, economists, law professors, AI experts, activists, government officials, historians, science fiction writers and more. We spent two days talking about these ideas. Several themes emerged from the event.

Misinformation and propaganda were themes, of course—and the inability to engage in rational policy discussions when people can’t agree on the facts.

Another theme was the harms of creating a political system whose primary goals are economic. Given the ability to start over, would anyone create a system of government that optimizes the near-term financial interest of the wealthiest few? Or whose laws benefit corporations at the expense of people?

Another theme was capitalism, and how it is or isn’t intertwined with democracy. And while the modern market economy made a lot of sense in the industrial age, it’s starting to fray in the information age. What comes after capitalism, and how does it affect how we govern ourselves?

Many participants examined the effects of technology, especially artificial intelligence. We looked at whether—and when—we might be comfortable ceding power to an AI. Sometimes it’s easy. I’m happy for an AI to figure out the optimal timing of traffic lights to ensure the smoothest flow of cars through the city. When will we be able to say the same thing about setting interest rates? Or designing tax policies?

How would we feel about an AI device in our pocket that voted in our name, thousands of times per day, based on preferences that it inferred from our actions? If an AI system could determine optimal policy solutions that balanced every voter’s preferences, would it still make sense to have representatives? Maybe we should vote directly for ideas and goals instead, and leave the details to the computers. On the other hand, technological solutionism regularly fails.

Scale was another theme. The size of modern governments reflects the technology at the time of their founding. European countries and the early American states are a particular size because that’s what was governable in the 18th and 19th centuries. Larger governments—the US as a whole, the European Union—reflect a world in which travel and communications are easier. The problems we have today are primarily either local, at the scale of cities and towns, or global—even if they are currently regulated at state, regional or national levels. This mismatch is especially acute when we try to tackle global problems. In the future, do we really have a need for political units the size of France or Virginia? Or is it a mixture of scales that we really need, one that moves effectively between the local and the global?

As to other forms of democracy, we discussed one from history and another made possible by today’s technology.

Sortition is a system of choosing political officials randomly to deliberate on a particular issue. We use it today when we pick juries, but both the ancient Greeks and some cities in Renaissance Italy used it to select major political officials. Today, several countries—largely in Europe—are using sortition for some policy decisions. We might randomly choose a few hundred people, representative of the population, to spend a few weeks being briefed by experts and debating the problem—and then decide on environmental regulations, or a budget, or pretty much anything.

Liquid democracy does away with elections altogether. Everyone has a vote, and they can keep the power to cast it themselves or assign it to another person as a proxy. There are no set elections; anyone can reassign their proxy at any time. And there’s no reason to make this assignment all or nothing. Perhaps proxies could specialize: one set of people focused on economic issues, another group on health and a third bunch on national defense. Then regular people could assign their votes to whichever of the proxies most closely matched their views on each individual matter—or step forward with their own views and begin collecting proxy support from other people.

This all brings up another question: Who gets to participate? And, more generally, whose interests are taken into account? Early democracies were really nothing of the sort: They limited participation by gender, race and land ownership.

We should debate lowering the voting age, but even without voting we recognize that children too young to vote have rights—and, in some cases, so do other species. Should future generations get a “voice,” whatever that means? What about nonhumans or whole ecosystems?

Should everyone get the same voice? Right now in the US, the outsize effect of money in politics gives the wealthy disproportionate influence. Should we encode that explicitly? Maybe younger people should get a more powerful vote than everyone else. Or maybe older people should.

Those questions lead to ones about the limits of democracy. All democracies have boundaries limiting what the majority can decide. We all have rights: the things that cannot be taken away from us. We cannot vote to put someone in jail, for example.

But while we can’t vote a particular publication out of existence, we can to some degree regulate speech. In this hypothetical community, what are our rights as individuals? What are the rights of society that supersede those of individuals?

Personally, I was most interested in how these systems fail. As a security technologist, I study how complex systems are subverted—hacked, in my parlance—for the benefit of a few at the expense of the many. Think tax loopholes, or tricks to avoid government regulation. I want any government system to be resilient in the face of that kind of trickery.

Or, to put it another way, I want the interests of each individual to align with the interests of the group at every level. We’ve never had a system of government with that property before—even equal protection guarantees and First Amendment rights exist in a competitive framework that puts individuals’ interests in opposition to one another. But—in the age of such existential risks as climate and biotechnology and maybe AI—aligning interests is more important than ever.

Our workshop didn’t produce any answers; that wasn’t the point. Our current discourse is filled with suggestions on how to patch our political system. People regularly debate changes to the Electoral College, or the process of creating voting districts, or term limits. But those are incremental changes.

It’s hard to find people who are thinking more radically: looking beyond the horizon for what’s possible eventually. And while true innovation in politics is a lot harder than innovation in technology, especially without a violent revolution forcing change, it’s something that we as a species are going to have to get good at—one way or another.

This essay previously appeared in The Conversation.

White House Announces AI Cybersecurity Challenge

Post Syndicated from Bruce Schneier original https://www.schneier.com/blog/archives/2023/08/white-house-announces-ai-cybersecurity-challenge.html

At Black Hat last week, the White House announced an AI Cyber Challenge. Gizmodo reports:

The new AI cyber challenge (which is being abbreviated “AIxCC”) will have a number of different phases. Interested would-be competitors can now submit their proposals to the Small Business Innovation Research program for evaluation and, eventually, selected teams will participate in a 2024 “qualifying event.” During that event, the top 20 teams will be invited to a semifinal competition at that year’s DEF CON, another large cybersecurity conference, where the field will be further whittled down.

[…]

To secure the top spot in DARPA’s new competition, participants will have to develop security solutions that do some seriously novel stuff. “To win first-place, and a top prize of $4 million, finalists must build a system that can rapidly defend critical infrastructure code from attack,” said Perri Adams, program manager for DARPA’s Information Innovation Office, during a Zoom call with reporters Tuesday. In other words: the government wants software that is capable of identifying and mitigating risks by itself.

This is a great idea. I was a big fan of DARPA’s AI capture-the-flag event in 2016, and am happy to see that DARPA is again inciting research in this area. (China has been doing this every year since 2017.)

Backdoor in TETRA Police Radios

Post Syndicated from Bruce Schneier original https://www.schneier.com/blog/archives/2023/07/backdoor-in-tetra-police-radios.html

Seems that there is a deliberate backdoor in the twenty-year-old TErrestrial Trunked RAdio (TETRA) standard used by police forces around the world.

The European Telecommunications Standards Institute (ETSI), an organization that standardizes technologies across the industry, first created TETRA in 1995. Since then, TETRA has been used in products, including radios, sold by Motorola, Airbus, and more. Crucially, TETRA is not open-source. Instead, it relies on what the researchers describe in their presentation slides as “secret, proprietary cryptography,” meaning it is typically difficult for outside experts to verify how secure the standard really is.

The researchers said they worked around this limitation by purchasing a TETRA-powered radio from eBay. In order to then access the cryptographic component of the radio itself, Wetzels said the team found a vulnerability in an interface of the radio.

[…]

Most interestingly is the researchers’ findings of what they describe as the backdoor in TEA1. Ordinarily, radios using TEA1 used a key of 80-bits. But Wetzels said the team found a “secret reduction step” which dramatically lowers the amount of entropy the initial key offered. An attacker who followed this step would then be able to decrypt intercepted traffic with consumer-level hardware and a cheap software defined radio dongle.

Looks like the encryption algorithm was intentionally weakened by intelligence agencies to facilitate easy eavesdropping.

Specifically on the researchers’ claims of a backdoor in TEA1, Boyer added “At this time, we would like to point out that the research findings do not relate to any backdoors. The TETRA security standards have been specified together with national security agencies and are designed for and subject to export control regulations which determine the strength of the encryption.”

And I would like to point out that that’s the very definition of a backdoor.

Why aren’t we done with secret, proprietary cryptography? It’s just not a good idea.

Details of the security analysis. Another news article.

Chinese Hacking of US Critical Infrastructure

Post Syndicated from Bruce Schneier original https://www.schneier.com/blog/archives/2023/05/chinese-hacking-of-us-critical-infrastructure.html

Everyone is writing about an interagency and international report on Chinese hacking of US critical infrastructure.

Lots of interesting details about how the group, called Volt Typhoon, accesses target networks and evades detection.

PIPEDREAM Malware against Industrial Control Systems

Post Syndicated from Bruce Schneier original https://www.schneier.com/blog/archives/2023/05/pipedream-malware-against-industrial-control-systems.html

Another nation-state malware, Russian in origin:

In the early stages of the war in Ukraine in 2022, PIPEDREAM, a known malware was quietly on the brink of wiping out a handful of critical U.S. electric and liquid natural gas sites. PIPEDREAM is an attack toolkit with unmatched and unprecedented capabilities developed for use against industrial control systems (ICSs).

The malware was built to manipulate the network communication protocols used by programmable logic controllers (PLCs) leveraged by two critical producers of PLCs for ICSs within the critical infrastructure sector, Schneider Electric and OMRON.

CISA advisory. Wired article.

Cloudflare’s network expansion in Indonesia

Post Syndicated from Joanne Liew original https://blog.cloudflare.com/indonesia/

Cloudflare's network expansion in Indonesia

Cloudflare's network expansion in Indonesia

As home to over 200 million Internet users and the fourth-largest population in the world, Indonesians depend on fast and reliable Internet, but this has always been a challenging part of the world for Internet infrastructure. This has real world implications on performance and reliability (IP transit is on average 6x more expensive than our major South East Asian interconnection markets). That said, first we wanted to share what makes things challenging in Indonesia; geography, infrastructure, and market dynamics.

Geography: The Internet backbone for many countries is almost entirely delivered by terrestrial fiber optic cables, where connectivity is more affordable and easier to build when the land mass is contiguous and there is a concentrated population distribution. However, Indonesia is a collection of over 18,000 islands, spanning three time zones, and approximately 3,200 miles (5,100 km) east to west. By comparison, the United States is 2,800 miles (4,500 km) east to west. While parts of Indonesia are geographically close to Singapore (the regional Internet hub with over 60% of the region’s data centers) given how large Indonesia is, much of it is far away.

Infrastructure: Indonesia is a large country and to connect it to the rest of the Internet it currently relies on submarine fiber optic cables. There are a total of 22 separate submarine cables connecting Indonesia to Singapore, Malaysia, Australia and onward. Many of the cable systems cross the Strait of Malacca, a narrow stretch of water, between the Malay Peninsula (Peninsular Malaysia) and the Indonesian island of Sumatra to the southwest, connecting the Indian and Pacific Oceans. This makes reliability challenging as a result of human activities, such as ships dropping their anchors, fishing trawlers, and dredging as it is one of the world’s top five busiest shipping lanes. Additionally, Indonesia is geographically located in a very active seismic zone and is very earthquake prone.

There are a number of new submarine cable systems that have come online and four significant builds planned (Apricot, ACC-1, Echo and Nui) that will improve both available capacity and cost economics in the market. Right now the cost is still significantly higher than comparable distances. For example Jakarta to Singapore is approximately 60 times more expensive than a service the same distance would be in the continental US or Europe for a 100Gbps wavelength service. Staying in Asia, a similar distance from Hong Kong to Taiwan costs around 1/6th that of Jakarta to Singapore.

Cloudflare's network expansion in Indonesia

Cloudflare's network expansion in Indonesia
Cyber 1 and Cyber 3 (NTT NexCenter) Data Center Buildings in Jakarta, 2019 (Photo Credit: Tom Paseka).

Cloudflare's network expansion in Indonesia
Picture of Cyber 1 Lobby Directory

While areas like Batam are becoming increasingly popular for data center builds due to its proximity to Singapore, Jakarta is still the most developed and mature market. It has the largest and best interconnected data centers in the country, including the two pictured.

Cloudflare is deployed in the facility on the right (NTT NexCenter), however most ISPs are inside the building on the left (Cyber 1). The two buildings are approximately 30-50 meters apart, yet it’s surprisingly difficult to be able to connect between them. One of the reasons why is market fragmentation and how many options are available. In the adjacent picture of the Cyber 1 building lobby directory many of the listings are unique data centers each with different policies and access conditions.

In the past, we’ve talked about the Cost of Bandwidth around the world (and updated here), but we’ve never talked about Indonesia specifically. Using the same methodology as we’ve used in the past, Indonesia’s cost is 43x times more expensive than North America or Europe, or even multiples more expensive than other countries in Asia.

Market dynamics: While Indonesia has good and functioning Internet Exchanges, there are a few ISPs who dominate the market. The three largest ISPs in the country (Telkom Indonesia, Indosat Ooredoo Hutchison and XL Axiata) collectively control 80% of the market, while Telkom Indonesia alone has a market share of around 60% by revenue.

This results in Telkom Indonesia having a heavily dominant market share position to leverage resulting in refusal to peer, or exchange Internet traffic in Indonesia without expensive payments, or instead, preferring to connect to other networks outside of Indonesia, introducing latency and diminished performance.

Despite all of these challenges, our network has come a long way since our initial deployment to Jakarta in 2019.

We’ve established:

  • A carrier neutral local point of presence at NTT Indonesia Nexcenter Data Center, one of the major interconnection hubs in Jakarta
  • An edge partnership point of presence in Yogyakarta with CitranetIX
  • Direct interconnections in country with two of the top three networks.
  • Peering across three of the larger local internet exchanges, Indonesia Internet Exchange, Jakarta Internet Exchange and Biznet Internet Exchange
  • Dedicated 100G wavelength transport back to Singapore

All of this results in a more performant and reliable network for our local customers.

We wanted to see how our network is performing since deployment. We mentioned during Speed Week in 2021 how we benchmark against different networks, and sharing some of those benchmarks here.

At the end of December 2021, Cloudflare was only faster in a few networks, as compared to other providers in Indonesia.

Cloudflare's network expansion in Indonesia

Fast forward twelve months to December 2022, Cloudflare is significantly faster in even more networks.

Cloudflare's network expansion in Indonesia

The TCP protocol is a connection-oriented protocol, which means that a connection is established and maintained until the application programs at each end have finished exchanging messages. The Connect Time summarizes how fast a session can be set up between a client and a server over a network. TTLB (or time to last byte) is the time taken to send the entire response to the web browser. It’s a good measure of how long a complete download takes. Check out our recent blog on Benchmarking Edge Network Performance for more information on how we measure the performance of our network and benchmark ourselves against industry players.

On closer inspection against the three major ISPs specifically, we’re the top provider for two out of the three networks. Cloudflare’s performance has improved year-on-year (16% reduction) and continues to lead (comparative to the other networks) meaning faster and more responsive services for our customers.

Cloudflare's network expansion in Indonesia

Helping build a better Internet for Indonesia doesn’t stop here and there is always more work to be done! We want to be the number one network everywhere and won’t rest until we are. We are continuing to connect to more networks locally, invest in direct submarine cable capacity, as well as further deployments into new data center buildings, Internet Exchanges and new cities too!

Are you operating a network and not yet peering with Cloudflare? Log-in to our Peering Portal or find out more information here for ways to set up peering, or request we deploy nodes into your network directly.

Cyberwar Lessons from the War in Ukraine

Post Syndicated from Bruce Schneier original https://www.schneier.com/blog/archives/2023/02/cyberwar-lessons-from-the-war-in-ukraine.html

The Aspen Institute has published a good analysis of the successes, failures, and absences of cyberattacks as part of the current war in Ukraine: “The Cyber Defense Assistance Imperative ­ Lessons from Ukraine.”

Its conclusion:

Cyber defense assistance in Ukraine is working. The Ukrainian government and Ukrainian critical infrastructure organizations have better defended themselves and achieved higher levels of resiliency due to the efforts of CDAC and many others. But this is not the end of the road—the ability to provide cyber defense assistance will be important in the future. As a result, it is timely to assess how to provide organized, effective cyber defense assistance to safeguard the post-war order from potential aggressors.

The conflict in Ukraine is resetting the table across the globe for geopolitics and international security. The US and its allies have an imperative to strengthen the capabilities necessary to deter and respond to aggression that is ever more present in cyberspace. Lessons learned from the ad hoc conduct of cyber defense assistance in Ukraine can be institutionalized and scaled to provide new approaches and tools for preventing and managing cyber conflicts going forward.

I am often asked why where weren’t more successful cyberattacks by Russia against Ukraine. I generally give four reasons: (1) Cyberattacks are more effective in the “grey zone” between peace and war, and there are better alternatives once the shooting and bombing starts. (2) Setting these attacks up takes time, and Putin was secretive about his plans. (3) Putin was concerned about attacks spilling outside the war zone, and affecting other countries. (4) Ukrainian defenses were good, aided by other countries and companies. This paper gives a fifth reasons: they were technically successful, but keeping them out of the news made them operationally unsuccessful.