The 2024 UK general election, the first since Brexit officially began (January 31, 2020) and after 14 years of Conservative leadership, saw the Labour Party secure a majority. This blog post examines Internet traffic trends and cyberattack activity on election day, highlighting notable declines in traffic during the afternoon and evening as well as a DDoS attack on a political party shortly after polls closed.
The UK’s snap election on Thursday, July 4, 2024, typical of British Thursday weekday elections, contrasts with weekend elections in other countries. Polling stations were open from 07:00 to 22:00.
Generally, election days do not result in drastic changes to Internet traffic. Traffic typically dips during voting hours but not as sharply as during major events like national holidays, and rises in the evening as results are announced.
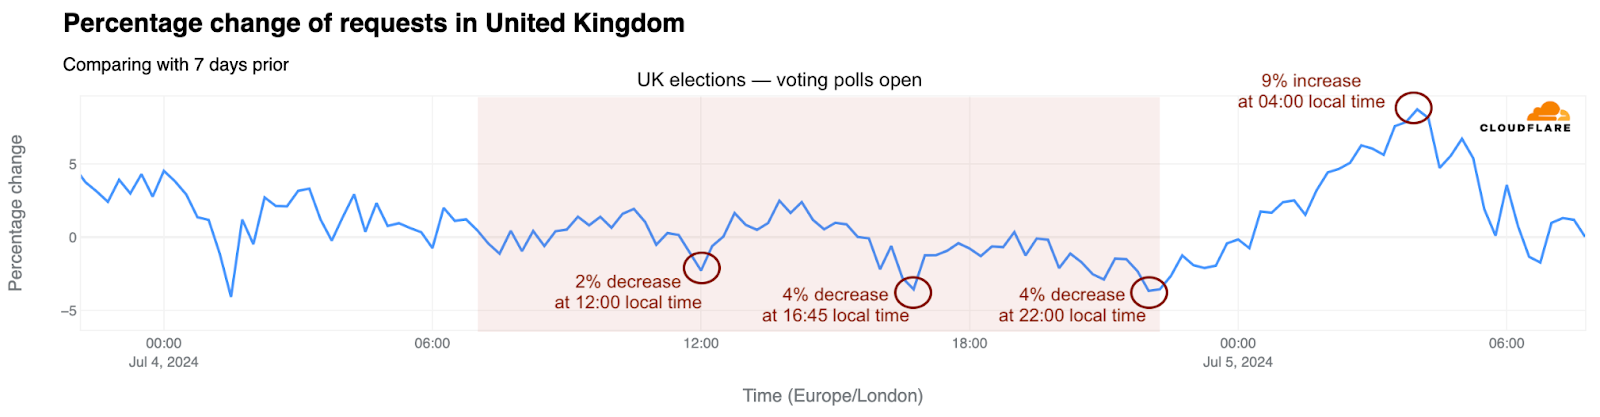
On July 4, 2024, traffic initially rose slightly from the previous week, then fell around noon (-2%). Significant declines began only after 16:00, with noticeable drops at 16:45 and again at 22:00 as polls closed.
Internet traffic dips across UK countries
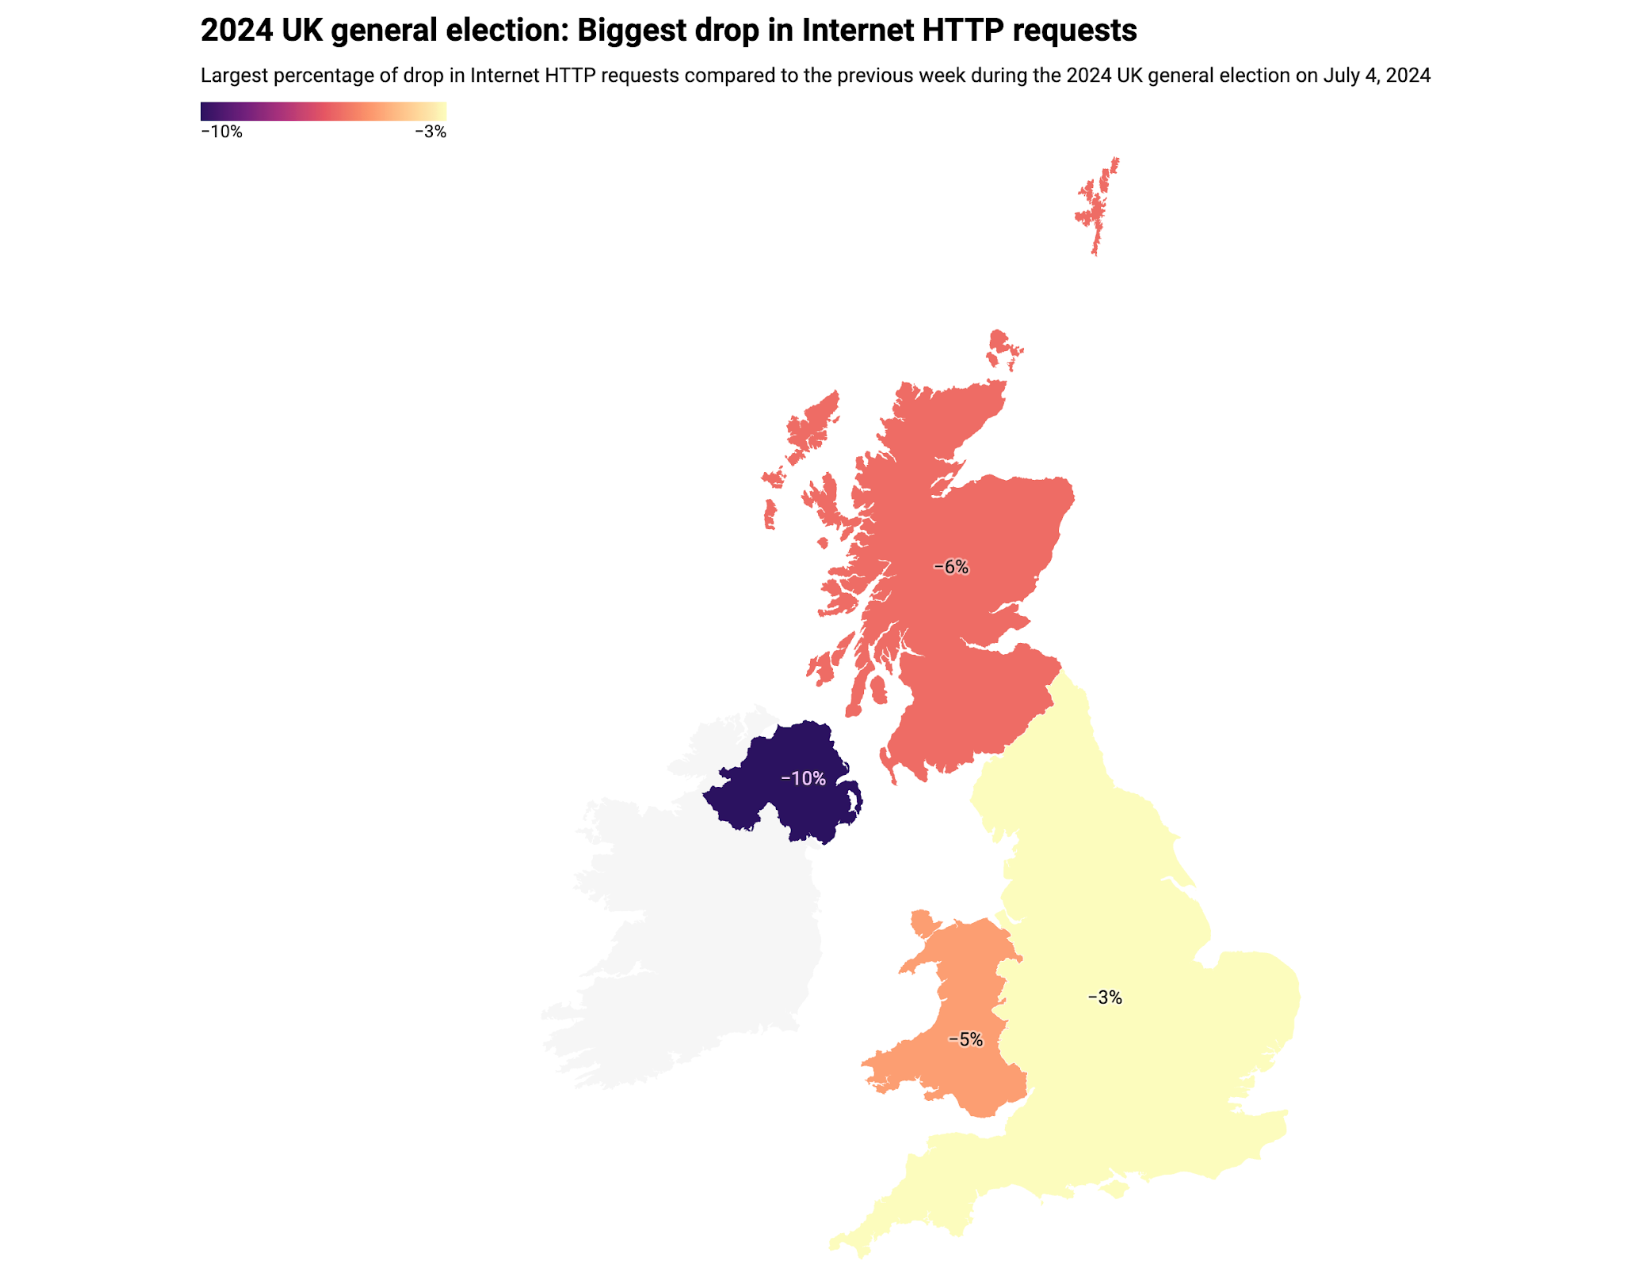
Traffic shifts during voting day, compared to the previous week, are more revealing when viewed in detail. The map and table below summarize the traffic changes observed at the country level within the UK, where the greatest impact was observed in Northern Ireland (-10%), followed by Scotland (-6%), Wales (-5%), and England (-3%), all after 16:00.
Country
Drop in traffic (%)
Time of drop in traffic (local)
Northern Ireland
-10%
July 4, 16:00
Scotland
-6%
July 4, 20:00
Wales
-5%
July 4, 17:00
England
-3%
July 4, 16:00
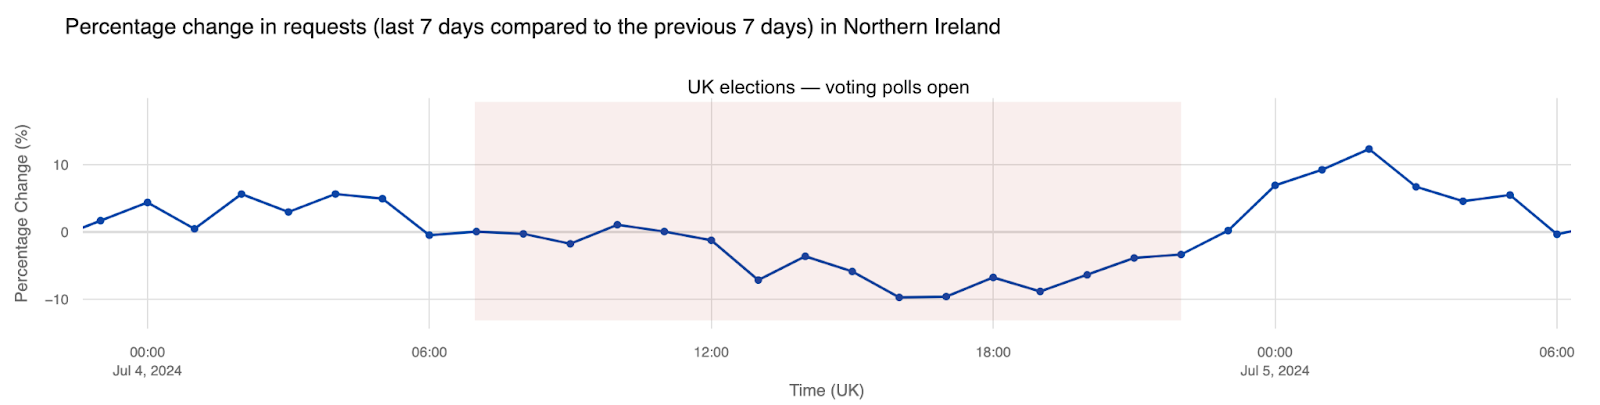
Next, examining the day’s traffic changes, we observed a clear drop in Northern Ireland around 13:00 local time and during off-work hours between 16:00 and 20:00, before it began to increase again.
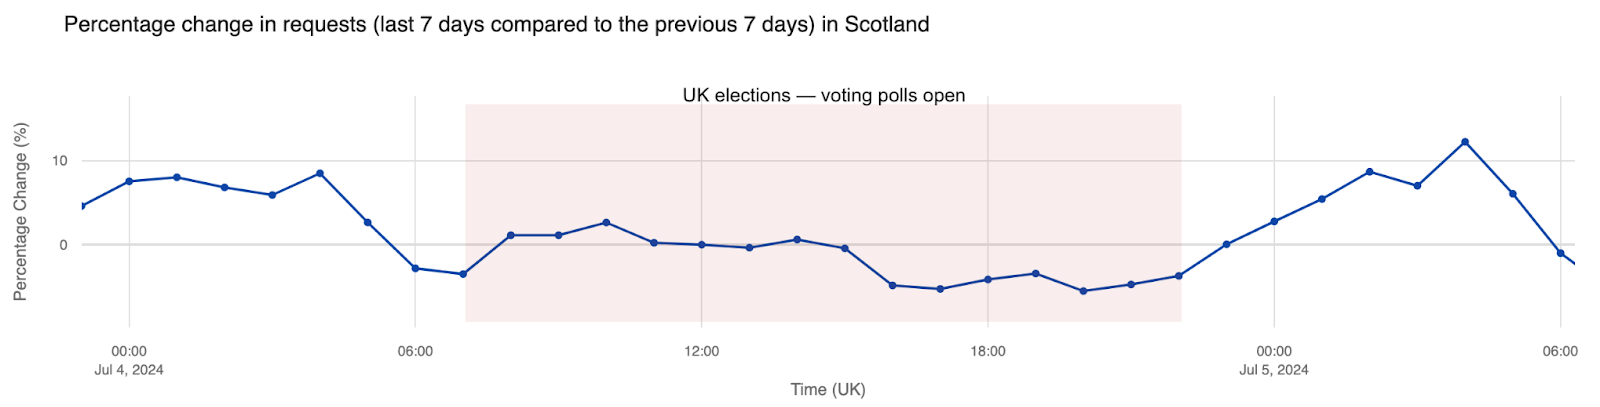
In Scotland, traffic fell by about 5% from 16:00 to 21:00 local time compared to the previous week.
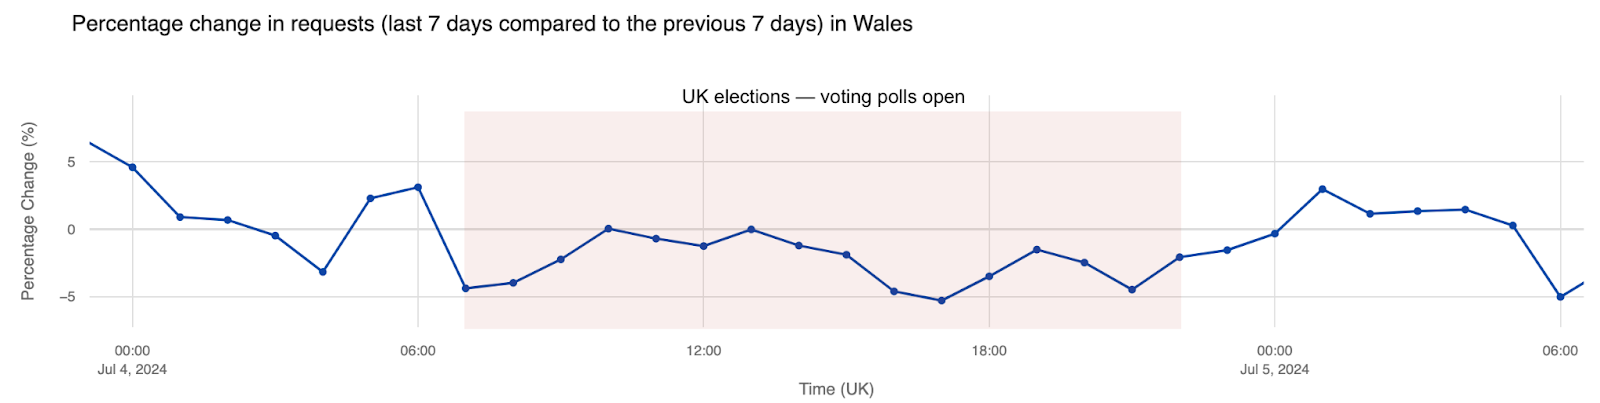
In Wales, decreases occurred at 07:00 (4% drop), between 16:00 and 18:00 (around 5% drop), and at 21:00.
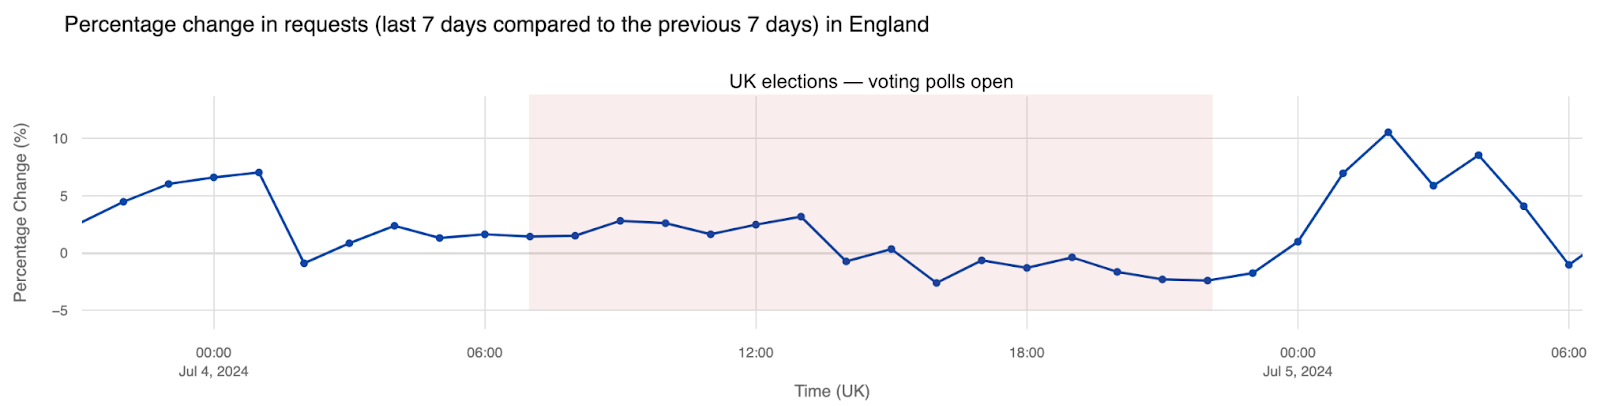
And in England, traffic decreased by approximately 3% between 16:00 and 18:00 and about 2% between 20:00 and 22:00.
In all the countries within the UK, traffic clearly increased after 23:00 local time when the voting polls had already closed and the first results started to arrive. Peak increases were reached at different times: Wales saw a 3% increase at 01:00; Northern Ireland and England experienced their highest increases of 12% and 11% respectively at 02:00; and Scotland had a 9% increase at 02:00 followed by a 12% spike at 04:00.
DNS trends: news outlets bring results
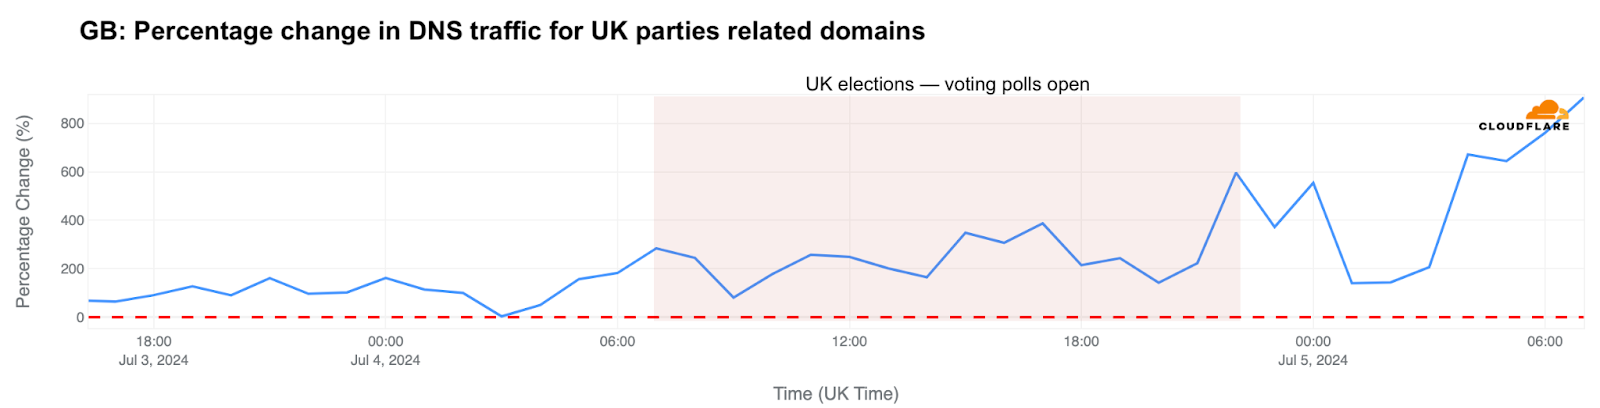
Switching focus to domain trends, our 1.1.1.1 resolver DNS data reveals a more targeted impact from the UK elections. Analyzing the participating parties, DNS traffic significantly increased on election day, peaking at 22:00 and midnight local time (up to 600% growth), and then again at 04:00 (671%).
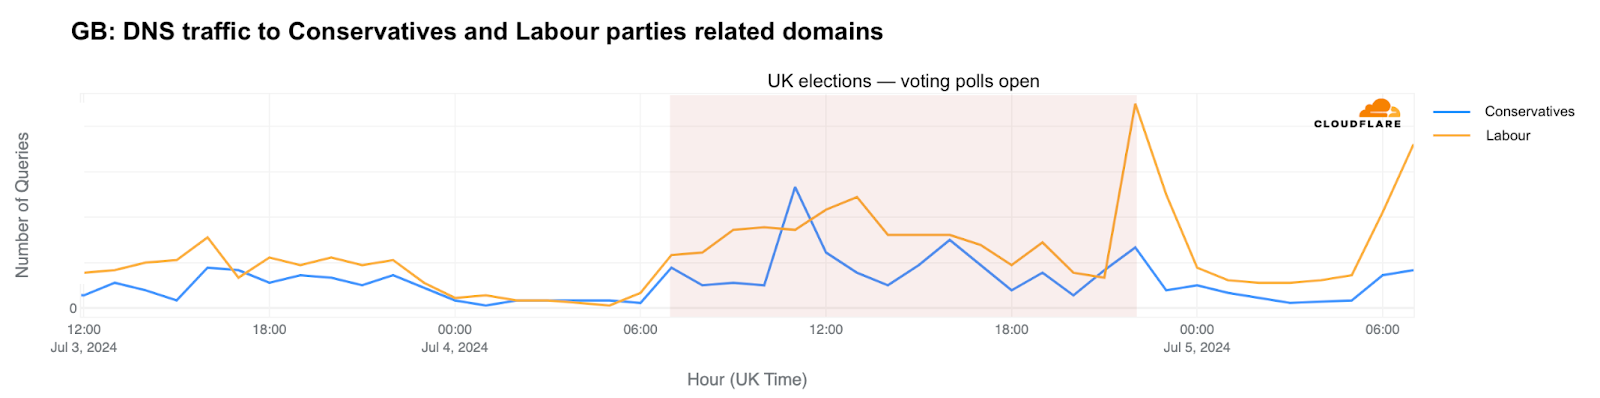
Among the main parties, Labour, led by Keir Starmer, outperformed the Conservative Party on election day. Labour’s DNS traffic spiked at 22:00 local time, with an 866% increase from the previous week.
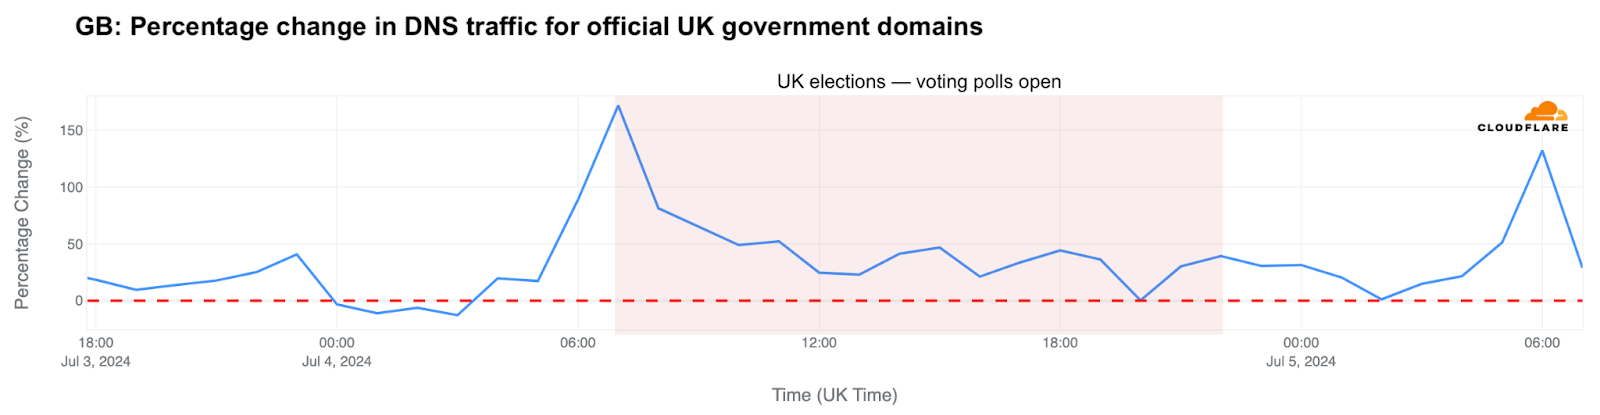
Analyzing official government and election-related websites, the UK differs from other countries in how results are shared. Official results weren’t continuously updated as they came in. The largest spike in DNS traffic, a 172% increase from the previous week, occurred on election morning around 07:00 local time. This increase likely happened because UK citizens were searching for the correct polling stations and other voting resources.
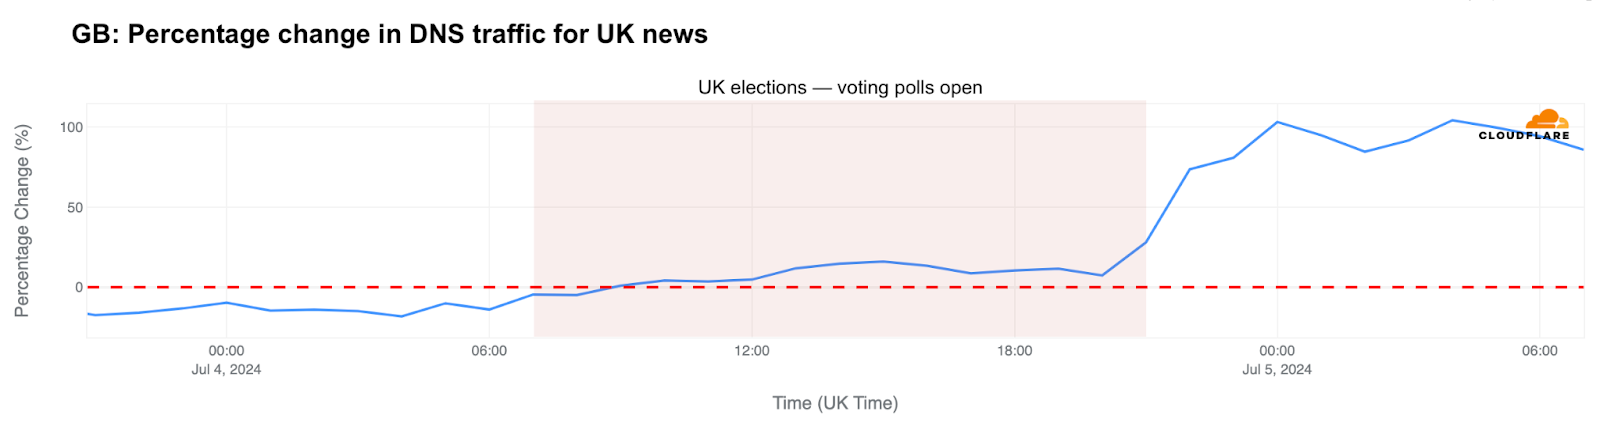
News sites and microblogging social media platforms in the UK experienced significant increases in usage after the polling stations closed at 22:00 local time. In the UK, news sites not only provide initial projections but also final results. DNS traffic for UK news media outlets surged 74% compared to the previous week, peaking at 104% at midnight and 04:00.
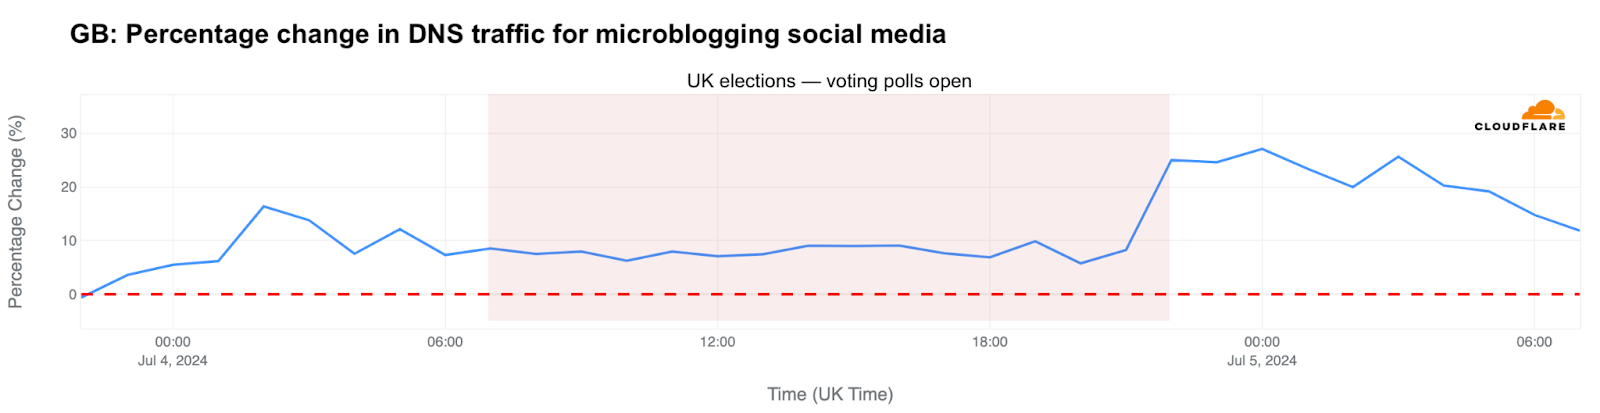
For microblogging social media in Great Britain, traffic was already 25% higher than the previous week when the polls closed (22:00), peaking at 27% at midnight and remaining elevated through the night.
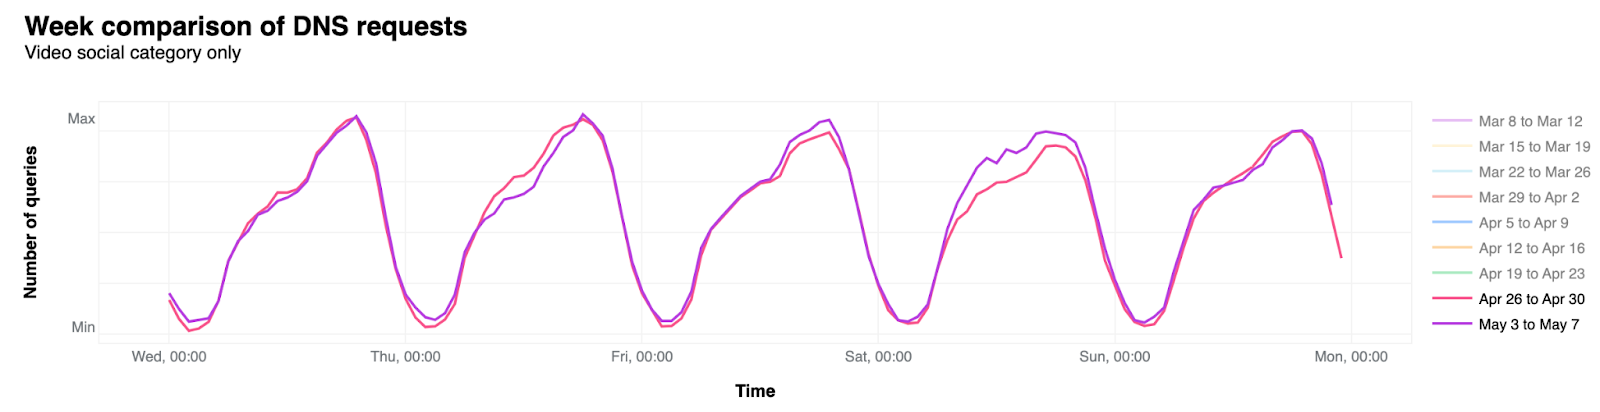
We saw last week in the US, during the Biden vs Trump debate, that video streaming social platforms such as YouTube or TikTok, were used to watch through news outlets channels the debate live, with DNS traffic surging. How about the UK? DNS traffic was 10% higher than in the previous week starting at midnight, and at 01:00 local time was 15% higher.
Attacks: political parties included impact
Focusing on attacks, those are usually constant, and aren’t necessarily driven always by elections. But, as we’ve seen at the start of the war in Ukraine or more recently in the Netherlands or in France, specific events do trigger attacks. DDoS (Distributed Denial of Service) attacks remain a common method employed by attackers.
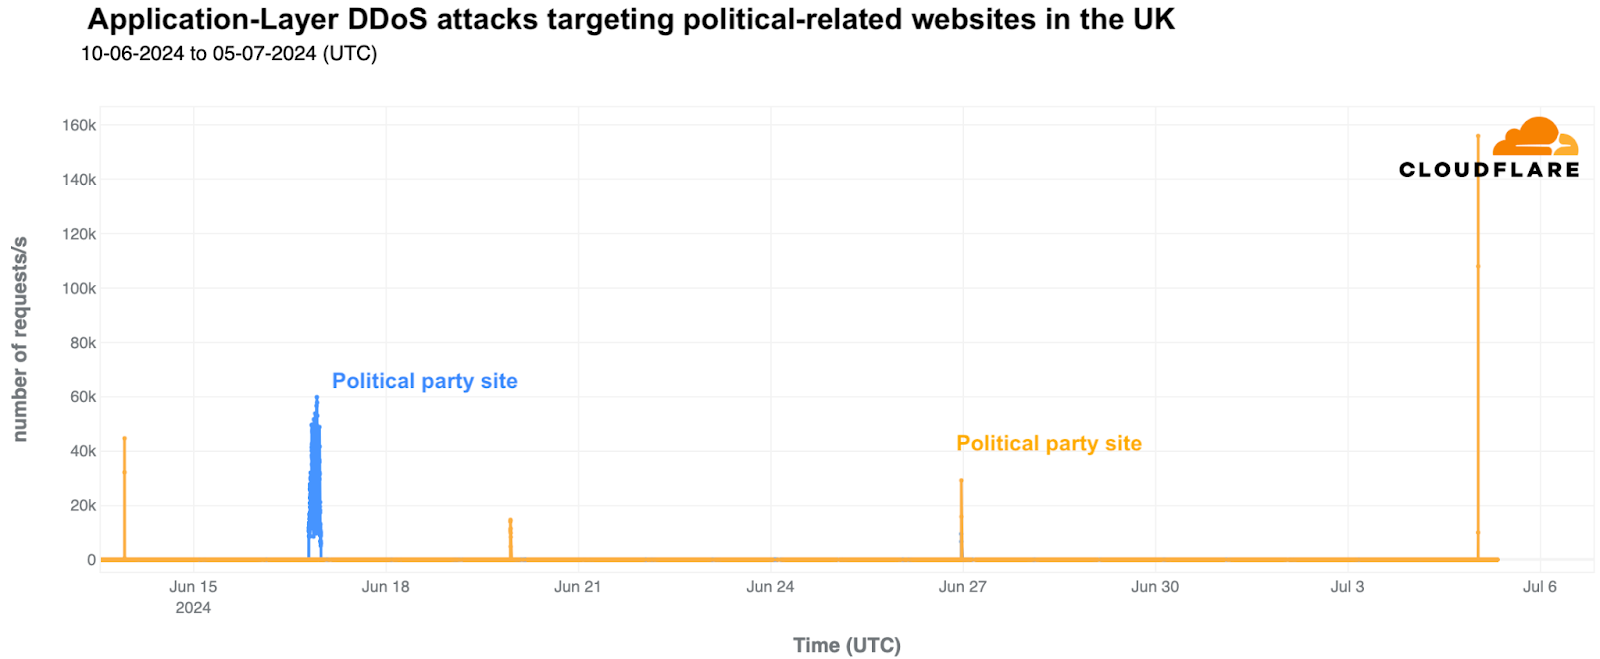
In recent days, there has been DDoS activity targeting political parties in the UK that participated in these elections. Our data shows that two parties experienced attacks that were blocked by Cloudflare. One party, represented in blue, suffered an attack on June 16, which lasted over four hours and peaked at 60,000 requests per second (rps).
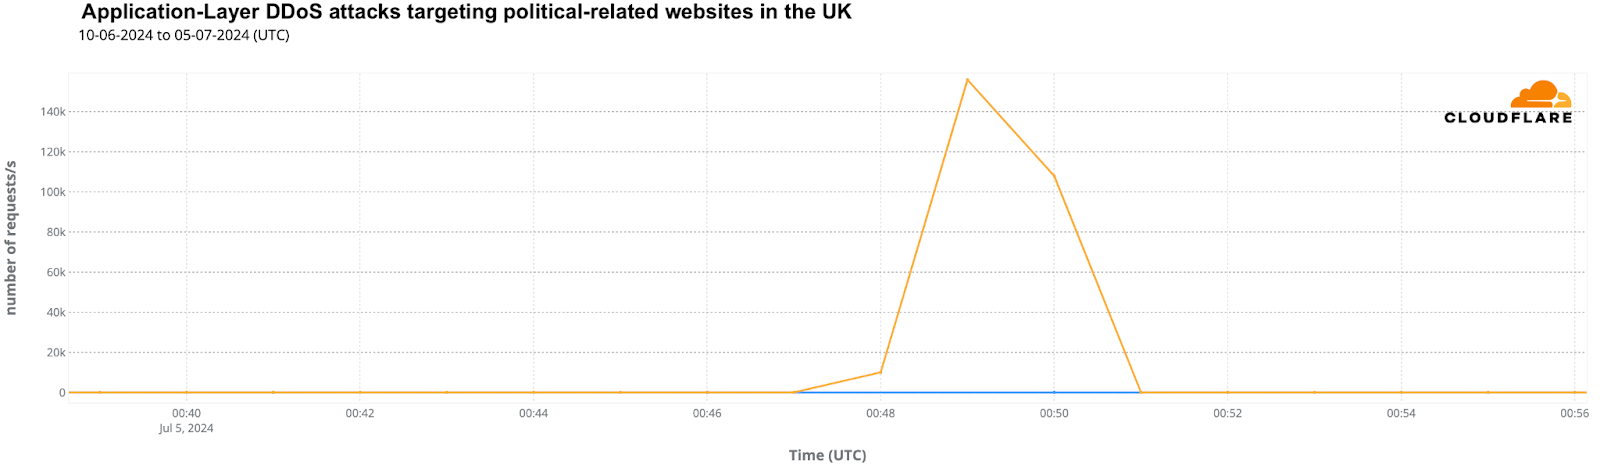
The party shown in yellow was hit by four DDoS attacks on different days: June 13, 19, 26, and in the early hours of July 5 (UTC), just after the election’s first predictions were broadcast, giving a majority to the Labour Party. This was the most significant attack in recent days, peaking at 156,000 rps. It began at 01:47 local time (00:47 UTC) and ended four minutes later. Here’s a closer look at that July 5, 2024, attack:
Although these rates are small on Cloudflare’s scale, they can be devastating for unprotected websites unaccustomed to such levels of traffic.
Conclusion: high intensity election year
Even if major political events don’t always bring notable changes to Internet traffic, our data shows that in the UK, traffic decreased more significantly in the afternoon and evening, especially as voting stations remained open until 22:00.
After voting ended, news sites became the go-to resource for UK residents seeking initial predictions and results.
We also observed attacks targeting political parties in the UK, further highlighting that this election year is marked by cyberattacks aimed at influencing politically related websites.
If you want to follow more trends and insights about the Internet and elections in particular, you can check Cloudflare Radar, and more specifically our new 2024 Elections Insights report, which will be updated as elections take place throughout the year.
France is currently electing a new government through early legislative elections that began on Sunday, June 30, 2024, with a second round scheduled for July 7. In this blog, we show how Cloudflare blocked DDoS attacks targeting three different French political parties.
2024 has been dubbed “the year of elections,” with elections taking place in over 60 countries, as we have mentioned before (1, 2, 3). If you regularly follow the Cloudflare blog, you’re aware that we consistently cover election-related trends, including in South Africa, India, Iceland, Mexico, the European Union and the 2024 US presidential debate. We also continuously update our election report on Cloudflare Radar.
Recently in France, as in the early stages of the war in Ukraine and during EU elections in the Netherlands, political events have precipitated cyberattacks. In France, several DDoS (Distributed Denial of Service attack) attacks targeted political parties involved in the elections over the past few days, with two parties hit just before the first round and another on election day itself.
The first political party, shown in yellow in the previous chart, experienced a DDoS attack on June 23, 2024, peaking at 68,000 requests per second (rps); it also endured a second DDoS attack on June 29, the day before the election, peaking at 20,000 rps. Although these rates are small on Cloudflare’s scale, they can be devastating for unprotected websites unaccustomed to such levels of traffic.
The second party, represented by the blue line, was targeted on June 24, June 27, and June 29, 2024, with the most severe attack occurring on June 27, reaching 118,000 rps during a day marked by frequent DDoS spikes that had in total 610 million daily requests.
The third party was attacked on the evening of June 29 in France, with several attempts blocked by Cloudflare on election day, June 30, between 10:00 and 23:00 UTC (12:00 and 01:00 local time). The peak activity targeting this party hit nearly 40,000 rps at 19:00 UTC (21:00 local time), with a total of 620 million daily DDoS requests on election day.
Modest drops and clear traffic increases after voting ends
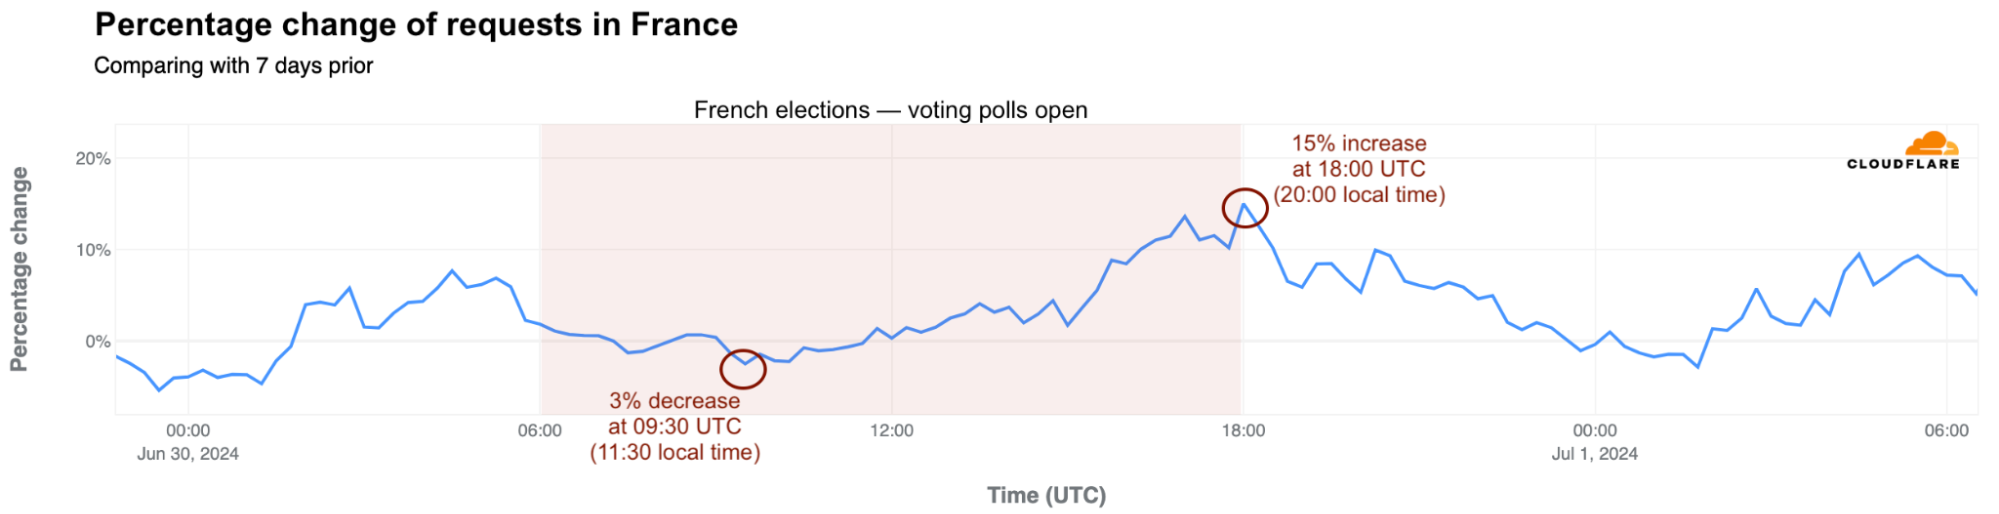
During the first round of the election this past Sunday, June 30, 2024, Internet traffic was initially higher than the previous week but dropped by as much as 3% at 11:30 local time (09:30 UTC) after the polls opened. Traffic began to increase again after 17:45 local time (15:45 UTC) and peaked at 20:00 local time (18:00 UTC) when the polls closed and the first projections were announced.
We will provide a trends update on the French election after the runoff scheduled for July 7, 2024.
If you want to follow more trends and insights about the Internet and elections in particular, you can check Cloudflare Radar, and more specifically our new 2024 Elections Insights report, which will be updated as elections take place throughout the year.
Football (“soccer” in the US) is considered the most popular sport in the world, with around 3.5 billion fans spread across the world. European football is central to its popularity. The UEFA Euro 2024 (the European Football Championship) started on June 14 and will run until July 14, 2024. But how much do these games impact Internet traffic in countries where national teams are playing? That’s what we aim to explore in this blog post. We found that, on average, traffic dropped 6% during games in European countries with national teams playing in the tournament.
Cloudflare has a global presence with data centers in over 320 cities, which helps provide a global view of what’s happening on the Internet. This is helpful for security, privacy, efficiency, and speed purposes, but also for observing Internet disruptions and traffic trends.
In the past, we’ve seen how Internet traffic and HTTP requests are impacted by events such as total solar eclipses, the Super Bowl, and elections. 2024 is the year of elections, and we’ve been sharing our observations in blog posts and our new 2024 Election Insights report on Cloudflare Radar.
However, football games are different from elections. Related trends happen when major teams or national squads are playing matches that draw a lot of human attention. If a game is broadcast on a national TV channel, Internet traffic typically drops because during games. People’s attention is more on the TV set with the ‘old’ broadcast signal, for those games that don’t require a paid subscription. That’s the most common situation when national teams are playing in Europe.
If it’s on a closed or paid channel (where a subscription is needed), then sometimes traffic increases as fewer viewers have access to the TV broadcast. For context, there’s a trend of channels offering games in their apps through streaming, not only for paid channels but also national broadcasters such as the British BBC. The opening England game in Euro 2024 on Sunday, June 16, 2024, had 15 million viewers on BBC One and was also streamed 3.5 million times on BBC iPlayer. This variety of viewing options from a single service appears to be a new trend in the digital age.
Football games associated with drops in traffic
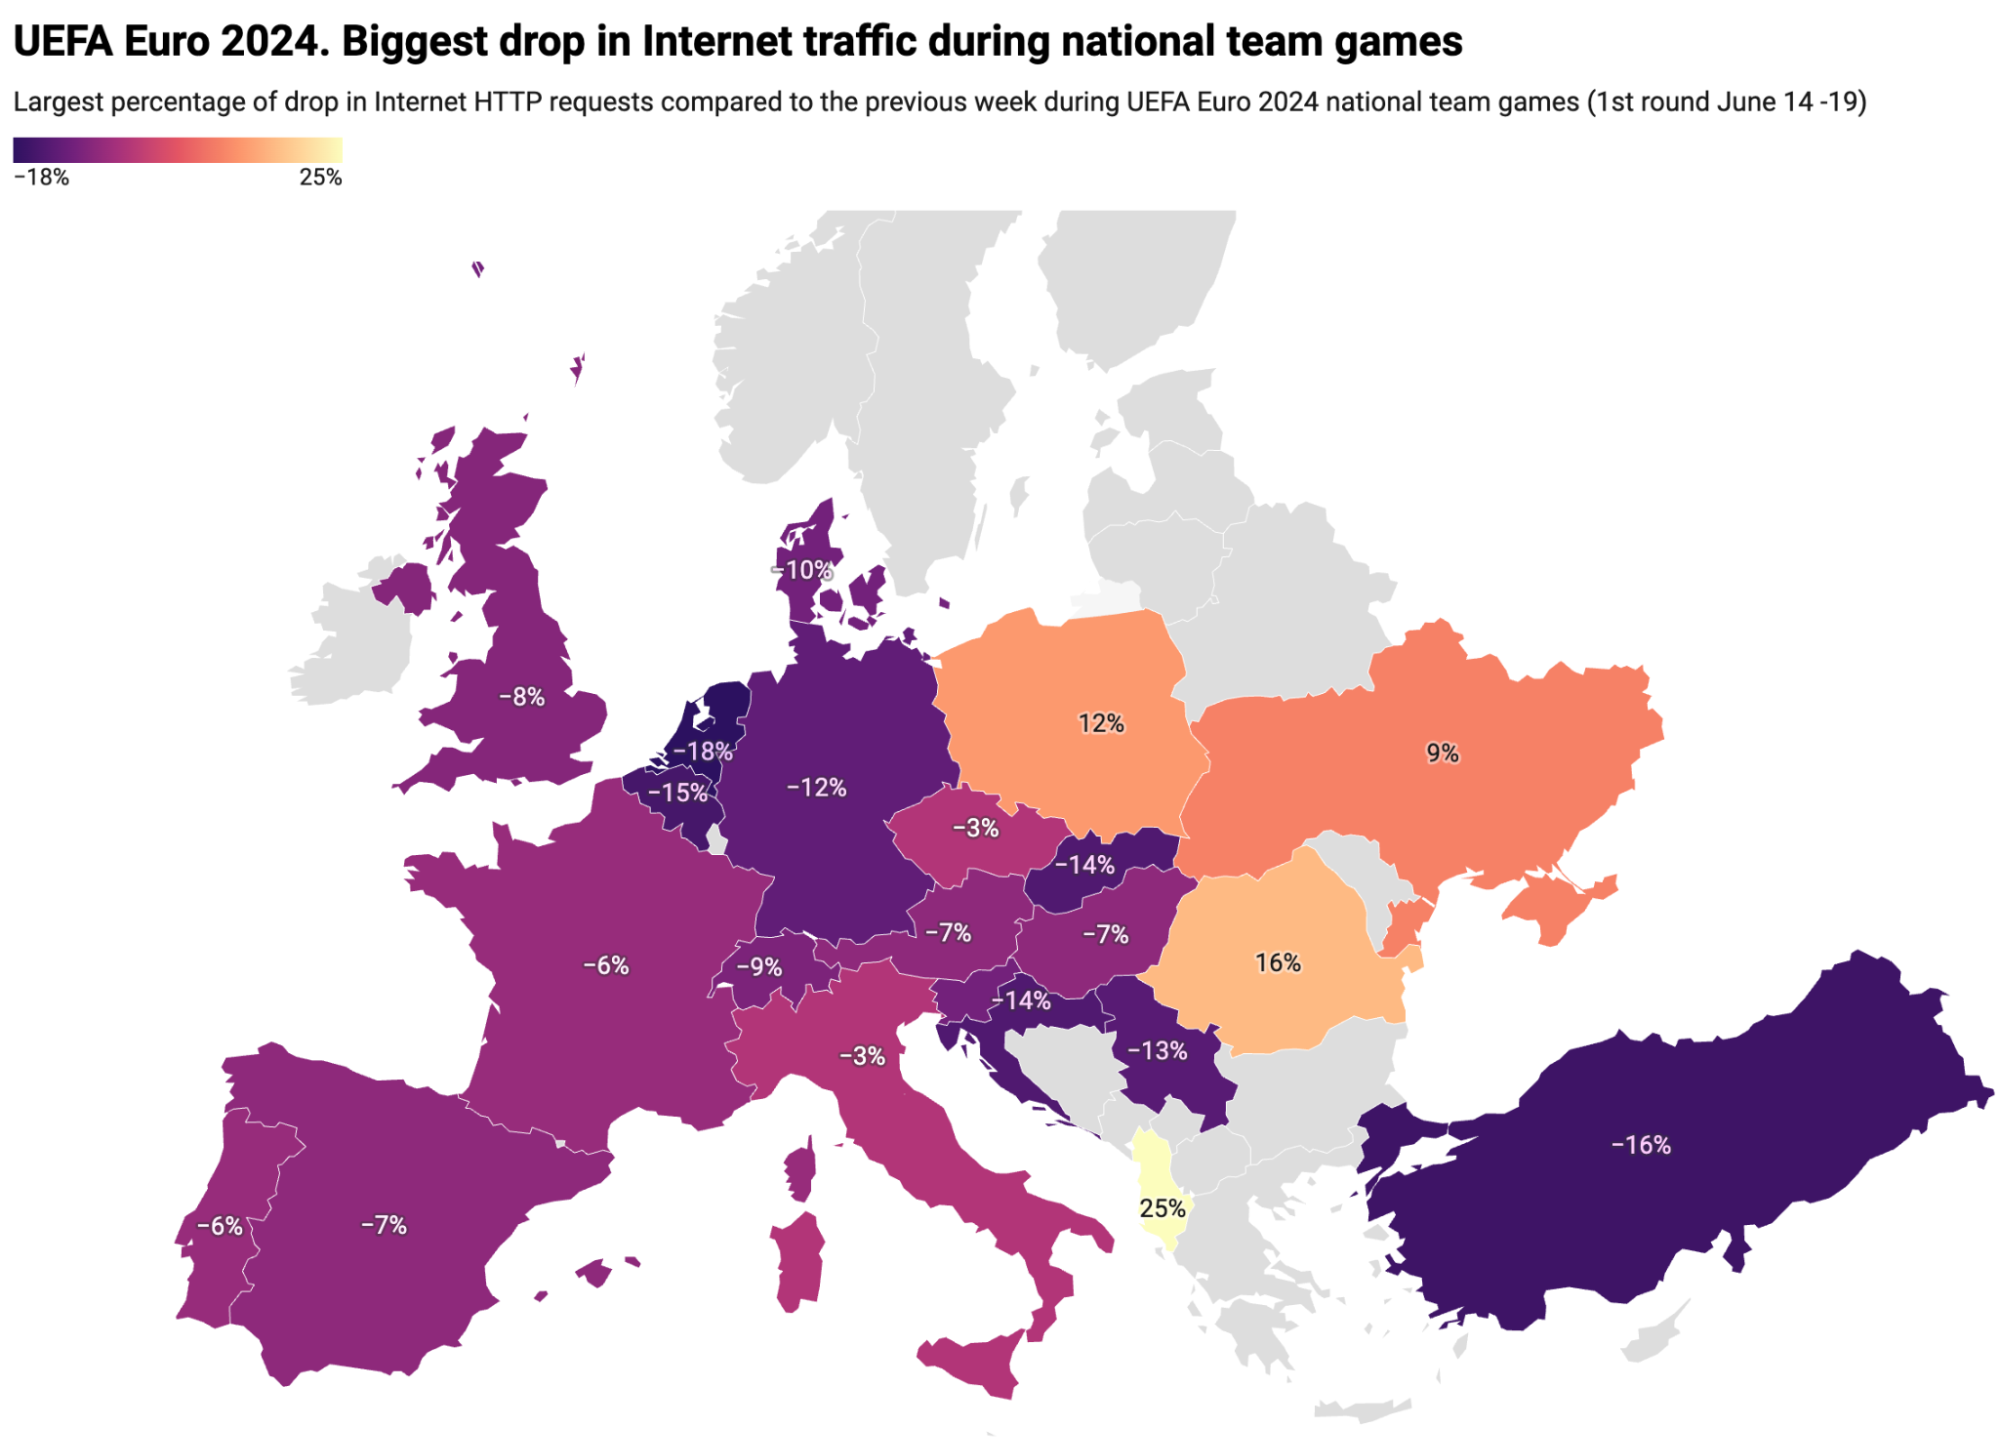
Now, for some game-related Internet trends: the Netherlands, Turkey, Belgium, Croatia, Slovakia, Serbia, and host Germany were the countries where their national team games had a significant impact on requests, with a drop of at least 12% compared to the previous week. Western Europe and countries around Germany top the list. The list shown in the map and the table below covers the first round of games among all teams in all six groups, which concluded on June 19, 2024.
Here is the full list, which provides more detail than the map above, showing each country and the percentage decrease (or increase) in traffic as compared to the previous week at the time those countries’ national team games were occurring.
Country
Increase/ decrease traffic
Game day/hour (UTC)
Opponent
Netherlands
-18%
June 16, 13:00
Poland
Turkey
-16%
June 18, 16:00
Georgia
Belgium
-15%
June 17, 16:00
Slovakia
Croatia
-14%
June 15, 16:00
Spain
Slovakia
-14%
June 17, 16:00
Belgium
Serbia
-13%
June 16, 19:00
England
Germany
-12%
June 14, 19:00
Scotland
Denmark
-10%
June 16, 16:00
Slovenia
Slovenia
-10%
June 16, 16:00
Denmark
Switzerland
-9%
June 15, 13:00
Hungary
England
-8%
June 16, 19:00
Serbia
Georgia
-8%
June 18, 16:00
Turkey
Austria
-7%
June 17, 19:00
France
Hungary
-7%
June 15, 13:00
Switzerland
Spain
-7%
June 15, 16:00
Croatia
France
-6%
June 17, 19:00
Austria
Scotland
-6%
June 14, 19:00
Germany
Portugal
-6%
June 18, 19:00
Czechia
Italy
-3%
June 15, 19:00
Albania
Czechia
-3%
June 18, 19:00
Portugal
Ukraine
9%
June 17, 13:00
Romania
Poland
12%
June 16, 13:00
Netherlands
Romania
16%
June 17, 13:00
Ukraine
Albania
25%
June 15, 19:00
Italy
Albania, Romania, Poland, Ukraine, and Slovenia were the only countries with an increase in HTTP requests during games. England (-8%) and Scotland (-6%) both have similar drops in requests during their national team games.
We’ve also noticed looking at our country-related HTTP data around games that social media services usually go up during half-time and before and after these national team games. As expected, traffic to websites in categories like AI chatbots, ecommerce (though some see increases during halftime), productivity tools, and business and financial services tends to decrease during Euro 2024 games.
First day of competition: Germany-Scotland
Another important perspective is focused on the first day of competition. On June 14, 2024, Euro 2024 kicked off in Germany. How was Internet traffic impacted in the country?
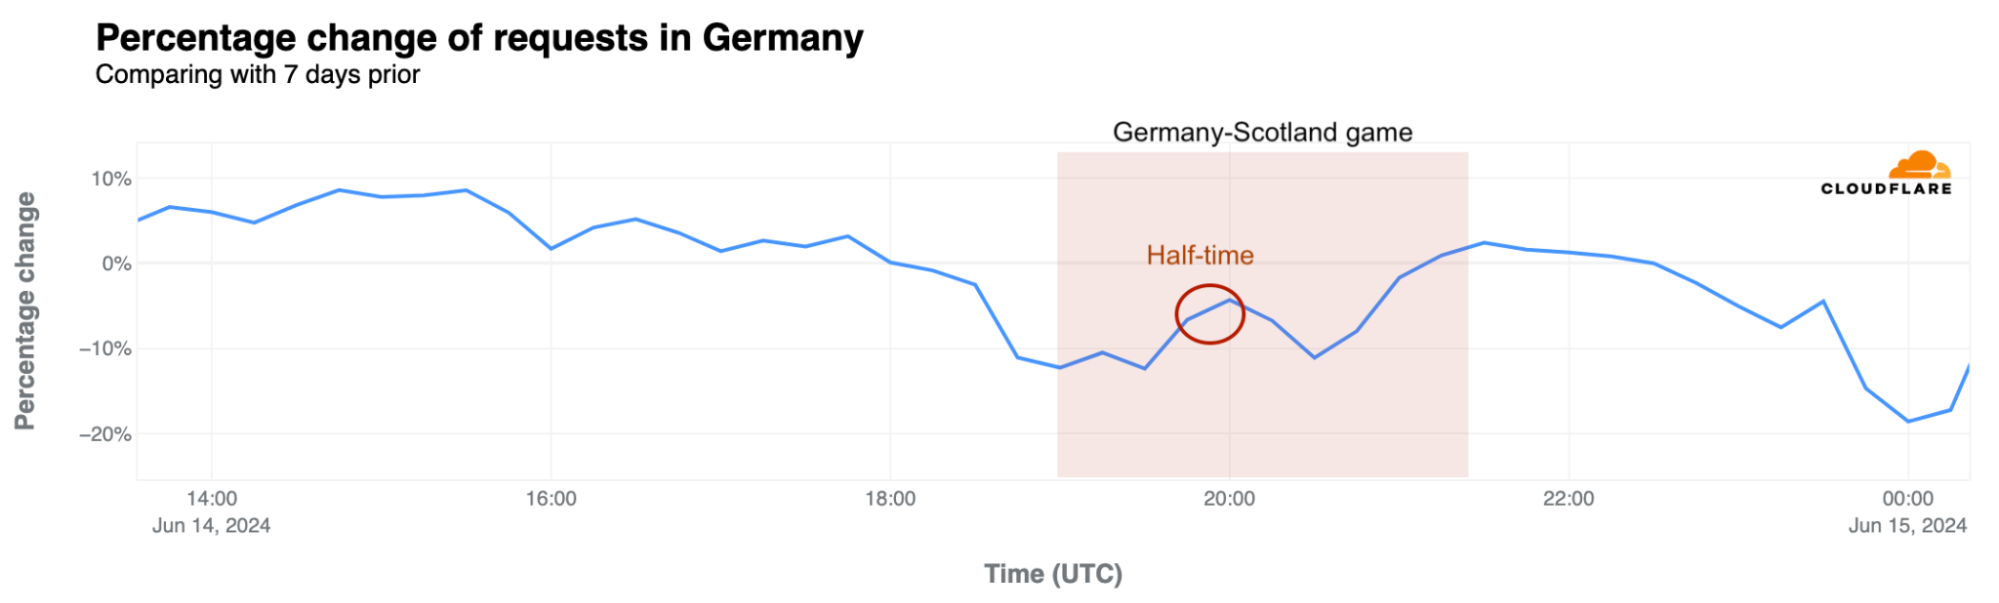
When the ceremony started around 18:45 UTC (20:45 local time), by as much as 11%, deepening to a 12% drop from the previous week when the first game between Germany and Scotland began at 19:00 UTC (21:00 local time). Traffic briefly recovered during halftime to only 4% below the previous week’s levels, but fell again to 11% below the prior week during the second half. At 00:00 UTC (02:00 local time), requests dropped as much as 19% from the previous week, in a night of celebration for German fans.
The second round of games in the Euro 2024 group phase is already underway. We’re keeping an eye on country-related trends after games on X.
An attacks perspective
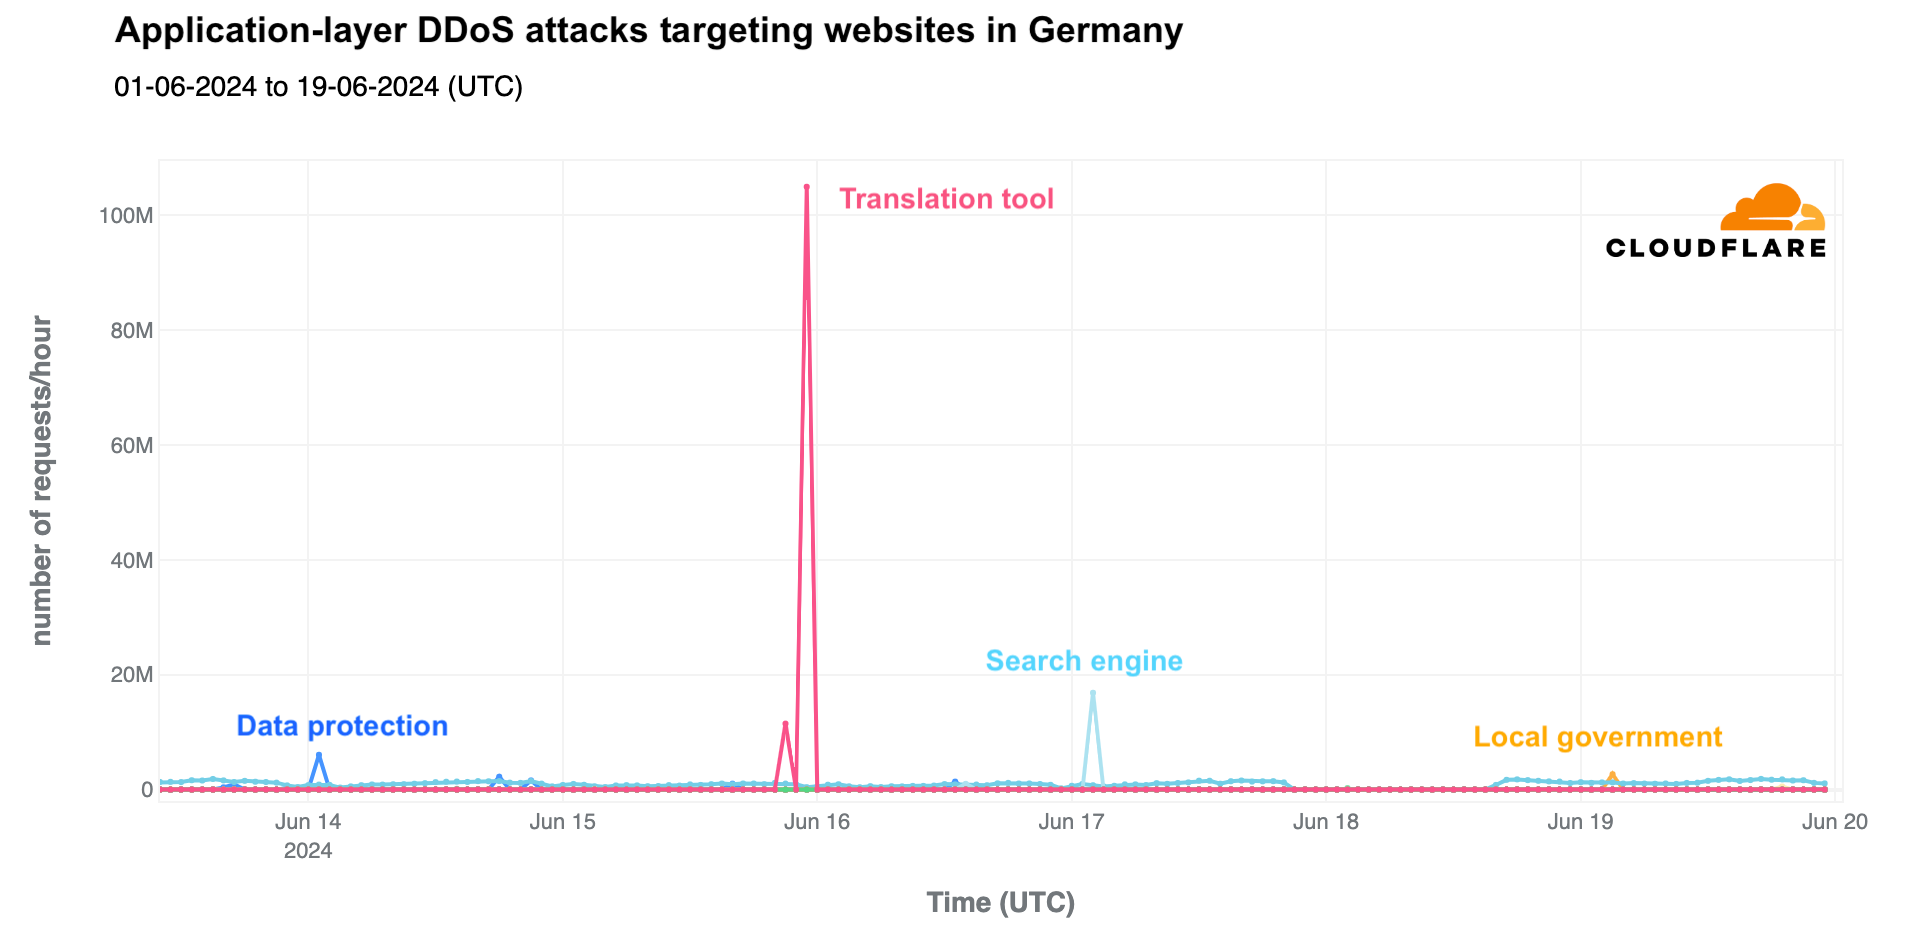
During the UEFA Euro 2024 event in Germany, we’ve observed several attacks in the country. These included application layer DDoS (Distributed Denial of Service) attacks targeting various websites, such as a translation tool, a data protection tool, a search engine, and a local government website. The most significant DDoS attack occurred on June 15, 2024, the day after the competition started, targeting the translation tool. This attack reached 105 million requests per hour at 23:00 UTC and lasted about two hours with two distinct spikes.
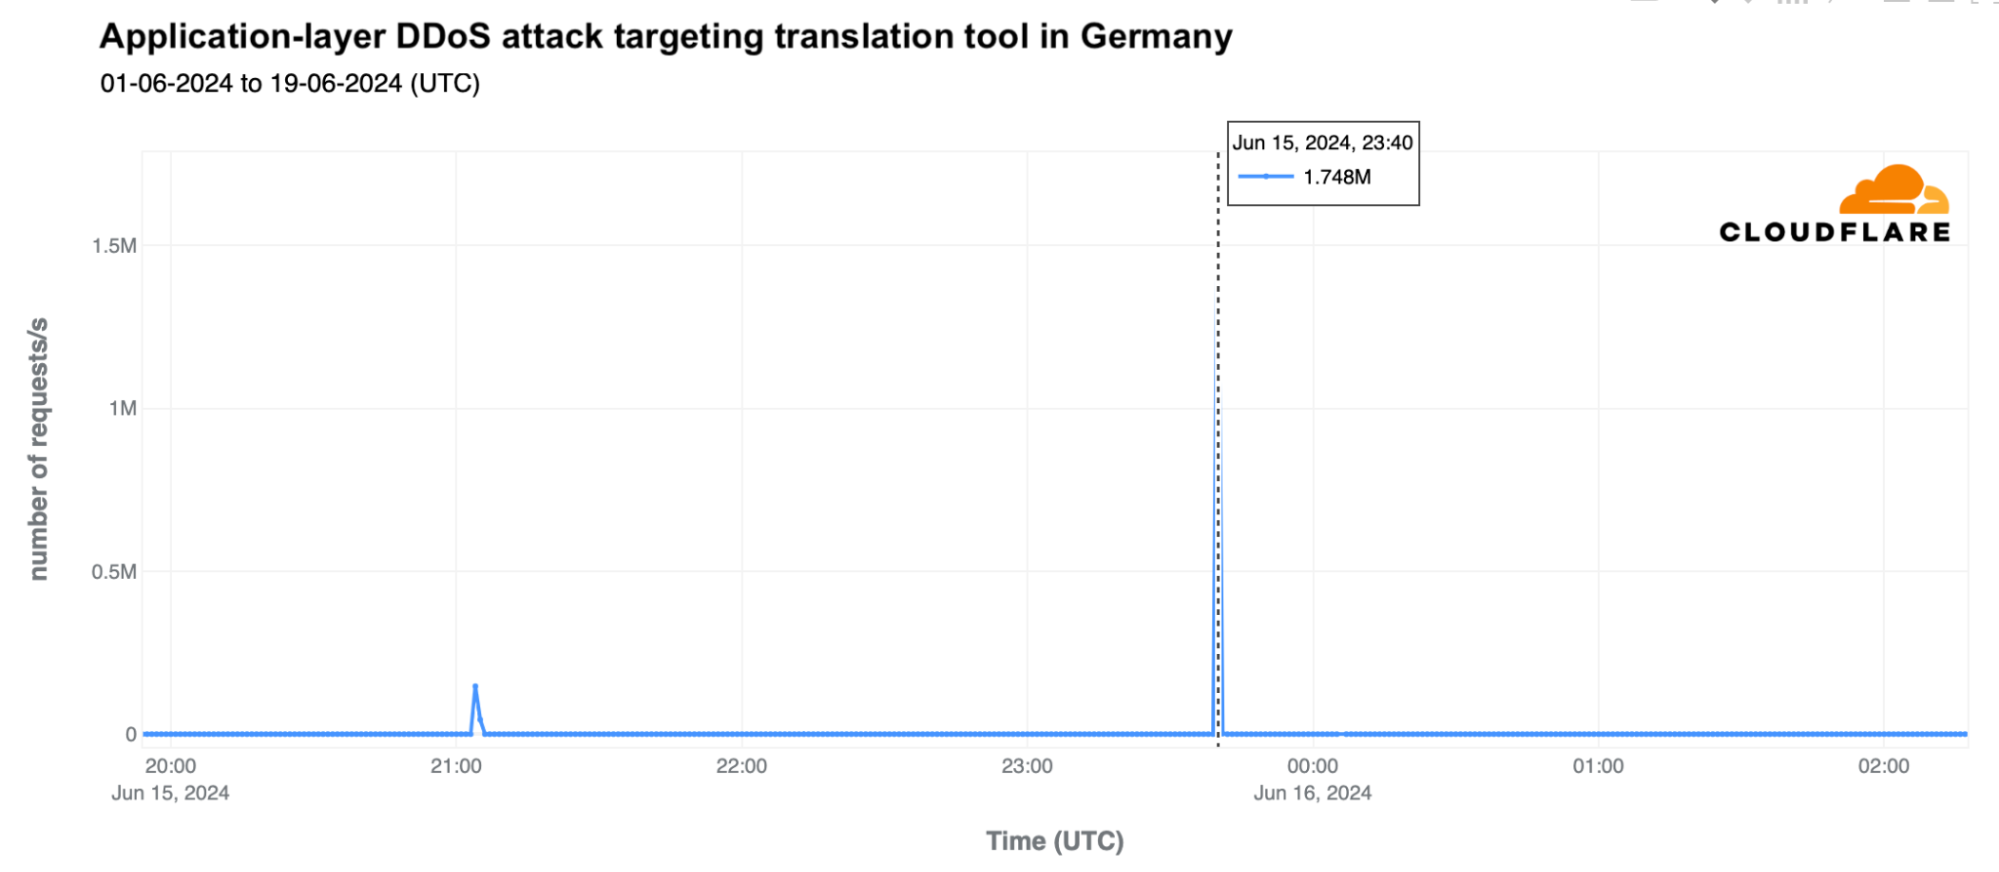
Looking more closely at the attack on the translation tool, it peaked at 1.74 million requests per second (rps) at 23:40 UTC, following an initial spike of 147,000 rps at 21:04 UTC.
Conclusion
Football is incredibly important to Europeans, enough to cause nationwide Internet traffic to drop when fans are rooting for their national teams in a UEFA Euro 2024 game broadcast on national TV.
Despite the popularity of online services like live score apps, sports news sites that track every minute of each game, and betting services enhanced with new visual tools and stats, national team football (or soccer) still significantly diverts attention away from the Internet.
We will continue to monitor UEFA Euro 2024 Internet trends. Based on the results of a poll we conducted on X, we plan to publish daily updates about games and their impact on countries whose national teams are playing that day. Follow us there.
The practice of cheating on exams (or at least attempting to) is presumably as old as the concept of exams itself, especially when the results of the exam can have significant consequences for one’s academic future or career. As access to the Internet became more ubiquitous with the growth of mobile connectivity, and communication easier with an assortment of social media and messaging apps, a new avenue for cheating on exams emerged, potentially facilitating the sharing of test materials or answers. Over the last decade, some governments have reacted to this perceived risk by taking aggressive action to prevent cheating, ranging from targeted DNS-based blocking/filtering to multi-hour nationwide shutdowns across multi-week exam periods.
Syria and Iraq are well-known practitioners of the latter approach, and we have covered past exam-related Internet shutdowns in Syria (2021, 2022, 2023) and Iraq (2022, 2023) here on the Cloudflare blog. It is now mid-June 2024, and exams in both countries took place over the last several weeks, and with those exams, regular nationwide Internet shutdowns. In addition, Baccalaureate exams also took place in Algeria, and we have written about related Internet disruptions there in the past (2022, 2023). However, in contrast to the single daily shutdowns in Syria and Iraq, the Algerian government opted instead for two multi-hour disruptions each day – one in the morning, one in the afternoon – and appears to be pursuing a content blocking strategy, rather than a full nationwide shutdown.
As we have done in past year’s posts, we will examine the impact that these shutdowns have on Internet traffic, but also analyze routing information and traffic from other Cloudflare services in an effort to better understand how these shutdowns are being implemented.
Syria
The Syrian Telecom Company, to their credit, publishes an exam schedule on social media, with the image below published to their Facebook page. The English version was created by applying Google Translate to the image. The schedule shows the date & time of each Internet shutdown (“disconnection”), in addition to the subject(s) of that day’s exam(s). In 2024, exams started on May 26, and went through June 13.
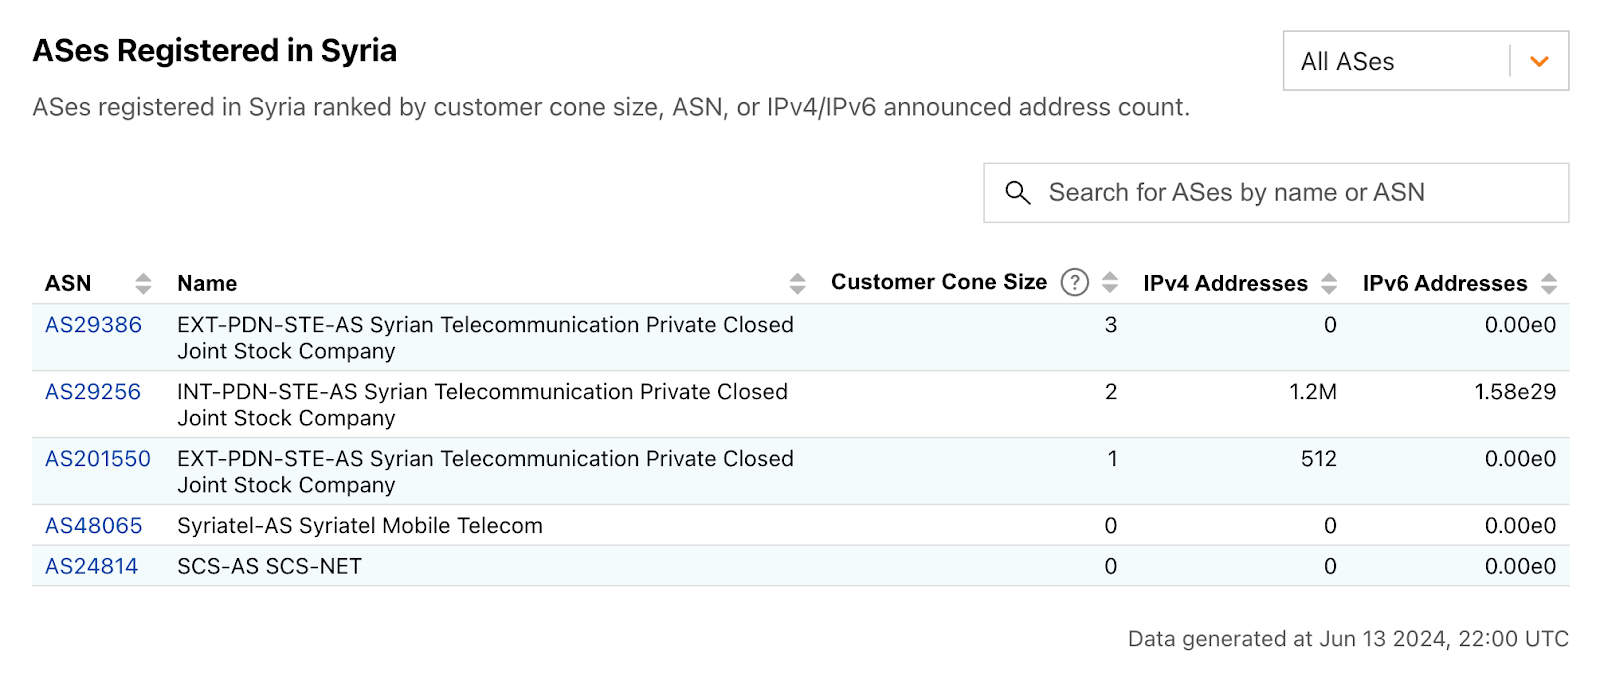
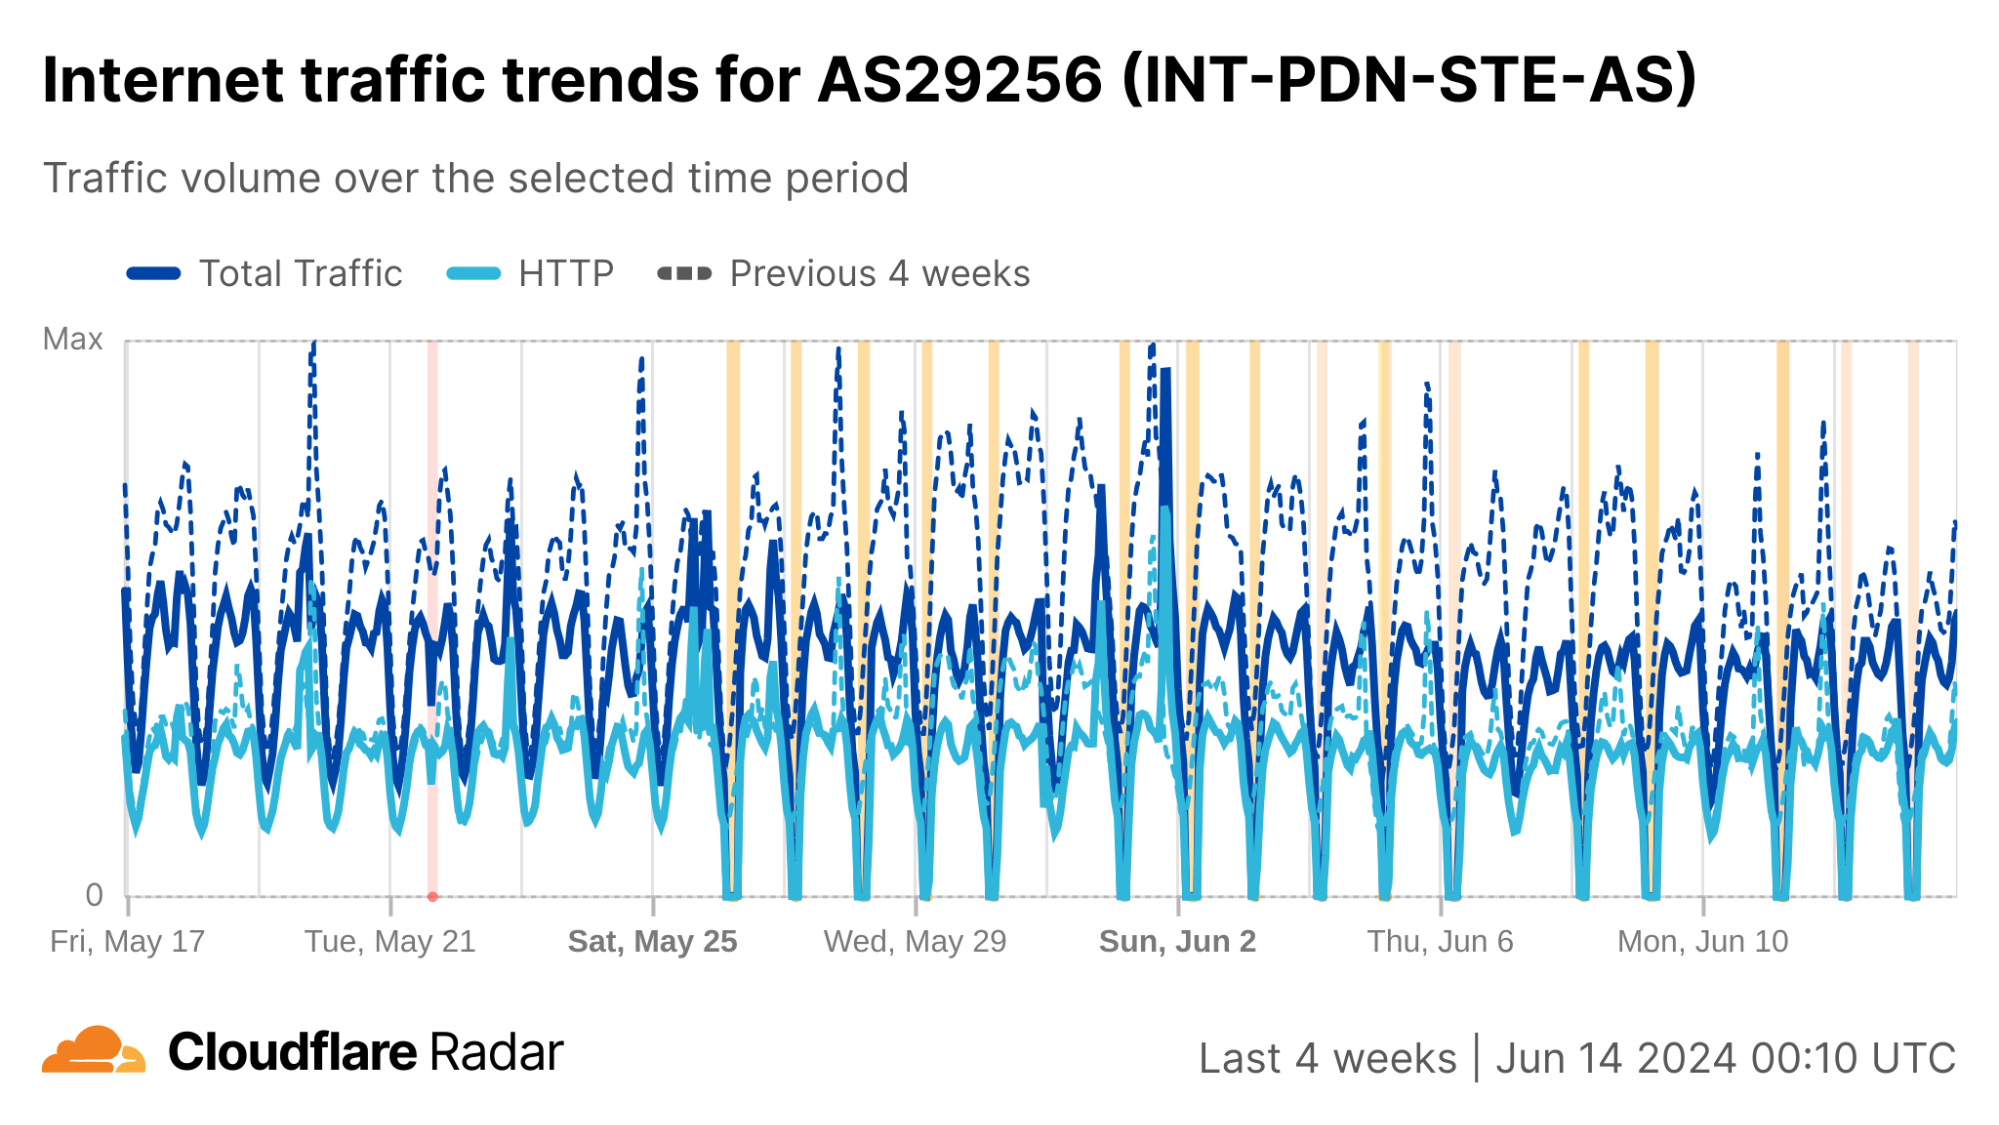
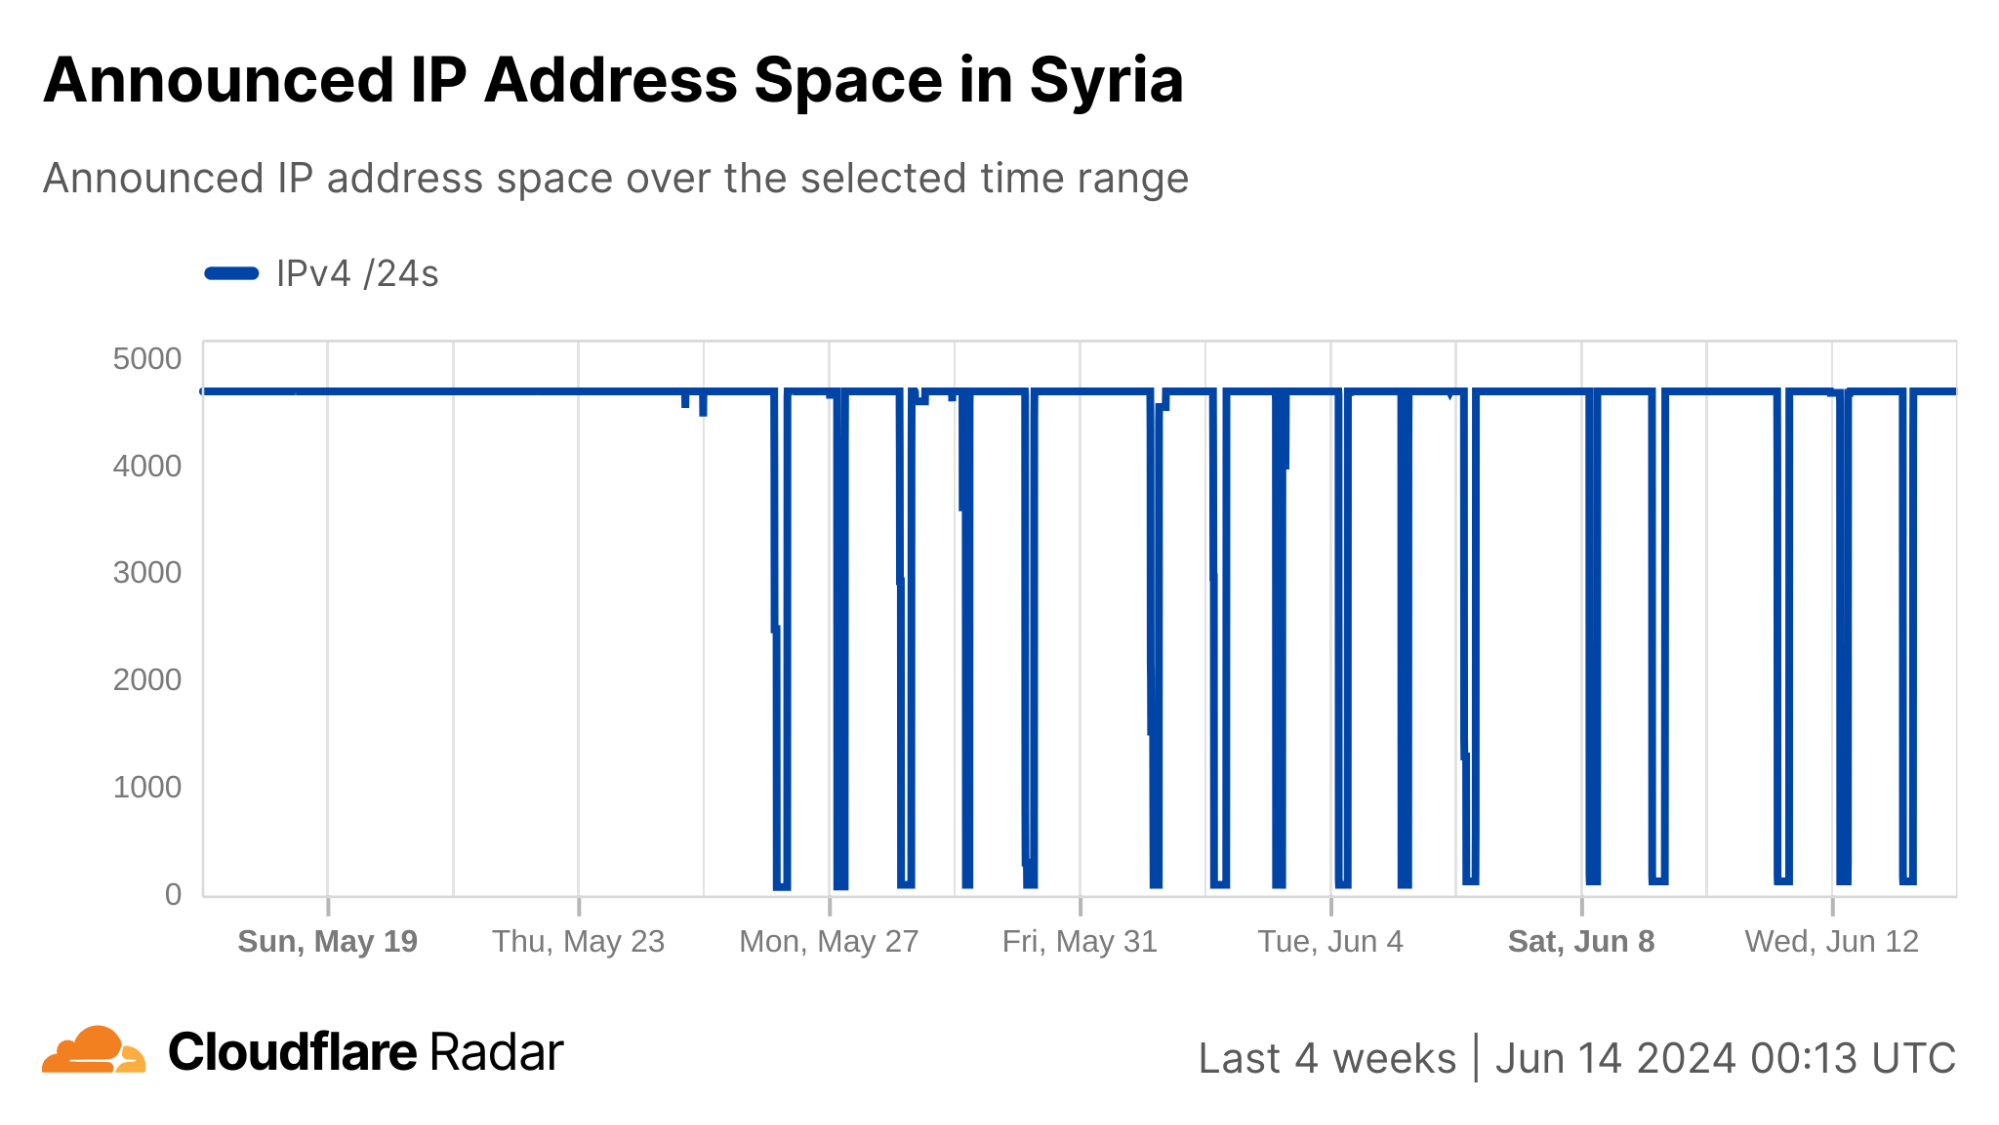
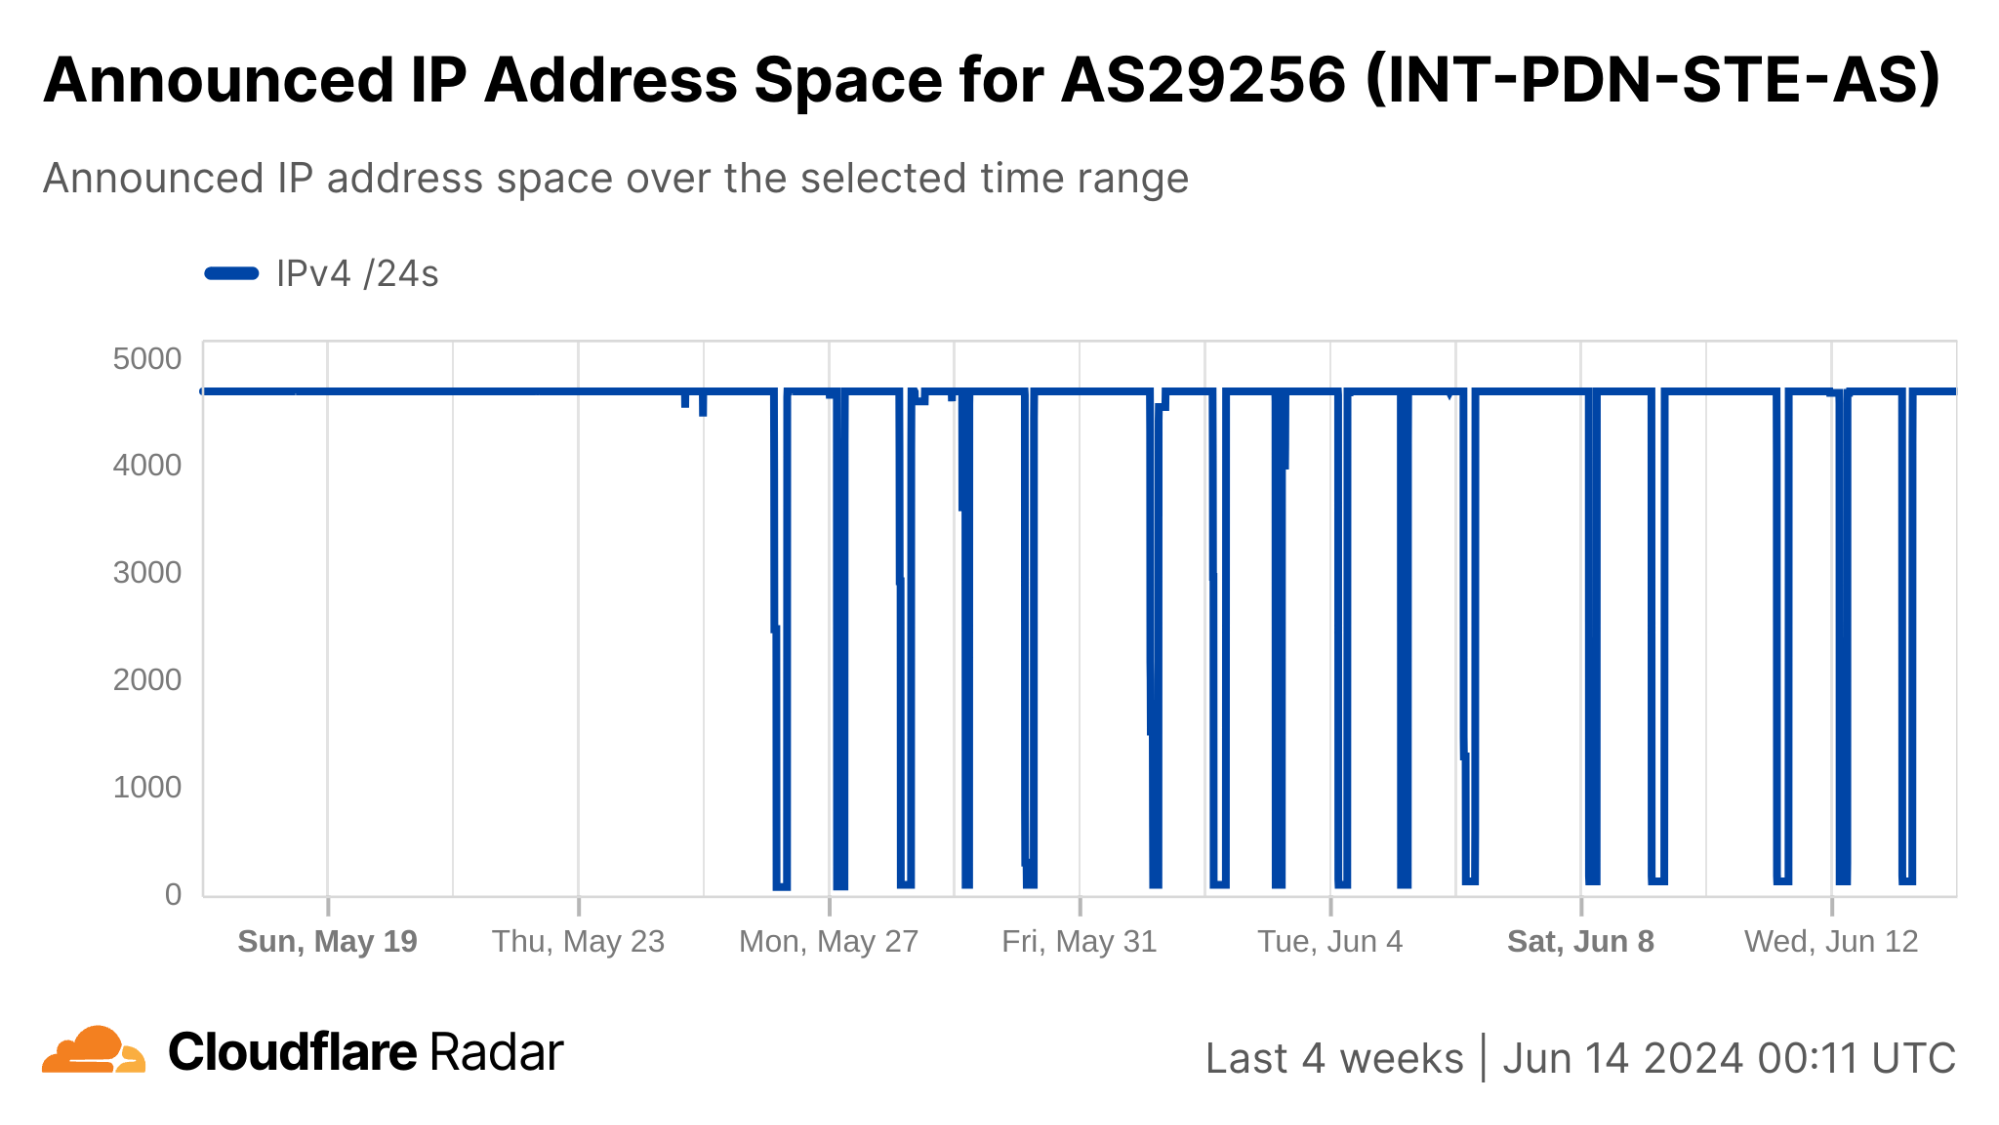
In Syria, AS29256 (Syrian Telecom) is effectively the Internet, as shown in the table below. While there are a few other autonomous systems (ASNs/ASes) registered in Syria, there are only two that currently announce IP address space to the public Internet. As such, the trends seen at a country level for Syria reflect those seen for AS29256, and this is clearly evident in the traffic graphs below.
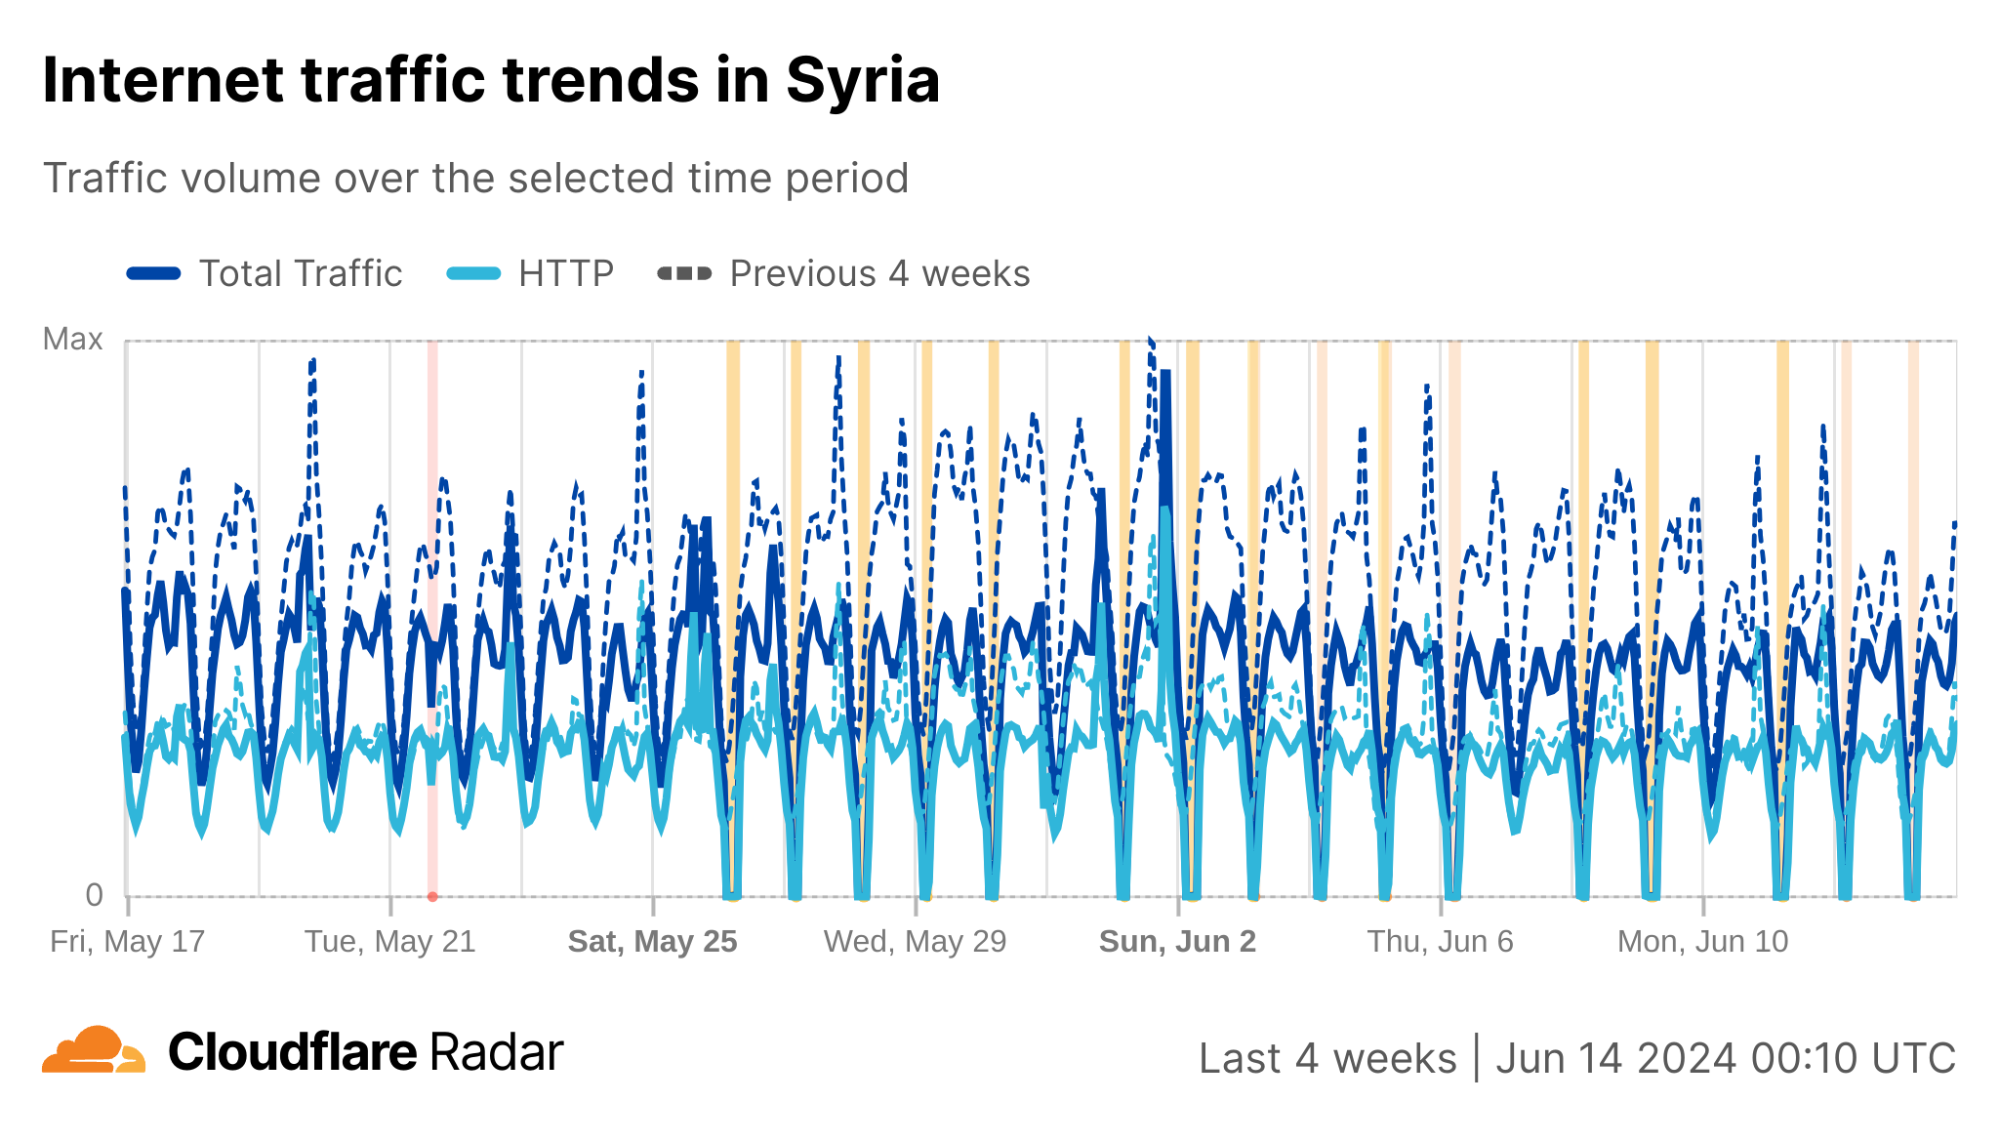
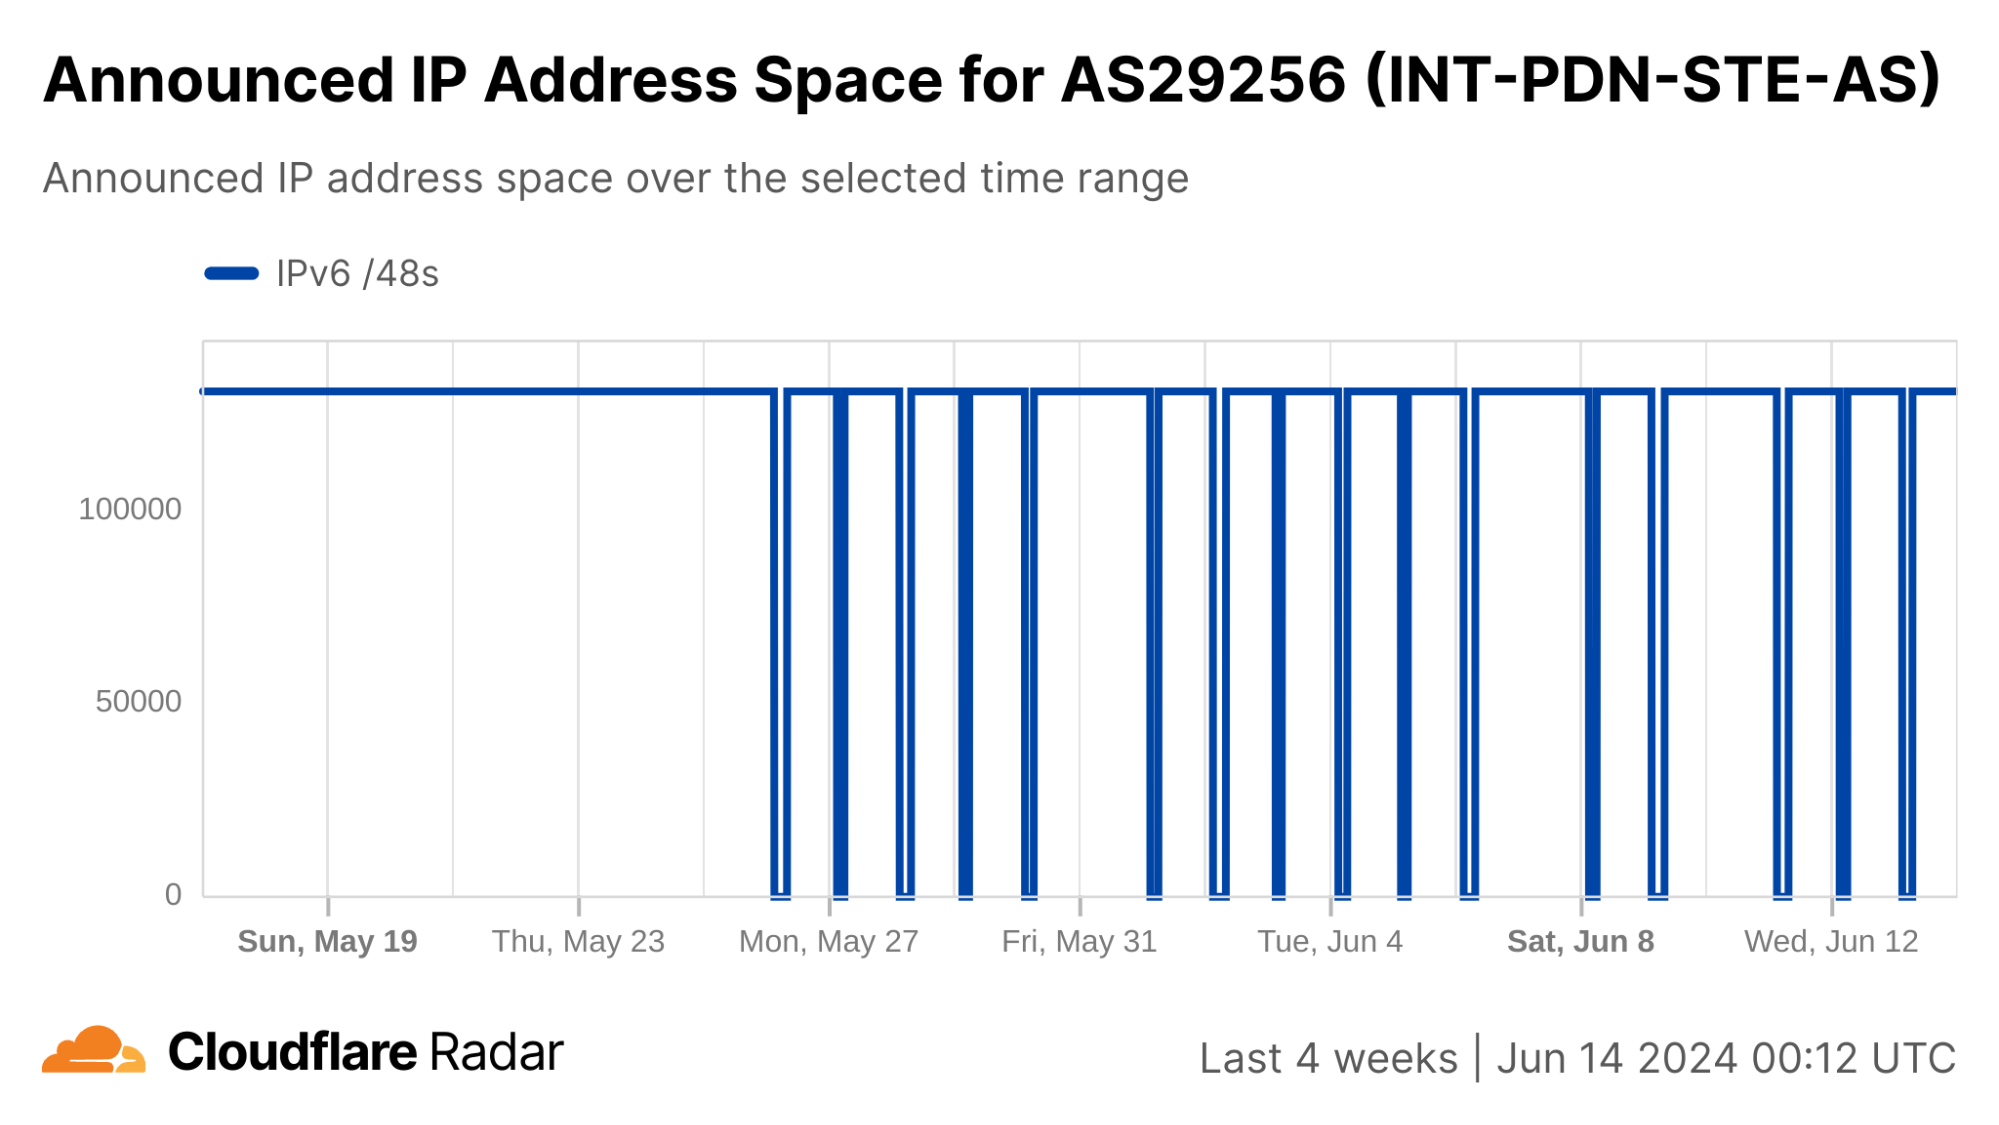
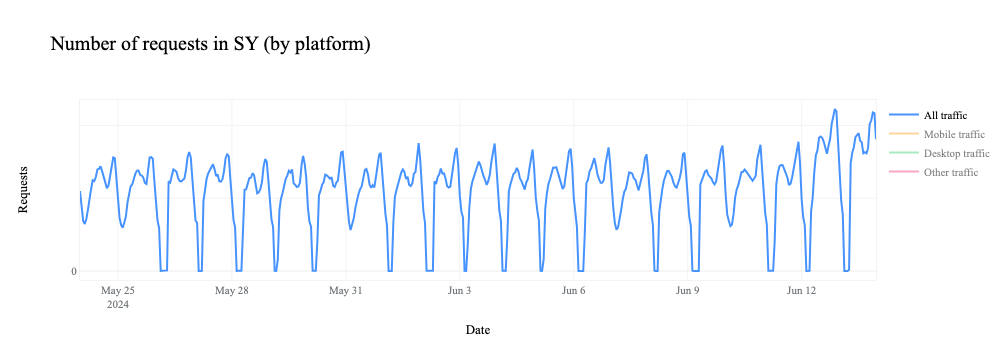
Nationwide Internet shutdowns in Syria began on May 26, taking place for varying multi-hour periods from Sunday to Thursday for three consecutive weeks. The graphs below show Internet traffic from the country, as well as AS29256, dropping to zero during the scheduled shutdowns.
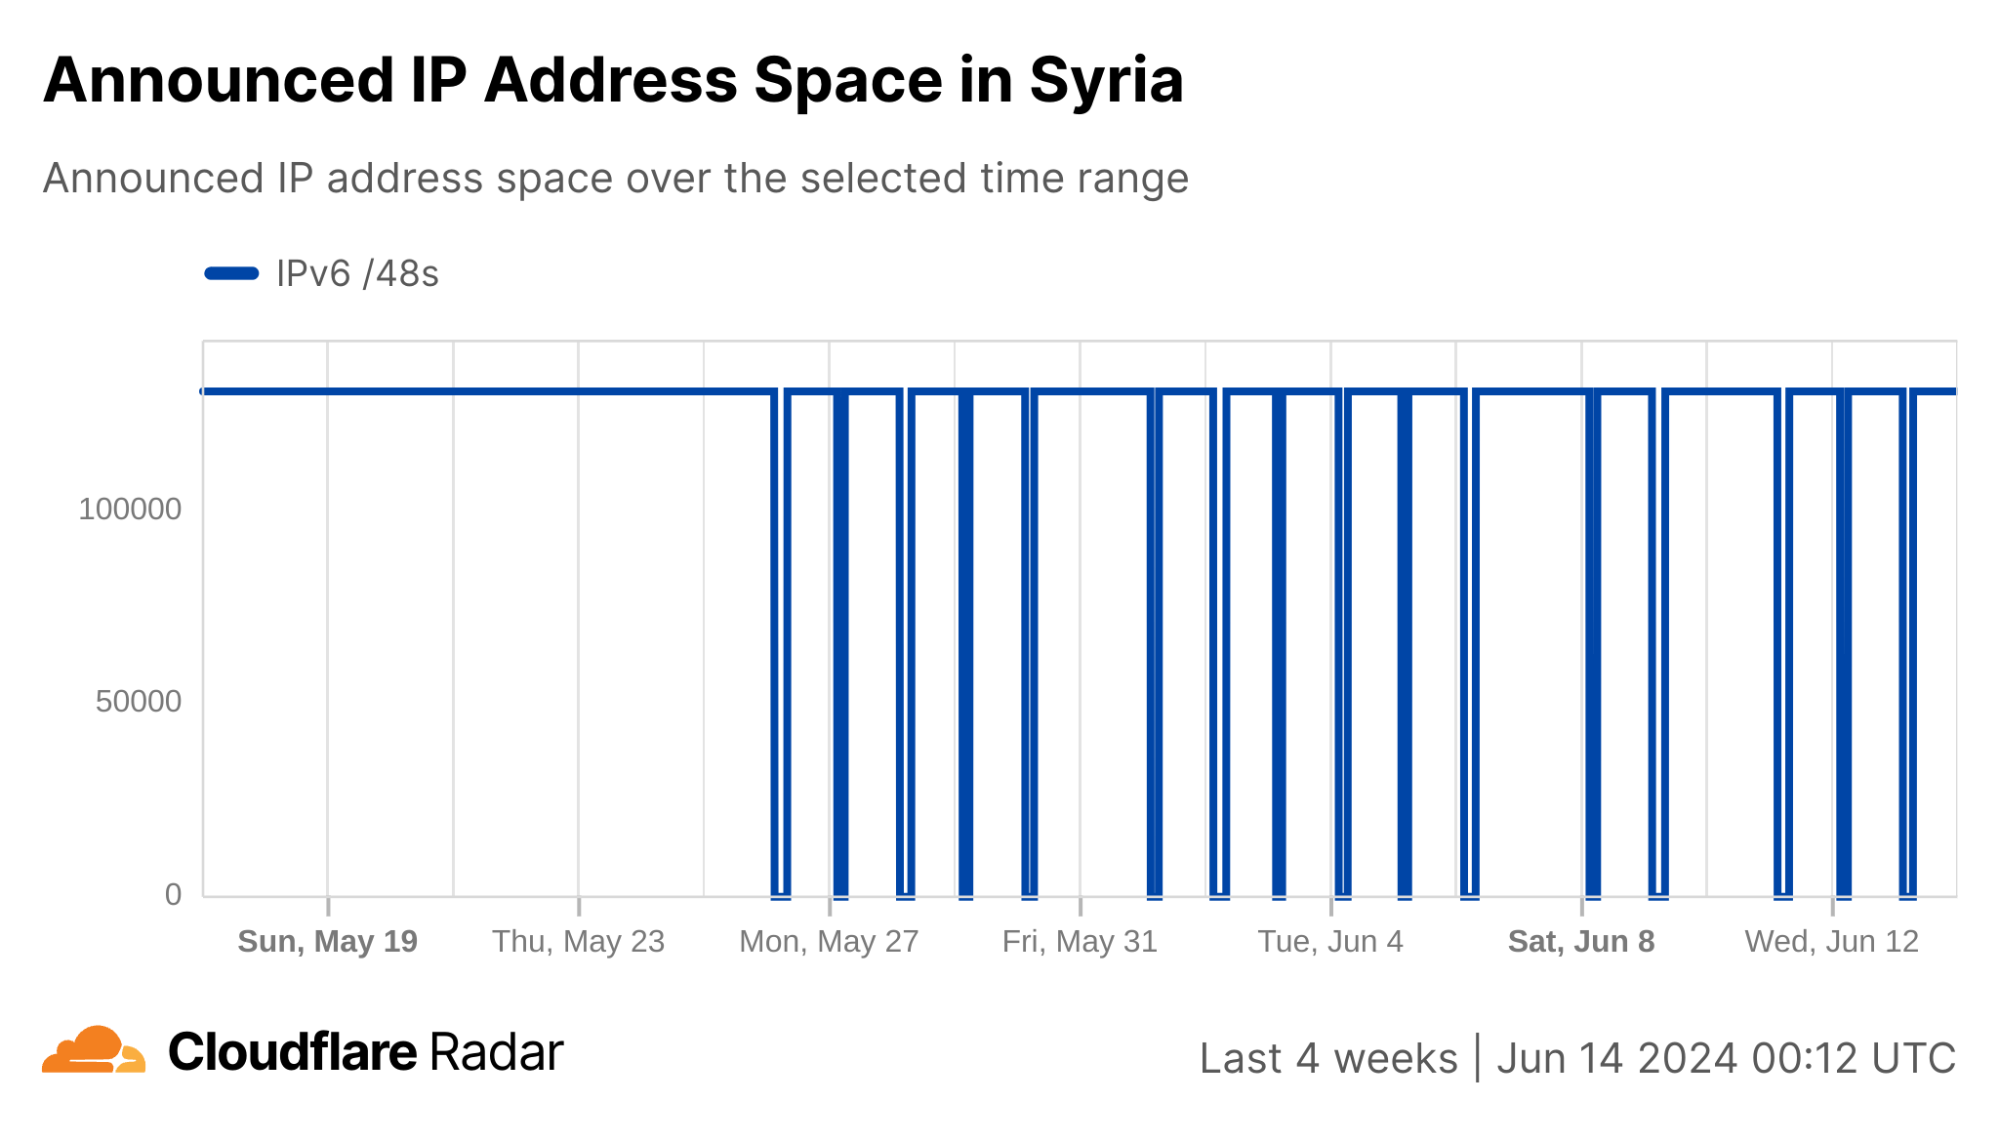
In addition, graphs from the Cloudflare Radar Routing pages for Syria and AS29256 show the number of IPv4 and IPv6 prefixes being announced country-wide and by AS29256 dropping to at or near zero during each shutdown. This ultimately means that there is no Internet path back to systems (IP addresses) connected to Syrian Telecom. Below, we explore why this is important and problematic.
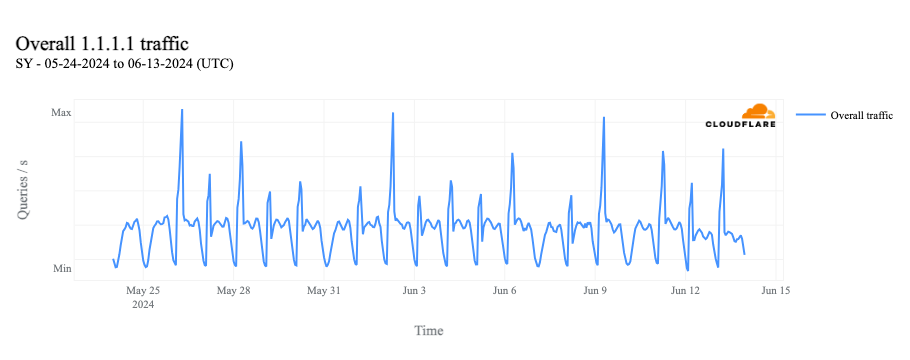
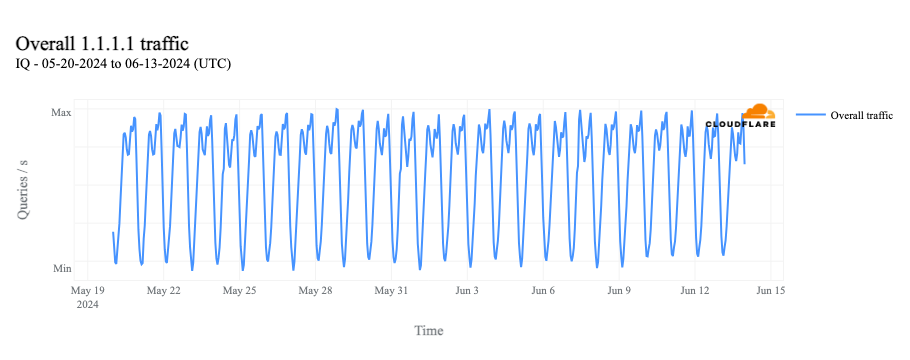
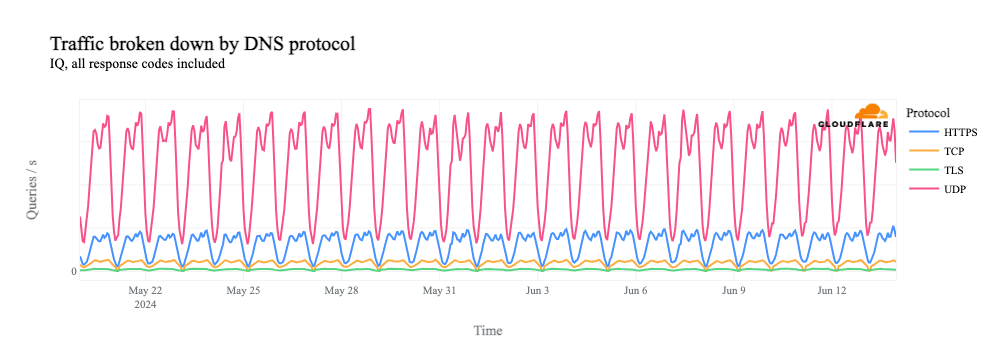
As has been observed in the past, the shutdowns in Syria are asymmetrical. That is, traffic can exit the country (via AS29256), but there are no paths for responses to return. The impact of this approach is clearly evident in traffic to Cloudflare’s 1.1.1.1 DNS Resolver. We continue to see traffic to the resolver when the shutdowns take place, and in fact, we see the traffic spike during the shutdowns, as the graph below shows.
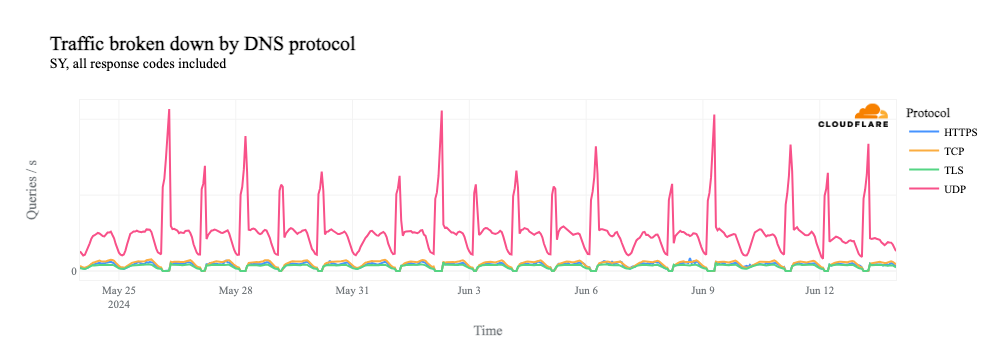
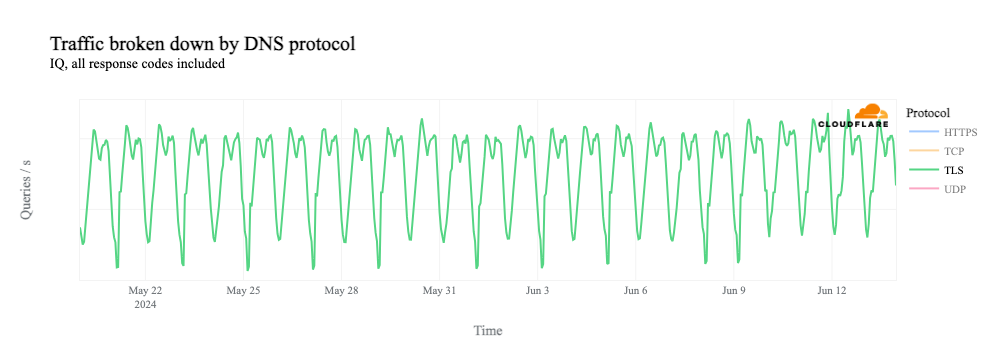
If we dig into traffic to 1.1.1.1 by protocol, we can see that it is driven by requests over UDP port 53, the standard port used for DNS requests over UDP and TCP. (Given the request pattern, that also appears to be the primary way that we see traffic to the resolver from Syria.)
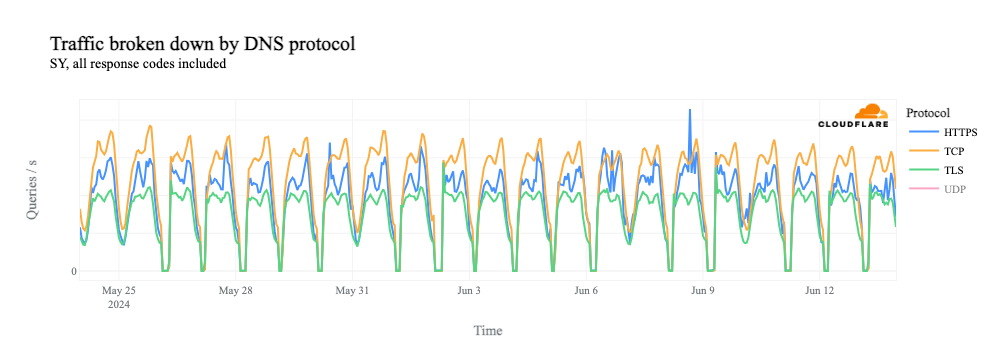
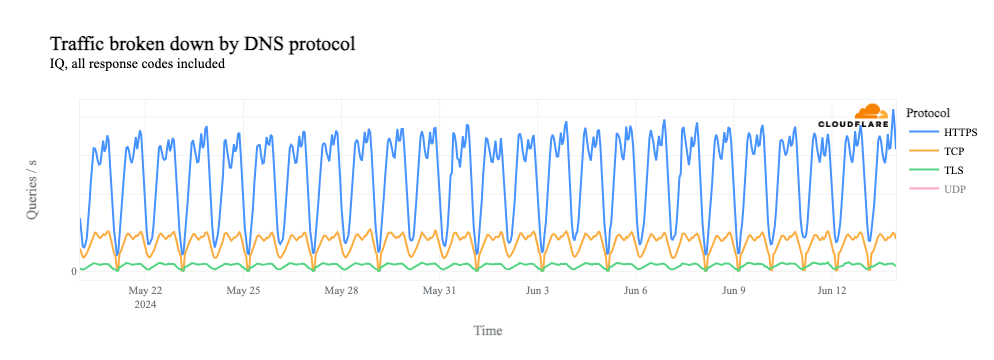
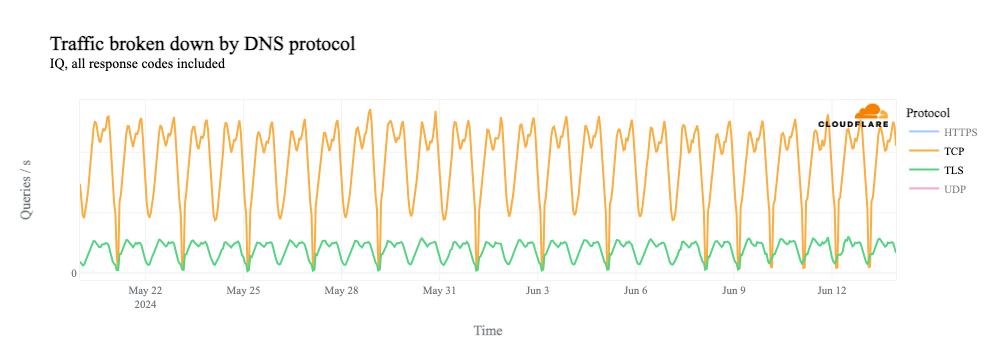
If we remove the UDP line from the graph, we see that request volume for DNS over TCP port 53, as well as DNS over HTTPS (DoH) and DNS over TLS (DoT), all drops to zero during the shutdowns.
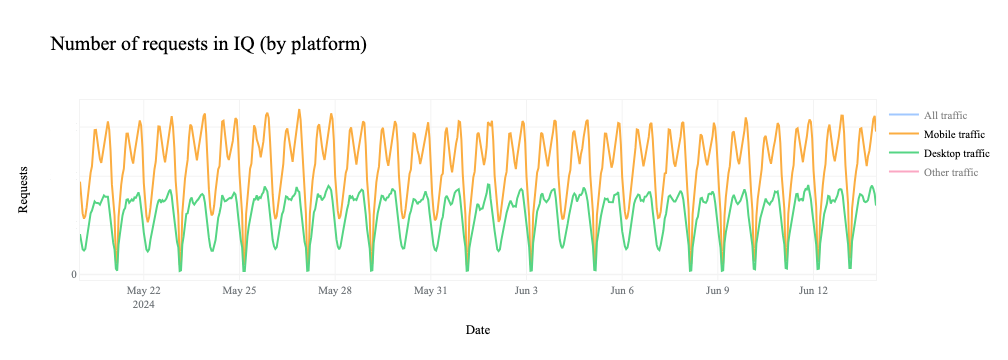
Similarly, we can clearly see the shutdowns in HTTP(S) request-based traffic graphs as well, since HTTP(S) is also a TCP-based protocol.
Why do we see this impact? With DNS over UDP, the client simply makes a request to the resolver – no multi-step handshake is involved, as with TCP. So in this case, 1.1.1.1 is receiving these requests, but as shown above, there’s no path for the response to reach the client. Because it hasn’t received a response, the client retries the request, and this flood of retries is manifested as the spike seen in the graphs above.
However, as we see above, request volume for DNS over TCP, as well as DoH, DoT, and HTTP(S) (which all use TCP), falls to zero during the shutdowns. The lack of a path back to the client means that the TCP 3-way handshake can’t complete, and thus we don’t see DNS requests over these protocols.
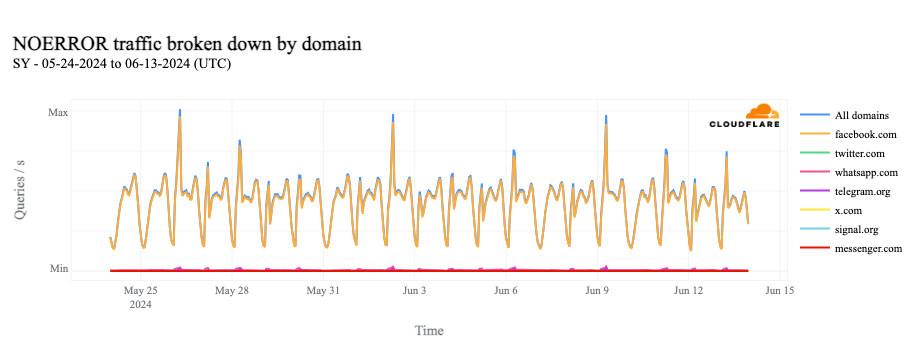
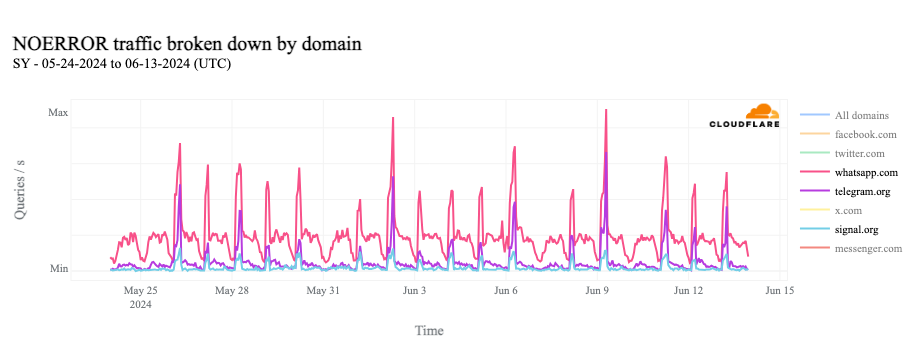
In looking at 1.1.1.1 Resolver request volume from Syria for popular social media and messaging applications, we can see traffic for facebook.com most closely matches the spikes shown above. Removing facebook.com from the graph, we can also see similar, though more limited, increases for domains used by popular messaging applications WhatsApp, Signal, and Telegram. Facebook and WhatsApp are reportedly the most popular social media and messaging applications in Syria.
Although we have focused on the analysis of traffic to Cloudflare’s DNS resolver, and the patterns seen within that traffic, it is also worth highlighting an interesting pattern observed in traffic to Cloudflare’s Authoritative DNS platform. (DNS resolvers act as a middleman between clients, such as a laptop or phone, and an authoritative DNS server. Authoritative DNS servers contain information specific to the domain names they serve, including IP addresses and other types of records.)
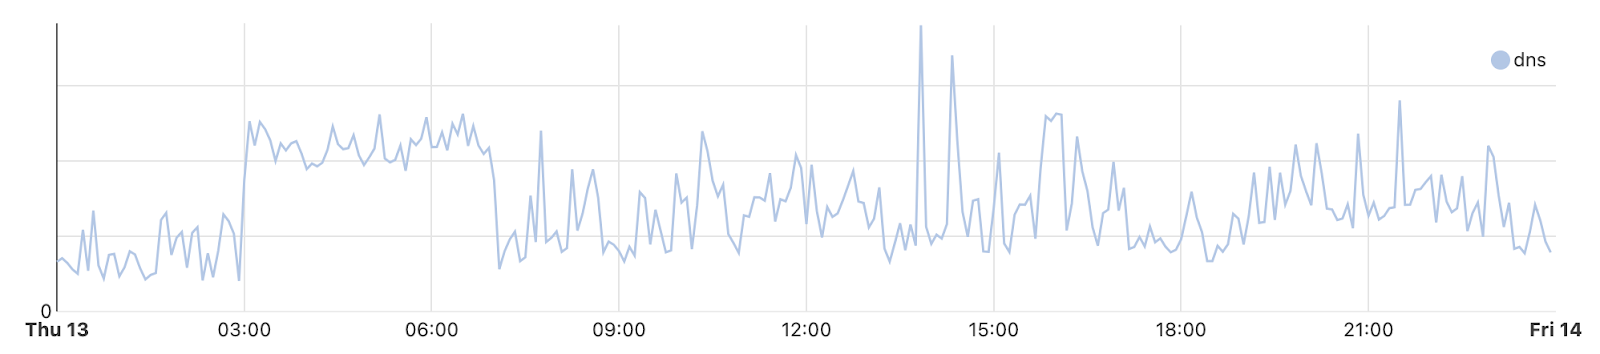
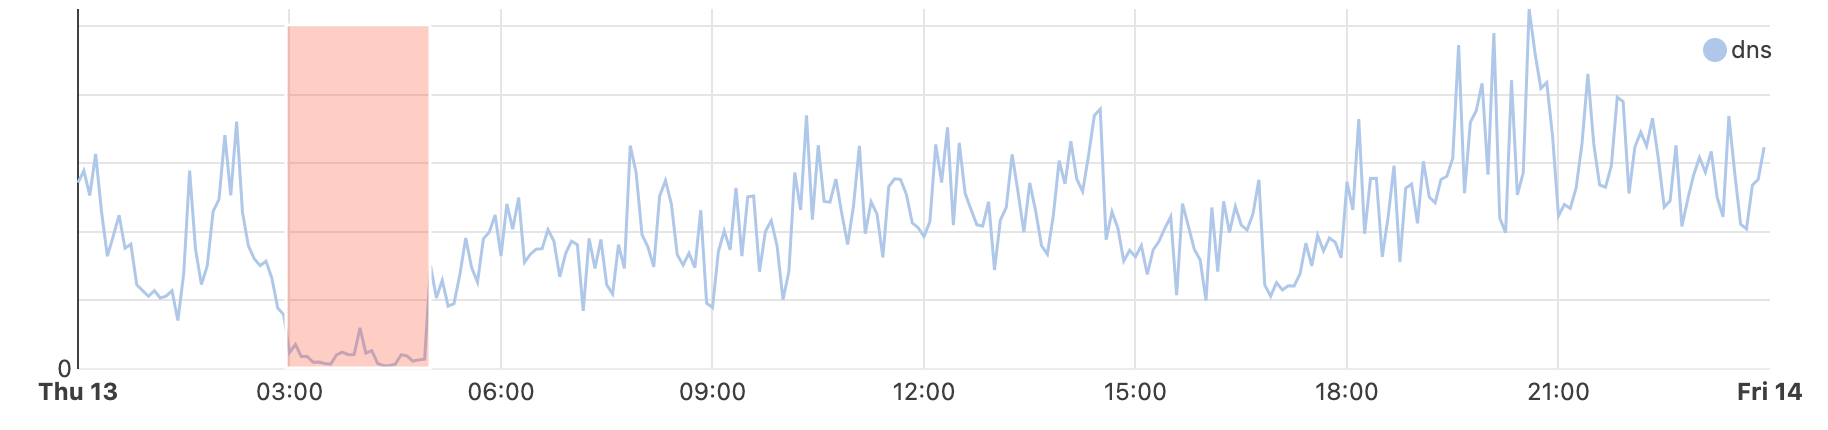
The graph below shows bits/second traffic from Syria for Cloudflare’s authoritative DNS service on June 13. (Similar patterns were observed during the other days when shutdowns occurred, but data volume limits the ability to create a graph showing an extended period of time.) In this graph, we can see that at the start of the shutdown (03:00 UTC), traffic rises sharply, effectively plateaus for the duration of the shutdown, and then returns to normal levels. We believe that the traffic pattern illustrated here could be the result of some local resolvers in Syria having the IP addresses for our authoritative DNS servers cached, and are making requests to them. The increased traffic level could be because they are retrying their queries after not receiving responses, but in a less aggressive fashion than the client applications driving the resolver traffic spikes shown above.
In summary, Syria appears to be implementing their Internet shutdowns not through filtering, but rather by simply not announcing their IP address space for the duration of the shutdown, thereby preventing any responses from returning to the originating requestor, whether client application, web browser, or local DNS resolver.
Iraq
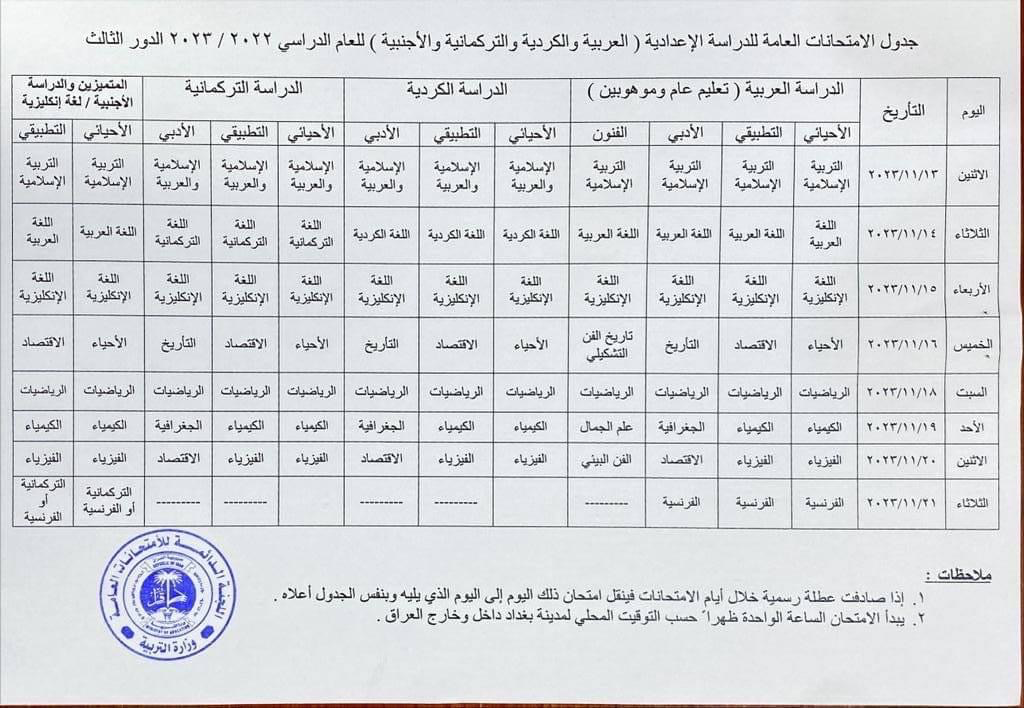
On May 19, the Iraqi Ministry of Communication posted an update that stated (translated) “The Ministry of Communications would like to note that the Internet service will be cut off for two hours during the general exams for intermediate studies, from six in the morning until eight in the morning, based on higher directives and at the request of the Ministry of Education.” The post came nearly a year after the Iraqi Ministry of Communication refused a request from the Ministry of Education to shut down the Internet during the baccalaureate exams as part of efforts to prevent cheating. On May 20, the Iraqi Ministry of Education posted the schedule for the upcoming set of exams to its Facebook page.
Iraq has a much richer network service provider environment than Syria does, with over 150autonomous systems (ASNs) registered in the country and announcing IP address space, compared to just two ASNs (both Syrian Telecom) in Syria announcing IP address space. Although traffic in Iraq is generally concentrated among the larger providers, shutdowns are rarely “complete” at a country level because not every autonomous system (network provider) in the country implements a shutdown. (This is due in part to the autonomous Kurdistan region in the north, which often implements similar shutdowns on their own schedule. Network providers in this region are included in Iraq’s country-level graphs.)
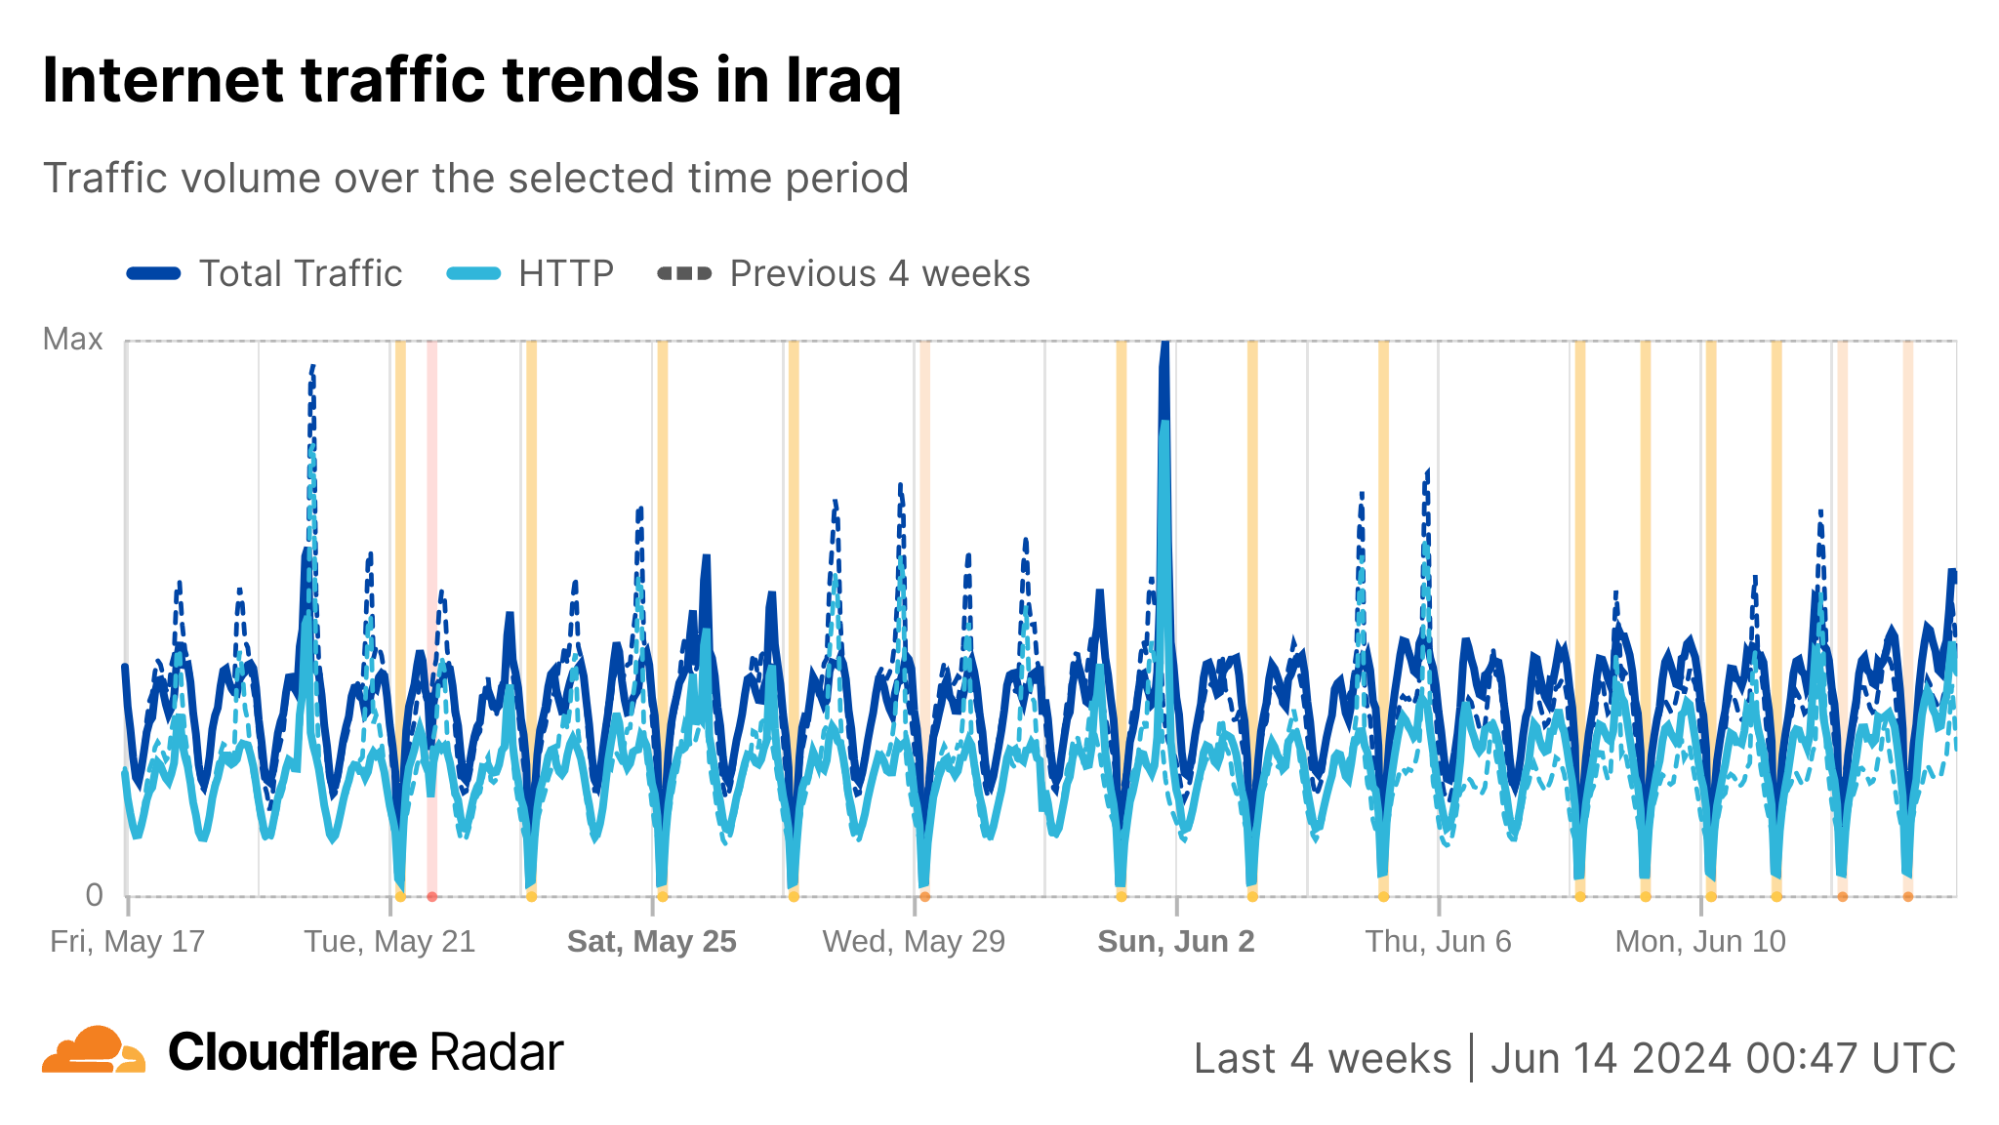
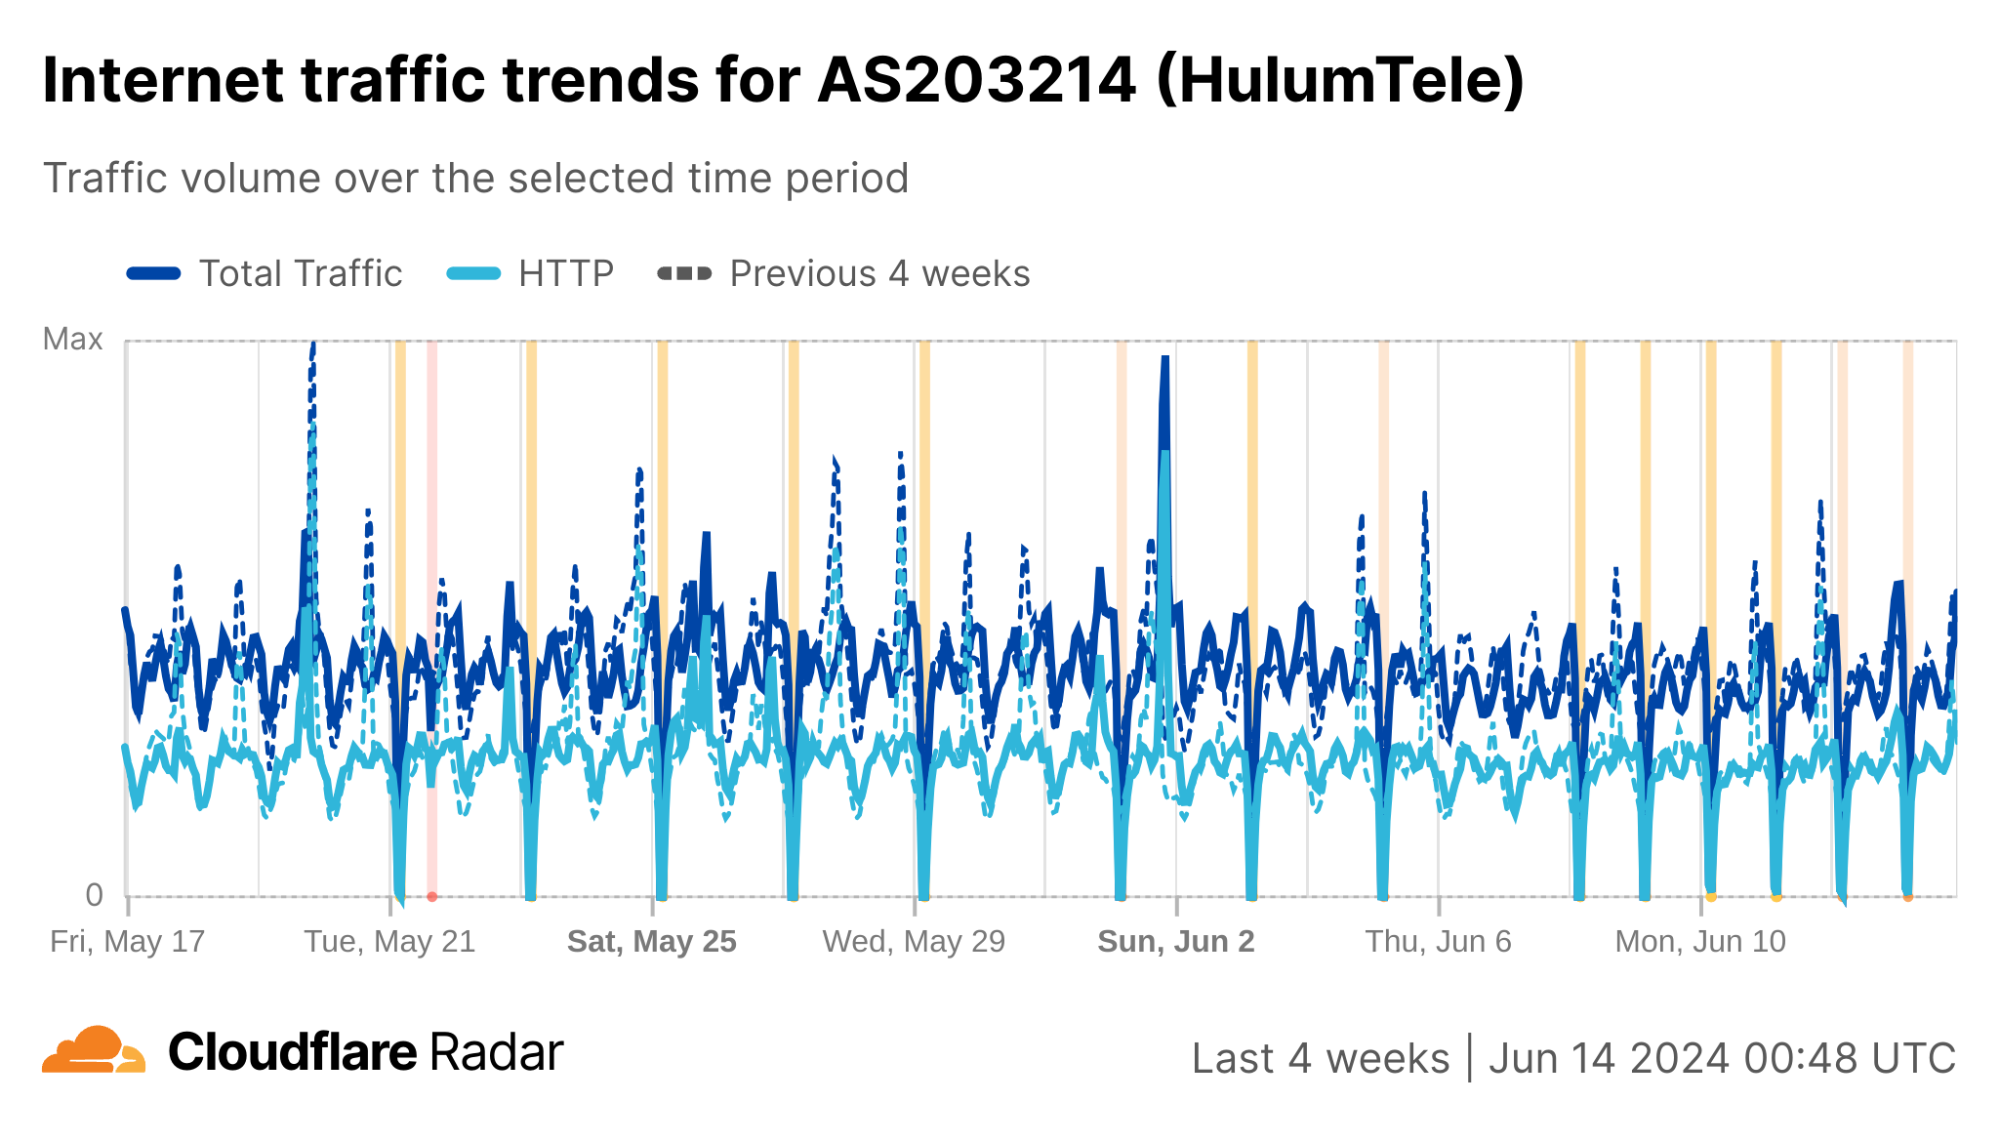
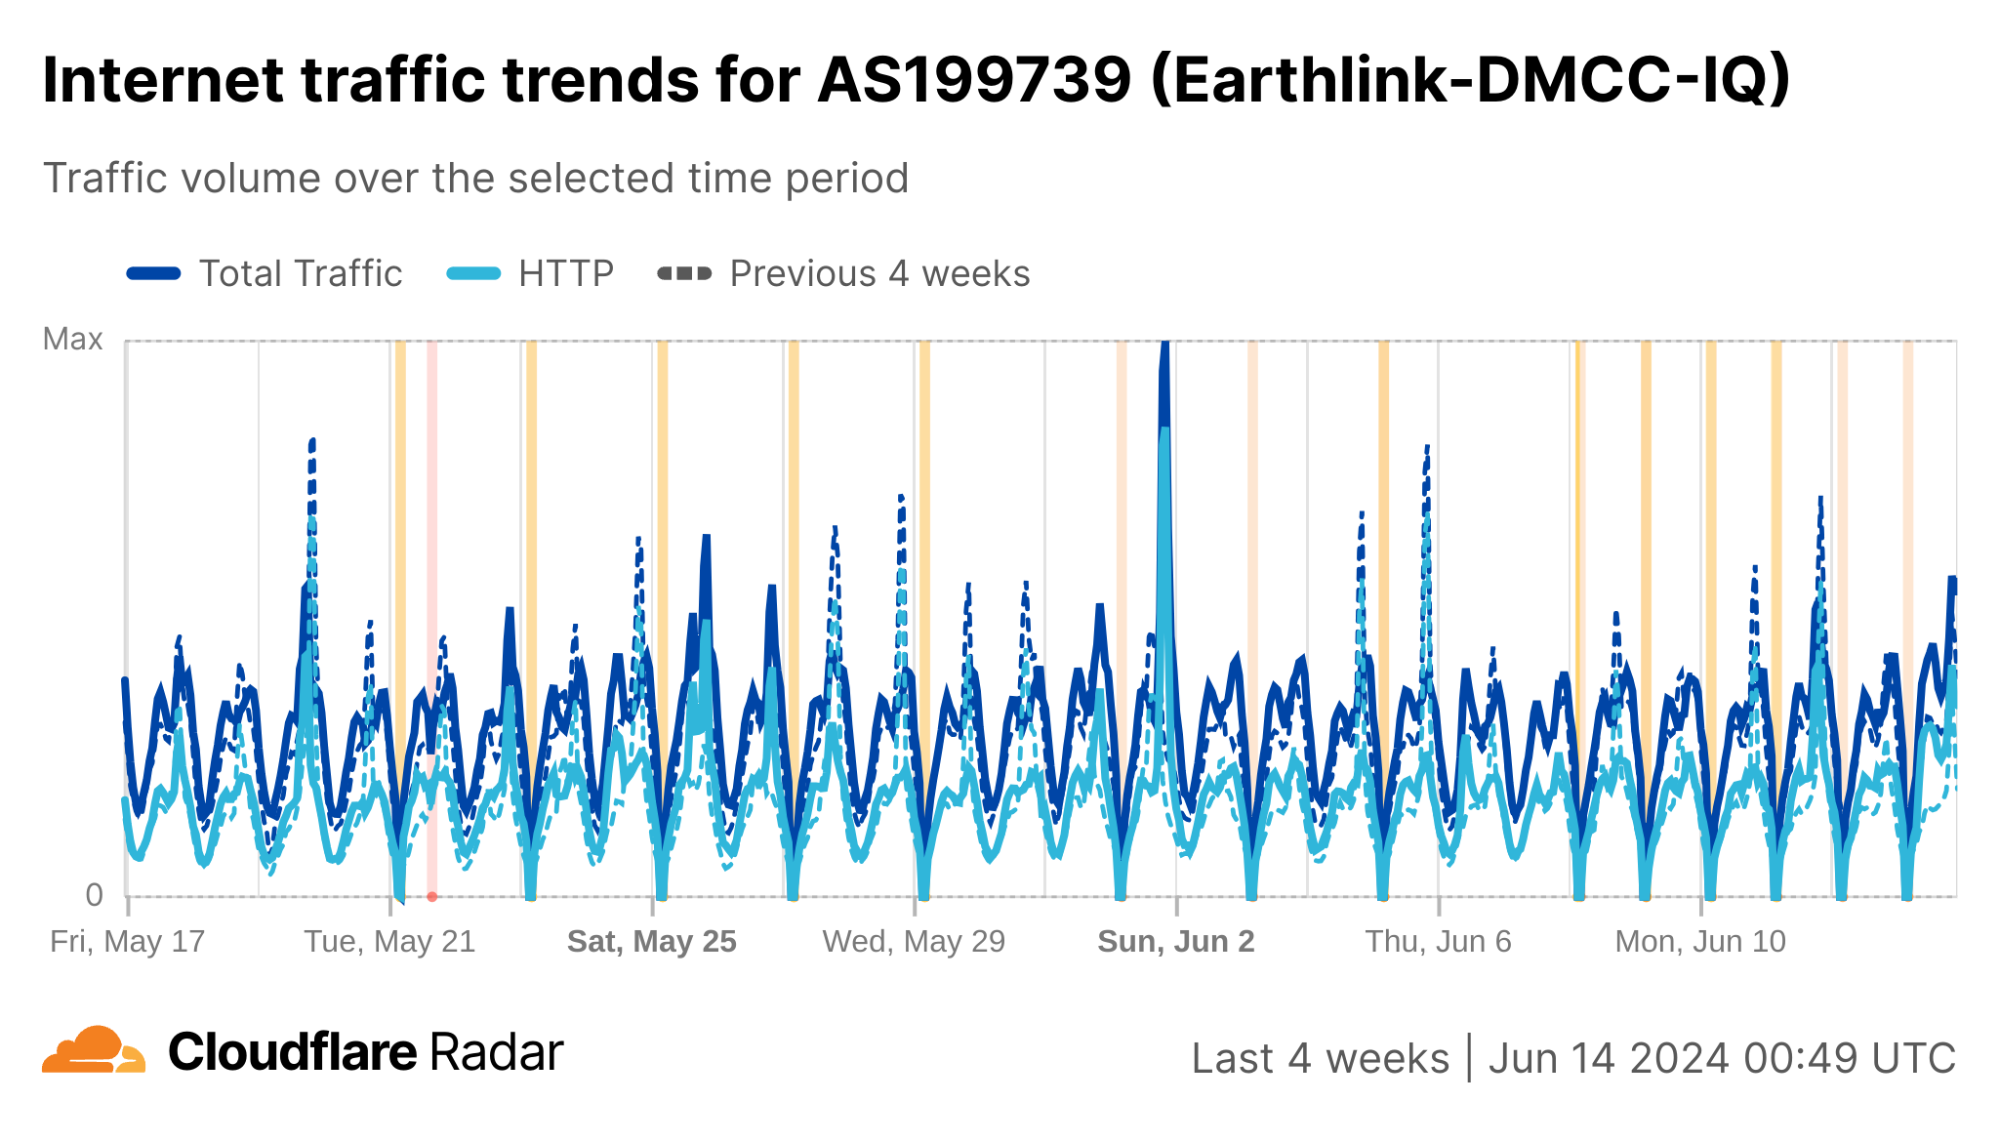
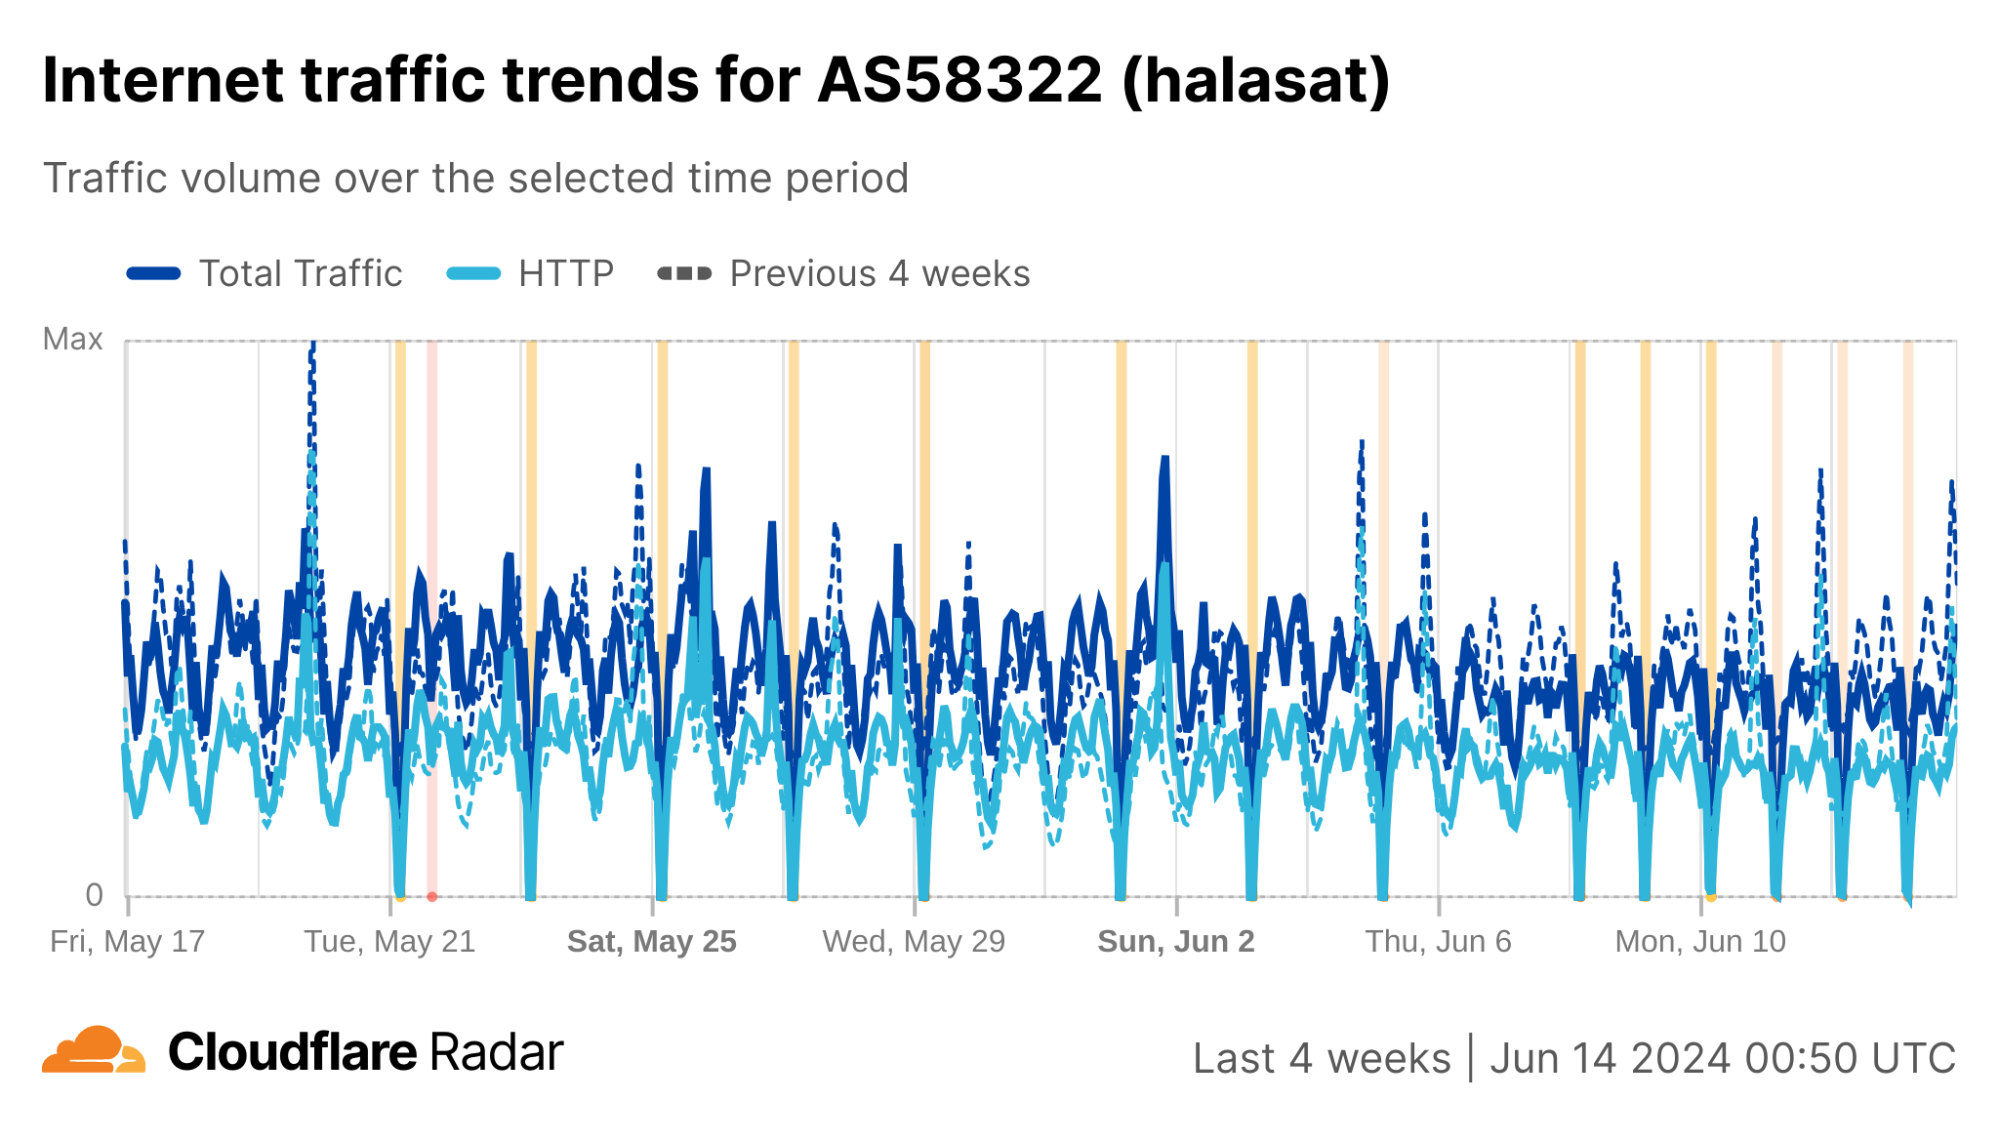
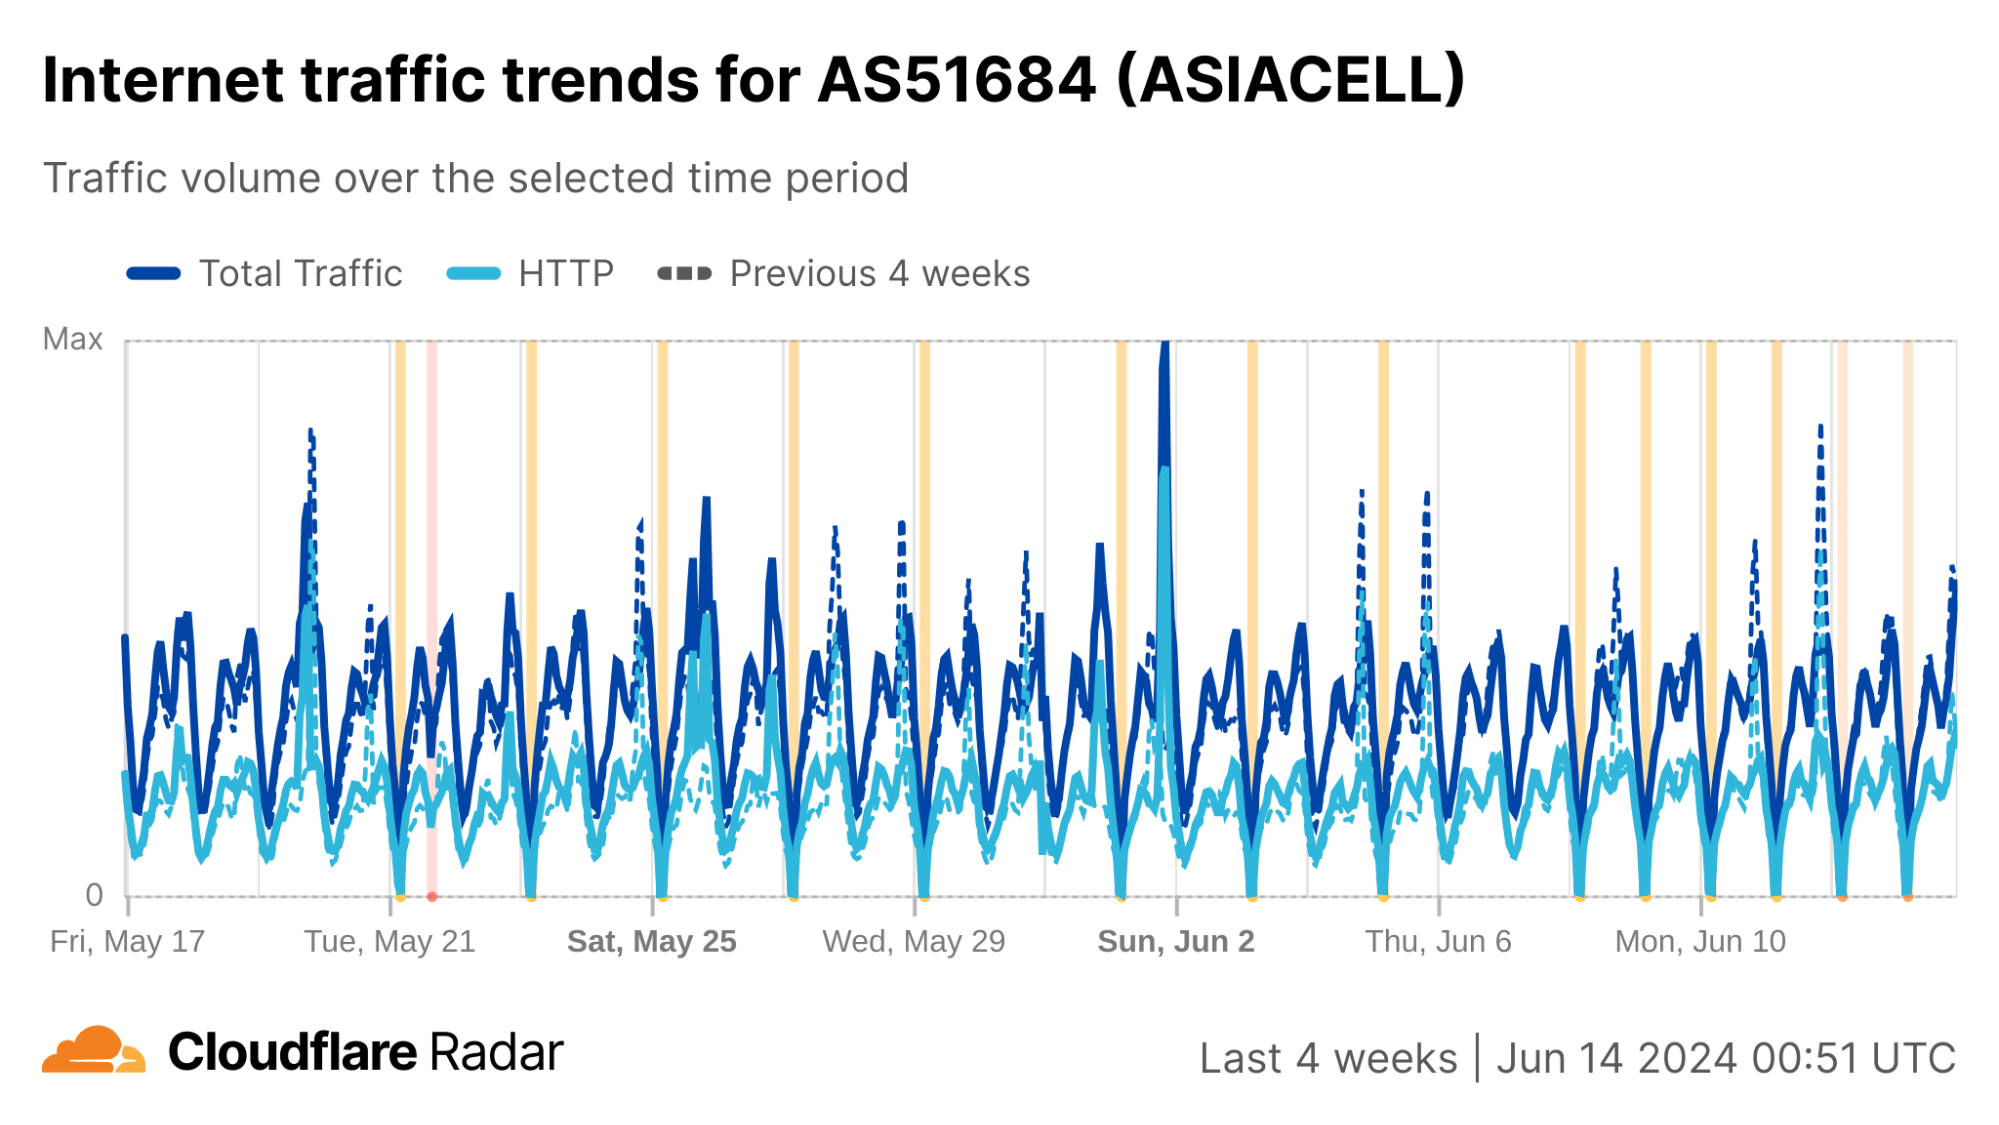
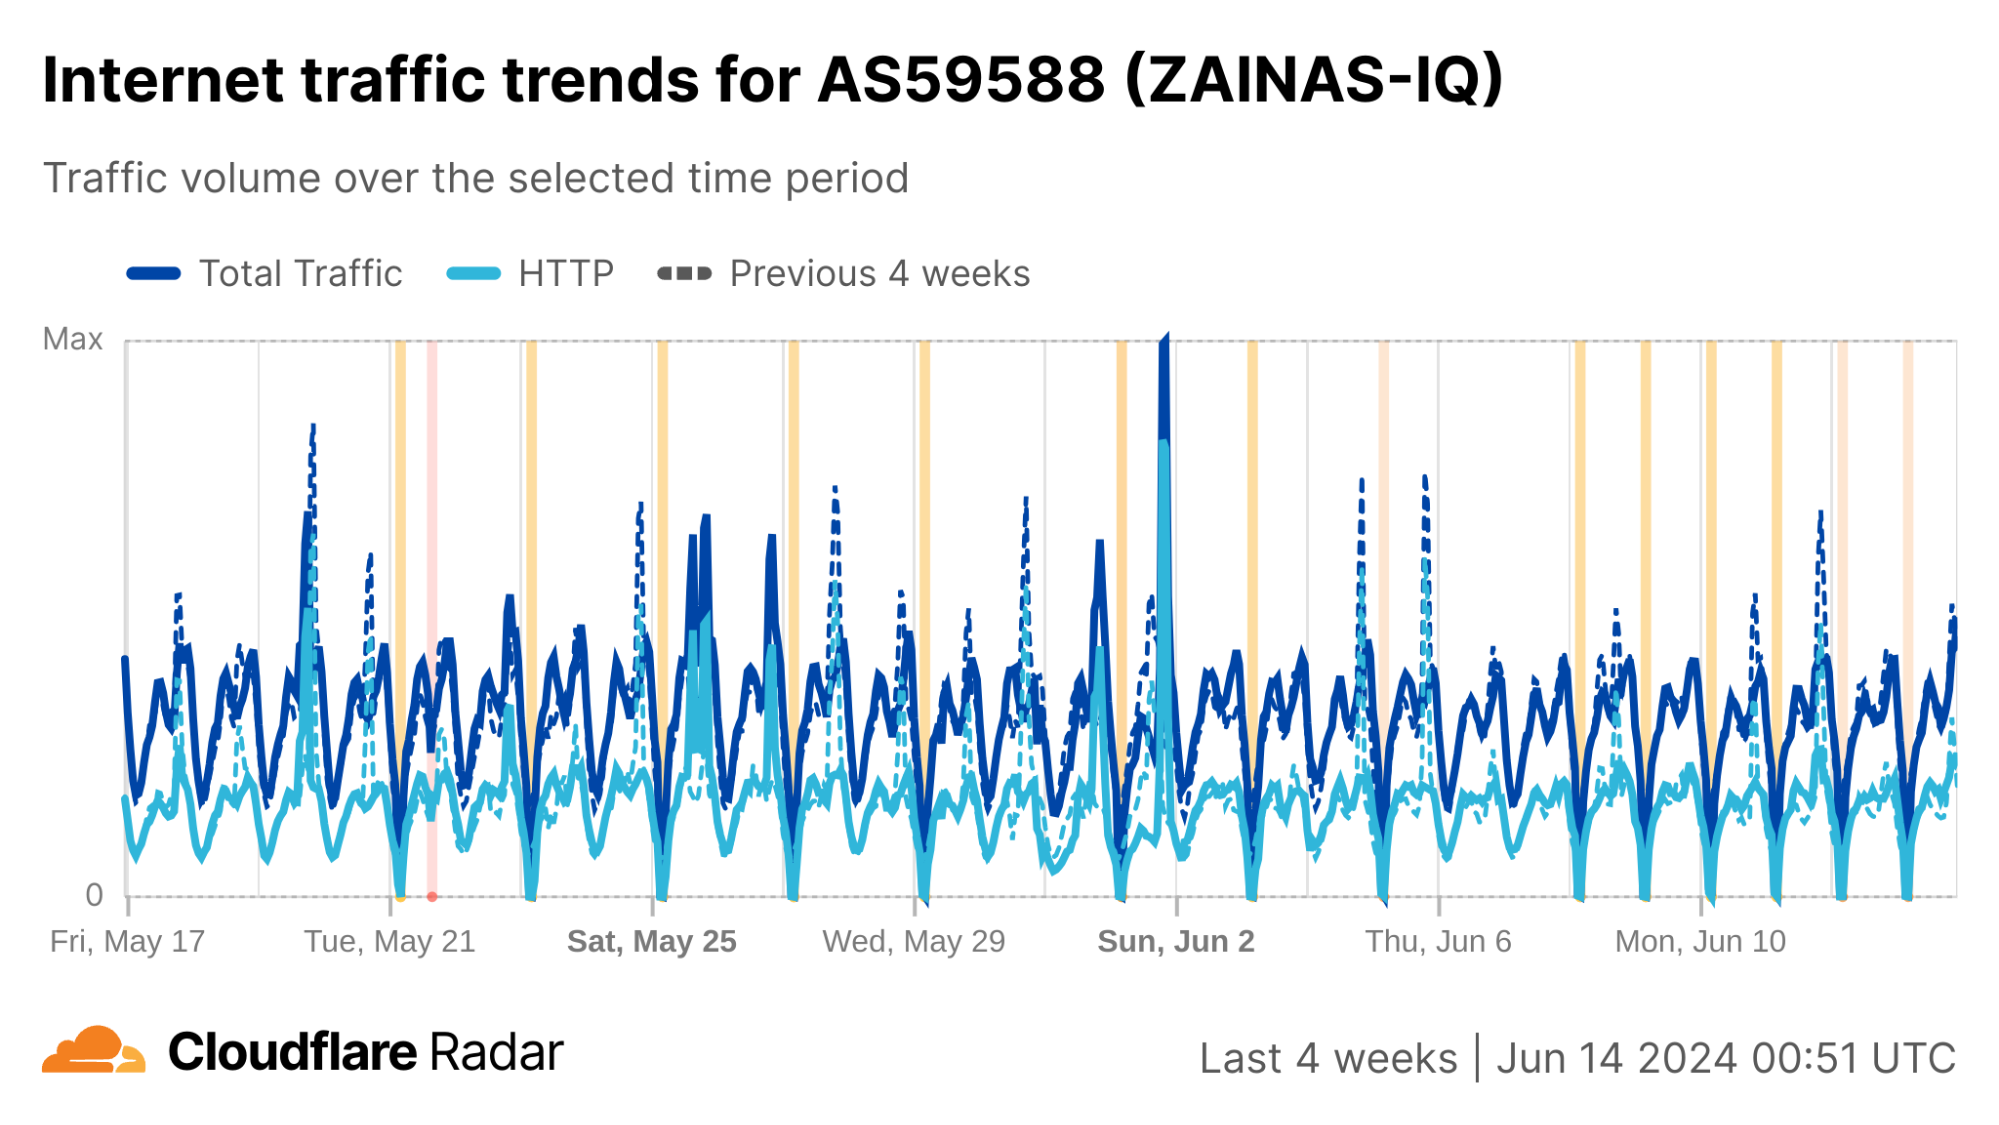
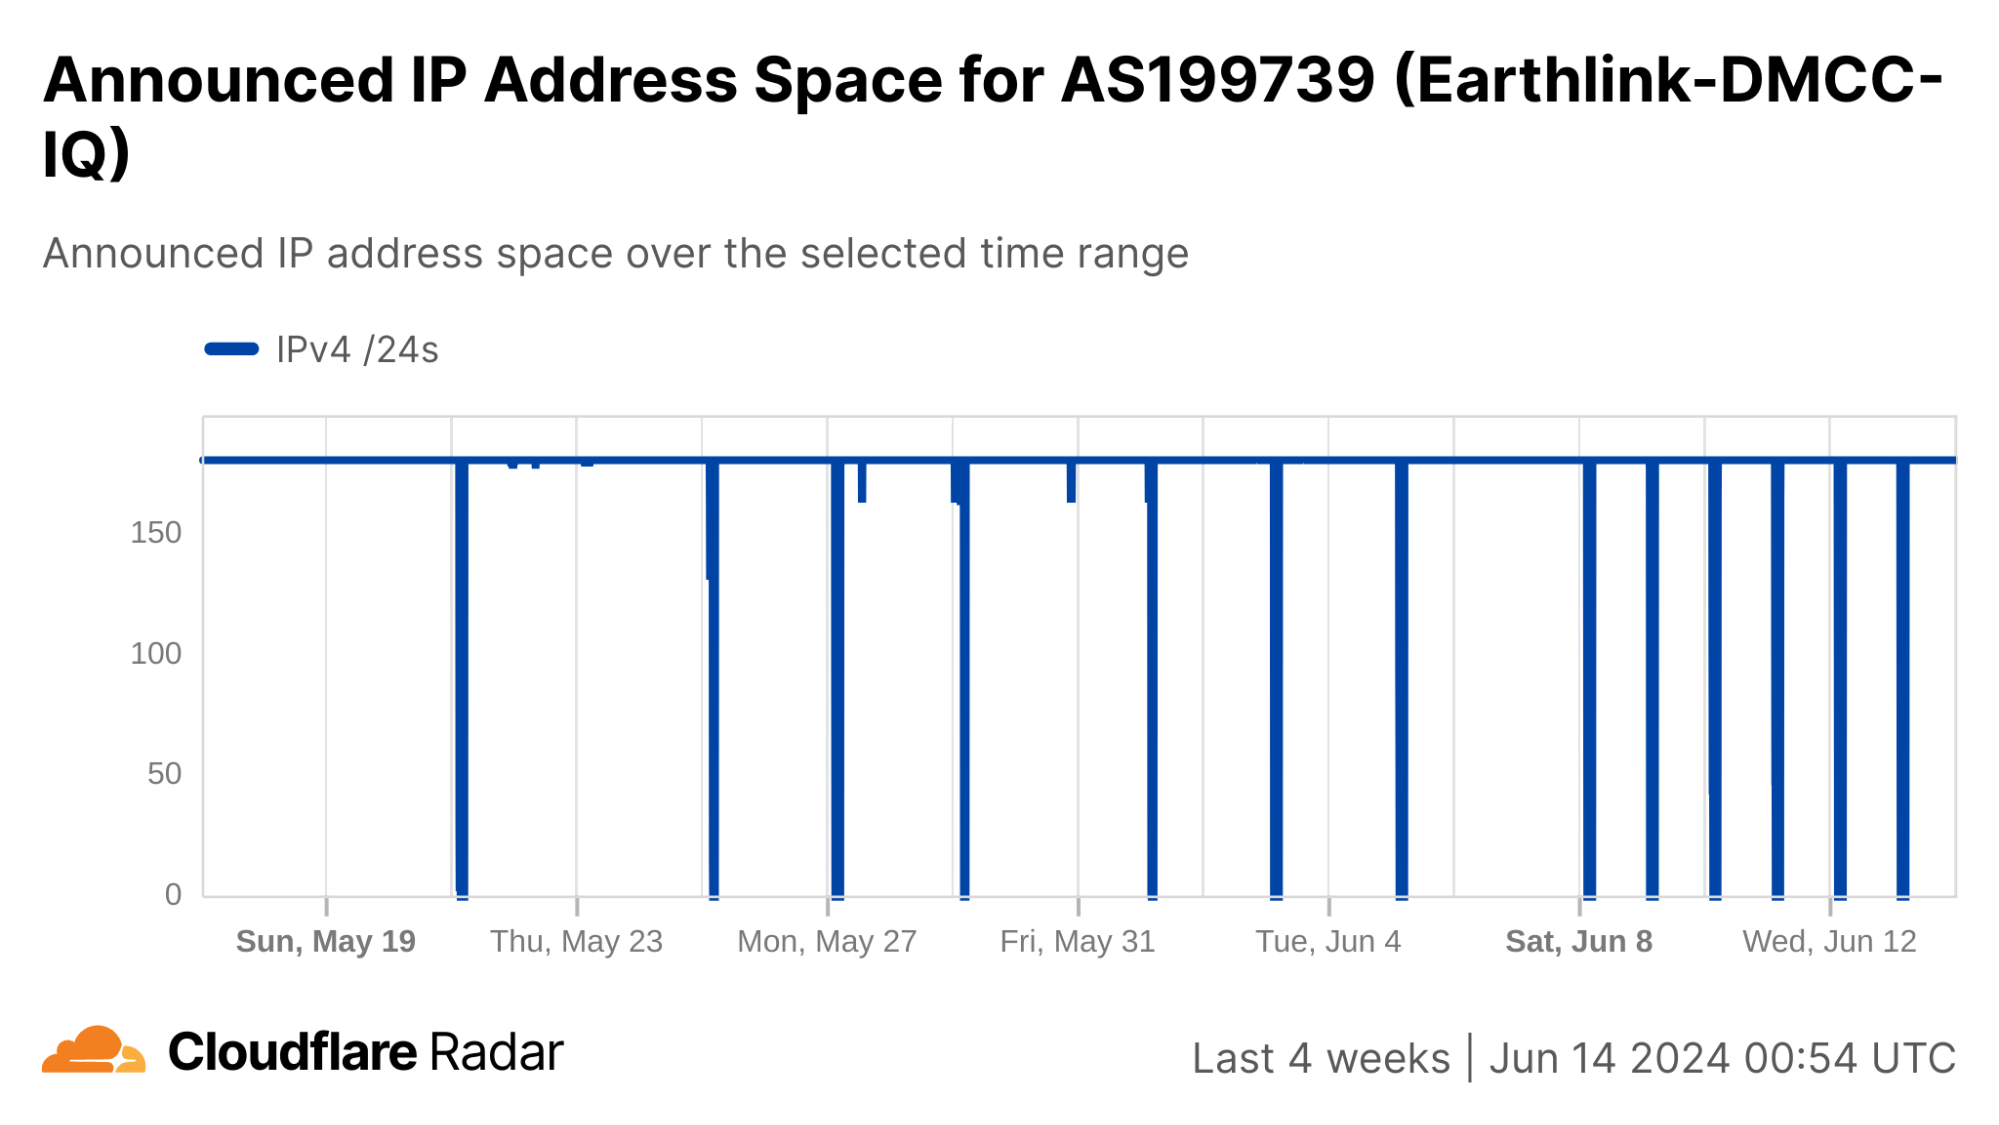
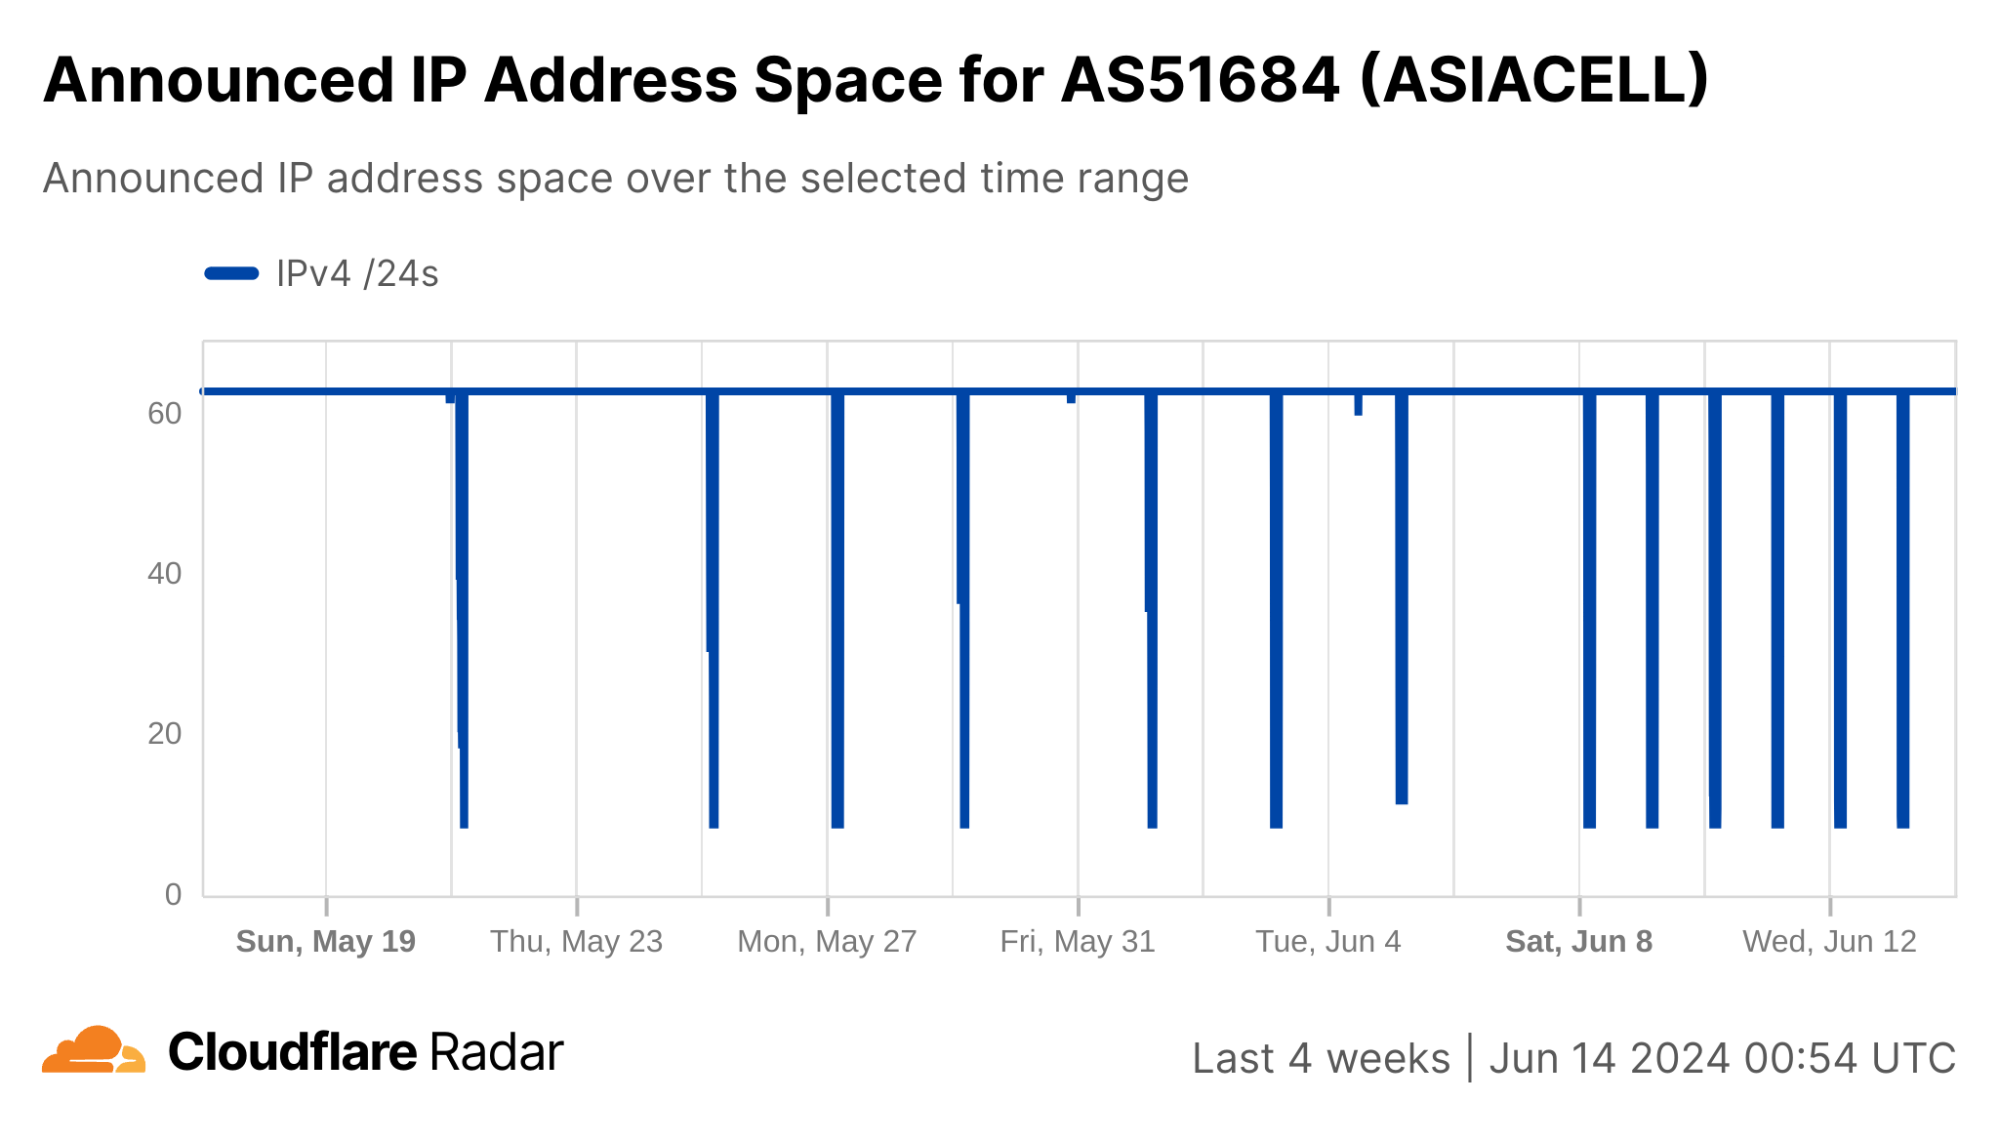
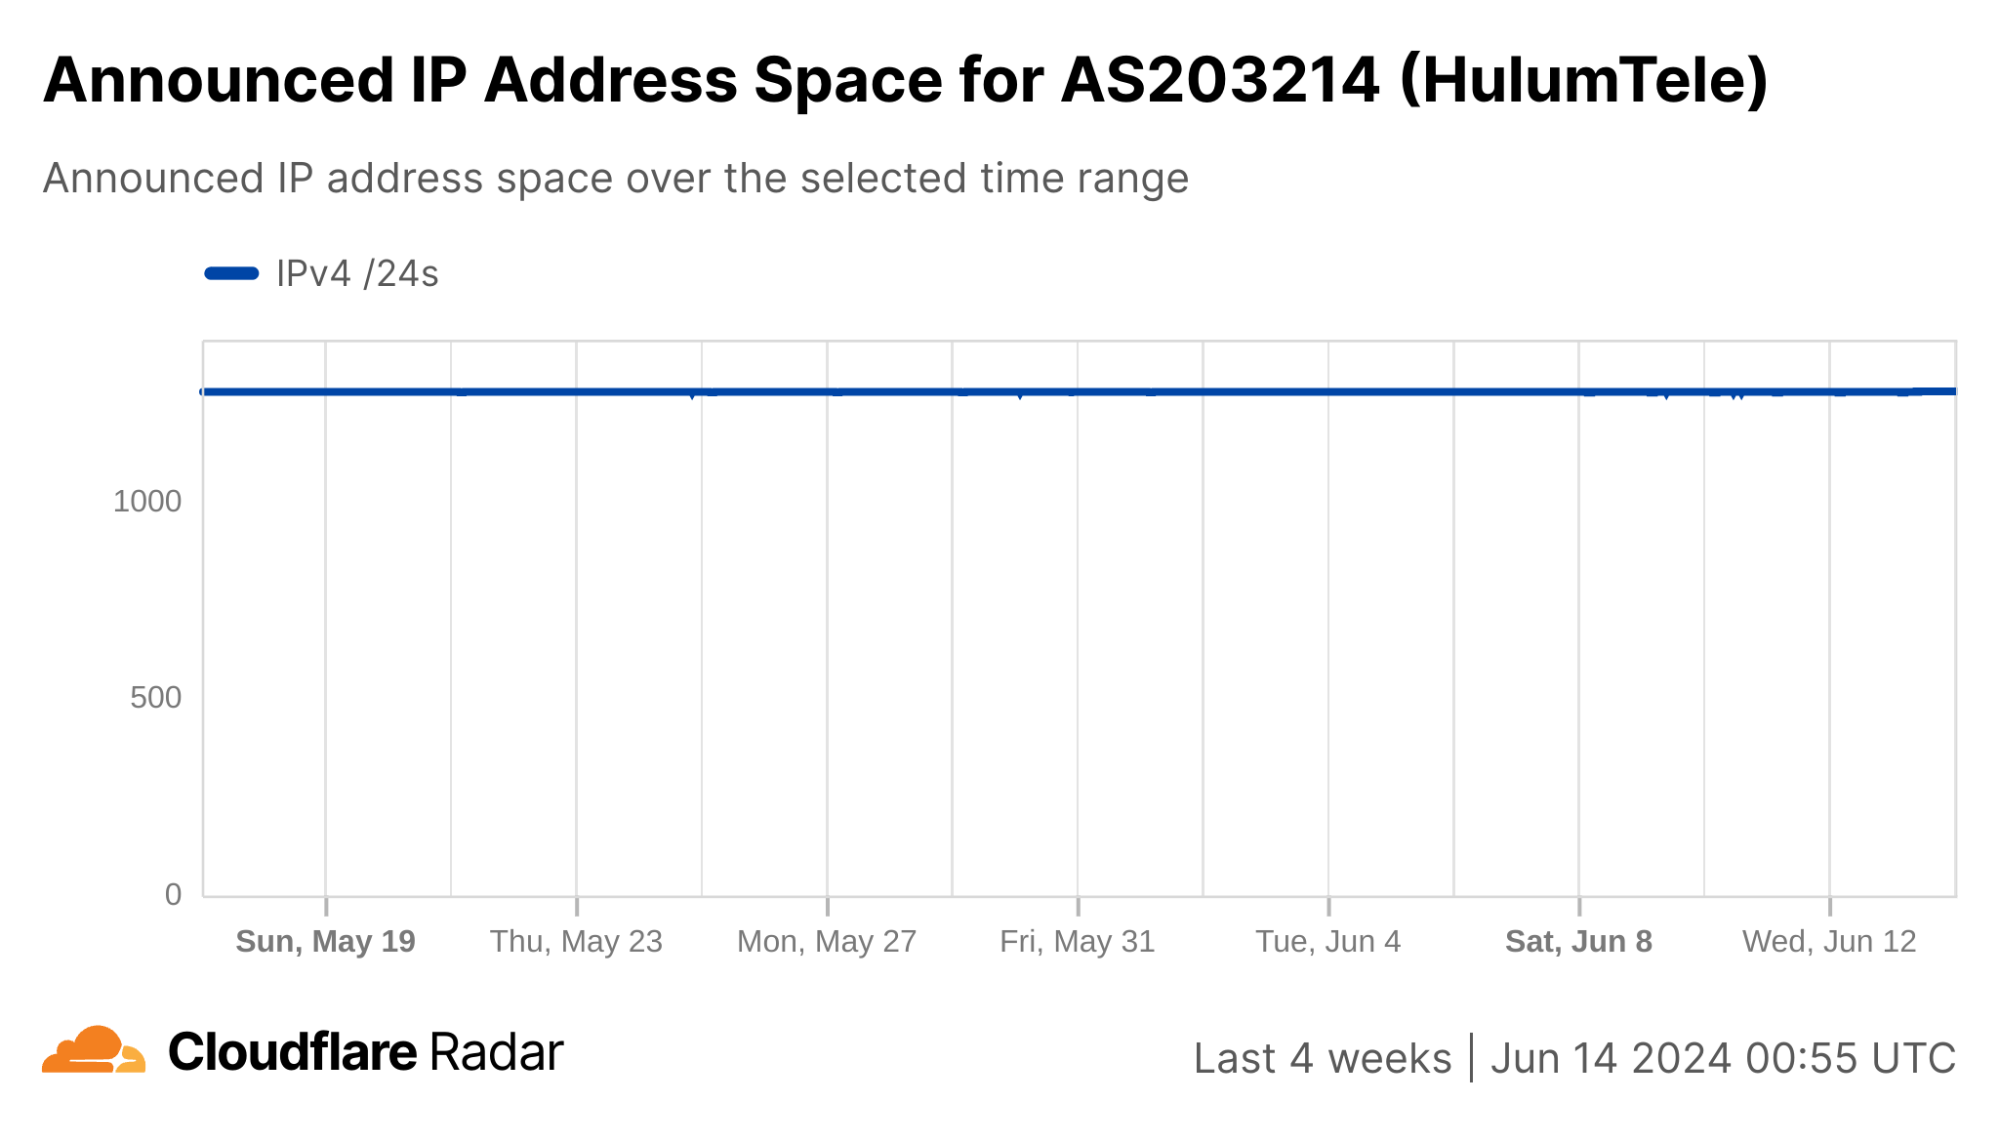
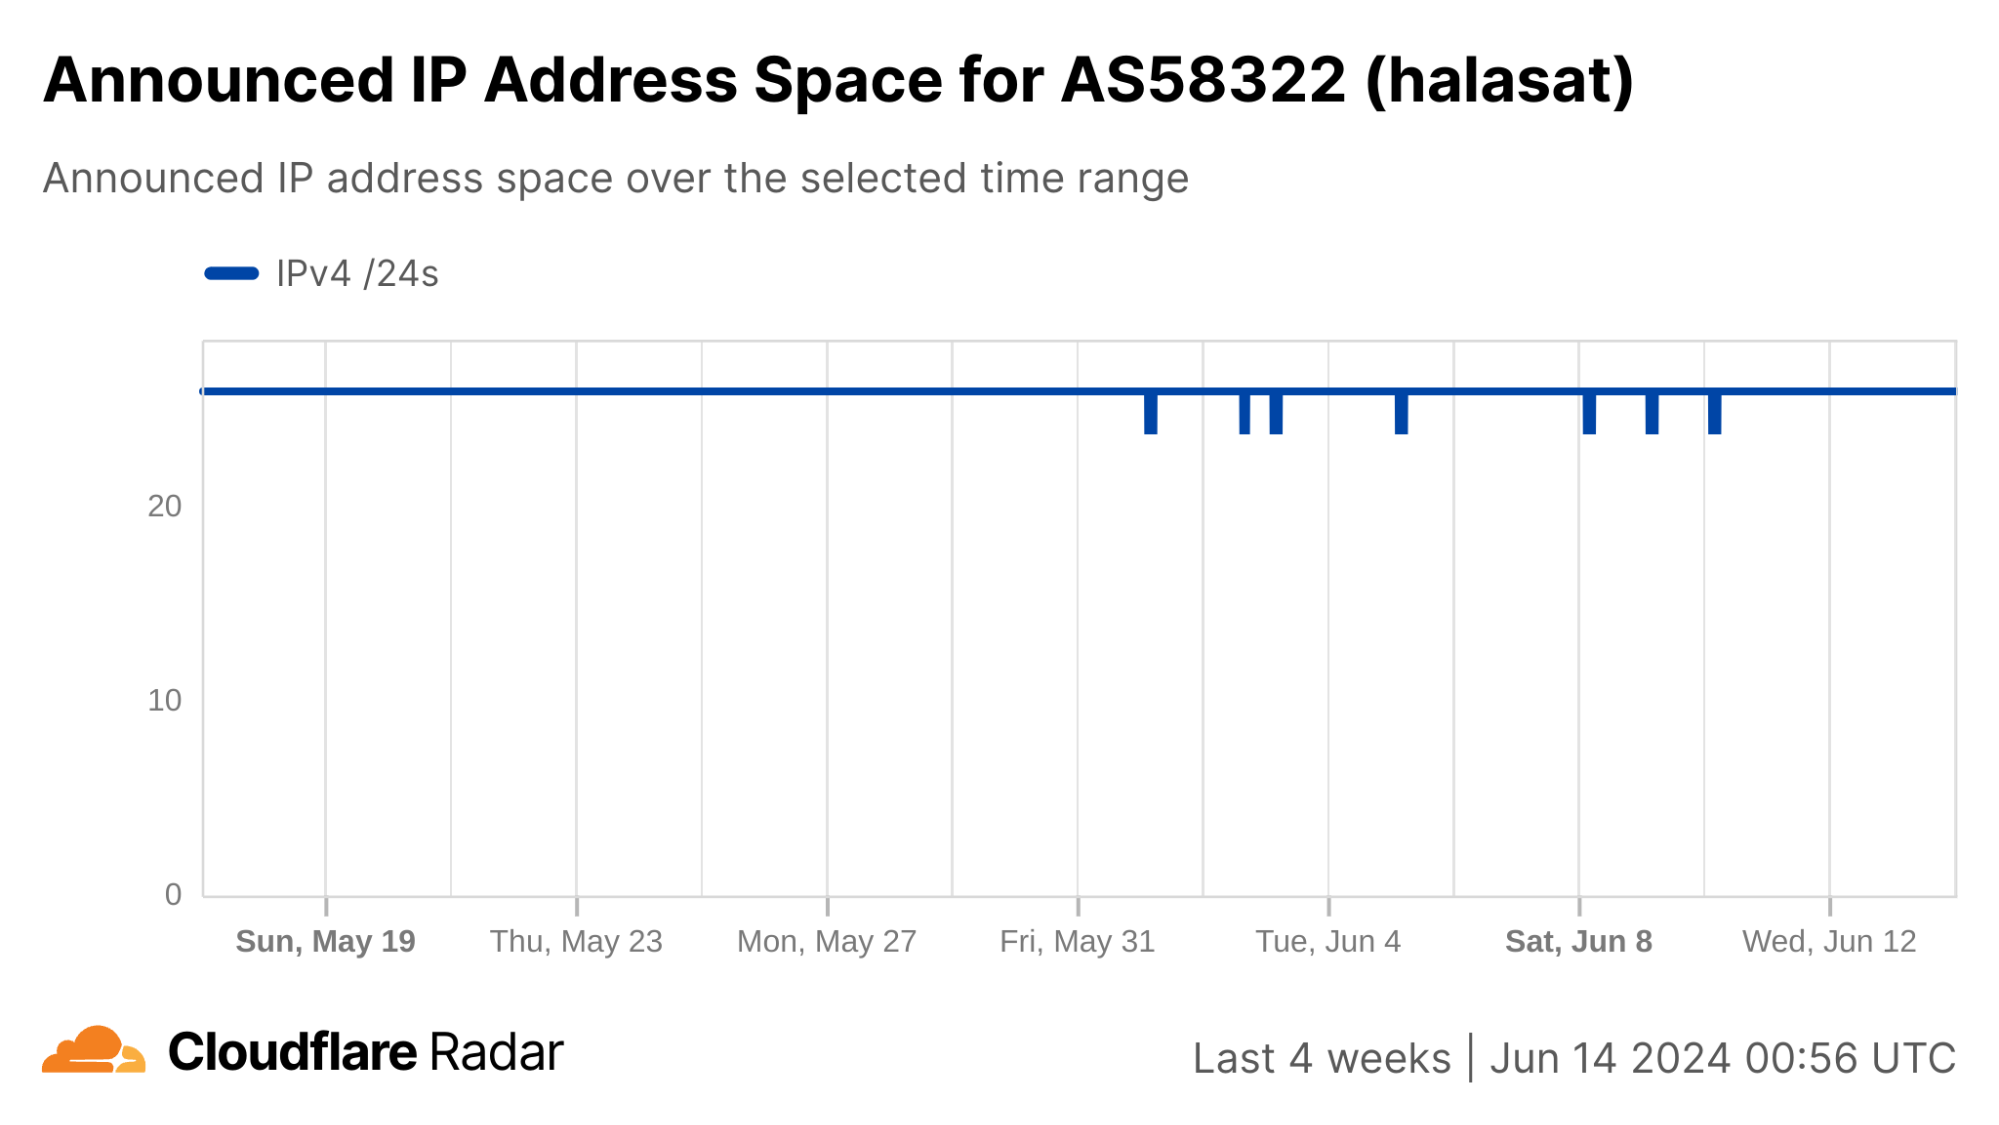
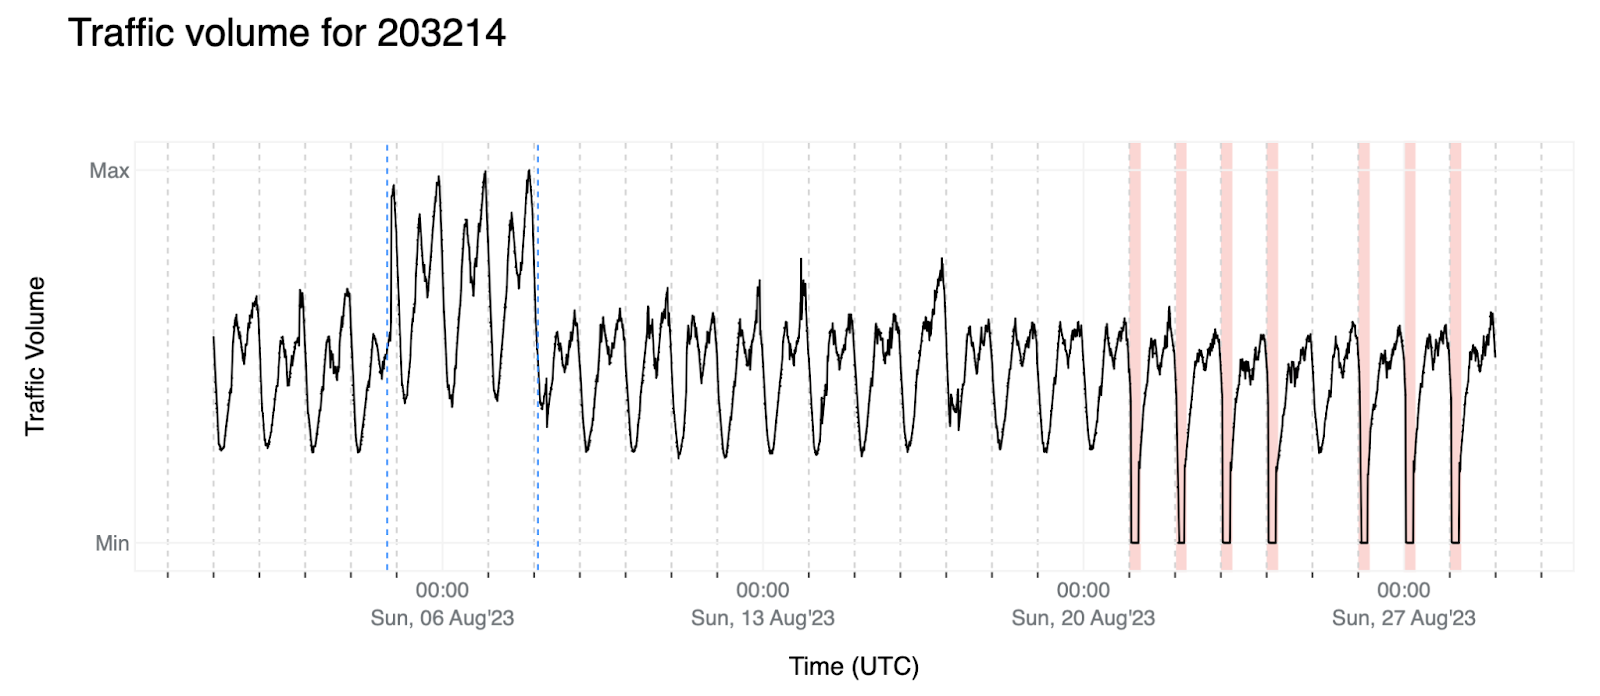
We can see this in a Cloudflare Radar traffic graph that shows the shutdowns at a country level, where traffic is dropping by around 87% during each multi-hour shutdown. In addition to the five networks also shown here (AS203214 (HulumTele), AS199739 (Earthlink), AS58322 (Halasat), AS51684 (Asiacell), and AS59588 (Zainas)), further analysis finds more than 30 where we observed a complete loss of traffic during the shutdowns, with a number of them downstream of these providers.
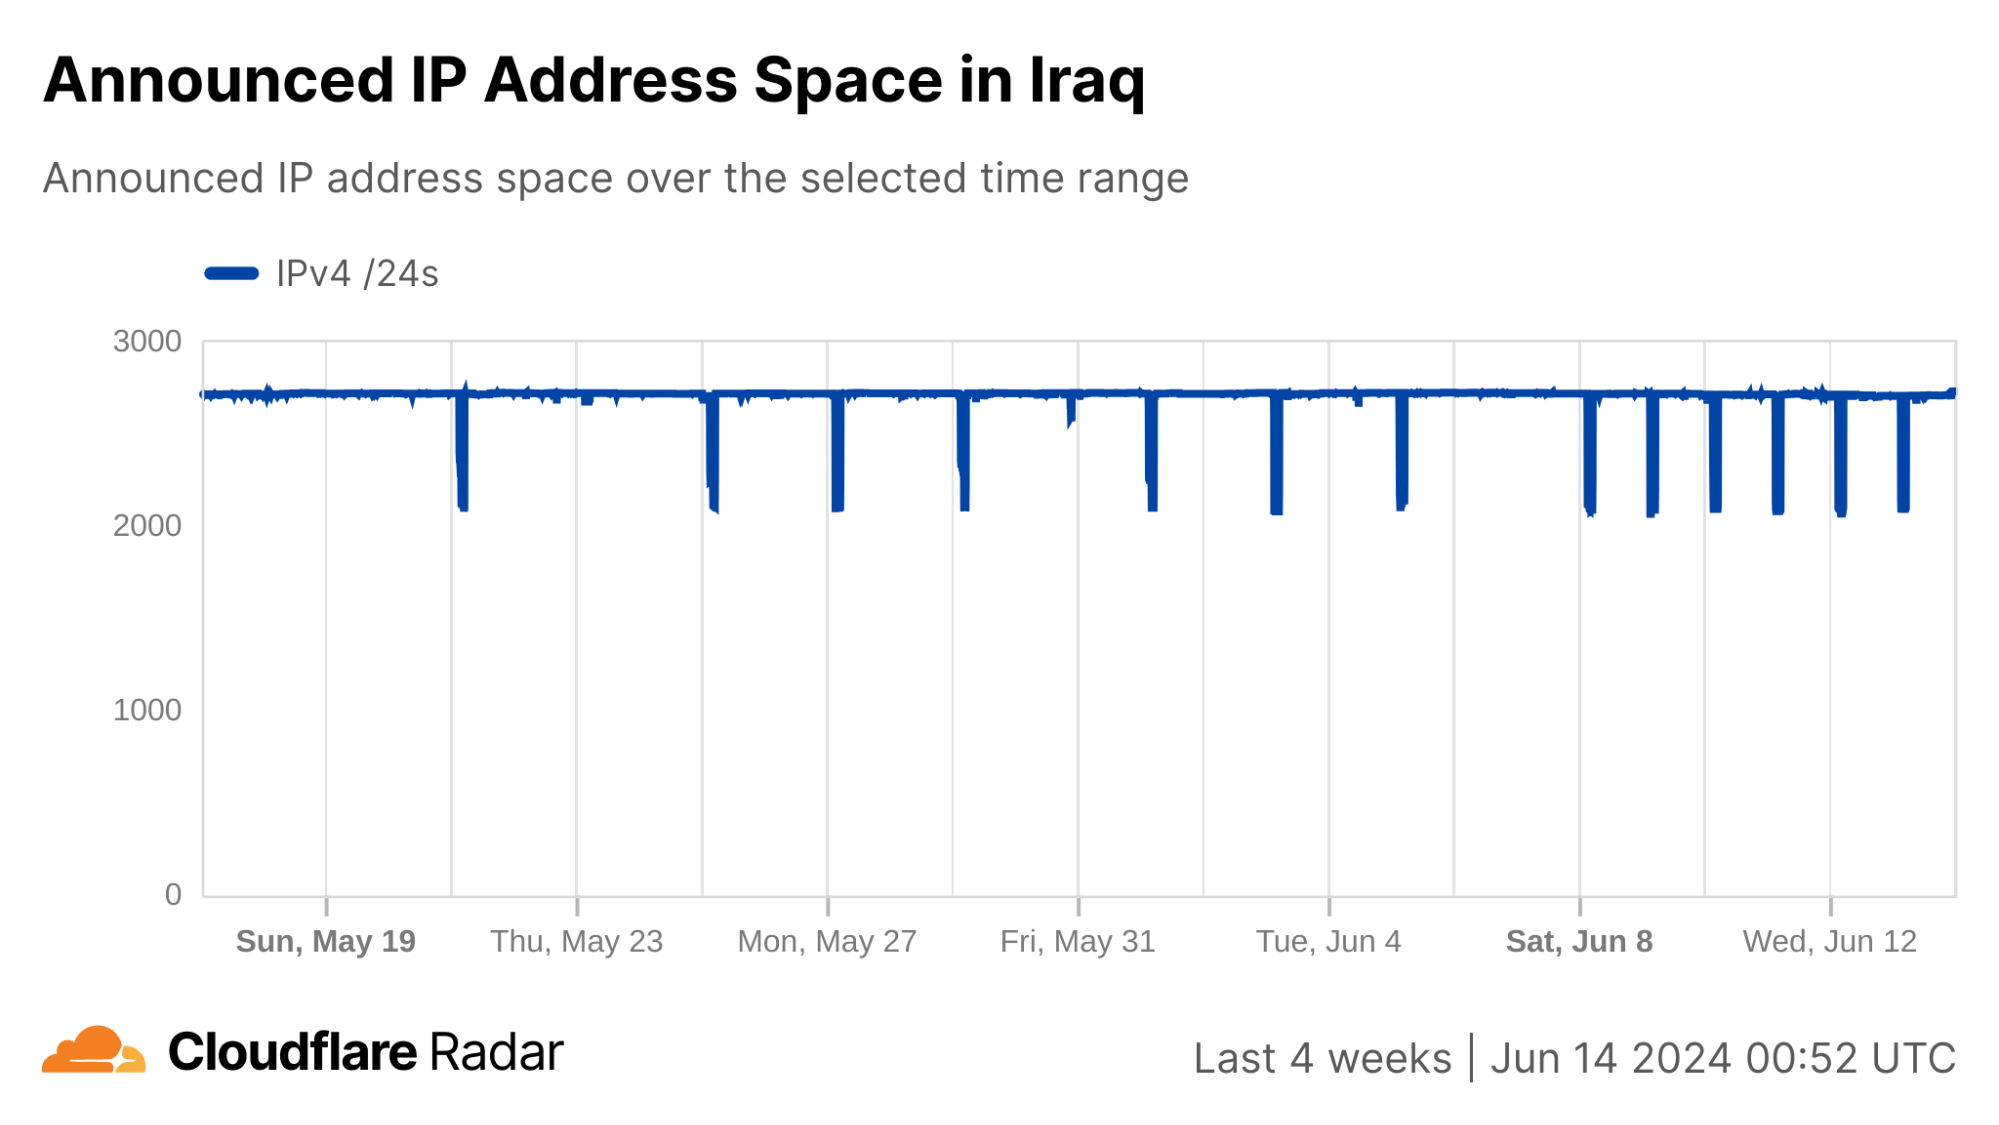
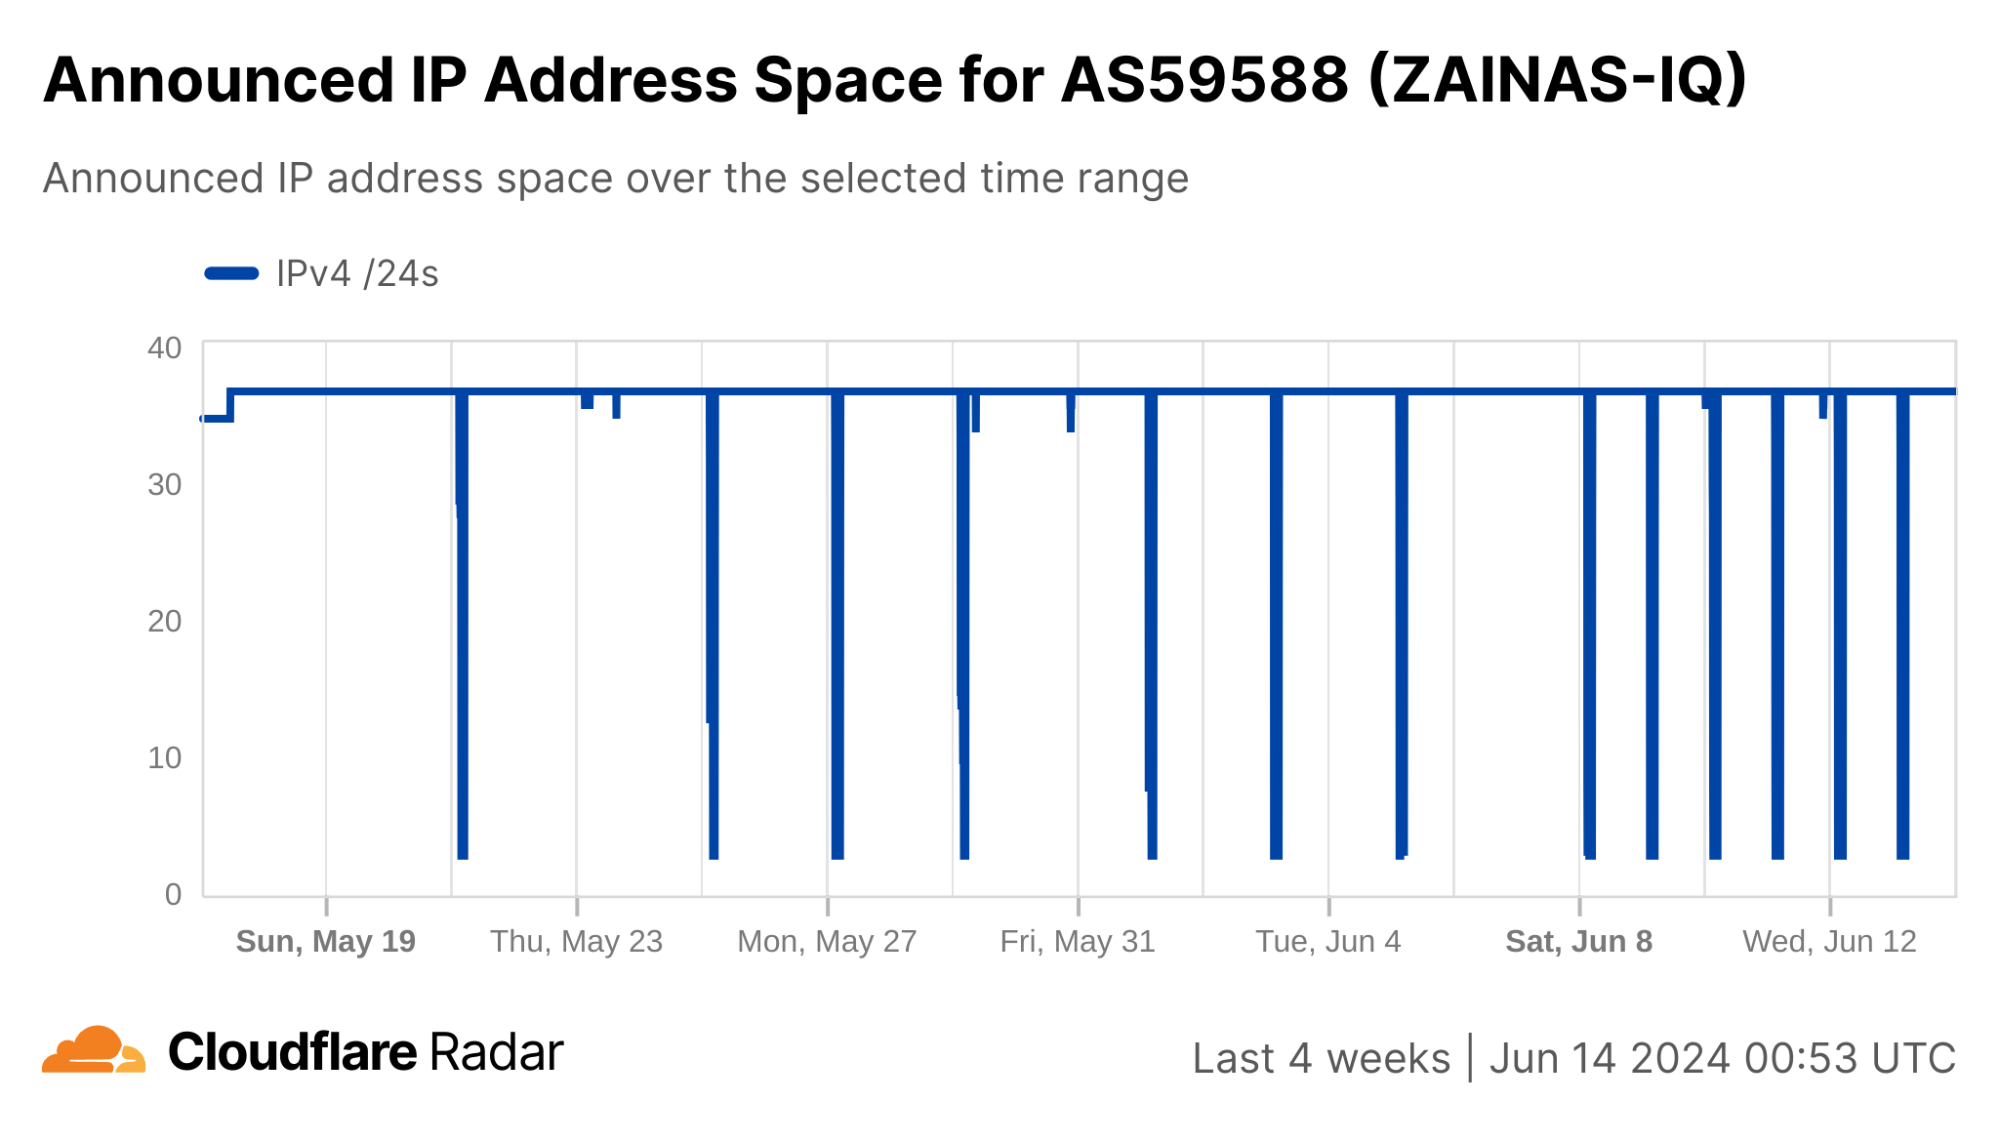
In contrast to Syria, the changes to announced IP address space during the shutdowns are much less severe in Iraq. Several of the shutdowns are correlated with a drop of ~20-25% in announced IPv4 address space, while a few others saw a drop closer to just 2%.
Similar to Syria, we can also look at 1.1.1.1 resolver traffic data to better understand how the shutdowns are being implemented. The country-level graphs below suggest that UDP traffic patterns are not visibly changing, suggesting that responses from the resolver are, in fact, getting back to the clients. However, this likely isn’t the case, and such a conclusion is at least in part an artifact of the graph’s time frame and hourly granularity, as well as the inclusion of resolver traffic from Kurdish network providers (ASNs). The shutdowns are more clearly evident in the DNS-over-TCP and DNS-over-HTTPS graphs below, as well as in the graph for HTTP(S) request traffic (both mobile & desktop), which is also TCP-based. In these graphs, the troughs on days that shutdowns occurred generally dip lower than those on the days that the Internet remained available.
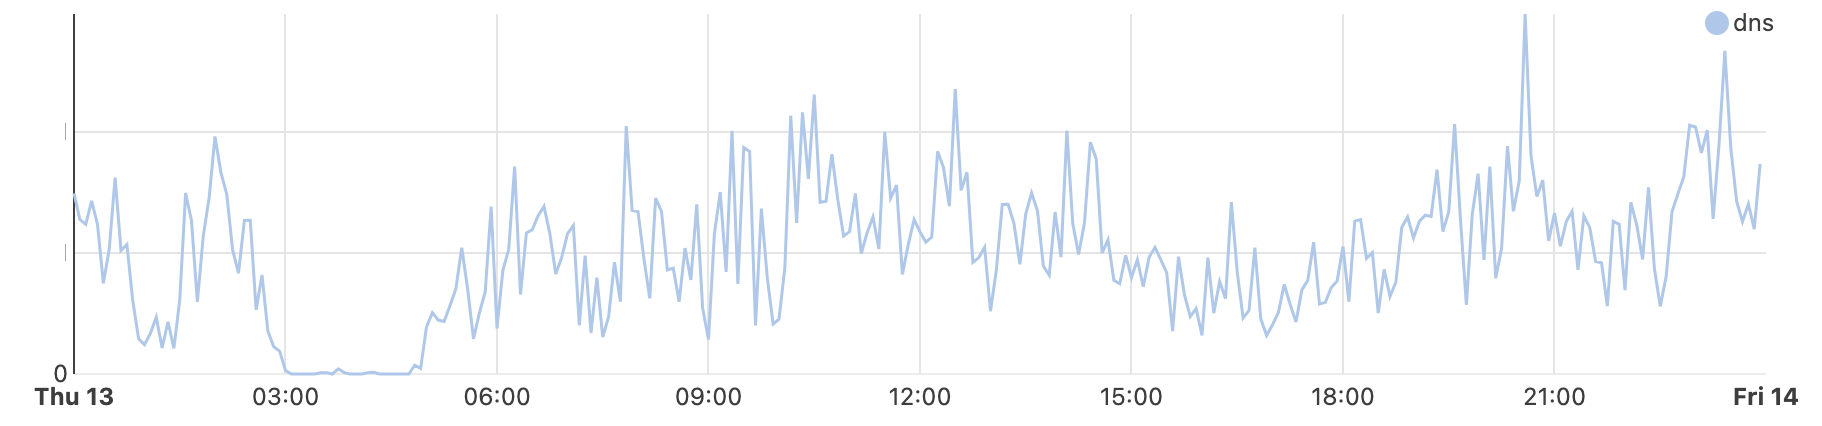
In looking at authoritative DNS traffic from Iraq during a shutdown (for June 13 as an example day, as above), we see evidence of a decline in traffic during the time the shutdown occurs.
The decline in authoritative DNS traffic is more evident at an ASN level, such as in the graph below for AS203214 (Hulum), effectively confirming that UDP traffic is not getting through here either.
Considering the traffic, 1.1.1.1 Resolver, and authoritative DNS observations reviewed here, it suggests that the Internet shutdowns taking place in Iraq are more complex than Syria’s, as it appears that both UDP and TCP traffic are unable to egress from impacted network providers. As not all impacted network providers are showing a complete loss of announced IP address space during the shutdowns, Iraq is taking a different approach to disrupting Internet connectivity. Although analysis of our data doesn’t provide a definitive conclusion, there are several likely options, and network providers in the country may be combining several. These options revolve around:
IP: Block packets from reaching IP addresses. This may be done by withdrawing prefix announcements from the routing table (a brute force approach) or by blocking access to specific IP addresses, such as those associated with a specific application or service (a more surgical approach).
Connection: Block connections based on SNI/HTTP headers, or other application data. If a network or on-path device is able to observe the server name (or other relevant headers/data), then the connection can be terminated.
DNS: Operators of private or ‘internal’ DNS resolvers, offered by ISPs and enterprise environments for use by their own users, can apply content restrictions, blocking the resolution of hostnames associated with websites and other applications.
The consequences of these options are covered in more detail in a blog post. In addition, applying them at common network chokepoints, such as AS212330 (IRAQIXP) or AS208293 (AlSalam State Company, associated with the Iraqi Ministry of Communications), can disrupt connectivity at multiple downstream ISPs, without those providers necessarily having to take action themselves.
Algeria
As we noted in blog posts in 2022 and 2023, Algeria has a history of disrupting Internet connectivity during Baccalaureate exams. This has been taking place since 2018, following widespread cheating in 2016 that saw questions leaked online both before and during tests. On March 13, the Algerian Ministry of Education announced that the Baccalaureate exams would be held June 9-13. As expected, Internet disruptions were observed both country-wide and at a network level. Similar to previous years, two disruptions were observed each day. The first one began at 08:00 local time (07:00 UTC), and except for June 9, lasted three hours, ending at 11:00 local time (10:00 UTC). (On June 9, it lasted until 13:00 local time (12:00 UTC).) The second one began between 14:00-14:30 local time (13:00-13:30 UTC), and lasted until 16:00-17:00 local time (15:00-16:00 UTC) – the end time varied by day.
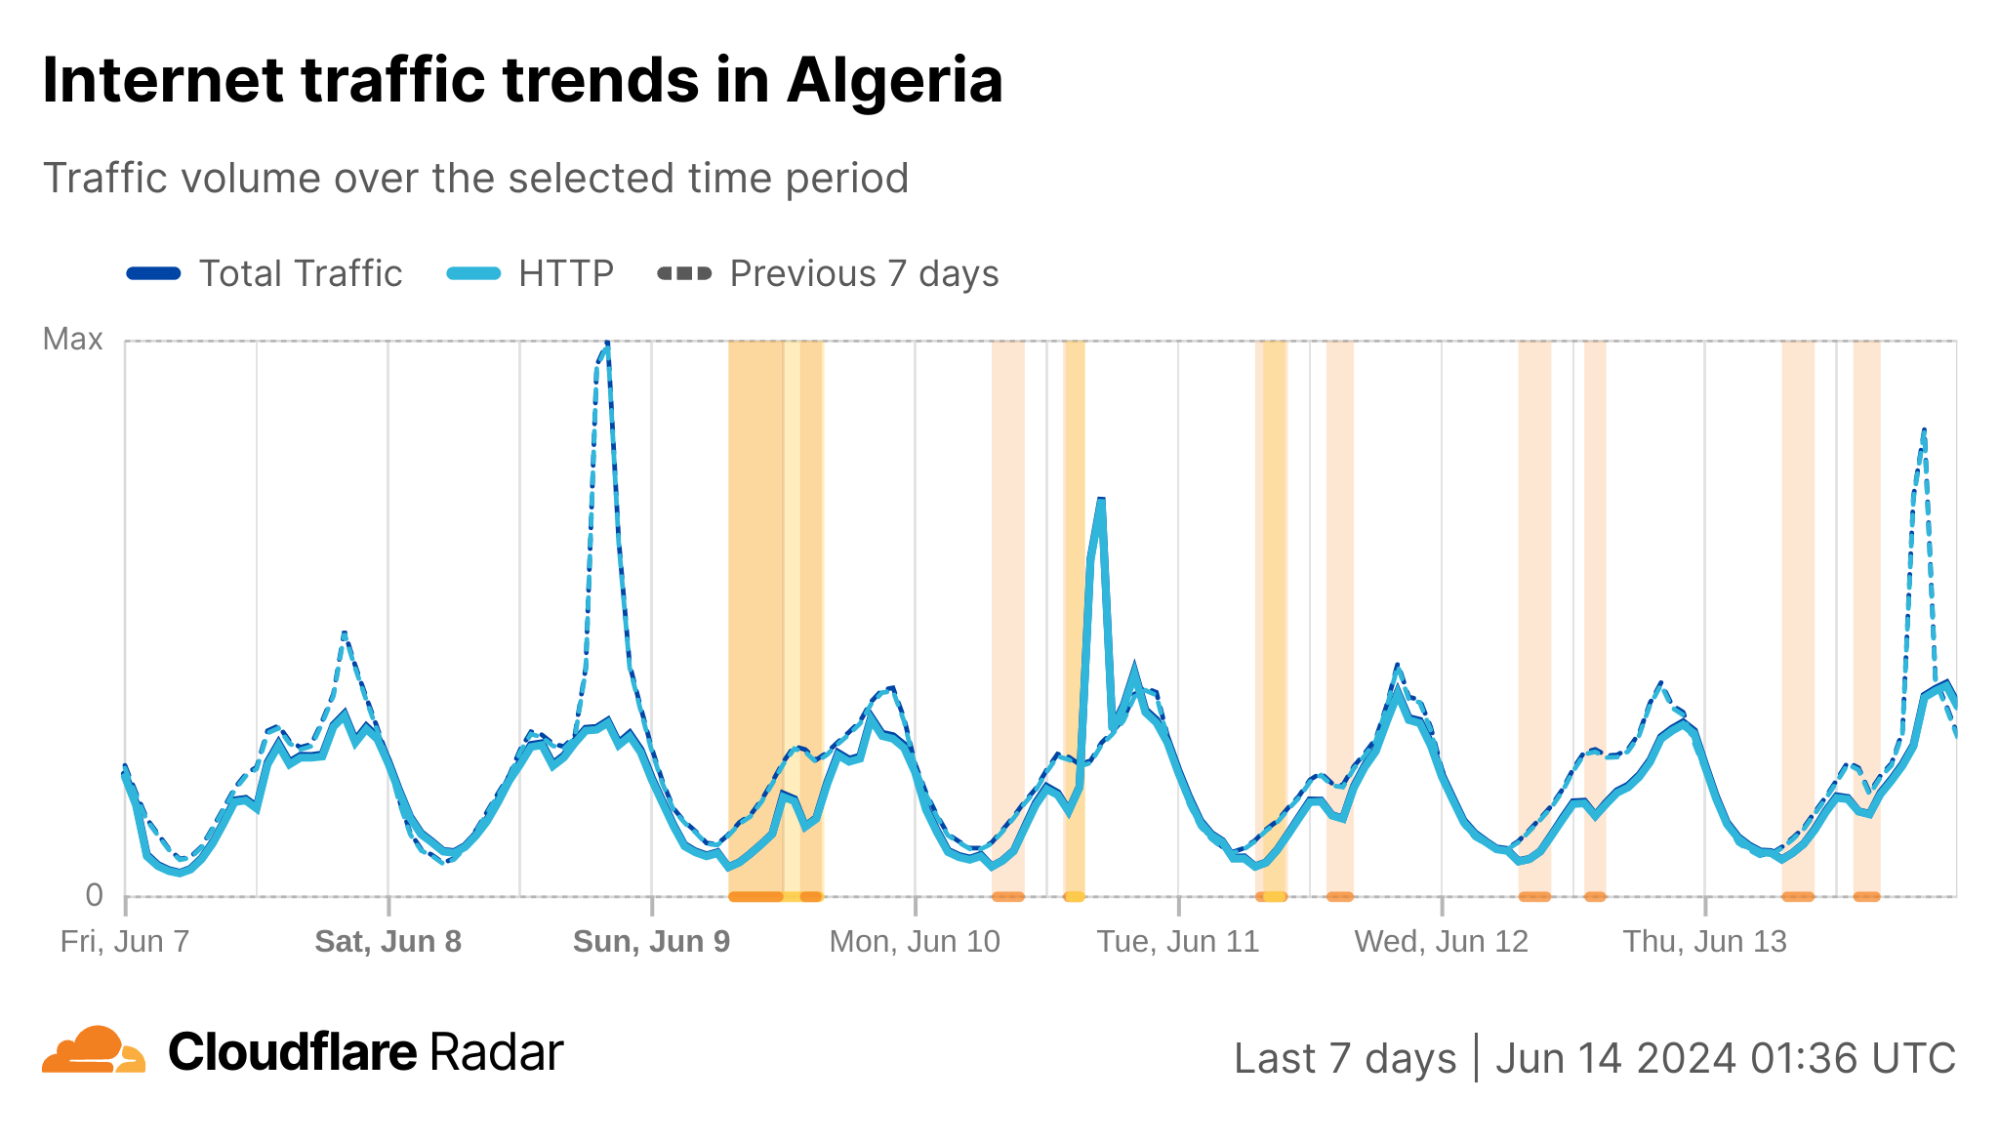
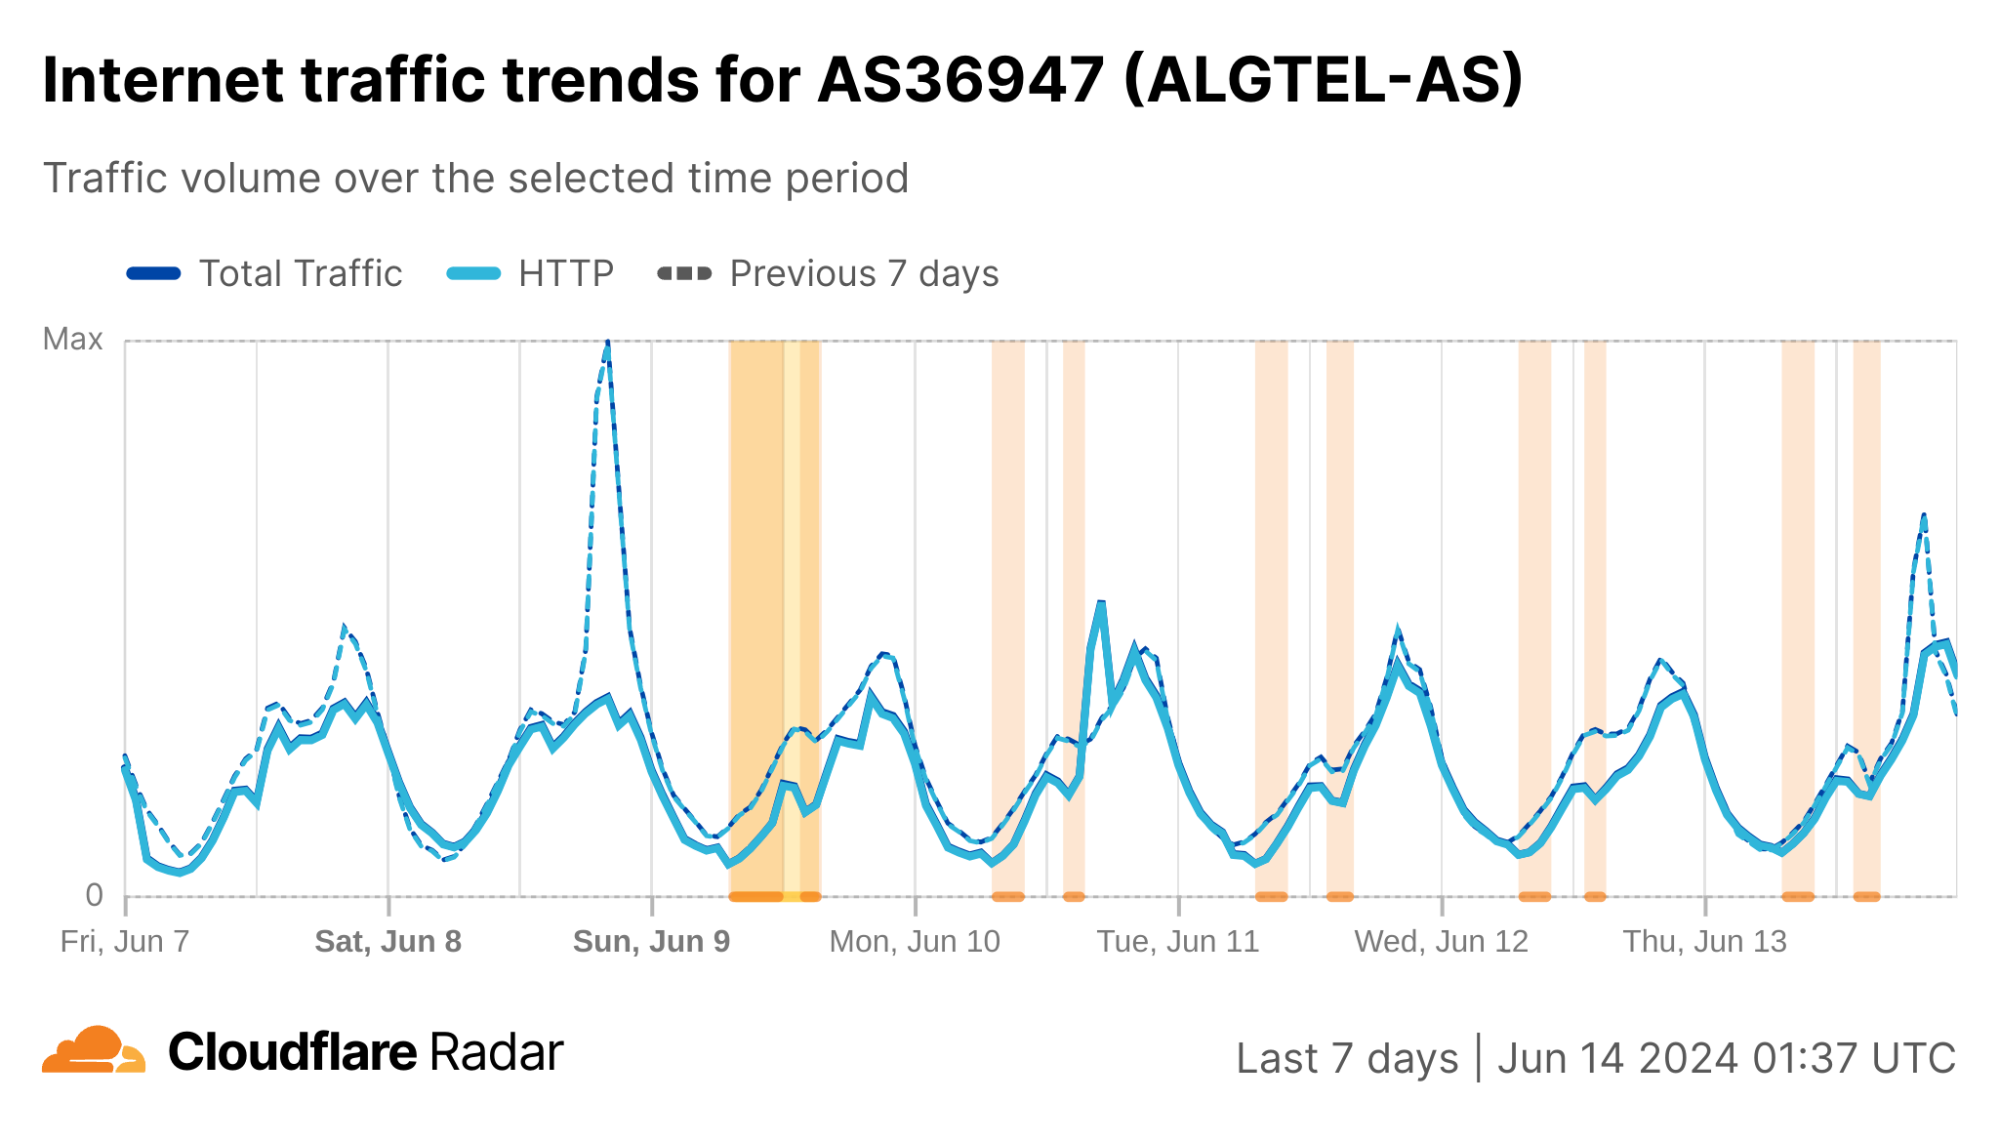
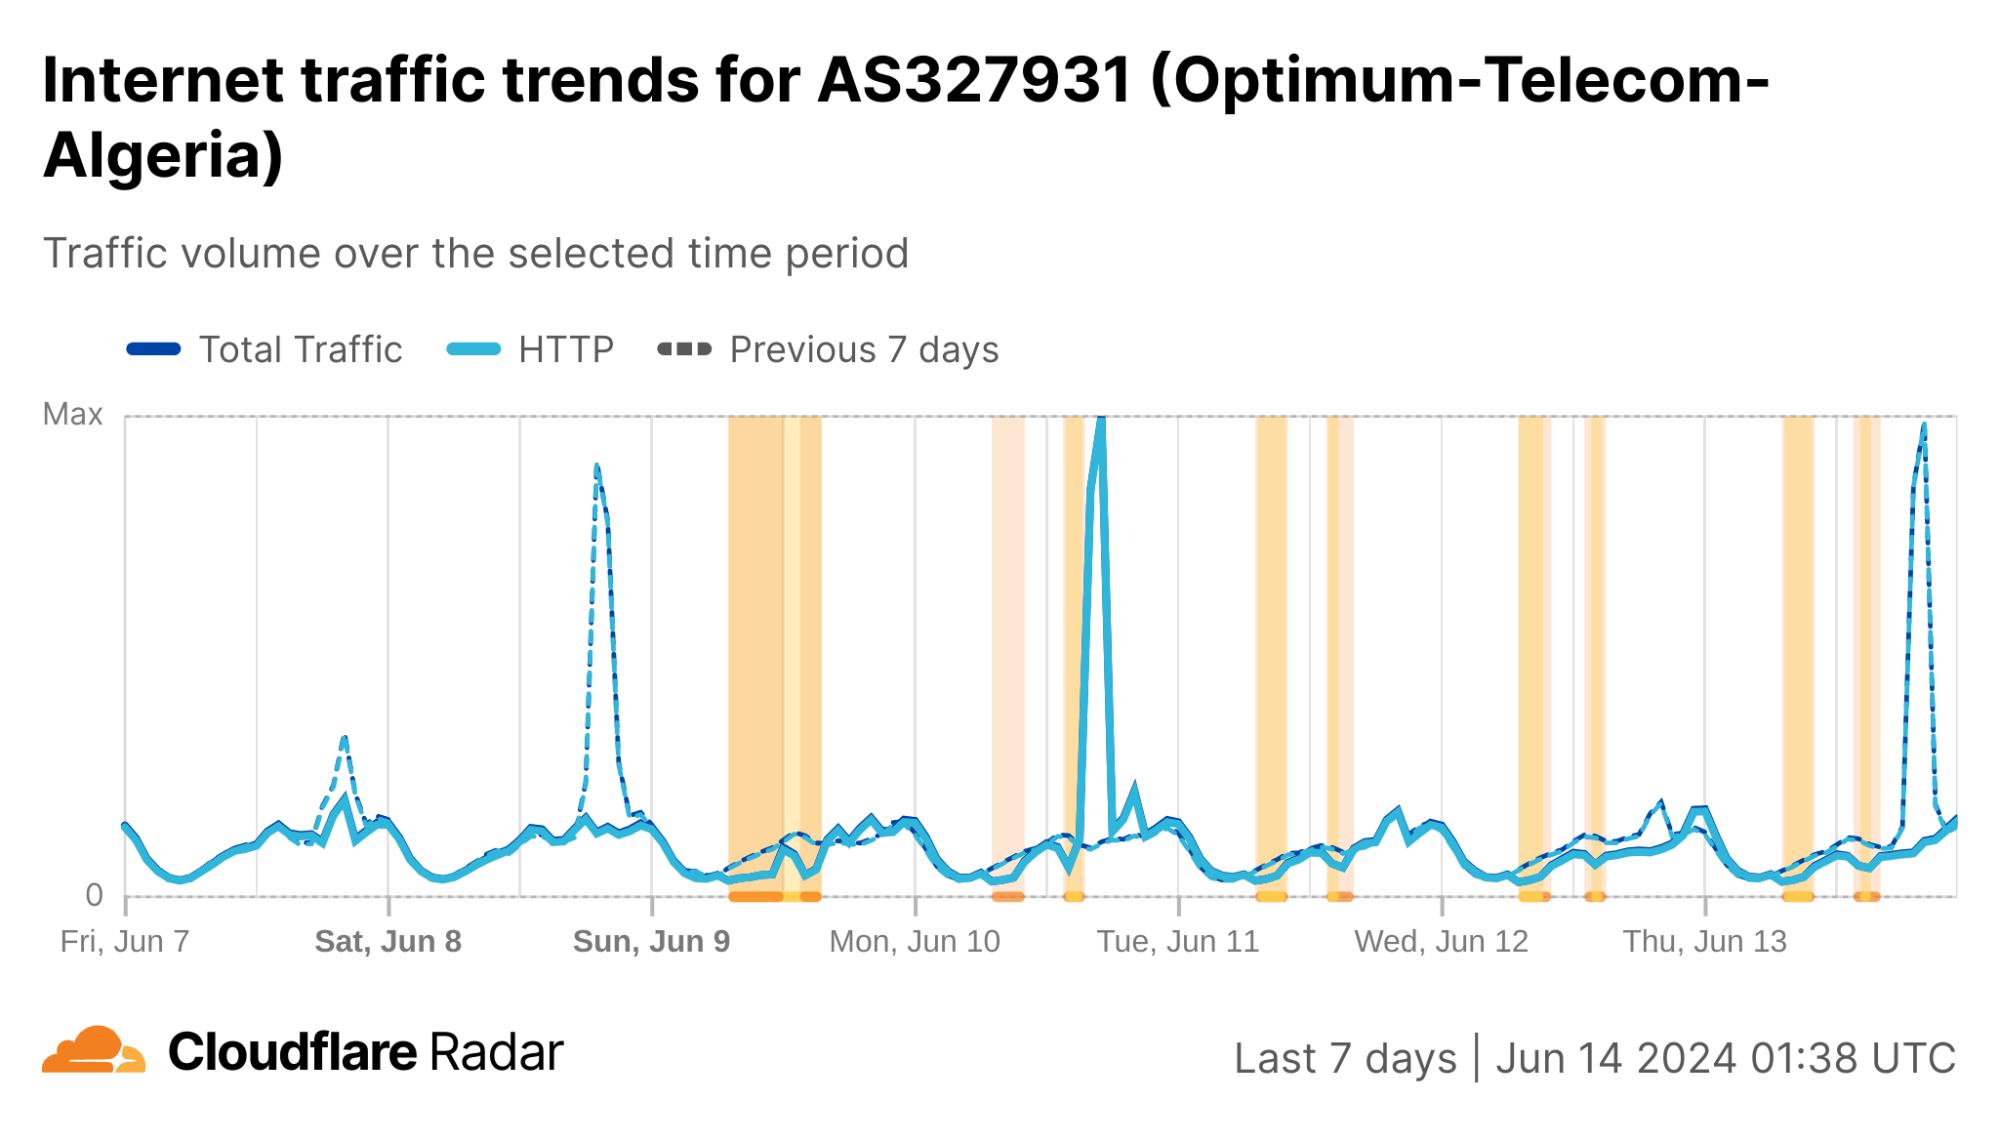
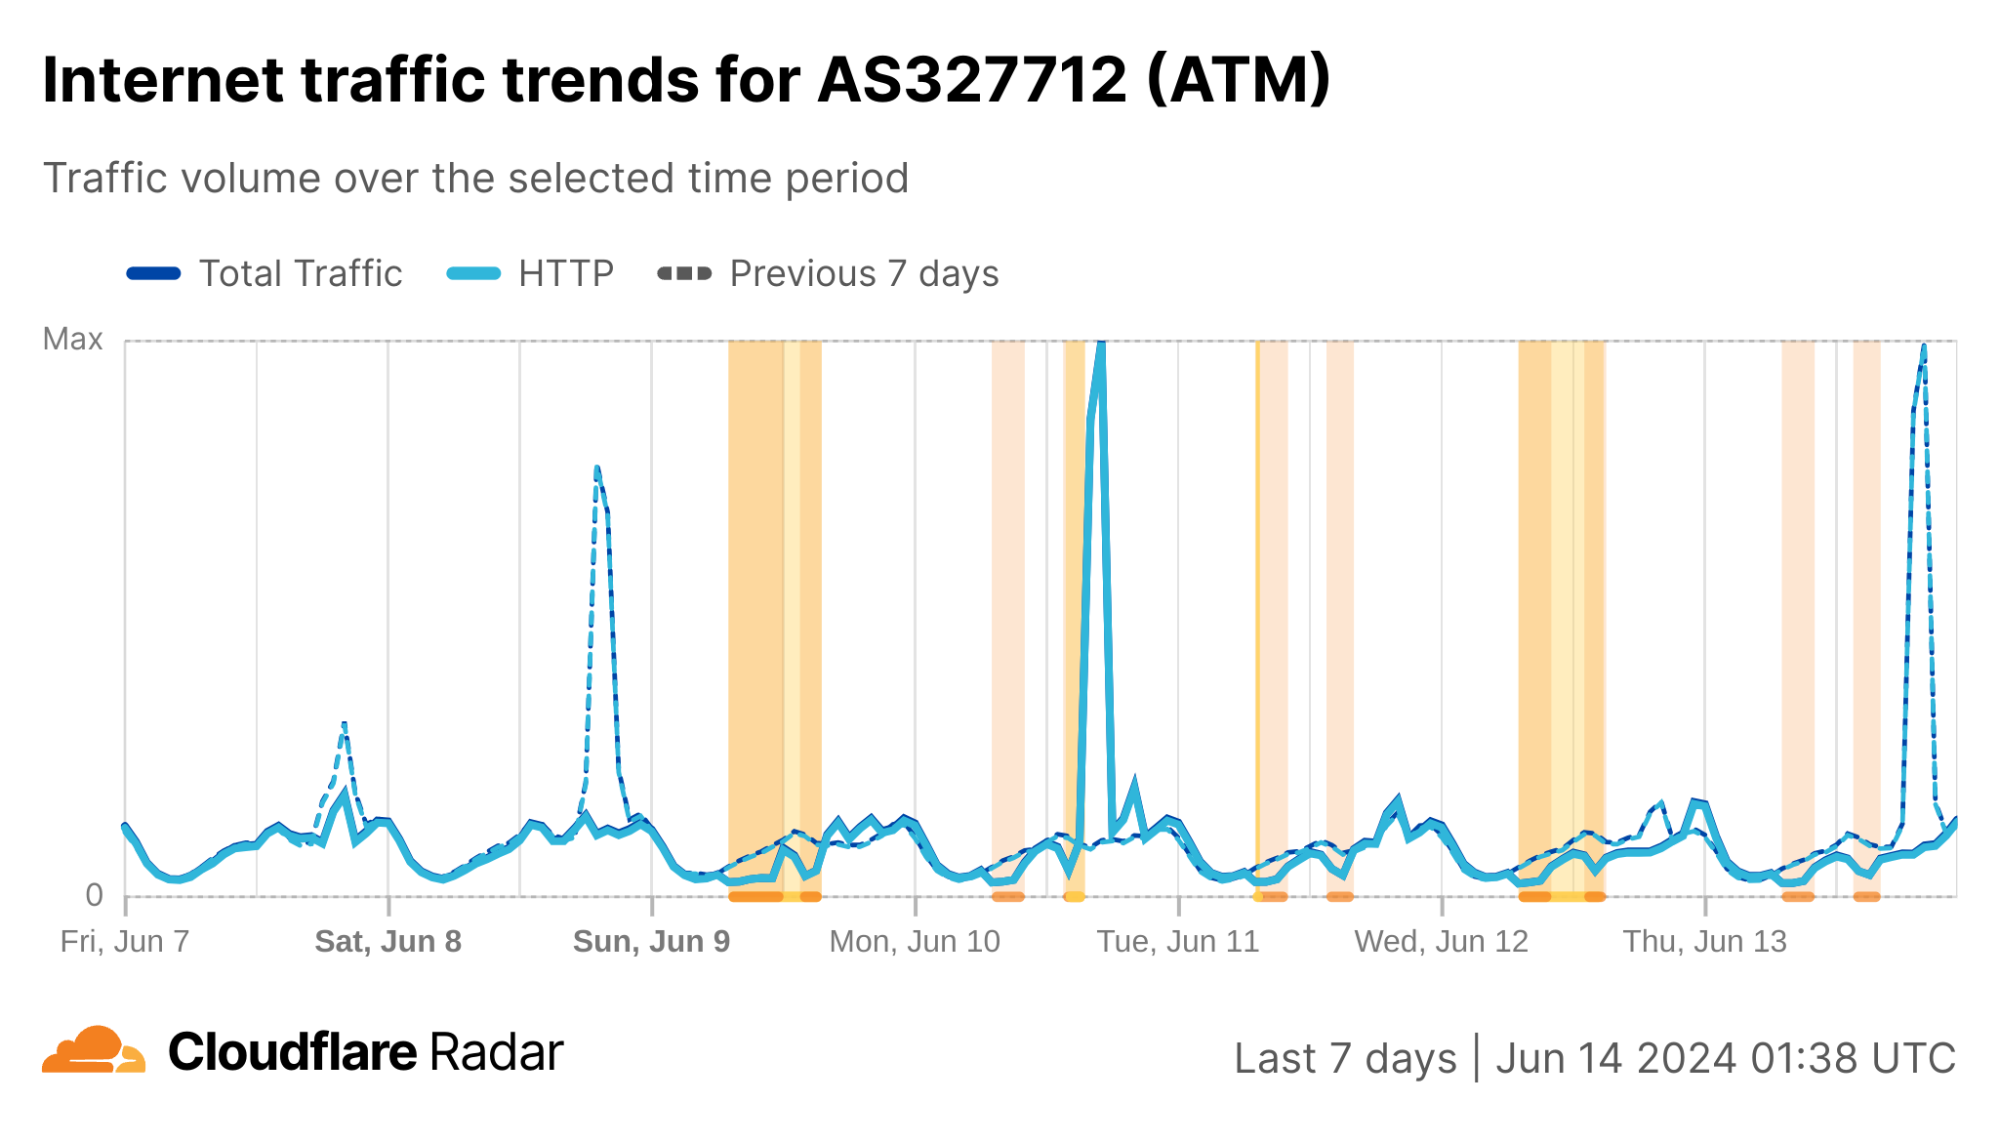
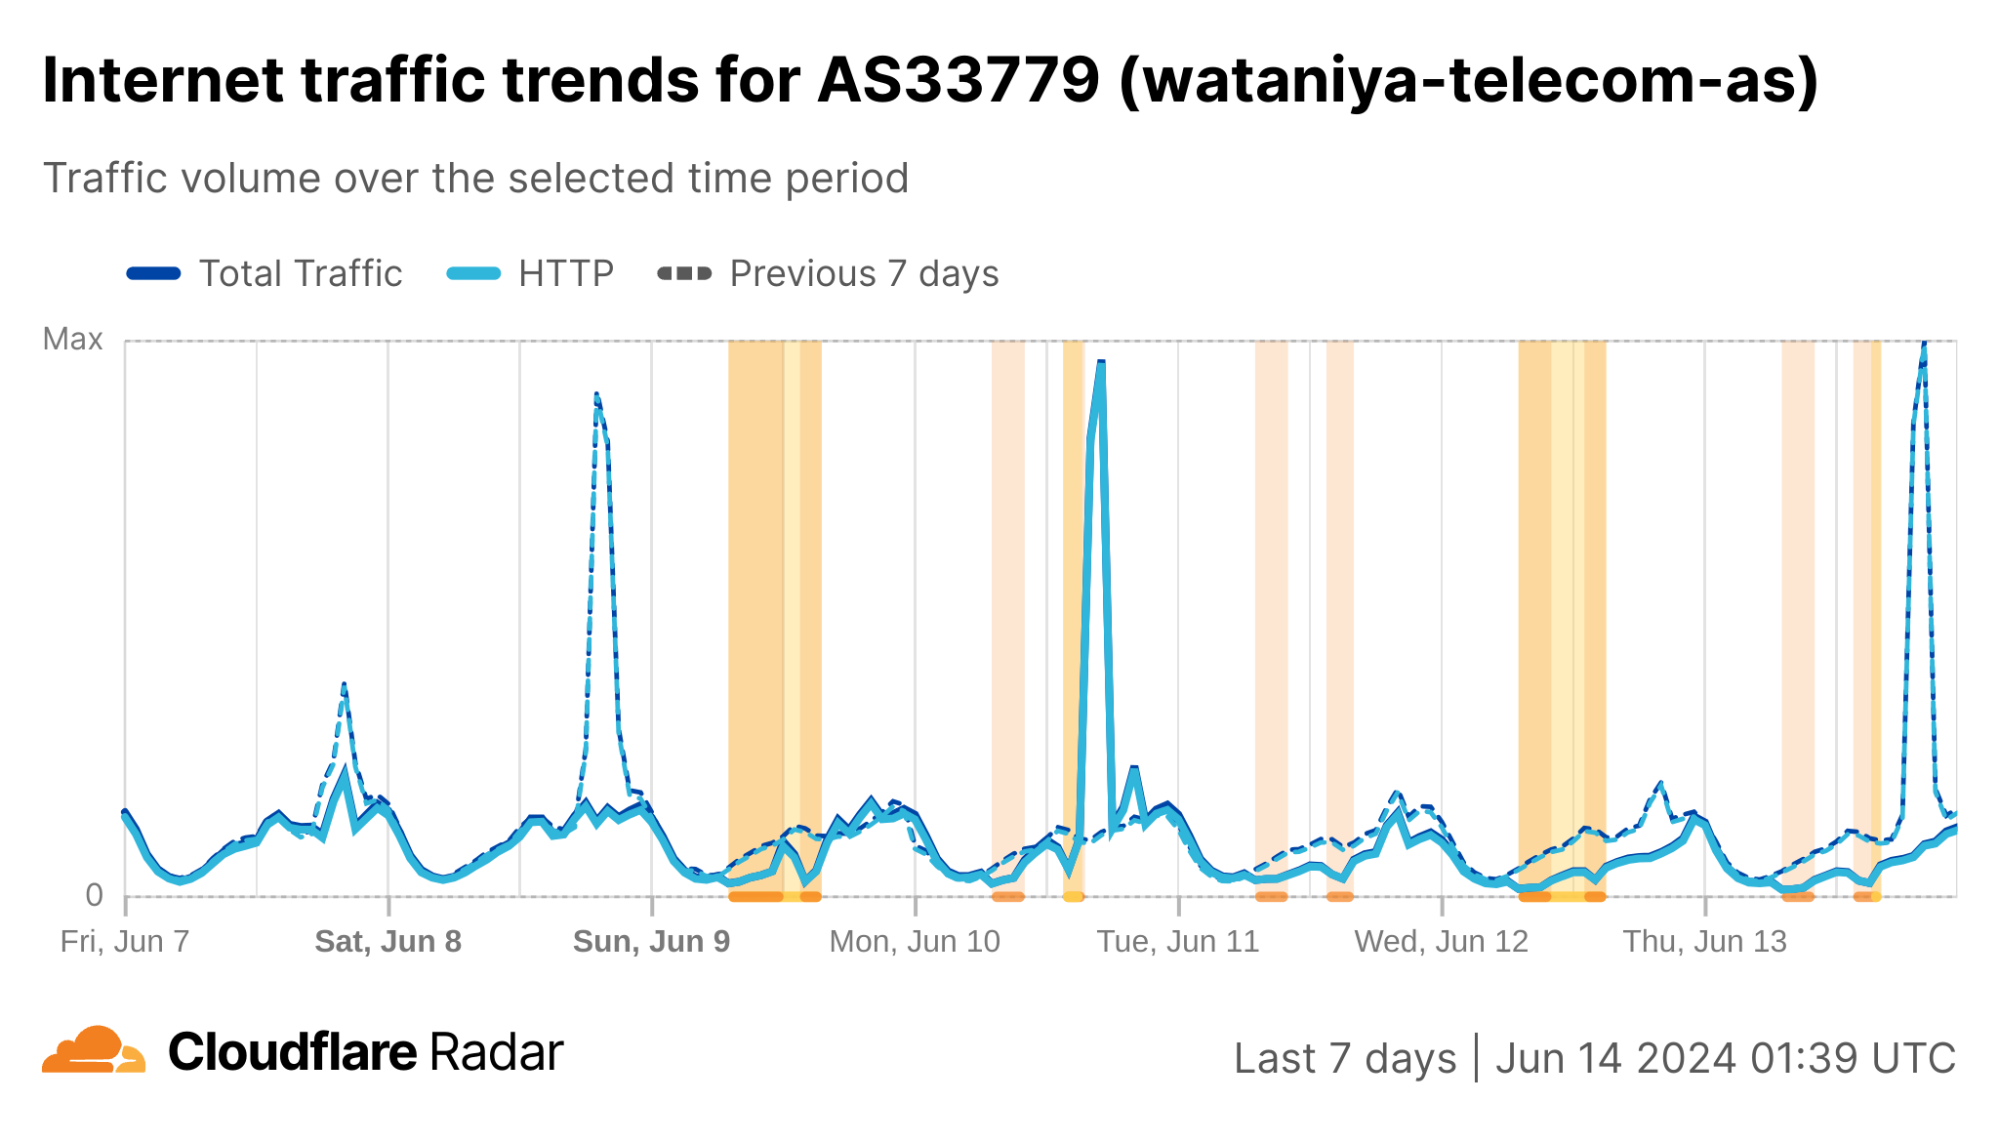
As seen in the graphs below, the impact to traffic was fairly nominal, suggesting that wide scale Internet shutdowns similar to those seen in Syria were not being implemented. While this is in line with 2023’s pronouncement by the Minister of Education that there would be no Internet shutdown on exam days, a number of posts on X complained of broader cuts to Internet connectivity.
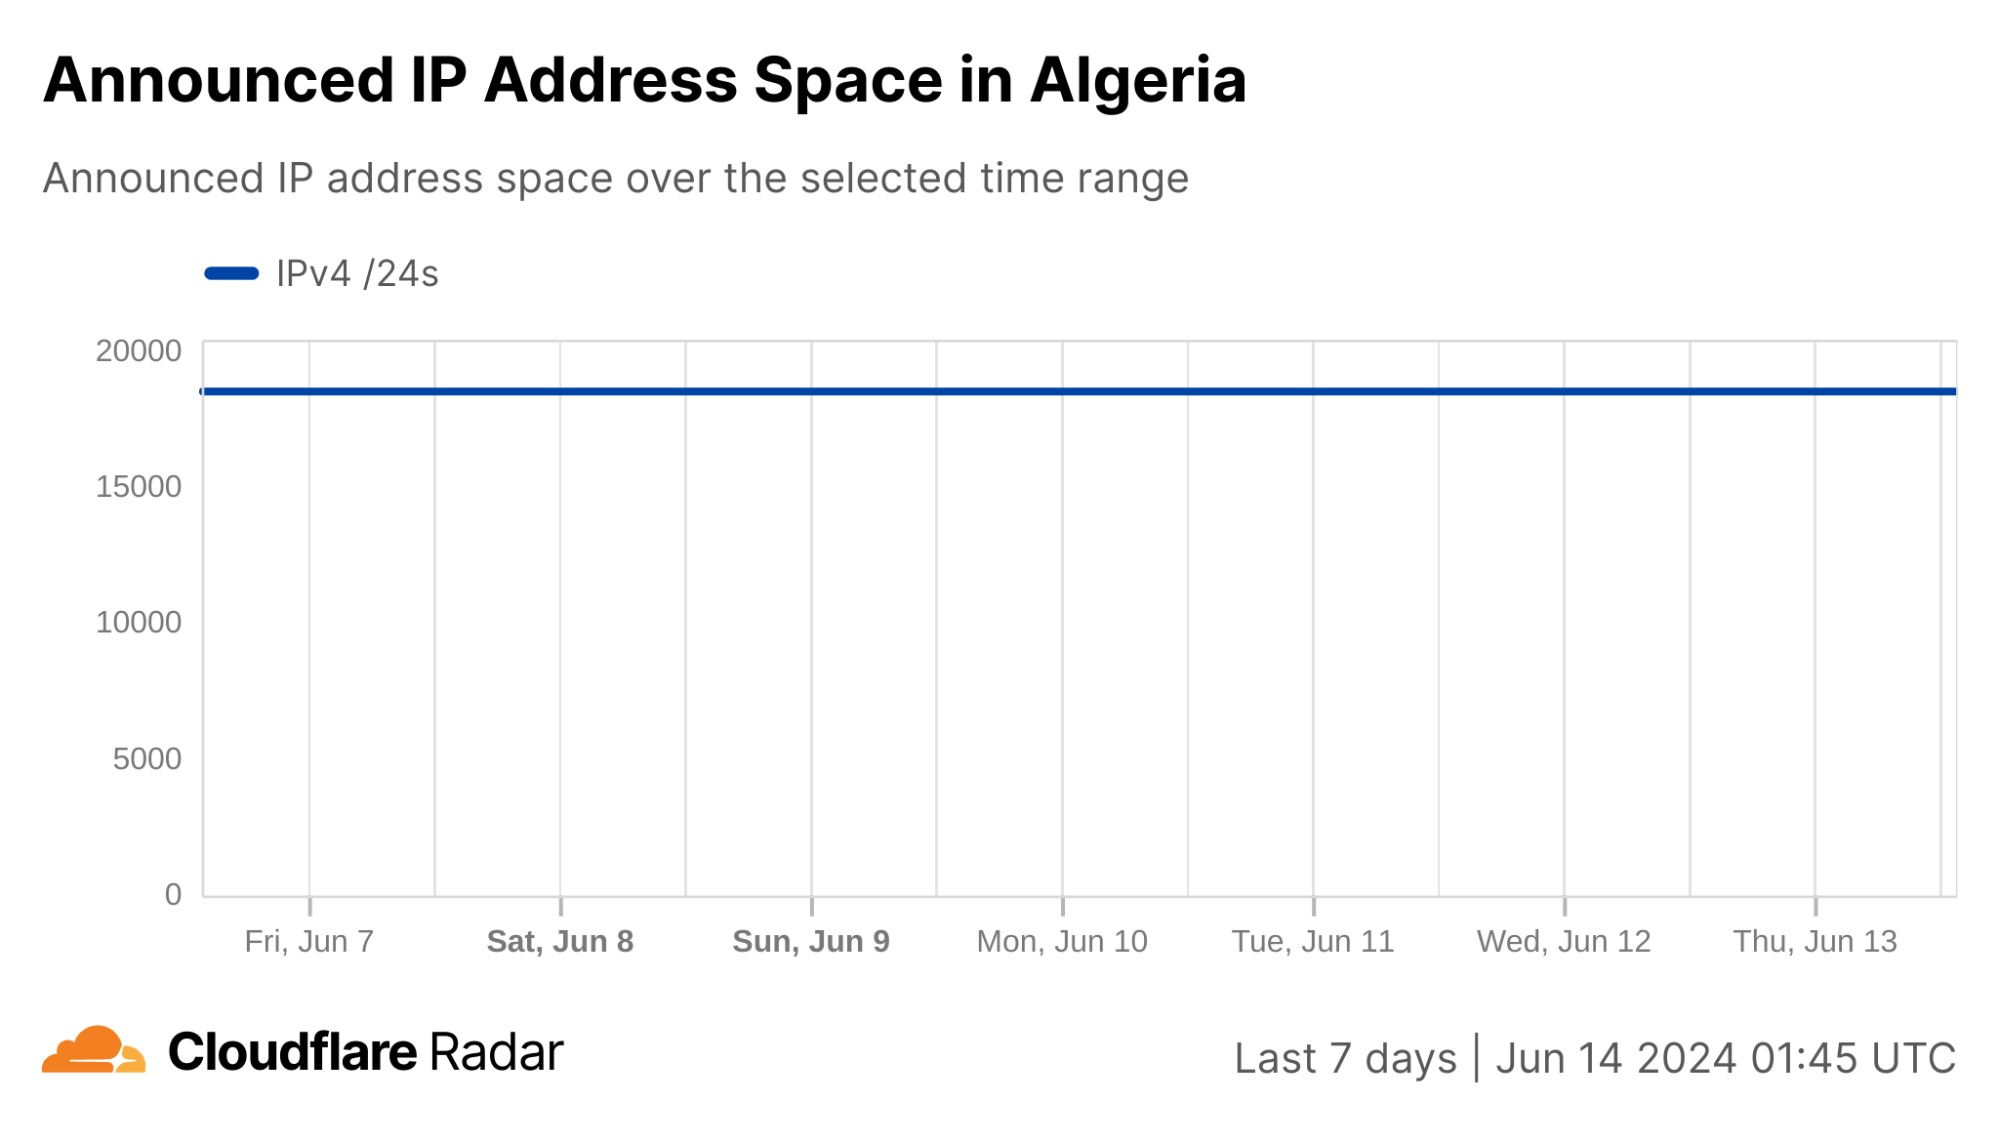
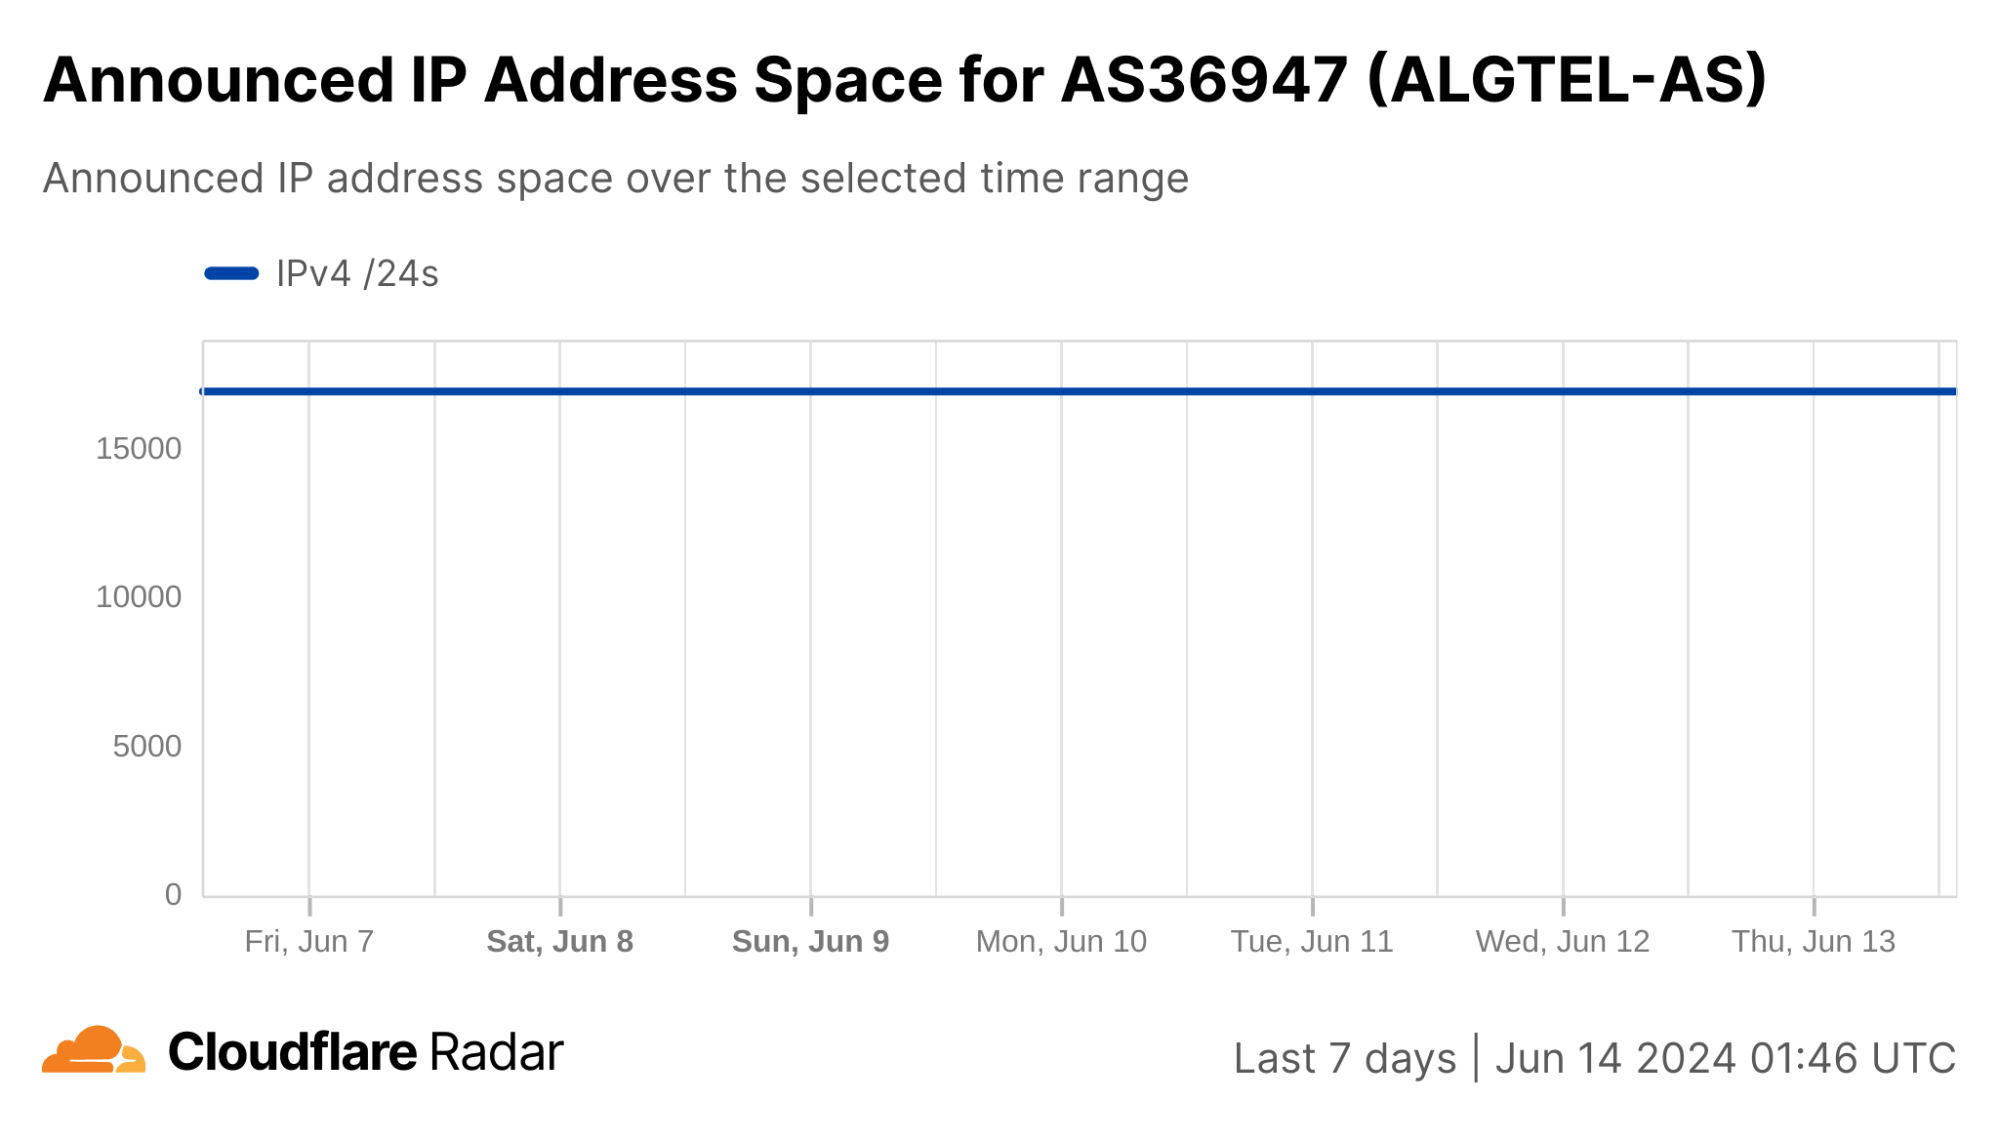
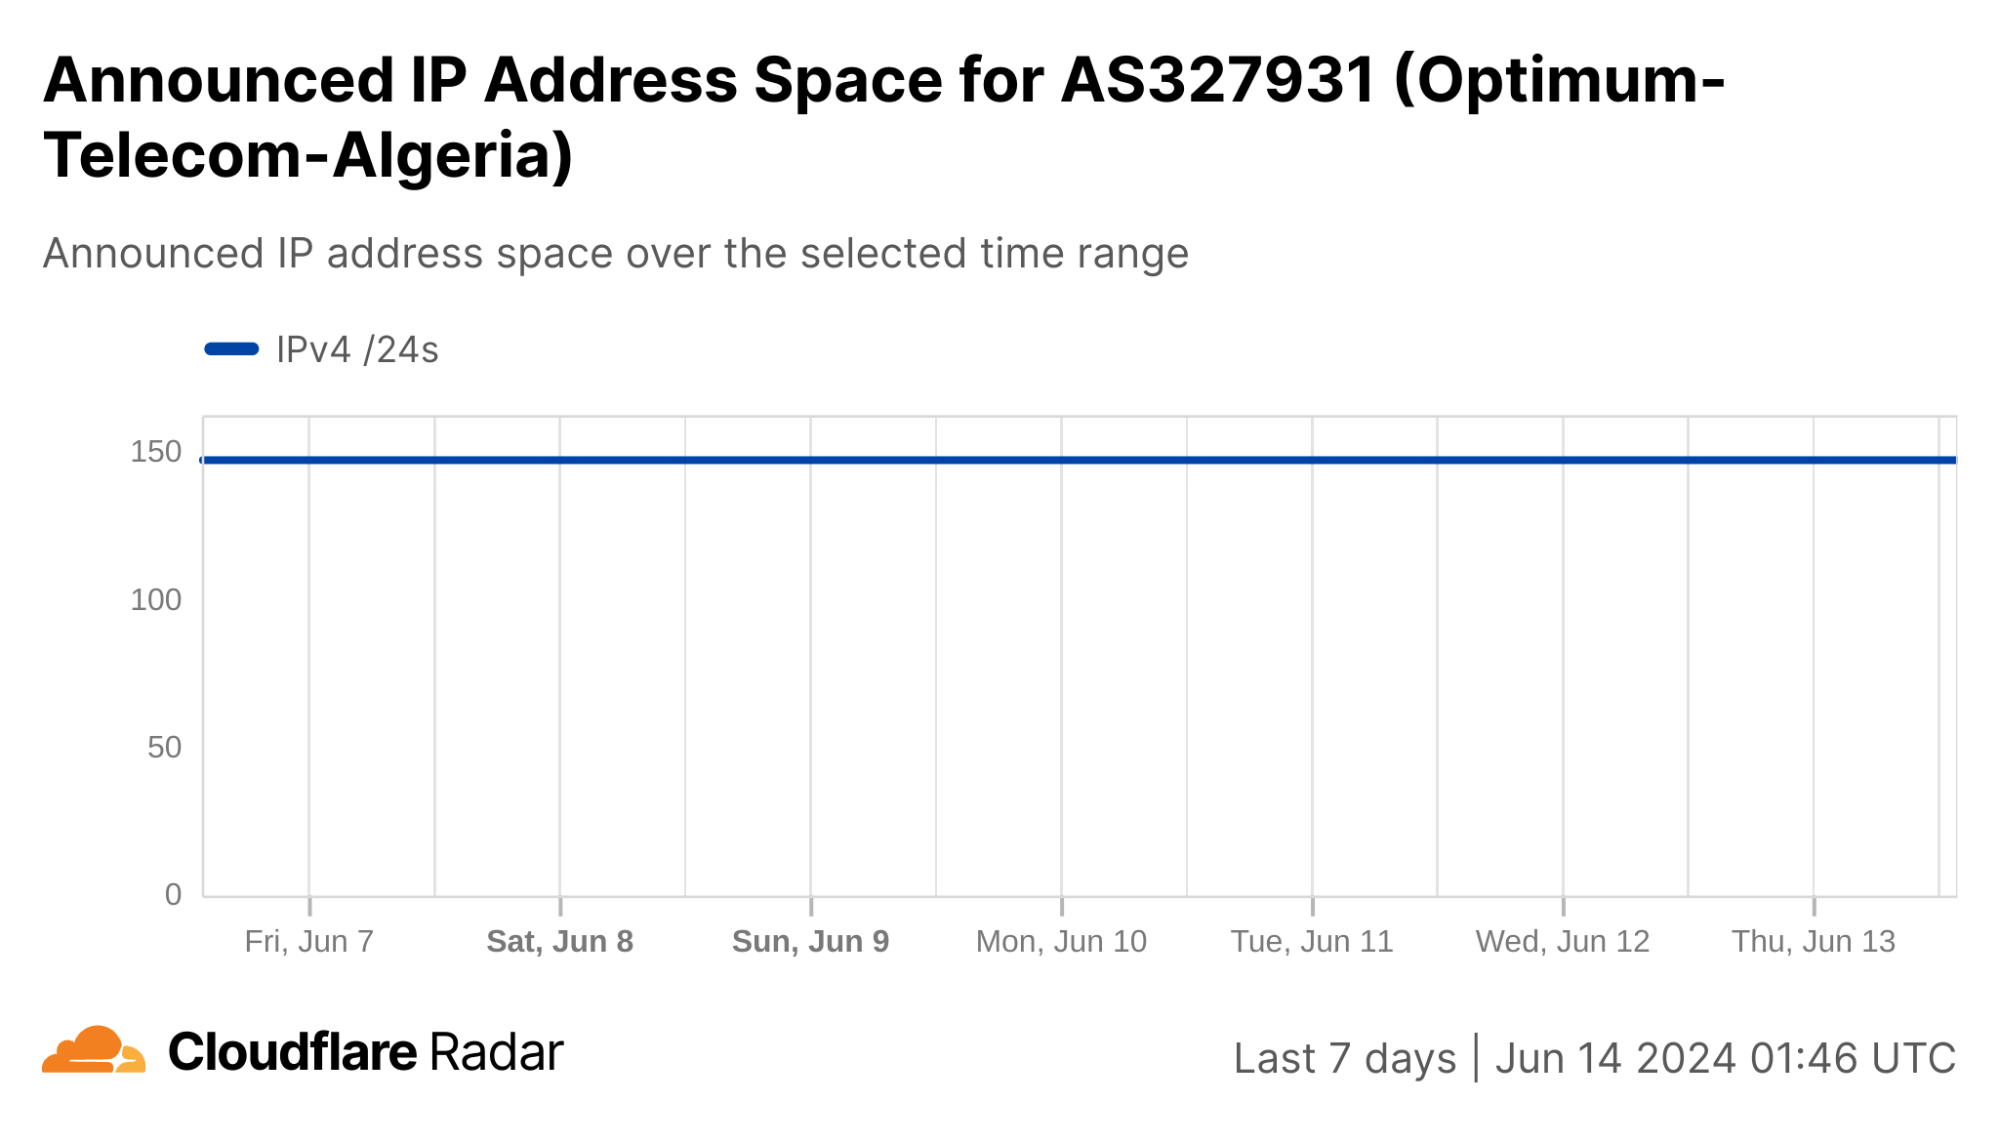
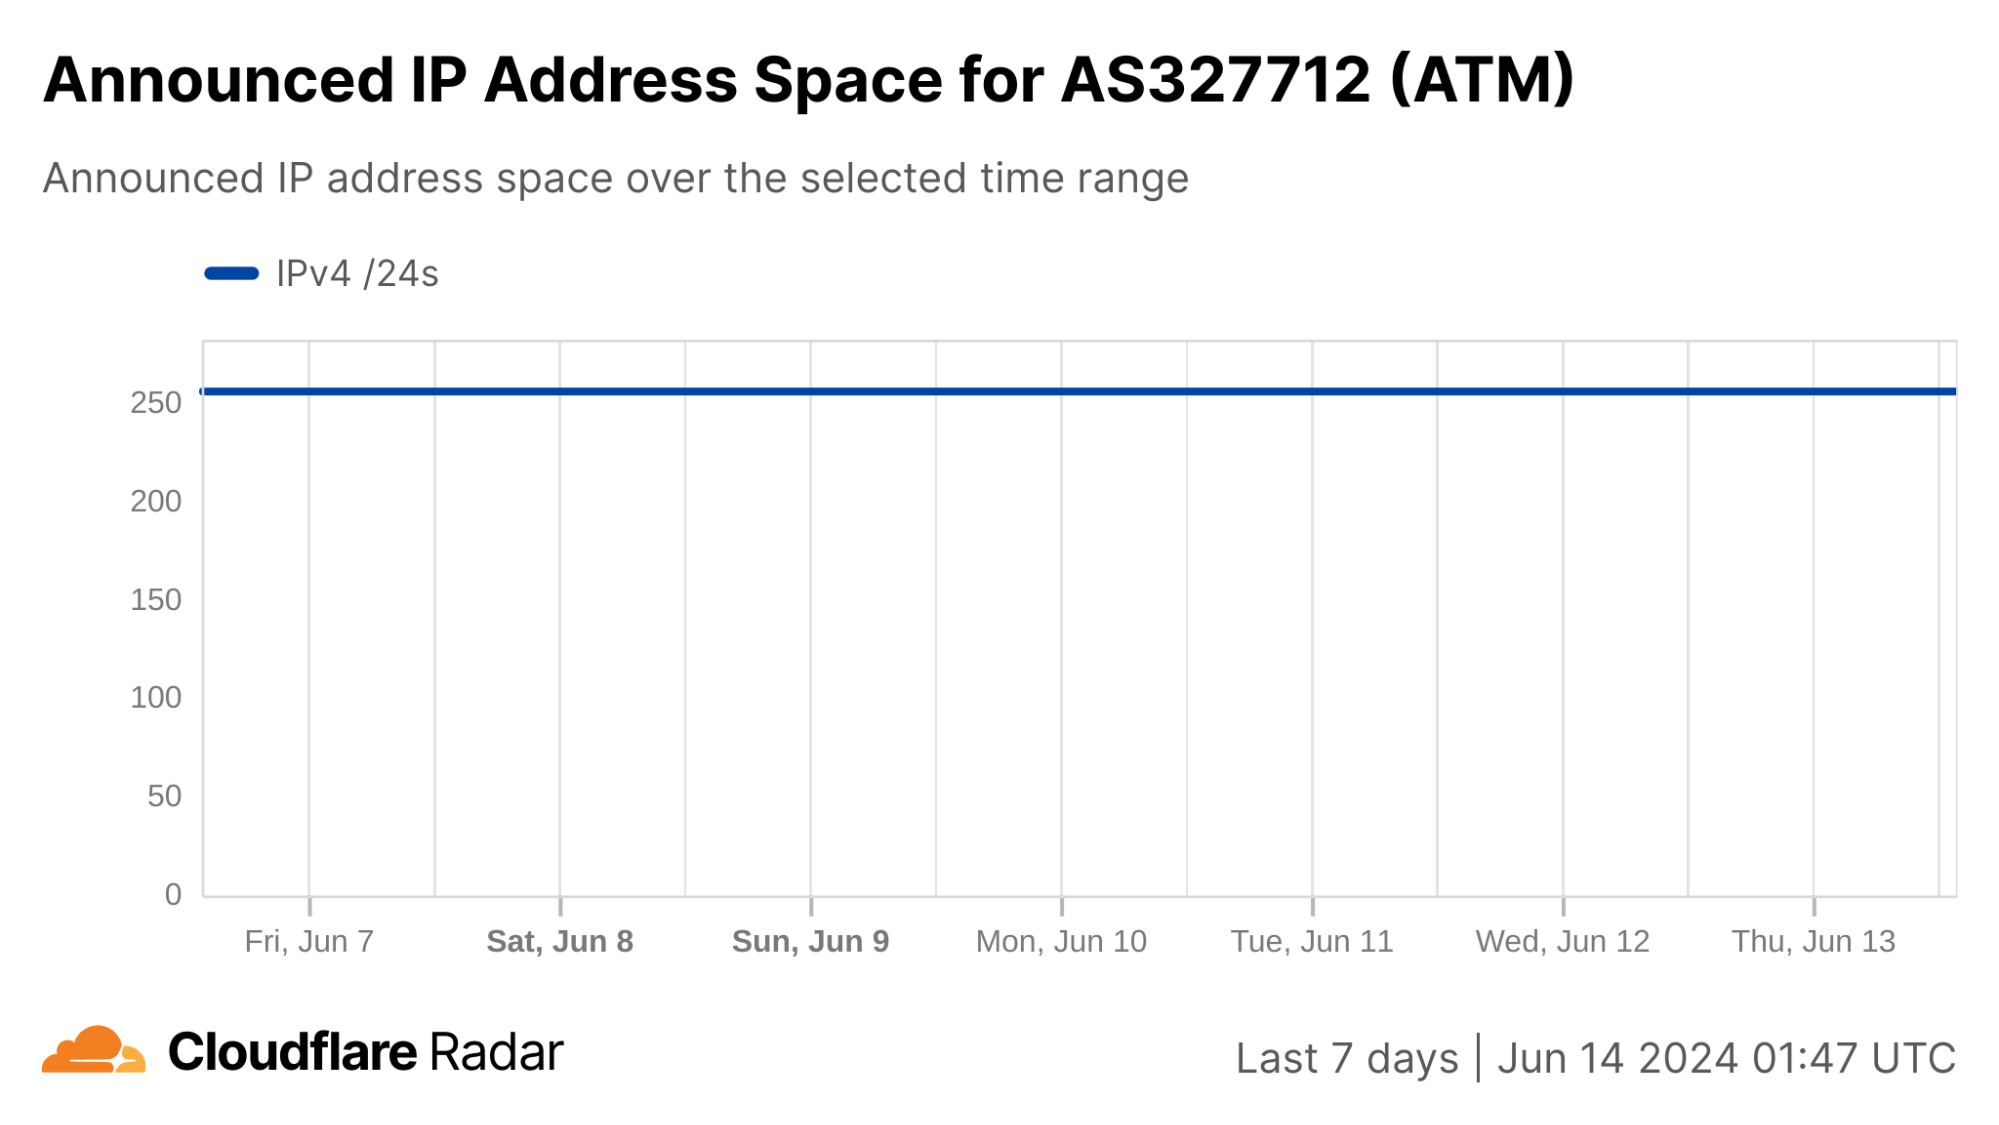
Similar to the analysis above of the shutdowns in Syria and Iraq, we can also review changes to announced IP address space to better understand how connectivity was being disrupted. In this case, as the graphs below show, no meaningful changes to announced IPv4 address space were observed during the days the Baccalaureate exams were given. As such, the observed drops in traffic were not caused by routing changes.
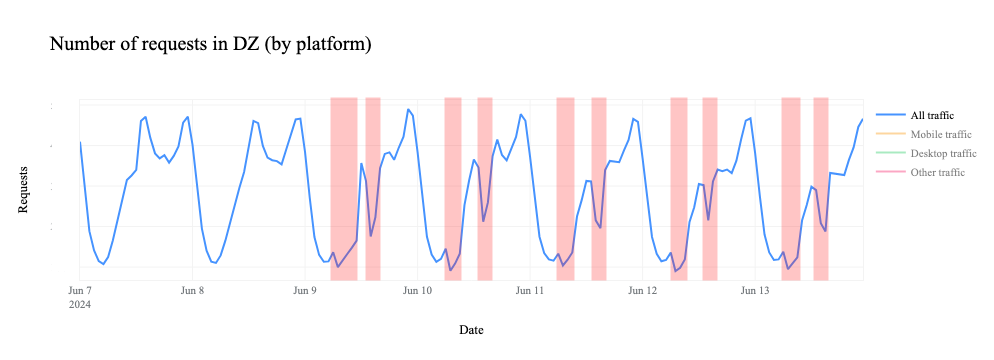
In the HTTP(S) request traffic graph below, the twice-daily disruptions are highlighted, with the morning one appearing as a nominal drop in traffic, and the afternoon one causing a more severe decline. (The graph shows request traffic aggregated at a country level, but the graphs for the ASNs listed above also show similar patterns.)
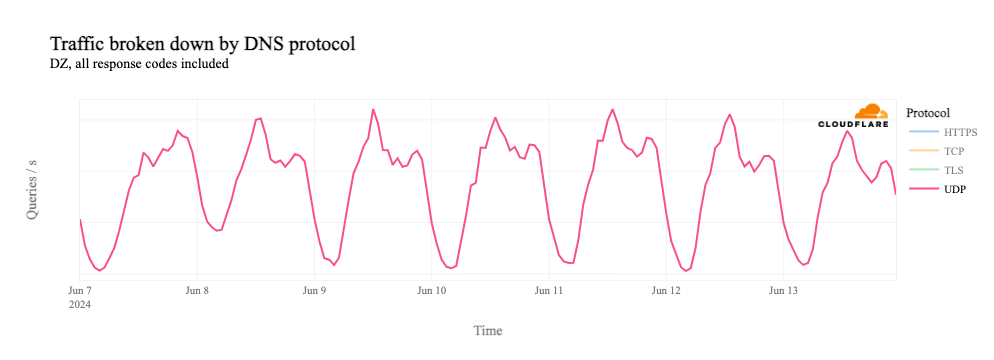
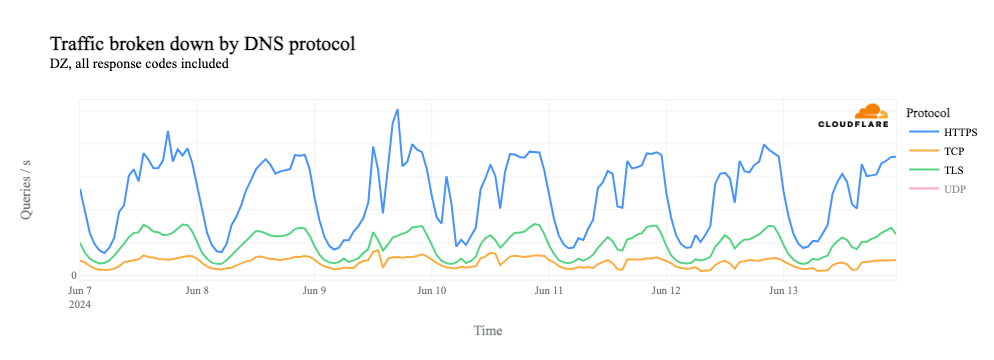
In addition, similar patterns are observed in 1.1.1.1 resolver traffic at a country and ASN level, but only for DNS over TCP, DNS over TLS, and DNS over HTTPS, all of which leverage TCP. In the graph below showing only resolver traffic over UDP, there’s no clear evidence of disruptions. However, in the graph that shows resolver traffic over HTTPS, TCP, and TLS, a slight perturbation is visible in the morning, as traffic begins to rise for the day, and a sharper decrease is visible in the afternoon, with both disruptions aligning with the twice daily drops in traffic discussed above.
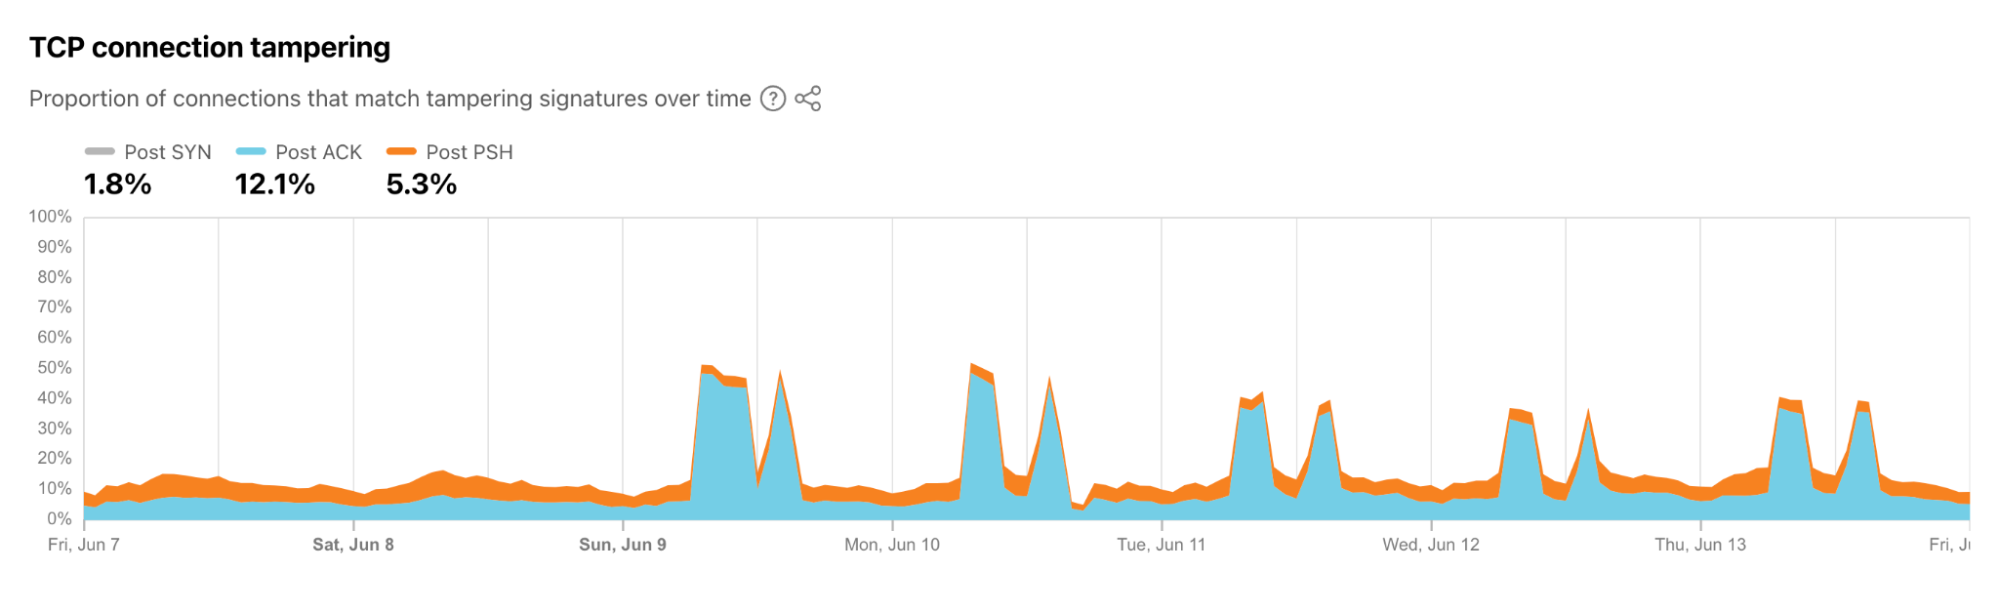
These observations support the conjecture that the Algerian government is likely taking a more nuanced approach to restricting access to content, interfering in some fashion with TCP-based traffic. The conjecture is also supported by an internal tool that helps to understand connection tampering that is based on research co-designed and developed by members of the Cloudflare Research team. We will be launching insights into TCP connection tampering on Cloudflare Radar later in 2024 and, in the meantime, technical details can be found in the peer-reviewed paper titled Global, Passive Detection of Connection Tampering.
The graph below, taken from the internal tool, highlights observed TCP connection tampering in connections from Algeria during the week that the Baccalaureate exams took place. While some baseline level of post-ACK and post-PSH tampering is consistently visible, we see significant increases in post-ACK twice a day during the exam period, at the times that align with the shifts in traffic discussed above. Technical descriptions of post-ACK and post-PSH tampering can be found in the Cloudflare Radar glossary, but in short, tampering post-ACK means an established TCP connection to Cloudflare’s server has been abruptly ended by one or more RST packets before the server sees data packets. Although clients do use RSTs, clients are more likely to close connections with a FIN (as specified by the RFC). The RST method can also be used by middleboxes that (i) sees the data packet, then (ii) drops the data packet, then (iii) sends an RST to the server to force the server to close the connection (and very likely another RST to the client too for the same reason). Tampering post-PSH means that something on the path, like a middlebox, (i) saw something it didn’t like on an established connection, then (ii) permitted the data to pass but then, (iii) it sends the RST to force endpoints to close the connection.
Looking beyond Cloudflare-sourced data, aggregated test results from the Open Observatory of Network Interference (OONI) also show evidence of anomalous behavior. Using OONI Probe, a mobile and desktop app, can probe for potential blocking of websites, instant messaging apps, and censorship circumvention tools. Examining test results from users in Algeria for popular messaging platforms WhatsApp, Telegram, Signal, and Facebook Messenger for the first two weeks of June, we clearly see the appearance of test results marked as “Anomaly” starting on June 9. (OONI defines “Anomaly” results as “Measurements that provided signs of potential blocking”.) OONI Tor testresults also show a similar “Anomaly” pattern. Anomalous traffic patterns are also visible for Google Web Search, YouTube, and GMail.
Although the analysis of these observations and data sets doesn’t provide us with specific details around exactly how the observed Internet disruptions are being implemented, it strongly supports the supposition that network providers in Algeria are, in some fashion, interfering with TCP connections, but not blocking them outright nor shutting down their networks completely. Given that popular messaging platforms, Google properties, Cloudflare’s 1.1.1.1 DNS resolver, and some number of Cloudflare customer sites all appear to be impacted, it suggests that a list of hostnames are being targeted for disruption/interference, either by the SNI or the destination IP address.
Conclusion
Perhaps recognizing the broad negative impact that brute-force nationwide Internet shutdowns have as a response to cheating on exams, some governments appear to be turning to more nuanced techniques, such as content blocking or connection tampering. However, because these are widely applied as well, they are arguably just as disruptive as a full nationwide Internet shutdown. The cause of full shutdowns, such as those seen in Syria, are arguably easier to diagnose than the disruptions to connectivity seen in Iraq and Algeria, which appear to use approaches that are hard to specifically identify from the outside.
On Sunday, May 12, issues with the ESSAy and Seacom submarine cables again disrupted connectivity to East Africa, impacting a number of countries previously affected by a set of cable cuts that occurred nearly three months earlier.
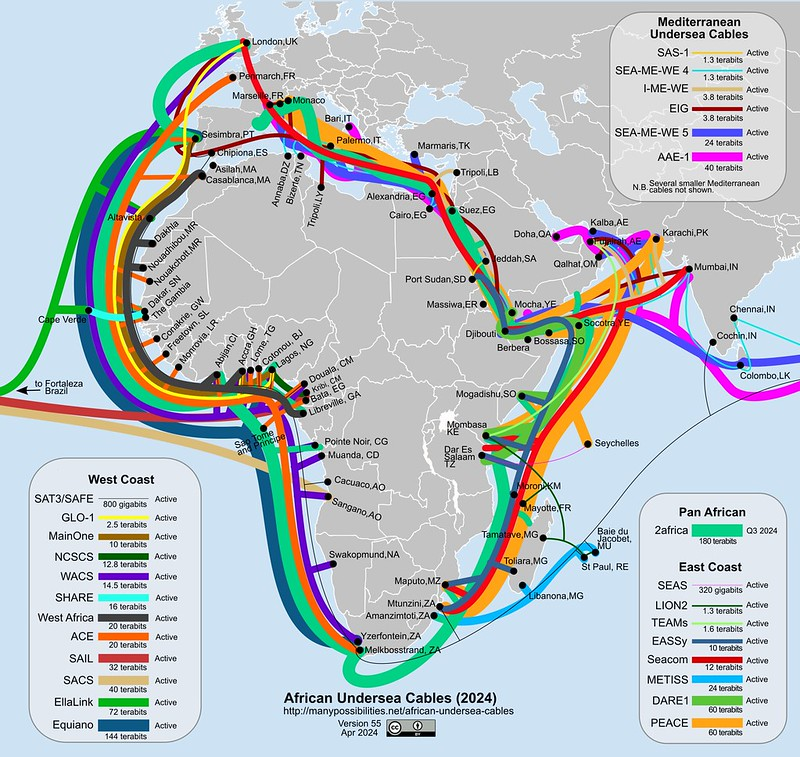
Already suffering from reduced capacity due to the February cable cuts, these countries were impacted by a second set of cable cuts that occurred on Sunday, May 12. According to a social media post from Ben Roberts, Group CTIO at Liquid Intelligent Technologies in Kenya, faults on the EASSy and Seacom cables again disrupted connectivity to East Africa, as he noted “All sub sea capacity between East Africa and South Africa is down.” A BBC article citing Roberts stated that the EASSy cable had been cut approximately 45km (28 miles) north of the South African port city of Durban. A subsequent press release issued by the Communications Authority of Kenya stated that the cut had occurred at the Mtunzini teleport station (in South Africa). As seen in the map below, both the EASSy and Seacom cables land in Mtunzini.
Map of African undersea cables, April 2024. Source: https://manypossibilities.net/african-undersea-cables/
Impacts to country-level Internet traffic
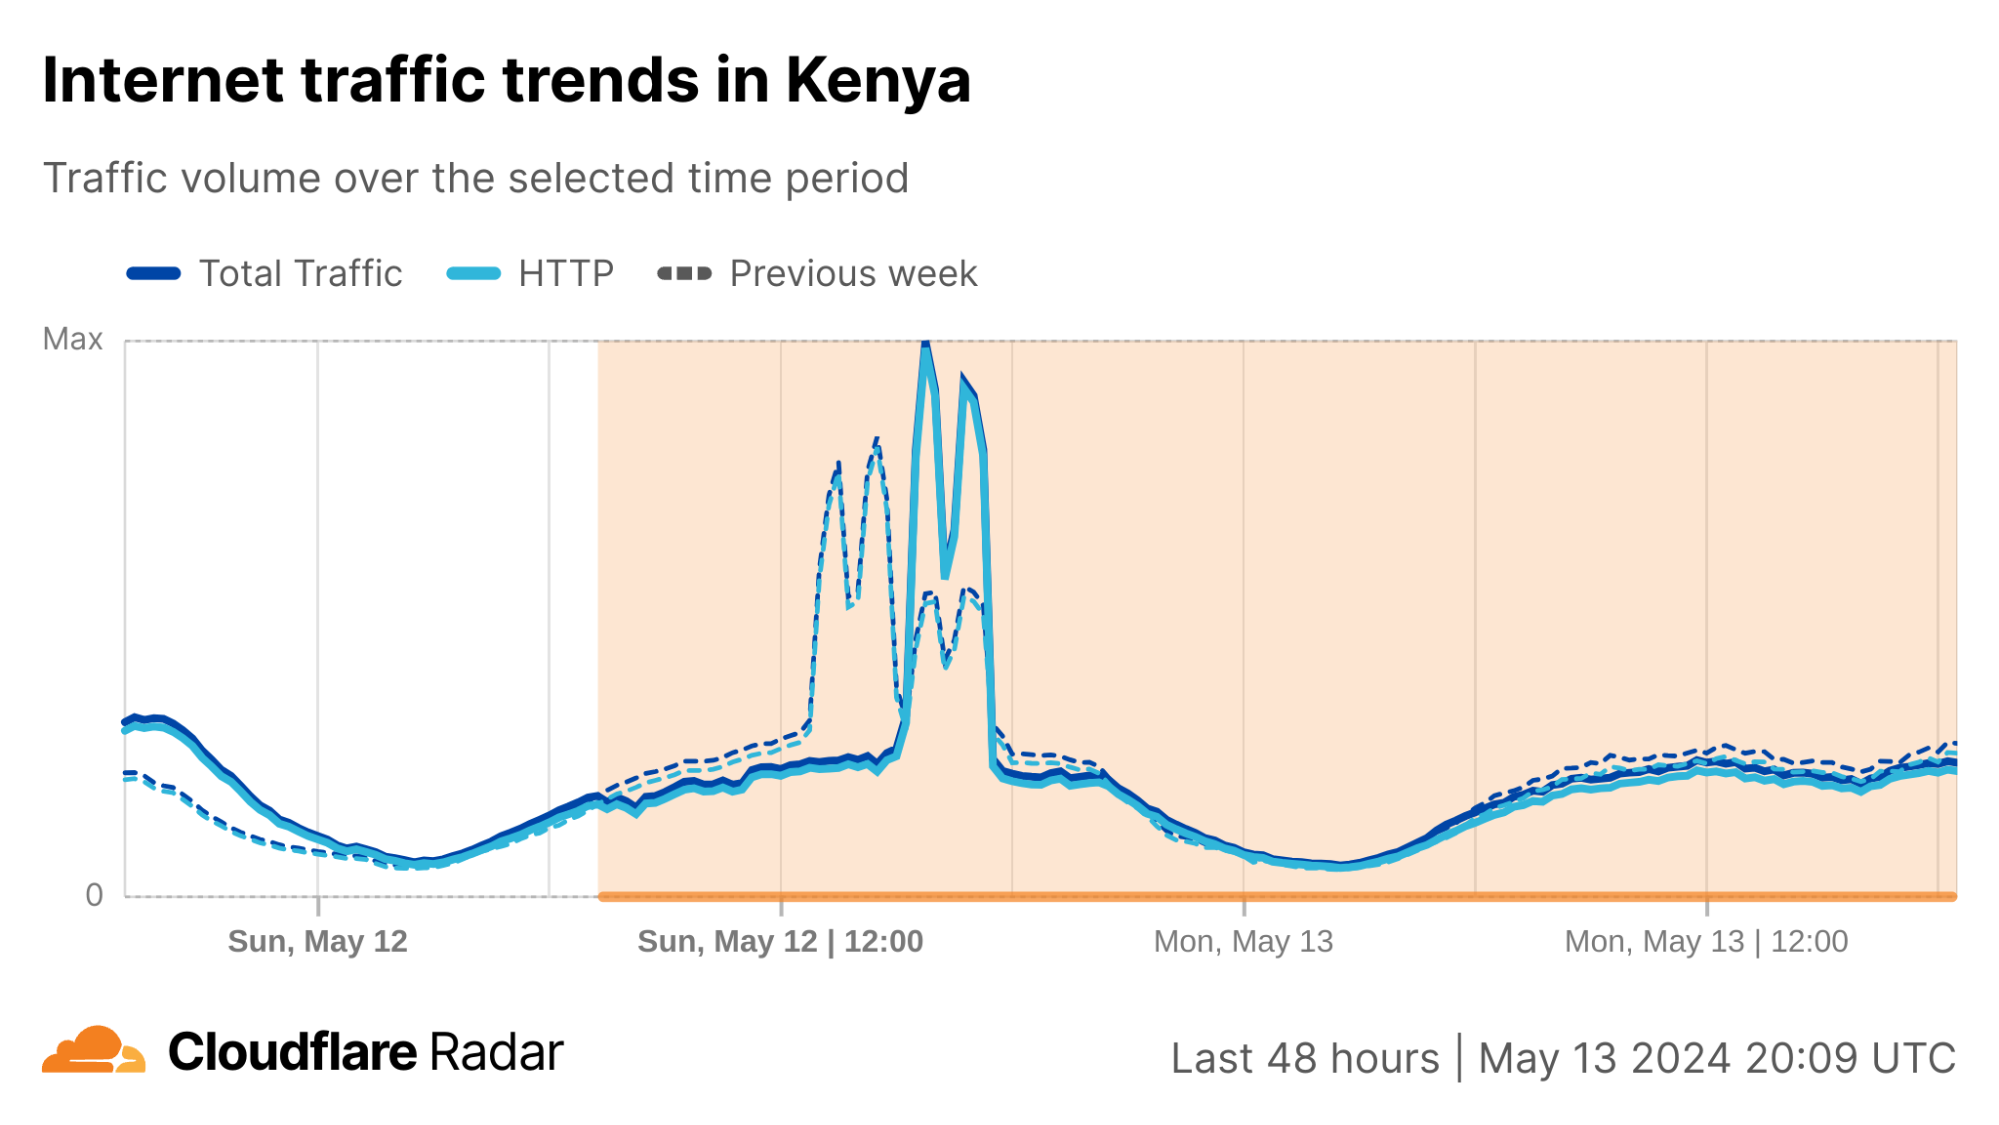
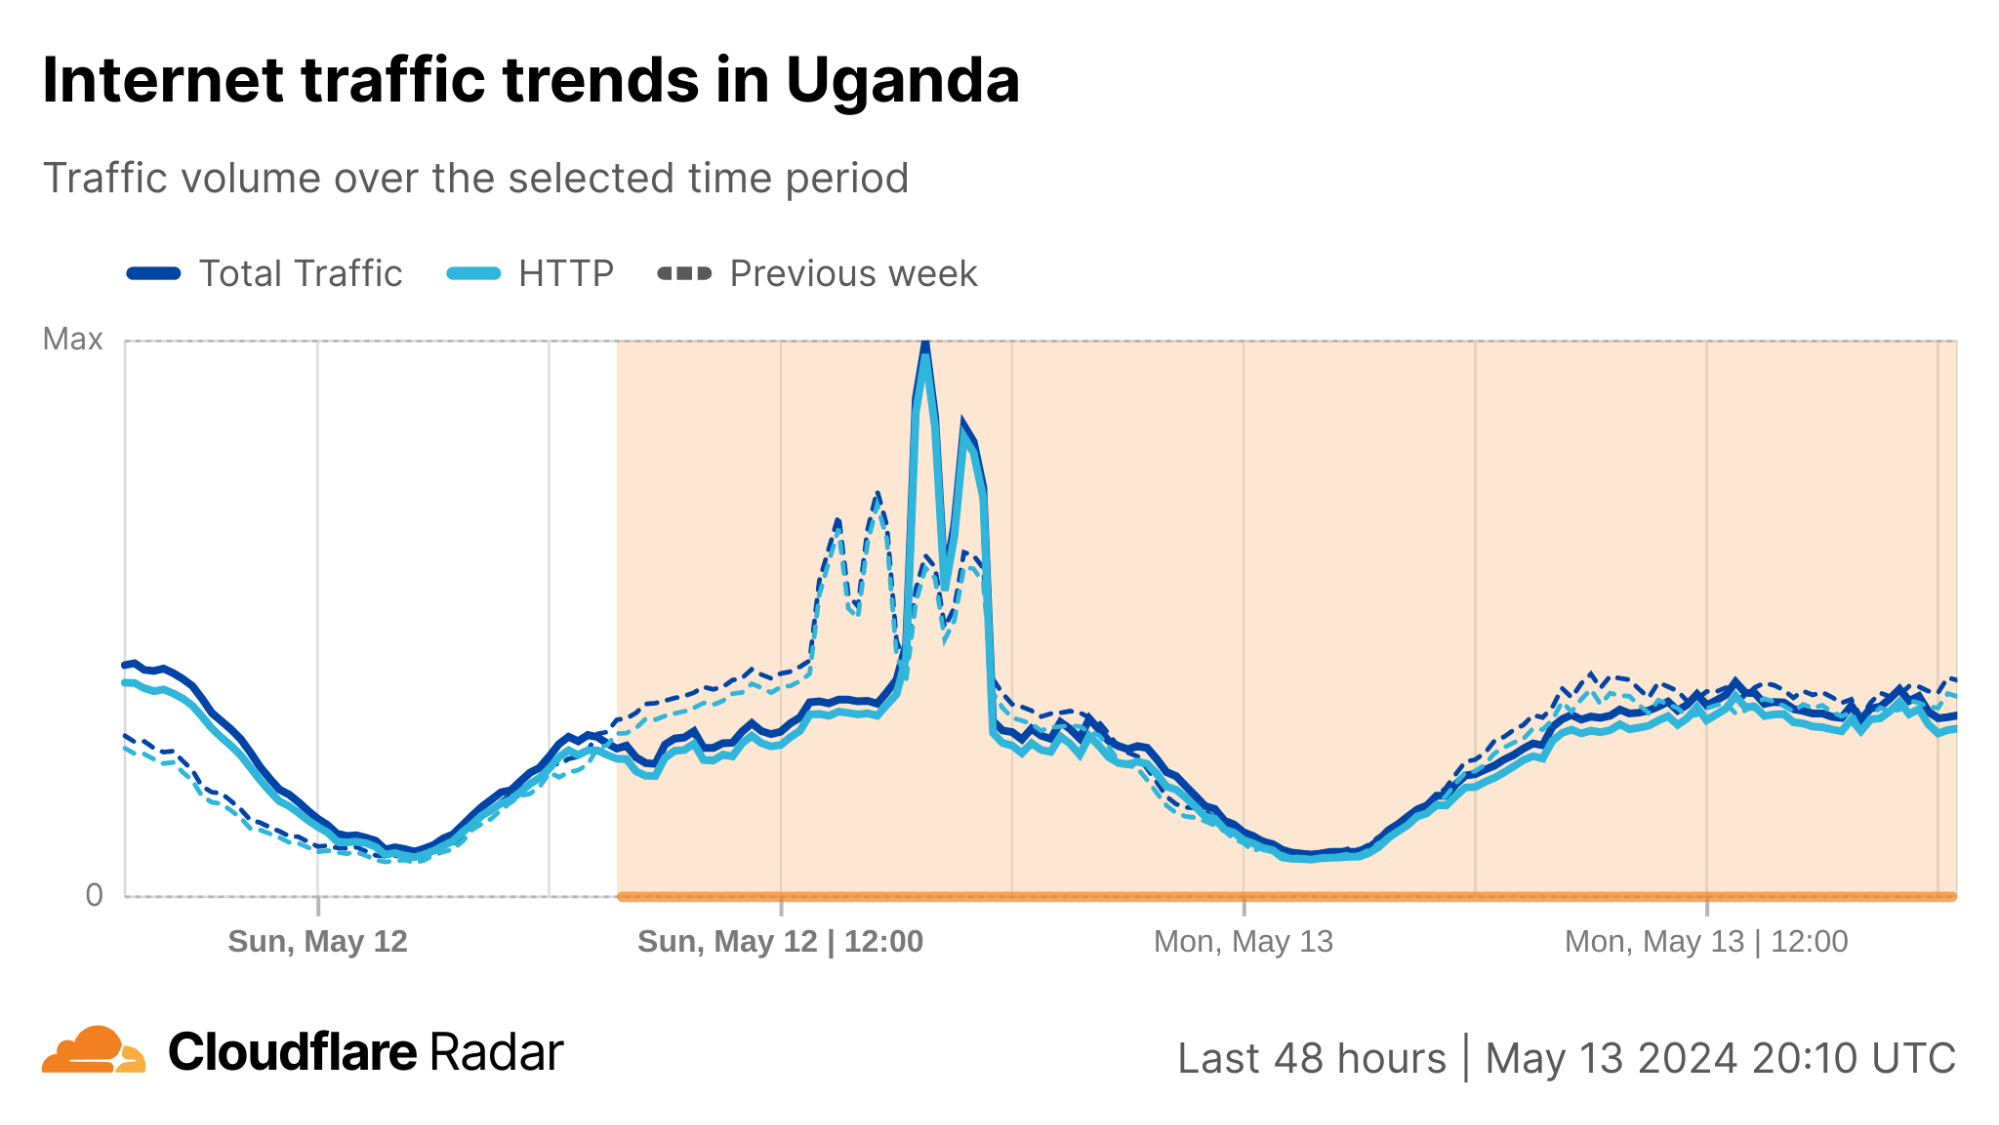
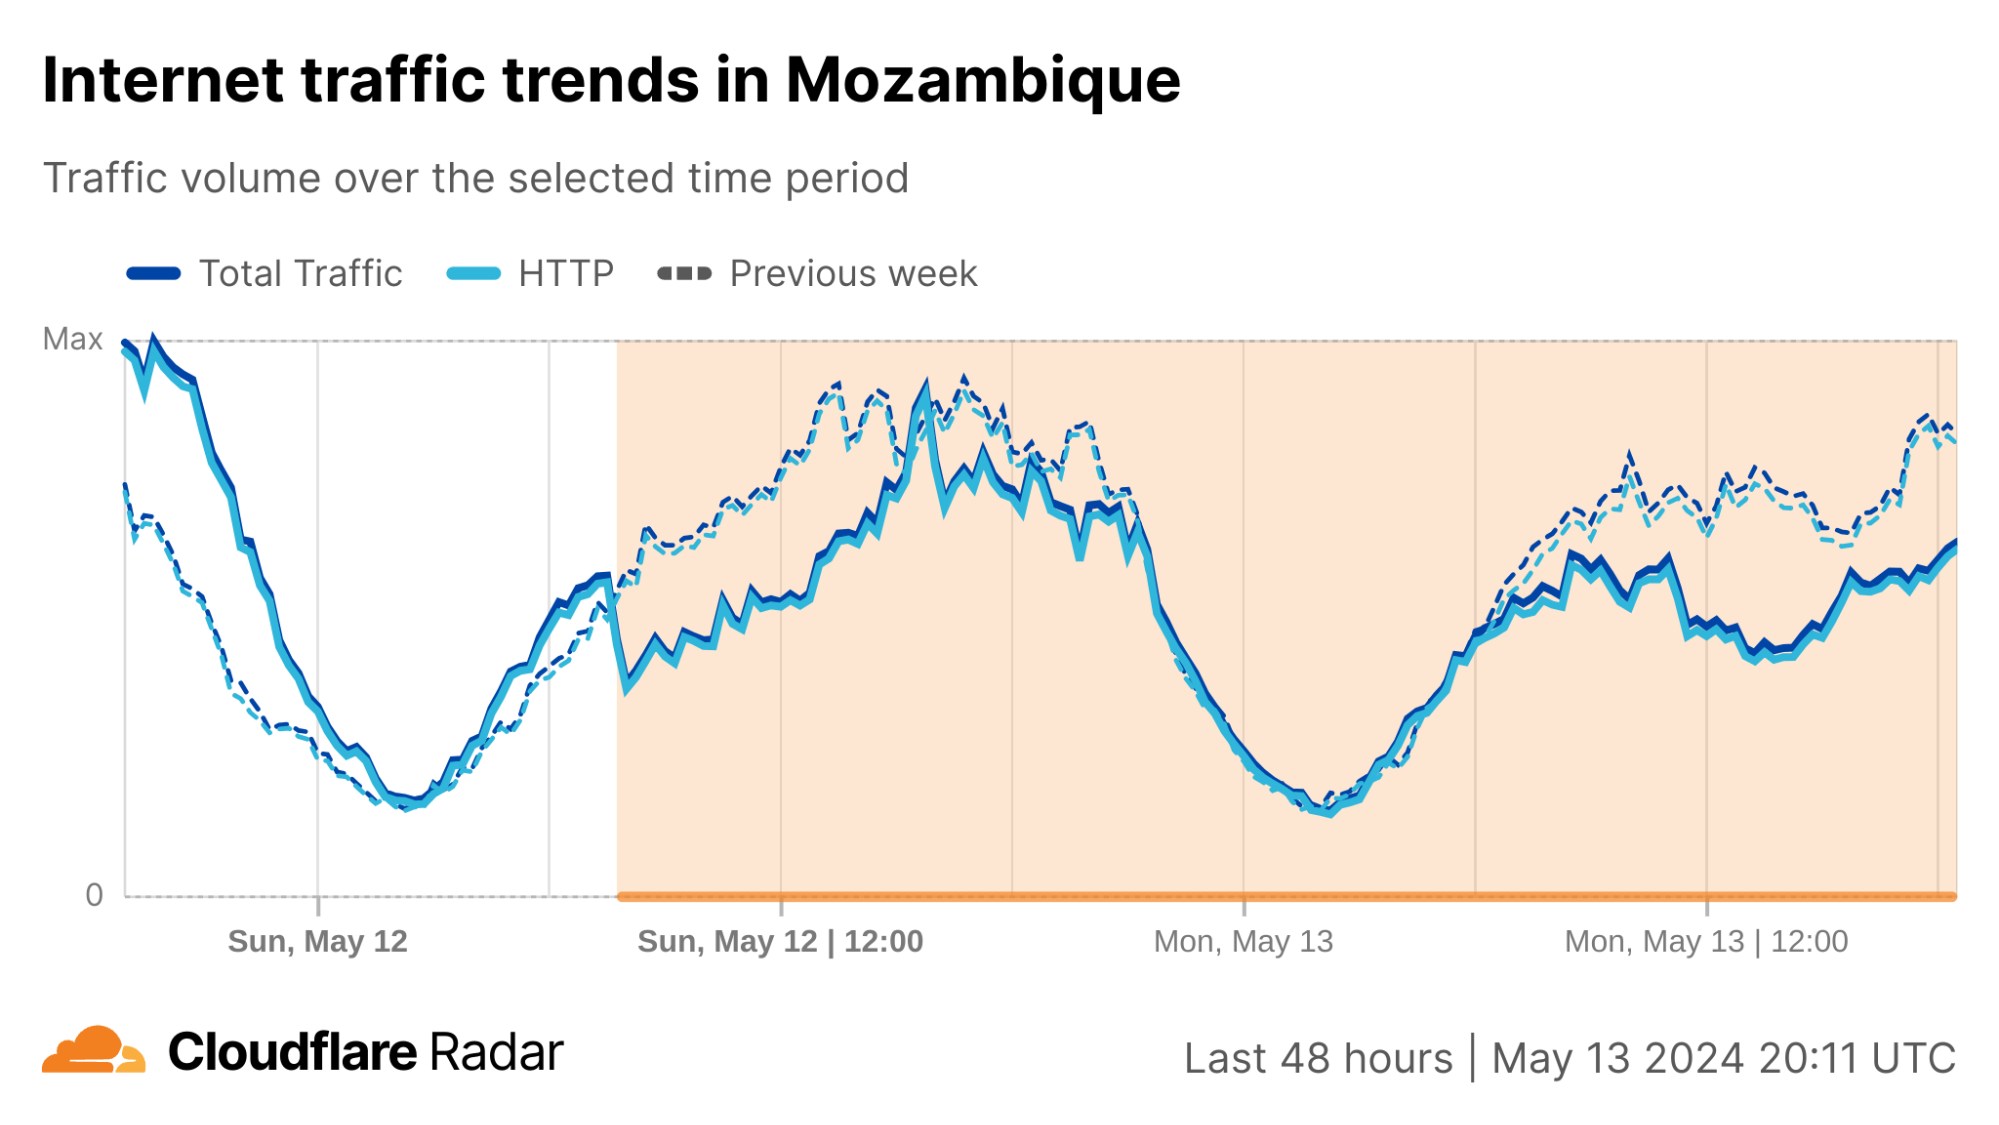
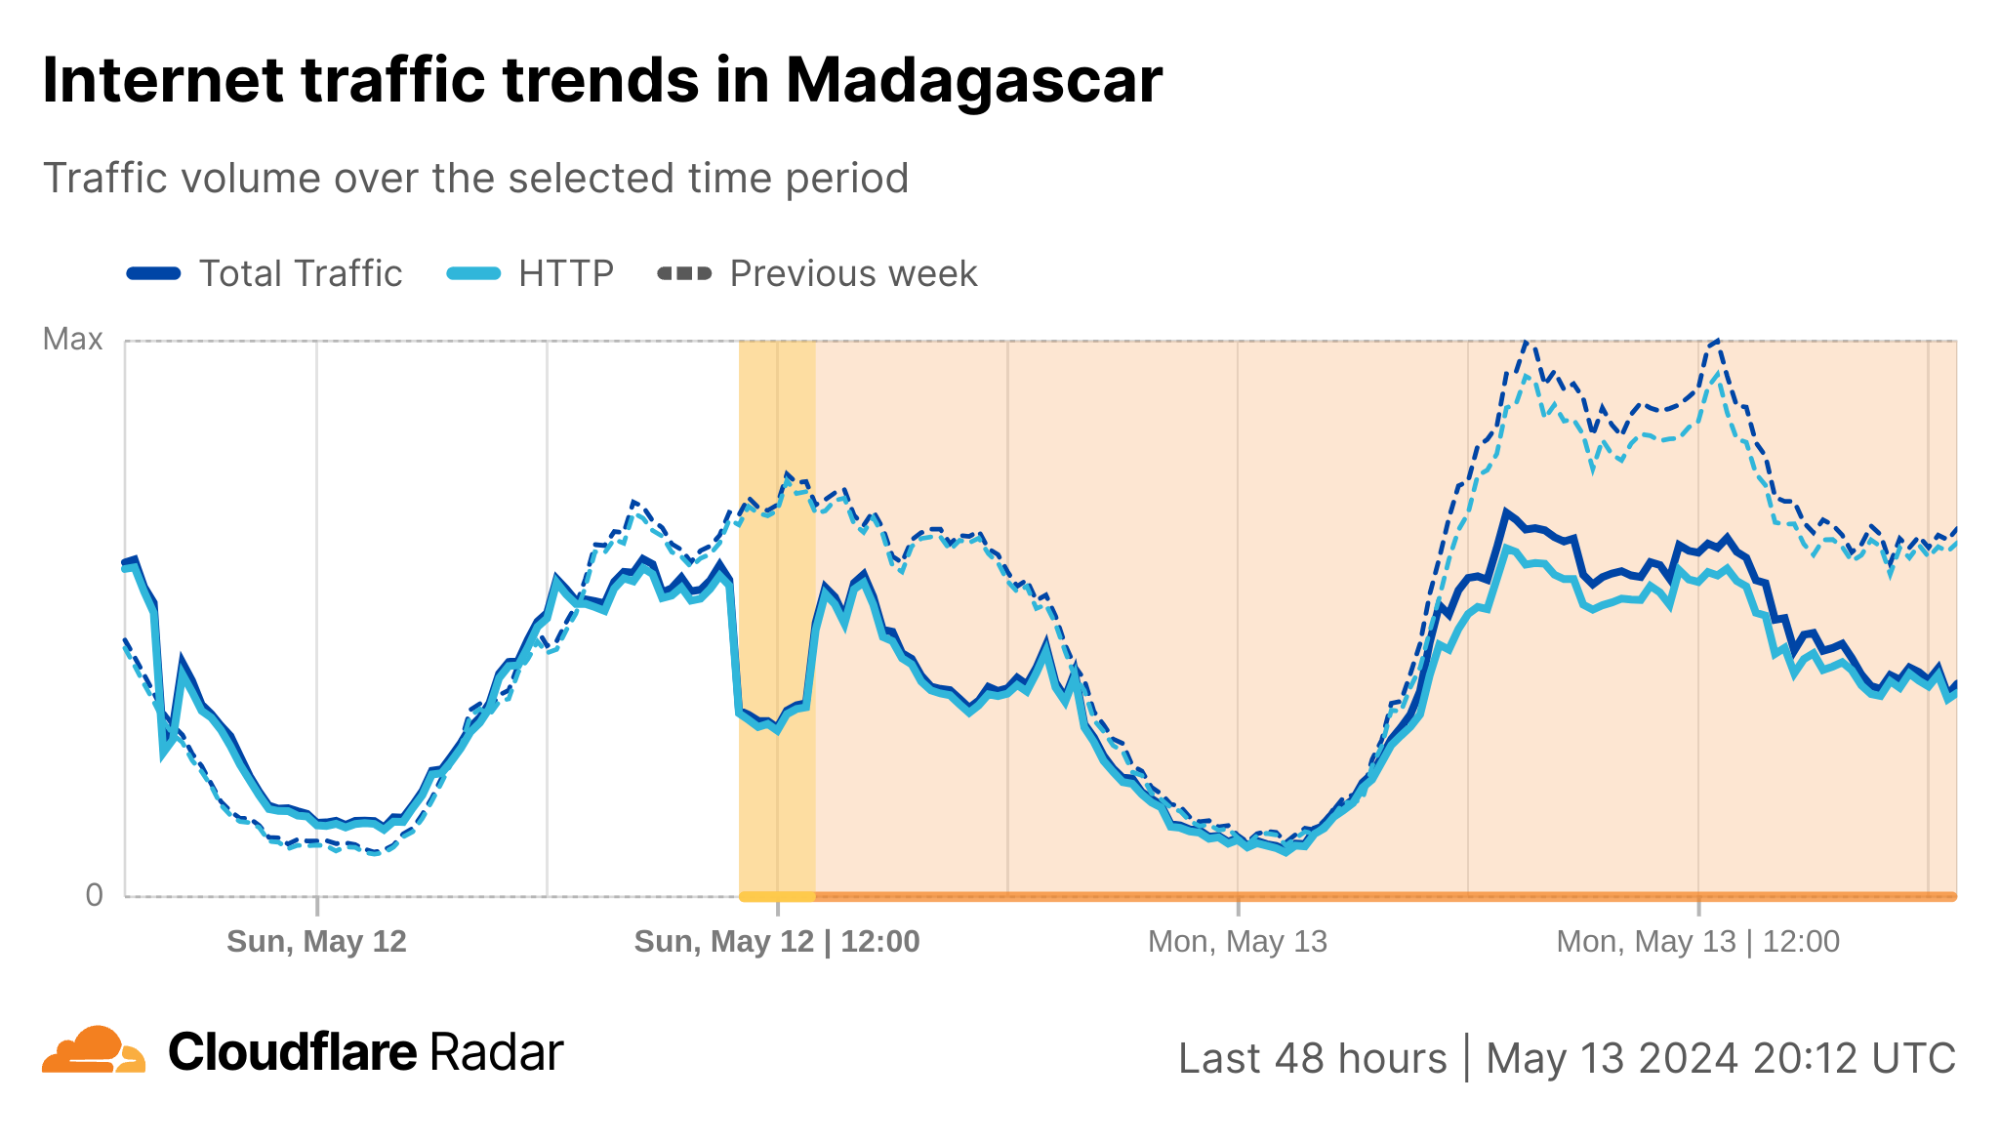
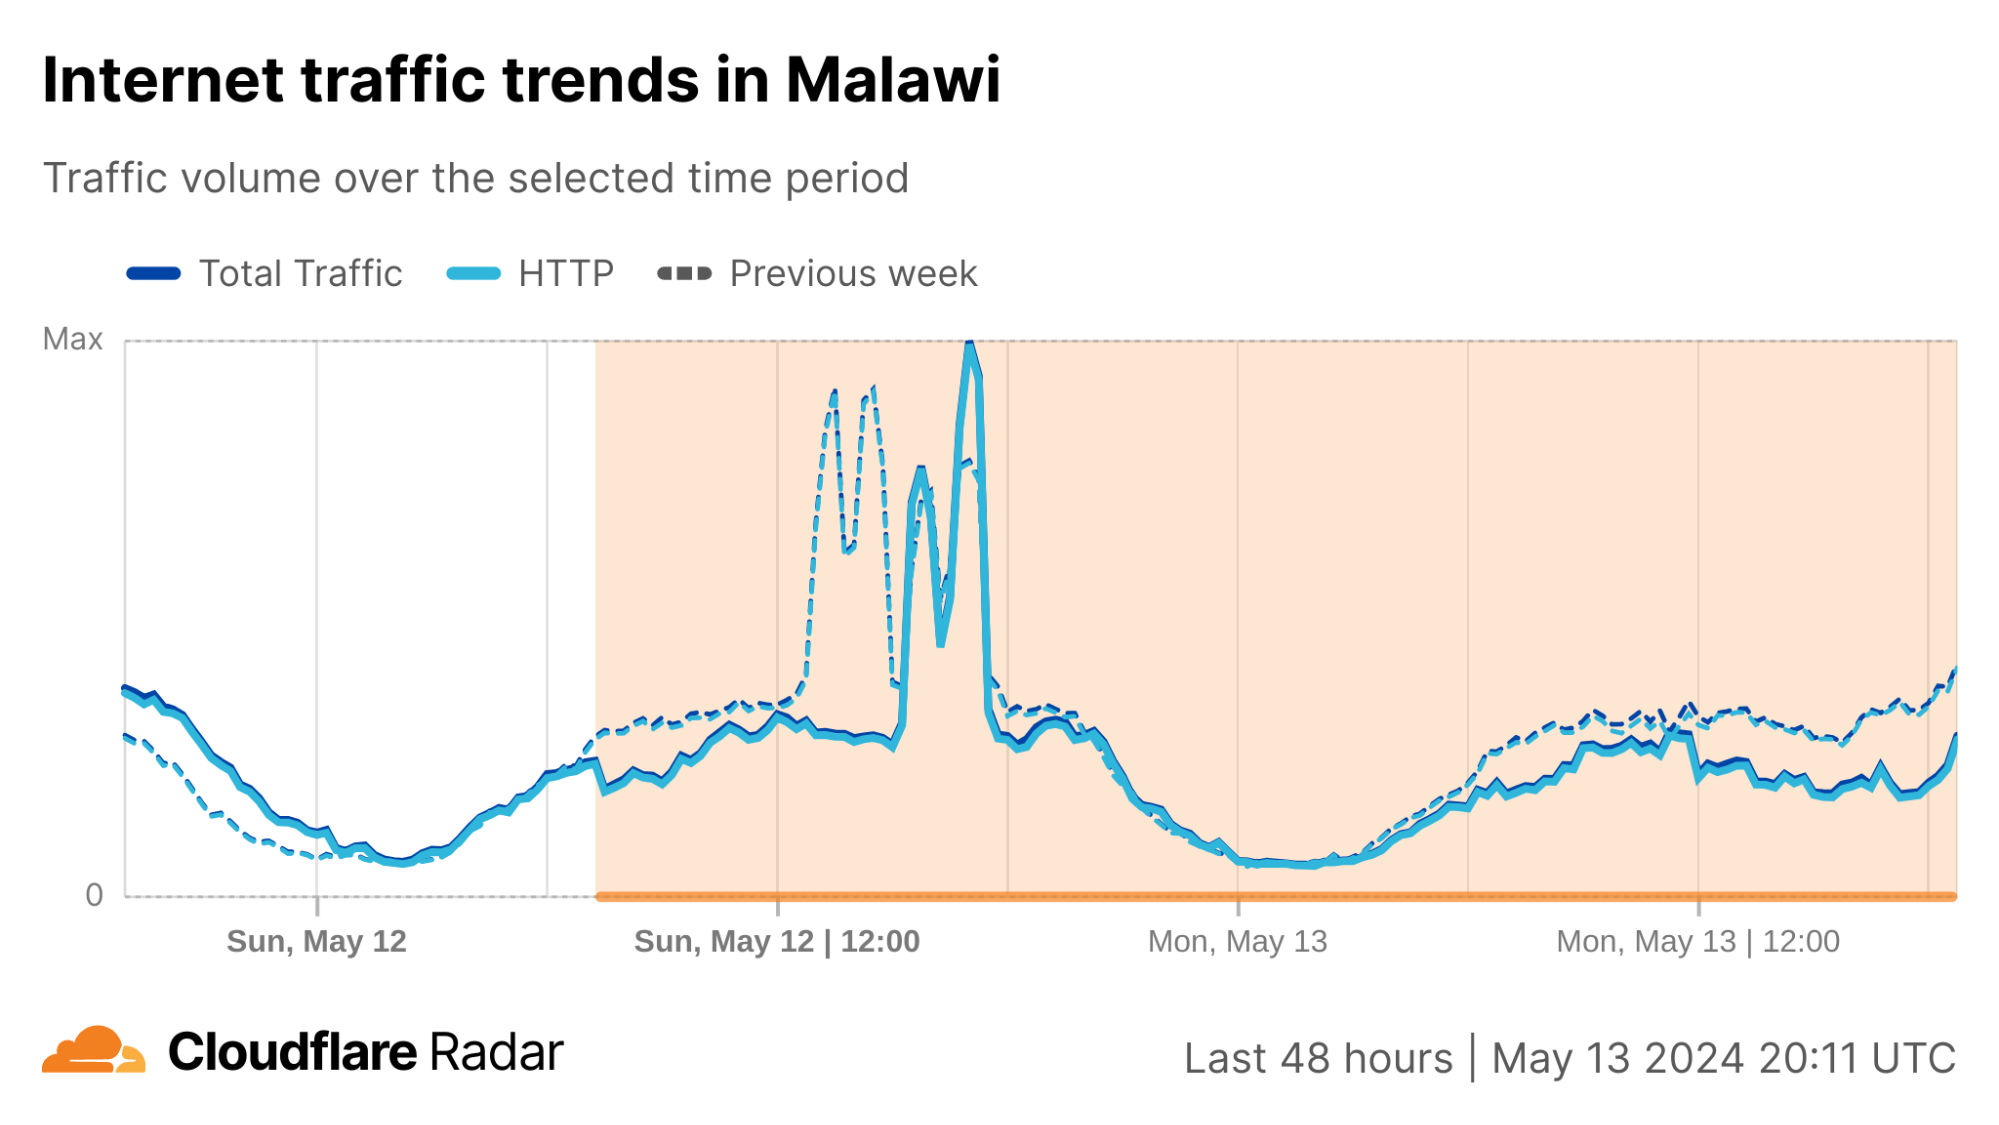
Cloudflare Radar saw traffic levels across a number of the impacted countries drop just before 11:00 local time (08:00 UTC). As seen in the graphs below, the magnitude of impact varied by country, with traffic initially dropping by 10-25% in Kenya, Uganda, Madagascar, and Mozambique, while traffic in Rwanda, Malawi, and Tanzania dropped by one-third or more as compared to the previous week.
In Kenya and Uganda, the overall impact appeared to be low, with traffic generally remaining just below expected levels in the day and a half following the cable faults. In the other countries, the overnight trough of the diurnal traffic patterns remained consistent with the previous week’s traffic levels, but otherwise traffic remains significantly lower than expected.
The importance of redundancy
In Kenya, the impact may have been nominal due to steps taken by providers like Safaricom and Airtel Kenya. In a May 12 social media post, Safaricom noted “…We have since activated redundancy measures to minimise service interruption and keep you connected as we await the full restoration of the cable.” In a subsequent social media post on May 13, Safaricom noted “Thanks to our redundancy plans and capacity investment across multiple undersea cables our services continue to be available, however some customers may experience slow connectivity and speeds.” Similarly, a social media post from Airtel Kenya noted “Following yesterday’s undersea fiber cut that has impacted internet connectivity, we would like to update you that we have taken measures to improve your browsing experience through additional capacity enhancement.”
Similarly, the previously referenced press release from the Communications Authority of Kenya talked about actions being taken, stating “Meanwhile, the Authority has directed service providers to take proactive steps to secure alternative routes for their traffic and is monitoring the situation closely to ensure that incoming and outbound internet connectivity is available. The East Africa Marine System (TEAMS) cable, which has not been affected by the cut, is currently being utilised for local traffic flow while redundancy on the South Africa route has been activated to minimize the impact.”
What’s next?
Once the necessary permits are secured and the cable faults are located, repairs can often be completed in several days. However, because cable repair ships are something of a scarce resource, there is often a delay to both engage a vessel and for it to travel to the area where the cable damage occurred, whether from its baseport or the location of a previous repair. However, in this case that delay may be comparatively short, as submarine cable industry observer @philBE2 predicts “Expecting the usual suspect, CS Leon Thevenin, now moored in Cape Town, to be swiftly mobilized for an expeditious repair mission…”
Cloudflare’s network spans more than 310 cities in over 120 countries, where we interconnect with over 13,000 network providers in order to provide a broad range of services to millions of customers. The breadth of both our network and our customer base provides us with a unique perspective on Internet resilience, enabling us to observe the impact of Internet disruptions. Thanks to recently released Cloudflare Radar functionality, this quarter we have started to explore the impact from a routing perspective, as well as a traffic perspective, at both a network and location level.
The first quarter of 2024 kicked off with quite a few Internet disruptions. Damage to both terrestrial and submarine cables caused problems in a number of locations, while military action related to ongoing geopolitical conflicts impacted connectivity in other areas. Governments in several African countries, as well as Pakistan, ordered Internet shutdowns, focusing heavily on mobile connectivity. Malicious actors known as Anonymous Sudan claimed responsibility for cyberattacks that disrupted Internet connectivity in Israel and Bahrain. Maintenance and power outages forced users offline, resulting in observed drops in traffic. And in a more unusual turn, RPKI, DNS, and DNSSEC issues were among the technical problems that disrupted connectivity for subscribers across multiple network providers.
As we have noted in the past, this post is intended as a summary overview of observed disruptions, and is not an exhaustive or complete list of issues that have occurred during the quarter.
Cable cuts
Moov Africa Tchad
Reported fiber optic cable damage that occurred in Cameroon on January 10 further disrupted connectivity for customers of AS327802 (Moov Africa Tchad / Millicom) a telecommunications provider in Chad. According to a (translated) Facebook post from Moov Africa Tchad, “On the afternoon of January 10, 2024, there was a breakdown of the internet due to a cut in the optical fiber coming from Cameroon through which Chad has access to the internet, the one coming from Sudan being unavailable for a while.” It is unclear whether the referenced cable cut occurred in Cameroon or Chad, and the mentioned Sudan cable issue may be the one covered in our Q4 2023 summary post. As a landlocked country, Chad is dependent on terrestrial Internet connections to/through neighboring countries, and the AfTerFibre cable map illustrates Chad’s reliance on limited cable paths through Cameroon and Sudan.
The graphs below show that Moov Africa Tchad traffic was disrupted for over 12 hours starting midday (UTC) on January 10, and the disruption was visible at a country level as well. The fiber cut also resulted in significant volatility from a routing perspective, as the volume of announced IPv4 address space shifted frequently at a network and country level during the disruption.
On February 15, a brief (~30 minute) but complete significant Internet disruption was observed at AS37577 (Orange Burkina Faso). According to the translation of a communiqué posted by the provider on social media, “The incident is due to a fiber cut, which causes a disruption of Internet services for certain customers.” Orange did not specify whether it was a more localized fiber cut, or damage to one of the terrestrial fibers that cross the country. The incident took the network completely offline, as the ASN’s amount of announced IPv4 address space dropped to zero for the duration.
MTN Nigeria
MTN Nigeria turned to social media on February 28 to let customers know that “You have been experiencing challenges connecting to the network due to a major service outage caused by multiple fibre cuts, affecting voice and data services.” A published report described the impact, noting “Millions of customers nationwide were impacted by the hours-long outage, especially in Lagos.” Connectivity was disrupted for approximately seven hours between 13:30 – 20:30 local time (12:30 – 19:30 UTC), and the provider posted a followup note just before midnight local time stating that service had been fully restored.
Digicel Haiti
A 16-hour Internet disruption on March 2/3 at AS27653 (Digicel Haiti) was due to a double fiber cut as a result of violence related to attempts to oust Prime Minister Ariel Henry. Starting around 22:00 local time on March 2 (03:00 on March 3), a complete outage was observed for approximately nine hours. Some recovery in traffic occurred for approximately two-and-a-half hours, followed by a three hour near-complete disruption. Digicel Haiti effectively disappeared from the Internet during the nine-hour outage, as no IPv4 or IPv6 address space was announced by the network during that time.
SKY (Philippines)
A brief traffic disruption observed on AS23944 (SKY) in the Philippines on March 18 was likely related to a fiber cut. In an advisory posted by SKY on social media, they stated that “SKY services in several areas in Marikina, Pasig and Quezon City are currently affected by a cut-fiber issue”, listing 45 affected areas. Traffic was most significantly impacted between 20:00 – 21:00 local time (12:00 – 13:00 UTC), although full recovery took several more hours. Only a minor impact to routing resulting from the fiber cut was observed.
Multiple African countries
On March 14, damage to multiple submarine cables off the west coast of Africa impacted Internet connectivity across multiple countries in West and Southern Africa. The damage was reportedly caused by underwater rock falls, and in addition to disrupting Internet connectivity, also caused availability issues for Microsoft Azure and Office 365 cloud services.
Comparatively brief disruptions were observed in Niger, Guinea, and Gambia, lasting from under an hour to approximately two hours.
However, the disruptions stretched out across multiple days in countries including Togo, Liberia, and Ghana, where it took several weeks for traffic to return to previously observed peak levels.
Operators in impacted countries attempted to maintain availability by shifting traffic to Google’s Equiano submarine cable, which reportedly experienced a 4x increase in traffic, and Morocco’sMaroc Telecom West Africa submarine cable. Service on the SAT-3 cable was fully restored as of April 6, with repairs on ACE completed on April 17, repairs to WACS and MainOne expected to be done by April 28.
On February 24, three submarine cables that run through the Red Sea were damaged: the Seacom/Tata cable, the Asia Africa Europe-1 (AAE-1), and the Europe India Gateway (EIG). It is believed that the cables were cut by the anchor of the Rubymar, a cargo ship that was damaged by a ballistic missile on February 18. At the time of the disruption, Seacom confirmed the damage to their cable, while the owners of the other two cables did not publish similar confirmations.
On February 2, Cloudflare observed a loss of traffic at AS15706 (Sudatel) and AS36972 (MTN Sudan), with a similar loss occurring on February 7 at AS36998 (Zain Sudan / SDN Mobitel). The disruption at MTN Sudan aligns with a social media post from the provider, in which they stated (translated) “We regret the interruption of all services due to circumstances beyond our control. While we apologize for the inconvenience caused by this interruption, we assure you of our endeavor to restore the service as soon as possible, and you will be notified of the return of the service.” On February 5, several days after their outage started, Zain Sudan published a social media post that stated (translated) “Zain Sudan has been constantly striving to maintain communication and Internet service to serve its valued subscribers, and we would like to point out that the current network outage is due to circumstances beyond its control, with our hopes that safety will prevail, and that service will be restored as soon as possible.” Sudatel did not share any information about the status of its network. On February 4, Digital Rights Lab – Sudan posted on social media that “Our sources confirmed that @RSFSudan forces tookover data centers of ISPs in Khartoum, #Sudan.” It is likely that the Internet outages observed across these providers are related to these takeovers, part of the military conflict that has been underway in the country since April 15, 2023.
The disruptions on these networks varied in length. At Sudatel, traffic started to return on February 11. At Zain Sudan, traffic began to return on March 3, corroborated by a social media post that stated (translated) “Zain network is gradually returning to work and allows its subscribers to communicate for free for a limited time. Zain promises to continue working to restore its network in the rest of the states.” Traffic had not yet returned on MTN Sudan by the end of the first quarter.
Ukraine
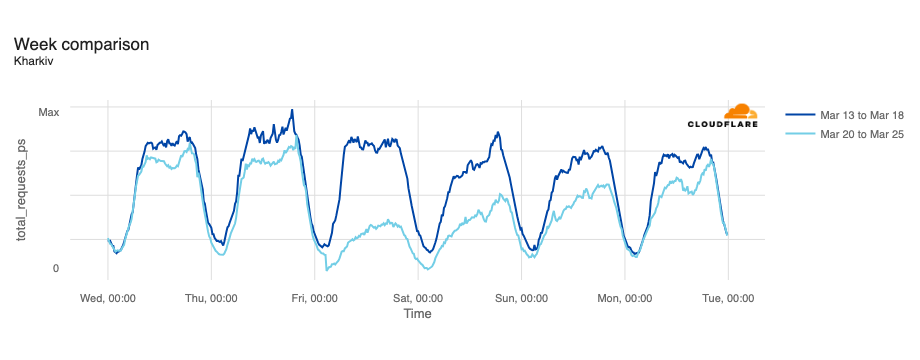
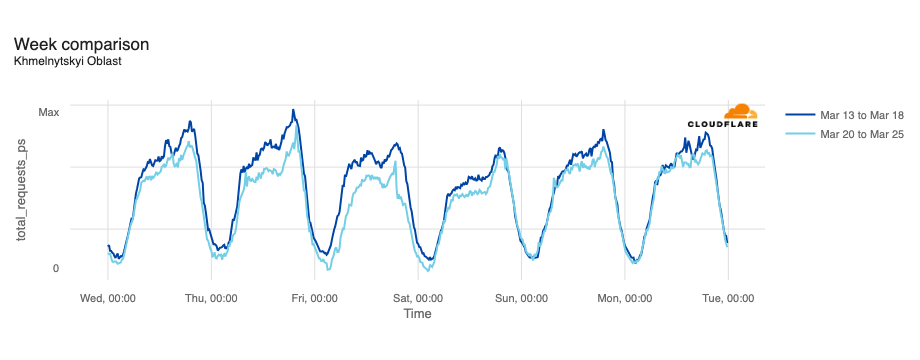
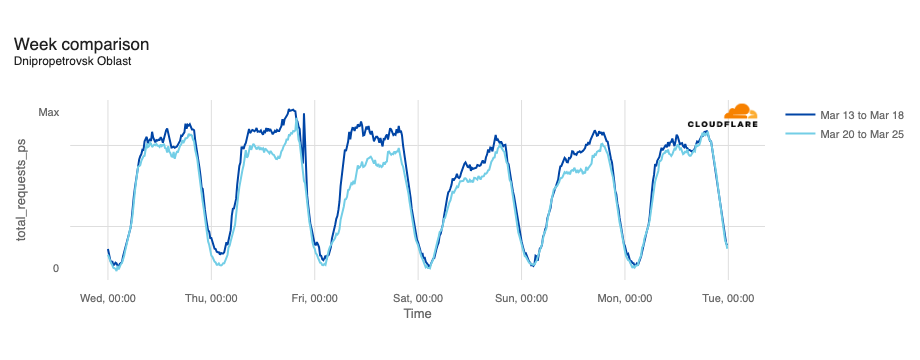
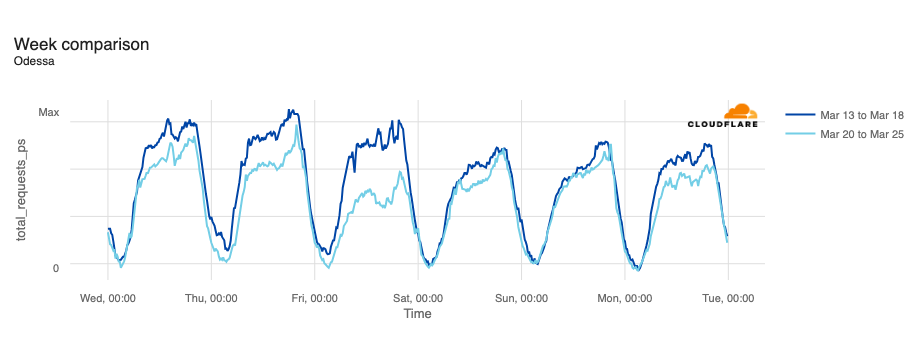
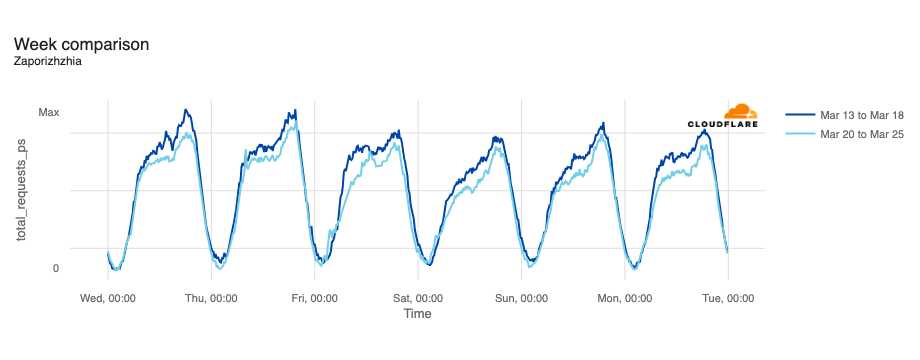
In February, the Ukraine/Russia war reached the two-year mark, and over that time, we have covered a number of Internet outages in Ukraine caused by conflict-related attacks. On February 22, Russian air strikes on critical infrastructure in Ukraine damaged energy facilities across the country, resulting in widespread power outages. These power outages caused Internet disruptions across multiple regions in Ukraine, including Kharkiv, Zaporizhzhia, Odessa, Dnipropetrovsk Oblast, and Khmelnytskyi Oblast. Traffic initially dropped around 05:00 local time (03:00 UTC), falling as much as 68% in Kharkiv. However, all regions saw lower traffic levels for several days as compared to the week before.
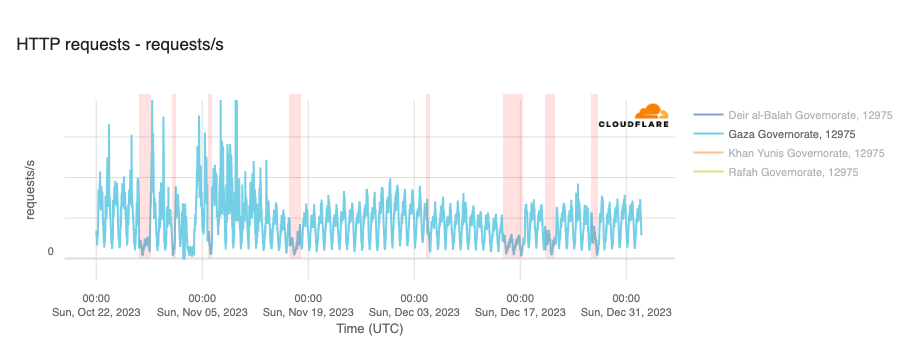
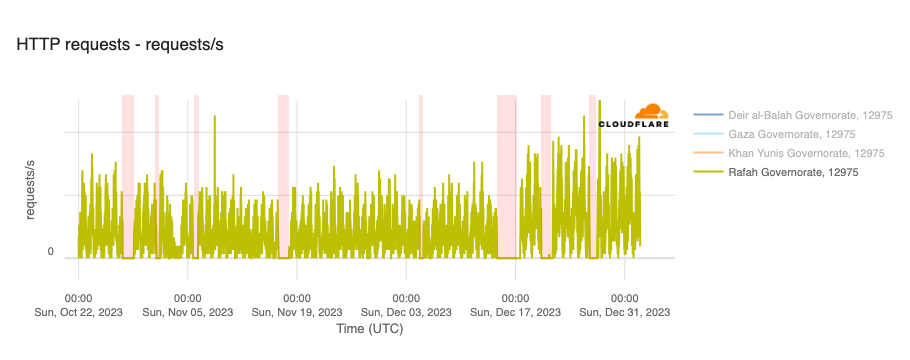
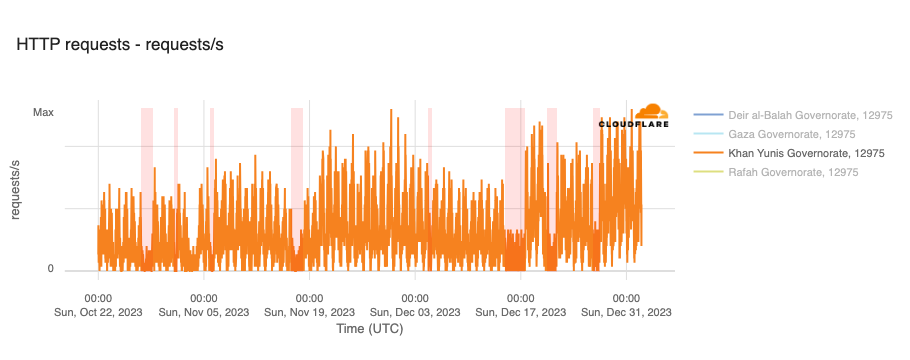
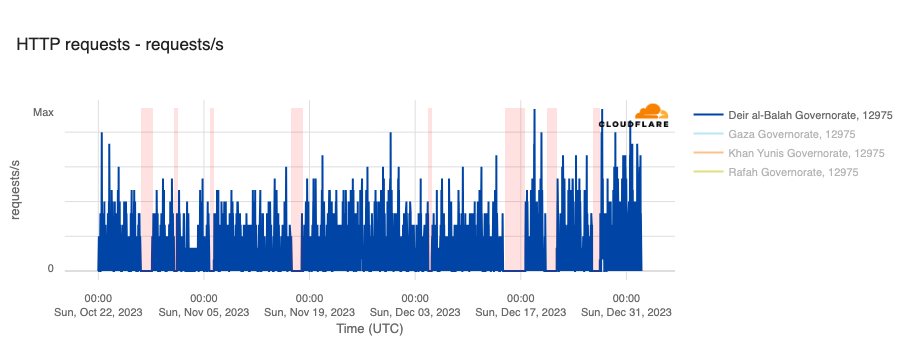
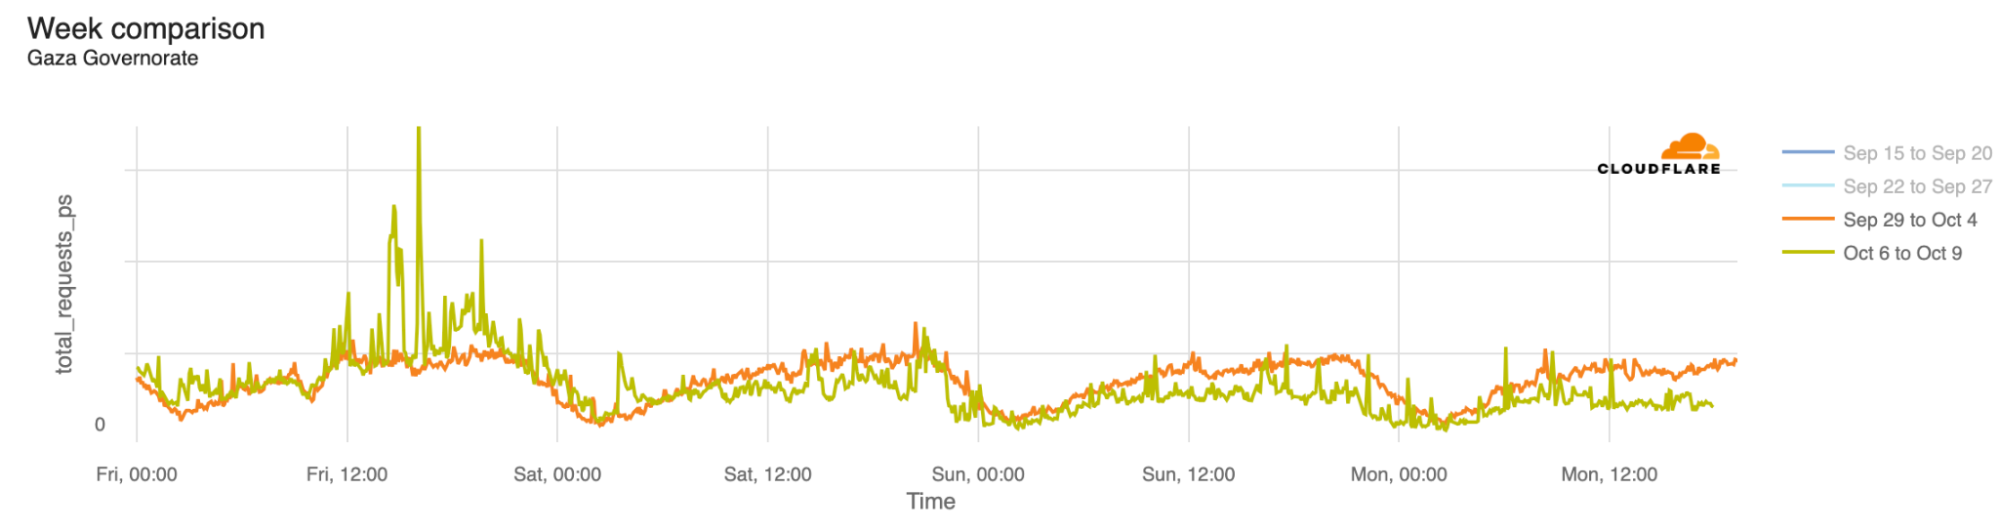
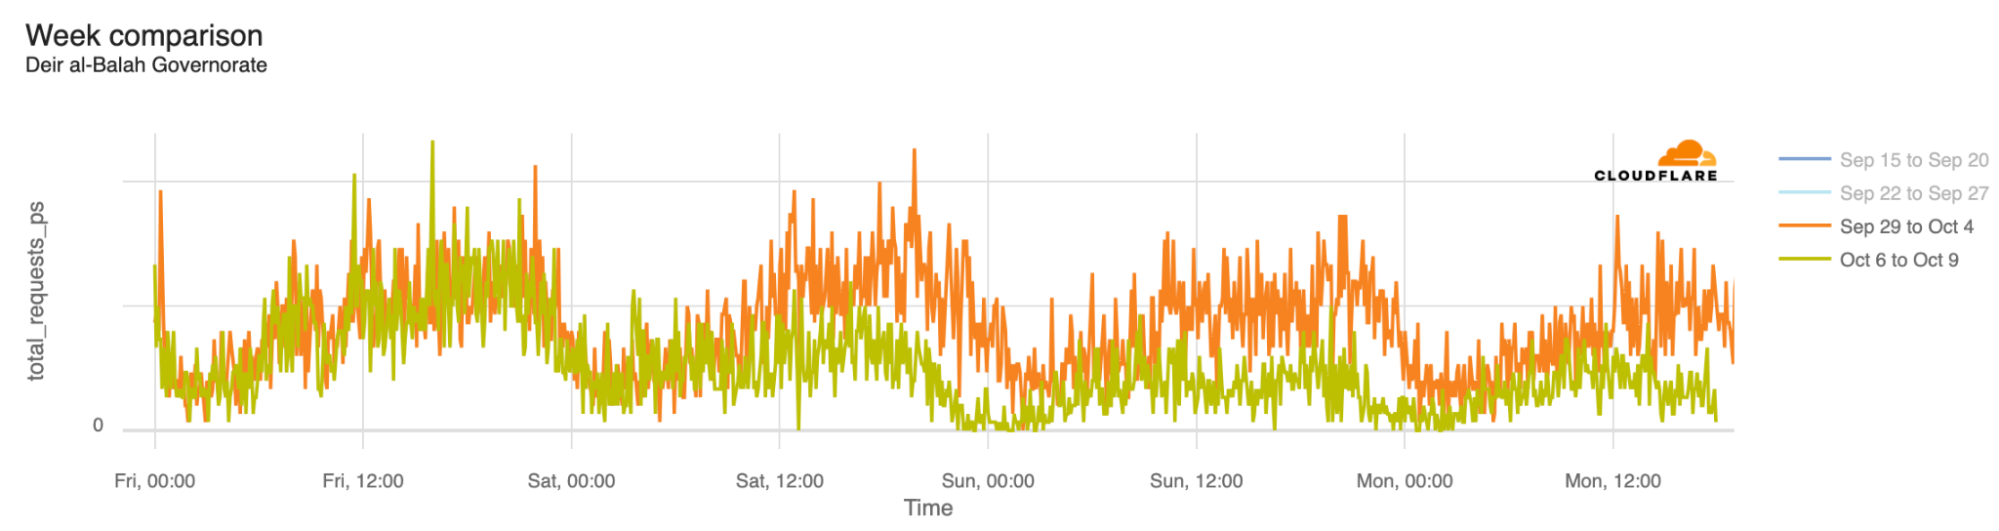
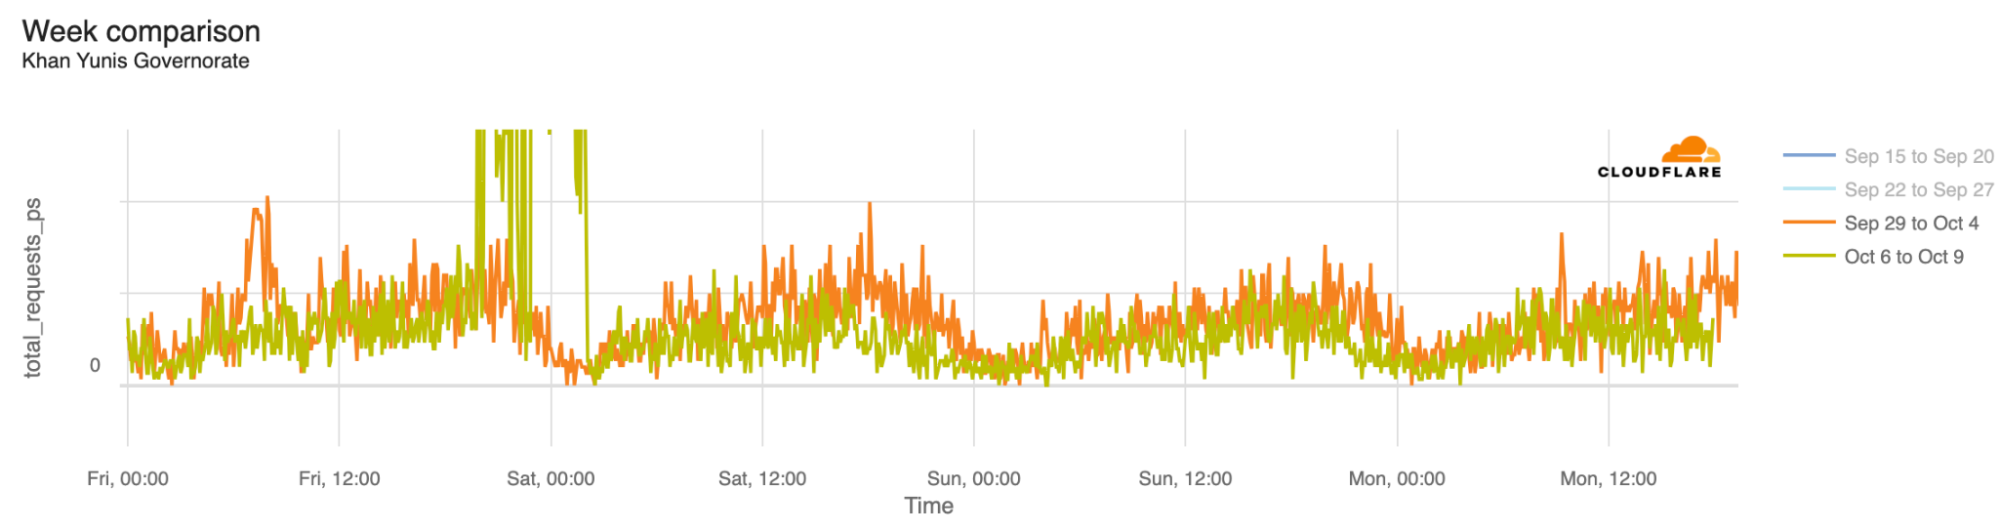
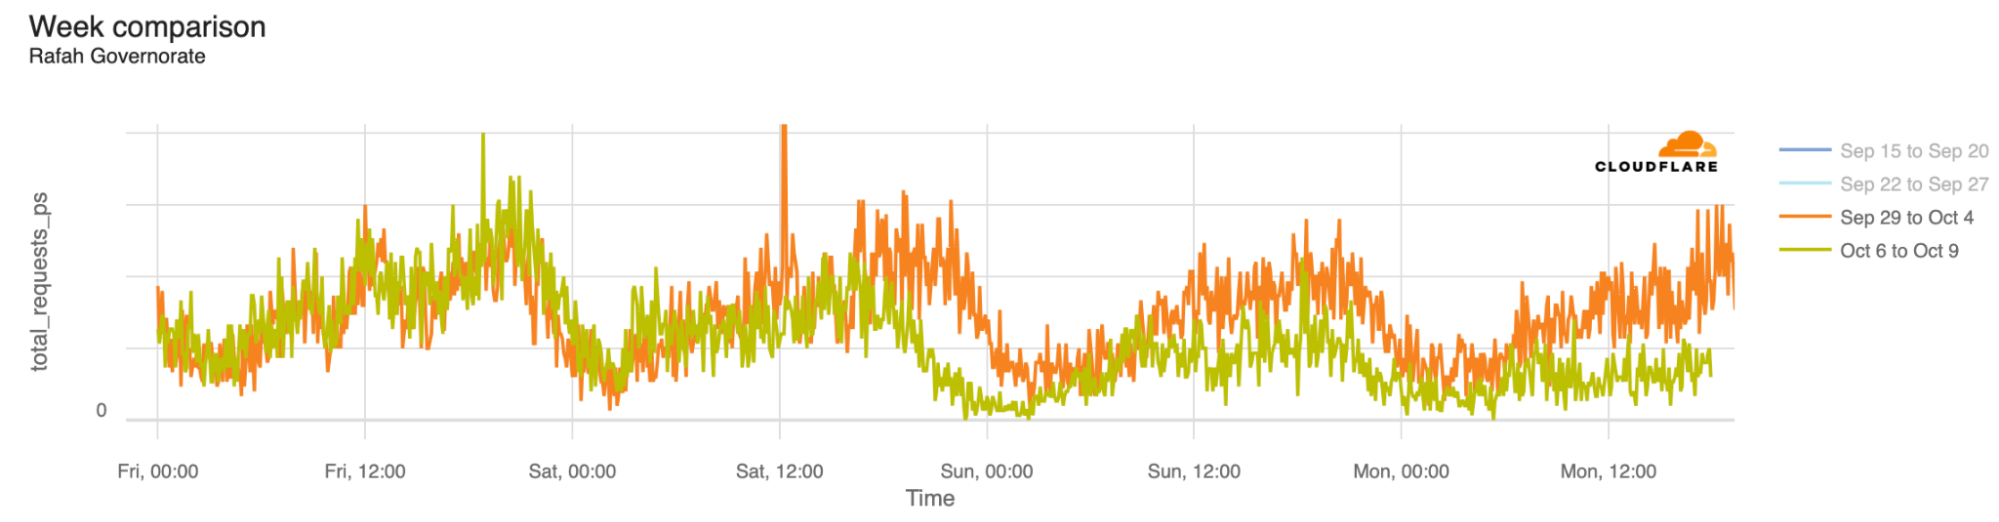
The associated outages during the quarter varied in length, from just a few hours to over a week. Each outage is shown in the graphs below, which show Paltel traffic within four Palestinian governorates in the Gaza Strip region. While it appears that the Gaza governorate suffered a disruption to traffic as connectivity remained available, complete outages occurred in the Khan Yunis, Rafah, and Deir al-Balah governorates.
January 12-19
January 22-24
March 5
Cyberattacks
In addition to the previously discussed cyberattack that impacted connectivity for AS327802 (Moov Africa Tchad / Millicom) on January 11, several other observed Internet disruptions were caused by cyberattacks in the first quarter.
Anonymous Sudan also reportedly targeted AS31452 (Zain Bahrain) with a cyber attack. This attack appeared to be less severe than the one that targeted HotNet in Israel, but it also lasted significantly longer, with traffic disrupted between 20:45 on March 3 and 18:15 on March 4 local time (17:45 on March 3 to 15:15 on March 4 UTC). No impact to announced IP address space was observed. Zain Bahrain acknowledged the connectivity disruption in a social media post on March 4, noting (translated) “We would like to inform you that some customers may encounter difficulties in using some of our services. Our technical team works to avoid these difficulties as quickly as possible.”
Multiple networks in Ukraine
On March 13, an attack targeted a number of Ukrainian telecommunications providers, including AS16066 (Triangulum), AS34359 (Link Telecom Ukraine), AS197522 (Kalush Information Network), AS52074 (Mandarun), and AS29013 (LinkKremen). Triangulum appeared to be the most significantly impacted, experiencing a near complete loss of traffic between March 13 and March 20, as seen below. Triangulum posted a notice on its website, noting in part “On March 13, 2024, a hacker attack was carried out on a number of Ukrainian providers. At 10:28 a.m. on March 13, 2024, a large-scale technical failure occurred on our Company’s network, as a result of which it became impossible to provide electronic communication services. The Company’s employees, together with employees of the Cyber Police and the National Cyber Security Coordination Center, are taking comprehensive measures around the clock aimed at restoring the entire range of services as soon as possible. Services are being restored gradually. Full recovery may take several days.”
Other affected providers experienced comparatively shorter connectivity disruptions. The near complete outage at Mandarun lasted approximately a day, while the others saw outages lasting around seven hours, starting around 11:30 local time (09:30 UTC) on March 13, with connectivity returning to typical levels around 08:00 local time (06:00 UTC) on March 14.
Government directed
Comoros
Following protests against the re-election of President Azali Assoumani, authorities in Comorosreportedly shut down Internet connectivity on January 17. While some disruption was visible to traffic at a country level between 12:00 local time on January 17 (09:00 UTC) and 17:30 local time on January 19 (14:30 UTC), it was significantly more noticeable in the traffic from AS36939 (Comores Telecom), which saw several periods of near-complete outage across the two-day span. Although Comores Telecom announces a limited amount of IPv4 address space, it saw significant volatility on January 17 & 18, dropping to zero several times.
Sudatel Senegal/Expresso Telecom and Tigo/Free (Senegal)
On February 4, the Minister of Communication, Telecommunications, and Digital Affairs in Senegalordered the suspension of mobile Internet connectivity starting at 22:00 local time (22:00 UTC). The suspension followed protests that erupted in the wake of the postponement of the presidential election. Traffic from AS37196 (Sudatel Senegal/Expresso Telecom) fell sharply at the time the suspension went into effect, recovering around 07:30 local time (07:30 UTC) on February 7. Traffic from AS37649 (Tigo/Free) fell at around 09:30 local time (09:30 UTC) on February 5, with the provider notifying subscribers of the suspension via social media. Traffic on Tigo/Free recovered around midnight local time (00:00 UTC) on February 7, and the provider again used social media to inform subscribers of service availability. No changes were observed to announced IP address space for either provider, indicating that the suspension of mobile Internet connectivity was not done at a routing level.
A little more than a week later, on February 13, the government in Senegal again ordered the suspension of mobile Internet connectivity in an effort to prevent “the spread of hateful and subversive messages online.” ahead of a march planned by activist groups which aimed to express dissent against the postponement of the presidential election. The mobile Internet shutdown was most visible on Tigo/Free, which saw a significant disruption between 10:15 and 19:45 local time (10:15 – 19:45 UTC).
Pakistan
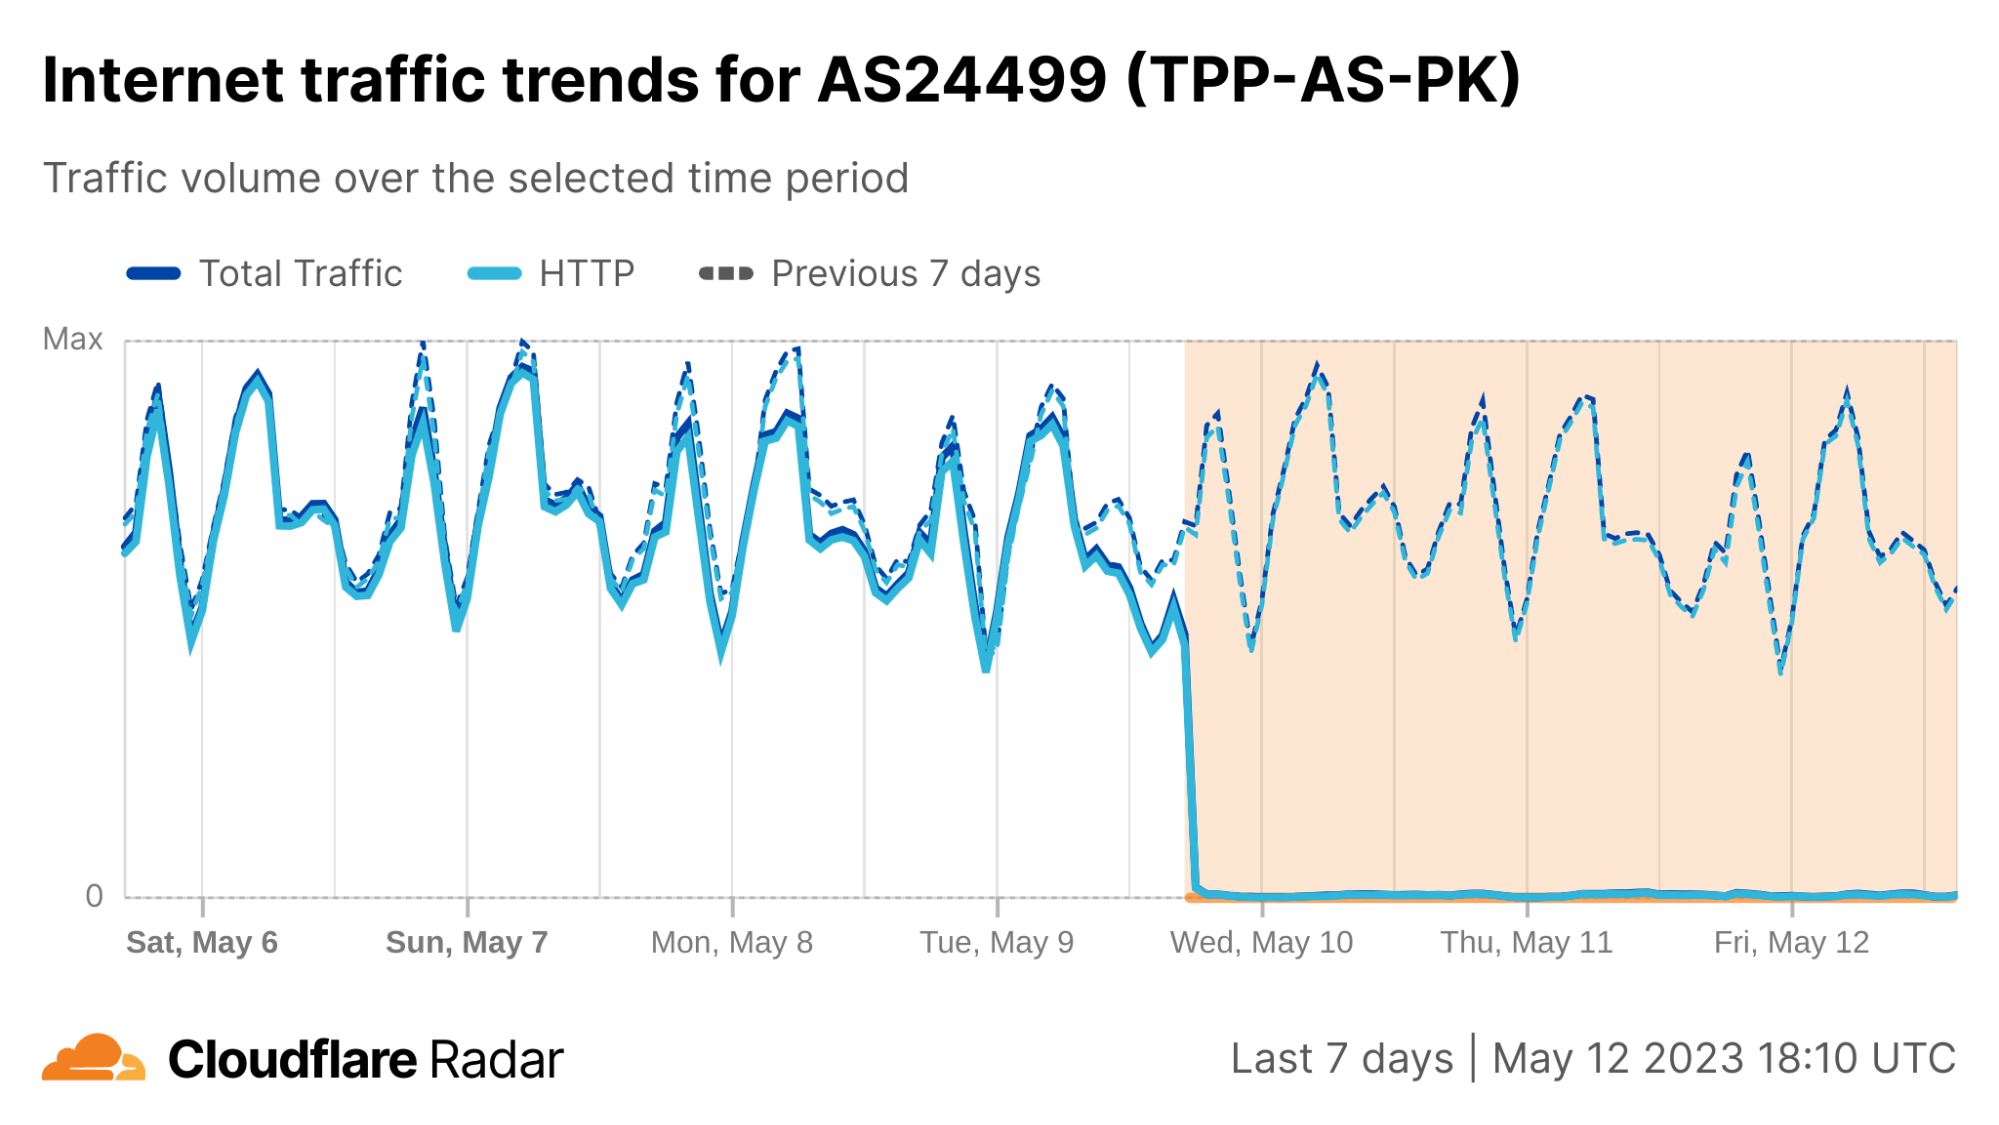
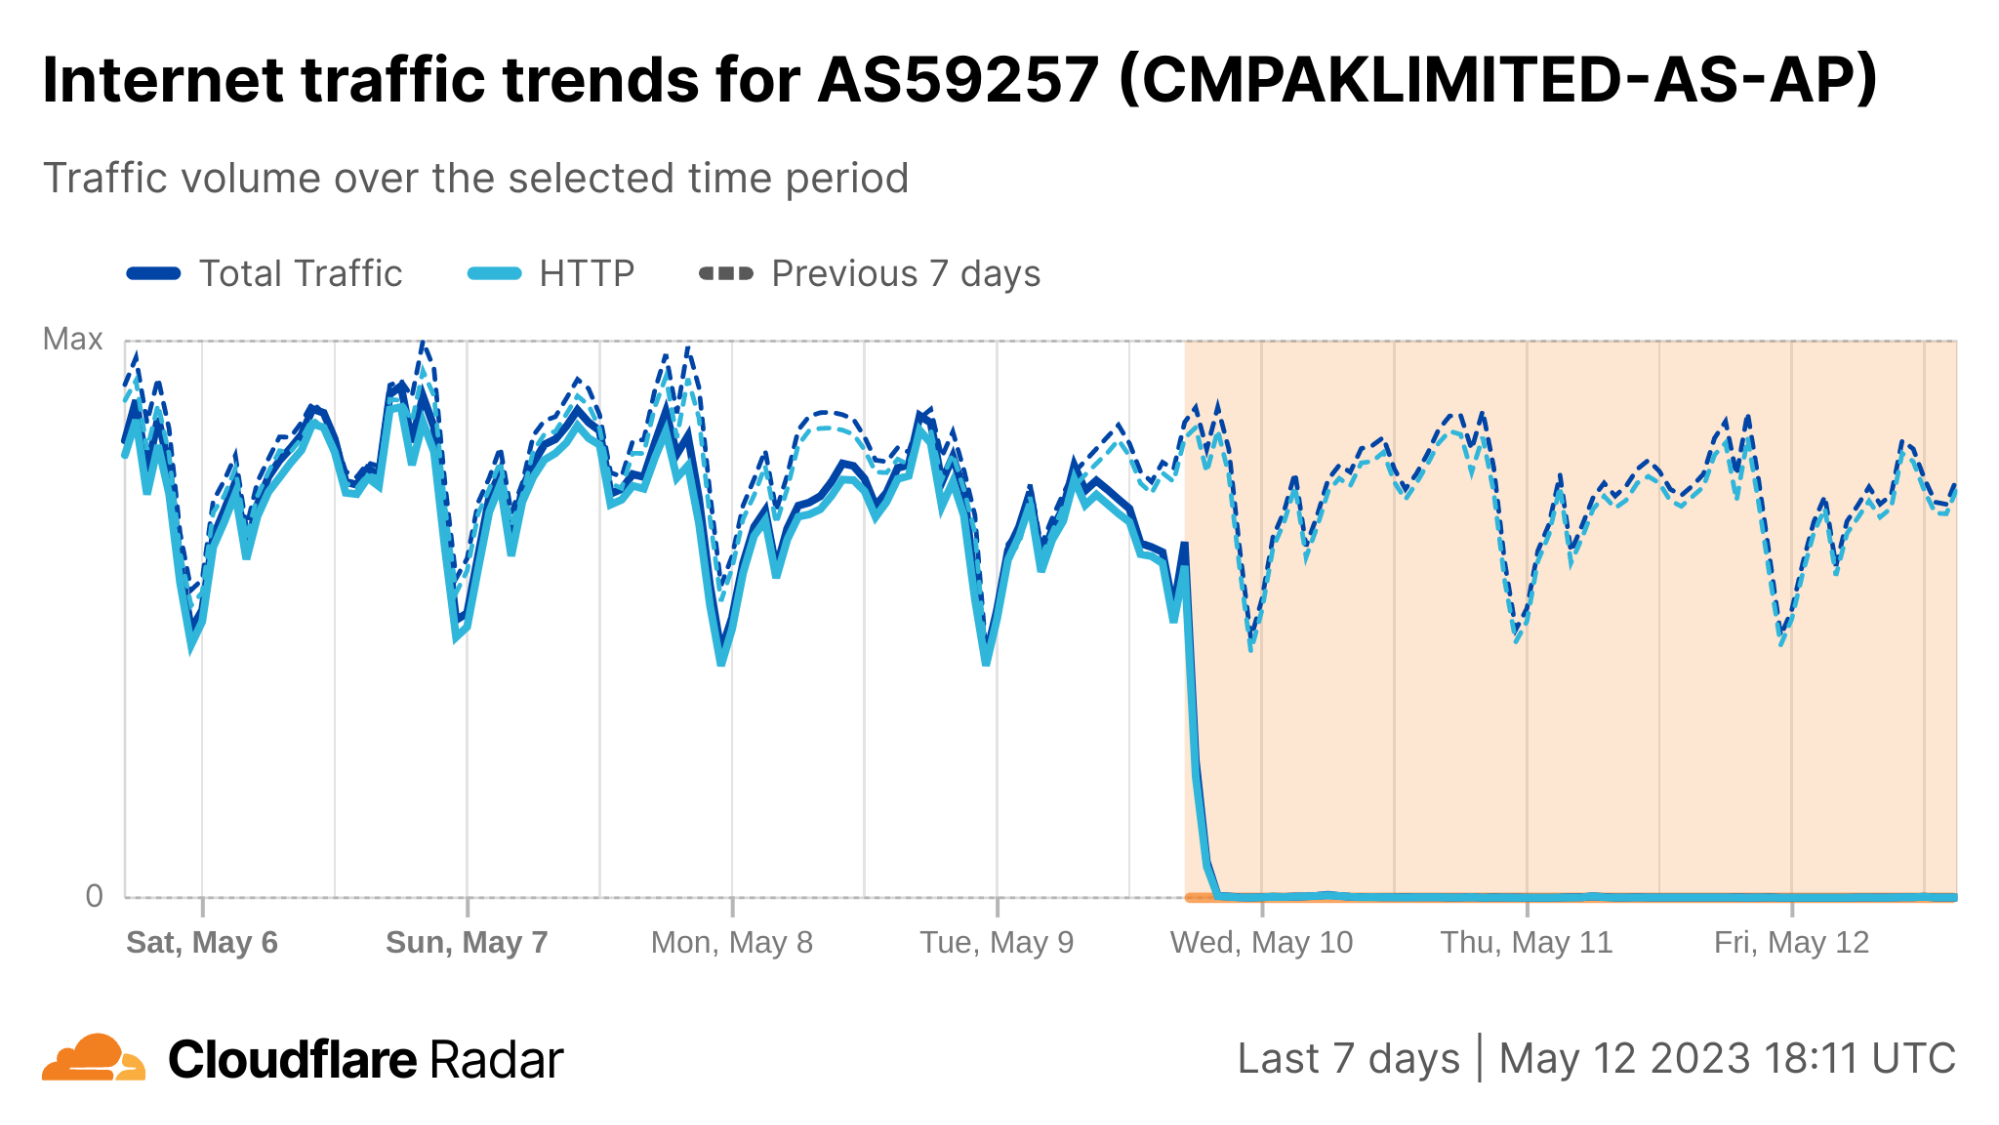
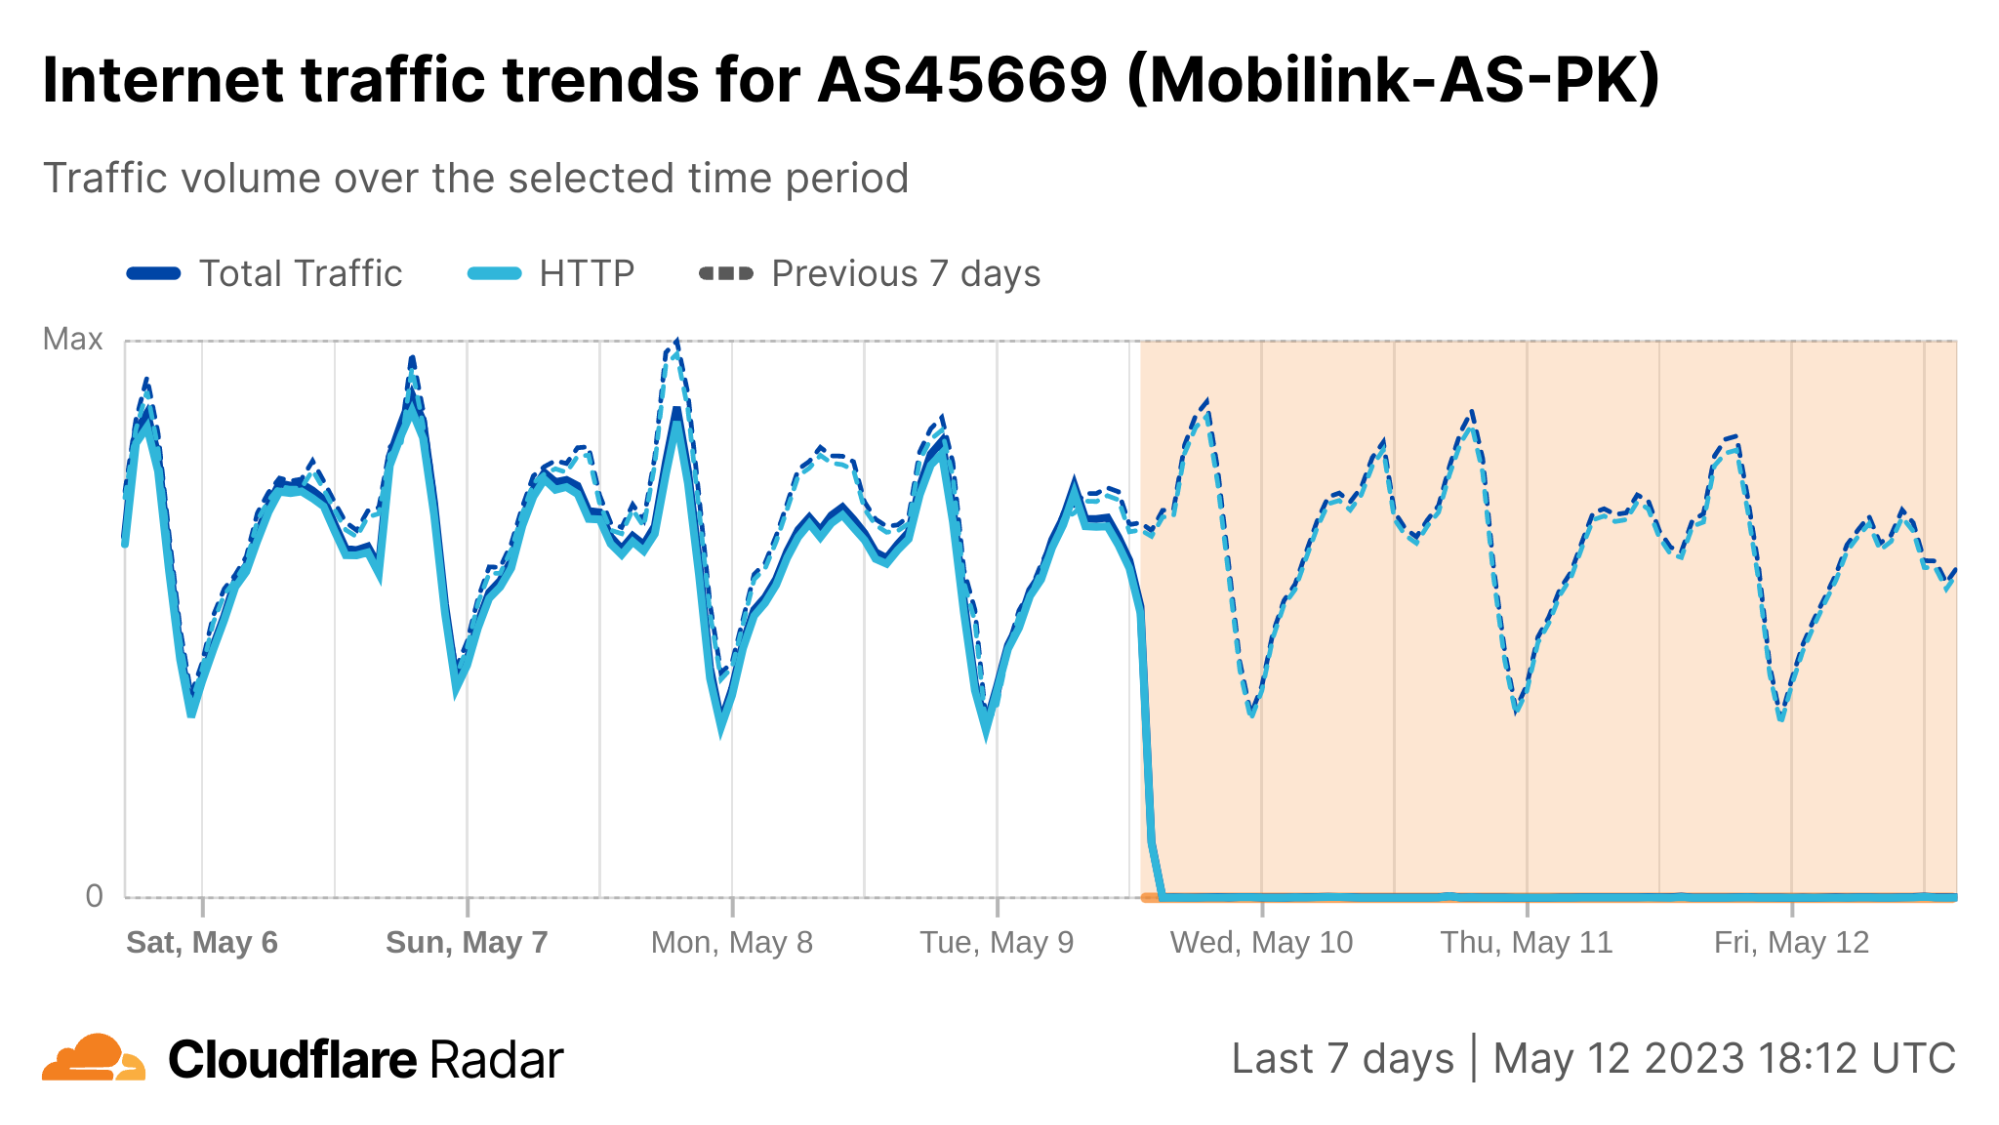
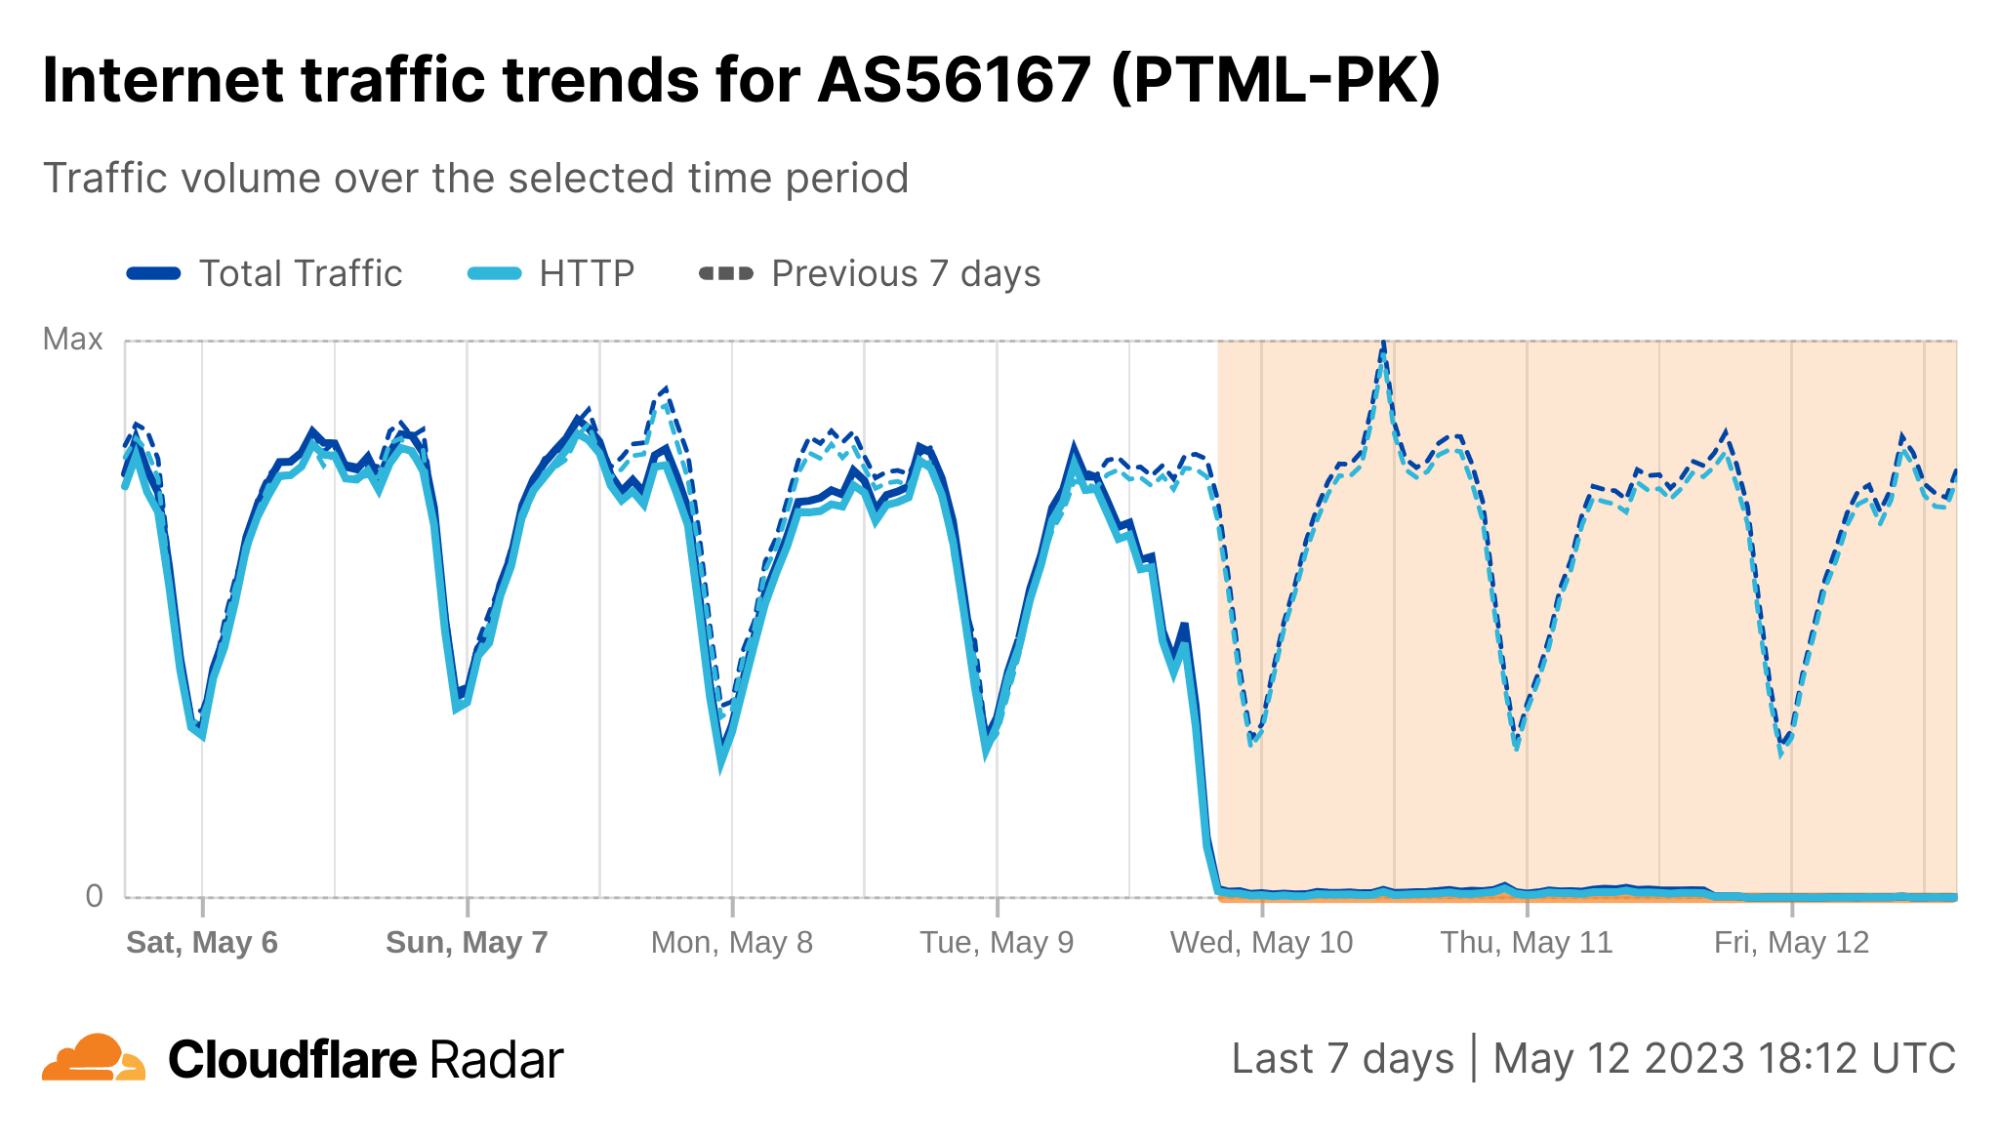
According to a published report, The Pakistan Telecommunication Authority (PTA) said that Internet services would remain available as citizens went to the polls on February 8 to elect a new government. However, on that day, Pakistani authorities cut mobile Internet access across the country as the nation’s voters went to cast their ballots, with the authorities attributing the move “to maintain law and order” in the wake of the violence that occurred the previous day. The impact of the ordered shutdown was visible across multiple Internet providers in Pakistan, including AS59257 (Zong/CMPak), AS24499 (Telenor Pakistan), and AS45669 (Jazz/Mobilink), lasting from 07:00 until 20:00 (02:00 – 15:00 UTC), with traffic returning to expected levels approximately nine hours later. A post on the Internet Society’s Pulse blog estimated that the shutdown cost Pakistan nearly USD $18.5M in lost Gross Domestic Product.
Chad
Several Internet disruptions were observed in Chad between February 28 and March 7. The first one started at 10:45 local time on February 28 and lasted until 18:00 local time on March 1 (09:45 on February 28 – 17:00 on March 1). Shorter disruptions lasting just a few hours each were also observed on March 3, 4, and 7. The apparent shutdowns came in the wake of political violence in the country. Notable drops in announced IPv4 address space aggregated across networks in the country were observed coincident with the February 28, March 3, and March 4 shutdowns, although it isn’t clear why a similar drop did not occur on March 7.
Power outages
Tajikistan
According to a published report, a widespread multi-hour power outage occurred in Tajikistan on March 1, possibly related to increased electricity usage by electric heaters as temperatures across the country neared freezing. The outage began around 11:00 local time (06:00 UTC), and lasted for approximately three hours. The impact on Internet traffic from the country is visible in the graph below. Although power was restored around 14:00 local time (09:00 UTC), Internet traffic did not return to expected levels until around 05:00 local time the next day (midnight UTC on March 2).
Although power outages most often have the biggest impact on Internet traffic, as computers and home/office routers shut down, this outage also appeared to impact network infrastructure within the country, as the aggregate volume of announced IPv4 address space across the country dipped slightly when the power was out.
Tanzania
On March 4, the Tanzania Electricity Corporation (TANESCO)posted a notice on social media regarding an ongoing power outage. It stated (translated) “The Tanzania Electricity Corporation (TANESCO) has notified the public that there has been an error in the National Grid system, resulting in a lack of electricity service in some areas of the country including Zanzibar. Our experts are continuing their efforts to ensure that the electricity service returns to its normal state. The organization apologizes for any inconvenience caused.” The power outage disrupted Internet connectivity in Tanzania, causing an observed drop in traffic between 13:30 and 23:00 local time (10:30 – 20:00 UTC).
Technical problems
Orange España
Network routing is the process of selecting a path across one or more networks, and on the Internet, routing relies on the Border Gateway Protocol (BGP). Historically, the exchange of BGP routing information was based on trust between providers, but over time, security mechanisms such as Resource Public Key Infrastructure (RPKI) have been developed to prevent abuse of the system by bad actors. RPKI is a cryptographic method of signing records that associate a BGP route announcement with the correct originating AS number. ROA (Route Origin Authorization) records provide a means of verifying that an IP address block holder has authorized an AS (Autonomous System) to originate routes to that one or more prefixes within the address block. Cloudflare has published a number of blog posts over the years about the importance of, and our support for, RPKI. Properly implemented and configured, RPKI and ROAs help support routing security, effectively preventing behavior like BGP hijacking.
Because Cloudflare enforces RPKI validation, we also rejected the RPKI-invalid routes. We would have started trying to reach Orange España over our default route toward some of our transit providers, but because they also perform RPKI validation, traffic would have been dropped within those provider networks as well. Because of this, from Cloudflare’s perspective, this incident caused a drop in traffic from Orange España between 16:45 and 19:45 local time (14:45 – 17:45 UTC) as well as a notable drop in announced IPv4 address space from AS12479.
On January 11, subscribers of AS34700 (MaxNet) in Ukraine experienced a nine-hour Internet outage. Initial traffic loss occurred around 16:00 local time (14:00 UTC), and recovered around 01:00 local time on January 12 (23:00 UTC on January 11). An initial social media post from the provider explained the reason for the outage, noting (translated) “Dear subscribers! Due to the flooding of one of the hub sites due to a utility malfunction, some areas of the city may be without services, partially or completely. We are doing our best to restore services, but it takes time. Further information regarding the opening times will be published as soon as the emergency works have been completed.” A subsequent post informed subscribers that Internet connectivity had been restored. The flooding apparently impacted core routing infrastructure as well, as the volume of IPv4 address space announced by MaxNet also fell to zero between 16:00 and 22:00 local time (14:00 – 20:00 UTC).
Plusnet (United Kingdom)
A traffic disruption observed on AS6871 (Plusnet) in the United Kingdom on January 15 was initially characterized as a “mass outage” by the provider in replies to customer complaints on social media. However, the underlying cause of the disruption turned out to be significantly less sensational – it was apparently linked to problems with their DNS servers. Because subscribers were unable to successfully resolve hostnames using Plusnet’s default DNS resolvers, this ultimately manifested itself as a drop in traffic from the network for approximately two hours, between 16:00 and 18:00 local time (and UTC). Users that had configured their systems to use a third-party DNS resolver, such as Cloudflare’s 1.1.1.1 service, did not experience a service disruption.
Russia
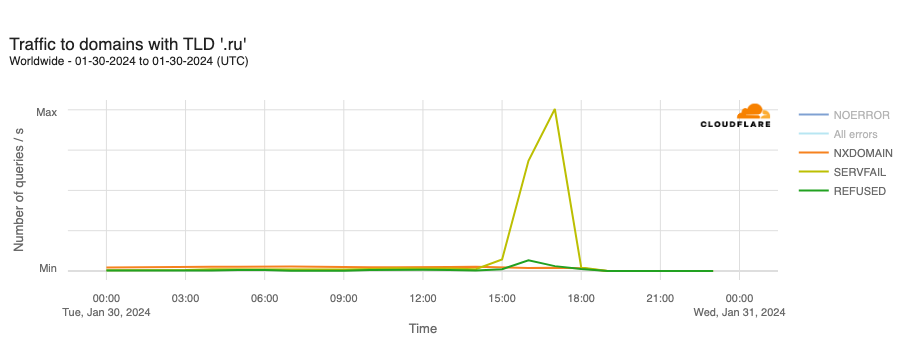
DNS issues also impacted users in Russia during January, though in a different way than Plusnet subscribers in the UK experienced. A reportedDNSSEC failure on January 30 resulted in .ru domains becoming inaccessible for several hours. (DNSSEC creates a secure domain name system by adding cryptographic signatures to existing DNS records. By checking its associated signature, you can verify that a requested DNS record comes from its authoritative name server and wasn’t altered en-route, as opposed to a fake record injected in a man-in-the-middle attack.)
The DNSSEC validation failure resulted in SERVFAIL responses to DNS lookups against Cloudflare’s 1.1.1.1 resolver for hostnames in the .ru country code top level domain (ccTLD). At peak, 68.4% of requests received SERVFAIL responses. The Coordination Center for the .ru ccTLD confirmed that it was working on the “technical problem affecting the .ru zone associated with the global DNSSEC infrastructure” but didn’t provide any additional details around the root cause of the problem, such as a potential issue with a DNSSEC key rollover. The .ru ccTLD experienced a similar DNSSEC-related outage for several hours on August 16, 2019, as well.
AT&T (United States)
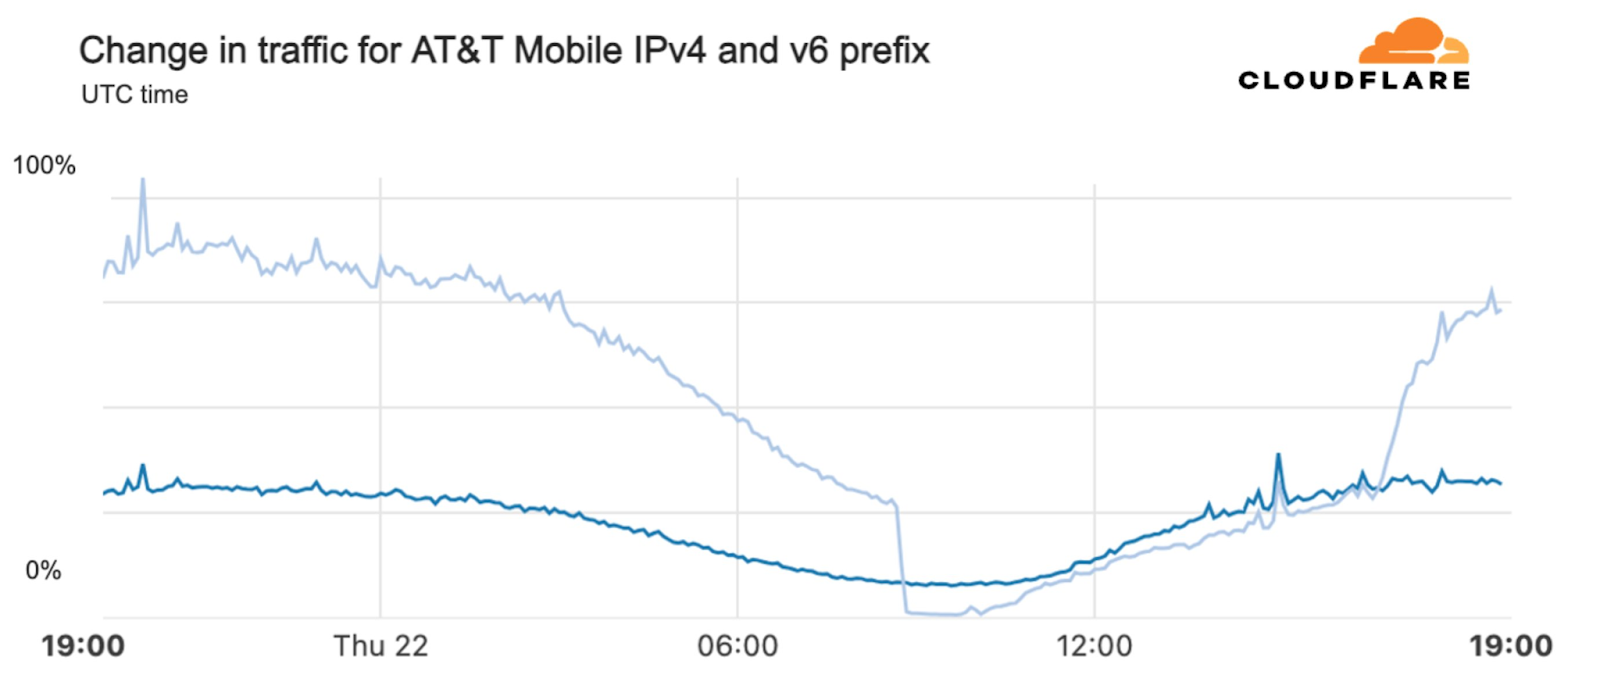
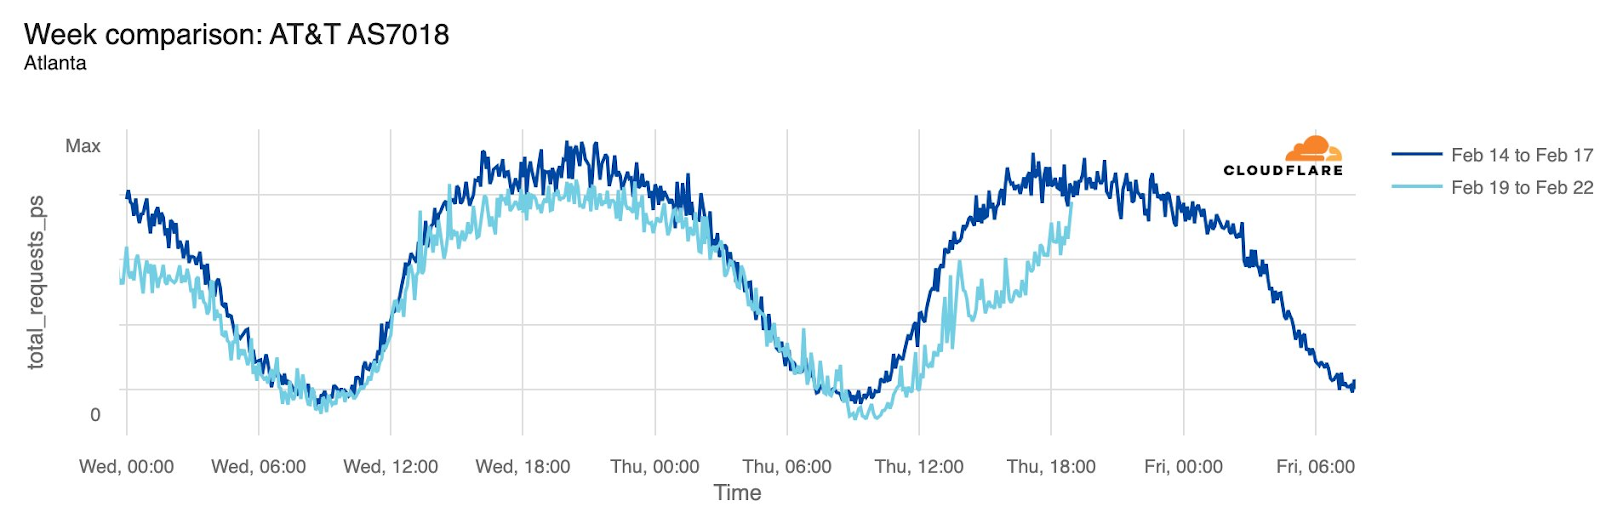
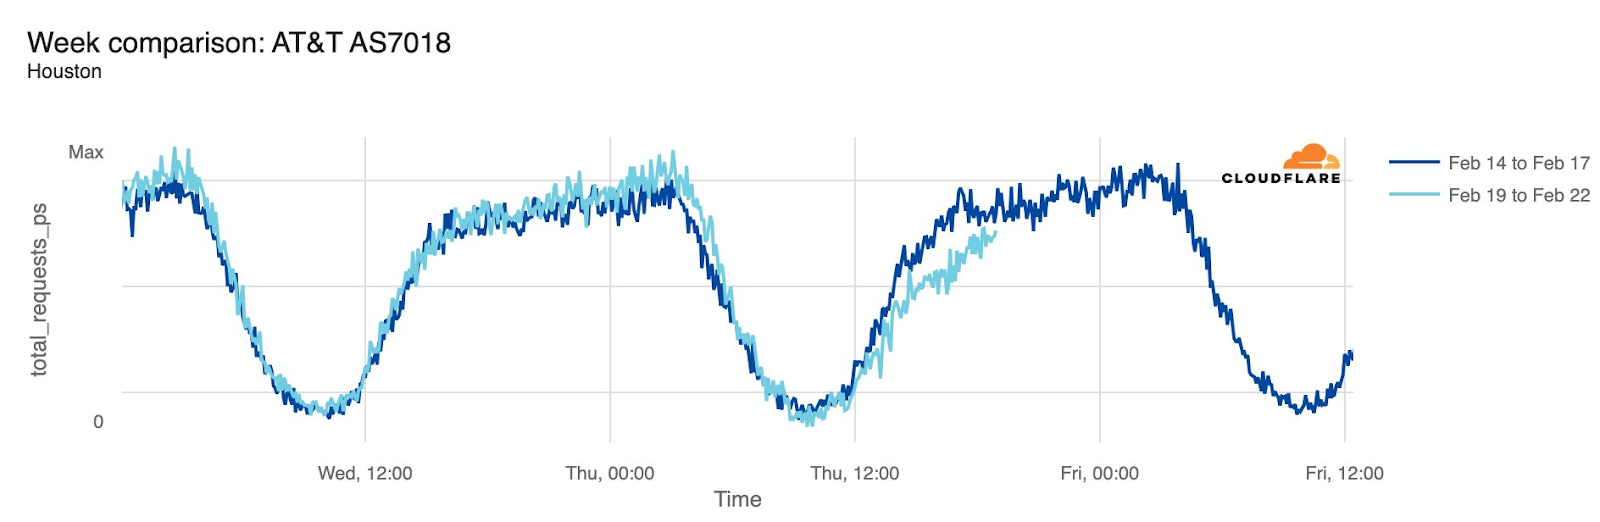
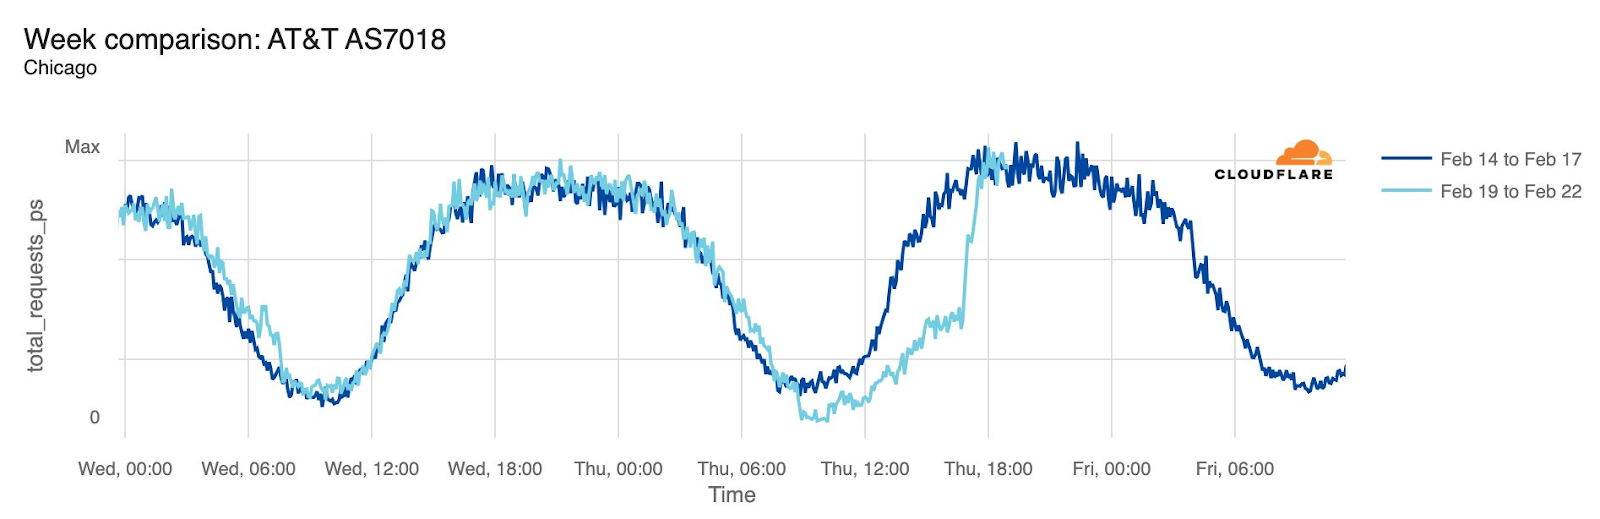
Starting just before 04:00 Eastern / 03:00 Central (09:00 UTC) on February 22, AT&T subscribers in several cities across the United States experienced mobile service interruptions. Impacted cities included Atlanta, Houston, and Chicago, with connectivity disrupted for approximately eight hours. Cloudflare data showed that as the problem began, AT&T (AS7018) traffic dropped as much as 45% in Chicago and 18% in Dallas, as compared with the previous week.
According to a “network update” published by AT&T, “Based on our initial review, we believe that today’s outage was caused by the application and execution of an incorrect process used as we were expanding our network, not a cyber attack.”
Just before noon local time (05:15 UTC) on March 12, a significant drop in traffic was observed on AS136442 (Ocean Wave), a consumer fiber and business Internet service provider in Myanmar. A (translated) social media post from the provider noted “Ocean Wave customers, please be informed that there will be no internet/ slow connection due to network maintenance.” The connectivity disruption lasted approximately seven hours, with traffic returning to typical levels just before 19:00 local time (12:15 UTC).
Conclusion
Two notable submarine cable damage events during the first quarter again highlighted the importance of protecting submarine cables, and the risks associated with them passing through/near geopolitically sensitive areas. Given the reliance on submarine cables for carrying Internet traffic, this will continue to be an issue for many years to come.
The Orange España incident also shed light on the importance of securing operationally important resources with multi-factor authentication, a topic that Cloudflare has written about in the past. Organizations like RIPE play a critically important behind-the-scenes role in functioning of the Internet, arguably obligating them to take all practical precautions when it comes to securing their systems in order to prevent malicious actors from taking actions that could broadly disrupt Internet connectivity.
(UPDATED on April 15, 2024, with information regarding the Palestinian territories.)
As news came on Saturday, April 13, 2024, that Iran was launching a coordinated retaliatory attack on Israel, we took a closer look at the potential impact on Internet traffic and attacks. So far, we have seen some traffic shifts in both Israel and Iran, but we haven’t seen a coordinated large cyberattack on Israeli domains protected by Cloudflare.
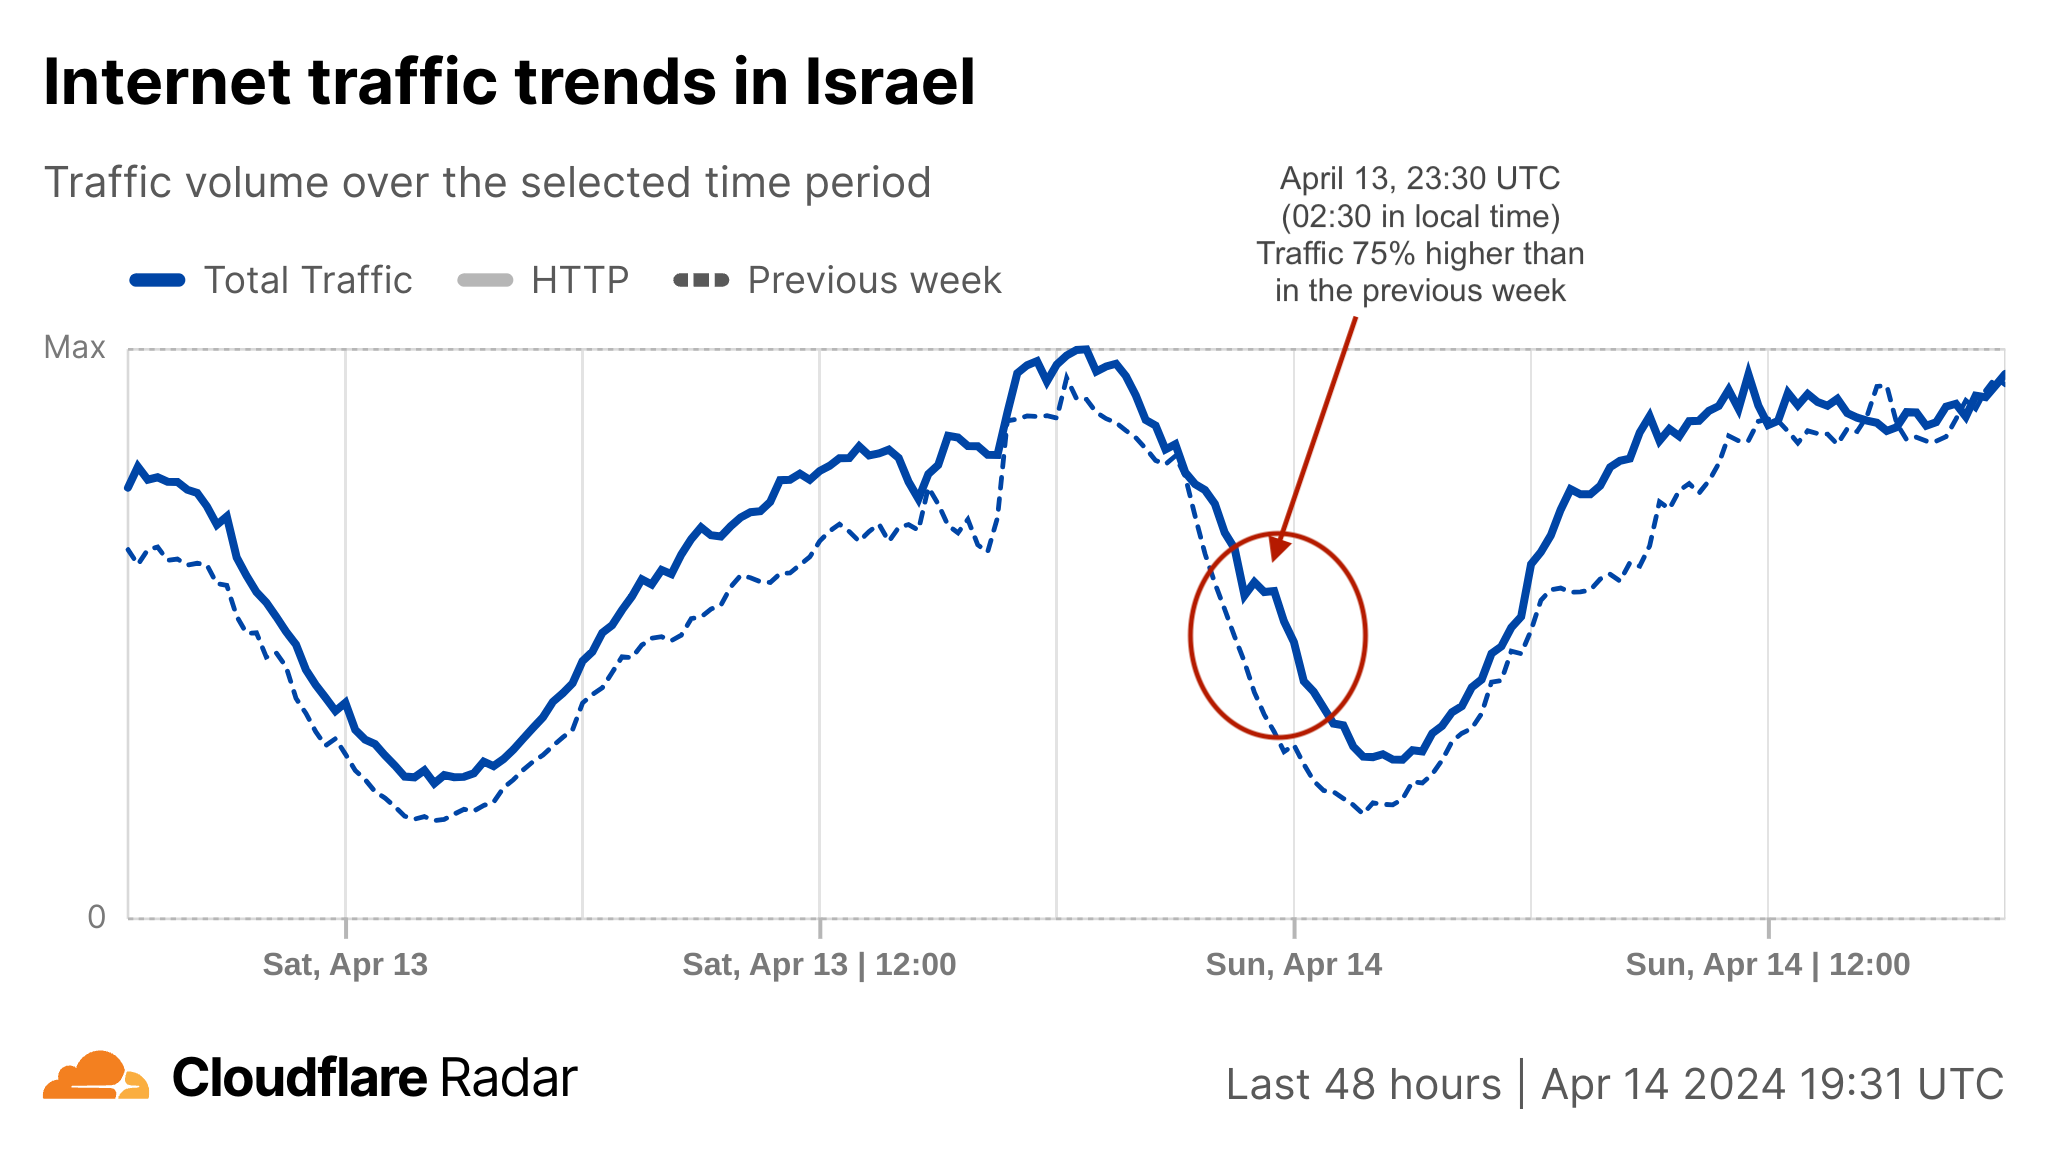
First, let’s discuss general Internet traffic patterns. Following reports of attacks with drones, cruise missiles, and ballistic missiles, confirmed by Israeli and US authorities, Internet traffic in Israel surged after 02:00 local time on Saturday, April 13 (23:00 UTC on April 12), peaking at 75% higher than in the previous week around 02:30 (23:30 UTC) as people sought news updates. This traffic spike was predominantly driven by mobile device usage, accounting for 62% of all traffic from Israel at that time. Traffic remained higher than usual during Sunday.
Around that time, at 02:00 local time (23:00 UTC), the IDF (Israel Defense Forces) posted on X that sirens were sounding across Israel because of an imminent attack from Iran.
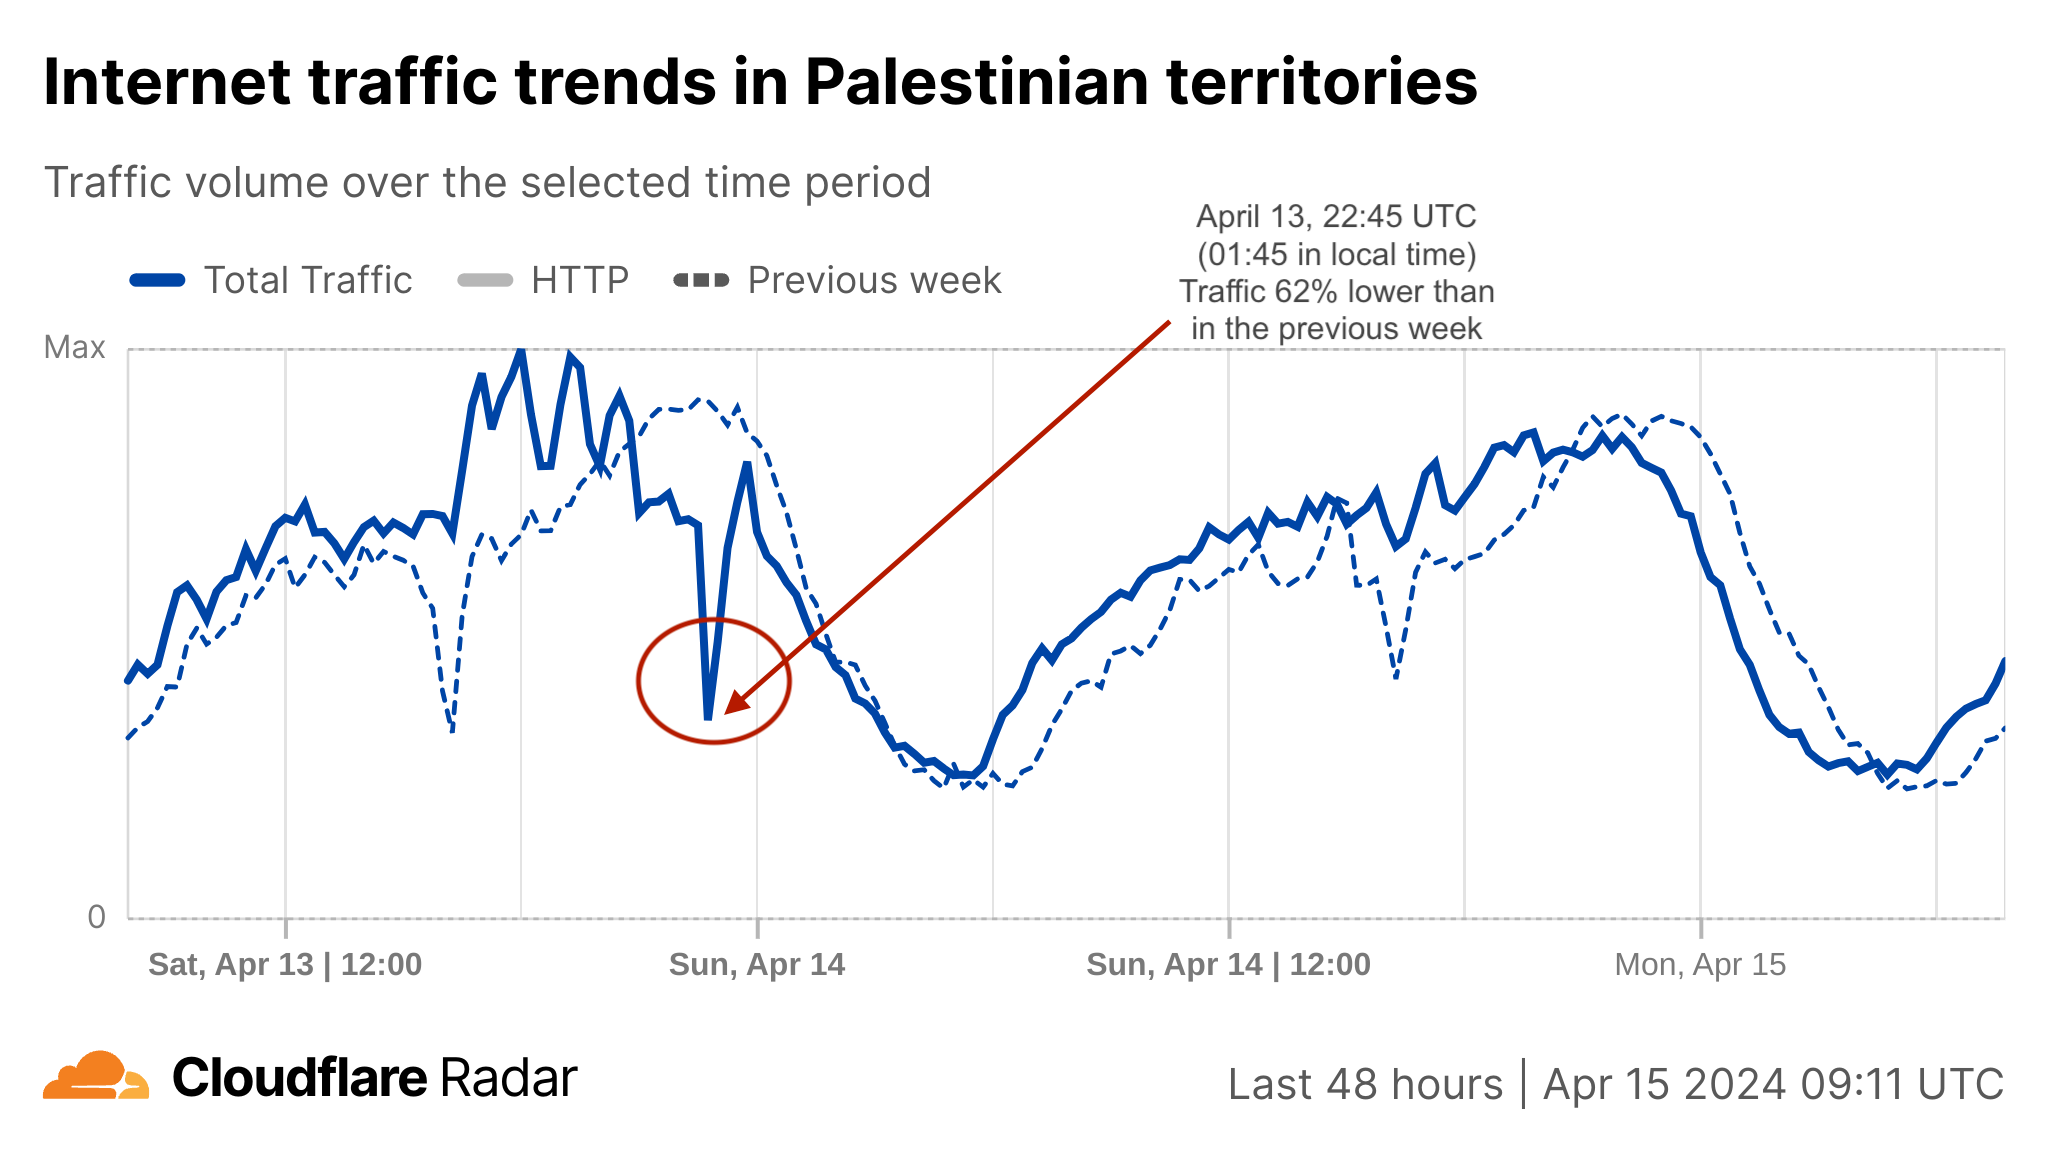
(April 15 UPDATE: the Palestinian territories related part). At around the same time, 01:25 local time (22:45 UTC), when the sirens were sounding in Israel, we observed not an increase, but a clear drop in traffic in Palestinian territories. The noticeable drop was seen in all of the Palestinian governorates, although it was a bigger drop in the West Bank, than in the Gaza Strip.
Usually, based on our past observations, drops in traffic unrelated to connectivity issues can occur when people pause their online activities for some reason (an eclipse or war, for example) or turn to television for news updates instead of the Internet (common during election days when TVs broadcast the latest exit polls).
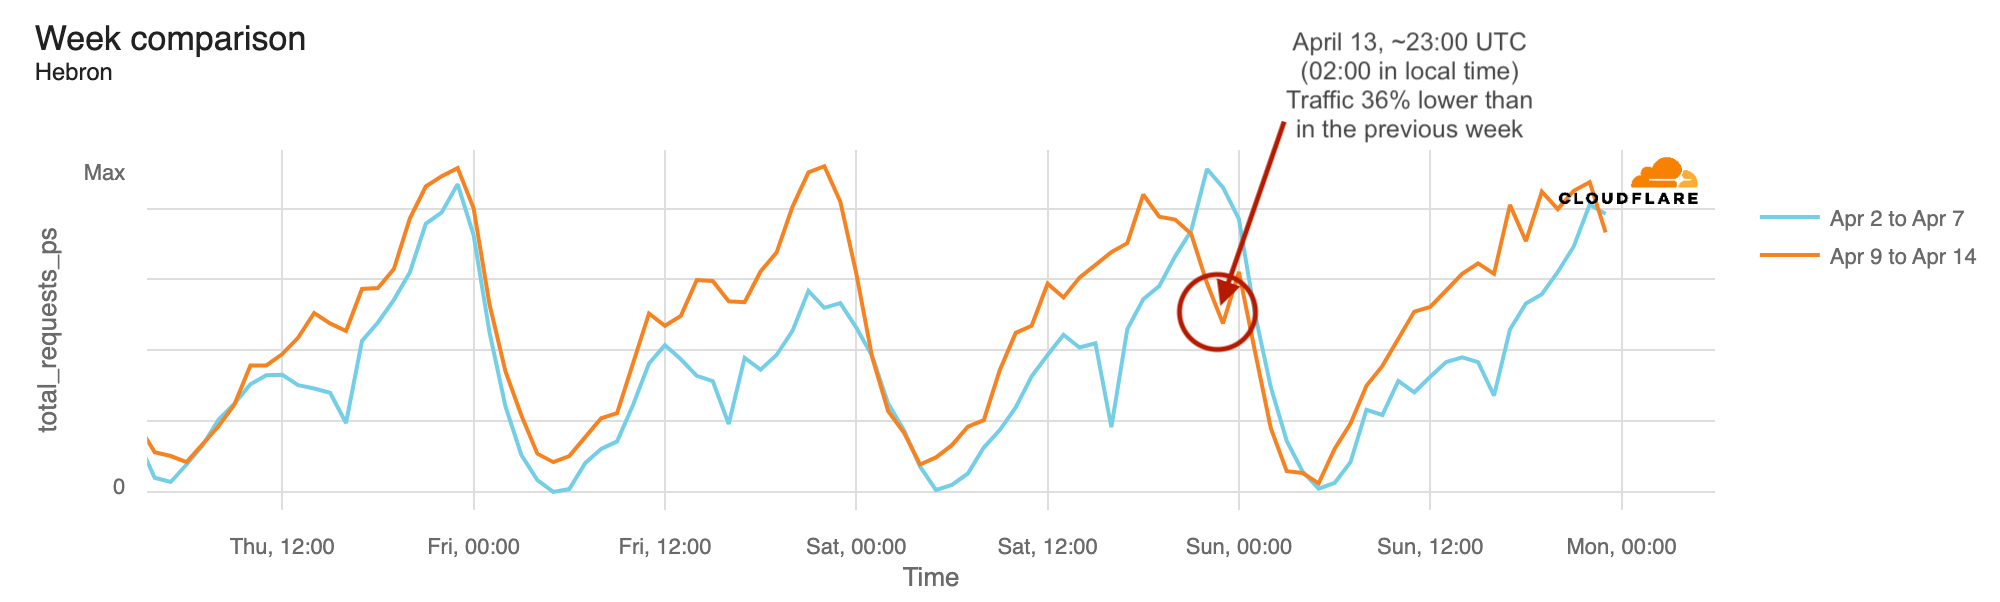
Here’s the noticeable HTTP requests drop in Hebron, one of the most populated states of the Palestinian territories, part of the West Bank. The noticeable drops in the blue line from the previous week are related to the Ramadan, and the Iftar, the first meal after sunset that breaks the fast and often also a family or community event. Ramadan ended on Tuesday, April 9, 2024.
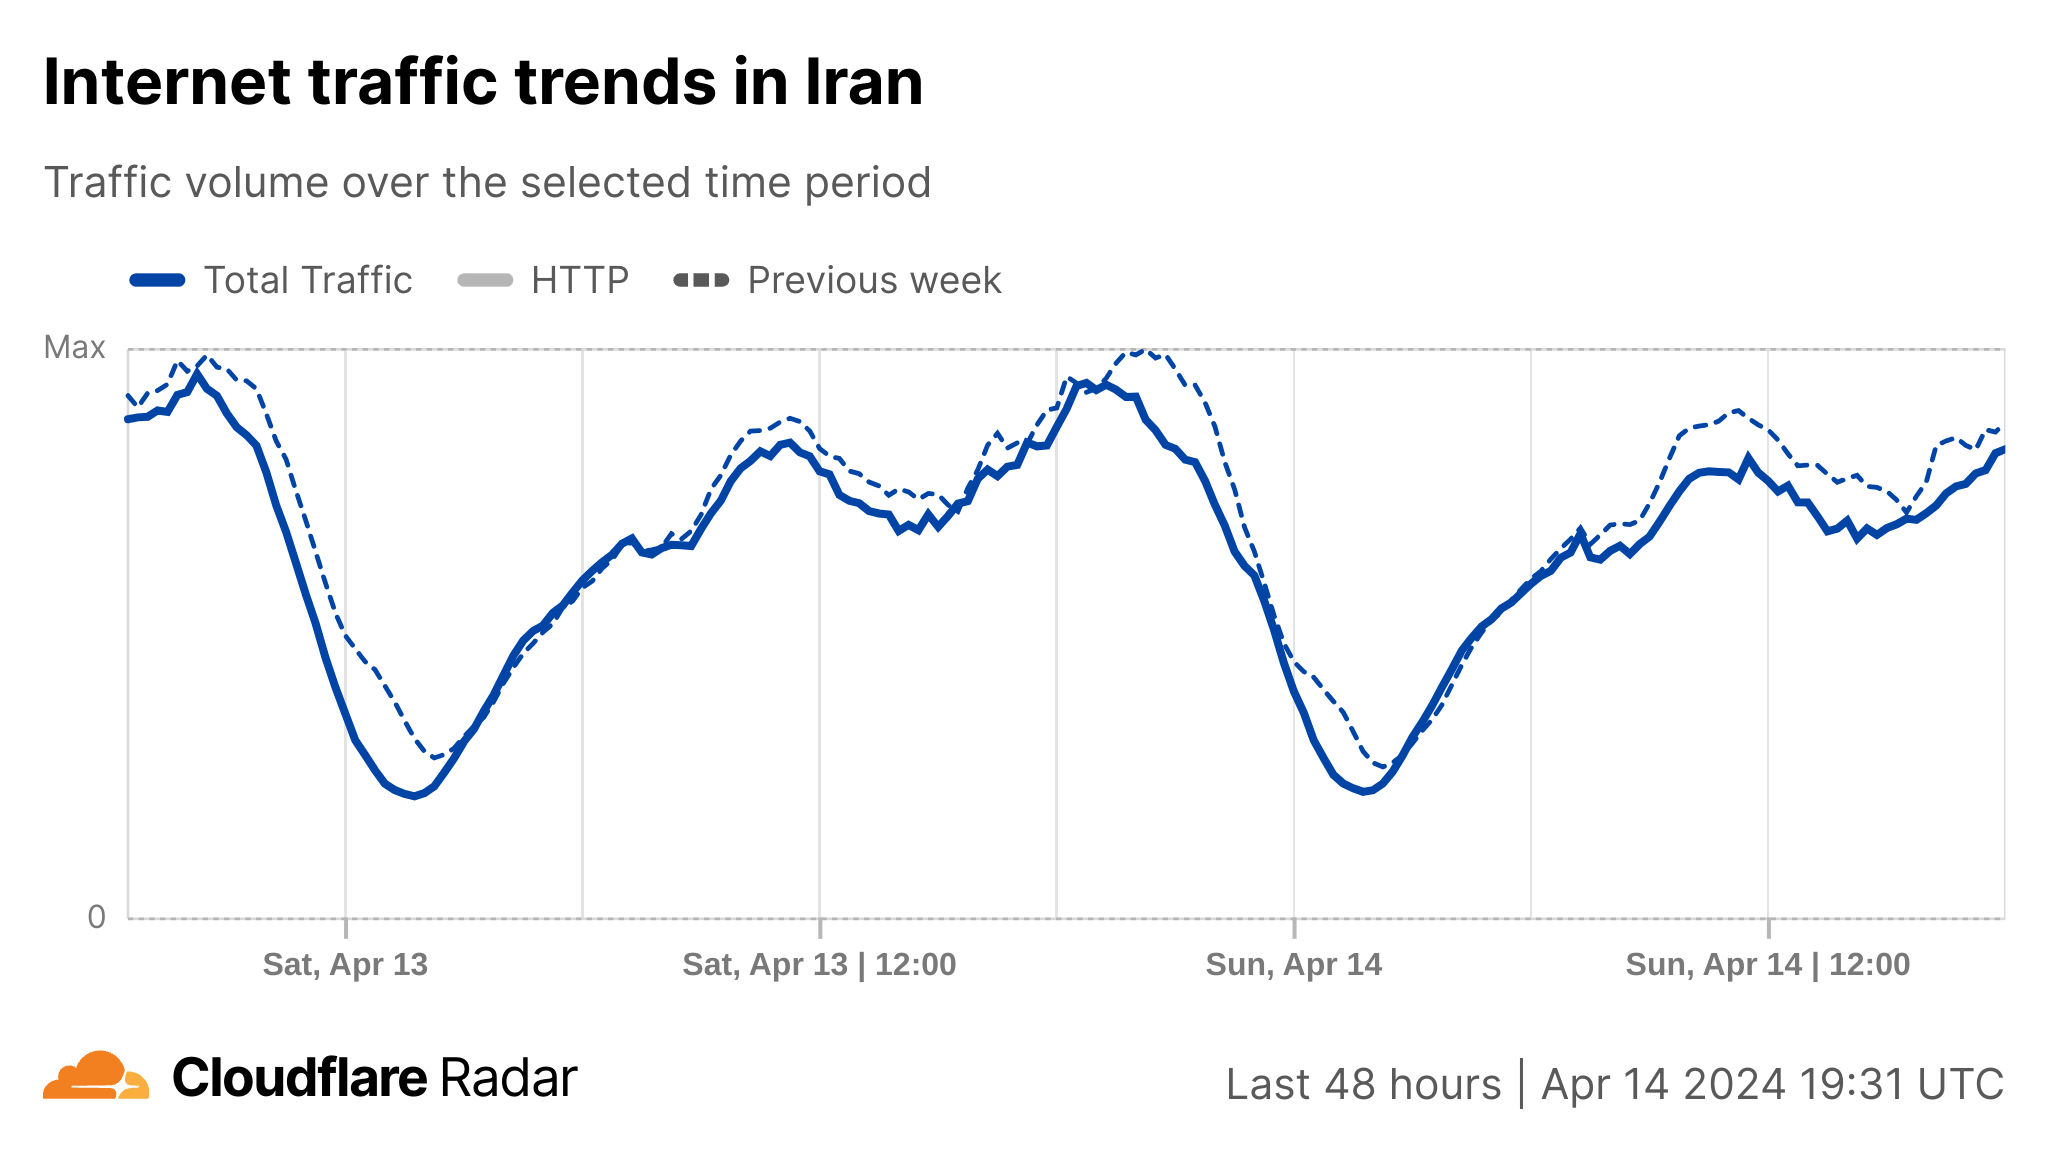
Meanwhile, in Iran, there has been a noticeable decline in traffic over the past few days in the early morning hours, around 04:30 local time (01:00 UTC), as compared to the previous week. However, this decline appears to be linked to the conclusion of Ramadan, which ended April 9. As we have writtenbefore, during Ramadan, there is typically an increase in traffic around 04:00 in most Muslim countries for Suhur, the pre-dawn meal. Nevertheless, traffic was higher in Iran early in the morning of Sunday, April 14 than the previous day, between 02:30 local time (23:00 UTC on April 13) and 07:00 (03:30 UTC).
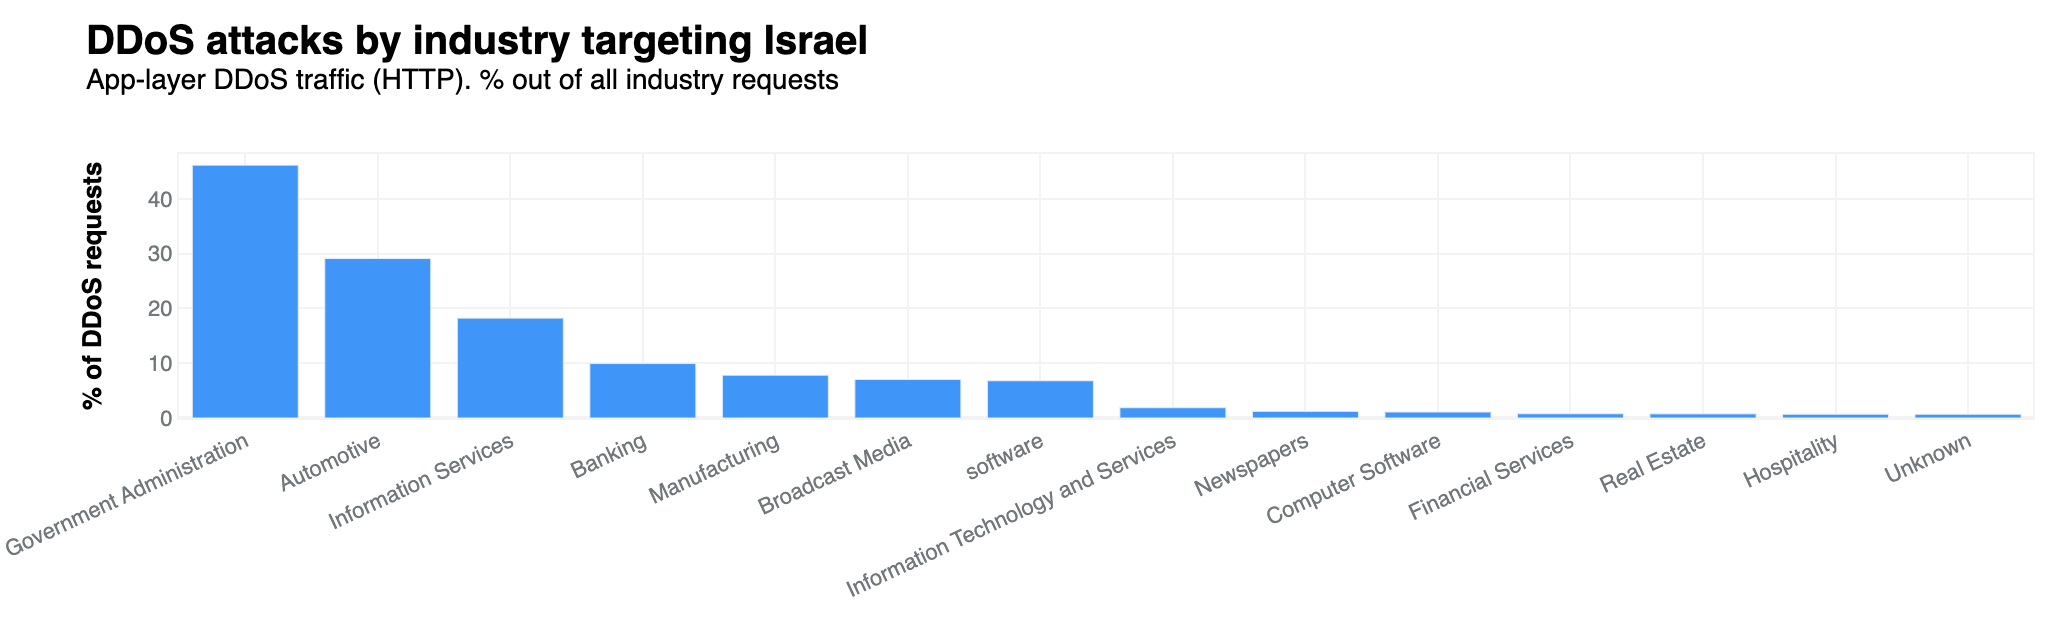
When analyzing application layer attacks, we haven’t observed any significant changes in those targeting Israel over the past few days. However, over the past month, the Government Administration sector emerged as the most targeted industry, with blocked DDoS requests accounting for 46% of all traffic directed towards it.
Based on Cloudflare data, we have not yet seen a coordinated cyberattack campaign targeting Israel. However, we saw a clear uptick in attacks back in October 2023, after the Israel-Hamas war started, as we noted in a blog post at that time.
A photo of the eclipse taken by Bryton Herdes, a member of our Network team, in Southern Illinois.
There are events that unite people, like a total solar eclipse, reminding us, humans living on planet Earth, of our shared dependence on the sun. Excitement was obvious in Mexico, several US states, and Canada during the total solar eclipse that occurred on April 8, 2024. Dubbed the Great North American Eclipse, millions gathered outdoors to witness the Moon pass between Earth and the Sun, casting darkness over fortunate states. Amidst the typical gesture of putting the eclipse glasses on and taking them off, depending on if people were looking at the sky during the total eclipse, or before or after, what happened to Internet traffic?
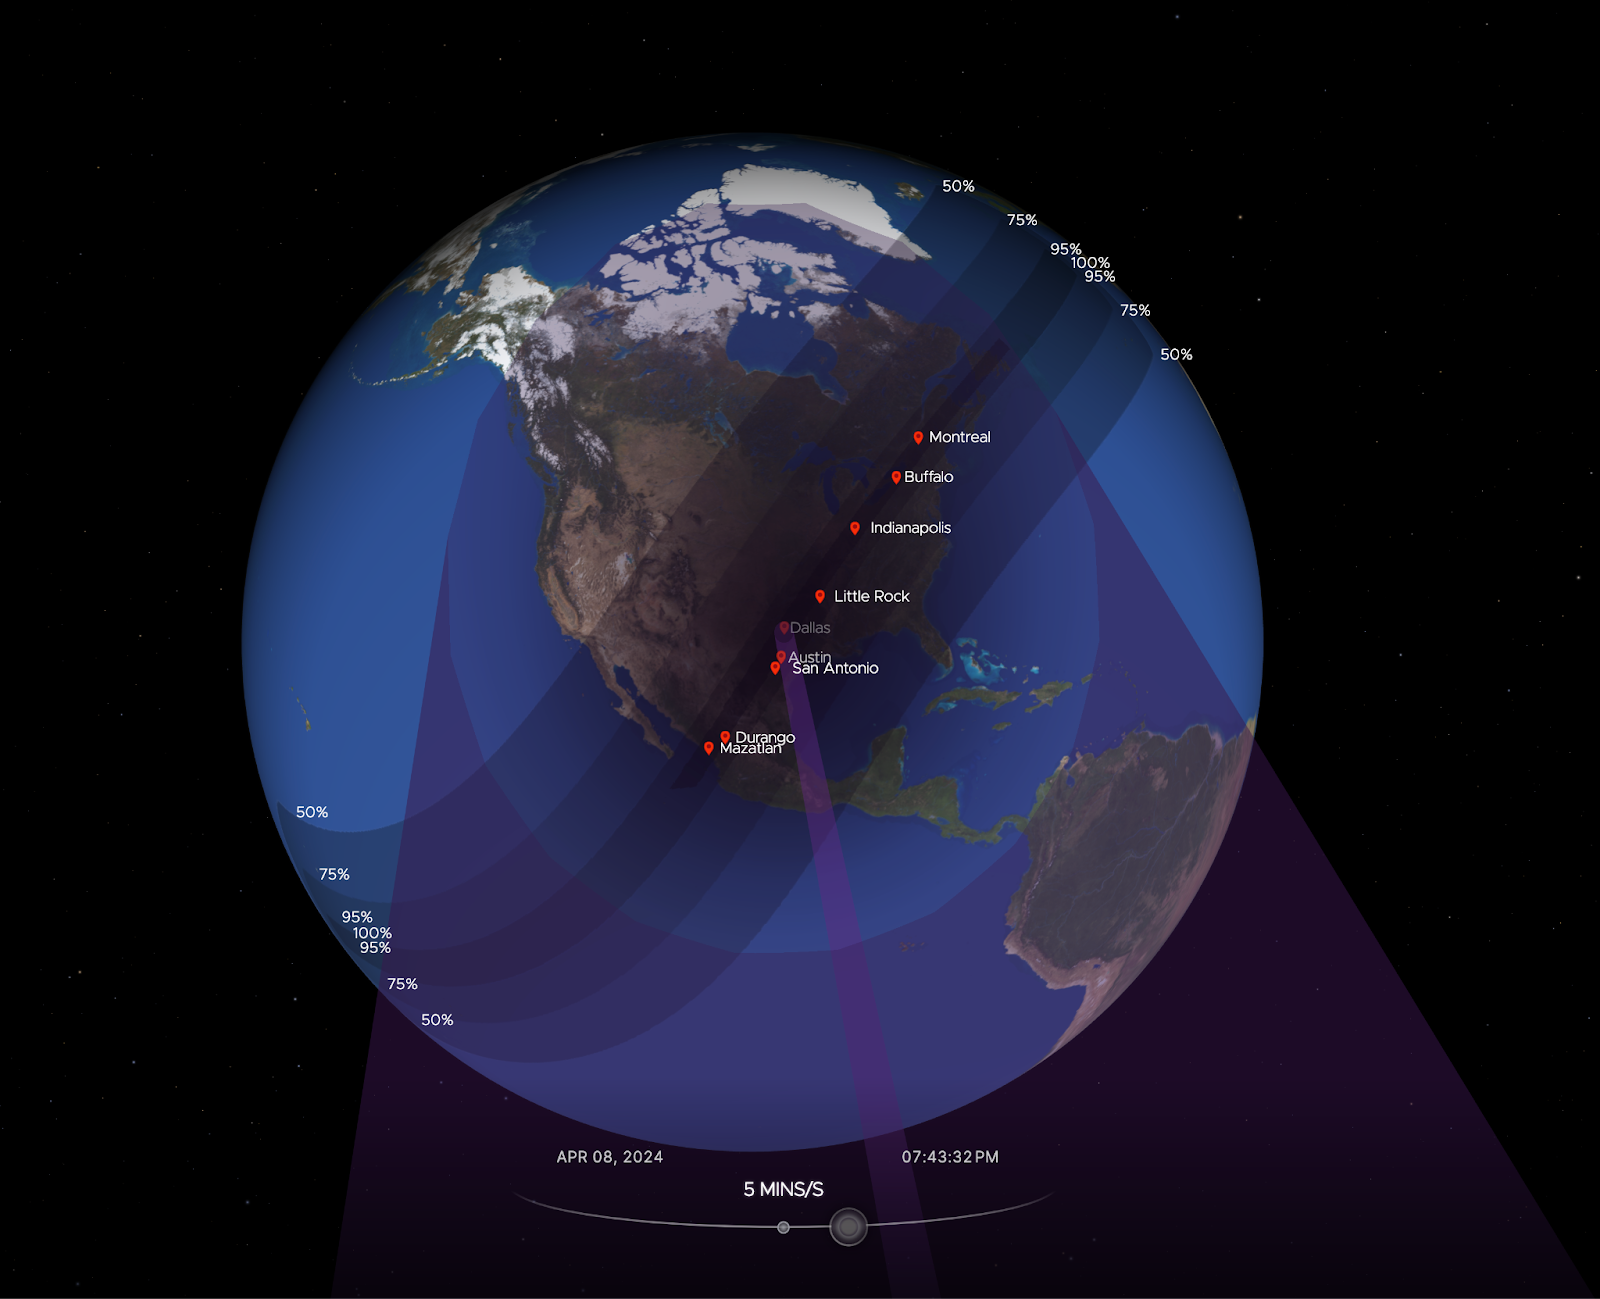
Cloudflare’s data shows a clear impact on Internet traffic from Mexico to Canada, following the path of totality. The eclipse occurred between 15:42 UTC and 20:52 UTC, moving from south to north, as seen in this NASA image of the path and percentage of darkness of the eclipse.
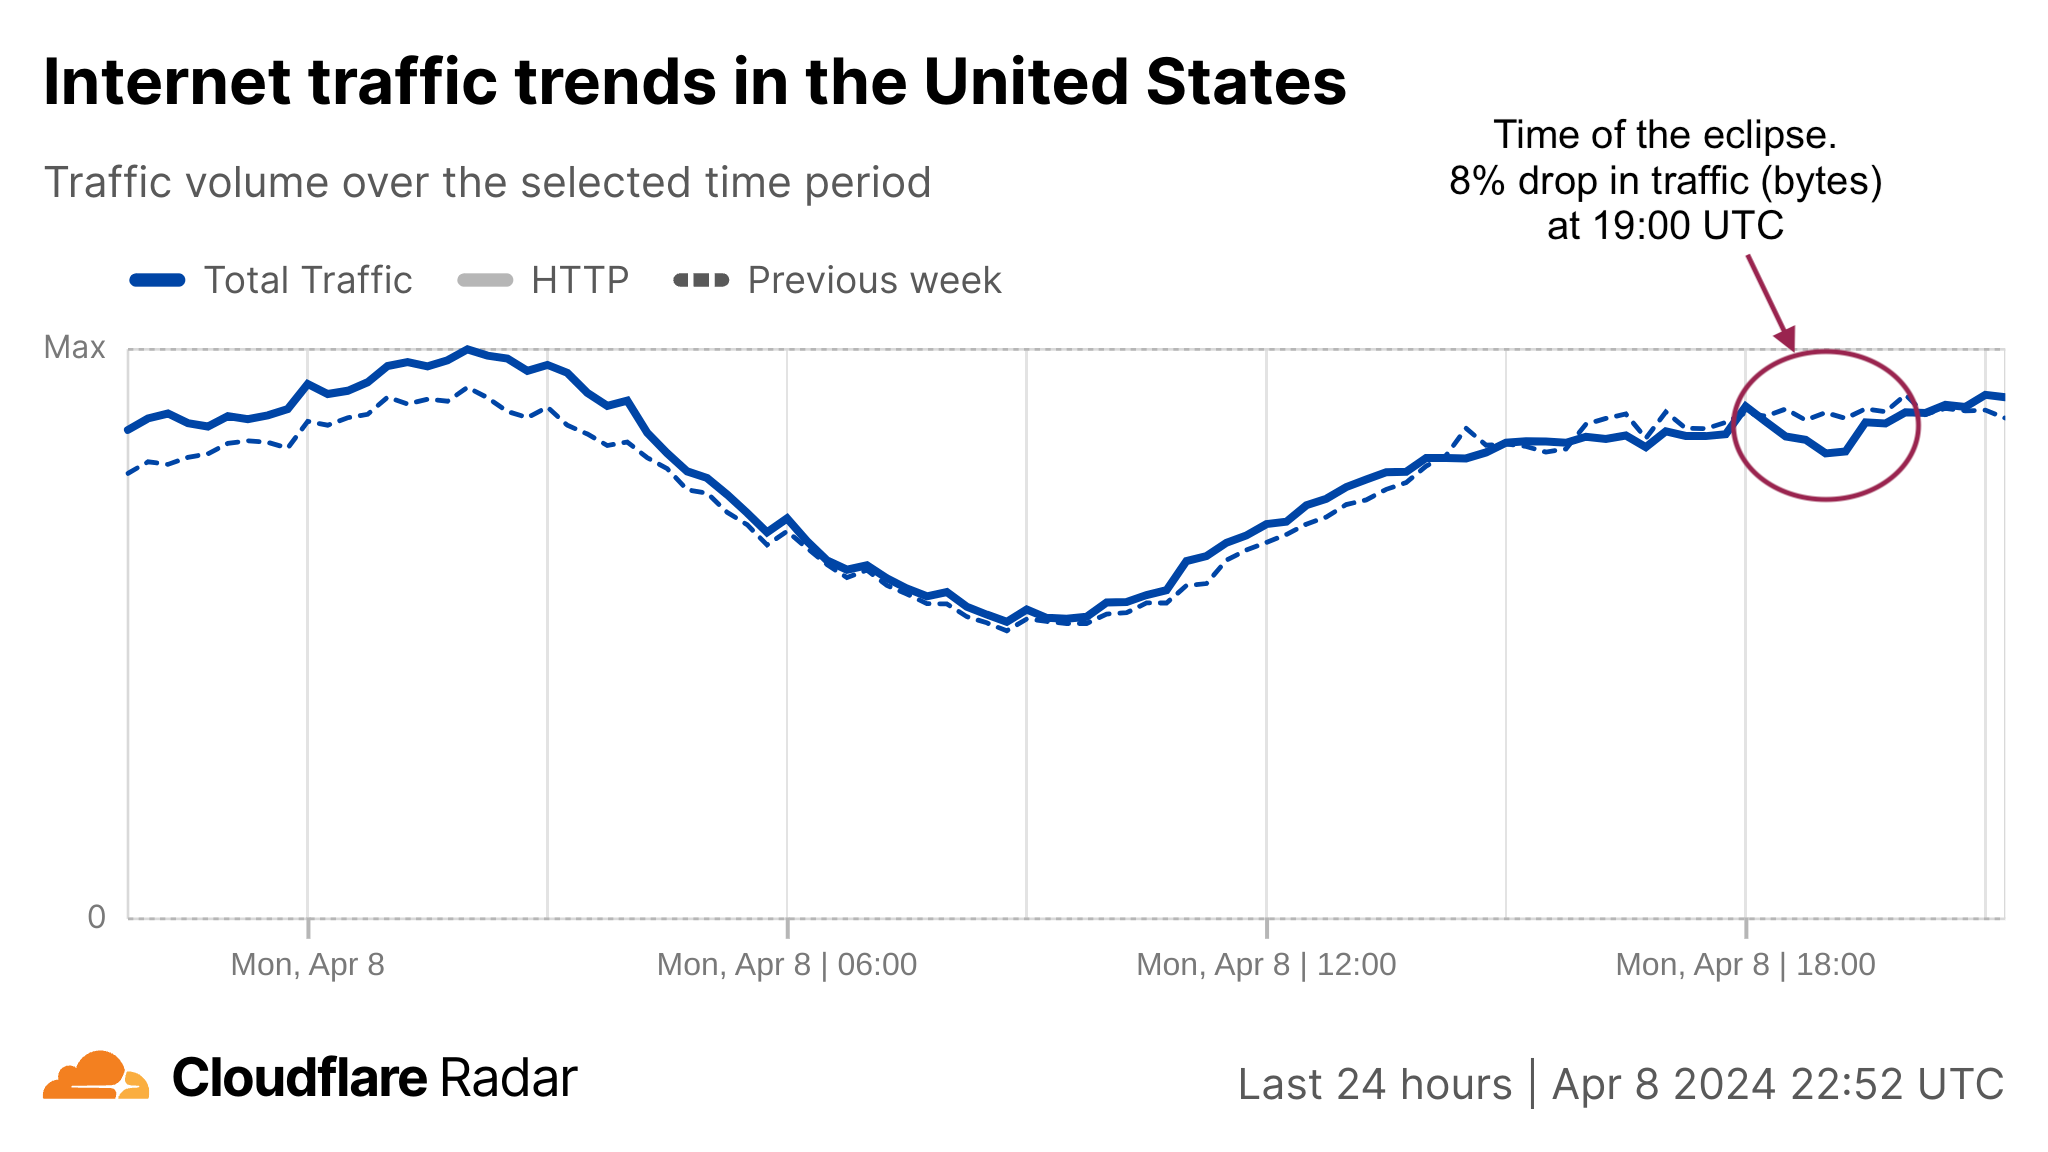
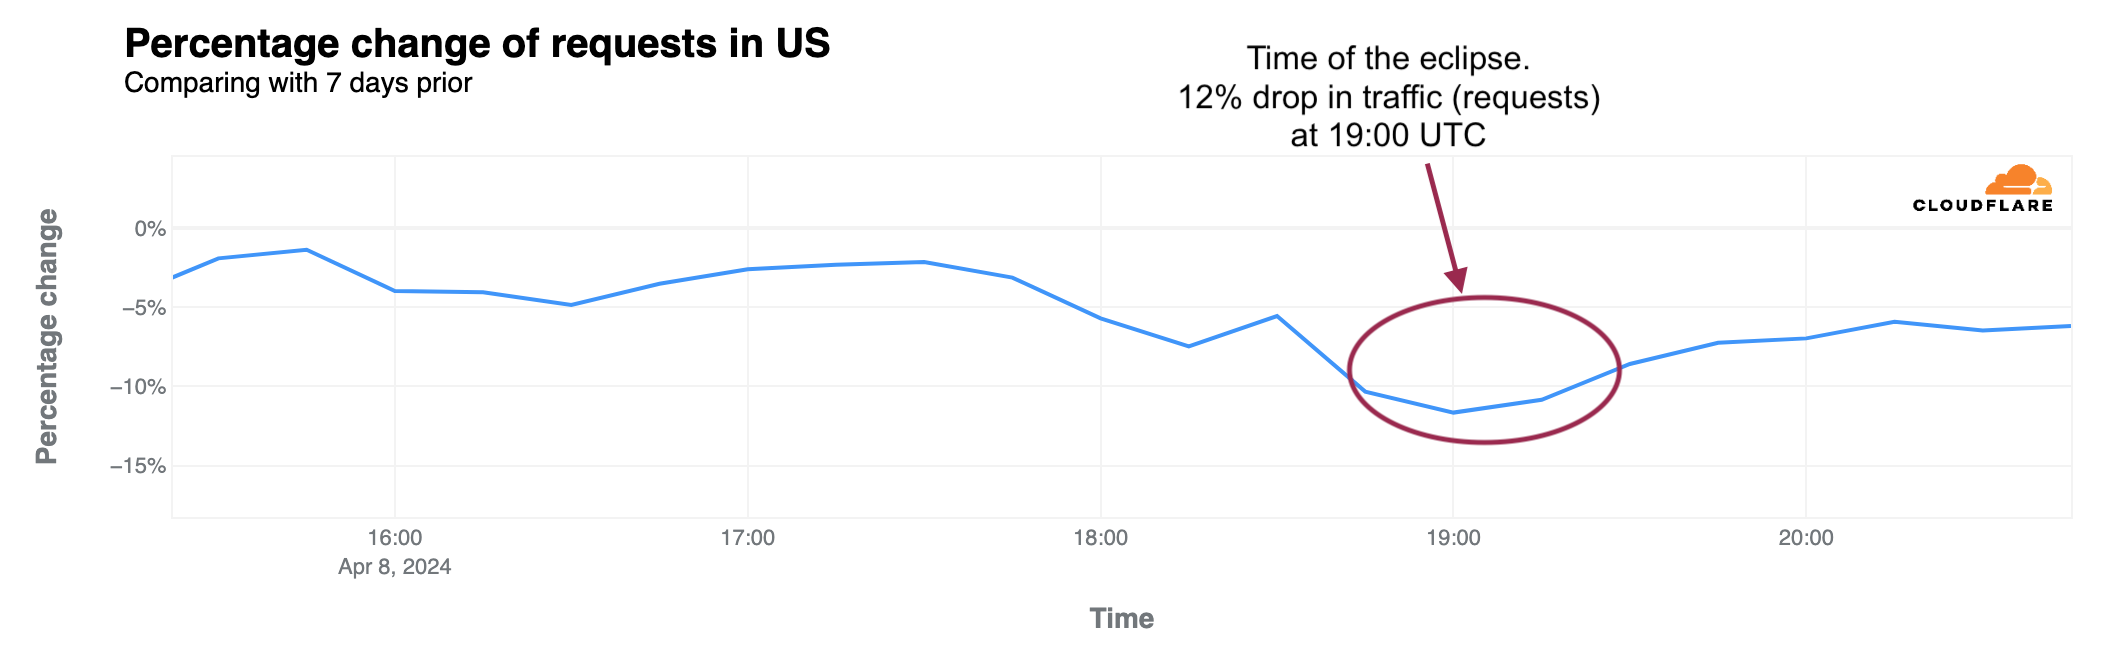
Looking at the United States in aggregate terms, bytes delivered traffic dropped by 8%, and request traffic by 12% as compared to the previous week at 19:00 UTC (14:00 Eastern, 12:00 Pacific).
Bytes delivered percentage change (-8% at 19:00 UTC)HTTP requests percentage change (-12% at 19:00 UTC)
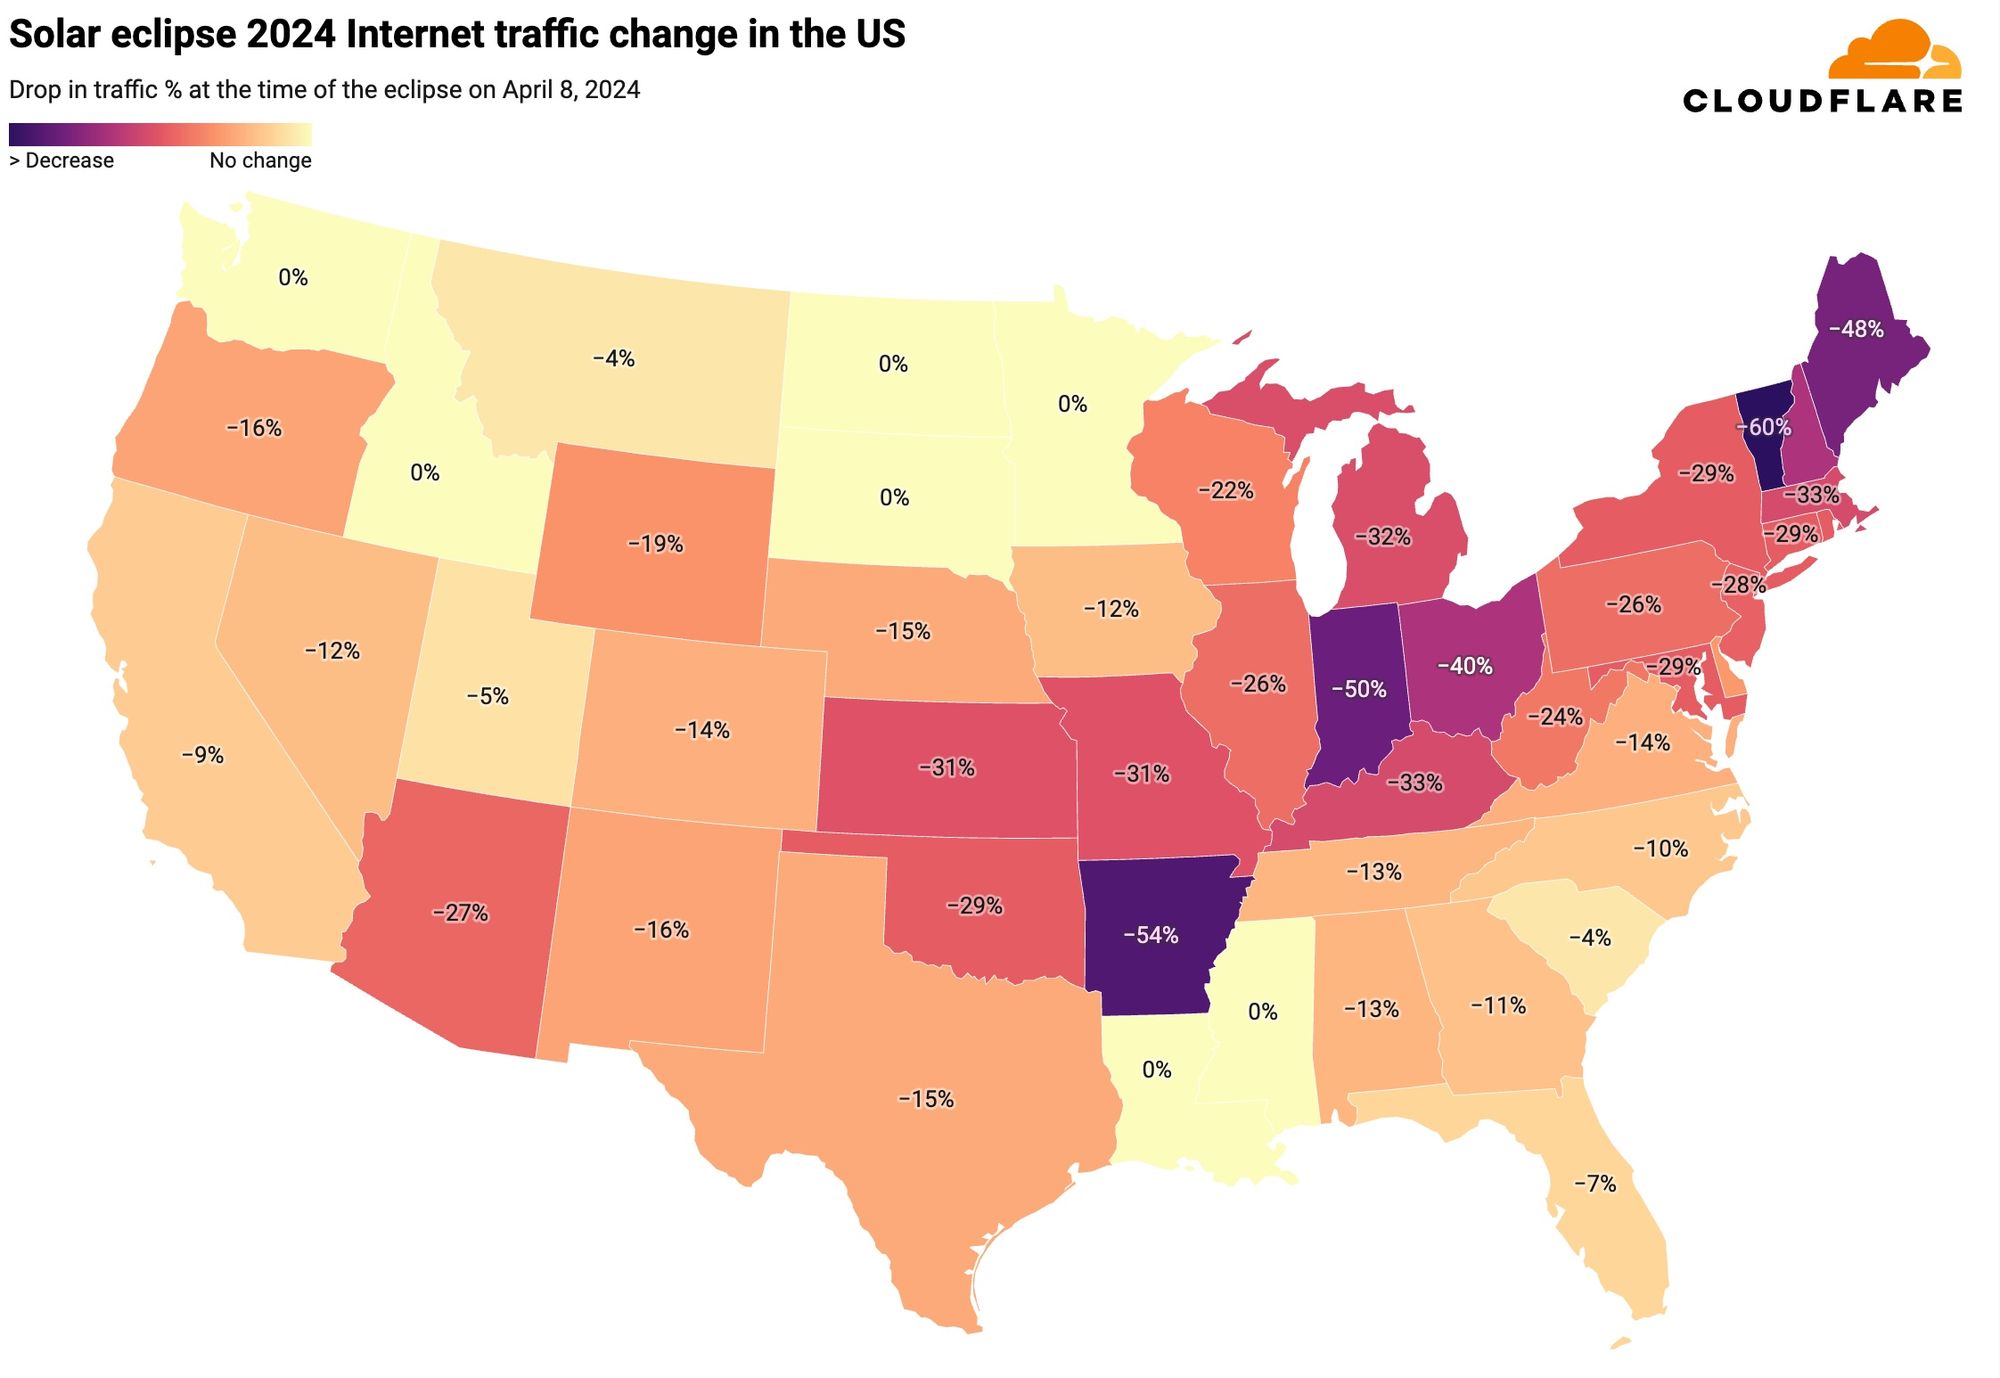
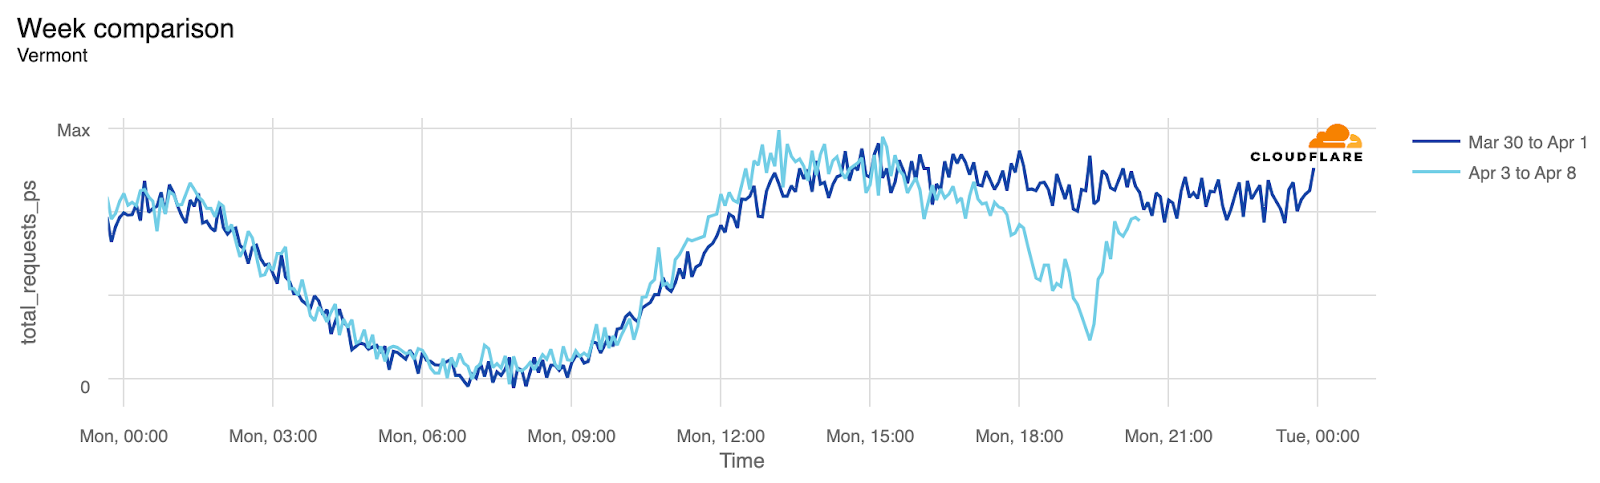
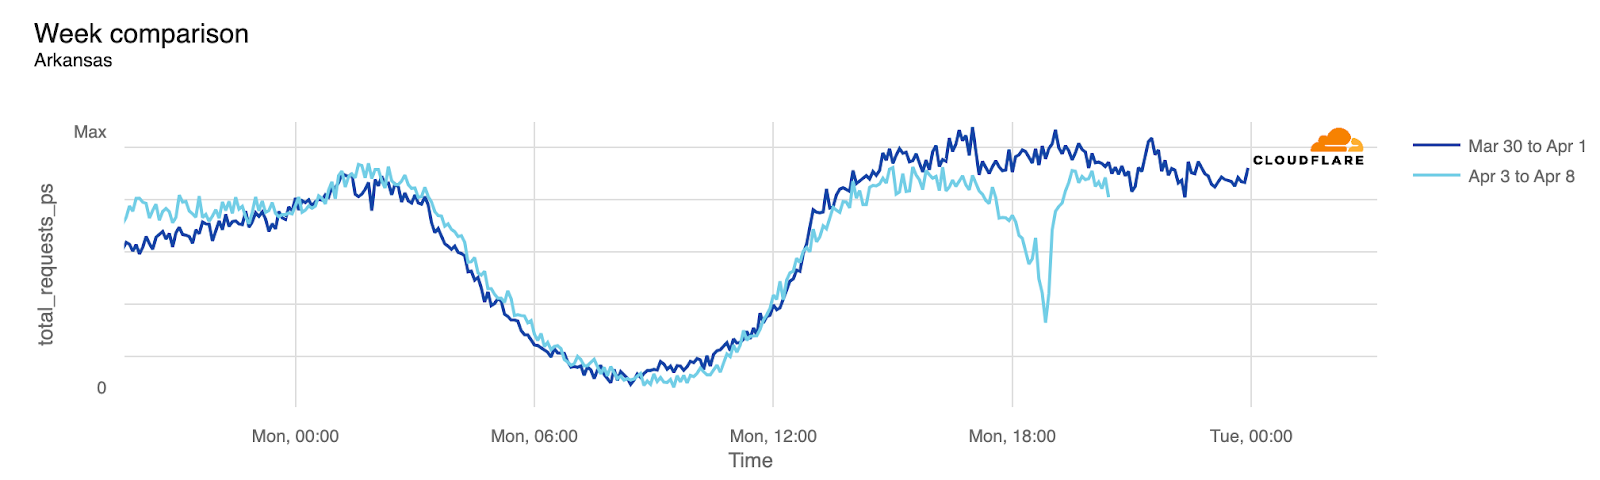
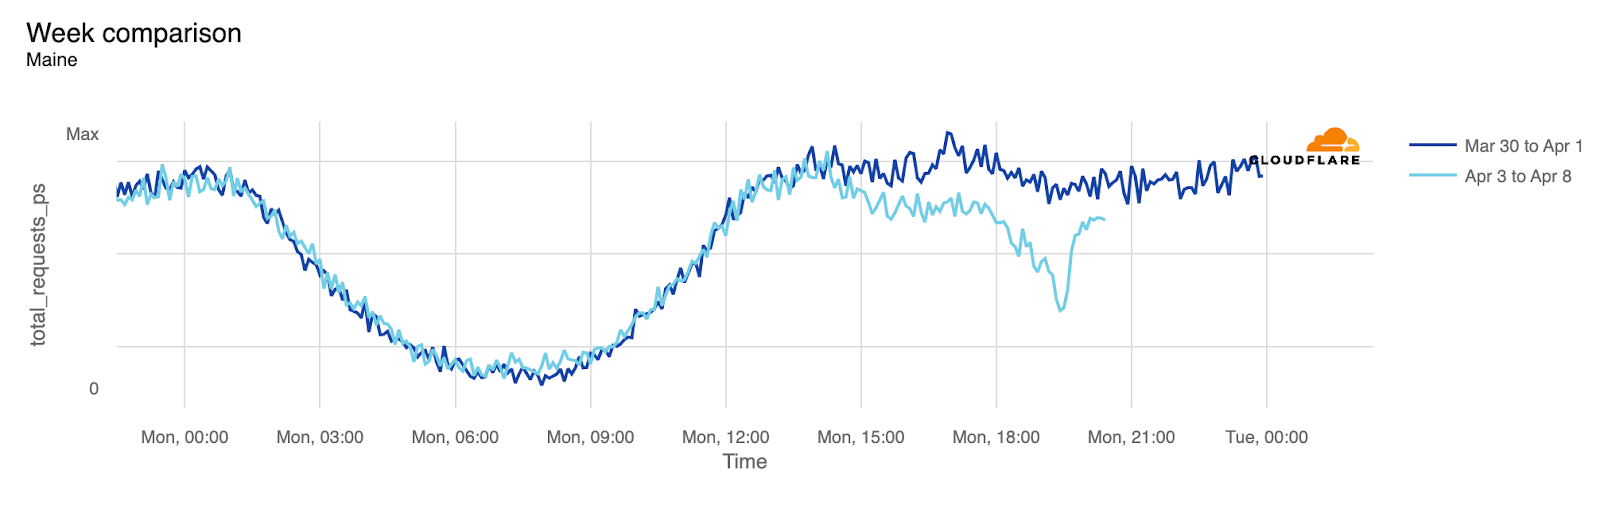
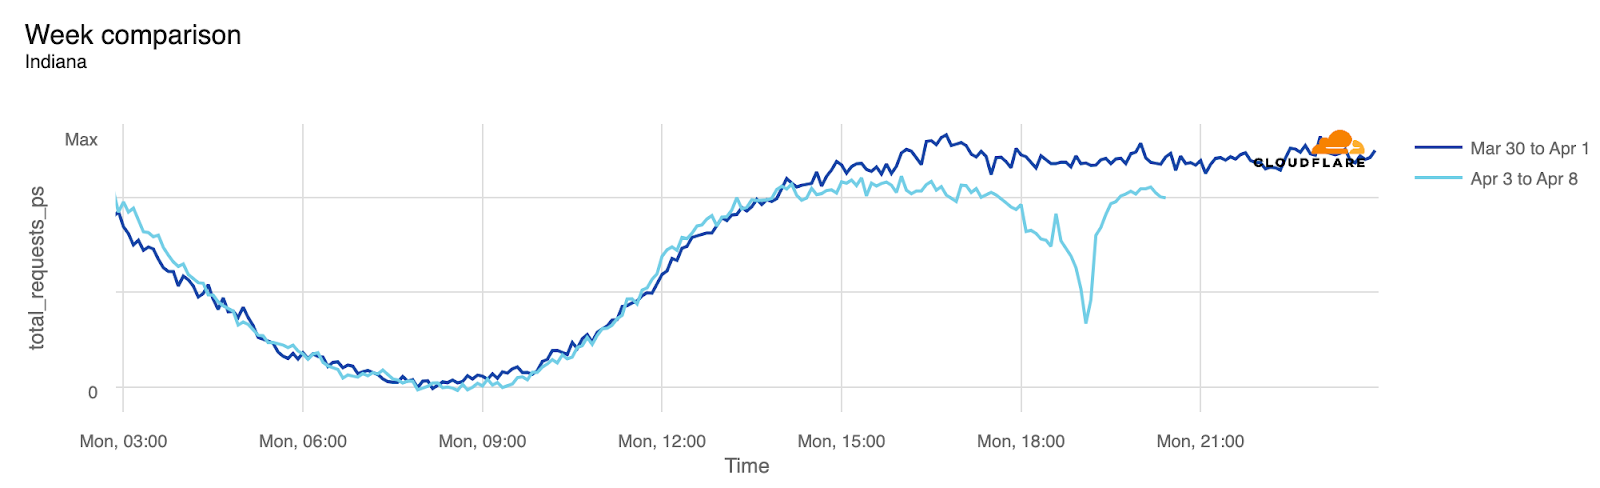
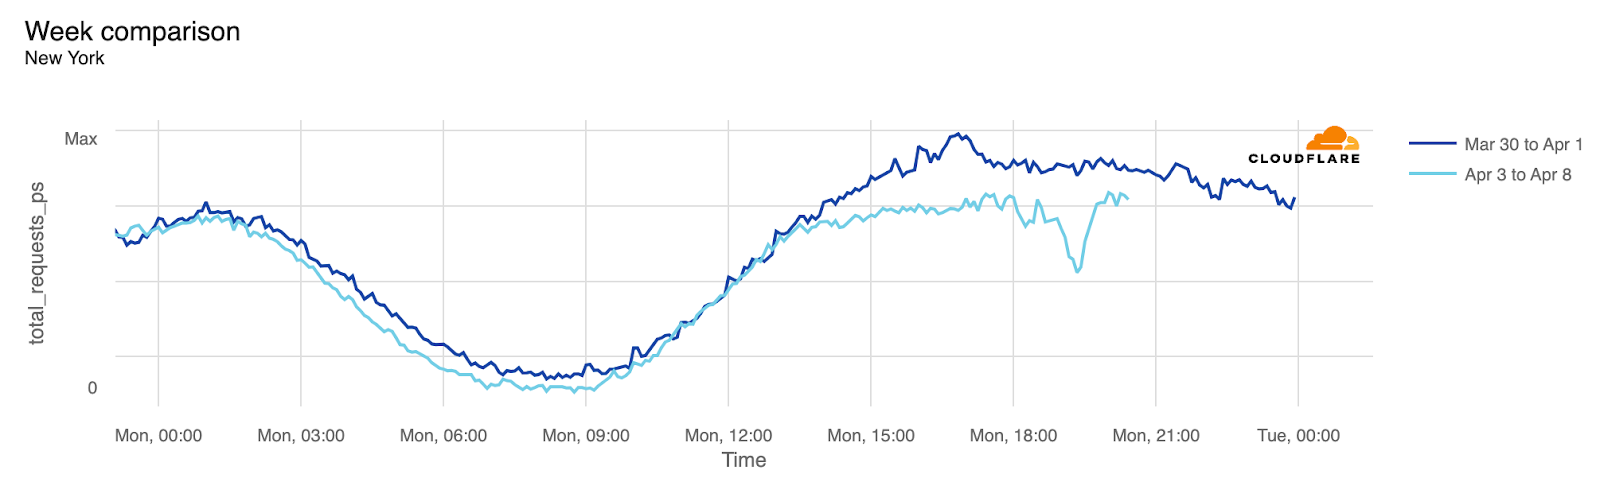
The state-level perspective in terms of traffic drop at the time of the eclipse, as compared to the previous week, is much more revealing. Here’s a summary of the US states’ traffic changes. We can almost trace the path of the eclipse, as shown in the previous NASA image.
From our data, Vermont, Arkansas, Indiana, Maine, New Hampshire, and Ohio experienced traffic drops of 40% or more around the time of the eclipse. These states were all in the path of totality, which was not the case for several others.
In the next table, we provide a detailed breakdown of the same perspective shown on the US map ordered by drop in traffic. In all of these charts, we’re using UTC as the time. We include the time of the biggest traffic drop compared to the previous week, at a 5-minute granularity, and also the percentage of drop compared to the previous week. States where it was possible to see at least part of the total eclipse are highlighted in bold. At the bottom are those with no clear difference.
The US: traffic change at time of the eclipse
State
Time of drop (UTC)
Local time
% of drop
Vermont
19:25
15:25
-60%
Arkansas
18:50
13:50
-54%
Indiana
19:05
15:05
-50%
Maine
19:30
15:30
-48%
New Hampshire
19:20
15:20
-40%
Ohio
19:10
15:10
-40%
Kentucky
19:05
14:05
-33%
Massachusetts
19:25
15:25
-33%
Michigan
19:15
15:15
-32%
Kansas
18:50
13:50
-31%
Missouri
18:55
13:55
-31%
Connecticut
19:20
15:20
-29%
Maryland
19:15
15:15
-29%
New York
19:25
15:25
-29%
Oklahoma
18:45
13:45
-29%
Rhode Island
19:25
15:25
-29%
New Jersey
19:20
15:20
-28%
Arizona
18:15
11:15
-27%
Illinois
19:05
14:05
-26%
Pennsylvania
19:15
15:15
-26%
West Virginia
19:15
15:15
-24%
Wisconsin
19:05
14:05
-22%
Wyoming
18:20
12:20
-19%
Alaska
20:15
12:15
-18%
Delaware
19:20
15:20
-18%
District of Columbia
19:15
15:15
-16%
New Mexico
18:25
12:25
-16%
Oregon
18:15
11:15
-16%
Nebraska
18:50
13:50/12:50
-15%
Texas
18:45
13:45
-15%
Colorado
18:25
12:25
-14%
Virginia
18:20
14:20
-14%
Alabama
19:00
14:00
-13%
Tennessee
19:00
15:00/14:00
-13%
Iowa
18:15
13:15
-12%
Nevada
18:10
11:10
-12%
Georgia
19:05
15:05
-11%
North Carolina
19:10
15:10
-10%
California
18:15
11:15
-9%
Florida
18:15
14:15
-7%
Utah
18:15
12:15
-5%
Montana
18:25
12:25
-4%
South Carolina
19:00
15:00
-4%
Hawaii
—
—
—
Louisiana
—
—
—
Minnesota
—
—
—
Mississippi
—
—
—
North Dakota
—
—
—
Idaho
—
—
—
South Dakota
—
—
—
Washington
—
—
—
Visualized, here’s what Vermont’s 60% drop looks like:
And here’s what the traffic drops in Arkansas, Maine, and Indiana look like:
In terms of states with larger populations, New York took the lead:
Mexico got the eclipse first
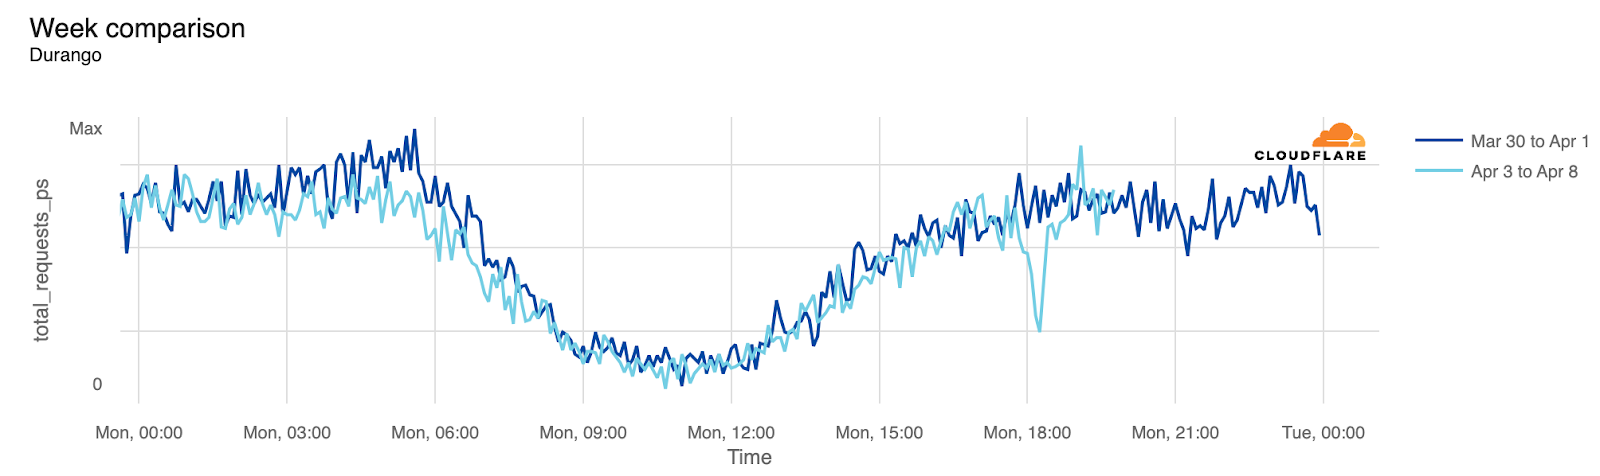
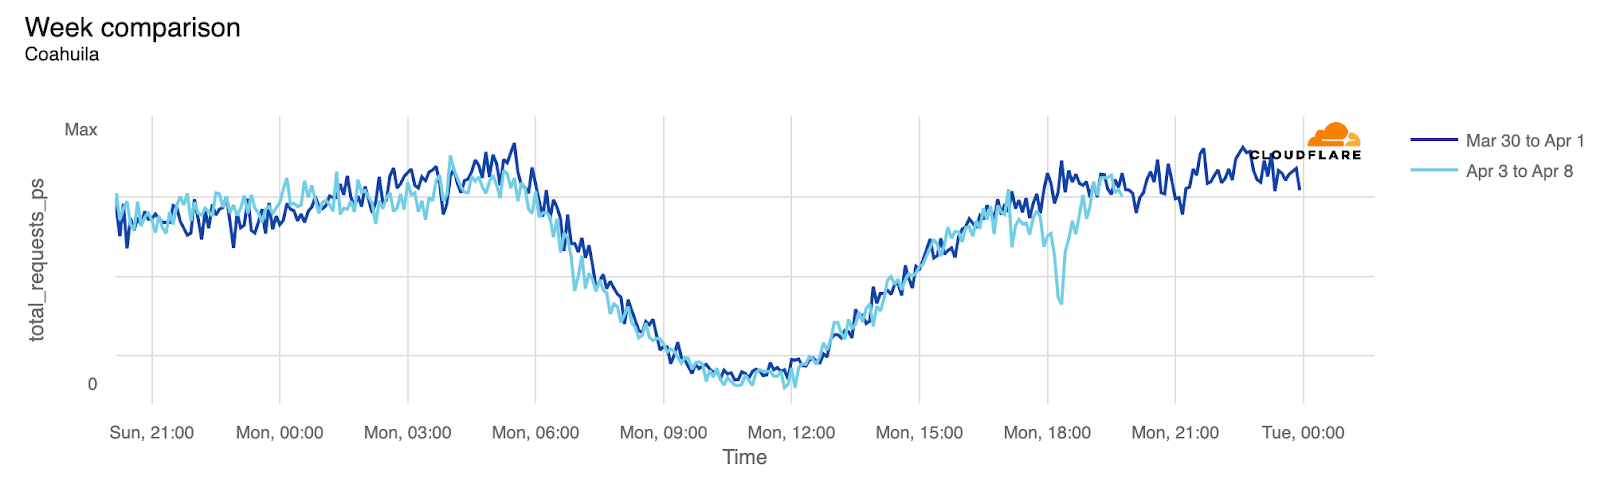
Before the eclipse became visible in the US, Mexico experienced it first. States within the eclipse zone, such as Coahuila, Durango, and Sinaloa, experienced noticeable drops in traffic. Even Mexico City, located further south, was affected.
Mexico: traffic change at time of the eclipse
State
Time of drop (UTC)
Local time
% of drop
Durango
18:15
12:15
-57%
Coahuila
18:15
12:15
-43%
Sinaloa
18:10
11:10
-34%
Mexico City
18:10
12:10
-22%
Here’s the Durango and Coahuila state perspectives:
Canada at last: an island stopped to see the eclipse
After Mexico and the US, Canada was next in the path of the eclipse. Prince Edward Island experienced the most significant impact in Canada. This region, with a population of less than 200,000, is one of eastern Canada’s maritime provinces, situated off New Brunswick and Nova Scotia in the Gulf of St. Lawrence. Next came New Brunswick and Newfoundland and Labrador.
This was the last total solar eclipse visible in the contiguous United States until August 23, 2044, with the next eclipse of similar breadth projected for August 12, 2045.
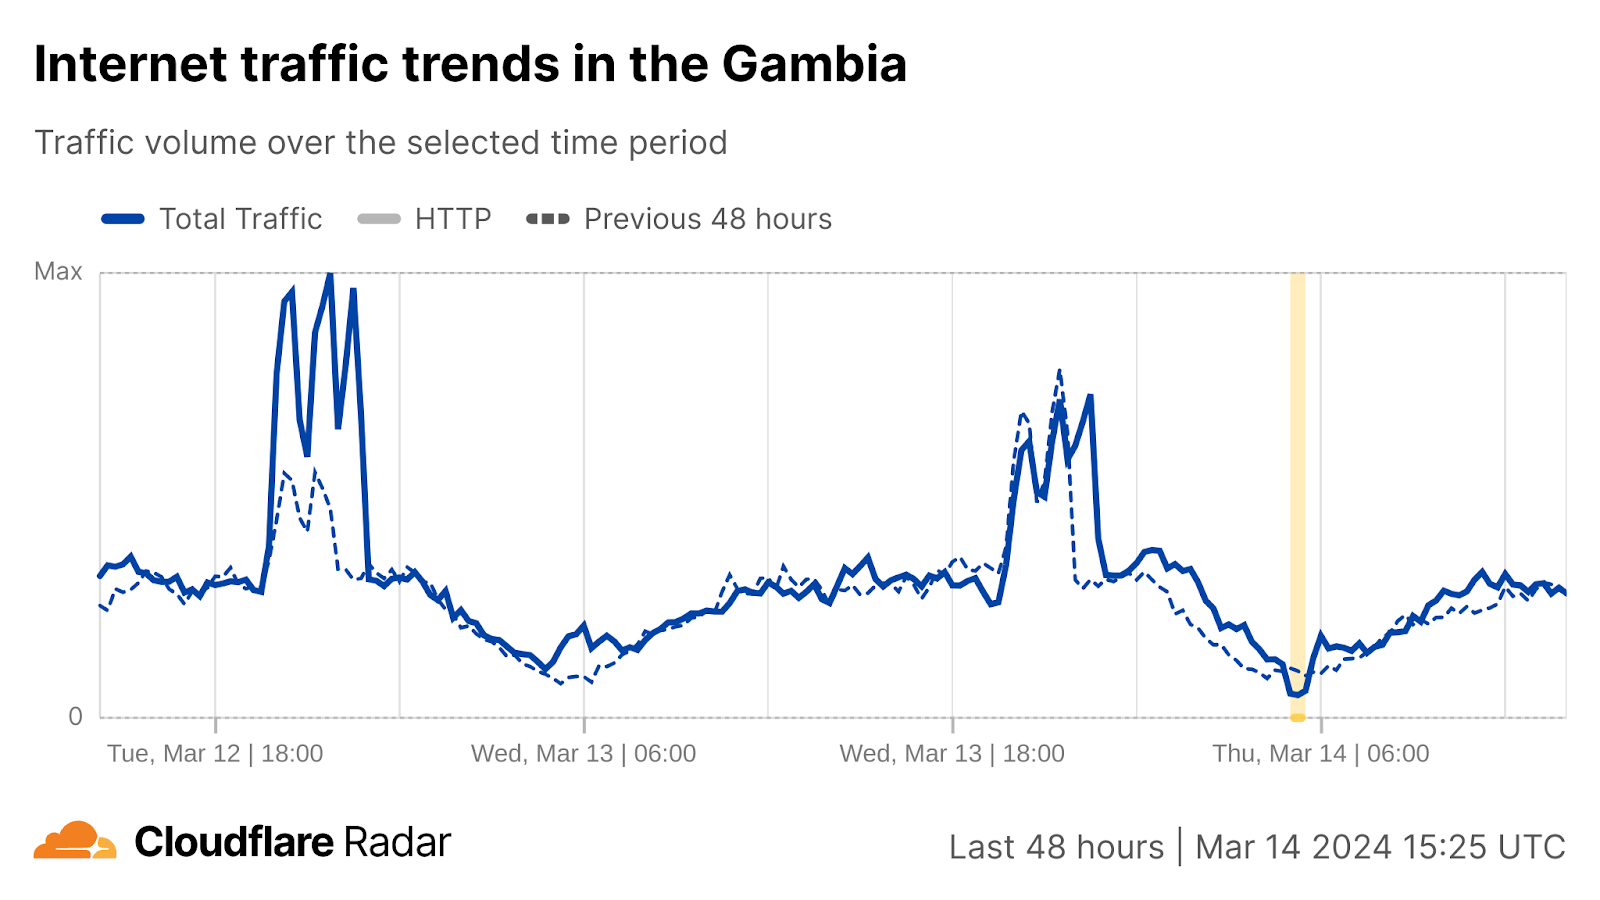
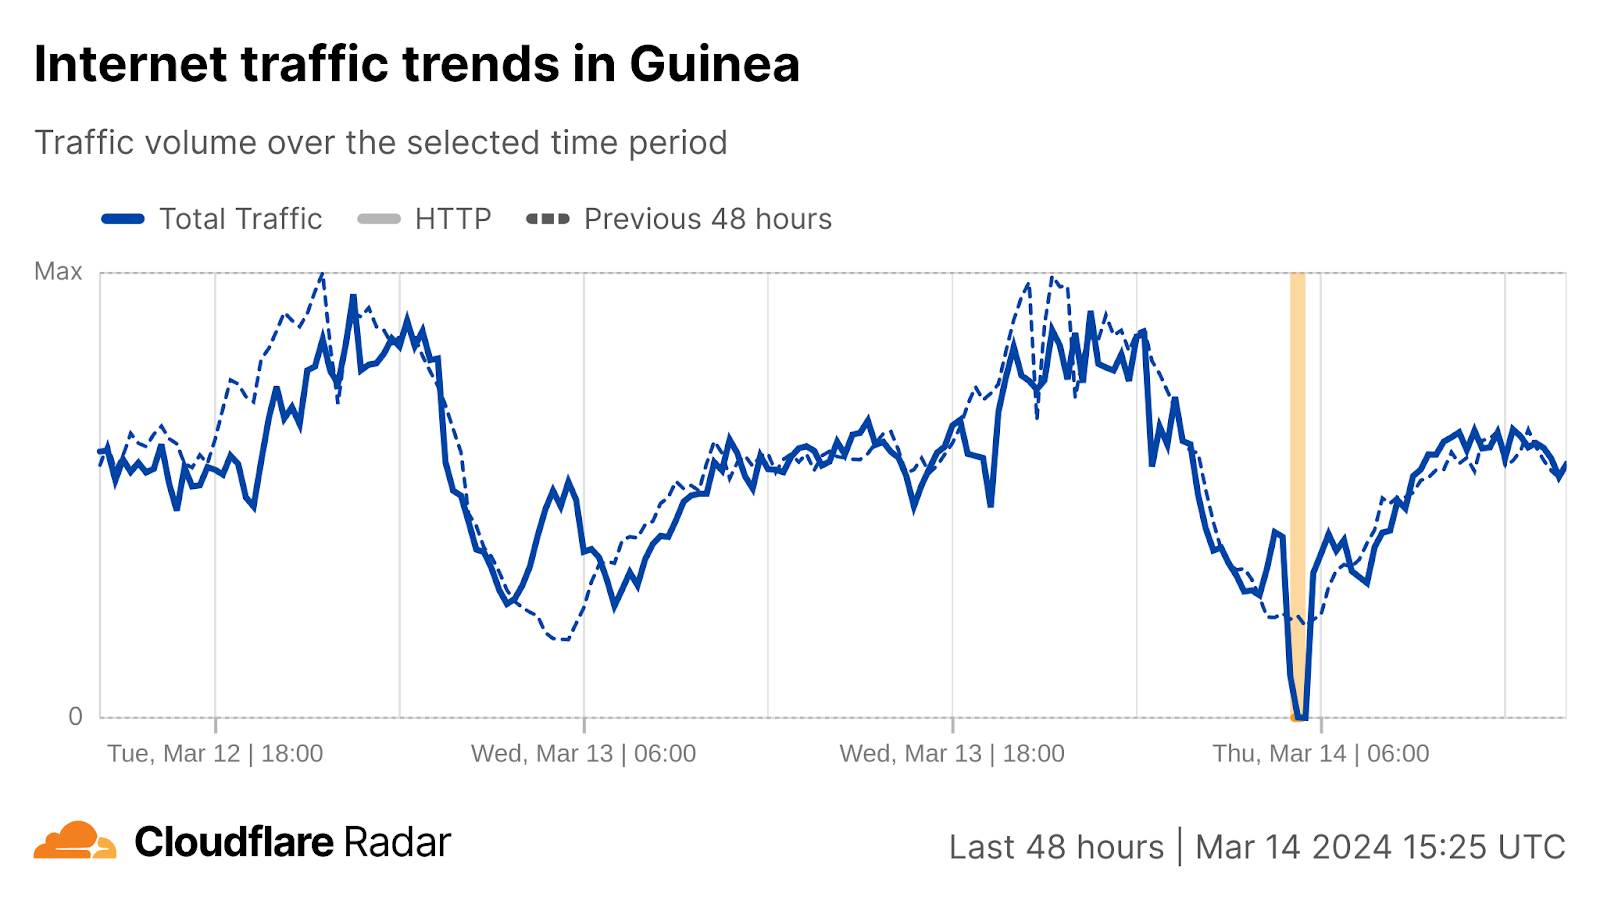
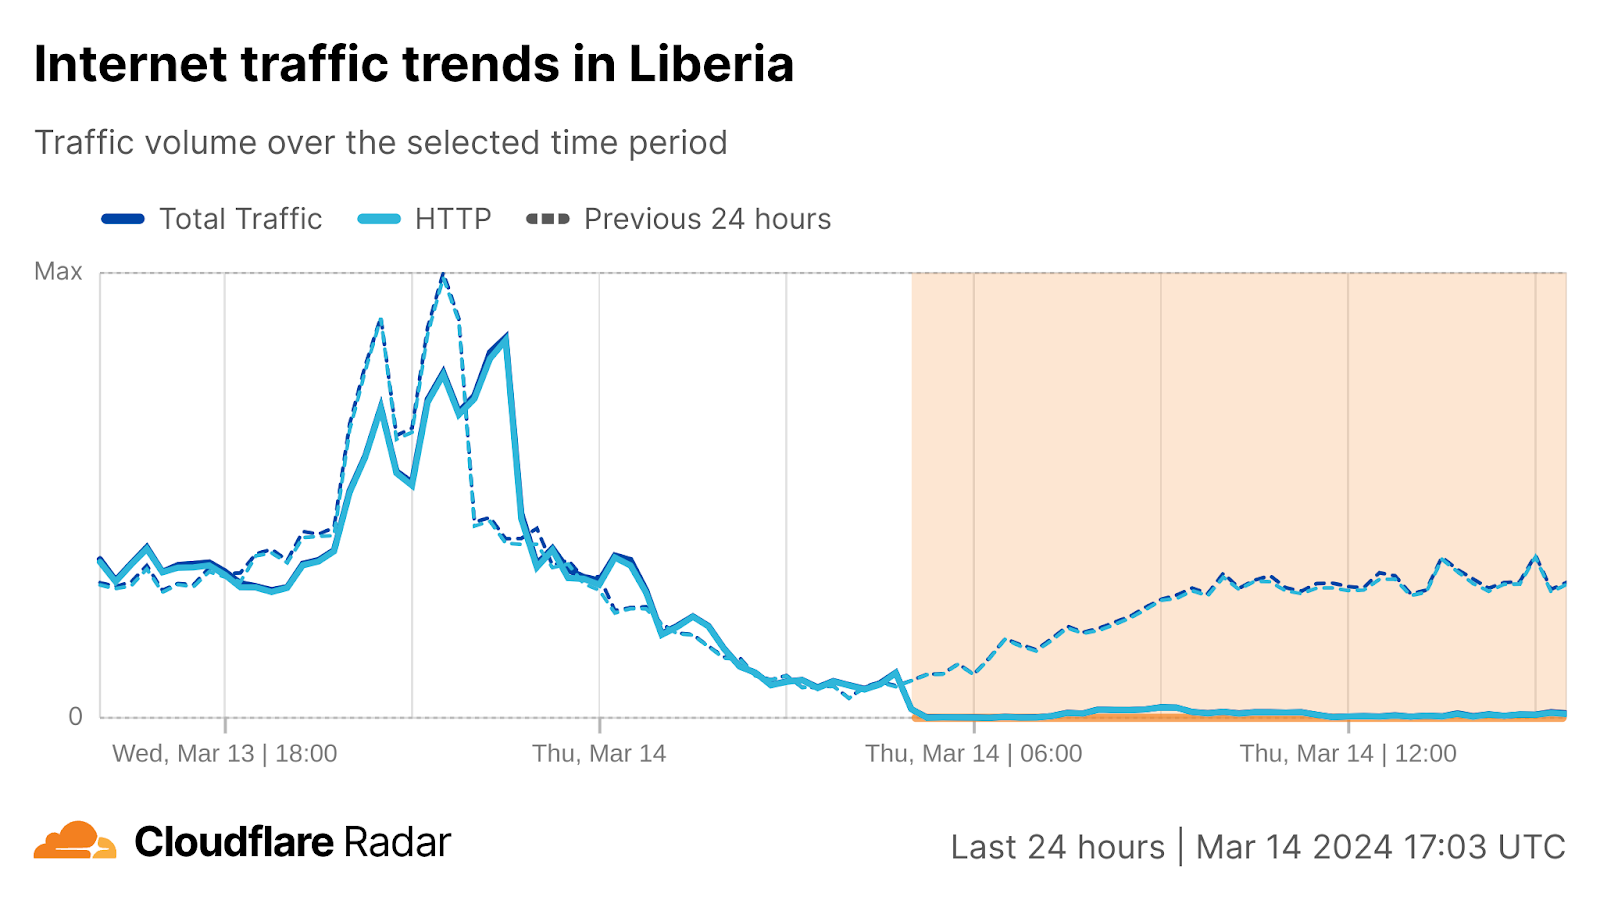
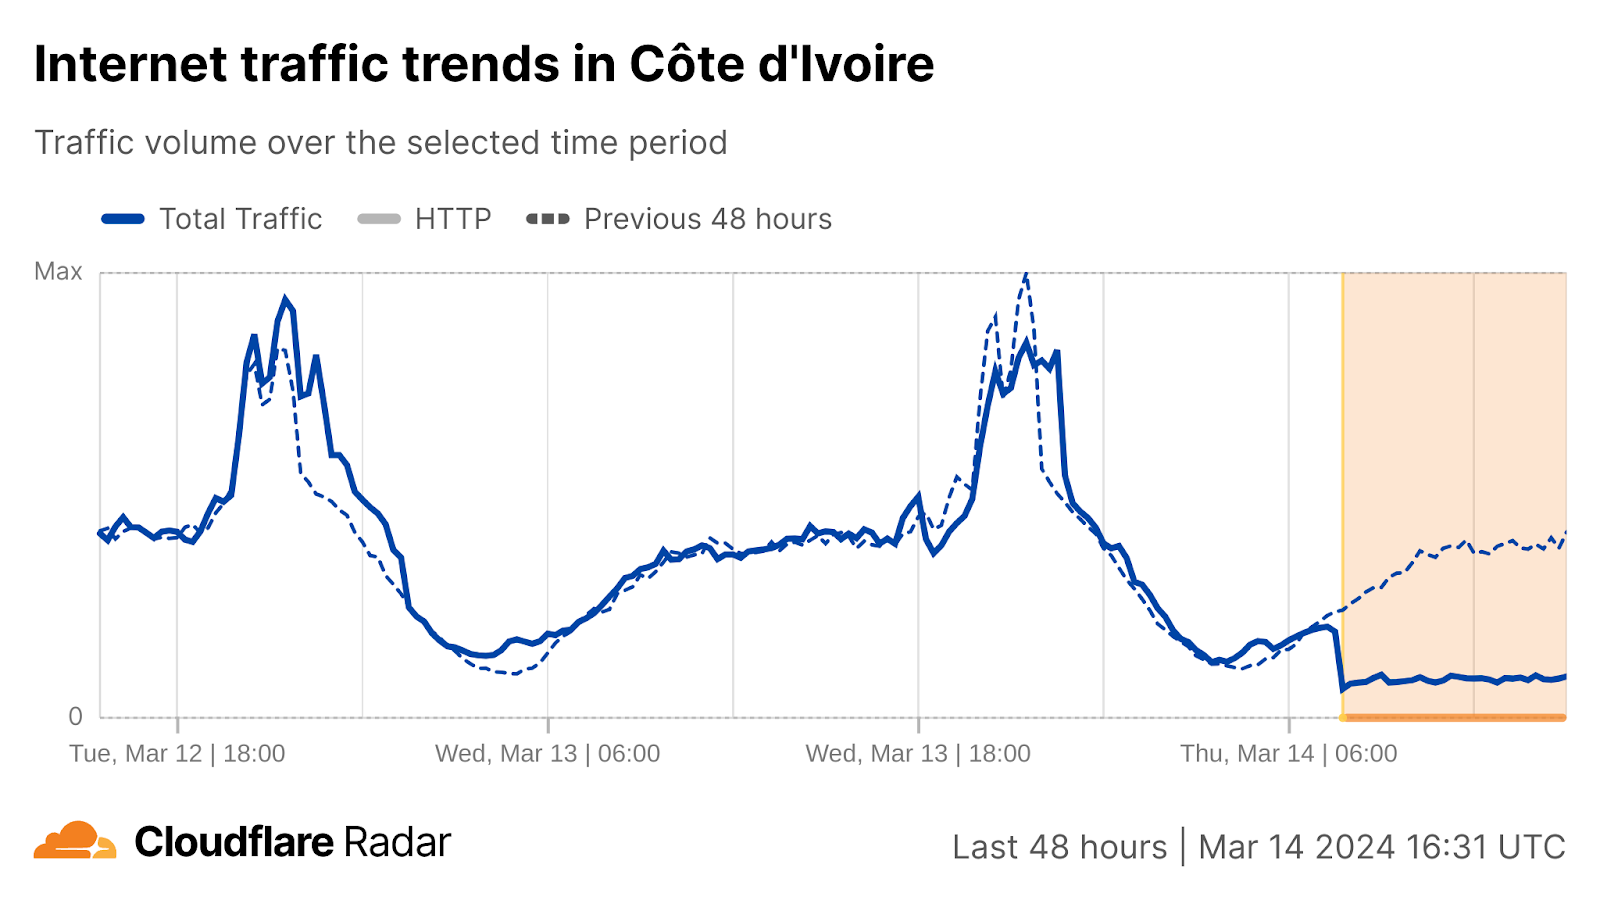
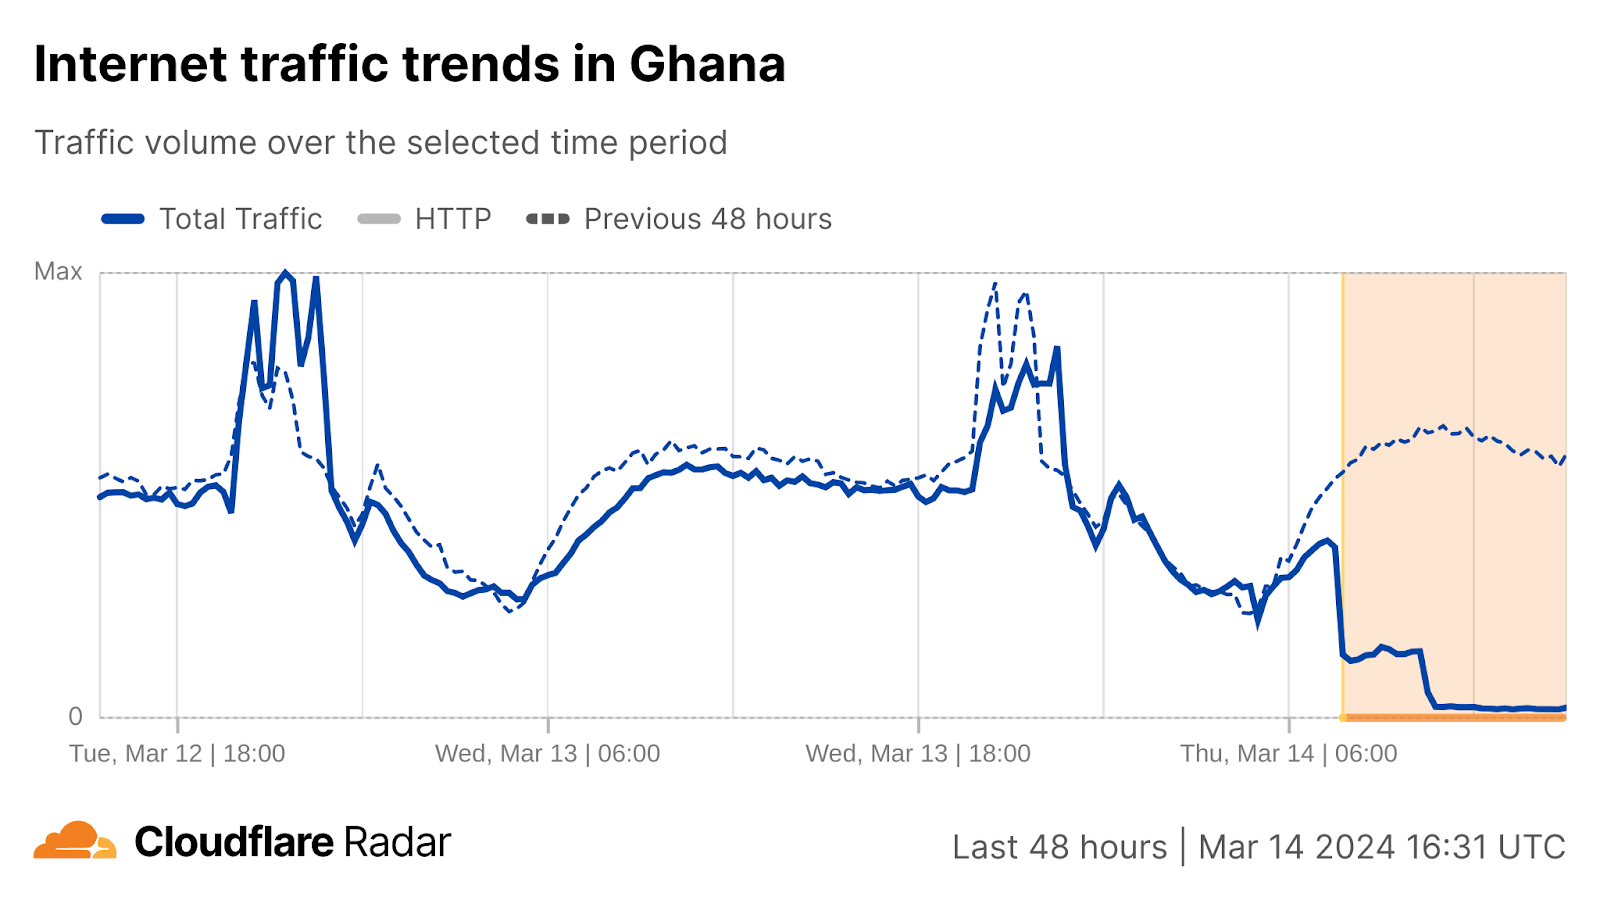
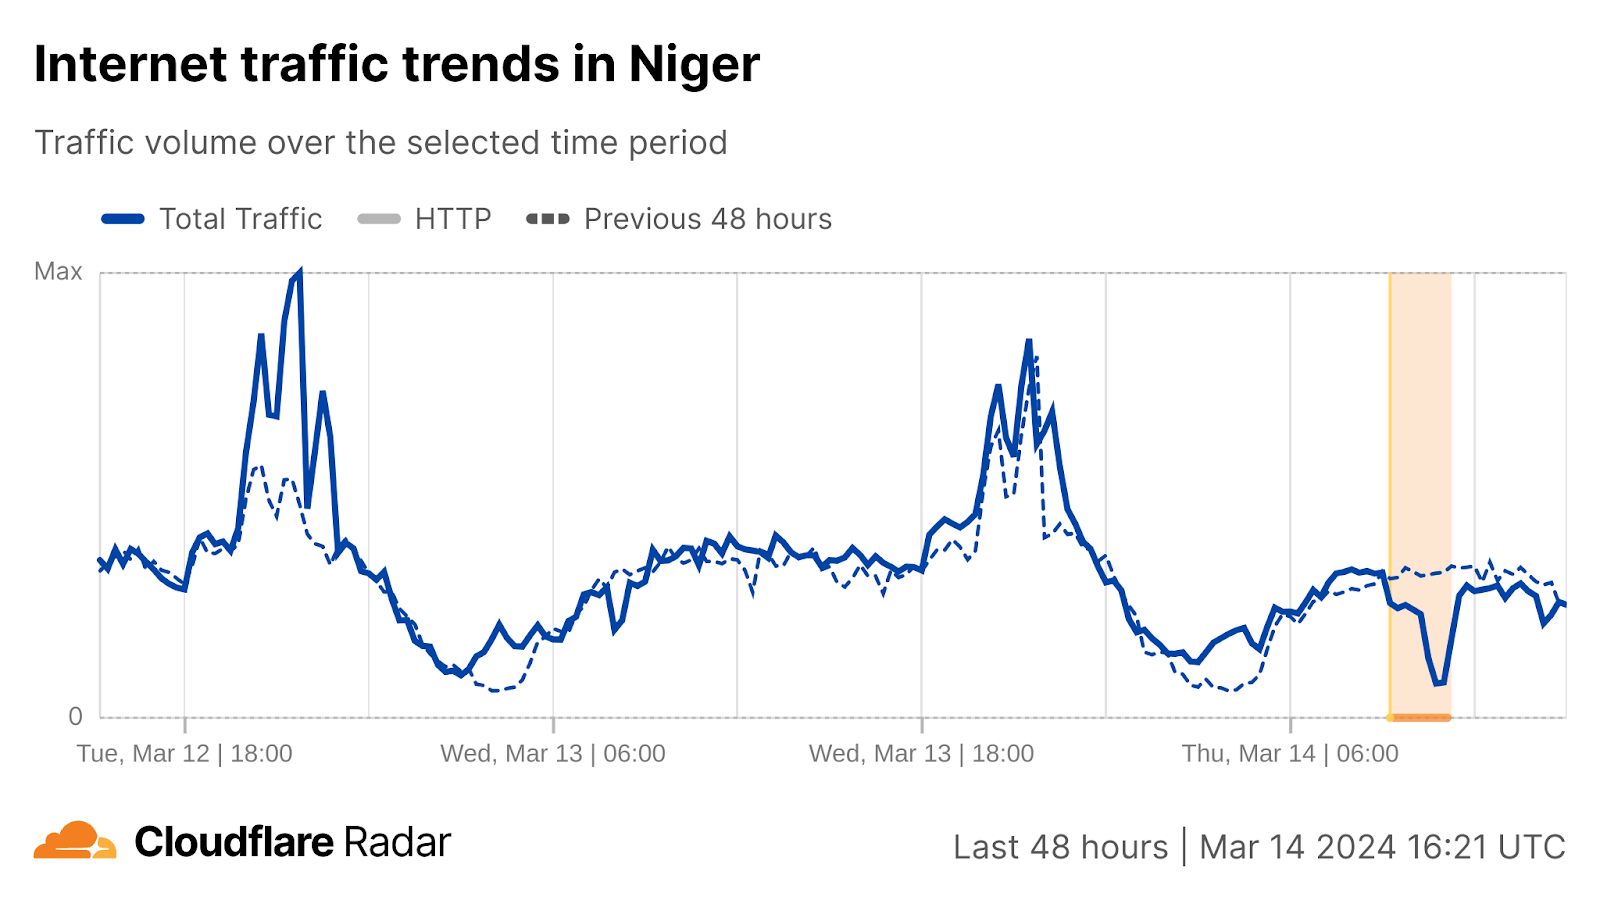
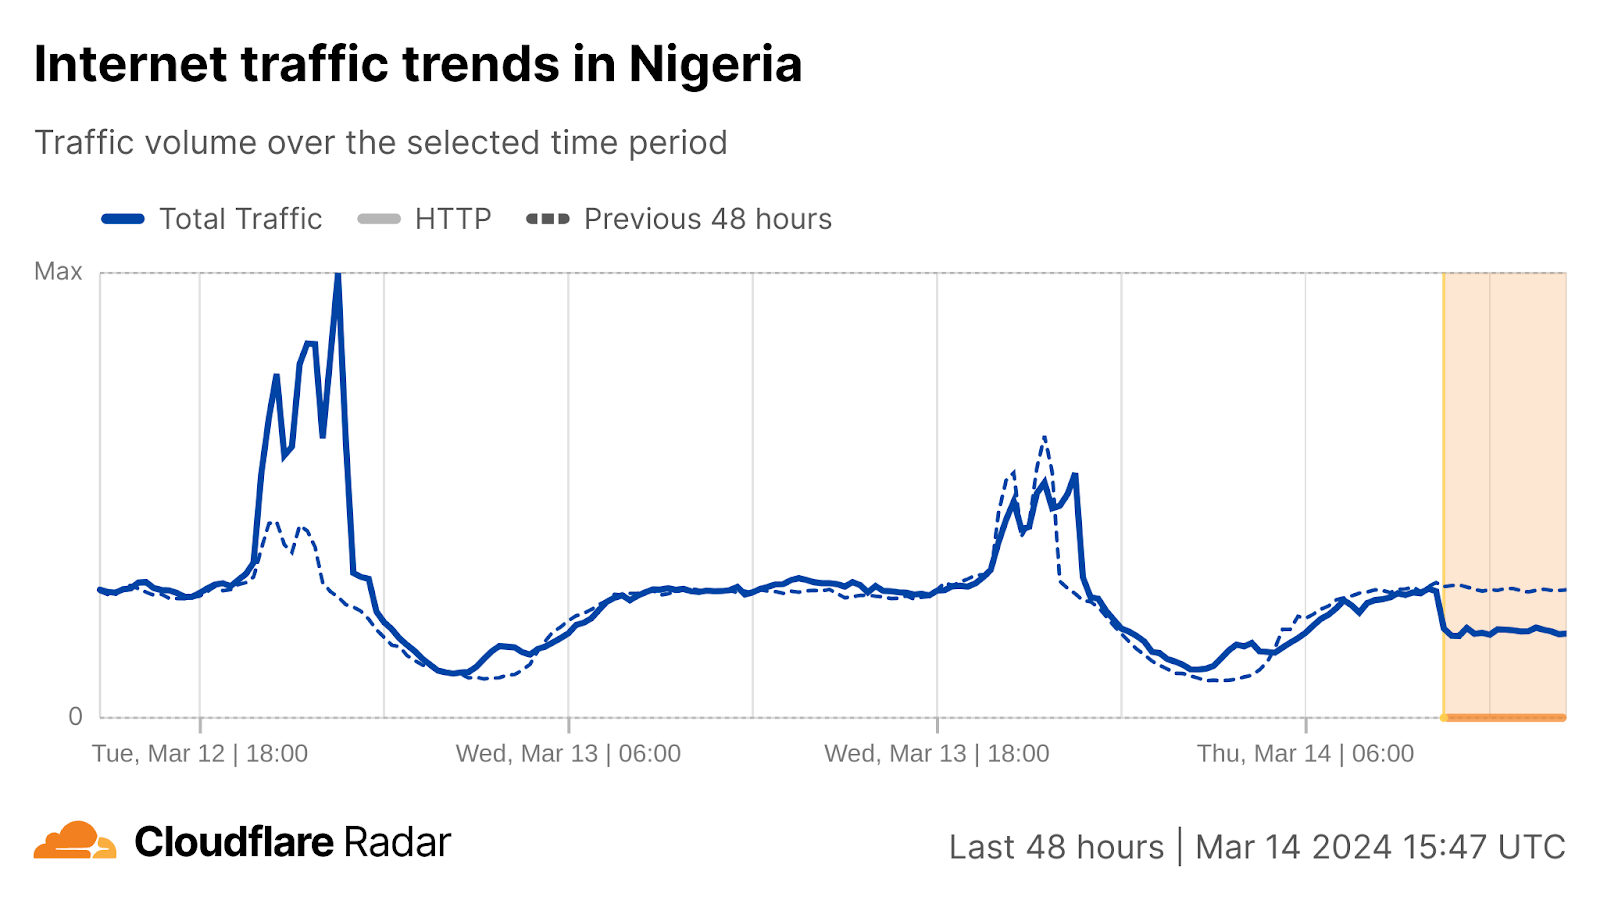
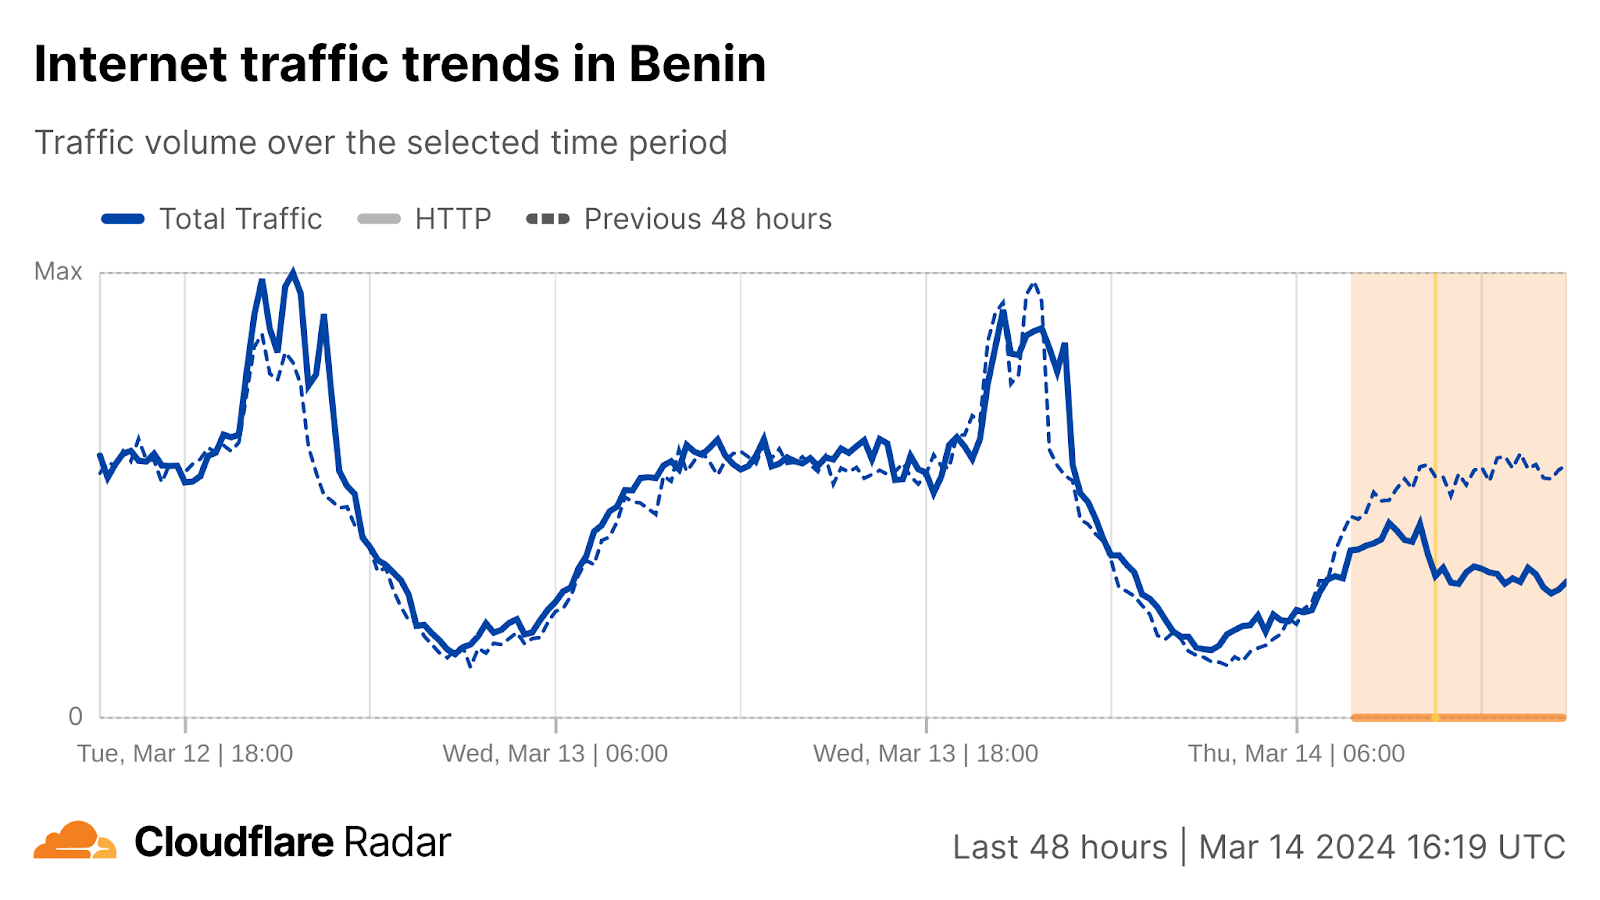
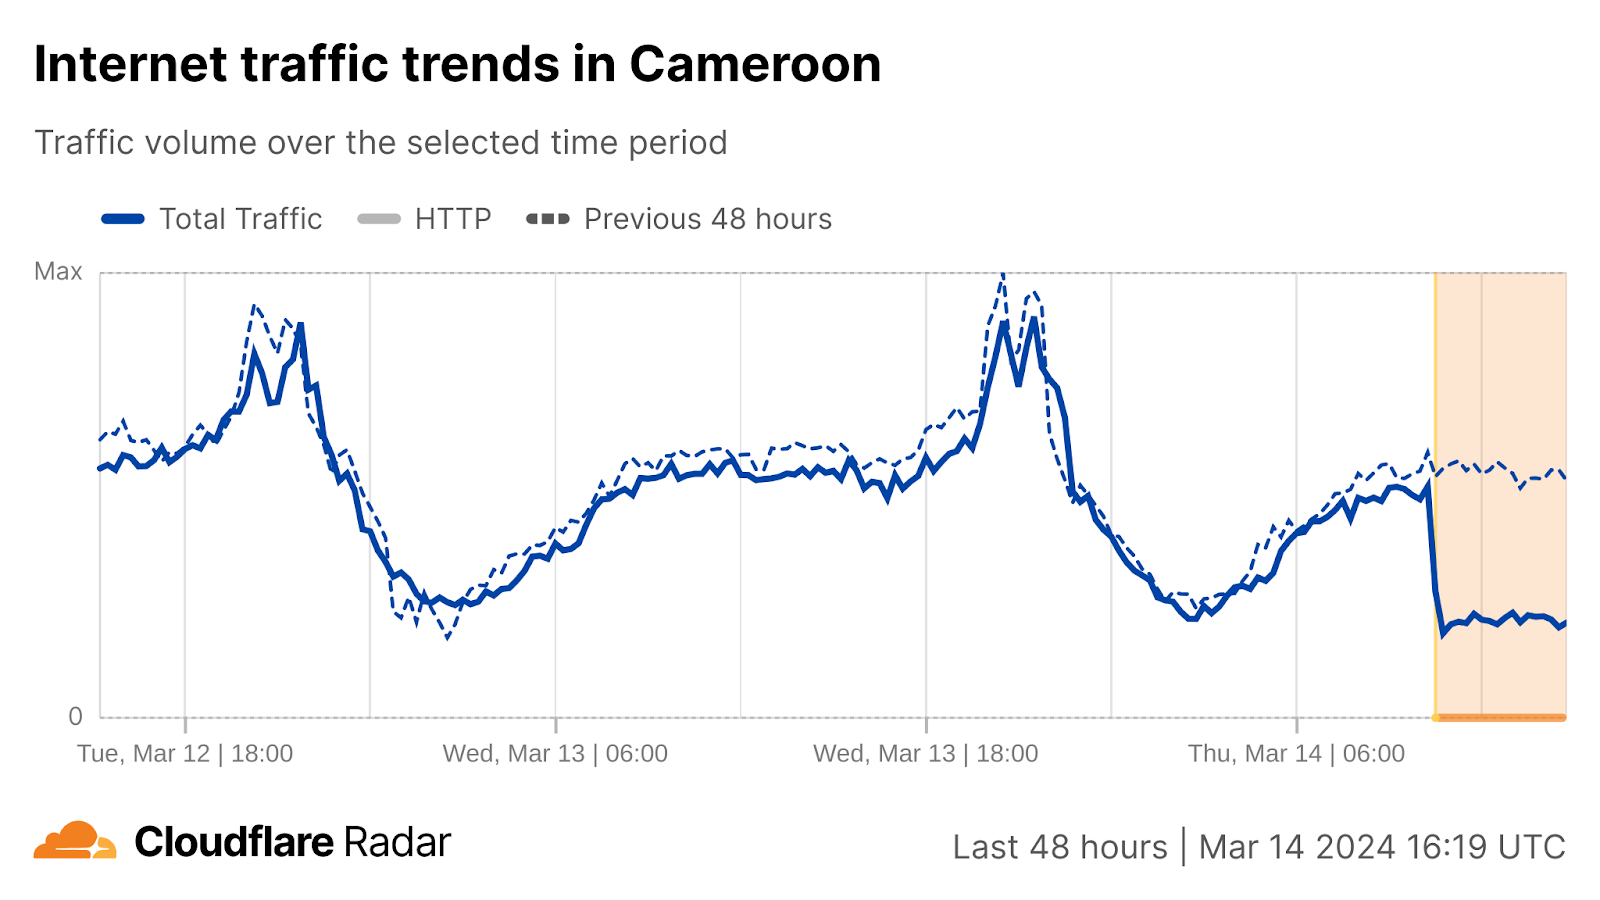
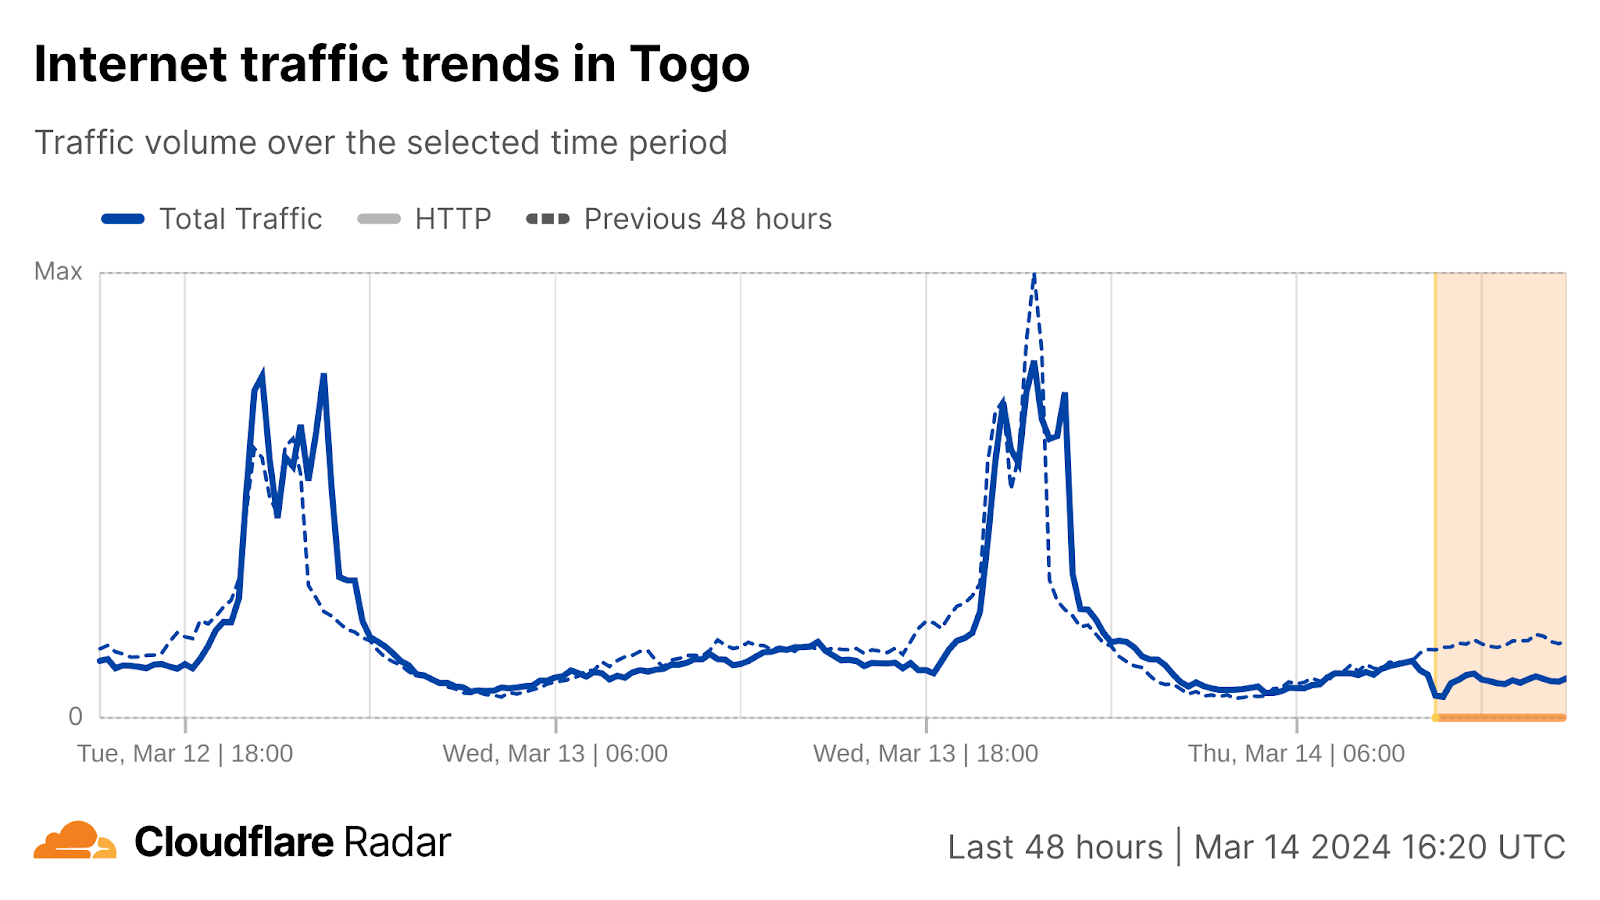
Internet connectivity in several African countries was disrupted today, March 14, 2024. Beginning at approximately 05:00 UTC, west and central African countries were most impacted, as was South Africa. Based on published reports and social media posts from impacted network providers, the disruption is believed to be due to multiple undersea cable failures in the region. From The Gambia to Côte d’Ivoire, including a major network in South Africa (Vodacom), a total of 11 African countries were impacted, based on our observations.
Cloudflare Radar data shows a pattern of disruptions from the north to the south of West Africa over time. It began south of Senegal, with The Gambia, Guinea, and Liberia experiencing disruptions around 05:00 UTC.
In The Gambia and Guinea, the disruptions lasted about 30 minutes, while in Liberia, the disruption has lasted more than 12 hours.
Moving south, around 07:30 UTC, disruptions were observed in Côte d’Ivoire and Ghana.
Niger, a landlocked nation in Central Africa, experienced a disruption at 09:15, lasting just over two hours.
This was followed by disruptions starting around 10:30 UTC in Nigeria, Benin, Cameroon, and Togo. These disruptions were ongoing at the time of writing.
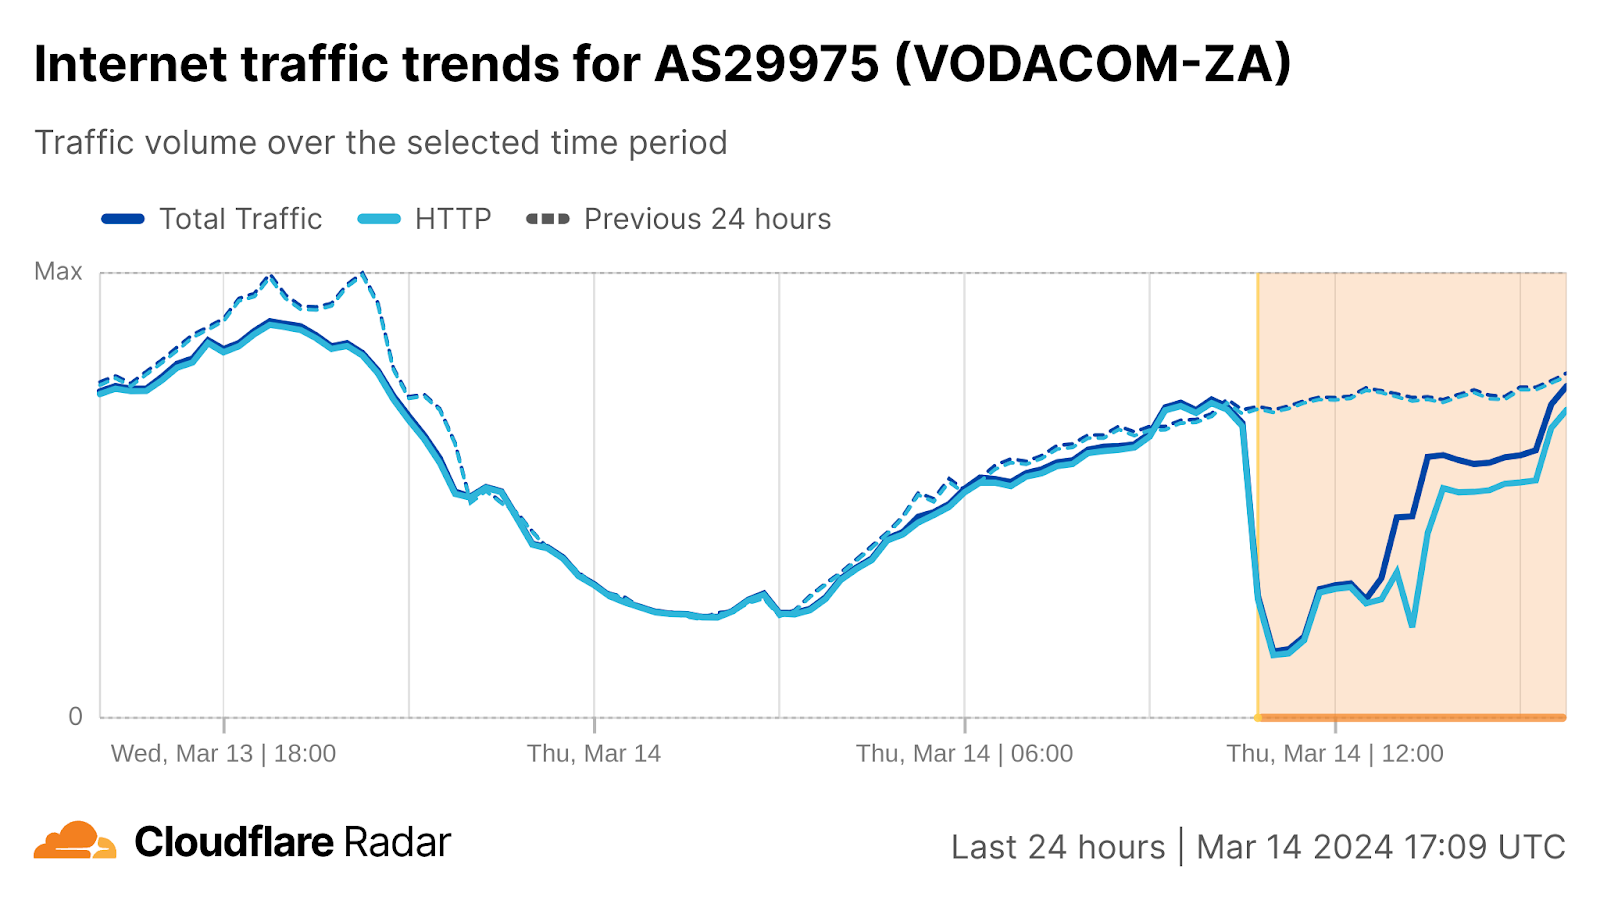
At approximately the same time, a significant disruption was observed on Vodacom’s South African network (AS29975). Traffic began to recover after 13:30 UTC, and appears to have reached close to normal levels by 16:00 UTC.
The importance of submarine cables
This series of disruptions serves as a reminder of how dependent the Internet is on submarine cables, which are estimated to carry over 90% of intercontinental data traffic. Only a small percentage of general use is done via satellite networks. There are 529 active submarine cables and 1,444 landings that are currently active or under construction, running to an estimated 1.3 million km around the globe.
Reports from several local networks, including South Africa’s Vodacom, MTN in Nigeria, and Celtiis in Bénin, reference multiple submarine cable failures. Microsoft was more detailed, stating on their Azure status page that “multiple fiber cables on the West Coast of Africa — WACS, MainOne, SAT3, ACE — have been impacted which reduced total capacity supporting our Regions in South Africa”. The company also explains that the recent cable cuts in the Red Sea in combination with today’s cable issues, “has impacted all Africa capacity”.
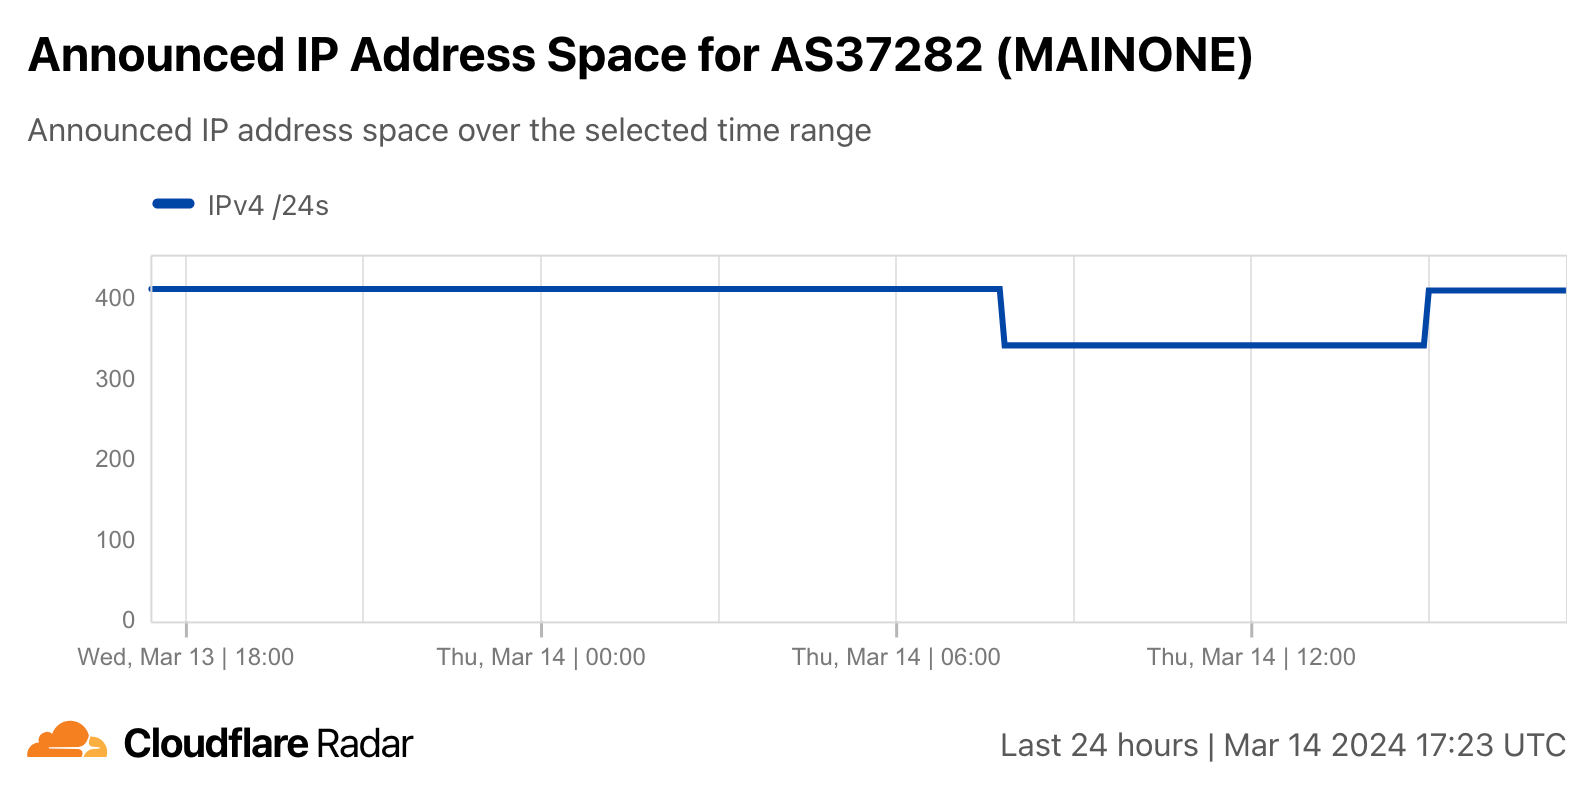
In addition to the impacts to the Microsoft Azure cloud platform, the website of MainOne, owners of the MainOne submarine cable, was offline for several hours. DNS for mainone.net is handled by name servers located in MainOne’s address space. It appears that a portion of the IPv4 address space for AS37282 (MAINONE) stopped being announced between 07:30 and 15:00 UTC, and once this address space was being routed again, both the nameservers and website became reachable.
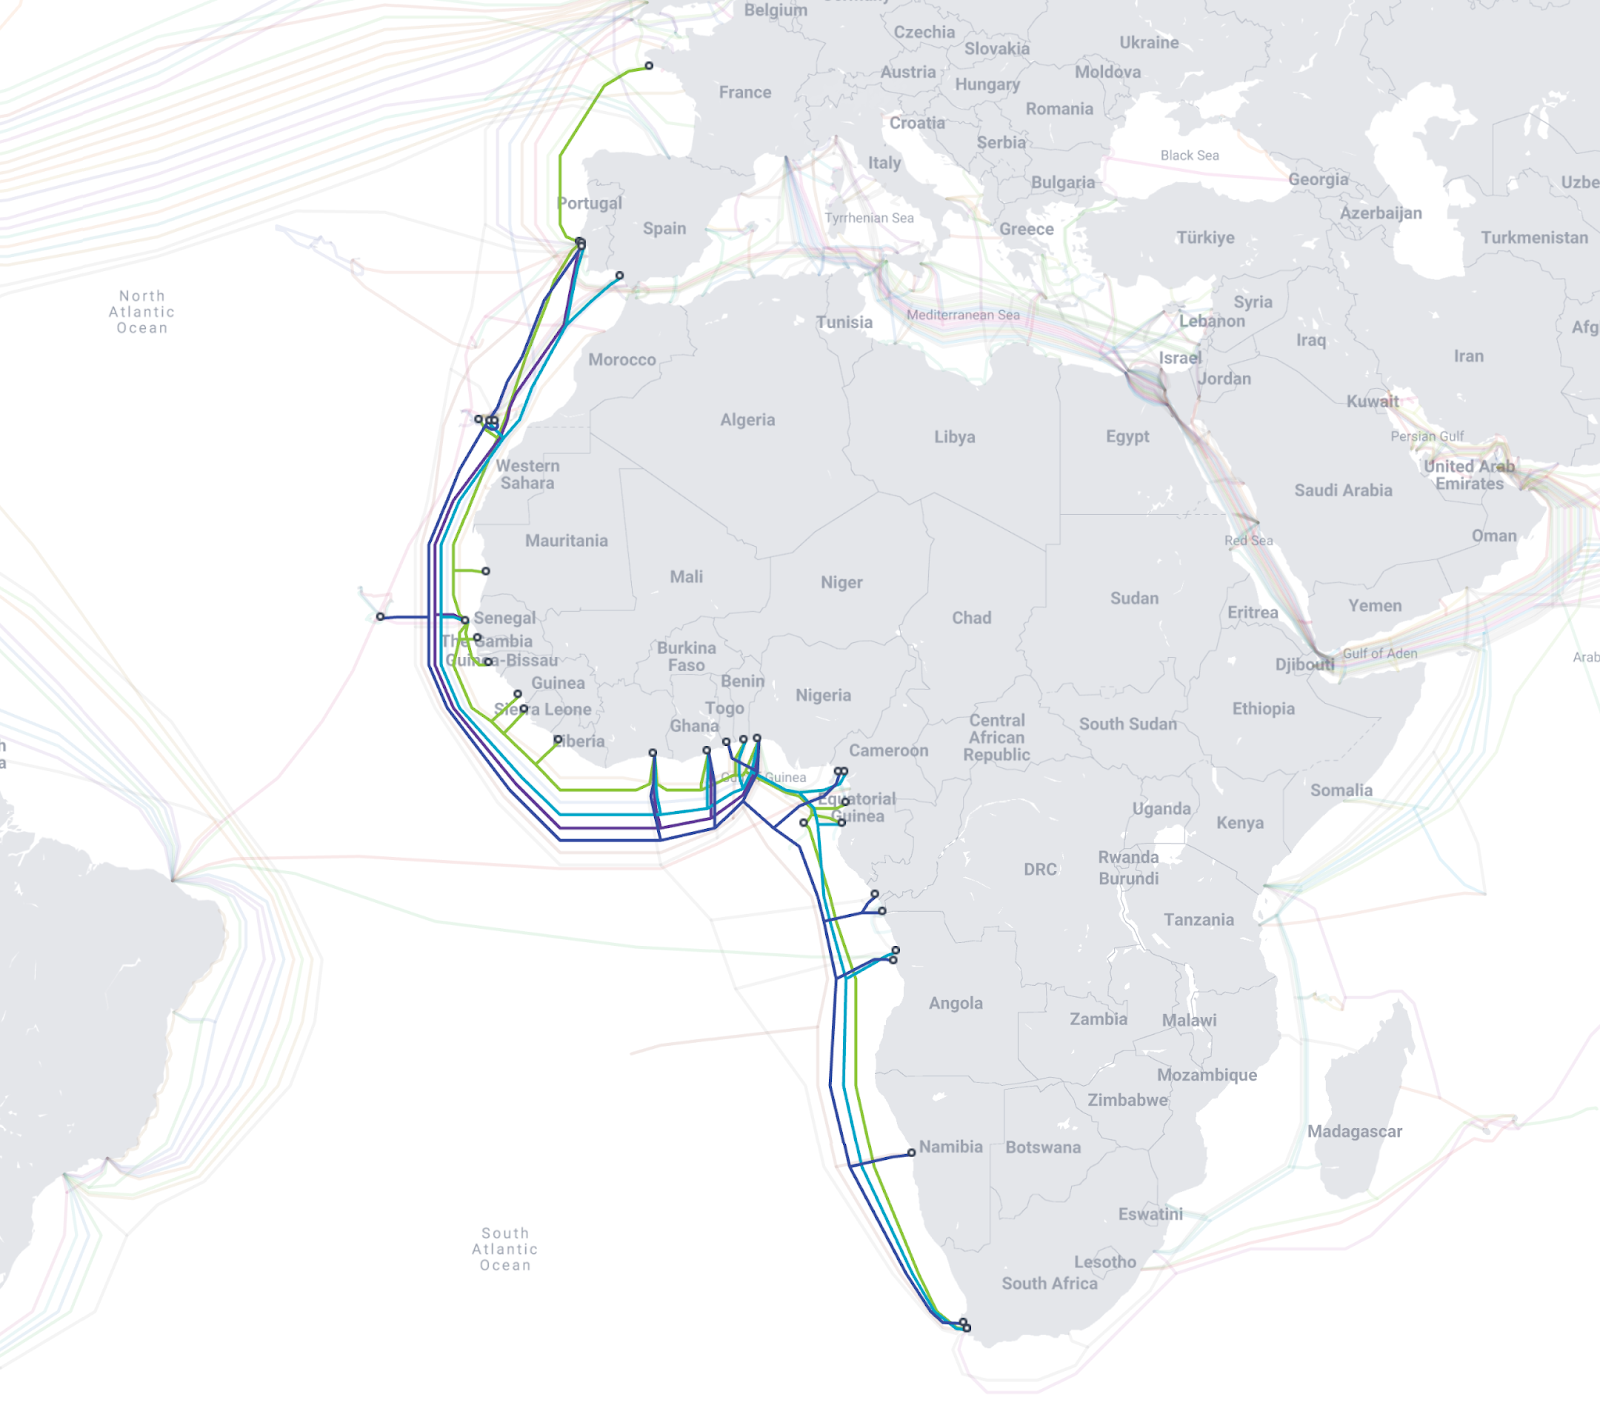
This map from TeleGeography highlights the impacted submarine cables: WACS (West Africa Cable System), MainOne, SAT-3/WASC, and ACE.
The disruptions are now being reported by news media outlets, including in South Africa, where the emphasis is not only on the latest outage but also on the problem with the submarine cable operator Seacom. This operator experienced a service-impacting outage on its cable system in the Red Sea. On March 8, the company stated that it is waiting for permits to start repairing its broken submarine cable in the Red Sea.
After winning Super Bowl LVII in 2023, the Kansas City Chiefs entered Super Bowl LVIII with an opportunity to pull off back-to-back wins, a feat last achieved by the New England Patriots two decades earlier, in 2003 and 2004. They faced the San Francisco 49ers, five-time Super Bowl champions, although their last win was nearly three decades ago, in 1995. The game started slowly, remaining scoreless until the start of the second quarter, after which both teams traded the lead until a tie score at the end of the game made it only the second Super Bowl to go into overtime. And if you weren’t watching it for the football, the advertisements certainly didn’t disappoint. And if you weren’t watching it for the football or the advertisements, but instead were waiting to see how many times CBS cut away to a shot of Taylor Swift during the game, the answer is… 16. (By my count, at least.)
In this blog post, we will explore which Super Bowl advertisements drove the largest spikes in traffic, as well as examine how traffic to food delivery services, social media, sports betting, and video platform websites and applications changed during the game. In addition, we look at local traffic trends seen during the game, as well as email threat volume across related categories in the weeks ahead of the game.
Cloudflare Radar uses a variety of sources to provide aggregate information about Internet traffic and attack trends. In this blog post, as we did last year and the year before, we use DNS name resolution data from our 1.1.1.1 resolver to estimate traffic to websites. We can’t see who visited the websites mentioned, or what anyone did on the websites, but DNS can give us an estimate of the interest generated by the ads or across a set of sites in the categories listed above.
Ads: URLs are no longer cool
In last year’s blog post, we asked “Are URLs no longer cool?”, noting that many of the advertisements shown during Super Bowl LVII didn’t include a URL. The trend continued into 2024, as over 100 ads were shown throughout Super Bowl LVIII, but only about one-third of them contained URLs — some were displayed prominently, some were in very small type. A few of the advertisements contained QR codes, and a few suggested downloading an app from Apple or Google’s app stores, but neither approach appears to be a definitive replacement for including a link to a website in the ad. And although Artificial Intelligence (AI) has all but replaced cryptocurrency as the thing that everyone is talking about, the lone AI ad during this year’s game was for Microsoft Copilot, which the company is positioning as an “everyday AI companion”.
As we did last year, we again tracked DNS request traffic to our 1.1.1.1 resolver in United States data centers for domains associated with the advertised products or brands. Traffic growth is plotted against a baseline calculated as the mean request volume for the associated domains between 12:00-15:00 EST on Sunday, February 11 (Super Bowl Sunday). The brands highlighted below were chosen because their advertisements drove some of the largest percentage traffic spikes observed during the game.
TurboTax
Although most Americans dislike having to pay taxes, they apparently feel that winning a million dollars would make doing so a little less painful. The Intuit TurboTax Super Bowl File ad, starring Emmy Award winner Quinta Brunson, included a URL pointing visitors to turbotax.com, where they could register to win one million dollars. The promotion aired a couple of times before the game began, visible as small spikes in the graph below, but it paid off for Intuit when it was shown at 19:56, driving traffic 24,875% above baseline and placing it as the ad that drove the largest increase in traffic.
DoorDash
Most DoorDash deliveries are fairly nominal, and should be able to easily fit in the Dasher’s car. However, in a twist, the delivery for the “DoorDash all the ads” promotion includes several cars, as well as candy, cosmetics, trips, mayonnaise, and a myriad of other items, all of which appeared in Super Bowl advertisements, as a way for the company to demonstrate that they deliver more than. The ad, which prominently featured a URL for the contest site, aired at 22:03 EST and drove traffic 24,574% above baseline. The graph below shows that prominent spike, but it also shows traffic remaining 1700-2500% above baseline after the ad aired. This elevated traffic is likely due to efforts to transcribe the full promo code needed to enter the contest. The promo code, as crowdsourced in a Reddit thread, clocks in at a whopping 1,813 characters.
Poppi
Super Bowl ads for “new” drink brands have frequently driven significant amounts of traffic, such as the growth seen by Cutwater Spirits in 2022. Relative newcomer Poppi, a brand of soda that contains prebiotics, continued the trend, with traffic spiking 7,329% above baseline after its ad appeared at 20:04 EST, despite no URL appearing in the advertisement. However, it appears that not everyone was a fan of the ad, as critics complained that it “food shamed” those who choose to drink traditional sodas.
e.l.f. Cosmetics
The cosmetic brand’s second Super Bowl advertisement featured Judge Judy presiding over a courtroom scene featuring musician Meghan Trainor and the cast of the USA Network legal drama Suits. While the ad drove traffic for elfcosmetics.com to 8,118% over baseline despite lacking a URL, the timing of the growth is unusual as it doesn’t align with the time the ad aired (20:22 EST). The traffic starts to tick up around 21:24 EST, just after a Chiefs touchdown put them in the lead, peaking at 22:53, several minutes after the Chiefs won the game. It isn’t clear why e.l.f. appears to buck the trend seen for most Super Bowl ads, showing a gradual ramp in traffic before peaking, as opposed to a large spike aligned with the time that the ad was broadcast.
In addition to the advertisements discussed above, a number of others also experienced traffic spikes greater than 1,000% above baseline, including ads for the NFL, Hallow, He Gets Us, homes.com, Kawasaki, Robert F. Kennedy, Jr. 2024, Snapchat, Skechers, and Volkswagen.
App traffic sees mixed impacts
Using the same baseline calculations described above, we also looked at traffic for domains associated with several groups of sites, including food delivery, messaging, social media, and sports betting to see how events that occurred during the game impacted traffic. Traffic shifts among most of these groups remained fairly nominal during the game, with sports betting seeing the largest movement. Halftime is clearly visible within the graphs, as viewers apparently focused on the musical performance, which featured R&B singer Usher, joined by guests Alicia Keys, H.E.R., will.i.am, Ludacris, and Lil Jon.
Food delivery
Traffic for food delivery sites remained relatively constant, on average, through the first quarter of the game, and started to decline as the second quarter started. A more significant dip is visible during halftime, with the drop continuing through the end of overtime. The outlier, of course, is the spike that occurred when the DoorDash advertisement aired, even though it featured a domain other than doordash.com, which is a member of this group.
Messaging
Traffic to domains associated with messaging applications generally remained just below baseline throughout the first half of the game. The spikes above baseline during the first half were nominal, and don’t appear to be associated with any notable in-game events. Traffic picked back up briefly as the halftime show ended, jumping to 14% above baseline. After that, traffic continued to drop until 22:46 EST, when the Chiefs sealed their victory with an overtime touchdown, causing traffic for messaging sites to spike to 34% above baseline.
Social media
Traffic for social media sites often spikes in conjunction with major plays, such as fumbles or touchdowns, as fans take to their favorite sites and apps to share photos or videos, or to celebrate or vent, depending on the team they support. Although social media traffic was fairly flat ahead of the start of the game, it began to see some spikiness as Post Malone sang America the Beautiful. This nominal spikiness continued through halftime, although none of the peaks were clearly correlated with major plays during the first half. Similar to messaging, a notable drop in traffic occurred during halftime followed by a spike as Usher’s halftime show ended. In the second half, traffic spiked as the Chiefs tied the game with a field goal, for the overtime coin toss, and as the 49ers took the lead with an overtime field goal. Interestingly, that final spike visible in the graph occurs approximately six minutes after the Chiefs’ game-winning touchdown during an ad break ahead of the post-game show.
Sports betting
Compared to the relatively anemic traffic growth (when it was actually above baseline) seen for the categories above, traffic for domains associated with sports betting sites and apps remained significantly above baseline throughout the game with the exception of the dip during halftime, similar to what was also seen in the categories above. The first spike occurred just minutes before the coin toss, jumping to 412% above baseline. The game’s first touchdown, scored by the 49ers, caused traffic to spike 705% above baseline. A 413% spike occurred when the Chiefs took the lead late in the third quarter, with a slightly smaller one occurring at the end of regulation play as the game entered overtime. The final spike occurred just a couple of minutes after the Chiefs scored the game-winning touchdown, reaching 548% above baseline.
Zooming in to Kansas City and San Francisco
Using the same baseline calculations highlighted in the previous two sections, we also looked at changes in DNS traffic for the domains associated with the Kansas City Chiefs (chiefs.com) and the San Francisco 49ers (49ers.com). In addition, we looked at HTTP traffic from these two cities, using traffic levels from one week prior as a baseline.
By and large, DNS traffic for chiefs.com did not appear to be significantly impacted by most of the team’s field goals or touchdowns during the game, as seen in the graph below. The exception is the traffic spike seen as the team tied the game towards the end of the fourth quarter, forcing the game into overtime. That play resulted in a spike of traffic for the team’s website that reached 1,887% above baseline. Traffic spiked again after the Chiefs won the game, spiking to 1,360% above baseline.
DNS traffic for 49ers.com did not exhibit significant shifts correlated with field goals or touchdowns. The most significant spike reached 1,023% over baseline at the end of the third quarter, minutes after the team called for a timeout.
When comparing traffic trends for Kansas City and San Francisco, they could hardly be more different. Looking at request traffic from Kansas City, we find that it remains below traffic seen during the same time frame on February 4, with notable drops at the start of the game, during halftime, and when the Chiefs tied the game with a field goal late in the fourth quarter. Traffic hit its lowest point when the Chiefs won the game, but then recovered to meet/exceed the prior week’s traffic levels once the broadcast had concluded.
In contrast, traffic from San Francisco remained well below traffic levels seen the previous Sunday before unexpectedly spiking around 19:30 EST. Request traffic then remained well above the previous week’s levels until San Francisco kicked a field goal to take the initial lead during overtime play. Traffic remained roughly in line with the previous week until the broadcast ended, and then remained slightly higher.
Email threats and “The Big Game”
As we noted in last year’s blog post, spammers and scammers will frequently try to take advantage of the popularity of major events when running their campaigns, hoping the tie-in will entice the user to open the message and click on a malicious link, or visit a malicious website where they give up a password or credit card number. The Cloudflare Area 1 Email Security team once again analyzed the subject lines of email messages processed by the service in the weeks leading up to the Super Bowl to identify malicious, suspicious, and spam messages across four topic areas: Super Bowl/football, sports media/websites, sports gambling, and food delivery.
Super Bowl/Football
Spammers and scammers apparently didn’t feel that the “Super Wild Card Weekend” nor the divisional playoffs were sufficiently interesting to use as bait for their campaigns, as the volume of Super Bowl and football themed unwanted and potentially malicious email messages throughout January remained relatively low and fairly consistent. However, they apparently knew that the big game itself would draw interest, as the volume of such messages increased more than 6x over the prior week in the days ahead of the game.
Sports media/websites
Attackers appeared to lose interest in using messages with subject lines related to sports media and websites as January progressed, with the volume of related messages peaking the first week of the month. However, similar to Super Bowl and football themed messages, this theme took on renewed interest in the week leading up to the Super Bowl, with message volume reaching over 3x the previous week, and 1.8x the peak seen durinthe first week of the year.
Sports gambling
The final weekend of regular season games (on January 6 & 7) again drove the highest volume of sports gambling themed messages, similar to the pattern seen in 2023. Message volume dropped by about a third over the next two weeks, but picked back up around the divisional and conference playoff games and into the Super Bowl. Even with the growth into the Super Bowl, gambling-themed spam and malicious message volume remained 10% lower than the peak seen a month earlier.
Food delivery
Peak volume of food delivery themed messages was an order of magnitude (10x) higher than the Super Bowl and football themed peak, which was the next largest. Due to the popularity of such services, it appears that it is a regular theme for spam and potentially malicious messages, as volume remained extremely high throughout January. After peaking the week of January 8-14, message volume was lower each of the following weeks, reaching its nadir in the week leading up to the Super Bowl, 47% lower than the peak volume.
Conclusion
Likely peaking during the so-called “dot.com” Super Bowls nearly a quarter-century ago, most Super Bowl ads no longer drive traffic to associated websites by including a URL in their ad. However, as our DNS traffic analysis found, it appears that viewers don’t seem to have much trouble finding these sites. We also found that in-game events had a mixed impact on traffic across domains associated with multiple types of apps, as well as traffic for the websites associated with the teams playing in the Super Bowl.
Cloudflare’s network spans more than 310 cities in over 120 countries, where we interconnect with over 13,000 network providers in order to provide a broad range of services to millions of customers. The breadth of both our network and our customer base provides us with a unique perspective on Internet resilience, enabling us to observe the impact of Internet disruptions.
During previous quarters, we tracked a number of government directed Internet shutdowns in Iraq, intended to prevent cheating on academic exams. We expected to do so again during the fourth quarter, but there turned out to be no need to, as discussed below. While we didn’t see that set of expected shutdowns, we did observe a number of other Internet outages and disruptions due to a number of commonly seen causes, including fiber/cable issues, power outages, extreme weather, infrastructure maintenance, general technical problems, cyberattacks, and unfortunately, military action. As we have noted in the past, this post is intended as a summary overview of observed disruptions, and is not an exhaustive or complete list of issues that have occurred during the quarter.
Government directed
Iraq
In a slight departure from the usual subject of this blog post, this time we lead off with coverage of government directed Internet shutdowns that didn’t happen. Iraq has been a frequent subject of this series of posts, as they have historically implemented daily multi-hour Internet shutdowns during exam periods, intended to prevent cheating. Earlier this year, there was some hope that this practice might be ending, and in our Q2 2023 Internet disruption summary post, we noted “In the weeks prior to the start of this year’s shutdowns, it was reported that the Iraqi Ministry of Communications had announced it had refused a request from the Ministry of Education to impose an Internet shutdown during the exams as part of efforts to prevent cheating. Unfortunately, this refusal was short-lived, with shutdowns ultimately starting two weeks later.” In addition to these second quarter shutdowns, they also occurred during the third quarter across multiple weeks in July, August, and September.
During the fourth quarter, the third round of 12th grade high school final exams was scheduled to begin on November 13 and end on November 21, taking place at 13:00 local time, as shown in the schedule below, which was published on the Iraqi Ministry of Education’s Facebook page.
November 2023 exam schedule in Iraq
However, in looking at Internet traffic for Iraq during that period, it appears that the nationwide Internet shutdowns that would have normally taken place did not occur, as the graph shows a very consistent diurnal pattern with no evidence of disruptions to Internet connectivity like we have seen in the past. Additionally, other civil society groups, academic researchers, and Internet analysts that also monitor these shutdowns did not report seeing any related drops in traffic. It is unclear whether a request for shutdowns was submitted by the Ministry of Education and again refused by the Ministry of Communications, or if no request was ever submitted for this round of exams. Regardless, we hope that Iraq continues to keep the Internet connected during future rounds of exams.
Military action
Palestine
On Saturday, October 7, 2023, attacks from the Palestinian group Hamas launched from the Gaza Strip against the south of Israel started a new conflict in the region, with Israel officially declaring the next day that it was at war. This had an almost immediate impact on Internet traffic in both Israel and Palestine, with traffic in the former showing ~170% growth as compared to the prior week, and ~100% growth in the latter as compared to the previous week. These trends are discussed in our October 9 blog post, Internet traffic patterns in Israel and Palestine following the October 2023 attacks.
On November 13, Telecom Namibia (AS36996)reported that it was experiencing interruptions to its fixed voice and data services in several areas, resulting from cable theft. The impact of these interruptions is shown in the figure below, with Internet traffic disrupted between 13:45 local time (11:45 UTC) on November 13 and 08:30 local time (06:30 UTC) on November 14. The disruption to connectivity due to cable theft was not an isolated incident, as the provider posted several additional notices on its social media accounts in November and December about similar occurrences.
Cuba
A day later, on November 14, ETECSA (AS27725)posted a notice about a terrestrial fiber cut that disrupted Internet services. As the state-owned telecommunications provider in Cuba, the cut impacted Internet traffic nationwide, as well as at a network level, as seen in the graphs below. The disruption was relatively short-lived, occurring between 06:30 – 08:15 local time (11:30 – 13:15 UTC), with a follow-up post announcing the re-establishment of Internet service.
Chad
On December 7 & 8, a near-complete outage observed in Chad was reportedly due to fiber optic cable cuts in neighboring countries. A published article cited SudaChad as claiming that the outage seen in the graphs below was due to an issue with CAMTEL, a Cameroonian partner. It also cites Moov Africa’s (formerly known as Millicom Chad)apology to customers, which points at “the fiber-optic cut in Cameroon and Sudan” as the root cause. Since simultaneous cuts in fiber optic cables in Chad’s two neighboring countries would certainly be an unusual occurrence, it isn’t clear if such an event happened, though routing data for SudaChad shows that the network’s two upstream providers are AS15706 (Sudatel) in Sudan and AS15964 (CAMNET) in Cameroon. The three providers are also partners on the WE-AFRICA-NA terrestrial cable, which stretches from Port-Sudan on the Red Sea in Sudan to Kribi on the Atlantic Ocean in Cameroon via Chad, but it isn’t known whether that cable system was involved in this outage.
The disruption lasted approximately fourteen hours, from 20:00 local time on December 7 until 10:15 local time on December 8 (19:00 UTC on December 7 until 09:15 UTC on December 8), with the impact visible country-wide, as well as at SudaChad and several downstream network providers.
Cyberattacks
Ukraine
Ukrainian Internet provider Kyivstar announced on the morning of December 12 that they were the “target of a powerful hacker attack”. They noted that the attack caused a “technical failure” that resulted in mobile communication and Internet access becoming temporarily unavailable. Although Kyivstar has been targeted by around 500 cyberattacks since Russia launched its invasion of Ukraine in February 2022, this was reportedly the largest attack to date. A subsequent report referenced an interview with Illia Vitiuk, the head of the cybersecurity department at Ukraine’s security service (SBU), in which he claimed that “the hackers attempted to penetrate Kyivstar in March 2023 or earlier, managed to get into the system at least as early as May, and likely gained full access to the network in November.”
Recovery took several days, with Kyivstar posting on December 15 that “the Internet is everywhere” but warning that connection speeds might be slightly reduced. These posts align with the traffic disruption shown in the figure below, which lasted from 06:30 local time (04:30 UTC) on December 12 until 14:00 local time (12:00 UTC) on December 15.
Power outages
Brunei
A major power outage in Brunei on October 17 disrupted key services including mobile and fixed Internet connectivity. Starting around 11:30 local time (03:30 UTC), traffic was disrupted for approximately 13 hours, recovering to expected levels around just after midnight local time on October 18 (16:45 UTC). Two Unified National Networksautonomous systems (AS10094 and AS131467) saw lower traffic volumes during the power outage.
Kenya
A widespread power outage in Kenya on November 11 disrupted Internet connectivity across the county for approximately seven hours. An X post from Kenya Power at 20:30 local time (17:30 UTC) reported a partial power outage, stating “We have lost power supply to parts of the country. Our engineers are working to restore supply to the affected areas.” Kenya Power kept customers informed of progress, posting updates at 22:00, 23:57, and the morning of November 12, with the final update reporting “We have successfully restored normal power supply in all the areas that were affected by the partial outage.”
Curaçao
On November 14, a Facebook post from Aqualectra, the water and power company in Curaçao, stated in part, “Around 14:00 this afternoon, a blackout occurred. Preliminary investigation indicates that one of the main cables responsible for transporting electricity between the substations at Nijlweg and Weis experienced a short circuit. It is important to emphasize that this is not due to a lack of production capacity.” The power outage resulted in a near complete loss of traffic at Flow Curaçao (AS52233), with significant disruptions also visible at United Telecommunication Services (AS11081) and at a country level, as seen in the graphs below. The disruption lasted eight hours, from 14:00 until 22:00 local time (18:00 UTC on November 14 until 02:00 UTC on November 15).
Sri Lanka
After stabilizing its electrical infrastructure in the wake of 2022’s problems with its electrical power grid, the failure of a main transmission line caused an island-wide power outage in Sri Lanka on December 9, in turn disrupting Internet connectivity. Traffic from the island nation initially dropped by around 50% starting around 16:45 local time (11:15 UTC). Repairs took several hours, with the country’s Internet traffic returning to expected levels around 01:00 local time on December 10 (19:30 UTC).
Panama
On the morning of December 24, Panamanian electric distribution company ENSAinitially reported an event that affected electrical services to their customers. A subsequent report posted just 30 minutes later provided additional details, pointing to an incident in the “National Interconnected System” that affected the electrical supply in a number of areas, but within an hour, it had spread nationally. Although the initial regional power issues did not have a noticeable impact on Panama’s Internet traffic, the loss of traffic in the graph below aligns with the national growth of the power outage, occurring at 11:45 local time (16:45 UTC). Traffic returned to expected levels at around 15:00 local time (20:00 UTC), aligning with an X post from ENSA stating that “At 3:12pm the supply of electrical energy to all our clients has been normalized after an event at the Transmission level originating in the Panama 1 Substation of ETESA.”
Weather
Ukraine
Internet disruptions in Ukraine due to the conflict there have been covered in multiple quarterly Internet disruption summary blog posts over the last two years. However, in November, connectivity in multiple areas of the country was disrupted by power outages caused by a major winter storm. Snow and high winds knocked out power to hundreds of towns and villages, damaging electrical power infrastructure. The impact is visible in the graphs below as a drop in traffic occurring around 01:00 local time on November 27 (23:00 UTC on November 26), observed in regions including Donetsk, Kherson Oblast, and Luhansk. Traffic appeared to return to expected levels early in the morning local time on November 28.
Mexico
On October 25, Hurricane Otis made landfall near Acapulco, a popular tourist destination in Mexico. In addition to catastrophic structural damage, it was reported that “more than 10,000 utility poles were destroyed, knocking out power and internet/communications across the region, while numerous transmission lines, electrical substations, and a power plant were also heavily damaged.” This damage to electrical and communications infrastructure in the area resulted in significant disruption to Internet connectivity. As shown in the graph below, Internet traffic from Acapulco dropped by around 80% as Otis made landfall. Traffic started to show some growth in early November, but peak volumes remained relatively consistent, and well below pre-hurricane levels, through the end of the year. (Several large spikes are visible on December 26 & 30, but it isn’t clear what those are associated with.) Although Acapulco’s tourism industry experienced a notable recovery heading into the end of the year, it appears that infrastructure recovery has not been quite as swift.
Fire
Hawaii
Last quarter, we reported on the impact of wildfires that started on August 7 in Hawaii, including killing nearly 100 people, as well as destroying homes, businesses, and infrastructure, causing power outages and disrupting Internet connectivity. One of the most impacted areas was the town of Lahaina, where Internet connectivity remained sparse for weeks after the fires began. Repair and restoration efforts continued throughout the fourth quarter, with traffic clearly growing throughout October, with peak levels in November and December approaching pre-fire levels.
Maintenance
Yemen
Two maintenance-related Internet disruptions impacted Internet connectivity in Yemen in the fourth quarter. The first lasted over four hours during the morning of November 10, from 03:10 – 07:45 local time (00:10 – 04:45 UTC), and followed two other disruptions the prior day. The impact was visible at a country level, as well as at a network level on PTC-YemenNet (AS30873).
An Associated Press article noted that in a statement to the state news agency, Yemen’s Public Telecom Corp. (PTC-YemenNet) blamed the outage on maintenance, apparently of the FALCON submarine cable. The article also cited a statement from GCX, the operator of the FALCON cable, regarding scheduled maintenance to the cable system that had been in planning for the previous three months.
The second maintenance-related disruption occurred on December 15 just before 23:00 local time (20:00 UTC). An X post from Mosfer Alnomeir, the Minister of Telecommunication and Information Technology in Yemen, explained what happened: “We note that half an hour ago there was an interruption in the Internet service that lasted approximately 30 minutes. This is while engineers carry out emergency replacement and upgrade work on some service equipment. Service was restored immediately. On behalf of the team, I say thank you for your understanding.” Once again, the impact was visible at both a country and network level.
Technical problems
Australia
“Changes to routing information” after a “routine software upgrade” were reportedly responsible for a multi-hour Internet outage at Australian telecommunications provider Optus (AS4804) on November 8 local time. Connectivity began to drop just after 04:00 Sydney time, with the outage lasting from 04:30 – 10:00 Sydney time (17:30 – 23:00 UTC on November 7). Traffic didn’t fully recover to expected levels until around 23:00 Sydney time (12:00 UTC).
The network issue impacted more than 10 million customers, as well as hospitals and payment and transport systems, and drew comparisons to July 2023’s outage at Canadian provider Rogers Communications. Optus submitted a report to the Australian Senate Standing Committee on Environment and Communications that detailed the cause of the outage, noting “It is now understood that the outage occurred due to approximately 90 PE routers automatically self-isolating in order to protect themselves from an overload of IP routing information. … This unexpected overload of IP routing information occurred after a software upgrade at one of the Singtel internet exchanges (known as STiX) in North America, one of Optus’ international networks. During the upgrade, the Optus network received changes in routing information from an alternate Singtel peering router. These routing changes were propagated through multiple layers of our IP Core network. As a result, at around 4:05am (AEDT), the pre-set safety limits on a significant number of Optus network routers were exceeded.” The report also detailed the recovery efforts and timelines for consumer Internet, DNS, and mobile services.
Armenia
Failure of international links caused a brief Internet disruption at Telecom Armenia (AS12297) on November 11, similar to a disruption that occurred almost exactly a year earlier. As shown in the graph below, the disruption began just around 15:15 local time (11:15 UTC), with short periods where traffic dropped to zero. Traffic recovered to expected levels by 21:00 local time (17:00 UTC). As one of the largest telecommunications providers in the country, the service disruption was visible at a country level as well.
United Kingdom
A sizable drop in traffic was observed between 15:00 and 21:30 local time (15:00 – 21:30 UTC) on mobile and broadband Internet provider Three UK (AS206067) on December 1, as seen in the graph below. Although the provider acknowledged that customers were experiencing issues and provided several updates (1, 2, 3, 4) on service restoration over the next day, it never disclosed any additional information on the cause of the disruption. However, a published report stated that Three UK blamed technical issues at one of its data centers as the cause of the problem, which impacted more than 20,000 users.
Egypt
On December 5, Telecom Egypt (AS8452)posted on X that a technical malfunction affecting one of their main network devices was responsible for an Internet disruption that occurred on their network, which also impacted connectivity on several other network providers, including LINKdotNET (AS24863), Vodadfone Egypt (AS24835), and Etisalat (AS36992), as well as traffic at a national level, as seen in the graphs below. Although one news report claimed that the disruption, which occurred between 14:15 – 00:00 local time (12:15 – 22:00 UTC), was due to damage to the FLAG and SeaMeWe-4 submarine cables, a subsequent post from Telecom Egypt about service restoration dispelled that claim, noting “The company also confirms that there is no truth to what has been circulated on some social media sites about the presence of a break in one of the submarine cables.”
Tunisia
A reported DNS server outage (albeit unconfirmed) at Tunisian Internet provider Topnet (AS37705) caused a brief Internet disruption for the provider’s customers on December 17, also impacting traffic volumes at a national level. The incident lasted less than two hours, from 13:00 – 14:45 local time (12:00 – 13:45 UTC).
Guinea
An unspecified incident on the Orange Guinée (AS37461) network impacted Internet connectivity, as well as telephone calls and text messages during the morning of December 22. The graph below shows a near-complete outage on the network between 09:15 – 11:30 local time (09:15 – 11:30 UTC). The provider posted a subsequent update regarding the restoration of calls, text messages, and Internet connectivity.
Conclusion
Within the Cloudflare Radar 2023 Year in Review, we highlighted over 180 major Internet disruptions that were observed year-to-date through the end of November, though the actual number was likely closer to 200 by the end of the year. While that may seem like a lot, it is worth nothing that the actual number is even higher, as these posts are not exhaustive in their coverage of such events. For example, while we covered the Internet shutdown in Manipur, India that took place across multiple months in 2023, internetshutdowns.in shows that over 90 more smaller localized shutdowns were put into place across the country.
On October 13, 2023, Cloudflare’s Cloudforce One Threat Operations Team became aware of a website hosting a Google Android Application (APK) impersonating the legitimate RedAlert – Rocket Alerts application (https://play.google.com/store/apps/details?id=com.red.alert&hl=en&pli=1). More than 5,000 rockets have been launched into Israel since the attacks from Hamas began on October 7th 2023. RedAlert – Rocket Alerts developed by Elad Nava allows individuals to receive timely and precise alerts about incoming airstrikes. Many people living in Israel rely on these alerts to seek safety – a service which has become increasingly important given the newest escalations in the region.
Applications alerting of incoming airstrikes have become targets as only days ago, Pro-Palestinian hacktivist group AnonGhost exploited a vulnerability in another application, “Red Alert: Israel” by Kobi Snir. (https://cybernews.com/cyber-war/israel-redalert-breached-anonghost-hamas/) Their exploit allowed them to intercept requests, expose servers and APIs, and send fake alerts to some app users, including a message that a “nuclear bomb is coming”. AnonGhost also claimed they attacked other rocket alert applications, including RedAlert by Elad Nava. As of October 11, 2023, the RedAlert app was reportedly functioning normally.
In the last two days, a new malicious website (hxxps://redalerts[.]me) has advertised the download of well-known open source application RedAlert by Elad Nava (https://github.com/eladnava/redalert-android). Domain impersonation continues to be a popular vector for attackers, as the legitimate website for the application (hxxps://redalert[.]me ) differs from the malicious website by only one letter. Further, threat actors continue to exploit open source code and deploy modified, malicious versions to unsuspecting users.
The malicious website hosted links to both the iOS and the Android version of the RedAlert app. But while the link to the Apple App Store referred to the legitimate version of the RedAlert app by Elad Nava, the link supposedly referring to the Android version hosted on the Play Store directly downloads a malicious APK file. This attack demonstrates the danger of sideloading applications directly from the Internet as opposed to installing applications from the approved app store.
The malicious RedAlert version imitates the legitimate rocket alert application but simultaneously collects sensitive user data. Additional permissions requested by the malicious app include access to contacts, call logs, SMS, account information, as well as an overview of all installed apps.
The website hosting the malicious file was created on October 12, 2023 and has since been taken offline. Only users who installed the Android version of the app from this specific website are impacted and urgently advised to delete the app. Users can determine if they installed the malicious version by reviewing the permissions granted to the RedAlert app. If users are unsure whether they installed the malicious version, they can delete the RedAlert applications and reinstall the legitimate version directly in the Play Store.
Screenshot of the attacker site https://redalerts[.]me
Malicious Android Package Kit (APK) Analysis
The malicious Android Package Kit (APK) file is installed by a user when they click the Google Play button on the fake RedAlert site. Once clicked, the user downloads the app directly from the fake site at hxxps://redalerts[.]me/app.apk. The SHA-256 hash of the APK is 5087a896360f5d99fbf4eb859c824d19eb6fa358387bf6c2c5e836f7927921c5.
Capabilities
A quick analysis of the AndroidManifest.xml file shows several differences compared to the legitimate, open source RedAlert application. Most notable are the additional permissions needed to collect information on the victim. The permissions added are listed below:
android.permission.GET_ACCOUNTS
android.permission.QUERY_ALL_PACKAGES
android.permission.READ_CALL_LOG
android.permission.READ_CONTACTS
android.permission.READ_PHONE_NUMBERS
android.permission.READ_PHONE_STATE
android.permission.READ_PRIVILEGED_PHONE_STATE
android.permission.READ_SMS
The application is designed to look and act like RedAlert. However, upon opening the app, a malicious service is started in the background. The startService() call is the only change to the onCreate() method, and this begins the sequence of malicious activity, which the actor has placed in a package called com.company.allinclusive.AI
The attacker starts their malicious code within the legitimate RedAlert code com.red.alert.activities: Main.java
The service is run to gather data from victims’ phones and upload it to the actor’s secure server. The data is extensive and includes:
SIM information, including IMEI and IMSI numbers, network type, country, voicemail number, PIN status, and more
Full Contact list
All SMS messages, including content and metadata for all statuses (e.g. received, outgoing, sent, etc.)
A list of accounts associated with the device
All phone calls and conversation details for including incoming, outgoing, missed, rejected, and blocked calls
Logged-in email and app accounts
List of installed applications
The actor’s code for gathering this information is illustrated below.
com.company.allinclusive.AI: AIMain.java contains the data the attacker will capture form the target
Stolen data is uploaded to an HTTP server at a hardcoded IP address. The actor has a Tools class which details the IP address where the data is to be uploaded:
com.company.allinclusive.AI: Tools.java stores the attackers command and control for the malware
Although HTTP and port 80 are specified, the actor appears to have the ability to use HTTPS and port 443 if a certificate is found bundled within the application package:
com.company.allinclusive.AI: UploadFileAsync.java
Data is uploaded through a Connector class, written by the actor. The Connector is responsible for encrypting the stolen data and uploading it to the HTTP server. In this sample, files are encrypted with AES in CBC mode with PKCS5 Padding. The keys are randomly generated and appended to the packaged data, however the keys are encrypted with RSA using a public key bundled in the malicious app. Because of this, anybody who is able to intercept the stolen data will be unable to decrypt it without the actor’s private key.
The encrypted files have names that look like <ID>_<DATE>.final, which contain:
<ID>_<DATE>.enc (encrypted data)
<ID>_<DATE>.param (AES encryption parameters, e.g. key and IV)
<ID>_<DATE>.eparam (RSA parameters, e.g. public key)
Anti-Analysis Runtime Capabilities
To avoid detection the actor included anti-analysis capabilities which can run at the time the app is started. The methods for anti-analysis that the attacker has included were anti-debugging, anti-emulation, and anti-test operations
Anti-Debugging
The application makes a simple call using the builtin android.os.Debug package to see if the application is being debugged.
The application attempts to locate certain files and identifiers to determine whether it is being run in an emulated environment. A snippet of these indicators are shown below:
com.company.allinclusive.AI.anti.emulator: FindEmulator.java checks for common emulators
Anti-Test
The application has utilities to identify whether a test user (“monkey”) is using the application:
These methodologies are all rudimentary checks for whether the application is under runtime analysis. It does not, however, protect the malicious code against static analysis.
How To Detect This Malware On Your Device
If you have installed RedAlert on your device, the extraneous permissions added by the actor can be used to determine whether you have been compromised. The following permissions appearing on the RedAlert app (whether or not enabled) would indicate compromise:
Call Logs
Contacts
Phone
SMS
How To Protect Yourself
You can avoid attacks like this by following the guidance below:
Keep your mobile device up to date on the latest software version at all times
Under attack? Contact our hotline to speak with someone immediately.Visit 1.1.1.1 from any device to get started with our free app that makes your Internet faster and safer.To learn more about our mission to help build a better Internet, start here. If you’re looking for a new career direction, check out our open positions.
On Saturday, October 7, 2023, attacks from the Palestinian group Hamas launched from the Gaza Strip against the south of Israel started a new conflict in the region. Israel officially declared that it is at war the next day. Cloudflare's data shows that Internet traffic was impacted in different ways, both in Israel and Palestine, with two networks (autonomous systems) in the Gaza Strip going offline a few hours after the attacks. Subsequently, on October 9, two additional networks also experienced outages. We also saw an uptick in cyberattacks targeting Israel, including a 1.26 billion HTTP requests DDoS attack, and Palestine.
Starting with general Internet traffic trends, there was a clear increase in Internet traffic right after the attacks reportedly began (03:30 UTC, 06:30 local time). Traffic spiked at around 03:35 UTC (06:35 local time) in both Israel (~170% growth compared with the previous week) and Palestine (100% growth).
That growth is consistent with other situations, where we’ve seen surges in Internet traffic when countrywide events occur and people are going online to check for news, updates, and more information on what is happening, with social media and messaging also playing a role. However, in Palestine, that traffic growth was followed by a clear drop in traffic around 08:00 UTC (11:00 local time).
The Palestine uptick in traffic after the Hamas attacks started is more visible when only looking at HTTP requests. Requests in Palestine dropped on Saturday and Sunday, October 7 and 8, as much as 20% and 25%, respectively.
Palestine's outages and Internet impact
What drove the drop in Internet traffic in Palestine? Our data shows that two Gaza Strip related networks (autonomous systems or ASNs) were offline on that October 7 morning. Fusion (AS42314) was offline from 08:00 UTC, but saw some recovery after 17:00 UTC the next day; this only lasted for a few hours, given that it went back offline after 12:00 UTC this Monday, October 9.
It was the same scenario for DCC North (AS203905), but it went offline after 10:00 UTC and with no recovery of traffic observed as of Monday, October 9. These Internet disruptions may be related to power outages in the Gaza Strip.
During the day on October 7, other Palestinian networks saw less traffic than usual. JETNET (AS199046) had around half of the usual traffic after 08:00 UTC, similar to SpeedClick (AS57704), which had around 60% less traffic. After 14:15 on October 9, traffic to those networks dropped sharply (a 95% decrease compared with the previous week), showing only residual traffic.
When looking more closely at the Gaza Strip specifically, we can see that some districts or governorates had a drop in HTTP requests a few hours after the first Hamas attacks. The Gaza Governorate was impacted, with traffic dropping on October 7, 2023, after 09:15 UTC. On October 9, at 18:00 UTC, traffic was 46% lower than in the previous week. (Note: there were spikes in traffic during Friday, October 6, several hours before the attacks, but it is unclear what caused those spikes.)
The Deir al-Balah Governorate (on October 9, at 18:00 UTC, traffic was 46% lower than in the previous week) and the Khan Yunis Governorate (50% lower) also both experienced similar drops in traffic:
In the Rafah Governorate traffic dropped after 19:00 UTC on October 8 (and on October 9, at 18:00 UTC, traffic was 65% lower than in the previous week).
Other Palestinian governorates in the West Bank did not experience the same impact to Internet traffic.
Spikes in Internet traffic in Israel
In Israel, Internet traffic surged to ~170% as compared to the previous week right after the Hamas attacks on October 7 at around 03:35 UTC (06:35 local time), and again at around 16:00 UTC (19:00 local time), with ~80% growth compared to the previous week. In both cases, the increase was driven by mobile device traffic.
There was also increased traffic, as compared with usual levels, on Sunday, October 8, with notable spikes at around 06:00 (09:00 local time) and 12:00 UTC (15:00 local time), seen in the HTTP requests traffic graph below.
Mobile device traffic drove the Saturday, October 7 spikes in traffic, with the daily mobile device usage percentage reaching its highest in the past two months, reaching 56%.
Looking at specific Israel districts, traffic looks similar to the nationwide perspective.
Cyber attacks targeting Israel
Cyber attacks are frequent, recurrent, and are not necessarily dependent on actual wars on the ground, as our 2023 attacks landscape clearly showed. However, it is not unusual to see cyberattacks launched in tandem with ground assaults. We saw that in Ukraine, an uptick in cyber attacks started just before war began there on February 24, 2022, and were even more constant, and spread to other countries after that day.
In Israel, we saw a clear uptick in cyber attacks earlier this year, with another wave of notable attacks on October 7 and October 8, 2023, after the Hamas attacks. The largest ones were DDoS attacks targeting Israeli newspapers. One attack on October 8, reached 1.26 billion daily requests blocked by Cloudflare as DDoS attacks, and the other reached 346 million daily requests on October 7, and 332 million daily requests the following day.
Looking at these DDoS attacks in terms of requests per second, one of the impacted sites experienced a peak of 1.1 million requests per second on October 8 at 02:00 UTC, and the other Israeli newspaper saw a peak of 745k requests per second at around 06:00 the same day.
In Palestine, we also saw application layer DDoS attacks, but not as big. The main one in the past three months was on October 7, 2023, targeting a Palestine online newspaper, reaching 105 million daily requests.
Looking at these most notable DDoS attacks targeting Palestine in terms of requests per second (rps), the most impacted site (a Palestinian newspaper) experienced a peak of 214k requests per second at around 17:20 UTC on October 7.
Follow Cloudflare Radar for up to date information
We launched the Cloudflare Radar Outage Center (CROC) during Birthday Week 2022 as a way of keeping the community up to date on Internet disruptions, including outages and shutdowns, visible in Cloudflare’s traffic data. While some of the entries have their genesis in information from social media posts made by local telecommunications providers or civil society organizations, others are based on an internal traffic anomaly detection and alerting tool. Today, we’re adding this alerting feed to Cloudflare Radar, showing country and network-level traffic anomalies on the CROC as they are detected, as well as making the feed available via API.
Building on this new functionality, as well as the route leaks and route hijacks insights that we recently launched on Cloudflare Radar, we are also launching new Radar notification functionality, enabling you to subscribe to notifications about traffic anomalies, confirmed Internet outages, route leaks, or route hijacks. Using the Cloudflare dashboard’s existing notification functionality, users can set up notifications for one or more countries or autonomous systems, and receive notifications when a relevant event occurs. Notifications may be sent via e-mail or webhooks — the available delivery methods vary according to plan level.
Traffic anomalies
Internet traffic generally follows a fairly regular pattern, with daily peaks and troughs at roughly the same volumes of traffic. However, while weekend traffic patterns may look similar to weekday ones, their traffic volumes are generally different. Similarly, holidays or national events can also cause traffic patterns and volumes to differ significantly from “normal”, as people shift their activities and spend more time offline, or as people turn to online sources for information about, or coverage of, the event. These traffic shifts can be newsworthy, and we have covered some of them in past Cloudflare blog posts (King Charles III coronation, Easter/Passover/Ramadan, Brazilian presidential elections).
However, as you also know from reading our blog posts and following Cloudflare Radar on social media, it is the more drastic drops in traffic that are a cause for concern. Some are the result of infrastructure damage from severe weather or a natural disaster like an earthquake and are effectively unavoidable, but getting timely insights into the impact of these events on Internet connectivity is valuable from a communications perspective. Other traffic drops have occurred when an authoritarian government orders mobile Internet connectivity to be shut down, or shuts down all Internet connectivity nationwide. Timely insights into these types of anomalous traffic drops are often critical from a human rights perspective, as Internet shutdowns are often used as a means of controlling communication with the outside world.
Over the last several months, the Cloudflare Radar team has been using an internal tool to identify traffic anomalies and post alerts for followup to a dedicated chat space. The companion blog post Gone Offline: Detecting Internet Outages goes into deeper technical detail about our traffic analysis and anomaly detection methodologies that power this internal tool.
Many of these internal traffic anomaly alerts ultimately result in Outage Center entries and Cloudflare Radar social media posts. Today, we’re extending the Cloudflare Radar Outage Center and publishing information about these anomalies as we identify them. As shown in the figure below, the new Traffic anomalies table includes the type of anomaly (location or ASN), the entity where the anomaly was detected (country/region name or autonomous system), the start time, duration, verification status, and an “Actions” link, where the user can view the anomaly on the relevant entity traffic page or subscribe to a notification. (If manual review of a detected anomaly finds that it is present in multiple Cloudflare traffic datasets and/or is visible in third-party datasets, such as Georgia Tech’s IODA platform, we will mark it as verified. Unverified anomalies may be false positives, or related to Netflows collection issues, though we endeavor to minimize both.)
In addition to this new table, we have updated the Cloudflare Radar Outage Center map to highlight where we have detected anomalies, as well as placing them into a broader temporal context in a new timeline immediately below the map. Anomalies are represented as orange circles on the map, and can be hidden with the toggle in the upper right corner. Double-bordered circles represent an aggregation across multiple countries, and zooming in to that area will ultimately show the number of anomalies associated with each country that was included in the aggregation. Hovering over a specific dot in the timeline displays information about the outage or anomaly with which it is associated.
Internet outage information has been available via the Radar API since we launched the Outage Center and API in September 2022, and traffic anomalies are now available through a Radar API endpoint as well. An example traffic anomaly API request and response are shown below.
Timely knowledge about Internet “events”, such as drops in traffic or routing issues, are potentially of interest to multiple audiences. Customer service or help desk agents can use the information to help diagnose customer/user complaints about application performance or availability. Similarly, network administrators can use the information to better understand the state of the Internet outside their network. And civil society organizations can use the information to inform action plans aimed at maintaining communications and protecting human rights in areas of conflict or instability. With the new notifications functionality also being launched today, you can subscribe to be notified about observed traffic anomalies, confirmed Internet outages, route leaks, or route hijacks, at a country or autonomous system level. In the following sections, we discuss how to subscribe to and configure notifications, as well as the information contained within the various types of notifications.
Subscribing to notifications
Note that you need to log in to the Cloudflare dashboard to subscribe to and configure notifications. No purchase of Cloudflare services is necessary — just a verified email address is required to set up an account. While we would have preferred to not require a login, it enables us to take advantage of Cloudflare’s existing notifications engine, allowing us to avoid having to dedicate time and resources to building a separate one just for Radar. If you don’t already have a Cloudflare account, visit https://dash.cloudflare.com/sign-up to create one. Enter your username and a unique strong password, click “Sign Up”, and follow the instructions in the verification email to activate your account. (Once you’ve activated your account, we also suggest activating two-factor authentication (2FA) as an additional security measure.)
Once you have set up and activated your account, you are ready to start creating and configuring notifications. The first step is to look for the Notifications (bullhorn) icon – the presence of this icon means that notifications are available for that metric — in the Traffic, Routing, and Outage Center sections on Cloudflare Radar. If you are on a country or ASN-scoped traffic or routing page, the notification subscription will be scoped to that entity.
Look for this icon in the Traffic, Routing, and Outage Center sections of Cloudflare Radar to start setting up notifications.In the Outage Center, click the icon in the “Actions” column of an Internet outages table entry to subscribe to notifications for the related location and/or ASN(s). Click the icon alongside the table description to subscribe to notifications for all confirmed Internet outages.In the Outage Center, click the icon in the “Actions” column of a Traffic anomalies table entry to subscribe to notifications for the related entity. Click the icon alongside the table description to subscribe to notifications for all traffic anomalies.On country or ASN traffic pages, click the icon alongside the description of the traffic trends graph to subscribe to notifications for traffic anomalies or Internet outages impacting the selected country or ASN.On country or ASN routing pages, click the icon alongside the description to subscribe to notifications for route leaks or origin hijacks related to the selected country or ASN.Within the Route Leaks or Origin Hijacks tables on the routing pages, click the icon in a table entry to subscribe to notifications for route leaks or origin hijacks for referenced countries and/or ASNs.
After clicking a notification icon, you’ll be taken to the Cloudflare login screen. Enter your username and password (and 2FA code if required), and once logged in, you’ll see the Add Notification page, pre-filled with the key information passed through from the referring page on Radar, including relevant locations and/or ASNs. (If you are already logged in to Cloudflare, then you’ll be taken directly to the Add Notification page after clicking a notification icon on Radar.) On this page, you can name the notification, add an optional description, and adjust the location and ASN filters as necessary. Enter an email address for notifications to be sent to, or select an established webhook destination (if you have webhooks enabled on your account).
Click “Save”, and the notification is added to the Notifications Overview page for the account.
You can also create and configure notifications directly within Cloudflare, without starting from a link on Radar a Radar page. To do so, log in to Cloudflare, and choose “Notifications” from the left side navigation bar. That will take you to the Notifications page shown below. Click the “Add” button to add a new notification.
On the next page, search for and select “Radar” from the list of Cloudflare products for which notifications are available.
On the subsequent “Add Notification” page, you can create and configure a notification from scratch. Event types can be selected in the “Notify me for:” field, and both locations and ASNs can be searched for and selected within the respective “Filtered by (optional)” fields. Note that if no filters are selected, then notifications will be sent for all events of the selected type(s). Add one or more emails to send notifications to, or select a webhook target if available, and click “Save” to add it to the list of notifications configured for your account.
It is worth mentioning that advanced users can also create and configure notifications through the Cloudflare API Notification policies endpoint, but we will not review that process within this blog post.
Notification messages
Example notification email messages are shown below for the various types of events. Each contains key information like the type of event, affected entities, and start time — additional relevant information is included depending on the event type. Each email includes both plaintext and HTML versions to accommodate multiple types of email clients. (Final production emails may vary slightly from those shown below.)
Internet outage notification emails include information about the affected entities, a description of the cause of the outage, start time, scope (if available), and the type of outage (Nationwide, Network, Regional, or Platform), as well as a link to view the outage in a Radar traffic graph.Traffic anomaly notification emails simply include information about the affected entity and a start time, as well as a link to view the anomaly in a Radar traffic graph.BGP hijack notification emails include information about the hijacking and victim ASNs, affected IP address prefixes, the number of BGP messages (announcements) containing leaked routes, the number of peers announcing the hijack, detection timing, a confidence level on the event being a true hijack, and relevant tags, as well as a link to view details of the hijack event on Radar.BGP route leak notification emails include information about the AS that the leaked routes were learned from, the AS that leaked the routes, the AS that received and propagated the leaked routes, the number of affected prefixes, the number of affected origin ASes, the number of BGP route collector peers that saw the route leak, and detection timing, as well as a link to view details of the route leak event on Radar.
If you are sending notifications to webhooks, you can integrate those notifications into tools like Slack. For example, by following the directions in Slack’s API documentation, creating a simple integration took just a few minutes and results in messages like the one shown below.
Conclusion
Cloudflare’s unique perspective on the Internet provides us with near-real-time insight into unexpected drops in traffic, as well as potentially problematic routing events. While we’ve been sharing these insights with you over the past year, you had to visit Cloudflare Radar to figure out if there were any new “events”. With the launch of notifications, we’ll now automatically send you information about the latest events that you are interested in.
We encourage you to visit Cloudflare Radar to familiarize yourself with the information we publish about traffic anomalies, confirmed Internet outages, BGP route leaks, and BGP origin hijacks. Look for the notification icon on the relevant graphs and tables on Radar, and go through the workflow to set up and subscribe to notifications. (And don’t forget to sign up for a Cloudflare account if you don’t have one already.) Please send us feedback about the notifications, as we are constantly working to improve them, and let us know how and where you’ve integrated Radar notifications into your own tools/workflows/organization.
Currently, Cloudflare Radar curates a list of observed Internet disruptions (which may include partial or complete outages) in the Outage Center. These disruptions are recorded whenever we have sufficient context to correlate with an observed drop in traffic, found by checking status updates and related communications from ISPs, or finding news reports related to cable cuts, government orders, power outages, or natural disasters.
However, we observe more disruptions than we currently report in the outage center because there are cases where we can’t find any source of information that provides a likely cause for what we are observing, although we are still able to validate with external data sources such as Georgia Tech’s IODA. This curation process involves manual work, and is supported by internal tooling that allows us to analyze traffic volumes and detect anomalies automatically, triggering the workflow to find an associated root cause. While the Cloudflare Radar Outage Center is a valuable resource, one of key shortcomings include that we are not reporting all disruptions, and that the current curation process is not as timely as we’d like, because we still need to find the context.
As we announced today in a related blog post, Cloudflare Radar will be publishing anomalous traffic events for countries and Autonomous Systems (ASes). These events are the same ones referenced above that have been triggering our internal workflow to validate and confirm disruptions. (Note that at this time “anomalous traffic events” are associated with drops in traffic, not unexpected traffic spikes.) In addition to adding traffic anomaly information to the Outage Center, we are also launching the ability for users to subscribe to notifications at a location (country) or network (autonomous system) level whenever a new anomaly event is detected, or a new entry is added to the outage table. Please refer to the related blog post for more details on how to subscribe.
The current status of each detected anomaly will be shown in the new “Traffic anomalies” table on the Outage Center page:
When the anomaly is automatically detected its status will initially be Unverified
After attempting to validate ‘Unverified’ entries:
We will change the status to ‘Verified’ if we can confirm that the anomaly appears across multiple internal data sources, and possibly external ones as well. If we find associated context for it, we will also create an outage entry.
We will change status to ‘False Positive’ if we cannot confirm it across multiple data sources. This will remove it from the “Traffic anomalies” table. (If a notification has been sent, but the anomaly isn’t shown in Radar anymore, it means we flagged it as ‘False Positive’.)
We might also manually add an entry with a “Verified” status. This might occur if we observe, and validate, a drop in traffic that is noticeable, but was not large enough for the algorithm to catch it.
A glimpse at what Internet traffic volume looks like
At Cloudflare, we have several internal data sources that can give us insights into what the traffic for a specific entity looks like. We identify the entity based on IP address geolocation in the case of locations, and IP address allocation in the case of ASes, and can analyze traffic from different sources, such as DNS, HTTP, NetFlows, and Network Error Logs (NEL). All the signals used in the figures below come from one of these data sources and in this blog post we will treat this as a univariate time-series problem — in the current algorithm, we use more than one signal just to add redundancy and identify anomalies with a higher level of confidence. In the discussion below, we intentionally select various examples to encompass a broad spectrum of potential Internet traffic volume scenarios.
1. Ideally, the signals would resemble the pattern depicted below for Australia (AU): a stable weekly pattern with a slightly positive trend meaning that the trend average is moving up over time (we see more traffic over time from users in Australia).
These statements can be clearly seen when we perform time-series decomposition which allows us to break down a time-series into its constituent parts to better understand and analyze its underlying patterns. Decomposing the traffic volume for Australia above assuming a weekly pattern with Seasonal-Trend decomposition using LOESS (STL) we get the following:
The weekly pattern we are referring to is represented by the seasonal part of the signal that is expected to be observed due to the fact that we are interested in eyeball / human internet traffic. As observed in the image above, the trend component is expected to move slowly when compared with the signal level and the residual part ideally would resemble white noise meaning that all existing patterns in the signal are represented by the seasonal and trend components.
2. Below we have the traffic volume for AS15964 (CAMNET-AS) that appears to have more of a daily pattern, as opposed to weekly.
We also observe that there’s a value offset of the signal right after the first four days (blue dashed-line) and the red background shows us an outage for which we didn’t find any reporting besides seeing it in our data and other Internet data providers — our intention here is to develop an algorithm that will trigger an event when it comes across this or similar patterns.
4. Another scenario is several scheduled outages for AS203214 (HulumTele), for which we also have context. These anomalies are the easiest to detect since the traffic goes to values that are unique to outages (cannot be mistaken as regular traffic), but it poses another challenge: if our plan was to just check the weekly patterns, since these government-directed outages happen with the same frequency, at some point the algorithm would see this as expected traffic.
5. This outage in Kenya could be seen as similar to the above: the traffic volume went down to unseen values although not as significantly. We also observe some upward spikes in the data that are not following any specific pattern — possibly outliers — that we should clean depending on the approach we use to model the time-series.
6. Lastly, here's the data that will be used throughout this post as an example of how we are approaching this problem. For Madagascar (MG), we observe a clear pattern with pronounced weekends (blue background). There’s also a holiday (Assumption of Mary), highlighted with a green background, and an outage, with a red background. In this example, weekends, holidays, and outages all seem to have roughly the same traffic volume. Fortunately, the outage gives itself away by showing that it intended to go up as in a normal working day, but then there was a sudden drop — we will see it more closely later in this post.
In summary, here we looked over six examples out of ~700 (the number of entities we are automatically detecting anomalies for currently) and we see a wide range of variability. This means that in order to effectively model the time-series we would have to run a lot of preprocessing steps before the modeling itself. These steps include removing outliers, detecting short and long-term data offsets and readjusting, and detecting changes in variance, mean, or magnitude. Time is also a factor in preprocessing, as we would also need to know in advance when to expect events / holidays that will push the traffic down, apply daylight saving time adjustments that will cause a time shift in the data, and be able to apply local time zones for each entity, including dealing with locations that have multiple time zones and AS traffic that is shared across different time zones.
To add to the challenge, some of these steps cannot even be performed in a close-to-real-time fashion (example: we can only say there’s a change in seasonality after some time of observing the new pattern). Considering the challenges mentioned earlier, we have chosen an algorithm that combines basic preprocessing and statistics. This approach aligns with our expectations for the data's characteristics, offers ease of interpretation, allows us to control the false positive rate, and ensures fast execution while reducing the need for many of the preprocessing steps discussed previously.
Above, we noted that we are detecting anomalies for around 700 entities (locations and autonomous systems) at launch. This obviously does not represent the entire universe of countries and networks, and for good reason. As we discuss in this post, we need to see enough traffic from a given entity (have a strong enough signal) to be able to build relevant models and subsequently detect anomalies. For some smaller or sparsely populated countries, the traffic signal simply isn’t strong enough, and for many autonomous systems, we see little-to-no traffic from them, again resulting in a signal too weak to be useful. We are initially focusing on locations where we have a sufficiently strong traffic signal and/or are likely to experience traffic anomalies, as well as major or notable autonomous systems — those that represent a meaningful percentage of a location’s population and/or those that are known to have been impacted by traffic anomalies in the past.
Detecting anomalies
The approach we took to solve this problem involves creating a forecast that is a set of data points that correspond to our expectation according to what we’ve seen in historical data. This will be explained in the section Creating a forecast. We take this forecast and compare it to what we are actually observing — if what we are observing is significantly different from what we expect, then we call it an anomaly. Here, since we are interested in traffic drops, an anomaly will always correspond to lower traffic than the forecast / expected traffic. This comparison is elaborated in the section Comparing forecast with actual traffic.
In order to compute the forecast we need to fulfill the following business requirements:
We are mainly interested in traffic related to human activity.
The more timely we detect the anomaly, the more useful it is. This needs to take into account constraints such as data ingestion and data processing times, but once the data is available, we should be able to use the latest data point and detect if it is an anomaly.
A low False Positive (FP) rate is more important than a high True Positive (TP) rate. As an internal tool, this is not necessarily true, but as a publicly visible notification service, we want to limit spurious entries at the cost of not reporting some anomalies.
Selecting which entities to observe
Aside from the examples given above, the quality of the data highly depends on the volume of the data, and this means that we have different levels of data quality depending on which entity (location / AS) we are considering. As an extreme example, we don’t have enough data from Antarctica to reliably detect outages. Follows the process we used to select which entities are eligible to be observed.
For ASes, since we are mainly interested in Internet traffic that represents human activity, we use the number of users estimation provided by APNIC. We then compute the total number of users per location by summing up the number of users of each AS in that location, and then we calculate what percentage of users an AS has for that location (this number is also provided by the APNIC table in column ‘% of country’). We filter out ASes that have less than 1% of the users in that location. Here’s what the list looks like for Portugal — AS15525 (MEO-EMPRESAS) is excluded because it has less than 1% of users of the total number of Internet users in Portugal (estimated).
At this point we have a subset of ASes and a set of locations (we don’t exclude any location a priori because we want to cover as much as possible) but we will have to narrow it down based on the quality of the data to be able to reliably detect anomalies automatically. After testing several metrics and visually analyzing the results, we came to the conclusion that the best predictor of a stable signal is related to the volume of data, so we removed the entities that don’t satisfy the criteria of a minimum number of unique IPs daily in a two weeks period — the threshold is based on visual inspection.
Creating a forecast
In order to detect the anomalies in a timely manner, we decided to go with traffic aggregated every fifteen minutes, and we are forecasting one hour of data (four data points / blocks of fifteen minutes) that are compared with the actual data.
After selecting the entities for which we will detect anomalies, the approach is quite simple:
1. We look at the last 24 hours immediately before the forecast window and use that interval as the reference. The assumption is that the last 24 hours will contain information about the shape of what follows. In the figure below, the last 24 hours (in blue) corresponds to data transitioning from Friday to Saturday. By using the Euclidean distance, we get the six most similar matches to that reference (orange) — four of those six matches correspond to other transitions from Friday to Saturday. It also captures the holiday on Monday (August 14, 2023) to Tuesday, and we also see a match that is the most dissimilar to the reference, a regular working day from Wednesday to Thursday. Capturing one that doesn't represent the reference properly should not be a problem because the forecast is the median of the most similar 24 hours to the reference, and thus the data of that day ends up being discarded.
There are two important parameters that we are using for this approach to work:
We take into consideration the last 28 days (plus the reference day equals 29). This way we ensure that the weekly seasonality can be seen at least 4 times, we control the risk associated with the trend changing over time, and we set an upper bound to the amount of data we need to process. Looking at the example above, the first day was one with the highest similarity to the reference because it corresponds to the transition from Friday to Saturday.
The other parameter is the number of most similar days. We are using six days as a result of empirical knowledge: given the weekly seasonality, when using six days, we expect at most to match four days for the same weekday and then two more that might be completely different. Since we use the median to create the forecast, the majority is still four and thus those extra days end up not being used as reference. Another scenario is in the case of holidays such as the example below:
A holiday in the middle of the week in this case looks like a transition from Friday to Saturday. Since we are using the last 28 days and the holiday starts on a Tuesday we only see three such transitions that are matching (orange) and then another three regular working days because that pattern is not found anywhere else in the time-series and those are the closest matches. This is why we use the lower quartile when computing the median for an even number of values (meaning we round the data down to the lower values) and use the result as the forecast. This also allows us to be more conservative and plays a role in the true positive/false positive tradeoff.
Lastly let's look at the outage example:
In this case, the matches are always connected to low traffic because the last 24h (reference) corresponds to a transition from Sunday to Monday and due to the low traffic the lowest Euclidean distance (most similar 24h) are either Saturdays (two times) or Sundays (four times). So the forecast is what we would expect to see on a regular Monday and that’s why the forecast (red) has an upward trend but since we had an outage, the actual volume of traffic (black) is considerably lower than the forecast.
This approach works for regular seasonal patterns, as would several other modeling approaches, and it has also been shown to work in case of holidays and other moving events (such as festivities that don’t happen at the same day every year) without having to actively add that information in. Nevertheless, there are still use cases where it will fail specifically when there’s an offset in the data. This is one of the reasons why we use multiple data sources to reduce the chances of the algorithm being affected by data artifacts.
Below we have an example of how the algorithm behaves over time.
Comparing forecast with actual traffic
Once we have the forecast and the actual traffic volume, we do the following steps.
We calculate relative change, which measures how much one value has changed relative to another. Since we are detecting anomalies based on traffic drops, the actual traffic will always be lower than the forecast.
After calculating this metric, we apply the following rules:
The difference between the actual and the forecast must be at least 10% of the magnitude of the signal. This magnitude is computed using the difference between 95th and 5th percentiles of the selected data. The idea is to avoid scenarios where the traffic is low, particularly during the off-peaks of the day and scenarios where small changes in actual traffic correspond to big changes in relative change because the forecast is also low. As an example:
a forecast of 100 Gbps compared with an actual value of 80 Gbps gives us a relative change of -0.20 (-20%).
a forecast of 20 Mbps compared with an actual value of 10 Mbps gives us a much smaller decrease in total volume than the previous example but a relative change of -0.50 (50%).
Then we have two rules for detecting considerably low traffic:
Sustained anomaly: The relative change is below a given threshold α throughout the forecast window (for all four data points). This allows us to detect weaker anomalies (with smaller relative changes) that are extended over time.
Point anomaly: The relative change of the last data point of the forecast window is below a given threshold β (where β < α — these thresholds are negative; as an example, β and α might be -0.6 and -0.4, respectively). In this case we need β < α to avoid triggering anomalies due to the stochastic nature of the data but still be able to detect sudden and short-lived traffic drops.
The values of α and β were chosen empirically to maximize detection rate, while keeping the false positive rate at an acceptable level.
Closing an anomaly event
Although the most important message that we want to convey is when an anomaly starts, it is also crucial to detect when the Internet traffic volume goes back to normal for two main reasons:
We need to have the notion of active anomaly, which means that we detected an anomaly and that same anomaly is still ongoing. This allows us to stop considering new data for the reference while the anomaly is still active. Considering that data would impact the reference and the selection of most similar sets of 24 hours.
Once the traffic goes back to normal, knowing the duration of the anomaly allows us to flag those data points as outliers and replace them, so we don’t end up using it as reference or as best matches to the reference. Although we are using the median to compute the forecast, and in most cases that would be enough to overcome the presence of anomalous data, there are scenarios such as the one for AS203214 (HulumTele), used as example four, where the outages are frequently occurring at the same time of the day that would make the anomalous data become the expectation after few days.
Whenever we detect an anomaly we keep the same reference until the data comes back to normal, otherwise our reference would start including anomalous data. To determine when the traffic is back to normal, we use lower thresholds than α and we give it a time period (currently four hours) where there should be no anomalies in order for it to close. This is to avoid situations where we observe drops in traffic that bounce back to normal and drop again. In such cases we want to detect a single anomaly and aggregate it to avoid sending multiple notifications, and in terms of semantics there’s a high chance that it’s related to the same anomaly.
Conclusion
Internet traffic data is generally predictable, which in theory would allow us to build a very straightforward anomaly detection algorithm to detect Internet disruptions. However, due to the heterogeneity of the time series depending on the entity we are observing (Location or AS) and the presence of artifacts in the data, it also needs a lot of context that poses some challenges if we want to track it in real-time. Here we’ve shown particular examples of what makes this problem challenging, and we have explained how we approached this problem in order to overcome most of the hurdles. This approach has been shown to be very effective at detecting traffic anomalies while keeping a low false positive rate, which is one of our priorities. Since it is a static threshold approach, one of the downsides is that we are not detecting anomalies that are not as steep as the ones we’ve shown.
We will keep working on adding more entities and refining the algorithm to be able to cover a broader range of anomalies.
A typo is one of those common mistakes with unpredictable results when it comes to the Internet’s domain names (DNS). In this blog post we’re going to analyze traffic for exmaple.com, and see how a very simple human error ends up creating unintentional traffic on the Internet.
Cloudflare has owned exmaple.com for a few years now, but don’t confuse it with example.com! example.com is a reserved domain name set by the Internet Assigned Numbers Authority (IANA), under the direction of the Internet Engineering Task Force (IETF). It has been used since 1999 as a placeholder, or example, in documentation, tutorials, sample network configurations, or to prevent accidental references to real websites. We use it extensively on this blog.
As I’m writing it, the autocorrect system transforms exmaple.com into example.com, every time, assuming I must have misspelled it. But in situations where there’s no automatic spelling correction (for example, while editing a configuration file) it’s easy for example to become exmaple.
And so, lots of traffic goes to exmaple.com by mistake — whether it was a typoed attempt to reach example.com or due to other random reasons. Fake email accounts in marketing forms are among these reasons (more details below). This phenomenon of "typosquatting" is used by attackers hoping someone misspells the name of a known brand, as we saw in March in our blog “Top 50 most impersonated brands in phishing attacks and new tools you can use to protect your employees from them”. Random typos that cause networks (big or small) problems have also been around for a while.
Here is what the example.com web page shows to a user who goes directly to that domain name:
And this is what exmaple.com looks like:
A bit of exmaple.com history
exmaple.com came to us a few years ago from a customer. He registered the domain to prevent malicious exploitation, but got tired of dealing with more traffic than expected — it’s not the first time that this has happened (icanhazip.com was another similar example). Too much traffic does come at a financial cost. So, why would a domain name like exmaple.com, that is not promoted anywhere, have traffic? It shows how unintentional traffic is a real thing with the right domain name. It could also be a result of a typo in network configurations or a misconfigured router, as we’re going to see next.
Let’s explore, then, what traffic goes to exmaple.com by answering some questions.
How much traffic does it get?
It gets much more traffic than one would expect in terms of HTTP requests, given that it is mostly used because someone or a system/router set by someone, misspelled example.com. In terms of bytes, the numbers are minimal, as this is a very simple site with only a short text sentence, as shown above. Usually, on a daily basis, it doesn’t go over 1 Mbps. In a 12-month period (May 2022-June 2023), it had 2.48 billion HTTP requests, but it has been increasing over recent months. In April 2023, it was 243 million requests, an 8.13 million daily average, against a 6.07 million daily average in June 2022.
What type of traffic is it? Almost all HTTP traffic that goes to exmaple.com is categorized as bot-related. That’s around 99.99%: 2.48 billion requests were from bots, 110,000 were not from bots, and 40,000 we weren’t able to categorize. This already gives us some information, showing that the majority of traffic is not a typical user simply adding exmaple.com by mistake to some documentation or tutorial. This is mostly automated traffic (more on that below).
There are also a few peaks worth mentioning. There’s a clear spike in bot traffic on December 8 and 9, 2022 (11.8 and 11.85 million requests, respectively), the week after Cyber Monday week.
From which countries are requests coming from? The top countries include France, Japan, Germany, and the US. Below, we’re going to check why this happens by looking at the autonomous system (ASNs) perspective. Never forgetting that connected networks or AS’s make up the Internet.
How about HTTP protocols?
In terms of the HTTP protocols, the majority uses unencrypted HTTP only, accounting for 76% of all requests, while HTTPS represents 24%. That is actually unusual in the modern day Internet. As Cloudflare Radar data shows, excluding bots, HTTPS represents 99.3% of all requests in a general Cloudflare perspective, and its 80.8% of HTTPS for bots-only traffic. HTTPS adds a layer of security (SSL/TLS encryption), ensuring data remains confidential.
HTTP is definitely more used by automated traffic, given that HTTPS is more used for human consumption, as browsers tend to prioritize HTTPS. Only 6% of human-related requests use HTTP (the rest is HTTPS). That HTTP percentage jumps to 76%, when considering automated requests-only.
Is exmaple.com the target of cyber attacks?
The short answer is yes. But it’s a very low percentage of requests that are mitigated. The biggest spike in application layer attacks was on December 9, 2022, with 560k HTTP daily requests categorized as DDoS attacks. Nothing of large scale, but that said, small attacks can also take down under-protected sites. WAF mitigations had a 10k spike on November 2, 2022.
Generating the most traffic: a French ISP
What drives most of the traffic are very specific ASNs. In this case, the dominant one is one of France's main Internet operators, Bouygues Telecom. Its AS5410 is generating the most traffic to exmaple.com, followed by Google Cloud, in Japan. Bouygues Telecom traffic to exmaple.com means more than three million daily requests at least since February 2023. Here’s the AS5410 over time traffic:
We contacted Bouygues Telecom to let them know a couple of weeks ago, and shared information about where we were seeing traffic from. So far, they haven’t found the needle in the haystack sending traffic to exmaple.com, potentially related to some erroneous configuration.
And since, exmaple.com is not a malicious site, so there’s no harm, no foul. However, one could wonder what might happen if this were a malicious domain. Identifying and resolving misconfigurations is important for network administrators to ensure efficient and secure network operations.
There are a few other ASN-related oddities. A major spike in traffic on December 8, 2022, with 5.84 million HTTP requests on a single day, came from the Netherlands-based AS49981, Worldstream (an Infrastructure-as-a-Service provider). And on March 28-29, 2023, it was Russian Rostelecom AS12389, with a double spike of around 1.8 million requests per day. On June 18, 2022, it was German Deutsche Telekom AS3320, and on May 6, 2022, there was a 2.31 million HTTP requests daily spike from Bell Canada’s ISP, AS577, just to mention those with clearer spikes.
Here is the list that associates countries with the ASNs that are generating more traffic to exmaple.com:
Why does this happen in specific ASNs in different regions of the world, you may ask? Even without a definitive answer, the amount of daily traffic from those ASNs, and the prevalence of bot traffic, seems to indicate that most traffic is related to a possible misconfiguration in a router, software or network setting, intended to go to example.com.
As we observed previously, example.com is used for testing, educational, or illustrative purposes, including in routers from specific networks. It could be for network troubleshooting and testing, training, simulations, or it also could be in the documentation or guides for configuring routers, as examples to illustrate how to set up DNS configurations, route advertisement, or other networking settings.
What are the main IP versions and browsers?
Regarding IP versions, they can be IPv4 or IPv6 — v6 emerged as a solution when the initial v4 wasn't prepared for the Internet's growth. For exmaple.com unique visitors, looking at the daily number of unique IPs where requests originate, IPv6 has been rising in comparison to IPv4. This suggests that IPv6 is now more frequently used by the services and bots generating most of this traffic. It started in May at 30% IPv6 usage and is now around 50%.
The user-agent header sent by the visitor's web browser in the HTTP request typically contains information about the used browser, operating system, and sometimes even the device. But in this case, the user-agent information doesn’t give us much detail, even of there’s some odd ones. “Empty” (when user agents are absent) comes first, followed by “Mozilla/5.0” and “Go-http-client/2.0”. What do those user-agents mean?
The user agent string "Mozilla/5.0" is widely used by a variety of web browsers, both mainstream and niche, including Mozilla Firefox, Google Chrome, Safari, and Opera. Therefore, it is challenging to attribute the usage of "Mozilla/5.0" specifically to a single browser or user category. While "Mozilla/5.0" is associated with legitimate browsers, it's worth noting that user agent strings can be easily manipulated or forged by bots and malicious actors.
“Go-http-client/2.0” indicates that the request is coming from a program or application written in the Go programming language (often referred to as Golang).
There are also a few others represented with known meanings, such as “curl/7.66.0” (the numbers correspond to the specific version being used). This user agent string indicates that the HTTP request was made using the cURL command-line tool, a popular tool used for tasks like downloading files, automated testing, debugging, or server monitoring. There’s also “Lavf/59.27.100”, a less common user agent tied to FFmpeg's Lavf library for multimedia tasks, and “python-requests/2.28.1”, that indicates the use of the Python Requests library, popular for sending HTTP requests and interacting with web services.
In the camp of more unusual user agents, with a few thousand requests, are instances like a specific GitHub page (a software library called Typhoeus) or a possible “script for checking if job exists” for the job searching site vercida.com.
From where did the users access the website? Let's examine the distribution of HTTP referrers. Note that the term "referer" is based on a misspelling in the original specification that has persisted (it should be "referrer header" instead) in HTTP — in the original HTTP proposal Tim Berners-Lee spells it “referrer” as well. The referer or referrer header is an optional field that provides information about the URL of the web page from which a particular request originated.
The predominant “referer” used is “empty”, which occurs when a user agent isn’t provided, also possibly meaning direct access or by bookmark. Next is exmaple.com itself (an unusual pattern, given there are no links on exmaple.com), with a peak of 160,000 requests on February 6, 2023. Following that is a curious spike of 10,000 requests from "reddit.com" on January 30, 2023, possibly due to a misspelling of example.com in a Reddit post that got popular.
We didn’t find a specific Reddit post from January 30 mentioning exmaple.com, but there were a few there over the years, clearly aiming to show example.com. Some of those are as recent as one year or even 10 months, like this Reddit post on the AWS subreddit, or this one from January 31, 2023, related to SEO.
On that note, regarding human misuse of misconfigurations impacting the Internet, in 2018, a member of the Cloudflare team gave a presentation about “Internet Noise” during a RIPE event that can be consulted here. It’s about unwanted traffic due to misconfigurations and misuse of proxies and internal use situations.
How about exmaple.com email trends?
Although no email address online intentionally targets exmaple.com, that address still gets some email attention. We configured a Gmail account to monitor these random emails in early 2022. Within 16 months, the 15 GB email capacity was fully used, containing 216,000 emails — an average of 432 daily emails. These emails reflect various scenarios: some are marketing-related, others appear to be network tests, and some are from individuals who, by error or to avoid spam, ended up at “@exmaple.com”. Among these use cases, we noticed accounts linked to PlayStation, Apple devices, Pandora music, Facebook, and more.
What the exmaple.com Inbox typically looks like.
Examining a 30-day span of emails (late July to late August), we noticed that certain types of emails are more common than others. This is notably seen in tests conducted by computer software applications that monitor systems, networks, and infrastructure. The main example of this is Nagios.
Since late July, nearly 83% of almost 4,000 emails were from Nagios. The sender used a “local domain” from Nagios, and the email address was “[email protected]”—where example.com was likely the intended recipient. The subjects alternated between “PROBLEM Service Alert: [Name of company] ATM/PING is WARNING” and “RECOVERY Service Alert: [Name of company]_Backup/PING is OK”, indicating service tests.
Analyzing the regions where most emails originate (based on our data centers), it's evident that North America and Southeast Asia are the primary sources, along with Europe. Regarding languages, English dominates, but some emails are in German, Spanish, Chinese, Japanese, Thai, and Russian.
Microsoft (56 emails), Apple (30), and Google (20 emails) are in the mix. Surprisingly, emails from various golf courses (31 emails from eight different golf courses) were also present, along with emails from cruise ship companies. Additionally, there are emails from well-known brands such as Call of Duty, PlayStation, HP, Uber (related to Uber Eats), McAfee, and even the U.S. Patent and Trademark Office (in newsletter subscription emails) that were observed (in this case, from the actual brands and not spam look alike). While Facebook-related emails were present in previous months, they haven't been seen recently.
Some emails clearly reveal their "fake" email intent, like “[email protected]”, sent by a virtual learning platform, likely when someone provided a randomly false email address. There are also repeated instances of people’s names like Mike or others, including surnames, before “@exmaple.com”. This suggests that people use the same fictitious email address when asked for their email by companies.
Here are some of the most creatively formed or interesting email addresses provided between July and August 2023, organized by us based on types of chosen email addresses (we included the number of emails in the most frequently used ones):
In the realm of email, DMARC (that stands for "Domain-based Message Authentication, Reporting, and Conformance") is a security protocol that helps prevent email spoofing and phishing attacks by providing a framework. It is used by email senders to authenticate their messages and receivers to verify their authenticity. DMARC is based on both SPF (verifies if an email was sent by an authorized sender) and DKIM (the receiving server will check the DKIM-Signature header), and the domains used by those two protocols. So, DMARC requires that SPF or DKIM “pass”.
The implementation of DMARC signals that an email sender is taking measures to improve email security and protect their domain's reputation. With this context, let’s delve into DMARC validation. How did these random email senders to “@exmaple.com”? Only 11% (433) of all emails (3890) from the past 30 days passed the DMARC authentication successfully, most of those were from recognized senders like Apple, Uber, or Microsoft.
This is also because a significant 83% (3252) of emails originated from what appear to be tests conducted by computer software applications that monitor systems, networks, and infrastructure — specifically, Nagios. All of these emails are categorized as "none" in terms of DMARC policies, indicating that the sender is not using a DMARC policy. This approach is frequently adopted as an initial phase to gauge the impact of DMARC policies before adopting more robust measures. Just 1% of all emails "failed" DMARC authentication, implying that these emails didn't align with the sender's designated policies.
In such instances, domain owners can instruct email providers to take actions such as quarantining the email or outright rejection, thus shielding recipients from potentially malicious messages. This was evident in domains like amazon.co.jp or sanmateo.flester.com (where "Undelivered Mail Returned to Sender" messages originated from the Mail Delivery System).
Our email perspective could have been even more comprehensive if this “@exmaple.com” email account had Cloudflare Area 1 — our cloud-native email security service that detects and thwarts attacks before they reach user inboxes. Perhaps in a future geeky venture, we will also incorporate that viewpoint, complete with percentages for spam, malicious content, and threat categories.
Where is example.com on our domain popularity ranking? What about exmaple.com?
Last but not least, we also have insight into example.com itself. Looking at our most popular domains list (using data from our 1.1.1.1 resolver), example.com or “example.org” are no strangers to our popular domains ranking. Those two are usual “guests” of our top 500 domains ranking, both worldwide and in specific countries, which also is an expression of its popularity and usage for all the use cases we already discussed. example.com usually sits higher, in the top 300. Since July, it has even appeared in our top 100 for the first time in 2023.
exmaple.com, on the other hand, is not in our top 100 list, and only appears in our top 100k top domains list. You can find our domains lists, including a top 100, and unordered CSV lists up to Top 1 million domains, on Cloudflare Radar and through our API.
Just by checking DNS data from those who use our resolver, the original example.com gets around 2.6 billion DNS queries every day. This number has been consistently increasing since 2022, more than doubling. Here's the chart to show it:
What about exmaple.com? DNS queries are significantly lower by an order of magnitude. On average, it receives around 40,000 DNS queries per day, with occasional spikes reaching 80,000 to 90,000 — there’s one 160k July 23, 2022, spike. It's also noteworthy that there are more DNS queries on weekdays and fewer on weekends, which is not the case for example.com.
Conclusion: Errare humanum est
“Some of the worst problems that happen on the Internet are not because somebody deliberately caused the problem. It’s because somebody made a mistake. We’ve lost half the networks ability to transport traffic or route it to the right destinations because somebody made a configuration mistake”. — Vint Cerf, American Internet pioneer, in a 2016’s article: Vinton G. Cerf: Human error, not hackers threaten Net.
Even if traffic to exmaple.com arrives without consequences, a typo from a technician in a device for the wrong and malicious domain, could definitely have a negative impact if protections are not put in place. The typical Internet user is also susceptible to sending emails to the wrong address due to typos or could be tricked by domains resembling popular brands, but with errors.
Stoic philosopher of Ancient Rome Lucius Seneca stated two thousand years ago, Errare humanum est or in plain English: to err is human. This held true for humans in the year AD 30 and remains so for humans in 2023. And the Internet, the complex network of networks that has grown larger than even its human inventors anticipated, is no stranger of these human errors, and its consequences. Quoting once again from Vint Cerf, “we need to have much better tools for writing software to avoid some of those stupid mistakes that cause problems in the Internet”.
After all this geeky analysis, my autocorrect finally recognizes "exmaple.com" and doesn't change it to "example.com". Success.
(Thanks to Jorge Pacheco, Sofia Cardita, Jérôme Fleury, and Marek Majkowski for their contributions to this blog post.)
Cloudflare operates in more than 300 cities in over 100 countries, where we interconnect with over 12,000 network providers in order to provide a broad range of services to millions of customers. The breadth of both our network and our customer base provides us with a unique perspective on Internet resilience, enabling us to observe the impact of Internet disruptions.
As we have noted in the past, this post is intended as a summary overview of observed disruptions, and is not an exhaustive or complete list of issues that have occurred during the quarter.
Government directed
Late spring often marks the start of a so-called “exam season” in several Middle Eastern and African countries, where students sit for a series of secondary school exams. In an attempt to prevent cheating on these exams, governments in the countries have taken to implementing wide-scale Internet shutdowns covering time periods just before and during the exams. We have covered these shutdowns in the past, including Sudan and Syria in 2021 and Syria, Sudan, and Algeria in 2022. This year, we saw governments in Iraq, Algeria, and Syria taking such actions.
Iraq
In the weeks prior to the start of this year’s shutdowns, it was reported that the Iraqi Ministry of Communications had announced it had refused a request from the Ministry of Education to impose an Internet shutdown during the exams as part of efforts to prevent cheating. Unfortunately, this refusal was short-lived, with shutdowns ultimately starting two weeks later.
In Iraq, two sets of shutdowns were observed: one impacted networks nationwide, except for the Kurdistan Region, while the other impacted networks within the Kurdistan Region. The former set of shutdowns were related to 9th and 12th grade exams, and were scheduled to occur from June 1 through July 15, between 04:00 and 08:00 local time (01:00 – 05:00 UTC). The graphs below show that during June, shutdowns took place on June 1, 4, 6, 8, 11, 13, 15, 17, 21, 22, 24, 25, and 26, resulting in significant disruptions to Internet connectivity. The shutdowns were implemented across a number of network providers, including AS203214 (HulumTele), AS59588 (Zain), AS199739 (Earthlink), AS203735 (Net Tech), AS51684 (Asiacell), and AS58322 (Halasat). The orange-highlighted areas in the graphs below show traffic on each network provider dropping to zero during the shutdowns.
As noted above, exam-related Internet shutdowns were also implemented in the Kurdistan region of Iraq. One report quoted the Minister of Education of the Kurdistan Regional Government as stating "The Internet will be turned off as needed during exams, but just like in previous years, the period of the Internet shutdown will not be lengthy, but rather short.” To that end, the observed shutdowns generally lasted about two hours, occurring between 06:30 and 08:30 local time (03:30 – 05:30 UTC) on June 3, 6, 10, 13, 17, and 24. The graphs below show the impact across three network providers in the region: AS21277 (Newroz Telecom), AS48492 (IQ Online), and AS59625 (KorekTel).
2023 marks the sixth year that Algeria has disrupted Internet connectivity to prevent cheating during nationwide exams. In 2022, we noted that “it appears that the Algerian government has shifted to a content blocking-based approach, instead of a wide-scale Internet shutdown.” It appears that the same approach was taken this year, as we again observed two nominal drops in traffic during each of the exam days, rather than a complete loss of traffic. These traffic shifts were observed on mobile network providers AS33779 (Ooredoo/Wataniya), AS327931 (Djezzy/Optimum), and AS327712 (Mobilis/Telecom Algeria). The first disruption takes place between 08:00 – 12:00 local time (07:00 – 11:00 UTC), with the second occurring between 14:00 – 17:00 local time (13:00 – 16:00 UTC).
Syria
After implementing four exam-related Internet shutdowns in 2022, this year saw just two. On June 25 and 26, Internet shutdowns took place between 05:00 – 08:30 local time (02:00 – 05:30 UTC). Syrian Telecom (AS29256), the government-affiliated telecommunications company, informed subscribers in a Facebook post that the Internet would be cut off at the request of the Ministry of Education.
Senegal
In Senegal, violent protests over the sentencing of opposition leader Ousmane Sonko to jail led the government to restrict access to platforms including WhatsApp, Facebook, Twitter, Instagram, TikTok, Telegram, Signal, and YouTube. On June 4, the Senegal Ministry of Communication issued a statement temporarily suspending mobile Internet access, with a followup statement on June 6 ending the suspension. These disruptions to mobile Internet access were visible on two network providers within the country: AS37196 (Sudatel Senegal) and AS37649 (Tigo/Free).
As shown in the graphs below, the shutdowns on Sudatel Senegal occurred from 15:00 local time on June 3 through 01:00 local time on June 5, and then again from 13:00 local time on June 5 until 01:00 local time on June 6. The three shutdowns seen on Tigo/Free took place between 15:30 – 19:00 local time on June 3, from 13:45 local time on June 4 until 02:05 local time on June 5, and from 13:05 local time on June 5 through 01:00 local time on June 6. (Senegal is UTC+0, so the local times are the same as UTC.)
Mauritania
In Mauritania, authorities cut off mobile Internet services after protests over the death of a young man in police custody. The shutdown began at 23:00 local time on May 30, and lasted six days, with connectivity returning at 23:00 local time on June 6. (Mauritania is UTC+0, so the local times are the same as UTC.) The graphs below show a near complete loss of Internet traffic during that period from AS37541 (Chinguitel) and AS37508 (Mattel), two mobile network providers within the country.
Pakistan
On May 9, Imran Khan, former Prime Minister of Pakistan was arrested on corruption charges. Following the arrest, violent protests erupted in several cities, leading the government of Pakistan to order the shutdown of mobile Internet services, as well as the blocking of several social media platforms. The figures below show the impact of the ordered shutdown to traffic on four mobile network providers within the country: AS24499 (Telenor Pakistan), AS59257 (China Mobile Pak), AS45669 (Mobilink/Jazz), and AS56167 (Ufone/PTML). The ordered shutdown caused a complete loss of Internet traffic from these networks that started at 22:00 local time (17:00 UTC) on May 9 at Telenor and China Mobile Pakistan, 18:00 local time (13:00 UTC) on Mobilink/Jazz, and 01:00 local time on May 10 (20:00 UTC on May 9) at Ufone/PTML. Traffic was restored at 22:00 local time (17:00 UTC) on May 12.
Looking at Cloudflare Radar’s recently launchedInternet Quality page for Pakistan during the duration of the shutdown, we observed that median latency within Pakistan dropped slightly after mobile networks were shut down, shown in the graph below. Prior to the shutdown, median latency (as observed to Cloudflare and a set of other providers) was in the 90-100ms range, while afterward, it averaged closer to 75ms. This may be a result of users shifting to lower latency fixed broadband connections – several fixed broadband providers in the country experienced increased traffic volumes while the mobile networks were unavailable.
Additional details about the mobile network shutdowns, content blocking, and the impact at an administrative unit and city level can be found in our May 12 blog post Cloudflare’s view of Internet disruptions in Pakistan.
India
Internet shutdowns are unfortunately frequent in India, with digital rights organization Access Now reporting at least 84 shutdowns within the country in 2022. The shutdowns are generally implemented at a more local level, and often last for a significant amount of time. One such shutdown took place in the northeastern Indian state of Manipur starting on May 3 after the escalation of ethnic conflict, and was reportedly intended to “thwart the design and activities of anti-national and anti-social elements… by stopping the spread of disinformation and false rumours'' and the likelihood of “serious disturbances to the entire peaceful coexistence of the communities and maintenance of public order”. Mobile data services were initially suspended for a five-day period, with the suspension continually extended through additional templated orders issued every five days.
The graphs below show the impact of the ordered shutdown to traffic from two major network providers in Manipur. Traffic from both AS45609 (Airtel) and AS9829 (BSNL) fell significantly around 18:00 local time (12:30 UTC) on May 4. Traffic on Airtel has remained low, and continued to drop further through the end of June. Traffic on BSNL showed slight signs of recovery starting in early June, but remains extremely low.
The shutdown order remains in place as of the time of this writing (late July).
Severe weather
Guam
On May 24, “Super Typhoon” Mawar wreaked havoc on the US territory of Guam, causing widespread physical damage after it made landfall, taking down trees, buildings, power lines, and communications infrastructure across the island. One result of this damage was a significant disruption to Internet connectivity, as shown in the country-level graph below. Restoration efforts started almost immediately, with Guam Power Authority, Docomo Pacific, and GTA Teleguam all posting regular status updates on their websites and/or social media accounts.
Among the two Internet providers, GTA Teleguam (AS9246) was largely able to complete service restoration in June, with traffic returning to pre-storm levels around June 17, as seen in the graph below. In fact, in a June 20 Facebook post they noted that “As of today, a majority of our wireless network cell sites are operational.” However, recovery at Docomo Pacific (AS3605) is taking significantly longer. The graph below shows that as of the end of June, traffic remained significantly below pre-storm levels.
Cable damage
Bolivia
On June 19, COTAS, a Bolivian telecommunications company, posted an update on their Facebook page that alerted users that a fiber optic cable had been cut in the town of Pongo. As seen in the graphs below, this cut significantly disrupted Internet connectivity across COTAS and two other network providers in the country: AS25620 (COTAS), AS27839 (Comteco), and AS52495 (Cotel) between 13:00 – 18:00 local time (17:00 – 22:00 UTC).
The Gambia
Gamtel, the state telecommunications company in The Gambia, notified subscribers via a Twitter post on June 7 of a localized fiber cut, and then of additional cable cuts on June 8. These fiber cuts disrupted Internet connectivity on AS25250 (Gamtel) between 14:00 local time on June 7 and 00:00 local time on June 9, with traffic volumes down as much as 80% as compared to the previous period. (The Gambia is UTC+0, so the local times are the same as UTC.)
Philippines
An advisory posted on Twitter by Philippines telecommunications provider PLDT at 18:43 local time (10:43 UTC) on June 5 stated “One of our submarine cable partners confirms a loss in some of its internet bandwidth capacity, and thus causing slower Internet browsing. We are working with our partners to provide alternate capacity that would restore the browsing experience in the next few hours.” The traffic graph below shows a minor disruption to Internet traffic for AS9299 (PLDT) starting around 14:00 local time (06:00 UTC), and the “slower Internet browsing” noted by PLDT is evident in the Internet quality graphs below, with increased latency and decreased bandwidth evident around that same time. PLDT stated in a subsequent tweet that as of 06:22 local time on June 6 (22:22 UTC on June 5), “Our submarine cable partner confirms supplementing additional capacity, restoring browser experience.”
Power outages
Curaçao
Aqualectra is the primary utility company in Curaçao, providing water and power services. On June 8, they posted a series of alerts to their Facebook page (1, 2, 3, 4) regarding a power outage impacting “all neighborhoods”, caused by a malfunction in one of the main power cables connected to the substation at Parera. This loss of power impacted Internet connectivity on the island, with a significant loss of traffic observed at a country level, as seen in the graph below, as well as across several Internet service providers, including AS11081 (UTS), AS52233 (Columbus Communications), and AS27660 (Curaçao Telecom). A followup Facebook post dated 01:25 local time on June 9 (05:25 UTC) confirmed the restoration of power to all neighborhoods.
Portugal
A power outage at an Equinix data center in Prior Velho (near Lisbon) on the afternoon of June 6 affected local utilities, banking services, and court networks, according to published reports (1, 2). Portuguese Internet service provider MEO was also impacted by the power outage, which caused a drop in traffic for AS3243 (MEO-RESIDENCIAL) and AS15525 (MEO-EMPRESAS), seen in the graphs below. The disruptions caused by the power outage also impacted connectivity quality within Portugal, as the Radar Internet quality graphs below highlight – a concurrent drop in bandwidth and increase in latency is visible, indicating that end users likely experienced poorer performance during that period of time.
Botswana
A countrywide power outage in Botswana on May 19 caused an Internet disruption that lasted about 90 minutes, from 10:45 until 12:15 local time (08:45 – 10:15 UTC), visible in the graph below. A tweet from Botswana Power Corporation provided public notice of the incident, but did not include a root cause.
Barbados
On April 4, The Barbados Light & Power Company tweeted an “Outage Notice”, stating “We are aware that our customers across the island are currently without electricity.” Posted at 11:46 local time (15:46 UTC), the notice comes shortly after a significant drop in traffic was observed country-wide, indicating that the power outage also impacted Internet connectivity across the country. After posting several additional updates throughout the day, a final update posted at 18:00 local time (22:00 UTC) indicated that power had been restored to 100% of impacted customers. The graph below shows that traffic took several additional hours to return to normal levels. (Note that the orange highlighting in the graph represents the duration of the disruption, and the red shading is related to an internal data collection issue.)
Technical problems
Namibia
A seven-hour Internet disruption observed in Namibia on June 15 and 16 was caused by unspecified “technical challenges” faced by Telecom Namibia. According to a tweet from the provider, “Telecom Namibia experienced technical challenges on its fixed and mobile data services on Thursday leading to intermittent Internet connectivity.” The impact of these challenges is visible in both the country- and network-level traffic graphs below.
Solomon Islands
Unspecified “technical reasons” also disrupted mobile Internet connectivity for Our Telekom customers in the Solomon Islands on April 26 and 27. An April 26 Facebook post from Our Telekom simply stated “Our mobile data network is currently down due to technical reasons.” The graphs below show a significant drop in traffic for AS45891 (Our Telekom/SBT) between 06:30 local time on April 27 (19:30 UTC on April 26) and 17:00 local time on April 27 (06:00 UTC). The loss of mobile traffic from Our Telekom also impacted traffic at a country level, as the graph shows a similar disruption for the Solomon Islands.
SpaceX Starlink
With an increasingly global service footprint, disruptions observed on SpaceX Starlink potentially impact users across multiple countries around the world. Just before midnight UTC on April 7, Internet traffic seen from AS14593 (SpaceX-Starlink) began to decline significantly. The disruption was short-lived, with traffic returning to expected levels within two hours. According to a Twitter post from Elon Musk, CEO of SpaceX, the problem was “Caused by expired ground station cert” (an expired digital certificate associated with one or more Starlink ground stations, likely preventing communication between the satellite constellation and the ground station(s)).
Madagascar
In Madagascar, a “problem with the backbone”, reported by Telma Madagascar, caused a loss of as much as two-thirds of Internet traffic between 09:15 – 14:00 local time (06:15 – 11:00 UTC) on April 7. The graphs below show that the backbone issue disrupted traffic at a national level, as well as for AS37054 (Telma Madagascar).
United Kingdom
On April 4, UK Internet provider Virgin Media suffered multiple service disruptions that impacted Internet connectivity for broadband customers. The first outage started just before 01:00 local time (midnight UTC)l, lasting until approximately 09:00 local time (08:00 UTC). The second outage started around 16:00 local time (15:00 UTC), with traffic volumes going up and down over the next several hours before appearing to stabilize around 21:30 local time (20:30 UTC).
Virgin Media’s Twitter account acknowledged the early morning disruption several hours after it began, posting “We’re aware of an issue that is affecting broadband services for Virgin Media customers as well as our contact centres. Our teams are currently working to identify and fix the problem as quickly as possible and we apologise to those customers affected.” A subsequent post after service restoration noted “We’ve restored broadband services for customers but are closely monitoring the situation as our engineers continue to investigate. We apologise for any inconvenience caused.”
However, the second disruption was acknowledged on Virgin Media’s Twitter account much more rapidly, with a post at 16:25 UTC stating “Unfortunately we have seen a repeat of an earlier issue which is causing intermittent broadband connectivity problems for some Virgin Media customers. We apologise again to those impacted, our teams are continuing to work flat out to find the root cause of the problem and fix it.”
Although no additional details have been shared via social media by Virgin Media about the outages or their resolution, some additional information was shared via Twitter by an apparent customer, who posted “Virgin Media engineers re-seated fibre cards and reset hub equipment to restore service. TTL was extended as a workaround to maintain stability whilst a permanent fix is implemented.”
A little more than a year later, on May 26, we observed an Internet outage at Miranda Media. Traffic started to fall around 16:30 local time (13:30 UTC), dropping to zero around 18:15 local time (15:15 UTC). The outage disrupted connectivity on the Crimean Peninsula and parts of occupied Ukraine and lasted until approximately 06:00 local time on May 27 (03:00 UTC). Published reports (1,2) suggest that the outage was due to a cyberattack targeting Miranda Media, reportedly carried out by Ukrainian hacktivists.
Russia
Russian satellite provider Dozor Teleport, whose customers include Russia’s Ministry of Defense, ships of the Northern Fleet, Russian energy firm Gazprom, remote oil fields, the Bilibino nuclear power plant, the Federal Security Service (FSB), Rosatom, and other organizations, experienced a multi-hour outage on June 29. The outage, which occurred between 01:30 – 17:30 UTC, was reportedly the result of a cyberattack that at least two groups claimed responsibility for.
Military action
Chad
Multiple Internet disruptions occurred in Chad on April 23 and 24, impacting several Internet providers, and were ultimately visible at a country level as well. As seen in the graphs below, the outages occurred from 04:30 – 06:00 local time (03:30 – 05:00 UTC) and 15:00 – 20:00 local time (14:00 – 19:00 UTC) on April 23, and 04:00 – 08:30 local time (03:00 – 07:30 UTC) on April 24. The impacted network providers in Chad included AS327802 (Millicom Chad), AS327756 (Airtel Chad), AS328594 (Sudat Chad), and AS327975 (ILNET-TELECOM). The outages were reportedly caused by damage to fiber infrastructure that links Chad with neighboring Cameroon and Sudan, with the latter experiencing Internet service disruptions amid clashes between the Sudanese Armed Forces (SAF) and Rapid Support Forces (RSF).
Sudan
As noted above, military action in Sudan disrupted Internet connectivity in Chad in April. Starting in mid-April, multiple Internet outages were observed at major Sudanese Internet providers, three of which are shown in the graphs below. The fighting in the country has led to fuel shortages and power cuts, ultimately disrupting Internet connectivity.
AS15706 (Sudatel) experienced complete Internet outages from 03:00 on April 23 to 17:00 on April 24 local time (01:00 on April 23 to 15:00 on April 24 UTC) and again from 03:00 on April 25 until 01:00 on April 28 local time (01:00 on April 25 to 23:00 on April 27 UTC). Internet connectivity on AS36972 (MTN) was disrupted between 03:00 and 12:00 local time on April 16 (01:00 – 10:00 UTC) and again between 20:00 on April 27 until 02:00 on April 29 (18:00 on April 27 to 00:00 on April 29). After a nominal multi-day recovery, a long-term near complete outage started on May 5, lasting for multiple weeks. Similar to MTN, multiple extended outages were also observed on AS33788 (Kanar Telecommunication). After seeing a significant drop in traffic midday on April 19, a near complete outage is visible between 12:00 on April 21 and 01:00 on April 29 (10:00 on April 21 to 23:00 on April 28 UTC), with a very brief minor recovery late in the day on April 24. A longer duration outage began around 00:00 local time on May 11 (22:00 on May 10 UTC), also lasting for multiple weeks.
Togo, Republic of Congo (Brazzaville), Burkina Faso
Repair work on the West Africa Cable System (WACS) submarine cable disrupted Internet connectivity across multiple countries, including Togo, Republic of Congo (Brazzaville), and Burkina Faso on April 6. According to the Google translation of a Facebook post from Canalbox Congo, the repair work was likely to cause “very strong disruptions on Internet connections with the risk of a total outage”. (Canalbox (GVA) is an African telecommunications operator that provides services across multiple countries in Africa.)
The graph below for AS36924 (GVA-Canalbox) shows three overlapping outage annotations, with each related to a disruption observed on that autonomous system (network) in one of the impacted countries. In the Republic of Congo (Brazzaville), a significant traffic disruption is visible between 16:15 – 23:15 local time (15:15 – 22:15 UTC). In Burkina Faso, the disruption happened earlier and was less severe, taking place between 09:15 – 18:00 local time (09:15 – 18:00 UTC), with a similar impact in Togo, where traffic was disrupted between 11:00 – 23:15 local time (11:00 – 23:15 UTC).
Conclusion
Because of how tightly interwoven the Internet has become with commerce, financial services, and everyday life around the world, any disruption to Internet connectivity ultimately carries an economic impact. The providers impacted by disruptions caused by unexpected or unavoidable events such as cable cuts or severe weather generally try to minimize the scope and duration of such disruptions, ultimately limiting the economic impact. However, in the case of government-directed Internet shutdowns, the damage to the economy is ultimately self-inflicted. The Internet Society’s new Net Loss Calculator now provides a way to quantify this damage, enabling the public, advocacy groups, and governments themselves to understand the potential cost of an Internet shutdown from gross domestic product (GDP), foreign direct investment (FDI), and unemployment perspectives.
On Tuesday, May 9, Imran Khan, former Prime Minister of Pakistan was arrested on corruption charges. Following the arrest, violent protests erupted in several cities, leading the government of Pakistan to order the shutdown of mobile Internet services, as well as the blocking of several social media platforms. Below, we examine the impact of these shutdowns at a national and local level, as seen through Cloudflare traffic data. In addition, we illustrate how Pakistanis appear to be turning to Cloudflare’s 1.1.1.1 resolver in an attempt to maintain access to the open Internet.
General traffic trends
Since Tuesday, May 9, peak traffic levels aggregated at a country level (as measured by HTTP request volume) have been declining, down nearly 30% during the first several days of the mobile Internet shutdowns. The lowest traffic levels (nadirs of the graph) have also declined, dropping by as much as one-third as well. In the sections below, we drill down into this traffic loss, looking at outages at a network level, and the impact of those outages at an administrative unit and city level.
The mobile network shutdowns have also impacted the profile of traffic that Cloudflare sees from Pakistan. In analyzing traffic from desktop devices vs. mobile devices, we observed a 60% drop in request volume from mobile devices, while desktop traffic request volume remained fairly consistent. Peak mobile device traffic share dropped from 70% to 43%.
Cloudflare uses a bot score assigned to each request to indicate how likely it is that the request came from a bot or a human user. Since these shutdowns began, peak human request volume has dropped by 40%, while bot traffic has remained relatively consistent.
Mobile network shutdowns
On Wednesday, May 10, the Pakistan Telecommunication Authority (PTA) announced that Internet services would remain suspended across the country for an “indefinite” period, responding to a directive from the Ministry of the Interior to block mobile broadband services. As a result of the shutdowns associated with this directive, Cloudflare observed outages on the four major mobile providers within the country:
Although Pakistan has high mobile Internet usage, it appears that fixed broadband Internet connections are readily used as a backup when mobile connectivity becomes unavailable. Autonomous systems associated with fixed broadband networks saw significant increases in traffic when the mobile networks were shut down.
Interestingly, median latency within Pakistan also dropped slightly after mobile networks were shut down. Prior to the shutdown, median latency (as observed to Cloudflare and a set of other providers) was in the 90-100ms range, while afterwards, it has averaged closer to 75ms. This may be a result of users shifting to lower latency fixed broadband connections, as discussed above.
Administrative unit-level disruptions
Because the mobile network providers that were affected by the shutdown directive provide services nationwide, we also observed an impact to traffic across multiple administrative units within the country. None of these locations has experienced a complete outage, but peak traffic levels have clearly been declining in comparison to previous days.
Gilgit-Baltistan experienced the largest loss, where peak traffic has fallen nearly 60%. In Sindh, peak traffic is down around 35%, followed by Khyber Pakhtunkhwa, where it is down 30%. Islamabad and Azad Jammu and Kashmir have seen peak traffic declines of ~20%.
City-level disruptions
The impact of the mobile network shutdowns is also visible at a more local level, with lower peak traffic levels clearly visible in four cities. The significant traffic loss has been in Peshawar (Khyber Pakhtunkhwa), which has dropped nearly 55% from prior days. Faisalabad (Punjab), Karachi (Sindh), and Multan (Punjab) have all seen peak traffic drop approximately 40%.
Content blocking
In addition to the government-directed mobile network shutdowns, Pakistan’s authorities have also ordered Internet service providers to block access to social media platforms including Facebook, Instagram, YouTube, and Twitter. Testing by the Open Observatory for Network Interference (OONI), an Internet censorship measurement organization, suggests that this blocking is using a combination of TLS-level interference and DNS-based blocking. When the latter occurs in a country, Cloudflare’s 1.1.1.1 DNS resolver often sees an increase in request volume from the country as users seek ways to continue to access the open Internet.
Over the last several days, as expected, 1.1.1.1 request volume from Pakistan has increased, up approximately 40%. Peak request volume for the blocked social media platforms has also increased. Traffic for facebook.com saw a significant increase starting around 14:00 UTC (19:00 local time) on May 9, with peak request volume more than doubling. Request volume for instagram.com, also owned by Facebook parent Meta, also began to increase around the same time, and has grown nearly 50%. Requests for twitter.com began to spike around 08:00 UTC (13:00 local time) on May 9, growing as much as 150% that afternoon. Request volume for youtube.com also spiked on May 9, increasing by approximately 40%. And like twitter.com, request volume on May 10 was higher than earlier in the week, but lower than the spike seen the previous day.
Conclusion
Because of the ubiquity of Internet connectivity and social media tools in everyday life, Internet shutdowns and website blocking ultimately come with a significant human and financial cost. The mobile network shutdowns in Pakistan have impacted tens of thousands of “gig workers” and freelancers that depend on mobile connectivity. Many point-of-sale terminals in the country also depend on mobile connectivity, with transactions through Pakistan’s main digital payment systems fell by around 50% after the shutdowns were put into place. Telecommunications operators within Pakistan have estimated the extent of the financial damage thus far to be Rs. 820 million (approximately $2.8 million USD).
Use Cloudflare Radar to monitor the impact of such government-directed Internet disruptions, and follow @CloudflareRadar on Twitter for updates on Internet disruptions as they occur.
When major events in a country happen Internet traffic patterns are often impacted, depending on the type of event. But what about the coronation of a king or queen? There’s no similar precedent, with a worldwide impact, in the Internet age, except maybe the coronation of the king of Thailand, in 2019. The last time it happened in the United Kingdom was 70 years ago (June 2, 1953), with Queen Elizabeth II; it was the first British coronation to be fully televised. Neither the Internet nor ARPANET were around at the time.
Imagine a grand royal event (if you saw the broadcast or the news, there’s no need), filled with pomp and pageantry, that's so captivating it impacts Internet traffic. That's what happened during the coronation of Charles III and Camilla, the newly crowned king and queen of the United Kingdom and other Commonwealth realms. As the coronation ceremony unfolded, on Saturday morning, May 6, 2023, there were clear spikes and dips in traffic, each coinciding with key moments of the ceremony.
Then came Sunday, and with it, the Coronation Big Lunch event. As the nation sat down to enjoy a communal meal throughout the country, Internet traffic took a significant nosedive, dropping by as much as 18%. The Sunday trends didn't stop there. As night fell and Prince William took to the stage to deliver a speech during the Coronation Concert, there was a clear drop in Internet traffic. Monday, May 8, was a bank holiday in the UK in honor of the coronation, and after a weekend of outdoor coronation events, Internet traffic was buzzing, noticeably higher than usual.
In the past, we’ve seen Internet traffic drop when a national televised event is happening — last year, we saw it, including in the UK, during the Eurovision, although traffic does increase when results are in. Different types of events and broadcasts yield different Internet patterns.
Coronation day: a rollercoaster of Internet traffic
Let's take a closer look at coronation day, May 6, 2023, when Internet traffic in the UK had its own peaks and valleys. There were moments when the digital realm seemed to hold its breath, with traffic dipping to its lowest points. The arrival of the royals and their guests marked one such moment. As the anticipation built and all eyes turned to the grand entrances, Internet traffic dipped to a notable 7% lower than the previous week.
Here's a play-by-play of the day's traffic trends, compared to the previous week. We’re using a 15-minute granularity, and aligning with key events as reported live by the BBC:
When the royals and guests were arriving at Westminster Abbey. The King and Queen arrived at 11:00.
#2 — 12:00 (-2%)
When King Charles III (12:02) was crowned.
#3 — 13:00 (-3%)
When King Charles and Queen Camilla left Westminster Abbey. The Coronation Procession started.
On Saturday, May 6, 2023, a downward trend in traffic began after 06:15, with traffic 5% lower than the previous week. This trend shifted to a traffic increase after 11:15 (+6%), coinciding with the ongoing ceremony. The exceptions were the previously mentioned traffic dips. The following table illustrates clear traffic spikes after significant moments, some of which are represented in the previous table. Here's a list of periods with higher growth:
This happened after the military flypast (14:35), when the royals were on the balcony of Buckingham Palace.
#2 — 12:30 (+13.7%)
After King Charles III was crowned at 12:02 (at which time traffic dropped 2%) and after Queen Camilla (12:16) was crowned, when a choir was singing Agnus Dei (12:30).
#3 — 15:30-16:15 (+13%)
During the highlights of the event and reactions from royal fans.
#4 — 14:00 (+13%).
When the UK’s national anthem was played in the gardens of Buckingham Palace.
#5 — 11:30 (+11%).
Just after the coronation oath and during the choir’s singing.
As guests and royals arrived and during moments like the king's crowning, Internet traffic noticeably dropped. However, during parts of the ceremony such as the choir singing, Internet traffic seemed to increase. That was also clear after the military flypast, over the Buckingham Palace balcony.
The following chart illustrates UK Internet traffic during the weekend, with the purple dotted line representing the previous weekend.
On a daily basis, daily traffic was 4% higher on Saturday, May 6, compared to the previous Saturday.
The Big Lunch and Prince William’s speech
Another trend from the coronation weekend relates to the events that took place on Sunday, May 7. Internet trends here align with what we observed almost a year ago during Queen Elizabeth II's Platinum Jubilee. Sunday was a day of celebration with both the Coronation Big Lunch (where neighbors and communities were invited to share food and fun together across the country) and the Coronation Concert taking place.
Next, we present the percentages of increase/decrease in requests during this past weekend, compared with the previous week (a slightly different perspective from the previous chart):
On Sunday, May 7, it's clear that UK traffic was lower than usual right after 07:00 local time (-2% in traffic), but it dropped the most after 12:00 (-5%), compared to the previous week. The moment with the biggest drop in traffic, compared to the previous week, was between 14:15 and 15:30, when traffic was around 18% lower. That was still Big Lunch time, given that it’s a multiple hour event full of “food and fun” — there were more than 65,000 Coronation Big Lunch events around the UK. During last year's Queen Elizabeth II's Platinum Jubilee, traffic dropped as much as 25% on Sunday, June 5, 2022, at 15:00.
At night, the Coronation Concert took center stage, broadcast live from Windsor Castle on the BBC after 20:00. The lineup included musical guests such as Take That, Lionel Richie, Katy Perry, and Andrea Bocelli. However, the star of the event, at least in terms of when Internet traffic was at its lowest that evening, was William, Prince of Wales. Cloudflare observed another significant drop in traffic, compared to the previous week, around 21:15-21:30, when traffic was 7% lower than the previous week. At that time, Lionel Richie had just performed, and Prince William was on stage for a special address to the king.
In terms of daily traffic, if on Coronation Saturday we saw an increase (4%), on Coronation Sunday there was a 6% drop compared to the previous week. On Monday, the coronation bank holiday, there weren't any major coronation events, and traffic was 4% higher than the previous week (May 1, also a bank holiday in the UK).
Coronation, a mobile devices day
Zooming in on the distribution of traffic from mobile devices, we find that Saturday, May 6, stands out in 2023. On this day, mobile traffic accounted for 61% of total traffic, a figure only matched by April 15 and January 1, 2023. Similarly, Sunday, May 7, was one of the Sundays with the highest percentage of mobile traffic, at 60%. This percentage was only surpassed by Easter Sunday, April 9 (60.4%), and, unsurprisingly, January 1, 2023 (61%).
Wales sees the largest Sunday drop in Internet traffic
Which UK countries were more impacted? Looking at both coronation weekend days, we saw a similar pattern (growth in traffic at around the time of the coronation ceremony on Saturday, and decrease on Sunday) in all of them. Looking at the Sunday drop, England had as much as 16% in traffic at 15:30; Scotland had as much as a 17% drop at around 13:30; Wales had as much as a 19% drop at around 15:00; and Northern Ireland had as much as an 18% drop in traffic, compared to the previous week, at the same time. Wales had the biggest drop.
From Canada to Australia
Last year, in early June, we observed the impact of Queen Elizabeth II’s Platinum Jubilee on the Internet in the UK. This event, which celebrated the first British monarch to reach a 70th anniversary on the throne, caused a significant drop in traffic, as much as 25% (on Sunday, June 5, 2022). This trend was also noticeable in other Commonwealth countries.
Several Commonwealth countries also held notable events to celebrate both the Queen’s Platinum Jubilee and the recent coronation. In Canada, events and activities related to the coronation mirrored those for the Queen’s Platinum Jubilee. Whether related or not, we observed on Saturday, May 6, as much as an ~8% drop in Internet traffic compared to the previous week, between 09:30 and 16:30 Toronto time. On Sunday, the drop was even larger, with about 10% less traffic between 10:30 and 12:00.
In Australia, the difference in traffic wasn't as pronounced as in Canada. However, traffic was 7% lower than the previous week at 20:00 Sydney time (10:00 UTC), when the coronation ceremony began on May 6. This was the only period over the past weekend when traffic was lower than the previous one.
Social media and royals trends
And what about the impact on DNS traffic to our 1.1.1.1 resolver from UK users? Social media apps certainly felt the ripple. Domains linked to social media platforms, which typically surge in popularity during major events, such as Twitter, experienced a notable uptick. We saw a 33% increase in DNS traffic in those around 14:00 local time on Saturday, May 6, compared to the previous week. By 18:00 on May 7, traffic had soared to 64% higher, and it remained elevated during the Coronation Concert: at 22:00, it was 36% higher.
Meanwhile, video-centric social media platforms, like TikTok, hit their peak at around 20:00 on May 7, when the Coronation Concert was starting, with a whopping 57% surge in DNS traffic.
During the coronation weekend, the peak period for DNS traffic to domains related to the royal family fell between 11:00 and 12:00 local time. In this hour, traffic was an impressive forty times higher than the same time the previous weekend (that growth is higher, more than 40x, when using a May 2022 baseline, as is seen in the next chart).
If we broaden our view to the past 12 months, we see that the domains associated with the royal family hit their highest point on the day Queen Elizabeth II passed away, September 8. Around 18:00 local time, DNS traffic was 12x higher than the previous week. This was followed by the day of Her Majesty's funeral, September 19, when around 11:00, DNS traffic was 6x higher than usual.
A similar impact was seen, related to the Queen's death, on British news organizations, in the past 12 months. September 8, around 18:00, was the peak of the whole year in terms of DNS traffic to news organizations, according to our data. At that time, DNS traffic was 263% higher than at the same time in the previous week. During the September 19 funeral, at 11:00, DNS traffic was 24% higher than before.
During the recent coronation weekend, DNS traffic to UK news organizations on Saturday, May 6, was higher than usual during the morning by as much as 47%, at 11:00, and continued higher than before mostly during that day.
September 8, 2022: The end of a 70-year reign
We already mentioned domain trends related to when Queen Elizabeth II passed away on September 8, 2022. But what about the impact on Internet traffic? We saw a 7% decrease in Internet traffic in the UK on that day at around 18:30 local time compared to the previous week, coinciding with the announcement of her death.
The following weekend, on Saturday, September 10, 2022, traffic was as much as 17% lower at 15:00. This was the day Charles was proclaimed the new king and people flocked to the royal palaces to pay their respects — Prince William and Kate, and Prince Harry and Meghan, paused outside Windsor Castle to read messages left by mourners.
Internet traffic dropped even further compared to the previous week during Queen Elizabeth II’s funeral: on September 19, 2022, traffic was 27% lower at 10:45. According to Wikipedia, this was when the Queen's coffin was transported from Westminster Hall to Westminster Abbey on the State Gun Carriage of the Royal Navy.
Old traditions in a recent medium
In this blog post, we've seen how a very old tradition, like the British coronation, can impact a very recent innovation, the Internet. Almost 70 years ago, Queen Elizabeth II's coronation was the first ever to be televised, at a time when television in the UK was less than 20 years old. The event, which took place at Westminster Abbey in London (the site of coronations since 1066), was watched by 27 million people in the UK alone and millions more around the world.
This time around, King Charles III's coronation could be viewed through that now old medium called television, or online, via streaming services. The Internet is much younger than Britain’s former monarch's reign or even Sir Tim Berners-Lee (born in 1955), and it was only 30 years ago that the World Wide Web protocol and code were made available royalty-free, enabling the web's widespread use.
Streaming media events online, on the other hand, at least on a large scale, are a more recent development — YouTube was launched in 2005. Looking at video platforms trends in the UK, we could see how DNS traffic was 13% higher at around 12:00, during the coronation ceremony, on May 6 — it was broadcast on YouTube.
British broadcasters, such as the BBC, also included a streaming version of the event. There, the increase in DNS traffic was even higher. Between 11:00 and 12:00, on May 6, DNS traffic was 197% higher than in the previous week.
The difference in DNS traffic to UK's streaming services was even more pronounced when Queen Elizabeth II passed away on September 8, with a 470% increase in DNS traffic around 18:00 compared to the previous week. During the Queen's funeral on September 19, DNS traffic was 150% higher around 11:00 compared to the previous week.
To provide the best experiences, we use technologies like cookies to store and/or access device information. Consenting to these technologies will allow us to process data such as browsing behavior or unique IDs on this site. Not consenting or withdrawing consent, may adversely affect certain features and functions.
Functional
Always active
The technical storage or access is strictly necessary for the legitimate purpose of enabling the use of a specific service explicitly requested by the subscriber or user, or for the sole purpose of carrying out the transmission of a communication over an electronic communications network.
Preferences
The technical storage or access is necessary for the legitimate purpose of storing preferences that are not requested by the subscriber or user.
Statistics
The technical storage or access that is used exclusively for statistical purposes.The technical storage or access that is used exclusively for anonymous statistical purposes. Without a subpoena, voluntary compliance on the part of your Internet Service Provider, or additional records from a third party, information stored or retrieved for this purpose alone cannot usually be used to identify you.
Marketing
The technical storage or access is required to create user profiles to send advertising, or to track the user on a website or across several websites for similar marketing purposes.