Tag Archives: Performance

Improving customer experience and reducing cost with CodeGuru Profiler

Post Syndicated from Rajesh original https://aws.amazon.com/blogs/devops/improving-customer-experience-and-reducing-cost-with-codeguru-profiler/

Amazon CodeGuru is a set of developer tools powered by machine learning that provides intelligent recommendations for improving code quality and identifying an application’s most expensive lines of code. Amazon CodeGuru Profiler allows you to profile your applications in a low impact, always on manner. It helps you improve your application’s performance, reduce cost and diagnose application issues through rich data visualization and proactive recommendations. CodeGuru Profiler has been a very successful and widely used service within Amazon, before it was offered as a public service. This post discusses a few ways in which internal Amazon teams have used and benefited from continuous profiling of their production applications. These uses cases can provide you with better insights on how to reap similar benefits for your applications using CodeGuru Profiler.

Inside Amazon, over 100,000 applications currently use CodeGuru Profiler across various environments globally. Over the last few years, CodeGuru Profiler has served as an indispensable tool for resolving issues in the following three categories:

  1. Performance bottlenecks, high latency and CPU utilization
  2. Cost and Infrastructure utilization
  3. Diagnosis of an application impacting event

API latency improvement for CodeGuru Profiler

What could be a better example than CodeGuru Profiler using itself to improve its own performance?
CodeGuru Profiler offers an API called BatchGetFrameMetricData, which allows you to fetch time series data for a set of frames or methods. We noticed that the 99th percentile latency (i.e. the slowest 1 percent of requests over a 5 minute period) metric for this API was approximately 5 seconds, higher than what we wanted for our customers.

Solution

CodeGuru Profiler is built on a micro service architecture, with the BatchGetFrameMetricData API implemented as set of AWS Lambda functions. It also leverages other AWS services such as Amazon DynamoDB to store data and Amazon CloudWatch to record performance metrics.

When investigating the latency issue, the team found that the 5-second latency spikes were happening during certain time intervals rather than continuously, which made it difficult to easily reproduce and determine the root cause of the issue in pre-production environment. The new Lambda profiling feature in CodeGuru came in handy, and so the team decided to enable profiling for all its Lambda functions. The low impact, continuous profiling capability of CodeGuru Profiler allowed the team to capture comprehensive profiles over a period of time, including when the latency spikes occurred, enabling the team to better understand the issue.
After capturing the profiles, the team went through the flame graphs of one of the Lambda functions (TimeSeriesMetricsGeneratorLambda) and learned that all of its CPU time was spent by the thread responsible to publish metrics to CloudWatch. The following screenshot shows a flame graph during one of these spikes.

TimeSeriesMetricsGeneratorLambda taking 100% CPU

As seen, there is a single call stack visible in the above flame graph, indicating all the CPU time was taken by the thread invoking above code. This helped the team immediately understand what was happening. Above code was related to the thread responsible for publishing the CloudWatch metrics. This thread was publishing these metrics in a synchronized block and as this thread took most of the CPU, it caused all other threads to wait and the latency to spike. To fix the issue, the team simply changed the TimeSeriesMetricsGeneratorLambda Lambda code, to publish CloudWatch metrics at the end of the function, which eliminated contention of this thread with all other threads.

Improvement

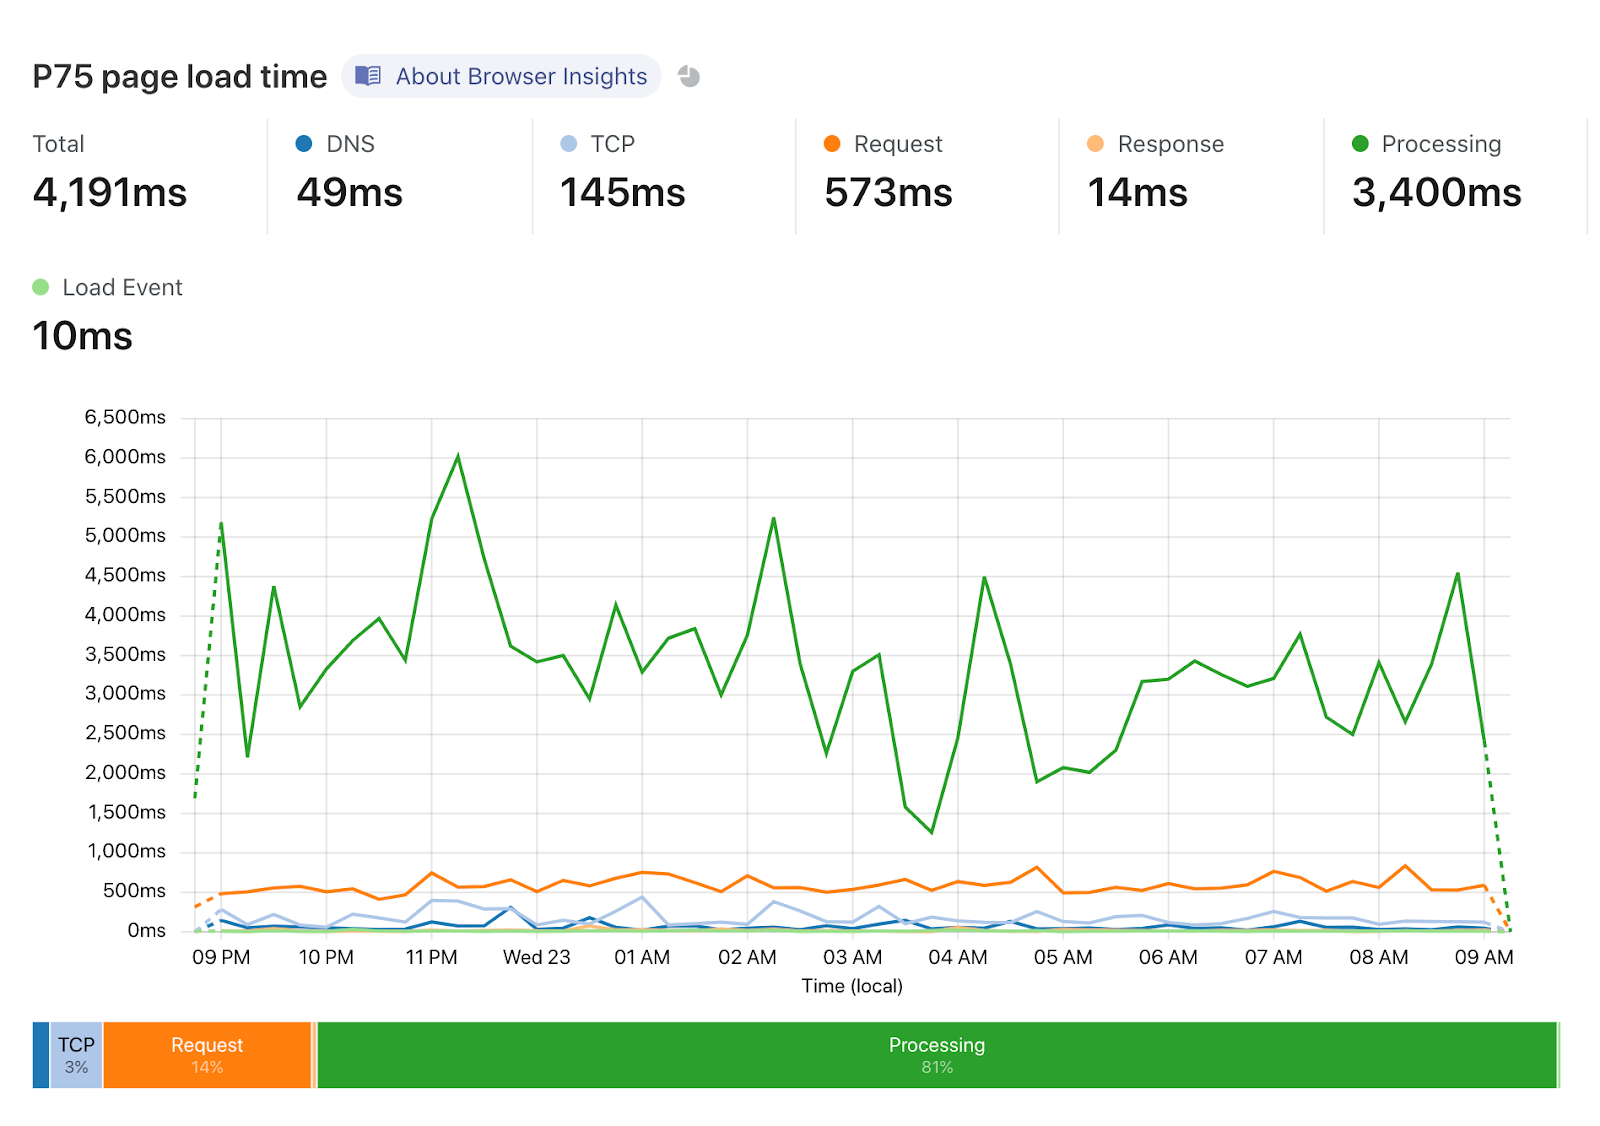
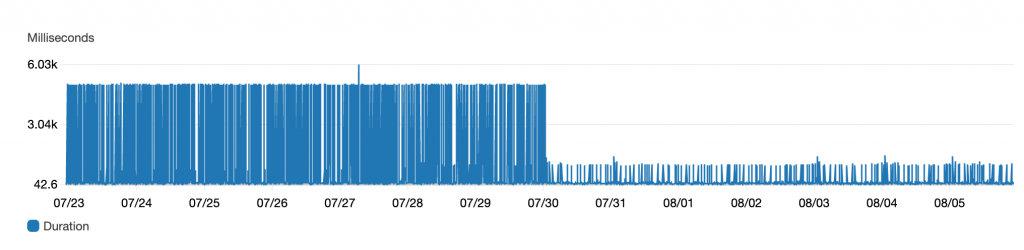
After the fix was deployed, the 5 second latency spikes were gone, as seen in the following graph.

Latency reduction for BatchGetFrameMetricData API

Cost, infrastructure and other improvements for CAGE

CAGE is an internal Amazon retail service that does royalty aggregation for digital products, such as Kindle eBooks, MP3 songs and albums and more. Like many other Amazon services, CAGE is also customer of CodeGuru Profiler.

CAGE was experiencing latency delays and growing infrastructure cost, and wanted to reduce them. Thanks to CodeGuru Profiler’s always-on profiling capabilities, rich visualization and recommendations, the team was able to successfully diagnose the issues, determine the root cause and fix them.

Solution

With the help of CodeGuru Profiler, the CAGE team identified several reasons for their degraded service performance and increased hardware utilization:

  • Excessive garbage collection activity – The team reviewed the service flame graphs (see the following screenshot) and identified that a lot of CPU time was spent getting garbage collection activities, 65.07% of the total service CPU.

Excessive garbage collection activities for CAGE

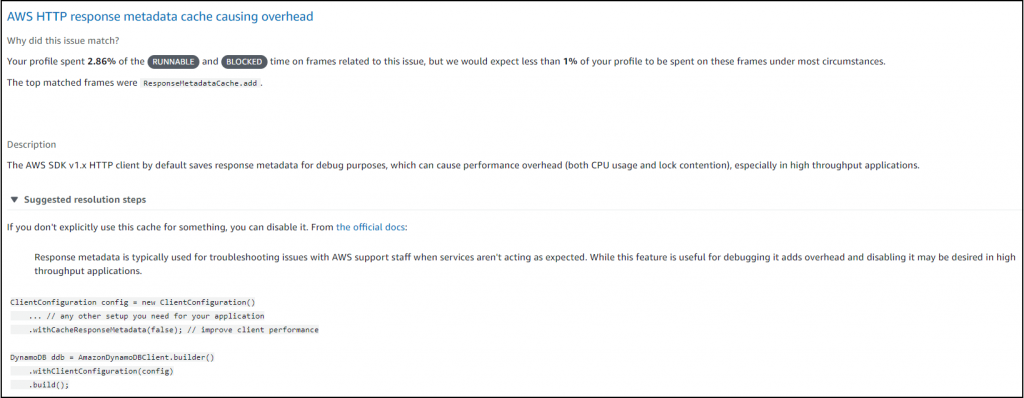
  • Metadata overhead – The team followed CodeGuru Profiler recommendation to identify that the service’s DynamoDB responses were consuming higher CPU, 2.86% of total CPU time. This was due to the response metadata caching in the AWS SDK v1.x HTTP client that was turned on by default. This was causing higher CPU overhead for high throughput applications such as CAGE. The following screenshot shows the relevant recommendation.

Response metadata recommendation for CAGE

  • Excessive logging – The team also identified excessive logging of its internal Amazon ION structures. The team initially added this logging for debugging purposes, but was unaware of its impact on the CPU cost, taking 2.28% of the overall service CPU. The following screenshot is part of the flame graph that helped identify the logging impact.

Excessive logging in CAGE service

The team used these flame graphs and CodeGuru Profiler provided recommendations to determine the root cause of the issues and systematically resolve them by doing the following:

  • Switching to a more efficient garbage collector
  • Removing excessive logging
  • Disabling metadata caching for Dynamo DB response

Improvements

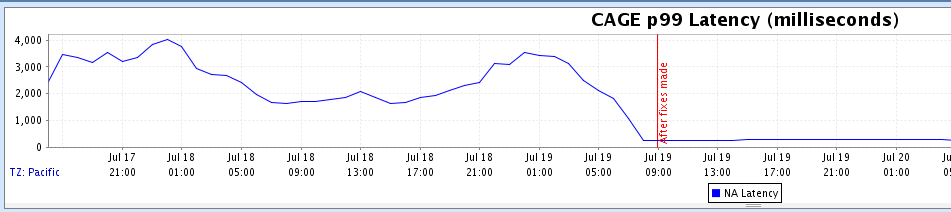
After making these changes, the team was able to reduce their infrastructure cost by 25%, saving close to $2600 per month. Service latency also improved, with a reduction in service’s 99th percentile latency from approximately 2,500 milliseconds to 250 milliseconds in their North America (NA) region as shown below.

CAGE Latency Reduction

The team also realized a side benefit of having reduced log verbosity and saw a reduction in log size by 55%.

Event Analysis of increased checkout latency for Amazon.com

During one of the high traffic times, Amazon retail customers experienced higher than normal latency on their checkout page. The issue was due to one of the downstream service’s API experiencing high latency and CPU utilization. While the team quickly mitigated the issue by increasing the service’s servers, the always-on CodeGuru Profiler came to the rescue to help diagnose and fix the issue permanently.

Solution

The team analyzed the flame graphs from CodeGuru Profiler at the time of the event and noticed excessive CPU consumption (69.47%) when logging exceptions using Log4j2. See the following screenshot taken from an earlier version of CodeGuru Profiler user interface.

Excessive CPU consumption when logging exceptions using Log4j2

With CodeGuru Profiler flame graph and other metrics, the team quickly confirmed that the issue was due to excessive exception logging using Log4j2. This downstream service had recently upgraded to Log4j2 version 2.8, in which exception logging could be expensive, due to the way Log4j2 handles class-loading of certain stack frames. Log4j 2.x versions enabled class loading by default, which was disabled in 1.x versions, causing the increased latency and CPU utilization. The team was not able to detect this issue in pre-production environment, as the impact was observable only in high traffic situations.

Improvement

After they understood the issue, the team successfully rolled out the fix, removing the unnecessary exception trace logging to fix the issue. Such performance issues and many others are proactively offered as CodeGuru Profiler recommendations, to ensure you can proactively learn about such issues with your applications and quickly resolve them.

Conclusion

I hope this post provided a glimpse into various ways CodeGuru Profiler can benefit your business and applications. To get started using CodeGuru Profiler, see Setting up CodeGuru Profiler.
For more information about CodeGuru Profiler, see the following:

Investigating performance issues with Amazon CodeGuru Profiler

Optimizing application performance with Amazon CodeGuru Profiler

Find Your Application’s Most Expensive Lines of Code and Improve Code Quality with Amazon CodeGuru


Speeding up HTTPS and HTTP/3 negotiation with… DNS

Post Syndicated from Alessandro Ghedini original https://blog.cloudflare.com/speeding-up-https-and-http-3-negotiation-with-dns/

Speeding up HTTPS and HTTP/3 negotiation with... DNS

In late June, Cloudflare’s resolver team noticed a spike in DNS requests for the 65479 Resource Record thanks to data exposed through our new Radar service. We began investigating and found these to be a part of Apple’s iOS14 beta release where they were testing out a new SVCB/HTTPS record type.

Once we saw that Apple was requesting this record type, and while the iOS 14 beta was still on-going, we rolled out support across the Cloudflare customer base.

This blog post explains what this new record type does and its significance, but there’s also a deeper story: Cloudflare customers get automatic support for new protocols like this.

That means that today if you’ve enabled HTTP/3 on an Apple device running iOS 14, when it needs to talk to a Cloudflare customer (say you browse to a Cloudflare-protected website, or use an app whose API is on Cloudflare) it can find the best way of making that connection automatically.

And if you’re a Cloudflare customer you have to do… absolutely nothing… to give Apple users the best connection to your Internet property.

Negotiating HTTP security and performance

Whenever a user types a URL in the browser box without specifying a scheme (like “https://” or “http://”), the browser cannot assume, without prior knowledge such as a Strict-Transport-Security (HSTS) cache or preload list entry, whether the requested website supports HTTPS or not. The browser will first try to fetch the resources using plaintext HTTP, and only if the website redirects to an HTTPS URL, or if it specifies an HSTS policy in the initial HTTP response, the browser will then fetch the resource again over a secure connection.

Speeding up HTTPS and HTTP/3 negotiation with... DNS

This means that the latency incurred in fetching the initial resource (say, the index page of a website) is doubled, due to the fact that the browser needs to re-establish the connection over TLS and request the resource all over again. But worse still, the initial request is leaked to the network in plaintext, which could potentially be modified by malicious on-path attackers (think of all those unsecured public WiFi networks) to redirect the user to a completely different website. In practical terms, this weakness is sometimes used by said unsecured public WiFi network operators to sneak advertisements into people’s browsers.

Unfortunately, that’s not the full extent of it. This problem also impacts HTTP/3, the newest revision of the HTTP protocol that provides increased performance and security. HTTP/3 is advertised using the Alt-Svc HTTP header, which is only returned after the browser has already contacted the origin using a different and potentially less performant HTTP version. The browser ends up missing out on using faster HTTP/3 on its first visit to the website (although it does store the knowledge for later visits).

Speeding up HTTPS and HTTP/3 negotiation with... DNS

The fundamental problem comes from the fact that negotiation of HTTP-related parameters (such as whether HTTPS or HTTP/3 can be used) is done through HTTP itself (either via a redirect, HSTS and/or Alt-Svc headers). This leads to a chicken and egg problem where the client needs to use the most basic HTTP configuration that has the best chance of succeeding for the initial request. In most cases this means using plaintext HTTP/1.1. Only after it learns of parameters can it change its configuration for the following requests.

But before the browser can even attempt to connect to the website, it first needs to resolve the website’s domain to an IP address via DNS. This presents an opportunity: what if additional information required to establish a connection could be provided, in addition to IP addresses, with DNS?

That’s what we’re excited to be announcing today: Cloudflare has rolled out initial support for HTTPS records to our edge network. Cloudflare’s DNS servers will now automatically generate HTTPS records on the fly to advertise whether a particular zone supports HTTP/3 and/or HTTP/2, based on whether those features are enabled on the zone.

Service Bindings via DNS

The new proposal, currently discussed by the Internet Engineering Task Force (IETF) defines a family of DNS resource record types (“SVCB”) that can be used to negotiate parameters for a variety of application protocols.

The generic DNS record “SVCB” can be instantiated into records specific to different protocols. The draft specification defines one such instance called “HTTPS”, specific to the HTTP protocol, which can be used not only to signal to the client that it can connect in over a secure connection (skipping the initial unsecured request), but also to advertise the different HTTP versions supported by the website. In the future, potentially even more features could be advertised.

example.com 3600 IN HTTPS 1 . alpn=”h3,h2”

The DNS record above advertises support for the HTTP/3 and HTTP/2 protocols for the example.com origin.

This is best used alongside DNS over HTTPS or DNS over TLS, and DNSSEC, to again prevent malicious actors from manipulating the record.

The client will need to fetch not only the typical A and AAAA records to get the origin’s IP addresses, but also the HTTPS record. It can of course do these lookups in parallel to avoid additional latency at the start of the connection, but this could potentially lead to A/AAAA and HTTPS responses diverging from each other. For example, in cases where the origin makes use of DNS load-balancing: if an origin can be served by multiple CDNs it might happen that the responses for A and/or AAAA records come from one CDN, while the HTTPS record comes from another. In some cases this can lead to failures when connecting to the origin (say, if the HTTPS record from one of the CDNs advertises support for HTTP/3, but the CDN the client ends up connecting to doesn’t support it).

This is solved by the SVCB and HTTPS records by providing the IP addresses directly, without the need for the client to look at A and AAAA records. This is done via the “ipv4hint” and “ipv6hint” parameters that can optionally be added to these records, which provide lists of IPv4 and IPv6 addresses that can be used by the client in lieu of the addresses specified in A and AAAA records. Of course clients will still need to query the A and AAAA records, to support cases where no SVCB or HTTPS record is available, but these IP hints provide an additional layer of robustness.

example.com 3600 IN HTTPS 1 . alpn=”h3,h2” ipv4hint=”192.0.2.1” ipv6hint=”2001:db8::1”

In addition to all this, SVCB and HTTPS can also be used to define alternative endpoints that are authoritative for a service, in a similar vein to SRV records:

example.com 3600 IN HTTPS 1 example.net alpn=”h3,h2”
example.com 3600 IN HTTPS 2 example.org alpn=”h2”

In this case the “example.com” HTTPS service can be provided by both “example.net” (which supports both HTTP/3 and HTTP/2, in addition to HTTP/1.x) as well as “example.org” (which only supports HTTP/2 and HTTP/1.x). The client will first need to fetch A and AAAA records for “example.net” or “example.org” before being able to connect, which might increase the connection latency, but the service operator can make use of the IP hint parameters discussed above in this case as well, to reduce the amount of required DNS lookups the client needs to perform.

This means that SVCB and HTTPS records might finally provide a way for SRV-like functionality to be supported by popular browsers and other clients that have historically not supported SRV records.

There is always room at the top apex

When setting up a website on the Internet, it’s common practice to use a “www” subdomain (like in “www.cloudflare.com”) to identify the site, as well as the “apex” (or “root”) of the domain (in this case, “cloudflare.com”). In order to avoid duplicating the DNS configuration for both domains, the “www” subdomain can typically be configured as a CNAME (Canonical Name) record, that is, a record that maps to a different DNS record.

cloudflare.com.   3600 IN A 192.0.2.1
cloudflare.com.   3600 IN AAAA 2001:db8::1
www               3600 IN CNAME cloudflare.com.

This way the list of IP addresses of the websites won’t need to be duplicated all over again, but clients requesting A and/or AAAA records for “www.cloudflare.com” will still get the same results as “cloudflare.com”.

However, there are some cases where using a CNAME might seem like the best option, but ends up subtly breaking the DNS configuration for a website. For example when setting up services such as GitLab Pages, GitHub Pages or Netlify with a custom domain, the user is generally asked to add an A (and sometimes AAAA) record to the DNS configuration for their domain. Those IP addresses are hard-coded in users’ configurations, which means that if the provider of the service ever decides to change the addresses (or add new ones), even if just to provide some form of load-balancing, all of their users will need to manually change their configuration.

Using a CNAME to a more stable domain which can then have variable A and AAAA records might seem like a better option, and some of these providers do support that, but it’s important to note that this generally only works for subdomains (like “www” in the previous example) and not apex records. This is because the DNS specification that defines CNAME records states that when a CNAME is defined on a particular target, there can’t be any other records associated with it. This is fine for subdomains, but apex records will need to have additional records defined, such as SOA and NS, for the DNS configuration to work properly and could also have records such as MX to make sure emails get properly delivered. In practical terms, this means that defining a CNAME record at the apex of a domain might appear to be working fine in some cases, but be subtly broken in ways that are not immediately apparent.

But what does this all have to do with SVCB and HTTPS records? Well, it turns out that those records can also solve this problem, by defining an alternative format called “alias form” that behaves in the same manner as a CNAME in all the useful ways, but without the annoying historical baggage. A domain operator will be able to define a record such as:

example.com. 3600 IN HTTPS example.org.

and expect it to work as if a CNAME was defined, but without the subtle side-effects.

One more thing

Encrypted SNI is an extension to TLS intended to improve privacy of users on the Internet. You might remember how it makes use of a custom DNS record to advertise the server’s public key share used by clients to then derive the secret key necessary to actually encrypt the SNI. In newer revisions of the specification (which is now called “Encrypted ClientHello” or “ECH”) the custom TXT record used previously is simply replaced by a new parameter, called “echconfig”, for the SVCB and HTTPS records.

This means that SVCB/HTTPS are a requirement to support newer revisions of Encrypted SNI/Encrypted ClientHello. More on this later this year.

Speeding up HTTPS and HTTP/3 negotiation with... DNS

What now?

This all sounds great, but what does it actually mean for Cloudflare customers? As mentioned earlier, we have enabled initial support for HTTPS records across our edge network. Cloudflare’s DNS servers will automatically generate HTTPS records on the fly to advertise whether a particular zone supports HTTP/3 and/or HTTP/2, based on whether those features are enabled on the zone, and we will later also add Encrypted ClientHello support.

Thanks to Cloudflare’s large network that spans millions of web properties (we happen to be one of the most popular DNS providers), serving these records on our customers’ behalf will help build a more secure and performant Internet for anyone that is using a supporting client.

Adopting new protocols requires cooperation between multiple parties. We have been working with various browsers and clients to increase the support and adoption of HTTPS records. Over the last few weeks, Apple’s iOS 14 release has included client support for HTTPS records, allowing connections to be upgraded to QUIC when the HTTP/3 parameter is returned in the DNS record. Apple has reported that so far, of the population that has manually enabled HTTP/3 on iOS 14, 8% of the QUIC connections had the HTTPS record response.

Speeding up HTTPS and HTTP/3 negotiation with... DNS

Other browser vendors, such as Google and Mozilla, are also working on shipping support for HTTPS records to their users, and we hope to be hearing more on this front soon.

Start measuring Web Vitals with Browser Insights

Post Syndicated from Jon Levine original https://blog.cloudflare.com/start-measuring-web-vitals-with-browser-insights/

Start measuring Web Vitals with Browser Insights

Many of us at Cloudflare obsess about how to make websites faster. But to improve performance, you have to measure it first. Last year we launched Browser Insights to help our customers measure web performance from the perspective of end users.

Today, we’re partnering with the Google Chrome team to bring Web Vitals measurements into Browser Insights. Web Vitals are a new set of metrics to help web developers and website owners measure and understand load time, responsiveness, and visual stability. And with Cloudflare’s Browser Insights, they’re easier to measure than ever – and it’s free for anyone to collect data from the whole web.

Start measuring Web Vitals with Browser Insights

Why do we need Web Vitals?

When trying to understand performance, it’s tempting to focus on the metrics that are easy to measure — like Time To First Byte (TTFB). While TTFB and similar metrics are important to understand, we’ve learned that they don’t always tell the whole story.

Our partners on the Google Chrome team have tackled this problem by breaking down user experience into three components:

  • Loading: How long did it take for content to become available?
  • Interactivity: How responsive is the website when you interact with it?
  • Visual stability: How much does the page move around while loading? (I think of this as the inverse of “jankiness”)
Start measuring Web Vitals with Browser Insights
This image is reproduced from work created and shared by Google and used according to terms described in the Creative Commons 4.0 Attribution License.

It’s challenging to create a single metric that captures these high-level components. Thankfully, the folks at Google Chrome team have thought about this, and earlier this year introduced three “Core” Web Vitals metrics:  Largest Contentful Paint,  First Input Delay, and Cumulative Layout Shift.

How do Web Vitals help make your website faster?

Measuring the Core Web Vitals isn’t the end of the story. Rather, they’re a jumping off point to understand what factors impact a website’s performance. Web Vitals tells you what is happening at a high level, and other more detailed metrics help you understand why user experience could be slow.

Take loading time, for example. If you notice that your Largest Contentful Paint score is “needs improvement”, you want to dig into what is taking so long to load! Browser Insights still measures navigation timing metrics like DNS lookup time and TTFB. By analyzing these metrics in turn, you might want to dig further into optimizing cache hit rates, tuning the performance of your origin server, or tweaking order in which resources like JavaScript and CSS load.

Start measuring Web Vitals with Browser Insights

For more information about improving web performance, check out Google’s guides to improving LCP, FID, and CLS.

Why measure Web Vitals with Cloudflare?

First, we think that RUM (Real User Measurement) is a critical companion to synthetic measurement. While you can always try a few page loads on your own laptop and see the results, gathering data from real users is the only way to take into account real-life device performance and network conditions.

There are other great RUM tools out there. Google’s Chrome User Experience Report (CrUX) collects data about the entire web and makes it available through tools like Page Speed Insights (PSI), which combines synthetic and RUM results into useful diagnostic information.

One major benefit of Cloudflare’s Browser Insights is that it updates constantly; new data points are available shortly after seeing a request from an end-user. The data in the Chrome UX Report is a 28-day rolling average of aggregated metrics, so you need to wait until you can see changes reflected in the data.

Another benefit of Browser Insights is that we can measure any browser — not just Chrome. As of this writing, the APIs necessary to report Web Vitals are only supported in Chromium browsers, but we’ll support Safari and Firefox when they implement those APIs.

Finally, Brower Insights is free to use! We’ve worked really hard to make our analytics blazing fast for websites with any amount of traffic. We’re excited to support slicing and grouping by URL, Browser, OS, and Country, and plan to support several more dimensions soon.

Push a button to start measuring

To start using Browser Insights, just head over to the Speed tab in the dashboard. Starting today, Web Vitals metrics are now available for everyone!

Behind the scenes, Browser Insights works by inserting a JavaScript “beacon” into HTML pages. You can control where the beacon loads if you only want to measure specific pages or hostnames. If you’re using CSP version 3, we’ll even automatically detect the nonce (if present) and add it to the script.

Where we’ve been, and where we’re going

We’ve been really proud of the success of Browser Insights. We’ve been hard at work over the last year making lots of improvements — for example, we’ve made the dashboard fast and responsive (and still free!) even for the largest websites.

Coming soon, we’re excited to make this available for all our Web Analytics customers — even those who don’t use Cloudflare today. We’re also hard at work adding much-requested features like client-side error reporting, and diagnostics tools to make it easier to understand where to improve.

Building even faster interpreters in Rust

Post Syndicated from Zak Cutner original https://blog.cloudflare.com/building-even-faster-interpreters-in-rust/

Building even faster interpreters in Rust

Building even faster interpreters in Rust

At Cloudflare, we’re constantly working on improving the performance of our edge — and that was exactly what my internship this summer entailed. I’m excited to share some improvements we’ve made to our popular Firewall Rules product over the past few months.

Firewall Rules lets customers filter the traffic hitting their site. It’s built using our engine, Wirefilter, which takes powerful boolean expressions written by customers and matches incoming requests against them. Customers can then choose how to respond to traffic which matches these rules. We will discuss some in-depth optimizations we have recently made to Wirefilter, so you may wish to get familiar with how it works if you haven’t already.

Minimizing CPU usage

As a new member of the Firewall team, I quickly learned that performance is important — even in our security products. We look for opportunities to make our customers’ Internet properties faster where it’s safe to do so, maximizing both security and performance.

Our engine is already heavily used, powering all of Firewall Rules. But we have bigger plans. More and more products like our Web Application Firewall (WAF) will be running behind our Wirefilter-based engine, and it will become responsible for eating up a sizable chunk of our total CPU usage before long.

How to measure performance?

Measuring performance is a notoriously tricky task, and as you can probably imagine trying to do this in a highly distributed environment (aka Cloudflare’s edge) does not help. We’ve been surprised in the past by optimizations that look good on paper, but, when tested out in production, just don’t seem to do much.

Our solution? Performance measurement as a service — an isolated and reproducible benchmark for our Firewall engine and a framework for engineers to easily request runs and view results. It’s worth noting that we took a lot of inspiration from the fantastic Rust Compiler benchmarks to build this.

Building even faster interpreters in Rust
Our benchmarking framework, showing how performance during different stages of processing Wirefilter expressions has changed over time [1].

What to measure?

Our next challenge was to find some meaningful performance metrics. Some experimentation quickly uncovered that time was far too volatile a measure for meaningful comparisons, so we turned to hardware counters [2]. It’s not hard to find tools to measure these (perf and VTune are two such examples), although they (mostly) don’t allow control over which parts of the program are recorded. In our case, we wished to individually record measurements for different stages of filter processing — parsing, compilation, analysis, and execution.

Once again we took inspiration from the Rust compiler, and its self-profiling options, using the perf_event_open API to record counters from inside our binary. We then output something like the following, which our framework can easily ingest and store for later visualization.

Building even faster interpreters in Rust
Output of our benchmarks in JSON Lines format, showing a list of recordings for each combination of hardware counter and Wirefilter processing stage. We’ve used 10 repeats here for readability, but we use around 20, in addition to 5 warmup rounds, within our framework.

Whilst we mainly focussed on metrics relating to CPU usage, we also use a combination of getrusage and clear_refs to find the maximum resident set size (RSS). This is useful to understand the memory impact of particular algorithms in addition to CPU.

But the challenge was not over. Cloudflare’s standard CI agents use virtualization and sandboxing for security and convenience, but this makes accessing hardware counters virtually impossible. Running our benchmarks on a dedicated machine gave us access to these counters, and ensured more reproducible results.

Speeding up the speed test

Our benchmarks were designed from the outset to take an important place in our development process. For instance, we now perform a full benchmark run before releasing each new version to detect performance regressions.

But with our benchmarks in place, it quickly became clear that we had a problem. Our benchmarks simply weren’t fast enough — at least if we wanted to complete them in less than a few hours! The problem was we have a very large number  of filters. Since our engine would never usually execute requests against this many filters at once it was proving incredibly costly. We came up with a few tricks to cut this down…

  • Deduplication. It turns out that only around a third of filters are structurally unique (something that is easy to check as Wirefilter can helpfully serialize to JSON). We managed to cut down a great deal of time by ignoring duplicate filters in our benchmarks.
  • Sampling. Still, we had too many filters and random sampling presented an easy solution. A more subtle challenge was to make sure that the random sample was always the same to maintain reproducibility.
  • Partitioning. We worried that deduplication and sampling would cause us to miss important cases that are useful to optimize. By first partitioning filters by Wirefilter language feature, we can ensure we’re getting a good range of filters. It also helpfully gives us more detail about where specifically the impact of a performance change is.

Most of these are trade-offs, but very necessary ones which allow us to run continual benchmarks without development speed grinding to a halt. At the time of writing, we’ve managed to get a benchmark run down to around 20 minutes using these ideas.

Optimizing our engine

With a benchmarking framework in place, we were ready to begin testing optimizations. But how do you optimize an interpreter like Wirefilter? Just-in-time (JIT) compilation, selective inlining and replication were some ideas floating around in the word of interpreters that seemed attractive. After all, we previously wrote about the cost of dynamic dispatch in Wirefilter. All of these techniques aim to reduce that effect.

However, running some real filters through a profiler tells a different story. Most execution time, around 65%, is spent not resolving dynamic dispatch calls but instead performing operations like comparison and searches. Filters currently in production tend to be pretty light on functions, but throw in a few more of these and even less time would be spent on dynamic dispatch. We suspect that even a fair chunk of the remaining 35% is actually spent reading the memory of request fields.

Function CPU time
`matches` operator 0.6%
`in` operator 1.1%
`eq` operator 11.8%
`contains` operator 51.5%
Everything else 35.0%
Breakdown of CPU time while executing a typical production filter.

An adventure in substring searching

By now, you shouldn’t be surprised that the contains operator was one of the first in line for optimization. If you’ve ever written a Firewall Rule, you’re probably already familiar with what it does — it checks whether a substring is present in the field you are matching against. For example, the following expression would match when the host is “example.com” or “www.example.net”, but not when it is “cloudflare.com”. In string searching algorithms, this is commonly referred to as finding a ‘needle’ (“example”) within a ‘haystack’ (“example.com”).

http.host contains “example”

How does this work under the hood? Ordinarily, we may have used Rust’s `String::contains` function but Wirefilter also allows raw byte expressions that don’t necessarily conform to UTF-8.

http.host contains 65:78:61:6d:70:6c:65

We therefore used the memmem crate which performs a two-way substring search algorithm on raw bytes.

Sounds good, right? It was, and it was working pretty well, although we’d noticed that rewriting `contains` filters using regular expressions could bizarrely often make them faster.

http.host matches “example”

Regular expressions are great, but since they’re far more powerful than the `contains` operator, they shouldn’t be faster than a specialized algorithm in simple cases like this one.

Something was definitely up. It turns out that Rust’s regex library comes equipped with a whole host of specialized matchers for what it deems to be simple expressions like this. The obvious question was whether we could therefore simply use the regex library. Interestingly, you may not have realized that the popular ripgrep tool does just that when searching for fixed-string patterns.

However, our use case is a little different. Since we’re building an interpreter (and we’re using dynamic dispatch in any case), we would prefer to dispatch to a specialized case for `contains` expressions, rather than matching on some enum deep within the regex crate when the filter is executed. What’s more, there are some pretty cool things being done to perform substring searching that leverages SIMD instruction sets. So we wired up our engine to some previous work by Wojciech Muła and the results were fantastic.

Benchmark Improvement
Expressions using `contains` operator 72.3%
‘Simple’ expressions 0.0%
All expressions 31.6%
Improvements in instruction count using Wojciech Muła’s sse4-strstr library over the memmem crate with Wirefilter.

I encourage you to read more on “Algorithm 1”, which we used, but it works something like this (I’ve changed the order a little to help make it clearer). It’s worth reading up on SIMD instructions if you’re unfamiliar with them — they’re the essence behind what makes this algorithm fast.

  1. We fill one SIMD register with the first byte of the needle being searched for, simply repeated over and over.
  2. We load as much of our haystack as we can into another SIMD register and perform a bitwise equality operation with our previous register.
  3. Now, any position in the resultant register that is 0 cannot be the start of the match since it doesn’t start with the same byte of the needle.
  4. We now repeat this process with the last byte of the needle, offsetting the haystack, to rule out any positions that don’t end with the same byte as the needle.
  5. Bitwise ANDing these two results together, we (hopefully) have now drastically reduced our potential matches.
  6. Each of the remaining potential matches can be checked manually using a memcmp operation. If we find a match, then we’re done.
  7. If not, we continue with the next part of our haystack and repeat until we’ve checked the entire thing.

When it goes wrong

You may be wondering what happens if our haystack doesn’t fit neatly into registers. In the original algorithm, nothing. It simply continues reading into the oblivion after the end of the haystack until the last register is full, and uses a bitmask to ignore potential false-positives from this additional region of memory.

As we mentioned, security is our priority when it comes to optimizations, so we could never deploy something with this kind of behaviour. We ended up porting Muła’s library to Rust (we’ve also open-sourced the crate!) and performed an overlapping registers modification found in ARM’s blog.

It’s best illustrated by example — notice the difference between how we would fill registers on an imaginary SIMD instruction-set with 4-byte registers.

Before modification

Building even faster interpreters in Rust
How registers are filled in the original implementation for the haystack “abcdefghij”, red squares indicate out of bounds memory.

After modification

Building even faster interpreters in Rust
How registers are filled with the overlapping modification for the same haystack, notice how ‘g’ and ‘h’ each appear in two registers.

In our case, repeating some bytes within two different registers will never change the final outcome, so this modification is allowed as-is. However, in reality, we found it was better to use a bitmask to exclude repeated parts of the final register and minimize the number of memcmp calls.

What if the haystack is too small to even fill a single register? In this case, we can’t use our overlapping trick since there’s nothing to overlap with. Our solution is straightforward: while we were primarily targeting AVX2, which can store 32-bytes in a lane, we can easily move down to another instruction set with smaller registers that the haystack can fit into. In reality, we don’t currently go any smaller than SSE2. Beyond this, we instead use an implementation of the Rabin-Karp searching algorithm which appears to perform well.

Instruction set Register size
AVX2 32 bytes
SSE2 16 bytes
SWAR (u64) 8 bytes
SWAR (u32) 4 bytes
Register sizes in different SIMD instruction sets [3]. We did not consider AVX512 since support for this is not widespread enough.

Is it always fast?

Choosing the first and last bytes of the needle to rule out potential matches is a great idea. It means that when it does come to performing a memcmp, we can ignore these, as we know they already match. Unfortunately, as Muła points out, this also makes the algorithm susceptible to a worst-case attack in some instances.

Let’s give an expression that a customer might write to illustrate this.

http.request.uri.path contains “/wp-admin/”

If we try to search for this within a very long sequence of ‘/’s, we will find a potential match in every position and make lots of calls to memcmp — essentially performing a slow bruteforce substring search.

Clearly we need to choose different bytes from the needle. But which ones should we choose? For each choice, an adversary can always find a slightly different, but equally troublesome, worst case. We instead use randomness to throw off our would-be adversary, picking the first byte of the needle as before, but then choosing another random byte to use.

Our new version is unsurprisingly slower than Muła’s, yet it still exhibits a great improvement over both the memmem and regex crates. Performance, but without sacrificing safety.

Benchmark Improvement
sse4-strstr (original) sliceslice (our version)
Expressions using `contains` operator 72.3% 49.1%
‘Simple’ expressions 0.0% 0.1%
All expressions 31.6% 24.0%
Improvements in instruction count of using sse4-strstr and sliceslice over the memmem crate with Wirefilter.

What’s next?

This is only a small taste of the performance work we’ve been doing, and we have much more yet to come. Nevertheless, none of this would have been possible without the support of my manager Richard and my mentor Elie, who contributed a lot of these ideas. I’ve learned so much over the past few months, but most of all that Cloudflare is an amazing place to be an intern!

[1] Since our benchmarks are not run within a production environment, results in this post do not represent traffic on our edge.

[2] We found instruction counts to be a particularly stable measure, and CPU cycles a particularly unstable one.

[3] Note that SWAR is technically not an instruction set, but instead uses regular registers like vector registers.