Сънуват ли джихадистите девици?

Post Syndicated from Атанас Шиников original https://www.toest.bg/sanuvat-li-dzhihadistite-devici/

Сънуват ли джихадистите девици?

Тези дни зачитам едно от любимите ми възрожденски четива, гротесково-ироничната „Видрица“ на Минчо Кънчев, българския революционен юначен поп. Предполагам, че на турски може да го наречем нещо като папаз бабаит. Записките му от Диарбекир винаги са ми напомняли на нашенска версия на големите западни ориенталисти, пътуващи на изток. Веднъж, разказва той, заточен по Анадола,

не знам тези турски ходжи, молли, дервиши какъв сън сънували,

ама отишли в гробищата да питат техния войнстващ светец Гази Хамза ба̀ба какво да правят. Та явно починалият светец, от чиятo сабя капела кръв, им казал, че Пророкът бил сърдит, задето гяурите не били избити. 

И самият Минчо Кънчев, при всичките му бабаитлъци, обрисува себе си като сънуващ човек. Че и приписва сънища на други участници. Каймакаминът сънува дякона Паисий (онзи, грешния предател, да не се бърка с автора на „История славянобългарска“) като обращенец в правата вяра. Самият дякон Паисий се сънува като повишен в чин владика. Накрая тия сънища се схождат трагично в убийството на дякона, извършено от Димитър Общи. 

От камбанарията на скептика подозирам, че разказите носят белезите на типична реторическа хватка. Без значение от коя страна на религиозната бариера стоиш, като искаш да вмъкнеш нещо скандално или да си измислиш оправдание, го поднасяш, облечено във формулата „сънувах“. Едновременно е авторитетно и недоказуемо. Та затова и „какъв сън сънували“ може да значи просто „какво са си наумили“. Сънищата на каймакамина и дякона Паисий са потвърждение на една заслужена смъртна казън. Сънищата на самия поп Минчо свидетелстват за неговата героично-мъченическа съдба. 

Но всъщност „ходжите, моллите и дервишите“ сънуват, и то много.

Далеч преди поп Минчо Кънчев. Защото са част от огромна и непрекъсната традиция на разбиране за ролята на сънищата сред мюсюлманите, която започва с фигурата на самия Пророк. Като че ли в пясъците на Арабия от седмото столетие след Христа традициите на сънуване, тълкуване и съответно впрягане на тълкуванията в публична употреба придобиват нова съдържателност.

Коранът, подобно на Библията (че кой от нас не е чел за сънищата на Йосиф, за „седемте добри и седемте лоши години“, за „колоса на глинени крака“ от съня на пророк Даниил или за съня на жената на Пилат от Евангелието?), дава изобилен материал относно виденията по време на сън. Даже използва поне четири термина за това. Първият от тях е буквално „видение“ (ру’йа); на второ място срещаме думата манам (просто „сън“ в смисъл на „състояние на заспалост“ и „видение по време на сън“), а инцидентно срещаме и преносното бушра, означаващо първоначално „добра новина“, интерпретирано веднъж като видение в сън. И накрая, за „лоши сънища“ Коранът използва най-популярната днес в арабския език дума за сън – хулм.

Доколкото самият Пророк Мохамед твърди, че „стъпва в обувките“ на пророческата мисия на библейските пророци, често пъти разказите за сънища в Писанието на мюсюлманите са свързани с персонажи, заети от библейския разказ, като Ибрахим (библ. Авраам) или Юсуф (библ. Йосиф). А разказите за Мохамед, т.нар. Сунна – онова, което мюсюлманите, особено в суннизма, твърдят, че той е казал, направил, одобрил или порицал, – са истински трамплин към развиване на детайлна традиция за разбиране на тази мъглява, но неотменна част от човешкия живот. 

Да надзърнем например в т.нар. Достоверен (Сахих) сборник на Ал-Бухари от IX век. В него имаме огромен раздел под надслов „Тълкуванието на сънищата“, който съдържа няколко десетки предания (хадиси). Появяват се нови категории сънища (например „добри сънища“, мубашшират), обяснява се какво място заемат в живота на правоверните. Добрият, верен сън е от Аллах, а лошият сън е само от дявола. „Добрите сънища на праведните са една четирийсет и шеста част от пророчеството“; ако човек види сън, който му се харесва, значи той е от Аллах. И не е възможно човек да види самия Пророк в съня си и този сън да е от дявола. 

Сунната задава и рамката на нещо друго – появяват се конкретни напътствия как да се разбира това или онова, видяно по време на сън. Ако вярващият сънува дявола, трябва да плюе наляво и да помоли Аллах за убежище. Същото предписание следва да се изпълни при всеки лош сън. Дрехата, носена от съратниците на Мухаммад, в сън представя ислямската религия; зелената градина също представя правоверието; черната разчорлена жена е представена като чумата. 

Докато спях, ми връчиха чаша с мляко, което започнах да пия, докато млякото не започна да струи от ноктите ми,

казва Пророкът. После дал остатъка на неговия съратник и бъдещ халиф Умар. Запитан как тълкува това, Мохамед отговорил, че млякото е символ на религиозното познание. 

Конкретни събития от времето на Пророка се обясняват чрез сън.

Видях се насън да размахвам меч, който се счупи по средата. После го размахах пак и той се възстанови по-хубав от преди.

В първия случай, пояснява той, счупеният меч символизира падналите мюсюлмани в претърпяното поражение в битката при Ухуд през 625 г., докато във втория очевидно става въпрос за последвалата победа, дарена на правоверните. 

Въз основа на зададените рамки в първоначалната мюсюлманска общност се развива и огромна традиция за употреба на сънищата с най-разнообразна цел. В крайна сметка, ако нещо се появява с авторитета на самия Бог в Корана и после е утвърдено чрез думите и делата на Пророка, не е ли редно да породи след себе си традиция? Обикновено така работи религиозното мислене. Може да го премисляш, може да го променяш, може да го реинтерпретираш, но трудно може да го изхвърлиш и да се откажеш от него. Поне трябва да се потрудиш върху аргументацията защо го правиш. 

С времето се появяват такива емблематични съчинения, като „Тълкувания на сънищата“ на Ибн Сирин от VIII век, върху когото стъпват всички по-нататъшни усилия. Умението за разбиране на сънищата и тяхната връзка с реалността е засвидетелствана и от факта, че през XII век Ал-Халлал съставя биографичен речник на тълкувателите на сънища, а философът Ибн Сина или богословът Ал-Газзали от епохата на късните Абасиди посвещават значителни усилия на ситуирането на сънищата в живота на правоверните. Дори Ибн Халдун от XV столетие сл.Хр., иначе познат като трезв, повратлив дипломат и историк (и досаден кошмар за всеки студент в българската арабистика), отделя част от прословутото си „Встъпление“ на наречената от него „наука за тълкуване на сънищата“. Съновникът на богослова Ан-Набулси, живял на границата между XVII и XVIII век, надгражда този на Ибн Сирин и до днес се преиздава с голям успех. Сега по-ясно може да си представим защо мюсюлманите сънуват. Сънуват от времето на Мохамед до днес. 

Сънуват всякакви неща. Или поне казват, че ги сънуват.

През август 1068 г. например богословът Ибн ал-Банна в Багдад записва в личния си дневник, че един човек го посещава с молба за разтълкуването на „страшен, велик сън“. В него се виждал слон с две крила, телосложение и ръст на човек, с голяма мъжественост (фалос), който се спуска над река Тигър. Ибн ал-Банна записва веднага значението на съня. Няма начин слонът да не е султанът Алп Арслан, а двете му крила – неговите двама сина. Голямата му мъжественост, която впрочем в съня спадала и се връщала към обичайния си размер, била неговата огромна репутация и авторитет. Малко след това в дневника са отбелязани и други сънища в около двайсет различни разказа – например зелени скакалци с бисери в устата. Пак Ибн Банна научава в сън, че шейх от общността е преследван от еретици.

Сънуват ли джихадистите девици?
„Спящи приятели“, илюстрация към ръкопис Arabe 3929 на „Макамите“ от Ал-Харири от XIII век, съхраняван във Френската национална библиотека

Ако пък зачетем Ан-Набулси, може да видим и че в пространството на сънищата се появяват неща, които наяве не са много легитимни. Но са изпълнени със смисъл.

Ето например как се сънува прасето в култура, която му отрежда презряно ъгълче на творението и го възприема като греховно (харам).

Прасето, казва богословът, може да те навести насън под всякаква форма. Обикновено означава проклет, силен, лукав враг, който никак не държи на думата си. Но ако човек е яхнал прасе насън, щял да вземе пари, и то много. Ама няма да бъдат чисти пари, нали? Ако ядеш насън, и знаеш, че кусаш възбранената пържола печена или готвена по друг начин, пак ще вземеш чрез търговия много пари. Но по непозволен начин.

Дивото прасе подсказва идващ голям дъжд и студ, ако пътуваш по суша или плаваш по морето. За онзи, който има противоречие, някаква дрязга или вражда, показва, че врагът му е силен, злобен, с мръсен език. Ако жителите на селата сънуват прасе, значи, че идват усилни, трудни времена, а ако някой, който сади разсад, сънува прасе, този разсад не е както трябва. По подобен начин, ако някой, който иска да се жени, сънува прасе, значи, че не се жени за подходящата жена. Защото

прасето насън може да обозначава и жена. 

И месото на прасето насън се услажда. Затова, който сънува, че яде печено свинско, значи ще се сдобие с бърза полза. А който съзре насън прасе в постелята си, ще се сноши с юдейка. Малките прасенца също имат място в сънищата. Означават големи грижи за онзи, който ги притежава или ги вижда. Домашното прасе обаче може да значи урожай. Ако просто виждаш прасе насън, значи, че си повелител над народ от юдеи и християни. За онзи, който е решил да влезе в конфликт с жена си и види насън мъжко прасе или свиня, значи, че ще се разведе. Възможно е прасето да бъде разтълкувано и като човек измежду юдеите и християните, или пак ако го видиш насън, да означава зло, нещастие, недоволство и скръб, възбранена печалба. Но ако е свинка, може да значи и многобройно потомство. В случай че насън пострадаш от прасе, значи ще пострадаш от християнин. 

Който обаче насън порази прасе, ще получи подкрепа и възможност за влияние от човек с голям авторитет. Който владее много прасета, ще получи много пари накуп. Има и вероятност насън да се превърнеш в прасе. Тогава ще получиш пари и други облаги, но ще бъде заедно с унижения и злощастия във вярата. Ако се сражаваш с прасе, ще надделееш над враг, който угнетява. Ядене на свинско, освен придобиването на пари с мътен произход и по нечестен начин, може да значи и че ще извършиш нечестие. Ако малки прасенца влязат в къщата ти и из двора, значи при теб ще дойдат слугите на султана, тъй че трябва да внимаваш. И обратното – ако насън изгонваш прасенца от двора, ще се откажеш от султанската работа.

Ан-Набулси, когото чета в арабския оригинал, отскоро може да четете в частичен превод на английски от Ясмин Сийл, която през 2022 г. получи литературен грант от клуба „ПЕН“ за превода под поетичното заглавие If You See Them Fall to Earth. Не знам дали там може да откриете откъса за нечистото животно, но за мен е важно признанието за превод на арабски класици от османската епоха на езика на съвремието. При което арабските автори придобиват нова актуалност. 

А моето подозрение около разказите за сънища на поп Минчо Кънчев и ходжите се оказва нелишено от основания.

Пророкът може и да затваря вратата за по-нататъшно пророчество от начина, по който бива изпратен от Аллах на земята, и това да обезкуражава част от общността. За да ги насърчи обаче, той отбелязва, че остават „добрите новини“ (мубашшират), а те на свой ред се обясняват по-късно като „видения насън, разкрити на благочестиви мюсюлмани“ и като „част от пророчеството“. Това вдъхва увереност в сънищата като средство, което предоставя водителство за общността и в частност може да реши конкретни предизвикателства пред нея.

Много по-лесно е да се позовеш на сън при оправдаването на дадено действие или обяснение на събитие, отколкото да намериш предание от Пророка (хадис), което да го подкрепя. Защото механизмът за обявяване на хадисите за достоверни е предмет на твърде тежък критически поглед към гарантирането на достоверността на механизма на тяхното предаване (иснад) чрез авторитети, стигащи до времето на Мохамед¹. Оттук и логичното заключение, че онова, което авторът не може да каже, опирайки се на своя собствен авторитет, може да подкрепи чрез външен източник чрез разказването на сън и видение²

1 Kinberg, Leah. “Dreams”, EI3, p. 97–98.

2 Ibid., p. 97.

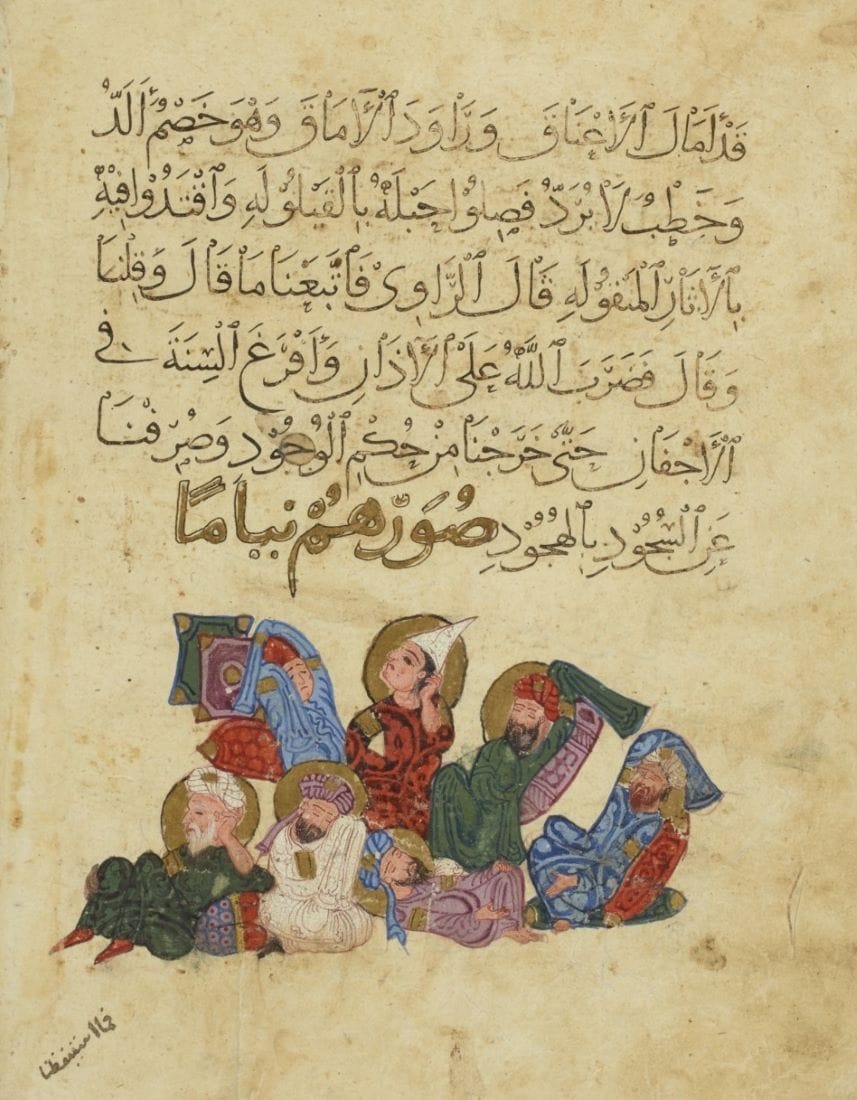
Водещо изображение: Али Парники сънува шейх Сафи в компанията на Пророка Мохамед, биографичен ръкопис за живота на шейх Сафи ад-Дин Исхак Ардабили, илюстрация от XVI век

В рубриката „Ориент кафе“ Атанас Шиников поднася любопитни теми, свързани не толкова с горещата политика, колкото с историята и културата на Близкия изток. А той, древен и днешен, е по-близко до нас и съвремието ни, отколкото си представяме.

[$] A generic ring buffer for the kernel

Post Syndicated from corbet original https://lwn.net/Articles/976836/

The kernel’s user-space ABI does not lack for ring buffers; they have been
defined for subsystems like BPF, io_uring, perf,
and tracing, for
example. Naturally, each of those ring buffers is unique, with no common
interface between them. The natural response to this ABI proliferation is,
of course, to add yet another ring buffer as the generic option; that is
the intent of this
patch series
from Kent Overstreet adding a new set of system calls for
ring buffers.

Security updates for Thursday

Post Syndicated from jake original https://lwn.net/Articles/977442/

Security updates have been issued by AlmaLinux (cockpit, kernel, kernel-rt, libxml2, ruby:3.1, and tomcat), Debian (libarchive, pillow, and tinyproxy), Fedora (apptainer), Mageia (amavisd-new and libxml2), Oracle (edk2), Red Hat (booth, cockpit, kernel-rt, less, libxml2, nghttp2, ruby:3.1, ruby:3.3, and tomcat), Slackware (kernel), and Ubuntu (atril, bluez, frr, gdk-pixbuf, openjdk-17, openjdk-21, openjdk-8, openjdk-lts, qemu, and unixodbc).

Backblaze Live Read: The Game Changer for Live Media Cloud Workflows

Post Syndicated from Elton Carneiro original https://backblaze.com/blog/announcing-b2-live-read/

A decorative image with the title Live Read.

Every sports fan knows that when something incredible happens on the field/ice/court, we want to see the replay right now. But many of us don’t know the impressive efforts that live media teams undertake to deliver clips in real time to all of us on whatever viewing platform we might prefer. Today, Backblaze is excited to make the work of live media production (and the end results) a lot easier with our latest innovation.

Announcing Backblaze B2 Live Read

Backblaze B2 Live Read is a patent-pending service that gives media production teams working on live events the ability to access, edit, and transform media content while it is being uploaded into Backblaze B2 Cloud Storage. This means that teams can start working on content far faster than they could before, without having to drastically change their workflows and tools, massively speeding up their time to engagement and revenue. 

This is a game changer for live media teams, who are passionate about bringing content to their audience as soon as possible. It means they don’t need to worry as screen resolutions continue to expand, ranging from 4K to 8K and beyond. It also reduces the need for having production teams on-site to minimize latency, which could be extremely costly depending on the venue. 

Previously, producers had to wait hours or days before they could access uploaded data, or they had to rely on cost-prohibitive and complicated options that often required on-premises storage. That’s no longer necessary. This innovation will make it faster and less expensive to:

  • Create near real-time highlight clips for news segments, in-app replays, and much more.
  • Tap into talent where they are versus trying to find local talent to produce events.
  • Promote content for on-demand sales within minutes of presentations at live events.
  • Distribute teasers for buzz on social media before talent has even left the venue.

For our customers, turnaround time is essential, and Live Read promises to speed up workflows and operations for producers across the industry. We’re incredibly excited to offer this innovative feature to boost performance and accelerate our customers’ business engagements.”

Richard Andes, VP, Product Management, Telestream

Coming soon inside your favorite tools

We designed Live Read to be easily accessible directly via the Backblaze S3 Compatible API and/or seamlessly within the user interface of launch partners including Telestream, Glookast, and Mimir. These platforms, along with CineDeck, Alteon, Hedge, Hiscale, MoovIT, and many others to come, are enabling Live Read within their platforms soon.   

If you want to use Live Read, you can join our private preview.  

How does it work?

Previously, media teams were forced to either wait for uploads to complete or use on-premises storage. Now, Live Read uniquely supports accessing parts of each growing file or growing object as it is uploaded so there’s no need to wait for the full file upload to complete. And, when the full upload is complete, it’s accessible like any other file in a Backblaze B2 Cloud Storage Bucket, with no middleware or proprietary software needed. 

Here’s a short video showing both how Live Read works on a conceptual level, as well as a live demo showing how one app can upload video data to Backblaze B2 using Live Read while a second app reads the uploaded video data:

For those of you who want to dig deeper into the code samples you saw in the video, here is some example code that uses the Amazon SDK for Python, Boto3, to start uploading data with Live Read. If you’re familiar with Amazon S3, you’ll recognize that this is a standard multipart upload apart from the add_custom_header handler function and the call to register it with Boto3’s event system:

def add_custom_header(params, **_kwargs):
    """
    Add the Live Read custom headers to the outgoing request.
    See https://boto3.amazonaws.com/v1/documentation/api/latest/guide/events.html
    """
    params['headers']['x-backblaze-live-read-enabled'] = 'true'

client = boto3.client('s3')
client.meta.events.register('before-call.s3.CreateMultipartUpload', add_custom_header)

response = client.create_multipart_upload(Bucket='my-video-files', Key='liveread.mp4')

upload_id = response['UploadId']

# Now upload data as usual with repeated calls to client.upload_part()

As it processes the call to create_multipart_upload(), Boto3 calls the add_custom_header() handler function, which adds a custom HTTP header, x-backblaze-live-read-enabled, with the value true, to the S3 API request. The custom HTTP header signals to Backblaze B2 that this is a Live Read upload. As with standard multipart uploads, the data is uploaded in parts between 5MB and 5GB in size. To facilitate reading data efficiently, all parts except the last one must have the same size.

Since this is a Live Read upload, as soon as a part is uploaded, it is accessible for downloading.

An app that downloads the file needs to send the same custom HTTP header when it retrieves data. For example:

def add_custom_header(params, **_kwargs):
    """
    Add the Live Read custom headers to the outgoing request.
    See https://boto3.amazonaws.com/v1/documentation/api/latest/guide/events.html
    """
    params['headers']['x-backblaze-live-read-enabled'] = 'true'

client = boto3.client('s3')
client.meta.events.register('before-call.s3.GetObject', add_custom_header)

# Read the first 1 KiB of the file
response = client.get_object(
    Bucket='my-video-files',
    Key='liveread.mp4',
    Range='bytes=0-1023'
)

Note that you must supply either Range or PartNumber to specify a portion of the file when you download data using Live Read. If you request a range or part that does not exist, then Backblaze B2 responds with a 416 Range Not Satisfiable error, just as you might expect. On receiving this error, an app reading the file might repeatedly retry the request, waiting for a short interval after each unsuccessful request.

The source code for the applications is available as open source at https://github.com/backblaze-b2-samples/live-read-demo/.

How much does it cost?

Live Read upload capacity is offered in $15/TB increments—and the capacity is only consumed when an upload is marked for Live Read. Standard uploads are free, as usual. After uploading is complete, the data stored in Backblaze B2 is billed as normal. From a cost perspective, this represents significant savings versus the workflows that production teams must currently follow to achieve anything close to the functionality delivered by Live Read.

And it’s not just for live media

Beyond media, the Live Read API can support breakthroughs across development and IT workloads. For example, organizations maintaining large data logs or surveillance footage backups have often had to parse them into hundreds or thousands of small files each day in order to have quick access when needed—but with Live Read, they can now move to far more manageable single files per day or hour while preserving ability to access parts immediately after they are written.

What’s next

For those interested in Live Read, you can sign up for the private preview here. We’ll continue to report as we add more integrations and we’ll share stories as customers succeed with the new feature. Until then, feel free to ask any question you have in the comments below. 

Want to see more?

Join Pat Patterson, Chief Technical Evangelist, and Elton Carneiro, Senior Director of Partnerships, on January 26, 2024 at 10:00 a.m. PT to learn more in real time. Can’t make it live? Sign up anyway and we’ll send a recording straight to your inbox.

Join the Webinar 

The post Backblaze Live Read: The Game Changer for Live Media Cloud Workflows appeared first on Backblaze Blog | Cloud Storage & Cloud Backup

#Бетономорие ПП-ДБ и Сглобката са прокарали и покровителстват незаконен строеж на огромно селище в залива на Корал

Post Syndicated from Екип на Биволъ original https://bivol.bg/grad_koral.html

четвъртък 6 юни 2024


Само два месеца преди Кирил Петков да подаде оставка като Mинистър-председател на Република България на 27 юни 2022 г., непосредствено зад плаж Корал, ударно започва да изниква огромен строеж на…

Zabbix 7.0 – Everything You Need to Know

Post Syndicated from Michael Kammer original https://blog.zabbix.com/zabbix-7-0-everything-you-need-to-know/28210/

After plenty of breathless anticipation, we’re proud to announce the release of the latest major Zabbix version – the new and improved Zabbix 7.0 LTS. This release is the direct result of user feedback and delivers a variety of improvements, including cloud-native Zabbix proxy scalability, website transaction monitoring, improved data collection speed and scalability, new dashboard widgets, major network discovery speed improvements, new templates and integrations, and more!

Without further ado, let’s take a whistle-stop tour of what you need to know:

Synthetic end-user web monitoring

Busy enterprises can now monitor multiple websites and applications by defining flexible multi-step browser-based scenarios. 7.0 LTS also makes it easy to capture screenshots of the current website state, collect and visualize website performance and availability metrics, extract, monitor, and analyze web application data, and get alerts when issues are discovered.

Zabbix proxy high availability and load balancing

When it’s time to expand, Zabbix 7.0 LTS makes it easy to scale a Zabbix environment, guaranteeing 100% availability with automatic proxy load balancing and high availability features, including the ability to assign hosts to load-balanced proxy groups and seamlessly scale a Zabbix environment by deploying additional proxies.

Faster, more efficient Zabbix proxies

Zabbix proxy now fully supports in-memory data storage for collected metrics. Users can choose from Disk, Memory, and Hybrid proxy buffer modes, all of which are ideal for embedded hardware. In addition, memory mode enables the support of edge computing use cases. Users can expect 10-100x better proxy performance by switching to memory or hybrid modes, depending on allocated hardware.

Centralized control of data collection timeouts

Centralizing control of data collection timeouts enables better support for metrics and custom checks, taking longer data collection time intervals. Data collection timeouts can be defined per item-type and overridden per proxy or on an individual item level. In addition, timeouts are now fully configurable in the Zabbix GUI or via Zabbix API.

Faster and more scalable data collection

Synchronous poller processes have been replaced with asynchronous pollers, which improves the speed and scalability of metric polling, particularly for agent, SNMP, and HTTP checks. The next metric can now be polled before waiting for a response from a previously requested metric, and up to 1,000 concurrent checks can now be supported per poller process.

New ways to visualize data

A variety of new dashboard widgets have been introduced, with the goal of giving users detailed information about their monitored metrics and infrastructure at a glance.

Dynamic dashboard widget navigation

Speaking of dashboard widgets, a new communication framework has also been introduced for dashboard widgets, enabling communication between widgets, allowing a widget to serve as a data source for other widgets, and dynamically updating information displayed in a dashboard widget based on the data source.

Faster network discovery

Discovering services and hosts has never been easier, thanks to support of parallelization while performing network discovery. Concurrency support allows for massive improvements in network discovery speed and simplifies host and service discovery while scanning large network segments.

Better security via enterprise-grade multi-factor authentication

Out-of-the box support of multi-factor authentication enables enterprise-grade security and added flexibility for configuring user authentication methods. Support MFA providers include time-based one-time Password (TOTP) and Duo Universal Prompt authentication.

More flexible resource discovery and management

Low-level discovery has received a variety of improvements, which enable enhanced host configuration and management flexibility when discovering hosts in complex environments, such as VMware or Kubernetes.

New templates and integrations

In response to user demand, Zabbix 7.0 LTS comes pre-packaged with a range of new templates for the most popular vendors and cloud providers.

Zabbix 7.0 training updates

All Zabbix training materials have been updated based on the new functionalities that have been added to the product since Zabbix 6.0.

Everyone is welcome to sharpen their skills, but if you’re a Zabbix 6.0 Certified Specialist or Certified Professional you can master Zabbix 7.0 LTS in just one day with our Upgrade Courses. As a 7.0 Specialist, you’ll be able to automate user provisioning with the Just-in-time (JIT) feature, monitor websites with new synthetic end-user monitoring, leverage new visualization features, and enhance the speed and performance of your data collection.

The 7.0 Certified Professional course covers proxy group configuration with high availability and load balancing, improved proxy data collection, new SNMP bulk monitoring, and enhanced host discovery for VMware, Kubernetes, and Cloud infrastructures.

We’re also happy to organize private trainings for organizations of any size, so don’t hesitate to get in touch!

Upcoming 7.0 events

If you’re looking for more information regarding Zabbix 7.0, you’re in luck! You can tune in to the “What’s new in Zabbix 7.0” webinar on June 11 at 12 PM CST or June 12 at 10 AM EEST. If you’d prefer a more hands-on approach, the following workshops are also available:

• “Zabbix Proxy High-availability and Load Balancing” (June 18, 6 PM EEST)
• “New Web Monitoring Features in Zabbix 7.0” (June 20, 6 PM EEST)

While you’re at it, feel free to explore Zabbix 7.0 LTS webinars and workshops in other languages. You can also check out worldwide events related to Zabbix 7.0 LTS, including our free in-person meetup in Riga on June 19 and Zabbix Summit 2024 this fall. 

Ready to upgrade or migrate?

With a brand-new version out, there’s never been a better time to take advantage of our upgrade or migration services. Let our team take the risk out of migrating or upgrading to 7.0, giving you the latest version at a lower cost and with minimal disruption to your organization.

Need a consultation about the latest version?

Not sure about how to get the most out of Zabbix 7.0? Our expert consultants can answer any questions related to the architecture of your infrastructure, the implementation of a back-up strategy, and your capacity planning, while providing strategic advice on which 7.0 services are right for you.

Make your contribution as a translator

The Documentation 7.0 translation project is now live, which means that you can help localize Zabbix 7.0 documentation in multiple languages. Your efforts will help make Zabbix accessible to users around the globe, and you’ll also receive a reward for your contributions. The guidelines, which contain essential information about the project, are available here.

Useful links

To see what else is in store for the future, have a look at the Zabbix roadmap.

You can find the instructions and download the new version on the Download page.

Detailed, step-by-step upgrade instructions are available on our Upgrade procedure page.

Learn about new features and changes introduced in Zabbix 7.0 LTS by visiting the What’s new in Zabbix 7.0 page.

The What’s new documentation section provides a detailed description of the new features.

Take a look at the release notes to see the full list of new features and improvements.


The post Zabbix 7.0 – Everything You Need to Know appeared first on Zabbix Blog.

Protecting vulnerable communities for 10 years with Project Galileo

Post Syndicated from Jocelyn Woolbright original https://blog.cloudflare.com/galileo10anniversaryradardashboard


In celebration of Project Galileo’s 10th anniversary, we want to give you a snapshot of what organizations that work in the public interest experience on an everyday basis when it comes to keeping their websites online. With this, we are publishing the Project Galileo 10th anniversary Radar dashboard with the aim of providing valuable insights to researchers, civil society members, and targeted organizations, equipping them with effective strategies for protecting both internal information and their public online presence.

Key Statistics

  • Under Project Galileo, we protect more than 2,600 Internet properties in 111 countries.
  • Between May 1, 2023, and March 31, 2024, Cloudflare blocked 31.93 billion cyber threats against organizations protected under Project Galileo. This is an average of nearly 95.89 million cyber attacks per day over the 11-month period.
  • When looking at the different organizational categories, journalism and media organizations were the most attacked, accounting for 34% of all attacks targeting the Internet properties protected under the Project in the last year, followed by human rights organizations at 17%.
  • On October 11, 2023, Cloudflare detected one of the largest attacks we’ve seen against an organization under Project Galileo, targeting a prominent independent journalism website covering stories in Russia and across Eastern Europe. We identified a DDoS attack that peaked at 7 million requests per second, with an attack duration of 7 minutes. In total, 1.9 billion DDoS requests targeting the attacked organization were mitigated that day.
  • We saw two attacks against an organization that manages vital Internet infrastructure in the Middle East. We mitigated 177 million DDoS requests targeting the organization over a three-hour period in October 2023. The second attack in December 2023 reached 42.6 million requests that were mitigated over a two-hour period.
  • We observed an attack targeting LGBT Foundation, a UK-based LGBTQ+ organization, during the beginning of Pride Month in June 2023. Cloudflare mitigated 144.7 million requests to this organization on June 2, 2023. In addition to this spike in June, we also saw another attack on August 26, 2023, which coincided with Manchester Pride. This second attack peaked at 1.46 million requests per second before finally subsiding on August 29.

This year, we broke down the dashboard into several sections:

  • Global civil society and human rights organizations
  • Global journalism and media organizations
  • Organizations based in Ukraine
  • Organizations in Israel and Palestine
  • Voting rights organizations based in the United States

Check out the full report here.

Highlights of the Report

Protecting free speech and a free press

The number of journalists imprisoned worldwide has grown in recent years. Reporters are increasingly at risk of being censored or shut down by governments or falling victim to cyberattacks. Project Galileo started as an initiative to protect free expression online. It’s grown to not only protect journalists, but also organizations working in the public interest such as voting rights groups, environmental activists, human rights defenders and more. We’ve seen journalists targeted on the Internet for various reasons, often stemming from the sensitive and impactful nature of their work. To that end, we’ve partnered with prominent organizations such as Internews, Center for International Media Assistance, International Press Institute, International Media Support, and many more to identify where our services are needed.

“Truth is the first casualty of war”

As the conflict in Ukraine continues, Cloudflare has been providing protection to journalists reporting on the conflict, human rights organizations helping refugees on the ground, and groups that have built mobile apps giving people early warnings of missile strikes.

Among them is Russian-born Galina Timchenko, co-founder, CEO, and owner of independent news outlet Meduza. A recent investigation by Access Now and the Citizen Lab reveals Timchenko had her iPhone infected with NSO Group’s Pegasus spyware during a trip to Berlin, Germany around February 10, 2023. This is the first documented case of Pegasus infection against a Russian journalist, which shows the growing suspicions among European Union governments regarding Russian civil society in exile. Labeled as an “undesirable organization” and blocked by the Russian government, Meduza operates out of Latvia to maintain editorial independence as it continues to publish news focused on covering stories in Russia and the former Soviet Union, including the conflict in Ukraine.

Meduza is an example of an important organization that lacks the resources to protect itself against intensive online attacks. On a single day in October 2023, Meduza came under DDoS attack peaking at 7 million requests per second and lasting 7 minutes—an onslaught which would have disabled the site under normal circumstances.

Protecting organizations in a time of conflict

We’ve reported on patterns of wartime violence coinciding with cyberattacks. Unfortunately, these trends have continued during the war between Israel and Hamas, and the humanitarian crisis in Gaza. Under Project Galileo, we protect a range of organizations based in the region that work to provide emergency response service, vital equipment for hospitals, crowdfunding platforms supporting the Muslim community worldwide, and more. We saw an increase in traffic after October 7, 2023, to both Israeli and Palestinian organizations, coinciding with the start of the Israel-Hamas war.

As we explored the data further, we saw an attack against a prominent organization based in the United Kingdom that works to secure Palestinian human rights, observing two dates on which there was an increase in mitigated traffic. The first, on October 15, 2023, coincided with the national demonstration in London in support of Palestine. We see in the first spike the requests go from 0 to 44,500 mitigated requests per second within two minutes. When we took a closer look, we identified that many of the requests were mitigated by Cloudflare’s Security Level, a product that uses the threat score (IP reputation) to decide whether to present a challenge to the visitor. The second spike, on February 21, 2024, coincided with UK lawmakers calling for cease-fire in the Israel-Hamas war. This peaked at 10,500 mitigations per second that lasted 40 minutes with an average of 6,638 requests per second.

As we reviewed the data, we saw two attacks against an organization that manages vital Internet infrastructure in the Middle East. Attacking infrastructure entities like domain name registries and registrars is not new, as we saw in Ukraine during the beginning of the war in March 2022, and follows an unsettling trend of targeting broad swaths of a country’s Internet infrastructure.

We saw two notable spikes in traffic, the first in October and second in December 2023. The first attack took place in three waves on October 18 and 19th, peaking around 78,500 requests per second. In total, the attack went from 2.48 million requests to 177.42 million requests mitigated per day.

On December 20-21, 2023, there was an attack that lasted more than 2 hours, averaging 8,600 requests per second throughout that period, reaching as high as 13,830 requests per second. In total, this attack saw 42.6 million daily requests mitigated.

And more…

Here we’ve provided just a snapshot of what organizations see on a daily basis when it comes to keeping their websites online. For more information on attacks against organizations protected under Project Galileo, check out the full Radar report.

If you are an organization looking for protection under Project Galileo, please visit our website: cloudflare.com/galileo.

Sabrent Apex X16 Rocket 5 Destroyer 64TB PCIe Gen5 Card Shown

Post Syndicated from Cliff Robinson original https://www.servethehome.com/sabrent-apex-x16-rocket-5-destroyer-64tb-pcie-gen5-card-shown/

The Sabrent Apex X16 Rocket 5 Destroyer is a 64TB card that uses a Microchip Switchtec PCIe Gen5 switch to provide over 50GB/s of throughput

The post Sabrent Apex X16 Rocket 5 Destroyer 64TB PCIe Gen5 Card Shown appeared first on ServeTheHome.

Modernize your data observability with Amazon OpenSearch Service zero-ETL integration with Amazon S3

Post Syndicated from Joshua Bright original https://aws.amazon.com/blogs/big-data/modernize-your-data-observability-with-amazon-opensearch-service-zero-etl-integration-with-amazon-s3/

We are excited to announce the general availability of Amazon OpenSearch Service zero-ETL integration with Amazon Simple Storage Service (Amazon S3) for domains running 2.13 and above. The integration is new way for customers to query operational logs in Amazon S3 and Amazon S3-based data lakes without needing to switch between tools to analyze operational data. By querying across OpenSearch Service and S3 datasets, you can evaluate multiple data sources to perform forensic analysis of operational and security events. The new integration with OpenSearch Service supports AWS’s zero-ETL vision to reduce the operational complexity of duplicating data or managing multiple analytics tools by enabling you to directly query your operational data, reducing costs and time to action.

OpenSearch is an open source, distributed search and analytics suite derived from Elasticsearch 7.10. OpenSearch Service currently has tens of thousands of active customers with hundreds of thousands of clusters under management processing hundreds of trillions of requests per month.

Amazon S3 is an object storage service offering industry-leading scalability, data availability, security, and performance. Organizations of all sizes and industries can store and protect any amount of data for virtually any use case, such as data lakes, cloud-centered applications, and mobile apps. With cost-effective storage classes and user-friendly management features, you can optimize costs, organize data, and configure fine-tuned access controls to meet specific business, organizational, and compliance requirements. Let’s dig into this exciting new feature for OpenSearch Service.

Benefits of using OpenSearch Service zero-ETL integration with Amazon S3

OpenSearch Service zero-ETL integration with Amazon S3 allows you to use the rich analytics capabilities of OpenSearch Service SQL and PPL directly on infrequently queried data stored outside of OpenSearch Service in Amazon S3. It also integrates with other OpenSearch integrations so you can install prepackaged queries and visualizations to analyze your data, making it straightforward to quickly get started.

The following diagram illustrates how OpenSearch Service unlocks value stored in infrequently queried logs from popular AWS log types.

You can use OpenSearch Service direct queries to query data in Amazon S3. OpenSearch Service provides a direct query integration with Amazon S3 as a way to analyze operational logs in Amazon S3 and data lakes based in Amazon S3 without having to switch between services. You can now analyze data in cloud object stores and simultaneously use the operational analytics and visualizations of OpenSearch Service.

Many customers currently use Amazon S3 to store event data for their solutions. For operational analytics, Amazon S3 is typically used as a destination for VPC Flow Logs, Amazon S3 Access Logs, AWS Load Balancer Logs, and other event sources from AWS services. Customers also store data directly from application events in Amazon S3 for compliance and auditing needs. The durability and scalability of Amazon S3 makes it an obvious data destination for many customers that want a longer-term storage or archival option at a cost-effective price point.

Bringing data from these sources into OpenSearch Service stored in hot and warm storage tiers may be prohibitive due to the size and volume of the events being generated. For some of these event sources that are stored into OpenSearch Service indexes, the volume of queries run against the data doesn’t justify the cost to continue to store them in their cluster. Previously, you would pick and choose which event sources you brought in for ingestion into OpenSearch Service based on the storage provisioned in your cluster. Access to other data meant using different tools such as Amazon Athena to view the data on Amazon S3.

For a real-world example, let’s see how using the new integration benefited Arcesium.

“Arcesium provides advanced cloud-native data, operations, and analytics capabilities for the financial services industry. Our software platform processes many millions of transactions a day, emitting large volumes of log and audit records along the way. The volume of log data we needed to process, store, and analyze was growing exponentially given our retention and compliance needs. Amazon OpenSearch Service’s new zero-ETL integration with Amazon S3 is helping our business scale by allowing us to analyze infrequently queried logs already stored in Amazon S3 instead of incurring the operational expense of maintaining large and costly online OpenSearch clusters or building ad hoc ingestion pipelines.”

– Kyle George, SVP & Global Head of Infrastructure at Arcesium.

With direct queries with Amazon S3, you no longer need to build complex extract, transform, and load (ETL) pipelines or incur the expense of duplicating data in both OpenSearch Service and Amazon S3 storage.

Fundamental concepts

After configuring a direct query connection, you’ll need to create tables in the AWS Glue Data Catalog using the OpenSearch Service Query Workbench. The direct query connection relies on the metadata in Glue Data Catalog tables to query data stored in Amazon S3. Note that tables created by AWS Glue crawlers or Athena are not currently supported.

By combining the structure of Data Catalog tables, SQL indexing techniques, and OpenSearch Service indexes, you can accelerate query performance, unlock advanced analytics capabilities, and contain querying costs. Below are a few examples of how you can accelerate your data:

  • Skipping indexes – You ingest and index only the metadata of the data stored in Amazon S3. When you query a table with a skipping index, the query planner references the index and rewrites the query to efficiently locate the data, instead of scanning all partitions and files. This allows the skipping index to quickly narrow down the specific location of the stored data that’s relevant to your analysis.
  • Materialized views – With materialized views, you can use complex queries, such as aggregations, to power dashboard visualizations. Materialized views ingest a small amount of your data into OpenSearch Service storage.
  • Covering indexes – With a covering index, you can ingest data from a specified column in a table. This is the most performant of the three indexing types. Because OpenSearch Service ingests all data from your desired column, you get better performance and can perform advanced analytics. OpenSearch Service creates a new index from the covering index data. You can use this new index for dashboard visualizations and other OpenSearch Service functionality, such as anomaly detection or geospatial capabilities.

As new data comes in to your S3 bucket, you can configure a refresh interval for your materialized views and covering indexes to provide local access to the most current data on Amazon S3.

Solution overview

Let’s take a test drive using VPC Flow Logs as your source! As mentioned before, many AWS services emit logs to Amazon S3. VPC Flow Logs is a feature of Amazon Virtual Private Cloud (Amazon VPC) that enables you to capture information about the IP traffic going to and from network interfaces in your VPC. For this walkthrough, you perform the following steps:

  1. Create an S3 bucket if you don’t already have one available.
  2. Enable VPC Flow Logs using an existing VPC that can generate traffic and store the logs as Parquet on Amazon S3.
  3. Verify the logs exist in your S3 bucket.
  4. Set up a direct query connection to the Data Catalog and the S3 bucket that has your data.
  5. Install the integration for VPC Flow Logs.

Create an S3 bucket

If you have an existing S3 bucket, you can reuse that bucket by creating a new folder inside of the bucket. If you need to create a bucket, navigate to the Amazon S3 console and create an Amazon S3 bucket with a name that is suitable for your organization.

Enable VPC Flow Logs

Complete the following steps to enable VPC Flow Logs:

  1. On the Amazon VPC console, choose a VPC that has application traffic that can generate logs.
  2. On the Flow Logs tab, choose Create flow log.
  3. For Filter, choose ALL.
  4. Set Maximum aggregation interval to 1 minute.
  5. For Destination, choose Send to an Amazon S3 bucket and provide the S3 bucket ARN from the bucket you created earlier.
  6. For Log record format, choose Custom format and select Standard attributes.

For this post, we don’t select any of the Amazon Elastic Container Service (Amazon ECS) attributes because they’re not implemented with OpenSearch integrations as of this writing.

  1. For Log file format, choose Parquet.
  2. For Hive-compatible S3 prefix, choose Enable.
  3. Set Partition logs by time to every 1 hour (60 minutes).

Validate you are receiving logs in your S3 bucket

Navigate to the S3 bucket you created earlier to see that data is streaming into your S3 bucket. If you drill down and navigate the directory structure, you find that the logs are delivered in an hourly folder and emitted every minute.

Now that you have VPC Flow Logs flowing into an S3 bucket, you need to set up a connection between your data on Amazon S3 and your OpenSearch Service domain.

Set up a direct query data source

In this step, you create a direct query data source which uses Glue Data Catalog tables and your Amazon S3 data. The action creates all the necessary infrastructure to give you access to the Hive metastore (databases and tables in Glue Data Catalog and the data housed in Amazon S3 for the bucket and folder combination you want the data source to have access to. It will also wire in all the appropriate permissions with the Security plugin’s fine-grained access control so you don’t have to worry about permissions to get started.

Complete the following steps to set up your direct query data source:

  1. On the OpenSearch Service domain, choose Domains in the navigation pane.
  2. Choose your domain.
  3. On the Connections tab, choose Create new connection.
  4. For Name, enter a name without dashes, such as zero_etl_walkthrough.
  5. For Description, enter a descriptive name.
  6. For Data source type, choose Amazon S3 with AWS Glue Data Catalog.
  7. For IAM role, if this is your first time, let the direct query setup take care of the permissions by choosing Create a new role. You can edit it later based on your organization’s compliance and security needs. For this post, we name the role zero_etl_walkthrough.
  8. For S3 buckets, use the one you created.
  9. Do not select the check box to grant access to all new and existing buckets.
  10. For Checkpoint S3 bucket, use the same bucket you created. The checkpoint folders get created for you automatically.
  11. For AWS Glue tables, because you don’t have anything that you have created in the Data Catalog, enable Grant access to all existing and new tables.

The VPC Flow Logs OpenSearch integration will create resources in the Data Catalog, and you will need access to pick those resources up.

  1. Choose Create.

Now that the initial setup is complete, you can install the OpenSearch integration for VPC Flow Logs.

Install the OpenSearch integration for VPC Flow Logs

The integrations plugin contains a wide variety of prebuilt dashboards, visualizations, mapping templates, and other resources that make visualizing and working with data generated by your sources simpler. The integration for Amazon VPC installs a variety of resources to view your VPC Flow Logs data as it sits in Amazon S3.

In this section, we show you how to make sure you have the most up-to-date integration packages for installation. We then show you how to install the OpenSearch integration. In most cases, you will have the latest integrations such as VPC Flow Logs, NGINX, HA Proxy, or Amazon S3 (access logs) at the time of the release of a minor or major version. However, OpenSearch is an open source community-led project, and you can expect that there will be version changes and new integrations not yet included with your current deployment.

Verify the latest version of the OpenSearch integration for Amazon VPC

You may have upgraded from earlier versions of OpenSearch Service to OpenSearch Service version 2.13. Let’s confirm that your deployment matches what is present in this post.

On OpenSearch Dashboards, navigate to the Integrations tab and choose Amazon VPC. You will see a release version for the integration.

Confirm that you have version 1.1.0 or higher. If your deployment doesn’t have it, you can install the latest version of the integration from the OpenSearch catalog. Complete the following steps:

  1. Navigate to the OpenSearch catalog.
  2. Choose Amazon VPC Flow Logs.
  3. Download the 1.1.0 Amazon VPC Integration file from the repository folder labeled amazon_vpc_flow_1.1.0.
  4. In the OpenSearch Dashboard’s Dashboard Management plugin, choose Saved objects.
  5. Choose Import and browse your local folders.
  6. Import the downloaded file.

The file contains all the necessary objects to create an integration. After it’s installed, you can proceed to the steps to set up the Amazon VPC OpenSearch integration.

Set up the OpenSearch integration for Amazon VPC

Let’s jump in and install the integration:

  1. In OpenSearch Dashboards, navigate to the Integrations tab.
  2. Choose the Amazon VPC integration.
  3. Confirm the version is 1.1.0 or higher and choose Set Up.
  4. For Display Name, keep the default.
  5. For Connection Type, choose S3 Connection.
  6. For Data Source, choose the direct query connection alias you created in prior steps. In this post, we use zero_etl_walkthrough.
  7. For Spark Table Name, keep the prepopulated value of amazon_vpc_flow.
  8. For S3 Data Location, enter the S3 URI of your log folder created by VPC Flow Logs set up in the prior steps. In this post, we use s3://zero-etl-walkthrough/AWSLogs/.

S3 bucket names are globally unique, and you may want to consider using bucket names that conform to your company’s compliance guidance. UUIDs plus a descriptive name are good options to guarantee uniqueness.

  1. For S3 Checkpoint Location, enter the S3 URI of your checkpoint folder which you define. Checkpoints store metadata for the direct query feature. Make sure you pick any empty or unused path in the bucket you choose. In this post, we use s3://zero-etl-walkthrough/CP/, which is in the same bucket we created earlier.
  2. Select Queries (recommended) and Dashboards and Visualizations for Flint Integrations using live queries.

You get a message that states “Setting Up the Integration – this can take several minutes.” This particular integration sets up skipping indexes and materialized views on top of your data in Amazon S3. The materialized view aggregates the data into a backing index that occupies a significantly smaller data footprint in your cluster compared to ingesting all the data and building visualizations on top of it.

When the Amazon VPC integration installation is complete, you have a broad variety of assets to play with. If you navigate to the installed integrations, you will find queries, visualizations, and other assets that can help you jumpstart your data exploration using data sitting on Amazon S3. Let’s look at the dashboard that gets installed for this integration.

I love it! How much does it cost?

With OpenSearch Service direct queries, you only pay for the resources consumed by your workload. OpenSearch Service charges for only the compute needed to query your external data as well as maintain optional indexes in OpenSearch Service. The compute capacity is measured in OpenSearch Compute Units (OCUs). If no queries or indexing activities are active, no OCUs are consumed. The following table contains sample compute prices based on searching HTTP logs in IAD.

Data scanned per query (GB) OCU price per query (USD)
1-10 $0.026
100 $0.24
1000 $1.35

Because the price is based on the OCUs used per query, this solution is tailored for infrequently queried data. If your users query data often, it makes more sense to fully ingest into OpenSearch Service and take advantage of storage optimization techniques such as using OR1 instances or UltraWarm.

OCUs consumed by zero-ETL integrations will be populated in AWS Cost Explorer. This will be at the account level. You can account for OCU usage at the account level and set thresholds and alerts when thresholds have been crossed. The format of the usage type to filter on in Cost Explorer is RegionCode-DirectQueryOCU (OCU-hours). You can create a budget using AWS Budgets and configure an alert to be notified when DirectQueryOCU (OCU-Hours) usage meets the threshold you set. You can also optionally use an Amazon Simple Notification Service (Amazon SNS) topic with an AWS Lambda function as a target to turn off a data source when a threshold criterion is met.

Summary

Now that you have a high-level understanding of the direct query connection feature, OpenSearch integrations, and how the OpenSearch Service zero-ETL integration with Amazon S3 works, you should consider using the feature as part of your organization’s toolset. With OpenSearch Service zero-ETL integration with Amazon S3, you now have a new tool for event analysis. You can bring hot data into OpenSearch Service for near real-time analysis and alerting. For the infrequently queried, larger data, mainly used for post-event analysis and correlation, you can query that data on Amazon S3 without moving the data. The data stays in Amazon S3 for cost-effective storage, and you access that data as needed without building additional infrastructure to move the data into OpenSearch Service for analysis.

For more information, refer to Working with Amazon OpenSearch Service direct queries with Amazon S3.


About the authors

Joshua Bright is a Senior Product Manager at Amazon Web Services. Joshua leads data lake integration initiatives within the OpenSearch Service team. Outside of work, Joshua enjoys listening to birds while walking in nature.

Kevin Fallis is an Principal Specialist Search Solutions Architect at Amazon Web Services. His passion is to help customers leverage the correct mix of AWS services to achieve success for their business goals. His after-work activities include family, DIY projects, carpentry, playing drums, and all things music.


Sam Selvan
is a Principal Specialist Solution Architect with Amazon OpenSearch Service.

[$] Measuring and improving buffered I/O

Post Syndicated from jake original https://lwn.net/Articles/976856/

There are two types of file I/O on Linux, buffered I/O, which goes through
the page cache, and direct I/O, which goes directly to the storage device.
The performance of buffered I/O was reported to be a lot worse than direct
I/O, especially for one specific test, in Luis Chamberlain’s
topic
proposal
for a session at the 2024 Linux Storage,
Filesystem, Memory Management, and BPF Summit
.
The proposal resulted in a lengthy mailing-list discussion,
which also came up in Paul McKenney’s RCU session the next
day; Chamberlain led a
combined storage and filesystem session to discuss those results with an
eye toward improving buffered I/O performance.

Kali Linux 2024.2 released

Post Syndicated from jzb original https://lwn.net/Articles/977303/

Version 2024.2 of the Kali Linux penetration testing distribution
has been released. This
release includes an update to GNOME
46
, a high-resolution (HiDPI) mode for Xfce, as well as a number
of new packages such as the AutoRecon network
reconnaissance tool, pspy command-line utility for
snooping on Linux processes, and SploitScan tool for
fetching and displaying CVE information. Kali Linux is based on Debian
testing, and 2024.2 incorporates Debian’s work to transition to 64-bit
time_t
to avoid year 2038 problems. Users with existing Kali
systems should be sure to follow the documentation
when upgrading.

Our brand-new cohort of AWS Heroes has arrived – June 2024

Post Syndicated from Taylor Jacobsen original https://aws.amazon.com/blogs/aws/our-brand-new-cohort-of-aws-heroes-has-arrived-june-2024/

The vibrant AWS community is made up of millions of builders worldwide. Within this global audience, there are technical enthusiasts who are going above and beyond to solve problems and generously share their learnings and best practices to empower others—the AWS Heroes. These inspirational leaders make significant contributions, and the AWS Heroes program is our way of recognizing and highlighting their impactful efforts.

Please join us in celebrating our newest group of AWS Heroes!

Arshad Zackeriya – Wellington, New Zealand

Community Hero Arshad Zackeriya is a Senior Engineer at Xero, specializing in empowering organizations to deliver software at high velocity. He is well-known in the community as “Zack,” and his expertise primarily centers around Amazon EKS and developer tools. Zack is also a public speaker, and serves as one of the co-organizers and leaders for the Wellington Chapter in the AWS User Group Aotearoa New Zealand. Additionally, he was an AWS New Voices Coach and was an AWS Community Builder for five consecutive years, earning recognition as a nominee for the AWS Community Builder of the Year for 2022 and 2023 in the APJ region.

Julia Furst Morgado – New York, USA

Container Hero Julia Furst Morgado is a Global Technologist on the Product Strategy team in the Office of the CTO at Veeam Software. She is committed to diversity and inclusion, and her passion lies in making Cloud Native technologies and DevOps best practices easier to understand by sharing her knowledge. Julia excels in evangelizing and creating engaging content focused on Amazon EKS, and presenting at major events about Amazon EKS Blueprints and Amazon EKS security. Additionally, she co-organizes the AWS Community Day New York, Kubernetes Community Days, and the AWS User Group Lisbon – Women in Tech chapter, fostering vibrant collaboration and learning opportunities.

Paloma Lataliza – Belo Horizonte, Brazil

Community Hero Paloma Lataliza is a Cloud Engineer with over six years of experience. She has a bachelor’s degree in Computer Science, specialized in Cloud Computing, is an enthusiast of container technologies and passionate about technology and sharing knowledge. Paloma is a leader of the AWS User Group Minas Gerais, and she is dedicated to mentoring women by providing a supportive network and offering them free classes to make tech more accessible. This is further demonstrated as the organizer of the AWSome Women Community Summit Brazil, and founder of the Mulheres na Nuvem Minas Gerais (Women in the Cloud Minas Gerais) project. Previously, she was an AWS Community Builder, producing technical content, speaking at Cloud and DevOps events, and mentoring those eager to deepen their technical skills.

Shaoyi Li – Shenzhen, China

Community Hero Shaoyi Li is a Lead Cloud Engineer focusing on cybersecurity and generative AI, advocating for cloud generative AI security and governance solutions to help the community build secure, compliant, and responsible generative AI applications. He is a regular speaker at AWS events, such as AWS Summits, AWS Community Days, and AWS User Group Meetups. Shaoyi also shares his insights into AWS technologies through various channels, including AWS case studies, AWS blogs, AWS WeChat channels, community.aws, and on his social networks.

Vishal Alhat – Pune, India

Community Hero Vishal Alhat is a Senior Software Engineer at Forcepoint, a leading cybersecurity company, where he leverages his 9+ years of experience to play a key role in cloud-based deployments. He focuses on cloud security and DevOps using AWS, implementing DevOps tools, AWS services, and best practices to automate deployments and ensure consistency across Forcepoint’s cloud infrastructure. Vishal is passionate about sharing his knowledge and was selected as the AWS Community Builder of the Year for the APJ region, which is a testament to his dedication. Furthermore, he is the AWS User Group Pune leader, and regularly speaks at conferences, meetups, AWS Community Days, and AWS Summits worldwide.

Learn More

Please visit the AWS Heroes website if you’d like to learn more about the AWS Heroes program or to connect with a Hero near you.

Taylor

[$] Rethinking the PostgreSQL CommitFest model

Post Syndicated from jzb original https://lwn.net/Articles/976793/

Many years ago, the PostgreSQL project started holding regular CommitFests to
help tackle the work of reviewing and committing patches in a more
organized fashion. That has served the project well, but some in
the project are concerned that CommitFests are no longer meeting
the needs of PostgreSQL or its contributors. A lengthy discussion on the
pgsql-hackers mailing list turned up a number of complaints, a few
suggestions for improvement, but little consensus or momentum toward
a solution.

[$] Removing GFP_NOFS

Post Syndicated from jake original https://lwn.net/Articles/976355/

The GFP_NOFS flag is meant for kernel memory allocations that
should not cause a call into the filesystems to reclaim memory because there are
already locks held that can potentially cause a deadlock. The “scoped
allocation” API is a better choice for filesystems to indicate that they
are holding a lock, so GFP_NOFS has long been on the chopping block, though
progress has been slow. In a filesystem-track session at
the 2024 Linux Storage,
Filesystem, Memory Management, and BPF Summit
, Matthew Wilcox wanted to
discuss how to move kernel filesystems away from the flag with the eventual
goal of removing it completely.