Version
1.82.0 of the Rust language has been released. There are a lot of new
features this time, including a cargo info command, tier-1 support
for 64-bit Apple Arm systems, a new native syntax (&raw) to create
raw pointers, changes to unsafe extern, unsafe attributes,
standardized rules around the handling of floating-point not-a-number
values, and more.
Attention all developers, architects, and IT professionals! We’re thrilled to announce the launch of the official Amazon OpenSearch Service YouTube channel—a comprehensive resource for anyone looking to master Amazon OpenSearch Service. Whether you’re just getting started with searches , vectors, analytics, or you’re looking to optimize large-scale implementations, our channel can be your go-to resource to help you unlock the full potential of OpenSearch Service.
OpenSearch is a distributed search and analytics suite that is open source, community-driven, Apache License v2 licensed, and governed by the OpenSearch Software Foundation, under the Linux Foundation.
Amazon OpenSearch Service is a managed service that makes it straightforward to deploy, operate, and scale OpenSearch domains in AWS. OpenSearch Service offers a robust set of features that can transform the way you handle log analytics, real-time monitoring, vector search, and advanced search workloads. But to truly unlock its full potential, you need more than just the basics. That’s where our new YouTube channel comes in.
Dive into a world of practical expertise
We’ve carefully curated a collection of videos that are designed to provide you with the tools, techniques, and insights you need to navigate OpenSearch Service with confidence. The channel also offers a direct line of communication between you and the AWS team. By leaving comments on our videos, you can share your feedback, ideas, and pain points. We’ll be closely monitoring these comments and using them to shape the content we create and influence the future roadmap of OpenSearch Service.
Here’s what sets our channel apart:
Bite-sized learning – Our videos are short and concise—each one packed with practical information that you can consume in under 15 minutes. Whether you’re looking for a quick tutorial or a deep-dive into advanced features, we make it effortless for you to learn on the go.
Curated content – We hand-pick the most important topics around OpenSearch Service and break them down into simple-to-follow, informative videos. From configuring clusters to scaling for petabyte-scale analytics, we cover the most relevant use cases to help you build, manage, and optimize your OpenSearch environment.
Organized playlists – The channel is organized into playlists based on workloads and features of OpenSearch Service such as log analytics, observability, lexical search, vector search, generative AI, and more.
Influence the AWS team – You can leave comments on our videos, and your feedback will be reviewed by the AWS team. This input allows us to work backward from your feedback to influence the content we create and feed into the product roadmap.
What you’ll learn
On the OpenSearch Service YouTube channel, you can expect new content regularly, including:
Log Analytics and Observability
Learn how to ingest, search, and visualize logs at scale with OpenSearch, making log analytics efficient and powerful for enterprises of all sizes. Gain deep insights into using OpenSearch Service for observability, including infrastructure monitoring, application performance management (APM), and more.
Lexical and Semantic Search
Discover the key differences between lexical and semantic search, and learn how to implement both in OpenSearch Service. We’ll cover optimizing search relevancy, handling complex queries, using machine learning models for semantic understanding and much more.
Vector Database & GenAI
Explore OpenSearch Service’s vector database capabilities to power advanced semantic search and AI-driven applications. Learn how generative AI models can enhance your search solutions.
Operational Best Practices
Learn the best practices for running OpenSearch Service in production, covering everything from security and scaling to performance tuning and cost management.
And More
Expect a wide array of content, including deep dives into new features, architecture best practices, how to demo videos, use case showcases, and interviews with industry experts.
Subscribe to stay ahead
Whether you’re a beginner looking to get started or an experienced professional seeking to optimize your workflows, make sure to subscribe to the OpenSearch Service YouTube channel so you don’t miss out on the latest tutorials, insights, and updates. Get ready to elevate your search and analytics skills and be part of shaping the future of this channel and powerful service.
About the Authors
Jagadish Kumar (Jag) is a Senior Specialist Solutions Architect at AWS focused on Amazon OpenSearch Service. He is deeply passionate about Data Architecture and helps customers build analytics solutions at scale on AWS.
Sohaib Katariwala is a Senior Specialist Solutions Architect at AWS focused on Amazon OpenSearch Service. He has over 14 years of experience helping organizations derive insights from their data.
Wendy Neu is a Senior Manager at AWS focused on leading the NoSQL Specialist Solutions Architecture team worldwide. She is passionate about Data Services and leverages her extensive expertise to help customers optimize their data storage, management, and analytics strategies, enabling them to drive innovation and achieve their business goals.
Email has become somewhat unfashionable as a collaboration tool for
open-source projects, but there are still a number of projects—such as
PostgreSQL and the Linux kernel—that expect contributors to send and
review patches via email. The aerc
mail client is aimed at developers looking for a text-based, efficient, and
extensible client that is meant to be used for working with Git and
email. It uses Vim-style keybindings by default, and has an interface
inspired by tmux that
lets users manage multiple accounts, mails, and embedded terminals at once.
Amazon Kinesis Data Analytics for SQL is a data stream processing engine that helps you run your own SQL code against streaming sources to perform time series analytics, feed real-time dashboards, and create real-time metrics. AWS has made the decision to discontinue Kinesis Data Analytics for SQL, effective January 27, 2026. In this post, we explain why we plan to end support for Kinesis Data Analytics for SQL, alternative AWS offerings, and how to migrate your SQL queries and workloads.
Overview of Kinesis Data Analytics for SQL
The following diagram illustrates the workflow for using Kinesis Data Analytics for SQL.
Kinesis Data Analytics for SQL has been denoted a legacy offering since 2021 on our marketing pages, the AWS Management Console, and public documentation. In this time, we haven’t added new functionality or expanded Kinesis Data Analytics for SQL to new AWS Regions. However, we continue to actively maintain and patch the offering and support customers using the service. We will continue to undertake these activities.
To help you plan and migrate away from Kinesis Data Analytics for SQL, we will discontinue the offering gradually:
On October 15, 2025, you won’t be able to create new Kinesis Data Analytics for SQL applications from this time, but will be able to run any existing applications as normal.
We will delete any remaining customer applications on January 27, 2026. You won’t be able to start or operate your Kinesis Data Analytics for SQL applications and support will no longer be available for Kinesis Data Analytics for SQL from this time.
Overview of Managed Service for Apache Flink and Apache Flink Studio
Amazon Managed Service for Apache Flink is a serverless, low-latency, highly scalable, and highly available real-time stream processing service. Apache Flink is a distributed open source engine for processing data streams. These managed Flink-based offerings provide functionality not available in Kinesis Data Analytics for SQL and can help you build end-to-end streaming pipelines and maintain the accuracy and timeliness of data. For example, Amazon Managed Service for Apache Flink supports built-in scaling, exactly-once processing semantics, multi-language support (including SQL), over 40 source and destination connectors, durable application state, and more
We see customers migrating their Kinesis Data Analytics for SQL workloads to take advantage of the advanced features available with managed Flink offerings. Customers running SQL queries typically select Amazon Managed Service for Apache Flink Studio. Amazon Managed Service for Apache Flink Studio allows you to create a notebook, which is a web-based development environment. With notebooks, you get a simple interactive development experience combined with the advanced capabilities provided by Flink. Amazon Managed Service for Apache Flink Studio uses Apache Zeppelin as the notebook, and uses Flink as the stream processing engine. Amazon Managed Service for Apache Flink Studio notebooks seamlessly combine these technologies to make advanced analytics on data streams accessible to developers of all skill sets. Notebooks are provisioned quickly and provide a way for you to instantly view and analyze your streaming data. Zeppelin provides your Amazon Managed Service for Apache Flink Studio notebooks with a complete suite of analytics tools, including the following capabilities:
Visualizing data
Exporting data to files
Controlling the output format for straightforward analysis
Turning the notebook into a scalable, production application
The following diagram illustrates a common workflow for Managed Service for Apache Flink.
Unlike Kinesis Data Analytics for SQL, Managed Service for Apache Flink adds the following SQL support:
Real-time visualization of transformed data in a data stream
Using Python scripts or Scala programs within the same application
Changing offsets of the streaming layer
Another benefit of Amazon Managed Service for Apache Flink is the improved scalability of the solution post-deployment, because you can scale the underlying resources to meet demand. In Kinesis Data Analytics for SQL, scaling is performed by adding more pumps to persuade the application into adding more resources.
Migrate to Managed Service for Apache Flink
For more information about migrating Kinesis Data Analytics for SQL to Amazon Managed Service for Apache Flink Studio, see Migrate from Amazon Kinesis Data Analytics for SQL Applications to Amazon Managed Service for Apache Flink Studio. Additionally, we have provided guidance in our public documentation, including sample code for how to recreate 17 common Kinesis Data Analytics for SQL queries in Amazon Managed Service for Apache Flink Studio, which we will continue to expand over time. We have created step by step migration guidance for customers using Amazon Data Firehose as a source, or who want to use user-defined functions in Amazon Managed Service for Apache Flink . We also provide documentation to help customers migrating machine learning workloads from Kinesis Data Analytics for SQL to Amazon Managed Service for Apache Flink.
Conclusion
In this post, we outlined how we plan to discontinue Kinesis Data Analytics for SQL and why we’re taking these steps. We recommend migrating your Kinesis Data Analytics for SQL workloads to Amazon Managed Service for Apache Flink or Apache Flink Studio, and we have provided resources to help you get started with your migration. If you need more help, you can ask questions in re:Post, making sure to tag Kinesis Data Analytics for SQL.
About the author
Julian Payne is a Principal Product Manager at AWS. He is passionate about building products and features to help customers innovate using real-time data processing applications in the cloud. Outside of work he writes and illustrates graphic novels.
Greg Kroah-Hartman has announced the release of the 6.11.4, 6.6.57, 6.1.113, 5.15.168, and 5.10.227 stable kernels. As usual, this set
of updates contains a long list of important fixes throughout the kernel
tree.
Напоследък темата с незаконните подслушвания пак става актуална. Затова ще обобщя информация за методите за подслушване, които са на разположение на държавните органи, а част от тях – и на частни субекти.
Започвам с уточнението, че подслушването може да бъде законно, за целите на наказателното преследване при тежки престъпления и на защитата на националната сигурност, а Конституцията го разрешава в определени от закона случаи. Частните субекти, обаче, не трябва да могат да използват нито един от долните механизми, поради липсата на какъвто и да било контрол. Ето възможните начини:
1. Подслушване чрез технически устройства, напр. чрез поставяне на подслушвателно устройство в кабинет/жилище; насочени микрофони към прозорец; записващи устройства, носени от лица (напр. свидетели) (чл. 6 от Закона за специалните разузнавателни средства)
2. Прихващане на телефонни разговори и съобщения чрез фалшива мобилна клетка в близост до мобилното устройство (отново приложим е чл. 6 от ЗСРС)
3. Подслушване на смартфон чрез шпионски софтуер като Pegasus или Predator (също предполагам приложим е чл. 6 от ЗСРС)
4. Подслушване на телефонни разговори и съобщения чрез прихващащи интерфейси в ДАТО и ДАНС, които се „закачат“ директно към телекомите (чл. 304-310 от Закона за електронните съобщения)
Подслушвателните устройства са дълга тема, която не засяга мобилните устройства, за разлика от останалите три, затова ще я оставия настрана.
Прихващане на мобилна комуникация чрез фалшива клетка (т.нар. cell-site simulator / IMSI-catcher / Stingray) е нещо, от което не можем да се предпазим, но можем да засичаме по косвени белези (поради което наскоро споделих едно приложение, което с екип доброволци разработваме). Ако си изключим 2G поддръжката от телефона, тези атаки стават по-трудни и започват да разчитат на изтичане на криптографски ключове от телекоми. Дали това се случва в България – не знам.
Подслушването със шпионски софтуер е скъпо, поради което само цели с много висок интерес биха попаднали в обхвата му. Там има два вида атаки: 0-click (когато просто ти „превземат“ телефона без да разбереш, но които не винаги работят, защото 0-click уязвимостите са рядкост) и 1-click (които разчитат на това жертвата да натисне линк). Не ми е известно българската държава да използва такъв софтуер, но има слухове за частни клиенти. Двата популярни (Pegasus и Predator) са в черните списъци на САЩ, а лица, свързани с тях влизат в санкционни списъци. Тук интересното е, че дъщерно дружество на NSO Group (производителят на Pegasus) функционира в България и изнася софтуер и хардуер за подслушване към трети страни, с разрешения от съответния държавен орган, а санкционирани лица покрай Predator имат/са имали фирми в България.
Последният начин е най-лесен за службите – т.нар. законно прихващане (legal interception) включва задължение на всеки оператор да предостави „прихващащ интерфейс“ към службите (ДАТО и ДАНС), които, образно казано, могат да започнат да слушат разговорите и sms-ите на всеки, чийто телефонен номер бъде въведен „в системата“, като телекомите не получават информация за това. Това е уредено в чл. 304 до 310 от Закона за електронните съобщения в далечната 2007 г. Този подход не може да бъде засечен и по косвени белези, както фалшивата клетка. Това засяга единствено гласовата комуникация и не може да се използва за криптирани приложения като Signal.
Законът приравнява това прихващане на специално разузнавателно средство, т.е. за да се извърши, трябва или предварително разрешение от съд, или в случаи на неотложност – одобрение в рамките на 24 часа след започване. Т.е. на теория, имаме защита срещу неправомерно подслушване по този начин. Това, обаче, има две слабости.
Първата е, че разрешенията за СРС се дават от дежурен административен ръководител или негов заместник, т.е. доста е ограничен кръга на лицата, които разрешават, а те пък се избират от Висшия съдебен съвет. Т.е. ако имаш влияние върху административните ръководители, имаш и бланкетни, понякога незаконосъобразни разрешения за подслушване.
Втората е, че в живия живот правилата и реалностите се разминават. Ако има техническа възможност да подслушаш нечии разговори, е необходим значителен контрол, за да го правиш винаги само със съдебно решение, особено ако това след това няма да се ползва за целите на наказателното преследване, а за компромати и изнудване.
Това означава, че трябва да има пълна проследимост, с невъзможност за изтриване на следи, на всяко „включване“ на прихващащите интерфейси, където номера на разрешението на съда да е задължителен параметър. Освен това трябва да има външен контрол, който по принцип се осъществява от Националното бюро за контрол на СРС. То контролира прилагането на всички СРС-та, но пък няма правомощия по Закона за електронните съобщения, поради което съм изпратил запитване дали и как осъществяват външния контрол върху тази процедура. Припомням, че освен Пеевски, санкции по Магнитски получи и Илко Желязков, известен като един от „лейтенантите на Пеевски“ – до освобождаването му след попадането му под санкциите, той е бил заместник-председател на бюрото за контрол (или вероятно, в неговия случай, за „замитане“).
Отделно от това зададох писмен въпрос на премиера Главчев (който отговаря и за двете агенции – ДАТО и ДАНС), какви вътрешни механизми за предотвратяване на злоупотреби се прилагат. Защото ако тези механизми не работят, или могат да се заобикалят по някакъв начин, и някой (напр. Пеевски), има влияние върху ключови служители в някоя от двете агенции, то това би значело, че има устойчив източник на компромати, с които да увеличава влиянието си в законодателната, изпълнителната и съдебната власт.
Отговорите от Главчев и от бюрото за контрол на СРС ще пристигнат вероятно следващата седмица, като ще ви информирам за това дали има адекватен вътрешен и външен контрол върху прихващането по Закона за електронните съобщения. С цялата получена информация – както сега, така и покрай убийството на „Нотариуса“, ще поправим дупките в законите, които позволяват злоупотреби с подслушване.
During a recent visit to the Defense Advanced Research Projects Agency (DARPA), I mentioned a trend that piqued their interest: Over the last 10 years of applying automated reasoning at Amazon Web Services (AWS), we’ve found that formally verified code is often more performant than the unverified code it replaces.
The reason is that the bug fixes we make during the process of formal verification often positively impact the code’s runtime. Automated reasoning also gives our builders confidence to explore additional optimizations that improve system performance even further. We’ve found that formally verified code is easier to update, modify, and operate, leading to fewer late-night log analysis and debugging sessions. In this post, I’ll share three examples that came up during my discussions with DARPA.
Automated reasoning: The basics
At AWS, we strive to build services that are simple and intuitive for our customers. Underneath that simplicity lie vast, complex distributed systems that process billions of requests every second. Verifying the correctness of these complex systems is a significant challenge. Our production services are in a constant state of evolution as we introduce new features, redesign components, enhance security, and optimize performance. Many of these changes are complex themselves, and must be made without impacting the security or resilience of AWS or our customers.
Design reviews, code audits, stress testing, and fault injection are all invaluable tools we use regularly, and always will. However, we’ve found that we need to supplement these techniques in order to confirm correctness in many cases. Subtle bugs can still escape detection, particularly in large-scale, fault-tolerant architectures. And some issues might even be rooted in the original system design, rather than implementation flaws. As our services have grown in scale and complexity, we’ve had to supplement traditional testing approaches with more powerful techniques based on math and logic. This is where the branch of artificial intelligence (AI) called automated reasoning comes into play.
While traditional testing focuses on validating system behavior under specific scenarios, automated reasoning aims to use logic to verify system behavior under any possible scenario. In even a moderately complex system, it would take an intractably large amount of time to reproduce every combination of possible states and parameters that may occur. With automated reasoning, it’s possible to achieve the same effect quickly and efficiently by computing a logical proof of the correctness of the system.
Using automated reasoning requires our builders to have a different mindset. Instead of trying to think about all possible input scenarios and how they might go wrong, we define how the system should work and identify the conditions that must be met in order for it to behave correctly. Then we can verify that those conditions are true by using mathematical proof. In other words, we can verify that the system is correct.
Automated reasoning views a system’s specification and implementation in mathematics, then applies algorithmic approaches to verify that the mathematical representation of the system satisfies the specification. By encoding our systems as mathematical systems and reasoning about them using formal logic, automated reasoning allows us to efficiently and authoritatively answer critical questions about the systems’ future behavior. What can the system do? What will it do? What can it never do? Automated reasoning can help answer these questions for even the most complex, large-scale, and potentially unbounded systems—scenarios that are impossible to exhaustively validate through traditional testing alone.
Does automated reasoning allow us to achieve perfection? No, because it still depends on certain assumptions about the correct behavior of the components of a system and the relationship between the system and the model of its environment. For example, the model of a system might incorrectly assume that underlying components such as compilers and processors don’t have any bugs (although it is possible to formally verify those components as well). That said, automated reasoning allows us to achieve higher confidence in correctness than is possible by using traditional software development and testing methods.
Faster development
Automated reasoning is not just for mathematicians and scientists. Our Amazon Simple Storage Service (Amazon S3) engineers use automated reasoning every day to prevent bugs. Behind the simple interface of S3 is one of the world’s largest and most complex distributed systems, holding 400 trillion objects, exabytes of data, and regularly processing over 150 million requests per second. S3 is composed of many subsystems that are distributed systems in their own right, many consisting of tens of thousands of machines. New features are being added all the time, while S3 is under heavy use by our customers.
A key component of S3 is the S3 index subsystem, an object metadata store that enables fast data lookups. This component contains a very large, complex data structure and intricate, optimized algorithms. Because the algorithms are difficult for humans to get right at S3 scale, and because we can’t afford errors in S3 lookups, we made new improvements on a cadence of about once per quarter, due to the extreme care and extensive testing required to confidently make a change.
S3 is a well-built and well-tested system built on 15 years of experience. However, there was a bug in the S3 index subsystem for which we couldn’t determine the root cause for some time. The system was able to automatically recover from the exception, so its presence didn’t impact the behavior of the system. Still, we were not satisfied.
Why was this bug around so long? Distributed systems like S3 have a large number of components, each with their own corner cases, and a number of corner cases happen at the same time. In the case of S3, which has over 300 microservices, the number of potential combinations of these corner cases is enormous. It’s not possible for developers to think through each of these corner cases, even when they have evidence the bug exists and ideas about its root cause—never mind all of the possible combinations of corner cases.
This complexity drove us to look at how we could use automated reasoning to explore the possible states and errors that might be hidden in those states. By building a formal specification of the system, we were able to find the bug and prove the absence of further bugs of its type. Using automated reasoning also gave us the confidence to ship updates and improvements every one to two months rather than just three to four times a year.
Faster code
The correctness of the AWS Identity and Access Management (IAM) service is foundational to the security of our customers’ workloads. Across millions of customers, thousands of resource types, and hundreds of AWS services, every API call—every single request to AWS—is processed by the IAM authorization engine. That’s over 1.2 billion requests per second. This is some of the most security-critical and highly scaled software in AWS.
Before any change at AWS goes into production, we need an extremely high degree of confidence that the system remains secure and correct. Using automated reasoning, we can prove that our systems adhere to specific security properties, under an exhaustive number of circumstances. We call this provable security. Not only has automated reasoning enabled us to provide provable security assurance to our customers, it gives us the ability to deliver functionality, security, and optimization at scale.
Like S3, IAM has evolved over 15 years into a time-tested and trusted system. But we wanted to raise the bar further. We built a formal specification that captures the behavior of the existing IAM authorization engine, codified its policy evaluation principles into provable theorems, and used automated reasoning to build a new and more efficient implementation. Earlier this year, we deployed the new proved-correct authorization engine —and no one noticed. Automated reasoning allowed us to seamlessly replace one of the most critical pieces of AWS infrastructure, the authorization engine, with a proved-correct equivalent.
With the specification and proofs in place, we could safely and aggressively optimize the code with a high degree of confidence. At the massive scale of IAM, every microsecond of performance improvement translates into a better customer experience and better cost optimization for AWS. We optimized string matching, removed unnecessary memory allocation and redundant computations, strengthened security, and improved scalability. After every change, we re-ran our proofs to confirm that the system was still operating correctly.
The optimized IAM authorization engine is now 50% faster than its predecessor. We simply would not have been able to make these types of impactful optimizations with such confidence if we didn’t use automated reasoning. For a deeper look at how we did this, see this AWS re:Inforce session.
Faster deployment (of faster code)
Most secure online transactions are protected by encryption. For example, the RSA encryption algorithm protects data by generating two keys: one to encrypt the data, and one to decrypt it. These keys enable secure data transmission as well as secure digital signatures. In the context of encryption, correctness and performance are both essential—a bug in an encryption algorithm can be disastrous.
As AWS customers move their workloads to AWS Graviton, the benefits of optimizing cryptography for the ARM instruction set increase. But optimizing encryption for better performance is complex, which makes it difficult to verify that modified encryption algorithms are behaving properly. Before we started to use automated reasoning, optimizations to cryptography libraries often required months-long reviews to achieve confidence for release into production.
Over the last decade, we’ve increasingly applied automated reasoning techniques within AWS to prove the correctness of our cloud infrastructure and services. We routinely use these methods not only to verify correctness, but also to enhance security and reliability and minimize design flaws. Automated reasoning can be used to create a precise, testable model of a system, which we can use to quickly verify that changes are safe—or learn they are unsafe without causing harm in production.
We can answer critical questions about our infrastructure to detect misconfigurations that might expose data. We can help stop subtle but serious bugs from reaching production that we would not have found with other techniques. We can make bold performance optimizations that we would not have dared attempt without model checking. Automated reasoning provides rigorous mathematical assurance that critical systems behave as expected.
AWS is the first and only cloud provider to use automated reasoning at this scale. As adoption of automated reasoning tools increases, it becomes easier for us to justify ever-larger investments into improving the usability and scalability of automated reasoning tools. The easier it is to use the automated reasoning tools and the more powerful they become, the more adoption we’ve observed. The more we’re able to prove correctness of our cloud infrastructure, the more compelling the cloud is to security-obsessed customers. And, as the examples in this post illustrate, not only are we able to increase security assurance, we are delivering higher performant code to customers faster, translating into cost savings that we can eventually pass on to customers.
My prediction is that we’re in the beginning of an era in which critical properties like security, compliance, availability, durability, and safety can be proved automatically for large-scale cloud architectures. From preventing potential issues with AI hallucinations to analyzing hypervisors, cryptography, and distributed systems, having sound mathematical reasoning at our foundations and continuously analyzing what we build sets Amazon apart.
Hono is a fast, lightweight web framework that runs anywhere JavaScript does, built with Web Standards. Of course, it runs on Cloudflare Workers.
It was three years ago, in December 2021. At that time, I wanted to create applications for Cloudflare Workers, but the code became verbose without using a framework, and couldn’t find a framework that suited my needs. Itty-router was very nice but too simple. Worktop and Sunder did the same things I wanted to do, but their APIs weren’t quite to my liking. I was also interested in creating a router — a program that determines which action is executed based on the HTTP method and URL path of the Request — made of a Trie tree structure because it’s fast. So, I started building a web framework with a Trie tree-based router.
“While trying to create my applications, I ended up creating my framework for them.” — a classic example of yak shaving. However, Hono is now used by many developers, including Cloudflare, which uses Hono in core products. So, this journey into the depths of yak shaving was ultimately meaningful.
Write once, run anywhere
Hono truly runs anywhere — not just on Cloudflare Workers. I’ll discuss why later in the post, but Hono also runs on Deno, Bun, and Node.js. This is because Hono does not depend on external libraries, but uses only the Web Standards API, and each runtime supports Web Standards.
It’s a delight for developers to know that the same code can run across different runtimes. For instance, the following src/index.ts code will run on Cloudflare Workers, Deno, and Bun.
import { Hono } from 'hono'

const app = new Hono()
app.get('/hello', (c) => c.text('Hello Hono!'))

export default app
To run it on Cloudflare Workers, you execute the Wrangler command:
wrangler dev src/index.ts
The same code works on Deno:
deno serve src/index.ts
And it works on Bun too:
bun run src/index.ts
This is only a simple “Hello World” example, but more complex applications with middleware and helpers that are discussed below can be run on Cloudflare Workers or the other runtimes. As proof of this, almost all our test code for Hono itself can run the same way on these runtimes. This is a genuine “write once, run anywhere” experience.
Who is using Hono?
Hono is now used by many developers and companies. For example, Unkey deploys their application built with Hono’s OpenAPI feature to Cloudflare Workers. The following is a list of companies using Hono, based on my survey “Who is using Hono in production?”.
There are many, many more companies not listed here. And major web services or libraries, such as Prisma, Resend, Vercel AI SDK, Supabase, and Upstash, use Hono in their examples. There are also several influencers who like Hono and use it as an alternative to Express.
Of course, at Cloudflare, we also use Hono. D1 uses Hono for the internal Web API running on Workers. Workers Logs is based on code from Baselime (acquired by Cloudflare) and uses Hono to migrate the applications from their original infrastructure to Cloudflare Workers. All Workers Logs internal or customer-facing APIs are run on Workers using Hono. We also use Hono as part of the internals of many other products, such as KV and Queues.
Why are you making a “multi-runtime” framework?
You might wonder “Why is an employee of Cloudflare creating a framework that runs everywhere?” Initially, Hono was designed to work exclusively with Cloudflare Workers. However, starting with version 2, I added support for Deno and Bun. This was a very wise decision. If Hono had been targeted only at Cloudflare Workers, it might not have attracted as many users. By running on more runtimes, it gains more users, leading to the discovery of bugs and receiving more feedback, which ultimately leads to higher quality software.
Hono and Cloudflare are a perfect combo
The combination of Hono and Cloudflare offers a delightful developer experience.
Many websites, including our Cloudflare Docs, introduce the following “vanilla” JavaScript as a “Hello World” for Cloudflare Workers:
This is primitive and good for understanding the Workers principle. However, if you want to create an endpoint that “returns a JSON response for GET requests that come to /books“, you need to write something like this:
It is short. And you can understand that “it handles GET accesses to /books” intuitively.
If you want to handle GET requests to /authors/yusuke and get “yusuke” from the path — “yusuke” is variable, you have to add something more complicated. The below is “vanilla” JavaScript example:
if (req.method === 'GET') {
  const match = url.pathname.match(/^\/authors\/([^\/]+)/)
  if (match) {
    const author = match[1]
    return Response.json({
      Author: author
    })
  }
}
If you use Hono, you don’t need if statements. Just add the endpoint definition to the app. Also, you don’t need to write a regular expression to get “yusuke”. You can get it with the function c.req.param():
One or two routes may be fine, but any more than that and maintenance becomes tricky. Code becomes more complex and bugs are harder to find. Using Hono, the code is very neat.
It is also easy to handle bindings to Cloudflare products, such as KV, R2, D1, etc. as Hono uses a “context model”. A context is a container that holds the application’s state until a request is received, and a response is returned. You can use a context to retrieve a request object, set response headers, and create custom variables. It also holds Cloudflare bindings. For example, if you set up a Cloudflare KV namespace with the name MY_KV, you can access it as follows, with TypeScript type completion.
Hono lets you write code in a simple and intuitive way, but that doesn’t mean there are limitations. You can do everything possible with Cloudflare Workers using Hono.
Add it when you want to use it
Hono is tiny. With the smallest preset, hono/tiny, you can write a “Hello World” application in just 12 KB. This is because it uses only the Web Standards API built into the runtime and has minimal functions. In comparison, the bundle size of Express is 579 KB.
However, there is much that you can do.
You can easily add functions using middleware. For example, it is a bit tedious to implement Basic Authentication from scratch, but with the built-in Basic Auth middleware, you can apply Basic Authentication to the path /auth/page with just this:
import { Hono } from 'hono'
import { basicAuth } from 'hono/basic-auth'

const app = new Hono()

app.use(
  '/auth/*',
  basicAuth({
    username: 'hono',
    password: 'acoolproject',
  })
)

app.get('/auth/page', (c) => {
  return c.text('You are authorized')
})
Hono’s package also includes built-in middleware that allows Bearer and JWT authentication, and easy configuration of CORS, etc. These built-in middleware components do not depend on external libraries, but there is also many 3rd-party middleware that allow the use of external libraries, such as authentication middleware using Clerk and Auth.js, and validators using Zod and Valibot.
There are also a number of built-in helpers, including the Streaming helper, which is useful for implementing AI. These can be added when you want to use them, and the file size increases only when they are added.
The important concepts of Hono are ”handler” and “middleware”.
A handler is a place to write a function that receives a request and returns a response, as specified by the user. For example, you can write a handler that gets a value of a query parameter, retrieves data from a database, and returns the result in JSON. Middleware can handle the requests that come to the handler and the responses that the handler returns. You can combine middleware with other middleware to build more large and complex applications. It is structured like an onion.
In a remarkably simple way, you can create middleware. For example, a custom logger that logs the request can be written as follows:
If you want to add a custom header to the response, write the following:
app.use(async (c, next) => {
  await next()
  c.header('X-Message', 'Hi, this is Hono!')
})
It would be interesting to combine this with HTMLRewriter. If an endpoint returns HTML, the middleware that modifies the HTML tags in it can be written as follows:
There is very little to remember to create middleware. All you have to do is to work with the context, which you should already know.
The RPC is like magic
Hono has a strong type system. One feature that uses this is RPC (Remote Procedure Call). With RPC, you can express server-side API specifications as TypeScript types. When these types are loaded as generics in a client, the paths, arguments, and return types of each API endpoint are inferred. It’s like magic.
For example, imagine an endpoint for creating a blog post. This endpoint takes a number type id and a string type title. Using Zod, one of the validator libraries that support TypeScript inference, you can define the schema like this:
import { z } from 'zod'

const schema = z.object({
  id: z.number(),
  title: z.string()
})
You create a handler that receives this object in JSON format via a POST request to the path /posts. Using Zod Validator, you check if it matches the schema. The response will have a property called message of type string.
import { zValidator } from '@hono/zod-validator'

const app = new Hono().basePath('/v1')

// ...

const routes = app.post('/posts', zValidator('json', schema), (c) => {
  const data = c.req.valid('json')
  return c.json({
    message: `${data.id.toString()} is ${data.title}`
  })
})
This is a “typical” Hono handler. However, the TypeScript type you can get from the typeof for the routes will contain the information about its Web API specification. In this case, it includes the endpoint for creating blog posts — sending a POST request to the path /posts returns a JSON object.
export type AppType = typeof routes
Now, let’s create a client. You pass the earlier AppType as generics to a Hono client object.
import { hc } from 'hono/client'
import { AppType } from '.'

const client = hc<AppType>('http://localhost:8787')
With this setup, you’re ready. It’s magic time.
Code completion works perfectly. When you write client-side code, you no longer need to know the API specifications completely, which also helps eliminate mistakes.
Server-side JSX is fun
Hono provides built-in JSX, a syntax that allows you to write code in JavaScript that looks like HTML tags. When you hear the term JSX, you may think of React, a front-end UI library. However, Hono’s JSX was initially developed to run only on the server side. When we first started developing Hono, we were looking for template engines to render HTML. Most template engines, such as Handlebars and EJS, use eval internally and are incompatible with Cloudflare Workers, which does not support it. Then we came up with the idea of using JSX.
Hono’s JSX is unique in that it treats the tags as a string. So the following strange code actually works.
console.log((<h1>Hello!</h1>).toString())
There is no need to do renderToString() as in React. If you want to render HTML, just return this as is.
app.get('/', (c) => c.html(<h1>Hello</h1>))
Very interesting is the creation of Suspense — a feature in React that allows you to display a fallback UI while waiting for an asynchronous component to load — without any client implementation. The asynchronous components are running in a server-only implementation.
Server-side JSX is a better developer experience than you might imagine. You can use the toolchains for React’s JSX in the same way for Hono’s JSX, including the ability to complete tags in the editor. They bring mature front-end technology to the server side.
Testing is important
Testing is important. Fortunately, you can write tests easily when using Hono.
For example, let’s write a test for an endpoint. To test for a 200 response status of a request coming to / with the GET method, you can write the following:
Simple, right? The beauty of this test is that you don’t have to bring up the server. The Web Standard API black boxes the server layer. The internal tests of Hono have 20,000 lines of code, but most of them are written in the same style as above, without the server up and running.
Going to full-stack
We released a new major version 4 in February 2024. There are three main features that stand out:
Static site generation
Client components
File-based routing
With these features, you can create full-stack applications with a user interface in Hono.
The introduction of client components allows JSX to work in the client. Now you can add interactions to your pages. Static site generation allows you to create blogs, etc. without having to bundle them into a single JavaScript file. We have also started an experimental project called HonoX. This is a meta-framework using Hono and Vite that provides file-based routing and a mechanism to hydrate client-side components to server-side generated HTML. It is easier to create larger applications that are a great match for Cloudflare Pages or Workers.
In addition to that, plans are underway to run it as a base server for existing full-stack frameworks such as Remix and Qwik.
In contrast to the Next.js framework, which started from the client-side with React, Hono is trying to become a full-stack framework starting from the server-side.
Hono Conference
On June 22, 2024, I held the “Hono Conference” in Tokyo, the first event to consist entirely of Hono-focused talks. One hundred people attended, and the event was a great success.
It was my dream to do this event. Now, there are 200 contributors to the honojs/hono repository on GitHub. If you include other Hono related repositories, there are many more. Creating “the most invincible framework we could think of” is a lot of fun for contributors and users.
Below is a group photo taken at the end of the event. This is my treasure. I want to make the 2nd event a global event.
Hono is 炎
I haven’t mentioned the origin of the name Hono yet. The name Hono is from the Japanese word for “炎“. It is similar to the word “flare“. Hono now runs on a variety of runtimes, but I said that it was first created to create Cloud”flare” Workers applications. It is an honor for Cloudflare that it has remained in its name.
That is all that the creator of Hono has to say about Hono.
Just try it
Everyone who has experienced application development with Hono and Cloudflare Workers says “the developer experience is a great experience“. If you haven’t experienced it yet, just try it.
Over the past two blogs (Help, I can’t see! A Primer for Attack Surface Management Blog Series and The Main Components of an Attack Surface Management (ASM) Strategy) in our series on Attack Surface Management, we’ve focused on the drivers and core elements of an Attack Surface Management solution. In this post, we’ll delve intoprocess of discovering assets. We cannot secure what we cannot see so getting this piece right is foundational to the success of your ASM program. This blog will explore four different methods of asset discovery starting with the most basic, deployed software agents.
Software Agents
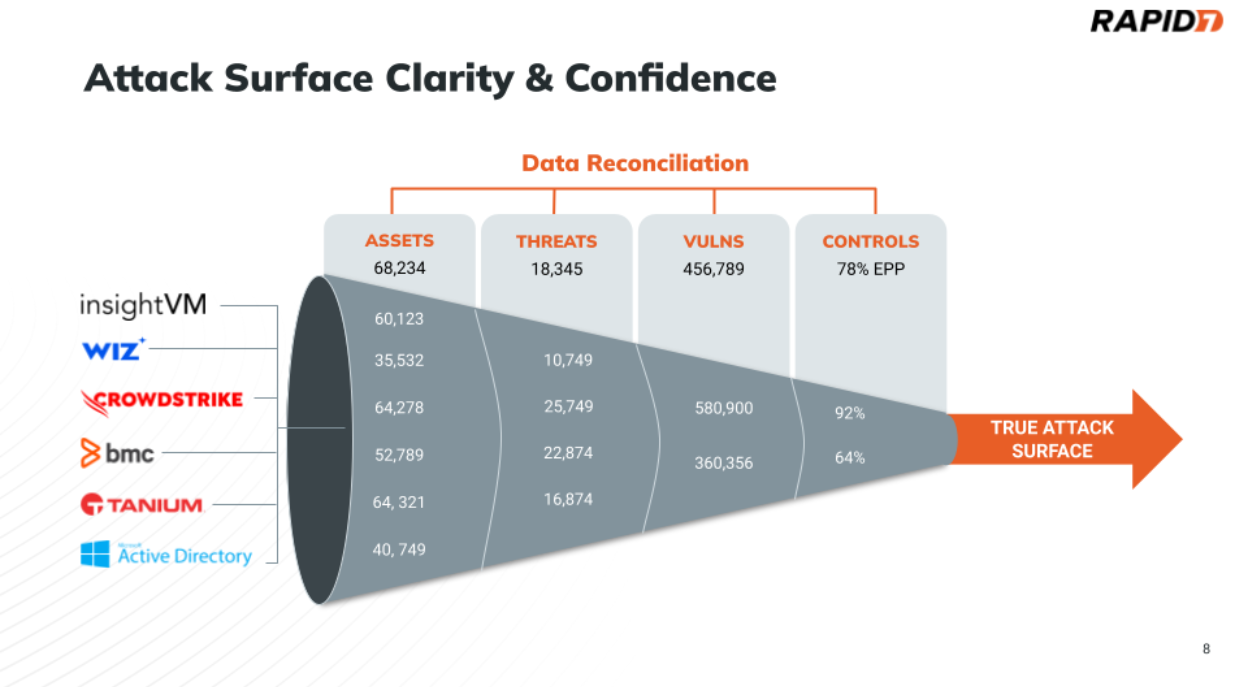
Deployed agents are how most asset inventory and asset management systems work. A software agent is deployed on a workstation or server, phoning home to the management system about the asset. The benefits of this approach are that you get a very high fidelity dataset on this particular asset, including up-to-date information on installed software, location, etc. However, this approach is only as good as the reach of the software agent. From an asset discovery perspective, the problem that is encountered is that you cannot discover assets that do not have that software agent installed. If we consider the funnel diagram below, this is effectively having visibility from one row in the funnel. In reality, most organizations do not have 100% deployment coverage of agents and many assets that will not be able to deploy agents, so they have many different tools that provide asset visibility, all with different perspectives.
Also, If the software agent is an IT management agent, and not an endpoint security agent, it will typically lack security controls, vulnerability and exposure context which means key information to best understand the attack surface may be missing.
In sum, software agents should be treated as pieces of the attack surface puzzle.
Data Aggregation & Correlation
The more comprehensive way to discover assets is through the ingestion of asset data across a variety of tools the organization uses. This is the primary way assets are discovered with a CAASM solution. By ingesting data from your IT, business applications, and security tools via API connectors we get the broadest visibility and can see across the data gaps from any individual tools.
A CAASM solution asks each connected tool for the latest list of assets on a recurring basis. Security and identity data related to an asset is then stored and mapped to build a relationship in a database (ideally a graph) that is easily discoverable and queryable. Note that some solutions exist, but not many, that enable asset history tracking to perform data trending to view how an asset and organization changes over time. In this case, more than a single asset record is stored per asset, retained for a configurable length of time.
Due to the correlation engine provided by CAASM solutions, the more data you ingest from your tools, the better your attack surface visibility and accuracy. Remember the funnel illustrated at the beginning of this article? Since your tools might not agree on the fundamental aspects like the number of assets, it’s necessary to ingest data across them to get closer to a truer picture of your attack surface.
Organization’s start putting together the pieces by ingesting data typically from 5 primary sources
Cloud Service Provider or Cloud Security Posture Management (AWS, Azure, insightCloudSec, Wiz, etc.)
Full deployments typically have between 10-20 data sources depending on the size of the organization. These will also include integrations into CMDB, IT Asset Management systems, Digital Risk Protection Service (DRPS), and more.
For the external attack surface (EASM), assets are discovered using one of two methods, or a combination of both. The first method is again, data ingestion from sources: like Shodan, Bitsight, etc. The second method is through active internet scanning that occurs on a recurring basis to discover the latest public facing assets and services running on them. We have covered data ingestion in detail already, we will then take a look at active network scanning shortly but let’s start with passive network scanning first.
Passive Network Scanning
Not every asset in the organization will be linked to a pre-existing data source. For complete attack surface coverage, you also need to consider methods that go further that address visibility gaps from your data sources. The first of these is passive network scanning.
In one scenario, attackers could gain access to your internal network through a malicious insider. A disgruntled employee could plug an unapproved workstation or malicious device into an ethernet port, or attackers might gain a foothold through WiFi attacks to gain entry on the network with a static IP address. In both of these cases, the malicious device would effectively be invisible to your teams and tools, with the exception of the perspective of network switches, firewalls, and network traffic analysis.
Support for data sources of passive network traffic therefore can give teams visibility into new assets that come online that are not correlated with any other data source. This can provide visibility into rogue devices that are circumventing security policy and protocol. Most CAASM solutions today do not ingest network data such as Netflow, or support NTA data ingestion, although some can use data from agents that process ARP or DHCP broadcasts to discover new assets. However, these agents need to be deployed on a specific network segment otherwise they won’t be able to discover unknown assets. In these cases, Active Network Scanning is a potential alternative to increase visibility of assets that are circumventing normal controls and monitoring.
Active Network Scanning
The most difficult-to-discover Shadow IT assets can also be the most vulnerable, because they won’t have the necessary security controls enabled. These assets are not discoverable through network data alone, as they provide no telemetry. Even with network data, security teams often miss fingerprinting and fail to identify the services running on these devices. Active scanning offers a way to capture information from these assets that are otherwise missed. Active network scanning is a necessary feature in environments where full visibility is extremely important.
A fully deployed vulnerability scanner is superior to native active network scanning because it uses the same network discovery techniques but also understands vulnerabilities and exposures. Using a CAASM solution to understand which assets and networks are not being continuously assessed for vulnerabilities is a great way to also increase your ability to discover new assets by active network scanning.
For the final blog in this series, we will look at how we can drive greater insights through the context we can acquire with effective Attack Surface Management (ASM).
Thousands of learners worldwide take their first steps into text-based programming using the Python programming language. Python is not only beginner-friendly, but is also used extensively in industry.
In 2015, Python developer Daniel Pope, who has a keen interest in education, noticed that beginners often have great ideas for creating projects but struggle because the software libraries they need to use are aimed at more confident programmers. To address this, he created Pygame Zero — a simplified version of the popular PyGame software. Since then, various developers have expanded the range of ‘zero’ libraries for Python.
How Python zero libraries help beginner programmers
The Raspberry Pi Foundation has a long history of supporting Python zero libraries. GPIO Zero was launched back in 2015, followed by guizero and then picozero. The goal of all ‘zero’ libraries is the same: to help beginner programmers create amazing projects using simple, understandable code, supported by useful documentation.
The Picamera2 library is a powerful tool for advanced users, but beginners — such as Astro Pi: Mission Space Lab programme participants — would benefit from a zero library to allow them to use the Raspberry Pi Camera module.
The Astro Pi Mark II units
Image taken by Astro Pi: Mission Space Lab programme participants
Picamzero: how to get started
The Code Club Projects and Youth Programmes teams at the Raspberry Pi Foundation have joined forces to createpicamzero: a new library that makes it simple for beginners to use the Raspberry Pi Camera board.
As with the other ‘zero’ libraries, it’s straightforward to get started. You can install picamzero by typing two commands in your Raspberry Pi’s terminal:
sudo apt update
sudo apt install python3-picamzero
Once it’s installed, setting up your program to communicate with your camera is easy:
from picamzero import Camera
cam = Camera()
You can ask picamzero to take a time-lapse sequence and make a video of your images using a single line of code.
Picamzero also makes it easy to add text and image overlays to your images.
A Lego scene captured using picamzero
We’ve written beginner-friendly documentation for the new library so that you can explore what you can create using just a few lines of code. We’ve also updated our resources so that you can start making exciting projects using picamzero straight away:
The LWN.net Weekly Edition for October 17, 2024 is available.
The collective thoughts of the interwebz
Manage Consent
To provide the best experiences, we use technologies like cookies to store and/or access device information. Consenting to these technologies will allow us to process data such as browsing behavior or unique IDs on this site. Not consenting or withdrawing consent, may adversely affect certain features and functions.
Functional
Always active
The technical storage or access is strictly necessary for the legitimate purpose of enabling the use of a specific service explicitly requested by the subscriber or user, or for the sole purpose of carrying out the transmission of a communication over an electronic communications network.
Preferences
The technical storage or access is necessary for the legitimate purpose of storing preferences that are not requested by the subscriber or user.
Statistics
The technical storage or access that is used exclusively for statistical purposes.The technical storage or access that is used exclusively for anonymous statistical purposes. Without a subpoena, voluntary compliance on the part of your Internet Service Provider, or additional records from a third party, information stored or retrieved for this purpose alone cannot usually be used to identify you.
Marketing
The technical storage or access is required to create user profiles to send advertising, or to track the user on a website or across several websites for similar marketing purposes.
 Jagadish Kumar (Jag) is a Senior Specialist Solutions Architect at AWS focused on Amazon OpenSearch Service. He is deeply passionate about Data Architecture and helps customers build analytics solutions at scale on AWS.
 Sohaib Katariwala is a Senior Specialist Solutions Architect at AWS focused on Amazon OpenSearch Service. He has over 14 years of experience helping organizations derive insights from their data.
 Wendy Neu is a Senior Manager at AWS focused on leading the NoSQL Specialist Solutions Architecture team worldwide. She is passionate about Data Services and leverages her extensive expertise to help customers optimize their data storage, management, and analytics strategies, enabling them to drive innovation and achieve their business goals.

 Julian Payne is a Principal Product Manager at AWS. He is passionate about building products and features to help customers innovate using real-time data processing applications in the cloud. Outside of work he writes and illustrates graphic novels.