Post Syndicated from The Hook Up original https://www.youtube.com/watch?v=M-vQKcsd03A
Yearly Archives: 2024
[$] LWN.net Weekly Edition for October 10, 2024
Post Syndicated from corbet original https://lwn.net/Articles/992718/
The LWN.net Weekly Edition for October 10, 2024 is available.
Worst Maritime Disaster in US History
Post Syndicated from The History Guy: History Deserves to Be Remembered original https://www.youtube.com/watch?v=tzK4Egay0L4
What’s new in Cloudflare One: Digital Experience (DEX) monitoring notifications and seamless access to Cloudflare Gateway with China Express
Post Syndicated from Guy Nir original https://blog.cloudflare.com/roundup-dex-alerts-cloudflare-gateway-china-express
At Cloudflare, we are constantly innovating and launching new features and capabilities across our product portfolio. We are introducing roundup blog posts to ensure that you never miss the latest updates across our platform. In this post, we are excited to share two new ways that our customers can continue to keep their web properties performant and secure with Cloudflare One: new Digital Experience Monitoring (DEX) notifications help proactively identify issues that can affect the end-user digital experience, and integration with China Express enables secure access to China-hosted sites for Cloudflare Gateway customers.

Digital Experience Monitoring (DEX) offers device, application, and network performance monitoring, providing IT administrators with insights to quickly identify and resolve issues. With DEX notifications , account administrators can create configurable alert rules based on available algorithms (z-score, SLO) and existing DEX filters. When notification criteria are satisfied, customers are notified via email, Pagerduty, or Webhooks
As with other notification types, DEX notifications can be configured and reviewed from Cloudflare dashboard notifications.
DEX notifications address the challenge of proactively identifying issues affecting the digital experience of your end users. By monitoring device health and conducting synthetic tests from WARP clients deployed on your fleet’s end-user devices, DEX provides valuable insights. These notifications empower IT administrators to quickly identify and address connectivity and application performance problems before they impact a wide range of users.
By proactively notifying administrators when problems arise, DEX helps minimize user disruption and provides peace of mind. Instead of actively refreshing and looking for issues as before, administrators can now receive immediate notifications. Management is simple, as notifications can be easily configured through the Cloudflare dashboard.
Administrators can now create three new notification types:
1) Device Connectivity Anomaly
Are you tired of manually monitoring your end-users’ device connectivity? Do you want to be notified immediately when there’s a sudden change? Our new DEX notification for Device Connectivity Anomaly alerts you when there’s a significant increase or decrease in the number of monitored devices connecting or disconnecting to the WARP Client. This can be filtered by various characteristics such as data center (“colo”), platform (operating system), and WARP Client version.
We use a statistical method called z-score to detect anomalies in monitored device count. A z-score measures how many standard deviations a data point is from the mean. By comparing the current five minutes of data to the past four hours, we can calculate the mean and standard deviation. If the z-score value exceeds 3.5 or falls below -3.5, a notification is triggered.
Here’s an example of a notification configuration for macOS devices in the UK using WARP Client version 2023.7.24:

2) DEX Test Latency
Ever worry application performance is slow? We’re thrilled to introduce DEX Test Latency notifications, which are designed for administrators who want to stay ahead of the curve when it comes to application performance. This notification proactively alerts you of significant spikes or drops in latency based on:
-
HTTP Test: Resource Fetch Time measures the time it takes for a web browser to retrieve a specific resource from your application and deliver it to the end user.
-
Traceroute Test: Round Trip Time measures the average time it takes for data packets to travel from your device to a specific destination IP address and back (when successful). Traceroute tests focus on the overall network performance between the test client/device and your application.
This notification can be filtered by various characteristics such as data center (“colo”), platform (operating system), WARP Client version, and test name.
In this example, you have a DEX test monitoring the latency of the website www.cloudflarestatus.com. This test, named “Cloudflare Status,” uses an HTTP GET request and runs on Windows devices connecting through the Lisbon colo (data center).

3) DEX Test Low Availability
Is application downtime causing headaches for you and your users?
DEX Test Low Availability notifications help maintain optimal application health by notifying you when availability falls below a given threshold. This notification monitors the success rate of HTTP or Traceroute requests sent to an application through pre-configured DEX tests. These synthetic tests simulate user traffic and measure the percentage of successful interactions with your application.
You define the Service Level Objective (SLO) — a specific availability threshold — for each notification. When the percentage of successful requests falls below this threshold, you’ll receive immediate notification, allowing you to proactively address issues before they impact a wide range of end users.
This can be filtered by various characteristics such as colo (data center), platform (operating system), WARP Client version, and test name.
In this example, a DEX test is targeting www.google.com. This Traceroute test runs on Chrome OS devices connecting through the Tel Aviv colo. The example notification is configured to alert you whenever the availability (percentage of successful requests) drops below 98%, allowing you to investigate potential issues and take corrective action quickly.

DEX notifications are now available for Cloudflare One customers. They can be configured by going to Cloudflare Dashboard > Account home > Notifications > Add, and then selecting any of the three DEX notification types. For more information, refer to Create a notification. DEX notifications are one of the many ways the Cloudflare One suite of solutions work seamlessly together as a unified platform to find and fix security issues across SaaS applications. Get started now with Cloudflare’s Zero Trust platform by signing up here.

In January 2023, we proudly launched China Express with multiple partners in China to extend Cloudflare One into China and provide connectivity to ensure that customers within the country could enjoy the same level of access to global services as the rest of the world. Our goal was simple: to deliver a consistent experience for customers and employees everywhere.
Over the past year, we’ve observed a notable increase in demand from enterprise customers seeking secure access to China-hosted sites. These customers, who often require consistent zero trust security policies applied through Cloudflare Gateway, including device posture checks, have faced challenges like scenic routing, where Internet traffic passes through multiple countries or networks, leading to significant packet loss when connecting to these websites.
For example, a global company with offices in both Hong Kong and San Jose has implemented WARP on their devices to manage Internet access. As part of their daily operations, employees need to access websites hosted in mainland China. However, they have experienced unstable connections, particularly when accessing the AWS web console in China. Further investigation revealed long and sometimes unpredictable network routes, contributing to the instability.
Global Internet traffic to and from China flows through a limited number of international links, tightly regulated by government authorities, often leading to significant instability and fluctuations. To address these challenges, our China Express partners offer the ‘Reverse Tunnel’ solution, a reliable service that ensures stable access to Chinese websites, effectively mitigating connectivity issues.
Today, we are thrilled to announce a significant enhancement to China Express: a new offering tailored to the needs of global Cloudflare Gateway customers accessing China-hosted sites. This enhancement introduces a dedicated tunnel configuration, ensuring safe and predictable connectivity while maintaining stringent zero trust security policies.
By partnering with JD Cloud, one of our trusted local providers in China, we’ve developed a solution that seamlessly integrates with Cloudflare’s Zero Trust Firewall DNS Policies by:
Directly routing through our Cloudflare Hong Kong data center: When global Cloudflare Gateway customers attempt to access China-hosted sites, their traffic is routed directly to our Hong Kong data center. This strategic routing point allows us to apply Zero Trust policies before the traffic continues its journey into China.
Using JD Cloud’s connectivity tunnel: From our Cloudflare Hong Kong data center, the traffic is then securely transmitted through JD Cloud’s private tunnel infrastructure, ensuring reliable and efficient connectivity into China. This partnership with JD Cloud leverages their local expertise and infrastructure capabilities, further enhancing the reliability and performance of the connection.
Note: This premium service is exclusive to China Network customers and requires a dedicated reverse tunnel contract with JD Cloud.
This solution offers several key benefits for our customers:
-
Improved stability: By directing all traffic to a dedicated tunnel, customers experience more reliable connections to websites within China.
-
Enhanced security: Zero Trust policies are consistently applied to all traffic, regardless of its destination, ensuring the highest level of security for customers accessing China-hosted sites.
-
Seamless customer experience: With a dedicated tunnel configuration, customers can access websites in China with confidence, knowing that their connections are both safe and predictable. Whether it’s multinational corporations expanding into the Chinese market, e-commerce platforms serving Chinese customers, or remote workers accessing corporate resources from within China, Cloudflare’s China Express with JD Cloud partnership provides a solution tailored to their specific needs.
By having companies implement a DNS host override policy in Cloudflare Gateway for origins in China, which routes traffic through the China Express Reverse Tunnel instead of using public Internet routes, companies can ensure more stable and reliable connections for their employees.
Looking ahead, we remain committed to continuously improving and expanding our offerings within China Express. Future developments may include further enhancements to performance, additional partnerships with local providers, and ongoing innovation to meet the evolving needs of our customers in the region.
We’ll continue to share roundup blog posts as we continue to build and innovate. Be sure to follow along on the Cloudflare Blog for the latest news and updates.
Cerro Gordo equipment setup LIVE!
Post Syndicated from Crosstalk Solutions original https://www.youtube.com/watch?v=sskHt1Th_Zs
[$] Improving bindgen for the kernel
Post Syndicated from daroc original https://lwn.net/Articles/992693/
Bindgen is a widely used tool that automatically generates Rust bindings from C
headers. The
Rust-for-Linux project uses it to create some of
the bindings between Rust code and the rest of the kernel. John Baublitz
presented at Kangrejos about the improvements that he has made to the tool in
order to make the generated bindings easier to use, including improved support
for macros, bitfields, and enums.
Несломимата Украйна: Плен
Post Syndicated from original https://www.toest.bg/neslomimata-ukrayna-plen/

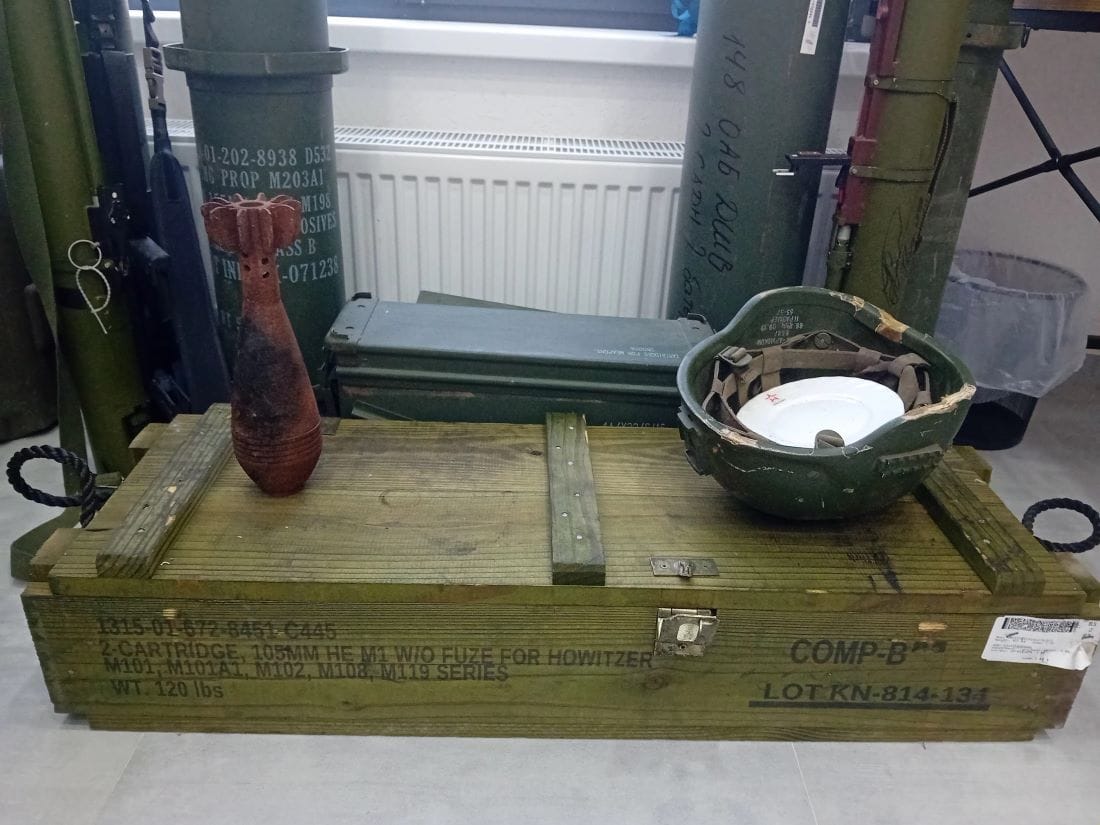
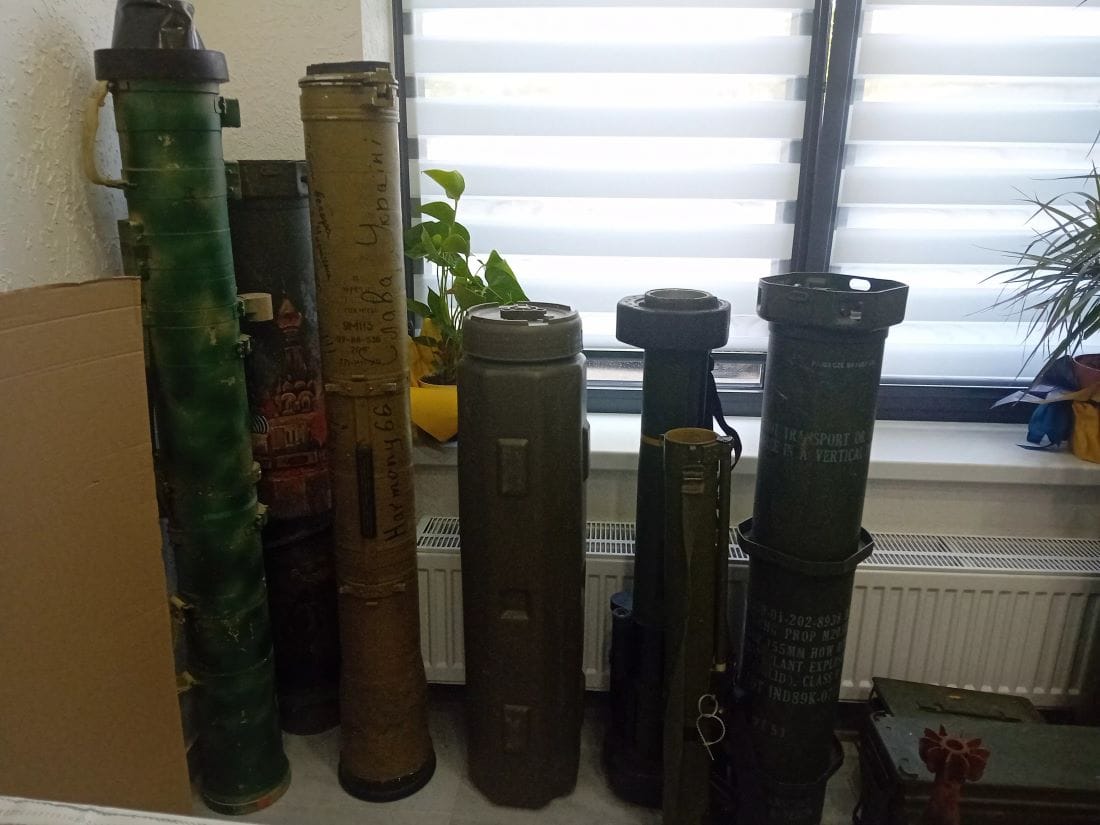
В края на коридора има малка стая. Вратата се отваря тихо, за да разкрие десетки гилзи от всякакъв калибър и няколко преносими ракетни противотанкови комплекса.
Това е библиотеката на YOUkraine, организация в Киев, която работи с ветерани, завърнали се от плен. На едната стена в стаята са подредени книги и две бели маси за четене със столове до тях, а под прозореца са остатъците от оръжията. Насред всичко това върху дървен сандък има войнишка каска с чиния за хранене в нея. Заглеждам се в чинията, за да различа червена петолъчка на бордюра ѝ. Чувам тихия глас на Катя зад рамото ми: „Каската е руска, на убит техен войник.“
Поглеждам я смаяно. Катя се усмихва и казва смирено:
Нашите момчета носят тези трофеи тук. Няма по-добро място от една библиотека за тях…“
Питам Катя кои са техните момчета.
Ветерани, които сега имат нужда от лечение и рехабилитация и нашата организация им помага. Също така и мъжете, които в момента воюват.

© Николета Атанасова
Моят приятел беше защитник на Мариупол и попадна в плен за четири месеца. След като го освободиха, ми разказа, че е понасял по-леко издевателствата, може би защото в цивилния живот беше спортист, боксьор, и е свикнал да го бият.
Това може и да е чувство за хумор, нали… Някои от неговите приятели едва са понасяли побоищата на руснаците и дори са загинали от тях.
На него му провървя, защото беше в плен само четири месеца.
Когато го видях за първи път след плена, се хвърлих на врата му и го попитах: „Къде беше, защо не се обади?“ И това е чувство за хумор… но разбирате ли, хуморът е единственото ни средство да преминем през тежките моменти. После много плаках и го прегръщах, а той ме попита дали го обичам още. Отговорих му: „Сериозно ли?“
Всъщност помня ясно вечерта, когато разбрах, че е пленен. С него имахме уговорка да се чуваме всяка вечер в определен час. Ако не може да се чуем, поне да ми изпрати някакъв емотикон, за да знам, че е жив. Една вечер се опитвах да се свържа с него няколко часа безуспешно. Накрая някой вдигна телефона му и ми заговори на руски. Разбрах какво се е случило. Помислих си, че умирам в този момент.
След като защитниците на Мариупол се предадоха и ги отведоха в руски военнопленнически лагери, жените и майките на всички попаднали в плен спонтанно се събрахме. В началото не знаехме какво да правим, събра ни ужасният общ проблем – пленените близки хора. Дори не се познавахме една друга, но знаехме, че трябва да създадем организация, която да работи за нашите момчета. Започнахме да организираме срещи с представителите на властта, да работим върху проекти, за да привлечем вниманието към проблема с военнопленниците.
Иначе единственият начин да разбереш какво се случва с мъжа ти, попаднал в руски плен, е, ако разменят някого. Когато някой се завърне от плен, всички близки на пленени войници буквално връхлитат върху него със снимки на своите хора и започват да го питат: „Виждал ли си моя мъж, жив ли е?“


© YOUkraine; © Николета Атанасова
Приятелят ми разказа какво се случва в тези руски лагери. Всяка вечер са им слагали чувал на главата, пребивали са ги, а след това са ги увесвали на куки за вързаните ръце. Заставяли са го да седи в шпагат и да пее руски песни. Почти не са ги хранили. На голяма част от момчетата са им изпадали зъбите и косите. Приятелят ми отслабна за четири месеца с 39 килограма. Когато отидох да го посрещна след плена и той излизаше от едно помещение, не го познах в първия момент. Само по походката разбрах, че е той. Беше ужасно да не го позная. Но промяната в него беше потресаваща.
Разказа ми, че са им давали да ядат някакъв кисèл в малки метални купички, който е бил толкова горещ, че не можеш дори да държиш купичката в ръка. Трябвало да го изядат за 30 секунди, ако не го изядат, ги пребиват, ако го изядат, изгарят хранопровода си и не могат да се хранят после със седмици, а руснаците седят отстрани и се смеят.
За него е било най-трудно да запази психиката си, защото четири месеца по цял ден е бил сам в една килия и е виждал само враговете си, които са го измъчвали. Спасението му са били спомените за живота ни преди войната, също така си е измислял някакви мисловни игри, които да държат мозъка му в кондиция. И още едно нещо: в килията му влязло мишле, за което той тайно се грижел и му говорел, когато е нямало наоколо часови да го чуят. Казва ми, че желанието му да общува с някого е било толкова голямо, че мишлето го е спасило да не полудее. Все пак на нас ни провървя, защото той се върна жив, поне засега.


© Николета Атанасова; © Анна Мурашенко, личен архив
Питам Катя за тяхната дейност. Разказва ми, че заедно с други организации адаптират спортове за ветерани. Най-често яздят или карат сърф. Със специални приспособления към седлото или сърфа дори хора без крака успявали. Освен това организацията им обучава журналисти и дори лекари как да се отнасят с ветерани, преживели плен.
Ще ви дам пример. След като се завърнат от плен, ветераните трябва да отидат на преглед при лекар. Той, за да ги прегледа, ги кара да си вдигнат ръцете. Ветеранът получава паник атака, защото по време на плен едно от изтезанията е било да ги държат по няколко часа всеки ден до стената с вдигнати ръце, със заплаха да ги разстрелят.
В разговора ни се намесва Анна Мурашенко, една от създателките на хъба.
Важни са и медиите. Ветераните, преживели плен, са в особено психическо състояние, полусъзнание, дори в шок от това, което са преживели, а журналистите, като ги видят, се нахвърлят върху тях и започват да ги снимат, без да се съобразят, че този човек може да се разплаче в момента, в който види близките си. Имахме случай: връща се наше момче от плен и някой му дава ябълка. То я взема и се разплаква. Всички снимат този кадър. Да, сигурно е много атрактивно да заснемеш как един военен плаче, докато взема ябълка и е в шок, но той след няколко седмици идва на себе си, той е мъж, герой от битки, и вижда тази снимка, но не иска неговият образ да е на един разплакан военен, нали? Според мен такива снимки са некоректни, защото донякъде обезценяват всичко, което тези момчета са направили във войната, обезценяват и преживяното от тях в плен, и не само, дори ги унижава в някакъв смисъл. Не бива заради журналистическа популярност да правиш така, че един герой да се чувства унизен и да не му е приятно да види снимката си. Да не говорим за грубия въпрос колко човека си убил… Та те са хора като всички нас и всеки преживява различно това, което му се налага да прави на фронта. Не може да се пита за такива неща.
Пред офиса спира кола и от нея излиза дребничък мъж в униформа. Катя става да го посрещне. Иля е на 22 години. Когато е защитавал Мариупол и са го пленили, все още не е бил навършил 20 години.
Врагът настъпваше към нас всеки ден и бяхме обкръжени. Нямахме оръжие, храна и лекарства. Обстановката беше сложна. Може би затова се наложи да се предадем. Все пак устояхме 86 дни… Да сведем глава беше най-тежкото решение, защото да загинеш в битка с оръжие в ръка за страната си би било чест за всеки от нас. В сраженията имаш право да вземаш решения. В плен това го няма.
Докато бях в плен, сякаш бях във вакуум и за да запазя разсъдъка си, си спомнях целия си живот до този момент – как бях малък, щастливите моменти със семейството ми. Това, което ме крепеше там, беше надеждата, че все някога ще се върна вкъщи. В началото бях в Еленовка, после ме преместиха в Таганрог за пет месеца и накрая бях в Камен Шахтинск. Това са едни от най-тежките места за оцеляване за украински пленени, защото се отнасяха много жестоко с нас – ежедневни физически побои, от които много наши момчета загинаха. Давеха ни в казани с вода, докато ни разпитваха. Въобще, който е попадал в Таганрог, разбира какво е плен в най-страшния му вид. Мен, докато ме разпитваха, ми палеха ръката, удряха ме по гениталиите. В Таганрог бях в самостоятелна килия, от която ме изваждаха само за да ме малтретират. Не знам как изглежда мястото, защото ми слагаха чувал на главата.
Килията ми беше 2 на 3 метра, с малък прозорец, през който нямах право да поглеждам. Ако ме видеха, че гледам през прозореца, влизаха и ме пребиваха. В килията можеш да седиш единствено на стол, и то задължително с изправен гръб и ръцете на бедрата. Не бива да мърдаш и ако се облегнеш на облегалката, часовият влиза и те пребива. Така седиш от шест сутринта до десет вечерта. Имаше килии, в които момчетата бяха по двама-трима. Правилата за тях бяха същите. Разговорите бяха забранени.
Сутрин, за да ни дадат закуска, трябваше да пеем химна на Русия. В началото храната ни беше една супена лъжица макарони за целия ден, а после – две тънички филийки хляб на ден. Ако има обяд, той е супа от вода, в която плува едно парченце картоф. Най-страшно беше с вечерята от вкиснало кисело зеле, от което веднага получаваш разстройство. Ако обаче поискаш да отидеш до тоалетната, те пребиват с въпроса „А сега по-добре ли ти е?“. Нямахме никакви сили, защото не се хранехме и редовно ни пребиваха, но ни караха да спортуваме в килията. Спортът беше да направиш 500 клека с подскок за един час, иначе отново те пребиват. Докато правиш клековете, те гледат и се смеят. Това е цинизъм и издевателство.
Ако се разболееш и помолиш за лекар, получаваш няколко гумени палки по тялото пак с въпроса „Сега по-добре ли си?“. А ти си длъжен да им отговориш: „Тъй вярно!“ Иначе отново бой – до смърт. Там никой не получаваше медицинска помощ, дори и ранените. Раните им загниваха и цялото място вонеше ужасно на разлагаща се плът. Оставяха ги да загинат. Не можех да видя какво става, но чувах виковете на моите приятели, които биваха изтезавани. Те също са слушали моите викове, когато руснаците изтезаваха мен. Това е ужасно усещане – да чуваш как приятел страда, и да не можеш да му помогнеш. За десетте месеца в плен четирима мои приятели загинаха от раните си. Някой знае ли въобще колко са военнопленническите лагери на руснаците и колко украинци загиват там всеки ден?
След като Иля си тръгва, с Катя дълго мълчим. Пием кафе насред библиотеката, пълна с книги и оръжие. Катя с тихия си глас ми казва:
Те споделят своите истории, за да разберем цената, която плащат, та да можем ние с вас сега да седим тук.
Питам я с какво не може да свикне.
С ракетните обстрели. Постоянно сънувам, че съм вкъщи, тъмно е и в дома ми влита ракета. После всичко се превръща в огромна черна дупка. Дори денем ме е страх от самия сън, който ще сънувам, ако заспя. Ходя на психолог, който ме кара да нарисувам на ракетата някакви уши или опашка, за да я направя да изглежда смешна в представите си. Аз я рисувам смешна, но все още не съм се излекувала.
Страх ме е и за приятеля ми, защото той отново отиде да воюва. Когато се върна от плен, си мислех, че моят кошмар е приключил и всичко ще бъде наред, но той премина през рехабилитация и замина отново на фронта. Буквално в момента ние с вас седим тук, говорим си, пием кафе, а той е някъде там и може би срещу него стрелят, но нямаше смисъл да го увещавам да остане тук, защото точно както всички други ветерани, той взема решенията си сам. Като се замисля, не познавам нито един ветеран, който се е завърнал от плен физически здрав и не се е върнал на фронта.
Моята задача е да го поддържам, да го чакам и да продължа да помагам с каквото мога, докато се опитвам да живея. Мисля постоянно от какво имат нужда момчетата ни там. Да, от оръжие на първо място. Ние ги наричаме железни, устойчиви, герои, но освен оръжието те имат нужда от нас, техните момичета тук. Да знаят, че ги чакаме, че ги обичаме. Защото колкото и да са железни тези мъже, те също имат чувства, могат да поплачат, могат да тъгуват, нищо че няма да ни го кажат или покажат.
Тръгваме си от YOUkraine привечер. Трябва да уговоря срещите си за утрешния ден. Е, сещате се, при зает сигнал операторът винаги ми казва:
Моля, изчакайте! Абонатът говори за победата!
Prohibition USA: The Failed Social Experiment
Post Syndicated from Geographics original https://www.youtube.com/watch?v=Xn0xZl-7lSw
Amazon EMR on EC2 cost optimization: How a global financial services provider reduced costs by 30%
Post Syndicated from Omar Gonzalez original https://aws.amazon.com/blogs/big-data/amazon-emr-on-ec2-cost-optimization-how-a-global-financial-services-provider-reduced-costs-by-30/
In this post, we highlight key lessons learned while helping a global financial services provider migrate their Apache Hadoop clusters to AWS and best practices that helped reduce their Amazon EMR, Amazon Elastic Compute Cloud (Amazon EC2), and Amazon Simple Storage Service (Amazon S3) costs by over 30% per month.
We outline cost-optimization strategies and operational best practices achieved through a strong collaboration with their DevOps teams. We also discuss a data-driven approach using a hackathon focused on cost optimization along with Apache Spark and Apache HBase configuration optimization.
Background
In early 2022, a business unit of a global financial services provider began their journey to migrate their customer solutions to AWS. This included web applications, Apache HBase data stores, Apache Solr search clusters, and Apache Hadoop clusters. The migration included over 150 server nodes and 1 PB of data. The on-premises clusters supported real-time data ingestion and batch processing.
Because of aggressive migration timelines driven by the closure of data centers, they implemented a lift-and-shift rehosting strategy of their Apache Hadoop clusters to Amazon EMR on EC2, as highlighted in the Amazon EMR migration guide.
Amazon EMR on EC2 provided the flexibility for the business unit to run their applications with minimal changes on managed Hadoop clusters with the required Spark, Hive, and HBase software and versions installed. Because the clusters are managed, they were able to decompose their large on-premises cluster and deploy purpose-built transient and persistent clusters for each use case on AWS without increasing operational overhead.
Challenge
Although the lift-and-shift strategy allowed the business unit to migrate with lower risk and allowed their engineering teams to focus on product development, this came with increased ongoing AWS costs.
The business unit deployed transient and persistent clusters for different use cases. Several application components relied on Spark Streaming for real-time analytics, which was deployed on persistent clusters. They also deployed the HBase environment on persistent clusters.
After the initial deployment, they discovered several configuration issues that led to suboptimal performance and increased cost. Despite using Amazon EMR managed scaling for persistent clusters, the configuration wasn’t efficient due to setting a minimum of 40 core nodes and task nodes, resulting in wasted resources. Core nodes were also misconfigured to auto scale. This led to scale-in events shutting down core nodes with shuffle data. The business unit also implemented Amazon EMR auto-termination policies. Because of shuffle data loss on the EMR on EC2 clusters running Spark applications, certain jobs ran five times longer than planned. Here, auto-termination policies didn’t mark a cluster as idle because a job was still running.
Lastly, there were separate environments for development (dev), user acceptance testing (UAT), production (prod), which were also over-provisioned with the minimum capacity units for the managed scaling policies configured too high, leading to higher costs as shown in the following figure.

Short-term cost-optimization strategy
The business unit completed the migration of applications, databases, and Hadoop clusters in 4 months. Their immediate goal was to get out of their data centers as quickly as possible, followed by cost optimization and modernization. Although they expected greater upfront costs because of the lift-and-shift approach, their costs were 40% higher than forecasted. This sped up their need to optimize.
They engaged with their shared services team and the AWS team to develop a cost-optimization strategy. The business unit began by focusing on cost-optimization best practices to implement immediately that didn’t require product development team engagement or impact their productivity. They performed a cost analysis to determine the largest contributors of cost were EMR on EC2 clusters running Spark, EMR on EC2 clusters running HBase, Amazon S3 storage, and EC2 instances running Solr.
The business unit started by enforcing auto-termination of EMR clusters in their dev environments by using automation. They considered using Amazon EMR isIdle Amazon CloudWatch metrics to build an event-driven solution with AWS Lambda, as described in Optimize Amazon EMR costs with idle checks and automatic resource termination using advanced Amazon CloudWatch metrics and AWS Lambda. They implemented a stricter policy to shut down clusters in their lower environments after 3 hours, regardless of usage. They also updated managed scaling policies in DEV and UAT and set the minimum cluster size to three instances to allow clusters to scale up as needed. This resulted in a 60% savings in monthly dev and UAT costs over 5 months, as shown in the following figure.

For the initial production deployment, they had a subset of Spark jobs running on a persistent cluster with an older Amazon EMR 5.(x) release. To optimize costs, they split smaller jobs and larger jobs to run on separate persistent clusters and configured the minimum number of core nodes required to support jobs in each cluster. Setting the core nodes to a constant size while using managed scaling for only task nodes is a recommended best practice and eliminated the issue of shuffle data loss. This also improved the time to scale in and out, because task nodes don’t store data in Hadoop Distributed File System (HDFS).
Solr clusters ran on EC2 instances. To optimize this environment, they ran performance tests to determine the best EC2 instances for their workload.
With over one petabyte of data, Amazon S3 contributed to over 15% of monthly costs. The business unit enabled the Amazon S3 Intelligent-Tiering storage class to optimize storage expenses for historical data and reduce their monthly Amazon S3 costs by over 40%, as shown in the following figure. They also migrated Amazon Elastic Block Store (Amazon EBS) volumes from gp2 to gp3 volume types.

Longer-term cost-optimization strategy
After the business unit realized initial cost savings, they engaged with the AWS team to organize a financial hackathon (FinHack) event. The goal of the hackathon was to reduce costs further by using a data-driven process to test cost-optimization strategies for Spark jobs. To prepare for the hackathon, they identified a set of jobs to test using different Amazon EMR deployment options (Amazon EC2, Amazon EMR Serverless) and configurations (Spot, AWS Graviton, Amazon EMR managed scaling, EC2 instance fleets) to arrive at the most cost-optimized solution for each job. A sample test plan for a job is shown in the following table. The AWS team also assisted with analyzing Spark configurations and job execution during the event.
| Job | Test | Description | Configuration |
| Job 1 | 1 | Run an EMR on EC2 job with default Spark configurations | Non Graviton, On-Demand Instances |
| 2 | Run an EMR on Serverless job with default Spark configurations | Default configuration | |
| 3 | Run an EMR on EC2 job with default Spark configuration and Graviton instances | Graviton, On-Demand Instances | |
| 4 | Run an EMR on EC2 job with default Spark configuration and Graviton instances. Hybrid Spot Instance allocation. | Graviton, On-Demand and Spot Instances |
The business unit also performed extensive testing using Spot Instances before and during the FinHack. They initially used the Spot Instance advisor and Spot Blueprints to create optimal instance fleet configurations. They automated the process to select the most optimal Availability Zone to run jobs by querying for the Spot placement scores using the get_spot_placement_scores API before launching new jobs.
During the FinHack, they also developed an EMR job tracking script and report to granularly track cost per job and measure ongoing improvements. They used the AWS SDK for Python (Boto3) to list the status of all transient clusters in their account and report on cluster-level configurations and instance hours per job.
As they executed the test plan, they found several additional areas of enhancement:
- One of the test jobs makes API calls to Solr clusters, which introduced a bottleneck in the design. To prevent Spark jobs from overwhelming the clusters, they fine-tuned
executor.coresandspark.dynamicAllocation.maxExecutorsproperties. - Task nodes were over-provisioned with large EBS volumes. They reduced the size to 100 GB for additional cost savings.
- They updated their instance fleet configuration by setting unit/weights proportional based on instance types selected.
- During the initial migration, they set the
spark.sql.shuffle.paritionsconfiguration too high. The configuration was fine-tuned for their on-premises cluster but not updated to align with their EMR clusters. They optimized the configuration by setting the value to one or two times the number of vCores in the cluster .
Following the FinHack, they enforced a cost allocation tagging strategy for persistent clusters that are deployed using Terraform and transient clusters deployed using Amazon Managed Workflows for Apache Airflow (Amazon MWAA). They also deployed an EMR Observability dashboard using Amazon Managed Service for Prometheus and Amazon Managed Grafana.
Results
The business unit reduced monthly costs by 30% over 3 months. This allowed them to continue migration efforts of remaining on-premises workloads. Most of their 2,000 jobs per month now run on EMR transient clusters. They have also increased AWS Graviton usage to 40% of total usage hours per month and Spot usage to 10% in non-production environments.
Conclusion
Through a data-driven approach involving cost analysis, adherence to AWS best practices, configuration optimization, and extensive testing during a financial hackathon, the global financial services provider successfully reduced their AWS costs by 30% over 3 months. Key strategies included enforcing auto-termination policies, optimizing managed scaling configurations, using Spot Instances, adopting AWS Graviton instances, fine-tuning Spark and HBase configurations, implementing cost allocation tagging, and developing cost tracking dashboards. Their partnership with AWS teams and a focus on implementing short-term and longer-term best practices allowed them to continue their cloud migration efforts while optimizing costs for their big data workloads on Amazon EMR.
For additional cost-optimization best practices, we recommend visiting AWS Open Data Analytics.
About the Authors
 Omar Gonzalez is a Senior Solutions Architect at Amazon Web Services in Southern California with more than 20 years of experience in IT. He is passionate about helping customers drive business value through the use of technology. Outside of work, he enjoys hiking and spending quality time with his family.
 Navnit Shukla, an AWS Specialist Solution Architect specializing in Analytics, is passionate about helping clients uncover valuable insights from their data. Leveraging his expertise, he develops inventive solutions that empower businesses to make informed, data-driven decisions. Notably, Navnit Shukla is the accomplished author of the book Data Wrangling on AWS, showcasing his expertise in the field. He also runs the YouTube channel Cloud and Coffee with Navnit, where he shares insights on cloud technologies and analytics. Connect with him on LinkedIn.
Perform data parity at scale for data modernization programs using AWS Glue Data Quality
Post Syndicated from Himanshu Sahni original https://aws.amazon.com/blogs/big-data/perform-data-parity-at-scale-for-data-modernization-programs-using-aws-glue-data-quality/
Today, customers are embarking on data modernization programs by migrating on-premises data warehouses and data lakes to the AWS Cloud to take advantage of the scale and advanced analytical capabilities of the cloud. Customers are migrating their on-premises data warehouse solutions built on databases like Netezza, PostgreSQL, Greenplum, and Teradata to AWS based modern data platforms using services like Amazon Simple Storage Service (Amazon S3) and Amazon Redshift. AWS based modern data platforms help you break down data silos and enable analytics and machine learning (ML) use cases at scale.
During migration, you might want to establish data parity checks between on-premises databases and AWS data platform services. Data parity is a process to validate that data was migrated successfully from source to target without any errors or failures. A successful data parity check means that data in the target platform has the equivalent content, values, and completeness as that of the source platform.
Data parity can help build confidence and trust with business users on the quality of migrated data. Additionally, it can help you identify errors in the new cloud-based extract, transform, and load (ETL) process.
Some customers build custom in-house data parity frameworks to validate data during migration. Others use open source data quality products for data parity use cases. These options involve a lot of custom code, configurations, and installation, and have scalability challenges. This takes away important person hours from the actual migration effort into building and maintaining a data parity framework.
In this post, we show you how to use AWS Glue Data Quality, a feature of AWS Glue, to establish data parity during data modernization and migration programs with minimal configuration and infrastructure setup. AWS Glue Data Quality enables you to automatically measure and monitor the quality of your data in data repositories and AWS Glue ETL pipelines.
Overview of solution
In large data modernization projects of migrating from an on-premises database to an Amazon S3 based data lake, it’s common to have the following requirements for data parity:
- Compare one-time historical data from the source on-premises database to the target S3 data lake.
- Compare ongoing data that is replicated from the source on-premises database to the target S3 data lake.
- Compare the output of the cloud-based new ETL process with the existing on-premises ETL process. You can plan a period of parallel runs, where the legacy and new systems run in parallel, and the data is compared daily.
- Use functional queries to compare high-level aggregated business metrics between the source on-premises database and the target data lake.
In this post, we use an example of PostgreSQL migration from an on-premises database to an S3 data lake using AWS Glue Data Quality.
The following diagram illustrates this use case’s historical data migration architecture.

The architecture shows a common pattern for on-premises databases (like PostgreSQL) to Amazon S3 based data lake migration. The workflow includes the following steps:
- Schemas and tables are stored in an on-premises database (PostgreSQL), and you want to migrate to Amazon S3 for storage and AWS Glue for compute.
- Use AWS Database Migration Service (AWS DMS) to migrate historical data from the source database to an S3 staging bucket.
- Use AWS Glue ETL to curate data from the S3 staging bucket to an S3 curated bucket. In the curated bucket, AWS Glue tables are created using AWS Glue crawlers or an AWS Glue ETL job.
- Use an AWS Glue connection to connect AWS Glue with the on-premises PostgreSQL database.
- Use AWS Glue Data Quality to compare historical data from the source database to the target S3 bucket and write results to a separate S3 bucket.
The following diagram illustrates the incremental data migration architecture.

After historical data is migrated and validated, the workflow proceeds to the following steps:
- Ingest incremental data from the source systems to the S3 staging bucket. This is done using an ETL ingestion tool like AWS Glue.
- Curate incremental data from the S3 staging bucket to the S3 curated bucket using AWS Glue ETL.
- Compare the incremental data using AWS Glue Data Quality.
In the next sections, we demonstrate how to use AWS Glue Data Quality to establish data parity between source (PostgreSQL) and target (Amazon S3). We cover the following scenarios:
- Establish data parity for historical data migration – Historical data migration is defined as a one-time bulk data migration of historical data from legacy on-premises databases to the AWS Cloud. The data parity process maintains the validity of migrated historical data.
- Establish data parity for incremental data – After the historical data migration, incremental data is loaded to Amazon S3 using the new cloud-based ETL process. The incremental data is compared between the legacy on-premises database and the AWS Cloud.
- Establish data parity using functional queries – We perform business- and functional-level checks using SQL queries on migrated data.
Prerequisites
You need to set up the following prerequisite resources:
- A PostgreSQL database, either on premises or using an Amazon Relational Database Service (Amazon RDS) for PostgreSQL DB instance
- A schema and table in PostgreSQL with sample data
- An AWS account with Amazon Virtual Private Cloud (Amazon VPC) and a base network set up
- A VPC set up with connectivity to the PostgreSQL database
- S3 buckets for raw and curated layers
- AWS Identity and Access Management (IAM) roles for AWS Glue with access to the S3 data bucket
- AWS DMS set up to ingest historical data from the PostgreSQL database to Amazon S3 and the AWS Glue Data Catalog
Establish data parity for historical data migration
For historical data migration and parity, we’re assuming that setting up a PostgreSQL database, migrating data to Amazon S3 using AWS DMS, and data curation have been completed as a prerequisite to perform data parity using AWS Glue Data Quality. For this use case, we use an on-premises PostgreSQL database with historical data loaded on Amazon S3 and AWS Glue. Our objective is to compare historical data between the on-premises database and the AWS Cloud.
We use the following tables in the on-premises PostgreSQL database. These have been migrated to the AWS Cloud using AWS DMS. As part of data curation, the following three additional columns have been added to the test_schema.sample_data table in the curated layer: id, etl_create_ts, and etl_user_id.
- Create
sample_datawith the following code:
- Create
genderwith the following code (contains gender details for lookup):
- Create
blood_groupwith the following code (contains blood group information for lookup):
We’re assuming that the preceding tables have been migrated to the S3 staging bucket using AWS DMS and curated using AWS Glue. For detailed instructions on how to set up AWS DMS to replicate data, refer to the appendix at the end of this post.
In the following sections, we showcase how to configure an AWS Glue Data Quality job for comparison.
Create an AWS Glue connection
AWS Glue Data Quality uses an AWS Glue connection to connect to the source PostgreSQL database. Complete the following steps to create the connection:
- On AWS Glue console, under Data Catalog in the navigation pane, choose Connections.
- Choose Create connection.
- Set Connector type as JDBC.
- Add connection details like the connection URL, credentials, and networking details.
Refer to AWS Glue connection properties for additional details.
AWS Glue 4.0 uses PostgreSQL JDBC driver 42.3.6. If your PostgreSQL database requires a different version JDBC driver, download the JDBC driver corresponding to your PostgreSQL version.

Create an AWS Glue data parity job for historical data comparison
As part of the preceding steps, you used AWS DMS to pull historical data from PostgreSQL to the S3 staging bucket. You then used an AWS Glue notebook to curate data from the staging bucket to the curated bucket and created AWS Glue tables. As part of this step, you use AWS Glue Data Quality to compare data between PostgreSQL and Amazon S3 to confirm the data is valid. Complete the following steps to create an AWS Glue job using the AWS Glue visual editor to compare data between PostgreSQL and Amazon S3:
- Set the source as the PostgreSQL table
sample_data. - Set the target as the AWS Glue table
sample_data.

- In the curated layer, we added a few additional columns:
id,etl_create_ts, andetl_user_id. Because these columns are newly created, we use a transformation to drop these columns for comparison. - Additionally, the
birth_datecolumn is a timestamp in AWS Glue, so we change it to date format prior to comparison.

- Choose Evaluate Data Quality in Transformations.
- Specify the AWS Glue Data Quality rule as DatasetMatch, which checks if the data in the primary dataset matches the data in a reference dataset.
- Provide the unique key (primary key) information for source and target. In this example, the primary key is a combination of columns job and username.

- For Data quality transform output, specify your data to output:
- Original data – This output includes all rows and columns in original data. In addition, you can select Add new columns to indicate data quality errors. This option adds metadata columns for each row that can be used to identify valid and invalid rows and the rules that failed validation. You can further customize row-level output to select only valid rows or convert the table format based on the use case.
- Data quality results – This is a summary output grouped by a rule. For our data parity example, this output will have one row with a summary of the match percentage.

- Configure the Amazon S3 targets for
ruleOutcomesandrowLevelOutcomesto write AWS Glue Data Quality output in the Amazon S3 location in Parquet format.

- Save and run the AWS Glue job.
- When the AWS Glue job is complete, you can run AWS Glue crawler to automatically create
rulesummaryandrow_level_outputtables and view the output in Amazon Athena.
The following is an example of rule-level output. The screenshot shows the DatasetMatch value as 1.0, which implies all rows between the source PostgreSQL database and target data lake matched.

The following is an example of row-level output. The screenshot shows all source rows along with additional columns that confirm if a row has passed or failed validation.

Let’s update a few records in PostgreSQL to simulate a data issue during the data migration process:
You can rerun the AWS Glue job and observe the output in Athena. In the following screenshot, the new match percentage is 87.27%. With this example, you were able to capture the simulated data issue with AWS Glue Data Quality successfully.

If you run the following query, the output will match the record count with the preceding screenshot:
Establish data parity for incremental data
After the initial historical migration, the next step is to implement a process to validate incremental data between the legacy on-premises database and the AWS Cloud. For incremental data validation, data output from the existing ETL process and the new cloud-based ETL process is compared daily. You can add a filter to the preceding AWS Glue data parity job to select data that has been modified for a given day using a timestamp column.
Establish data parity using functional queries
Functional queries are SQL statements that business analysts can run in the legacy system (for this post, an on-premises database) and the new AWS Cloud-based data lake to compare data metrics and output. To make sure the consumer applications work correctly with migrated data, it’s imperative to validate data functionally. The previous examples are primarily technical validation to make sure there is no data loss in the target data lake after data ingestion from both historical migration and change data capture (CDC) context. In a typical data warehouse migration use case, the historical migration pipeline often pulls data from a data warehouse, and the incremental or CDC pipeline integrates the actual source systems, which feed the data warehouse.
Functional data parity is the third step in the overall data validation framework, where you have the flexibility to continue similar business metrics validation driven by an aggregated SQL query. You can construct your own business metrics validation query, preferably working with subject matter experts (SMEs) from the business side. We have noticed that agility and perfection matter for a successful data warehouse migration, therefore reusing the time-tested and business SME-approved aggregated SQL query from the legacy data warehouse system with minimal changes can fast-track the implementation as well as maintain business confidence. In this section, we demonstrate how to implement a sample functional parity for a given dataset.
In this example, we use a set of source PostgreSQL tables and target S3 data lake tables for comparison. We use an AWS Glue crawler to create Data Catalog tables for the source tables, as described in the first example.

The sample functional validation compares the distribution count of gender and blood group for each company. This could be any functional query that joins facts and dimension tables and performs aggregations.
You can use a SQL transformation to generate an aggregated dataset for both the source and target query. In this example, the source query uses multiple tables. Apply SQL functions on the columns and required filter criteria.
The following screenshot illustrates the Source Functional Query transform.

The following screenshot illustrates the Target Functional Query transform.

The following screenshot illustrates the Evaluate Data Quality transform. You can apply the DatasetMatch rule to achieve a 100% match.

After the job runs, you can find the job run status on AWS Glue console.

The Data quality tab displays the data quality results.

AWS Glue Data Quality provides row- and rule-level outputs, as described in the previous examples.

Check the rule-level output in the Athena table. The outcome of the DatasetMatch rule shows a 100% match between the PostgreSQL source dataset and target data lake.
Check the row-level output in the Athena table. The following screenshot displays the row-level output with data quality evaluation results and rule status.
Let’s change the company value for Spencer LLC to Spencer LLC – New to simulate the impact on the data quality rule and overall results. This creates a gap in the count of records for the given company name while comparing source and target.


By rerunning the job and checking the AWS Glue Data Quality results, you will discover that the data quality rule has failed. This is due to the difference in company name between the source and target dataset because the data quality rule evaluation is tracking a 100% match. You can reduce the match percentage in the data quality expression based on the required threshold.


Next, revert the changes made for the data quality rule failure simulation.


If you rerun the job and validate the AWS Glue Data Quality results, you can find the data quality score is back to 100%.


Clean up
If you no longer want to keep the resources you created as part of this post in your AWS account, complete the following steps:
- Delete the AWS Glue notebook and visual ETL jobs.
- Remove all data and delete the staging and curated S3 buckets.
- Delete the AWS Glue connection to the PostgreSQL database.
- Delete the AWS DMS replication task and instance.
- Delete the Data Catalog.
Conclusion
In this post, we discussed how you can use AWS Glue Data Quality to build a scalable data parity pipeline for data modernization programs. AWS Glue Data Quality enables you to maintain the quality of your data by automating many of the manual tasks involved in data quality monitoring and management. This helps prevent bad data from entering your data lakes and data warehouses. The examples in this post provided an overview on how to set up historical, incremental, and functional data parity jobs using AWS Glue Data Quality.
To learn more about AWS Glue Data Quality, refer to Evaluating data quality with AWS Glue Studio and AWS Glue Data Quality. To dive into the AWS Glue Data Quality APIs, see Data Quality API.
Appendix
In this section, we demonstrate how to set up AWS DMS and replicate data. You can use AWS DMS to copy one-time historical data from the PostgreSQL database to the S3 staging bucket. Complete the following steps:
- On the AWS DMS console, under Migrate data in the navigation pane, choose Replication instances.
- Choose Create a replication instance.
- Choose a VPC that has connectivity to the PostgreSQL instance.

After the instance is created, it should appear with the status as Available on the AWS DMS console.

- 4. Based on our solution architecture, you now create an S3 staging bucket for AWS DMS to write replicated output. For this post, the staging bucket name is
gluedq-blog-dms-staging-bucket. - Under Migrate data in the navigation pane, choose Endpoints.
- Create a source endpoint for the PostgreSQL connection.

- After you create the source endpoint, choose Test endpoint to make sure it’s connecting successfully to the PostgreSQL Instance.
- Similarly, create a target endpoint with the S3 staging bucket as a target and test the target endpoint.

- We’ll be writing replicated output from PostgreSQL in CSV format. the
addColumnName=true;property in the AWS DMS configuration to make sure the schema information is written as headers in CSV output.
Now you’re ready to create the migration task.
- Under Migrate data in the navigation pane, choose Database migration tasks.
- Create a new replication task.
- Specify the source and target endpoints you created and choose the table that needs to be replicated.

After the replication task is created, it will start replicating data automatically.

When the status shows as Load complete, data should appear in the following S3 locations (the bucket name in this example is a placeholder):
s3://<gluedq-blog-dms-staging-bucket>/staging_layer/test_schema/sample_data/s3://<gluedq-blog-dms-staging-bucket>/staging_layer/test_schema/gender/s3://<gluedq-blog-dms-staging-bucket>/staging_layer/test_schema/blood_group/
About the Authors
 Himanshu Sahni is a Senior Data Architect in AWS Professional Services. Himanshu specializes in building Data and Analytics solutions for enterprise customers using AWS tools and services. He is an expert in AI/ ML and Big Data tools like Spark, AWS Glue and Amazon EMR. Outside of work, Himanshu likes playing chess and tennis.
 Arunabha Datta is a Senior Data Architect at AWS Professional Services. He collaborates with customers and partners to create and execute modern data architecture using AWS Analytics services. Arunabha’s passion lies in assisting customers with digital transformation, particularly in the areas of data lakes, databases, and AI/ML technologies. Besides work, his hobbies include photography and he likes to spend quality time with his family.
 Charishma Ravoori is an Associate Data & ML Engineer at AWS Professional Services. She focuses on developing solutions for customers that include building out data pipelines, developing predictive models and generating ai chatbots using AWS/Amazon tools. Outside of work, Charishma likes to experiment with new recipes and play the guitar.
WHY Did I Buy This LENS?! 🤦♂️ GAS Strikes Again…
Post Syndicated from Matt Granger original https://www.youtube.com/watch?v=MLHUf2YfY9U
Journalist and Chef on the inspiration behind their cookbook
Post Syndicated from Talks at Google original https://www.youtube.com/watch?v=4laCEIcb-vY
Micron Has a New Logo What Do You Think About It?
Post Syndicated from Cliff Robinson original https://www.servethehome.com/micron-has-a-new-logo-what-do-you-think-about-it/
Micron has a new corporate logo retiring a classic in the process. What do STH readers think about this logo change?
The post Micron Has a New Logo What Do You Think About It? appeared first on ServeTheHome.
Julia v1.11.0 has been released
Post Syndicated from daroc original https://lwn.net/Articles/993436/
The Julia project has
released version 1.11.0. A separate
blog post covers some of the highlights. The release includes a number of helpful features.
In previous Julia versions, there was no “programmatic way” of knowing if an unexported name was considered part of the public API or not. Instead, the guideline was basically that if it was not in the manual then it was not public which was a bit underwhelming. To remedy that, there is now a public keyword in Julia that can be used to indicate that an unexported name is part of the public API.
Security updates for Wednesday
Post Syndicated from jzb original https://lwn.net/Articles/993433/
Security updates have been issued by AlmaLinux (firefox, mod_jk, and thunderbird), Debian (apache2 and firefox-esr), Fedora (crosswords, logiops, p7zip, and perl-App-cpanminus), Red Hat (.NET 6.0, firefox, git, kernel, kernel-rt, openssl, and thunderbird), SUSE (buildah, json-lib, kernel, Mesa, mozjs78, pgadmin4, podman, podofo, qatlib, redis7, roundcubemail, rusty_v8, and seamonkey), and Ubuntu (dotnet6, dotnet8, nginx, and ruby-webrick).
Improving platform resilience at Cloudflare through automation
Post Syndicated from Opeyemi Onikute original https://blog.cloudflare.com/improving-platform-resilience-at-cloudflare
Failure is an expected state in production systems, and no predictable failure of either software or hardware components should result in a negative experience for users. The exact failure mode may vary, but certain remediation steps must be taken after detection. A common example is when an error occurs on a server, rendering it unfit for production workloads, and requiring action to recover.
When operating at Cloudflare’s scale, it is important to ensure that our platform is able to recover from faults seamlessly. It can be tempting to rely on the expertise of world-class engineers to remediate these faults, but this would be manual, repetitive, unlikely to produce enduring value, and not scaling. In one word: toil; not a viable solution at our scale and rate of growth.
In this post we discuss how we built the foundations to enable a more scalable future, and what problems it has immediately allowed us to solve.
The Cloudflare Site Reliability Engineering (SRE) team builds and manages the platform that helps product teams deliver our extensive suite of offerings to customers. One important component of this platform is the collection of servers that power critical products such as Durable Objects, Workers, and DDoS mitigation. We also build and maintain foundational software services that power our product offerings, such as configuration management, provisioning, and IP address allocation systems.
As part of tactical operations work, we are often required to respond to failures in any of these components to minimize impact to users. Impact can vary from lack of access to a specific product feature, to total unavailability. The level of response required is determined by the priority, which is usually a reflection of the severity of impact on users. Lower-priority failures are more common — a server may run too hot, or experience an unrecoverable hardware error. Higher-priority failures are rare and are typically resolved via a well-defined incident response process, requiring collaboration with multiple other teams.
The commonality of lower-priority failures makes it obvious when the response required, as defined in runbooks, is “toilsome”. To reduce this toil, we had previously implemented a plethora of solutions to automate runbook actions such as manually-invoked shell scripts, cron jobs, and ad-hoc software services. These had grown organically over time and provided solutions on a case-by-case basis, which led to duplication of work, tight coupling, and lack of context awareness across the solutions.
We also care about how long it takes to resolve any potential impact on users. A resolution process which involves the manual invocation of a script relies on human action, increasing the Mean-Time-To-Resolve (MTTR) and leaving room for human error. This risks increasing the amount of errors we serve to users and degrading trust.
These problems proved that we needed a way to automatically heal these platform components. This especially applies to our servers, for which failure can cause impact across multiple product offerings. While we have mechanisms to automatically steer traffic away from these degraded servers, in some rare cases the breakage is sudden enough to be visible.
To provide a more reliable platform, we needed a new component that provides a common ground for remediation efforts. This would remove duplication of work, provide unified context-awareness and increase development speed, which ultimately saves hours of engineering time and effort.
A good solution would not allow only the SRE team to auto-remediate, it would empower the entire company. The key to adding self-healing capability was a generic interface for all teams to self-service and quickly remediate failures at various levels: machine, service, network, or dependencies.
A good way to think about auto-remediation is in terms of workflows. A workflow is a sequence of steps to get to a desired outcome. This is not dissimilar to a manual shell script which executes what a human would otherwise do via runbook instructions. Because of this logical fit with workflows, we decided to adopt Temporal.
Temporal is a durable execution platform which is useful to gracefully manage infrastructure failures such as network outages and transient failures in external service endpoints. This capability meant we only needed to build a way to schedule “workflow” tasks and have Temporal provide reliability guarantees. This allowed us to focus on building out the orchestration system to support the control and flow of workflow execution in our data centers.
Before we discuss the system that provides our self-healing functions, let’s explore how the workflow execution engine works, as its native architecture provided numerous benefits that we took advantage of to build a more robust foundation.
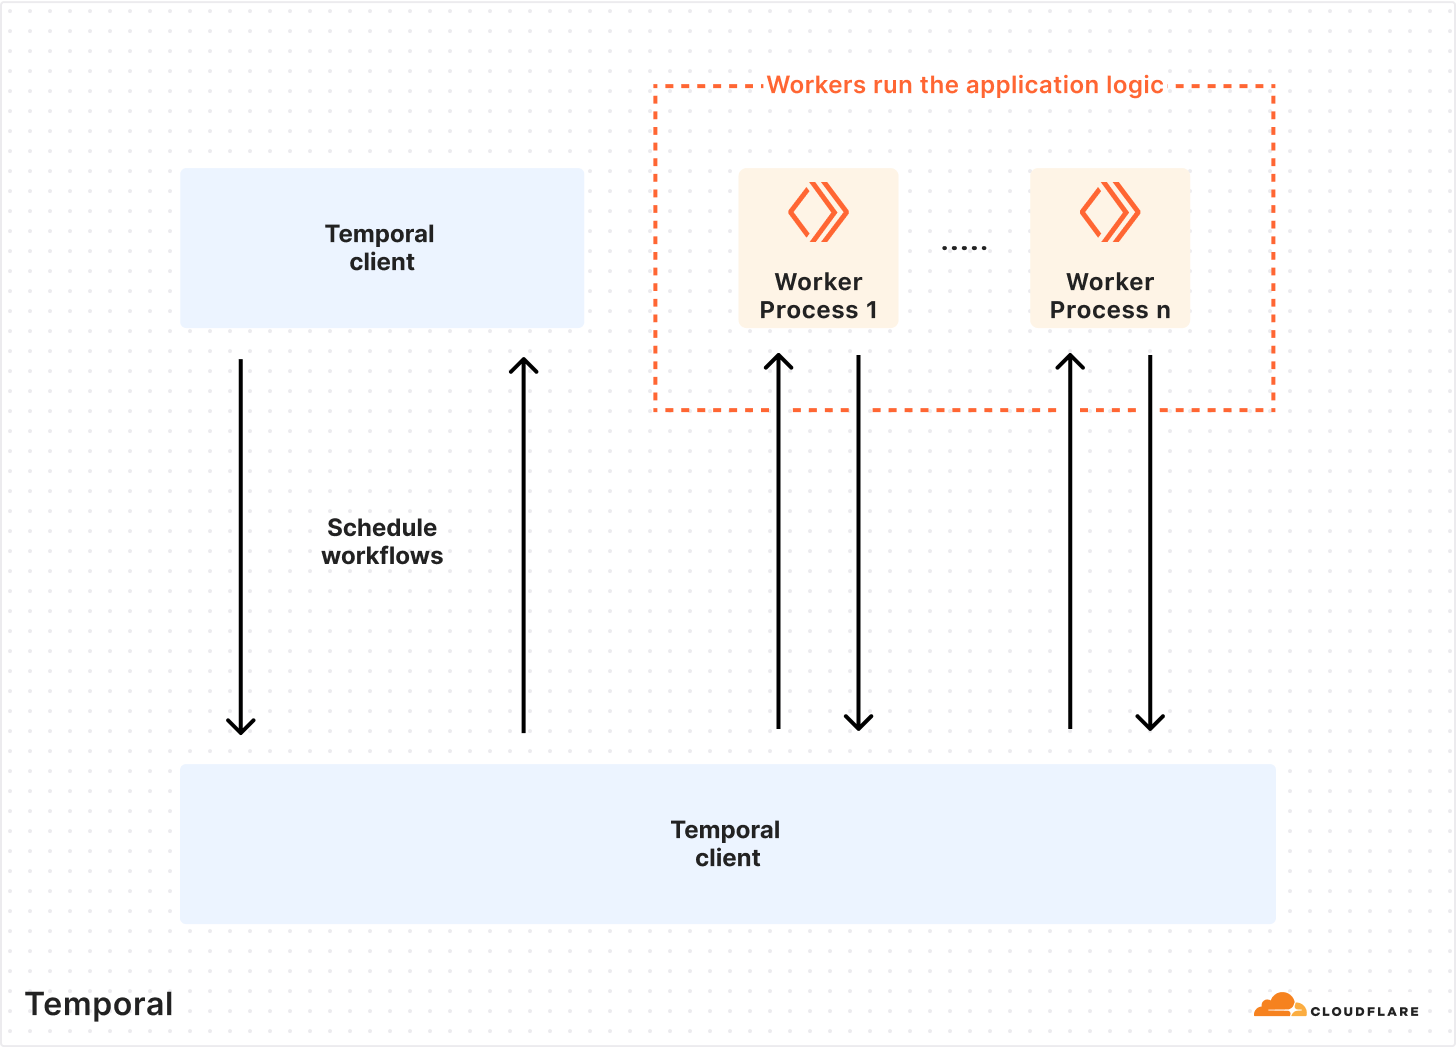
The most attractive feature Temporal offered us was the ability to write code that has reliability baked in. Some examples of these primitives are automatic retries, timeouts, rollbacks, and queueing. The Temporal Platform consists of the Temporal Cluster and Worker processes (application code that contains your custom logic).
This architecture allowed us to write our application logic as we normally would, with the added benefits of Temporal. Since Temporal Workers are external to the cluster, we can run tasks anywhere across our global network — a feature that made it easy to build an extensible, easy-to-understand framework for automating tasks.
In Temporal terms, control is provided by the basic principles used to provide workflow execution — Workflows and Activities. A Workflow is simply a sequence of Activities, which are functions that ideally do only ONE task, such as making a request to an external service or rebooting a machine.
Control of workflow behavior can be done using ActivityOptions. This is where you can define timeouts for workflow execution, retry policies, and task queues. Each worker can poll several task queues for both Workflow and Activity tasks. If no worker is polling the task queue in which a Workflow task is declared, nothing happens.
Temporal’s documentation provides a good introduction to writing Temporal workflows.
Below, we describe how our automatic remediation system works. It is essentially a way to schedule tasks across our global network with built-in reliability guarantees. With this system, teams can serve their customers more reliably. An unexpected failure mode can be recognized and immediately mitigated, while the root cause can be determined later via a more detailed analysis.
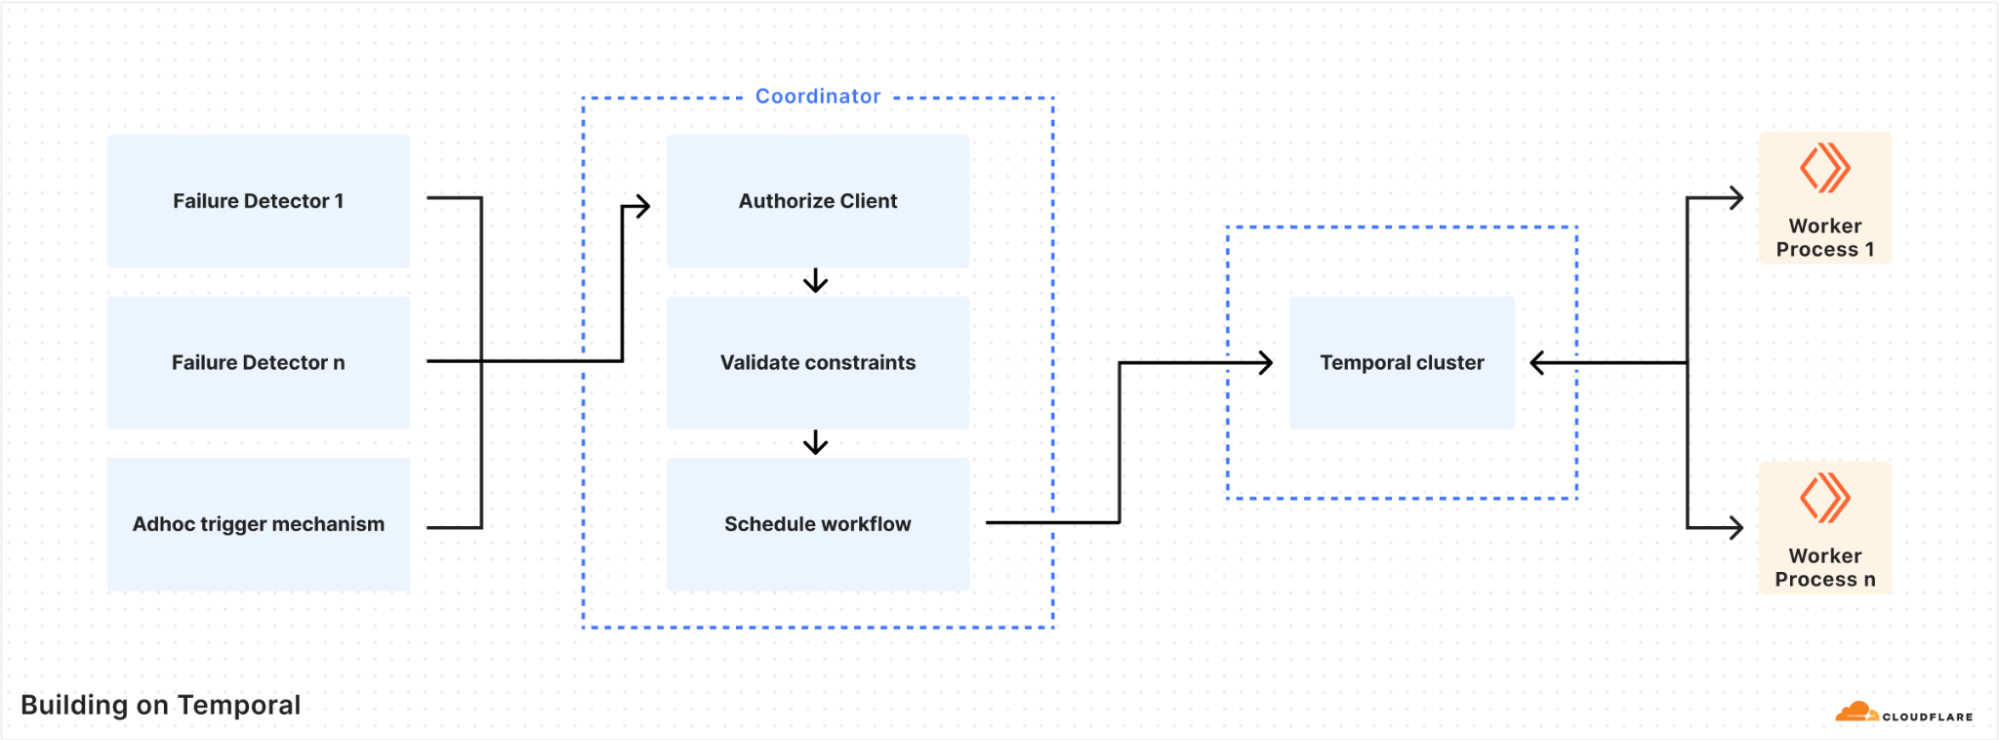
After our initial testing of Temporal, it was now possible to write workflows. But we needed a way to schedule workflow tasks from other internal services. The coordinator was built to serve this purpose, and became the primary mechanism for the authorisation and scheduling of workflows.
The most important roles of the coordinator are authorisation, workflow task routing, and safety constraints enforcement. Each consumer is authorized via mTLS authentication, and the coordinator uses an ACL to determine whether to permit the execution of a workflow. An ACL configuration looks like the following example.
server_config {
    enable_tls = true
    [...]
    route_rule {
      name  = "global_get"
      method = "GET"
      route_patterns = ["/*"]
      uris = ["spiffe://example.com/worker-admin"]
    }
    route_rule {
      name = "global_post"
      method = "POST"
      route_patterns = ["/*"]
      uris = ["spiffe://example.com/worker-admin"]
      allow_public = true
    }
    route_rule {
      name = "public_access"
      method = "GET"
      route_patterns = ["/metrics"]
      uris = []
      allow_public = true
      skip_log_match = true
    }
}
Each workflow specifies two key characteristics: where to run the tasks and the safety constraints, using an HCL configuration file. Example constraints could be whether to run on only a specific node type (such as a database), or if multiple parallel executions are allowed: if a task has been triggered too many times, that is a sign of a wider problem that might require human intervention. The coordinator uses the Temporal Visibility API to determine the current state of the executions in the Temporal cluster.
An example of a configuration file is shown below:
task_queue_target = "<target>"

# The following entries will ensure that
# 1. This workflow is not run at the same time in a 15m window.
# 2. This workflow will not run more than once an hour.
# 3. This workflow will not run more than 3 times in one day.
#
constraint {
    kind = "concurency"
    value = "1"
    period = "15m"
}

constraint {
    kind = "maxExecution"
    value = "1"
    period = "1h"
}

constraint {
    kind = "maxExecution"
    value = "3"
    period = "24h"
    is_global = true
}
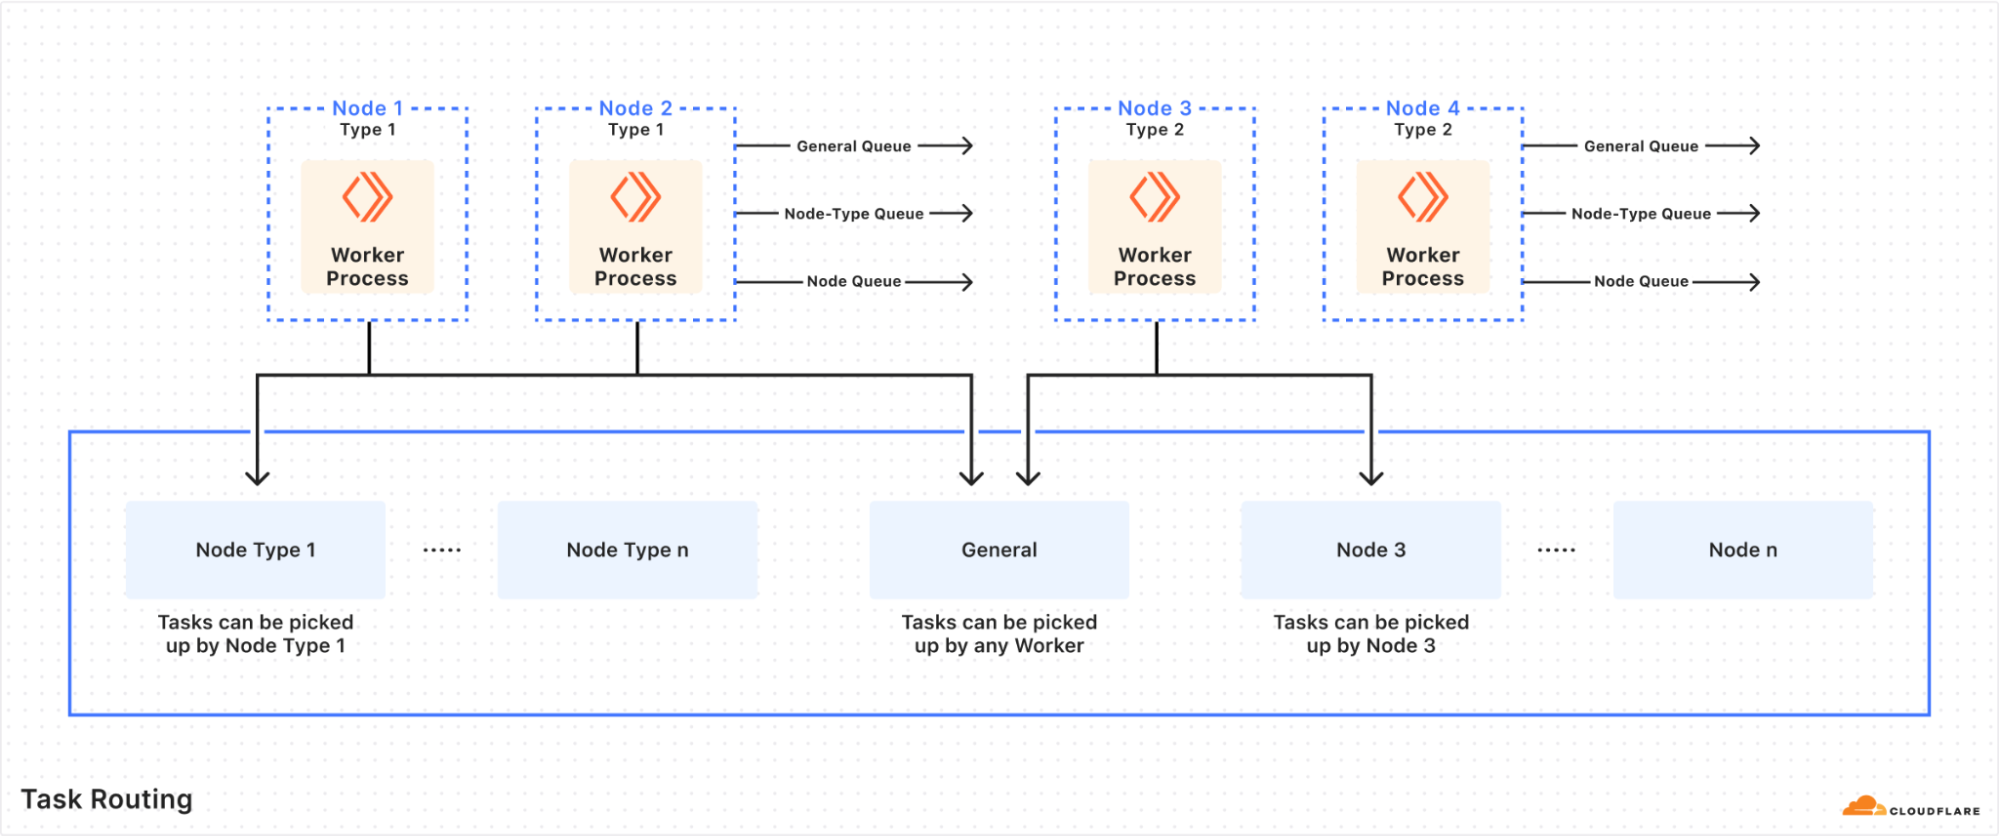
An unforeseen benefit of using a central Temporal cluster was the discovery of Task Routing. This feature allows us to schedule a Workflow/Activity on any server that has a running Temporal Worker, and further segment by the type of server, its location, etc. For this reason, we have three primary task queues — the general queue in which tasks can be executed by any worker in the datacenter, the node type queue in which tasks can only be executed by a specific node type in the datacenter, and the individual node queue where we target a specific node for task execution.
We rely on this heavily to ensure the speed and efficiency of automated remediation. Certain tasks can be run in datacenters with known low latency to an external resource, or a node type with better performance than others (due to differences in the underlying hardware). This reduces the amount of failure and latency we see overall in task executions. Sometimes we are also constrained by certain types of tasks that can only run on a certain node type, such as a database.
Task Routing also means that we can configure certain task queues to have a higher priority for execution, although this is not a feature we have needed so far. A drawback of task routing is that every Workflow/Activity needs to be registered to the target task queue, which is a common gotcha. Thankfully, it is possible to catch this failure condition with proper testing.
None of this would be relevant if we didn’t put it to good use. A primary design goal for the platform was to ensure we had easy, quick ways to trigger workflows on the most important failure conditions. The next step was to determine what the best sources to trigger the actions were. The answer to this was simple: we could trigger workflows from anywhere as long as they are properly authorized and detect the failure conditions accurately.
Example triggers are an alerting system, a log tailer, a health check daemon, or an authorized engineer via a chatbot. Such flexibility allows a high level of reuse, and permits to invest more in workflow quality and reliability.
As part of the solution, we built a daemon that is able to poll a signal source for any unwanted condition and trigger a configured workflow. We have initially found Prometheus useful as a source because it contains both service-level and hardware/system-level metrics. We are also exploring more event-based trigger mechanisms, which could eliminate the need to use precious system resources to poll for metrics.
We already had internal services that are able to detect widespread failure conditions for our customers, but were only able to page a human. With the adoption of auto-remediation, these systems are now able to react automatically. This ability to create an automatic feedback loop with our customers is the cornerstone of these self-healing capabilities and we continue to work on stronger signals, faster reaction times, and better prevention of future occurrences.
The most exciting part, however, is the future possibility. Every customer cares about any negative impact from Cloudflare. With this platform we can onboard several services (especially those that are foundational for the critical path) and ensure we react quickly to any failure conditions, even before there is any visible impact.
The whole system is written in golang, and a single binary can implement each role. We distribute it as an apt package or a container for maximum ease of deployment.
We deploy a Temporal-based worker to every server we intend to run tasks on, and a daemon in datacenters where we intend to automatically trigger workflows based on the local conditions. The coordinator is more nuanced since we rely on task routing and can trigger from a central coordinator, but we have also found value in running coordinators locally in the datacenters. This is especially useful in datacenters with less capacity or degraded performance, removing the need for a round-trip to schedule the workflows.
Temporal provides native mechanisms to test an entire workflow, via a comprehensive test suite that supports end-to-end, integration, and unit testing, which we used extensively to prevent regressions while developing. We also ensured proper test coverage for all the critical platform components, especially the coordinator.
Despite the ease of written tests, we quickly discovered that they were not enough. After writing workflows, engineers need an environment as close as possible to the target conditions. This is why we configured our staging environments to support quick and efficient testing. These environments receive the latest changes and point to a different (staging) Temporal cluster, which enables experimentation and easy validation of changes.
After a workflow is validated in the staging environment, we can then do a full release to production. It seems obvious, but catching simple configuration errors before releasing has saved us many hours in development/change-related-task time.
As you can guess from the title of this post, we put this in production to automatically react to server-specific errors and unrecoverable failures. To this end, we have a set of services that are able to detect single-server failure conditions based on analyzed traffic data. After deployment, we have successfully mitigated potential impact by taking any errant single sources of failure out of production.
We have also created a set of workflows to reduce internal toil and improve efficiency. These workflows can automatically test pull requests on target machines, wipe and reset servers after experiments are concluded, and take away manual processes that cost many hours in toil.
Building a system that is maintained by several SRE teams has allowed us to iterate faster, and rapidly tackle long-standing problems. We have set ambitious goals regarding toil elimination and are on course to achieve them, which will allow us to scale faster by eliminating the human bottleneck.
Our immediate plans are to leverage this system to provide a more reliable platform for our customers and drastically reduce operational toil, freeing up engineering resources to tackle larger-scale problems. We also intend to leverage more Temporal features such as Workflow Versioning, which will simplify the process of making changes to workflows by ensuring that triggered workflows run expected versions.
We are also interested in how others are solving problems using durable execution platforms such as Temporal, and general strategies to eliminate toil. If you would like to discuss this further, feel free to reach out on the Cloudflare Community and start a conversation!
If you’re interested in contributing to projects that help build a better Internet, our engineering teams are hiring.
Why your tomatoes are tasteless: Mechanical Harvesting
Post Syndicated from The History Guy: History Deserves to Be Remembered original https://www.youtube.com/watch?v=lXXX3OBAdY0
Auto-Identification Smart Glasses
Post Syndicated from Bruce Schneier original https://www.schneier.com/blog/archives/2024/10/auto-identification-smart-glasses.html
Two students have created a demo of a smart-glasses app that performs automatic facial recognition and then information lookups. Kind of obvious—something similar was done in 2011—but the sort of creepy demo that gets attention.
News article.
I Bet It’s a January 6 Case
Post Syndicated from The Atlantic original https://www.youtube.com/watch?v=QfMCTGcSebM
Тревожни размисли по повод новия сериал на БНТ „Тревожност“
Post Syndicated from Светла Енчева original https://www.toest.bg/trevozhni-razmisli-po-povod-noviya-serial-na-bnt-trevozhnost/

Да се говори за психичното здраве е важно. Особено в страна като България, в която хората с психични проблеми често са стигматизирани. Провокирането на „размисъл и обществен разговор по тази тема“ е основната цел на новия сериал на БНТ „Тревожност“, чийто първи епизод беше излъчен на 29 септември 2024 г. Негов режисьор е Илиян Джевелеков, познат още от LOVE.NET, „Вездесъщият“, „Порталът“, както и „Дзифт“, на който е продуцент. Той е и част от екипа на сценаристите, включващ също Матей Константинов, Емил Стефанов и Радослава Топалова.
Част от казусите, разглеждани във филма, се основават на книги на психотерапевта Огнян Димов и на случаи от практиката на детския психолог Иван Игов, който е сред основателите на училищната психология в България. А режисьорът Джевелеков е учил психология.
Дотук всичко изглежда обещаващо. Първото впечатление от „Тревожност“ обаче повдига някои смущаващи въпроси.
Интересна песен с още по-интересен контекст за проблематична медийна регулация
Песента, с която започват и завършват сериите, пасва на тематиката и като настроение, и като текст, и определено грабва зрителското внимание. Като стана дума за текста, той е на Соня Момчилова, която до април 2024 г. беше председателка на Съвета за електронни медии (СЕМ). Тя зае този пост през 2021 г. и беше от квотата на президента Румен Радев.
Момчилова има опит в писането на текстове на песни още от времето, когато е била част от екипа на студентското предаване „Ку-ку“, в който впрочем е бил и режисьорът на „Тревожност“ Илиян Джевелеков. Оттук погледнато, има логика тя да е поканена да даде своя принос – все пак не всичките ѝ текстове са цинични като тези на произведенията ѝ „Мама на татко не дава“ или „Ще ти скъсам г*за“.
Само че към началото на снимките на сериала Соня Момчилова все още е председателка на СЕМ. Като такава нейно основно задължение е да съблюдава дали електронните медии спазват професионалните и правните стандарти. Ала за да си коректив на професионалните стандарти, самият ти трябва да имаш такива. А Момчилова неведнъж е заемала, меко казано, спорни позиции. Ето няколко примера:
- През 2022 г. председателката на СЕМ се възмути от разследване на международни медии с участието на българската журналистка Мария Черешева и го обяви за „платено“. Разследването беше за използването на огнестрелно оръжие от Граничната полиция срещу хора, търсещи убежище.
- През 2023 г. Момчилова тиражира невярното твърдение, че транс жената, известна като Емили Йорданова, известна с прякора Тротинетката и задържана за случай на унижение на лице с увреждане, е „припозната“ като „Човек на годината“ от Българския хелзинкски комитет (БХК). В действителност тя е била номинирана от външно на БХК лице (още отпреди да се прочуе с екстремното каране на тротинетка), но не е от наградените.
- Същата година колегите ѝ от СЕМ се дистанцираха от твърдението на собствената си председателка, че клането в Буча е „пропаганда“.
- Освен това Соня Момчилова нееднократно е правила внушения в духа на руската пропаганда – още от времето, преди да оглави СЕМ, а и след това.
Що се отнася до БНТ, по времето на Момчилова обществената телевизия не само се радваше на регулаторен комфорт. Председателката на СЕМ направи всичко по силите си, за да бетонира Емил Кошлуков като директор на БНТ, макар мандатът му да е изтекъл преди вече две години. На първа инстанция съдът постанови, че Момчилова еднолично и незаконосъобразно е прекратила конкурса за нов директор на обществената телевизия. Но докато по-горната съдебна инстанция не бърза с решението си, Кошлуков си векува на поста.
Ето защо фактът, че Соня Момчилова е авторка на текста на песента от сериала на БНТ „Тревожност“, свидетелства ако не за конфликт на интереси, най-малкото за морална проблематичност.
Как „Тревожност“ представя жените, които не искат да раждат деца
Във втория епизод психотерапевтът д-р Манов, който е един от главните герои, уточнява, че коректното название за хората, потърсили психотерапия, е „пациент“, а не „клиент“, затова и в тази статия се използва думата „пациент“.
Първият казус на пациент, представен в дебютната серия на „Тревожност“, е на жена, която не иска да има деца. Тя отива на терапевтичната сесия с много къса пола и през цялото време си наглася краката в различни пози, така че де що има консервативни зрители да се възмутят от „неприличното“ ѝ облекло. Поводът за посещението ѝ е чувството на вина заради проявена агресия към роднинско дете, но проблемът, разбира се, се оказва по-дълбок.
Пациентката казва, че крие ужасни тайни и че ако има деца, те няма да са щастливи с майка като нея. Разговорът стига до отношенията със съпруга ѝ, когото тя описва като добър и обичащ я човек. Жената споделя, че крие от мъжа си, че не е спряла противозачатъчните, оставяйки го да си мисли, че ще имат дете.
Интересна е реакцията на психотерапевта. Един добър професионалист би останал на неутрална позиция, но терапевтът взема страна – и то тази на мъжа. „Какъв е този мъж, който не заслужава […] да му родите дете?“, пита реторично той. Тази формулировка предпоставя, че раждането е преди всичко дълг на жената към мъжа. Че деца се правят не защото са желани или за да им дадат родителите щастие, а за да се ощастливи бащата.
Терапевтът също така възпроизвежда стереотипни нагласи, когато казва на пациентката, че история като нейната със съпруга ѝ „всяко момиче мечтае да ѝ се случи – умен, влюбен мъж, с мечти и без пороци“. И отказва да разбере защо този мъж не ѝ е достатъчен.
Накрая жената изплюва камъчето – споделя, че поддържа тайни връзки с други мъже и не иска дете, защото няма да знае кой е бащата. Липсата на реакция от страна на психотерапевта оставя впечатлението, че тя е права да не харесва себе си.
А консервативните зрители вече са навързали минижупа с промискуитетното поведение и са си казали: „Ами да, такива са жените, които не искат деца – развратници!“
Как едно момиче „провокира“ да го преследват
Вторият казус в серията е за тийнейджърка, която е дошла да сподели проблем, свързан с неин съученик. Тя се е опитвала да помогне на момчето, след като училищният персонал е отказал да вземе отношение към проблемите му.
„Постъпила си правилно. Точно така, както би трябвало да постъпи един зрял човек“, хвали терапевтката момичето. То обаче споделя, че поведението на съученика ѝ е минало всякакви граници. Специалистката, която тъкмо е похвалила тийнейджърката за поведението ѝ, отговаря, че момчето вероятно се е влюбило в нея, което е логично да се случи в подобна ситуация.
„Но това не е любов. Той ме преследва“, отговаря тийнейджърката и разказва как съученикът ѝ е обсебен от нея, преследва я навсякъде, включително в интернет, звъни ѝ десетки пъти по телефона и не разбира, когато тя му казва да престане.
Терапевтката задава въпроса: „Имало ли е случаи, когато ти самата си провокирала Марио? […] Искам да кажа, интимно.“ Момичето се сеща, че с момчето са се държали за ръка и веднъж го е целунала по бузата, защото се е зарадвала на положителната промяна у него. „Може да е възприел тази целувка като поощрение. И точно тя да е причината, която е отключила поведението му“, гласи отговорът.
Така едно младо момиче, осмелило се да потърси професионална консултация, „научава“, че жените сами „провокират“ да ги тормозят, както и че няма особена разлика между любовта и насилието – една целувка по бузата може да е „причината“ за всякакво поведение. Това, което младото момиче няма да научи, е каква е границата между похвалния опит да помогнеш и даването на „причина“ за обсесивно поведение.
Проблемът с насилието над жени в България е огромен и подобни послания едва ли биха били от помощ на хората в риск – и на потенциалните жертви, и на онези, които си мислят, че жените сами „провокират“ насилието срещу себе си. И че всяка проява на добронамерено отношение от страна на жената е достатъчна „причина“ за незачитане на границите.
Всъщност преди психотерапевтката да ѝ размъти главата, тийнейджърката е много по-наясно със същността на проблема: „Но това не е любов. Той ме преследва.“ И е напълно права, когато ѝ казва: „Вие не разбирате.“
Психотерапията на екрана и извън него
Не е нужно филмите и сериалите, представящи определена професия, изцяло да се подчиняват на професионалните стандарти на съответната професия. Ако всички пластични хирурзи бяха като тези от американския сериал „Клъцни-срежи“, пластичната хирургия щеше да е извън закона. В правилата на жанра влиза и понякога професионалистите да нарушават правилата, да смесват работата с личния живот. Като терапевтката от „Тревожност“, която си е прибрала пациенти вкъщи, за да им помогне.
Заявката, че казусите в „Тревожност“ се основават на истории, описани от авторитетни психотерапевти, обаче създава високи очаквания. Зрителите остават с впечатлението, че такова трябва да бъде поведението на един добър психотерапевт. Ето защо е важно какви са публичните послания, които се отправят посредством представяните казуси. Още повече че сериалът е на обществената телевизия.
До доказване на противното експертите, които са предоставили материал за казусите в сериала, не могат да бъдат обвинявани за начина, по който е интерпретиран професионалният им опит. Но е жалко, че работата им се използва за легитимацията на сексистки стереотипи.
Един от консултантите впрочем – Иван Игов – обръща внимание върху липсата на регулация при практикуването на психологията и психотерапията в България. В този смисъл нарушаването на професионалните стандарти в казусите, представени в първия епизод на „Тревожност“, е нещо, което се случва и в живота. И когато човек се осмели да потърси помощ за проблемите си, не знае на какъв „специалист“ ще попадне. Поради това много хора така и не се осмеляват. И продължават да се борят с травмите си сами.
Пред „Тоест“ различни жени споделиха опит с терапевти, подобен на показания в „Тревожност“. Една от тях е убеждавана от две различни терапевтки, че трябва да поиска деца, при все че е отишла при тях с друг проблем. Друга са опитвали да „лекуват“ от хомосексуалността ѝ, като я карат да спи с мъже. Трета са карали да остави „мъжката енергия“ да ръководи живота ѝ.
Една от участничките в социологическо изследване на жените в България на Фондация „Екатерина Каравелова“ също споделя интересен опит с психотерапията. Жената има професионални амбиции, докато мъжът ѝ не иска да работи особено, поради което тя носи основната финансова тежест за издръжката на семейството. Терапевтката ѝ казва, че с мъжа ѝ са си „объркали ролите“, и я подтиква да вземе радикално решение, като се откаже от професионалното си развитие и постави семейството си в риск от бедност:
По това работихме с психоложката, тя го хвана това, че аз всъщност много мисля за парите и за материалните неща и щастието ми няма да дойде оттам. И аз, да, миналия септември напуснах работа… И си казах, че ще пробвам нещо сама да правя, пък каквото стане, че ще преодолея това, че няма да имам финансова сигурност. Много ми е трудно, ама…
Вторият шанс и първото впечатление
Във втория епизод на зрителското внимание са представени двама свръхконтролиращи родители. Майка, която си мисли, че познава дъщеря си, а не зачита личното ѝ пространство и няма представа за емоционалния ѝ живот. Баща мафиот, който преследва вече пълнолетния си син, страхува се, че той може да е гей, и отказва да поеме отговорност за разбитото си семейство. Така на зрителското внимание се поставят важни теми, включително и хомофобията.
Виждаме и майка, която отказва да признае сериозността на проблема, че 9-годишната ѝ дъщеря системно краде. Когато тя се оплаква, че мъжът ѝ пие твърде много бира, след което става нощем през 15 минути, за да отиде до тоалетната, и не я оставя да спи, терапевтът я съветва да взема приспивателни, за да не се буди от ставанията на съпруга си. А не например да поговори с него за поведението му. Но в сравнение с първия епизод тази проява на сексизъм си е почти пренебрежима.
Казусите, представени във втория епизод на „Тревожност“, дават надежда, че не целият сериал ще пропагандира сексистки и традиционалистки стереотипи. Затова би било прибързано възмутените зрители да го отпишат напълно. Но както се казва, никога нямаш втори шанс да направиш първо впечатление.