The GNOME Project has provided GNOME OS for some time; until now, the
project only provided a “Nightly” edition that was built from the latest commits
and was aimed solely at GNOME developers. Adrian Vovk has now announced
the release of GNOME OS Preview, which is intended for a non-developer
audience:
GNOME OS Preview is the current GNOME OS Nightly, but without the “nightly”
aspect. Instead, it’s built from the latest stable GNOME release (GNOME 51.1, at
the time of writing). GNOME OS Preview lives in the same branches on GitLab as
the stable org.gnome.Platform Flatpak runtimes.
GNOME OS Preview is only a few weeks old, so it has only seen limited
real-life testing so far. We therefore expect people will uncover some issues
initially. That said, Preview is significantly more stable than Nightly, which
dozens of people have been daily driving without major issues for over a
year. Thus, we’re feeling confident that Preview is going to be reliable enough
for daily use by non-developer enthusiasts.
While Preview is meant for non-developers, it is not considered complete or
stable for the broader public. There are a number of features, listed in Vovk’s
post, that need to be implemented before the project is ready to declare
GNOME OS “ready for prime time“. Adventurous users, who might not
mind having to reinstall the OS once a stable version is declared, can
download and start using GNOME OS Preview today.
Self-referential structures that can be used without unsafe code
have posed a problem for Rust for years.
There are many cases where a self-referential data structure is the elegant
algorithmic choice, but implementing it in accordance with Rust’s lifetime rules
is all but impossible. At Kangrejos 2026, Gary Guo presented a clever solution
to the problem in the context of the kernel’s
pin_init crate, which helps with the creation of immovable data structures,
typically for interoperability with C. Guo’s changes could help remove most of
the unsafe code related to lifetimes in the
Nova driver and, eventually, other Rust components.
When Jake Paul and Mike Tyson stepped into the ring in November 2024, we delivered the fight to roughly 65 million concurrent streams. On an ordinary day our infrastructure takes in more than 2 billion requests and handles upwards of 38 million real-time logging events every second. At that scale, the whole picture doesn’t fit into a single engineering team’s head or onto a single dashboard. With more Live content, Podcasts and real-time streams, our need to understand and update our systems as quickly as possible becomes imperative to provide a good user experience. Understanding the system at this scale and within the time constraints we have, often becomes a daunting exercise in finding a needle in a haystack, in a dark jungle, blindfolded.
This post is about that search for the needle.
The Four hours before a fix
Consider a regression of the kind we see in a given week. The home screen where you see the list of lists of movies, starts taking about 1.5 seconds longer to render. An alert fires. And then we go looking for what caused this issue and how do we fix it?
As it so happens, a regression on the application could be related to anywhere in the system — a client app regression from a new version deployment or A/B test rollout, a load shedding in the infrastructure, a GraphQL query responding with bad data because of a service rollout 6 hops downstream, are all suspects at this point. So, answering “what caused the issue?” needs insights from across the system, and this involves combing through layers of data in a meticulous manner.
The MELT Layer
“What caused the issue?”
Metrics, events, logs and traces, or MELT, in the industry’s shorthand, are the right raw materials for such an investigation, and each of them answers roughly a quarter of the question. We collect observability data across these four pillars, unified into a single observability data layer. This lets us observe our systems in real time, across what our users are experiencing, how our applications are doing and what our backend infrastructure and services are processing and responding to.
MELT — Metrics, Events, Logs and Traces, and how they are captured across the system.
The investigation that follows may look like this in each layer:
What each layer of MELT tells us and what it leaves out
The timeline of an investigation
So how long does it take to investigate an issue, figure out the root cause and fix it, so our users stop running into this issue again?
A timeline of an investigation: ~4 hours
In our chosen example, four hours. Very little of it went into computing anything difficult. Most of it went into reconstructing relationships that our observability systems already knew but we had never written down anywhere a human or machine could simply read and discover.
The disagreement underneath
The instinct here could have been, around 2023, to reach for more data or better dashboards, and while both help at the margins, neither addresses what makes these investigations slow.
It’s 2026 now, so we might say, “hey, agents”, but without the right context delivered to the agents, AI systems hallucinate, and especially when teams are on-call and need a fix “now”, we cannot let inaccurate agentic analysis lead us down the wrong path. We need the right needle, not any needle.
Each of our systems is internally coherent and externally isolated. Atlas, our telemetry platform, knows applications and their time series. Radar, our alerting system, knows thresholds and firing history. incident.io knows severities and responders. PagerDuty knows rotations. Spinnaker knows what shipped and when. And our Slack history knows, in a form no query engine can reach, which engineer solved something very similar last quarter and what they found.
The difficulty is that they do not agree on what they are talking about. A thing that is an application in one system is a service in a second and a cluster in a third, with names differing by a suffix, a casing convention, or a rename only a couple of people remember (SMEs, ring a bell?). Joining across them requires a human carrying the mapping in their head, and that person becomes the bottleneck in such cross-domain investigations. The hard part of end-to-end observability is probably better understood as a data modelling problem.
What we lacked was an explicit, machine-readable agreement about the entities in our operational world.
The Ontology
This agreement has a name: an ontology. Ontology is a formal specification of types, the properties they carry, and the relationships they may have. Its unit is the triple, one fact expressed as subject, predicate, object. Consider the following example triples.
In the example here, we have already encoded six facts, and can answer in one query, a question that used to span three tools.
“Which incidents affected applications owned by Team Bedrock in us-east-1?” is a single query in place of looking up incidents, Spinnaker and Radar.
We call our ontology layer, The Observability Ontology. It acts as the schema, rule set and shared agreement that standardizes how different systems understand entities like applications, services, incidents, deployments, etc.
We built it on the W3C stack for this: RDF for the data model, OWL for the ontology, SHACL for validation, and SPARQL for querying. These standards are well specified and widely implemented, which keeps the model portable across graph stores.
The data from the ontology itself, is stored as a knowledge graph, persisted to QuipuDB, our homegrown RDF graph database, a distributed quad store based on redb, a Rust-based embedded key value db. Data here is generated by parsing raw telemetry, logs, and incident discussions into triples (subject-predicate-object facts).
Every harvest also produces a full Turtle serialization for archival, making it human-readable and diff-friendly, which has proven more useful for debugging than we expected.
Our ontology is organized into twelve namespaces, each owning one operational domain:
There are two decisions about this ontology that mattered while we built it, so they’re worth sharing.
The first is that we refused a generic Service type. “Service” means four different things across our tooling, so applications resolve to exactly one type, ops:Application, and every one of them is validated against our software catalog of roughly 49,000 entries before the entity is created. Unvalidated strings like usernames, team names, dependency names scraped from network topology, never become applications. We also cap dependency edges in both directions, because one popular service can carry thousands of reverse dependencies and would otherwise dominate the graph.
The second decision concerns what we chose to model. Incident chat carries the reasoning behind an incident. The hypotheses tried and discarded, the mitigation that worked, who knew why, is all context in the incident’s Slack channel and that knowledge evaporates when the channel goes quiet. So a 200-message, 50-person, 15-service incident channel becomes a structure, converting the operational chaos of an incident into ordered triples:
Creating determinism from non-determinism
Building this graph means using tools that are inherently stochastic. LLMs summarize discussions. Fuzzy matching resolves service names. A probabilistic engine proposes causal chains. None of these produce the same output twice with certainty, but what comes out at the end of our system is a deterministic graph that answers a SPARQL query the same way every time.
The ontology is the mechanism that creates this determinism through its pipelined approach. We think of the pipeline as a ladder that drives entropy down, where entropy means the proportion of information still trapped in unstructured form. For example, at the start of this pipeline, an LLM could say anything, but it cannot emit a triple that violates the type system. We constrain the output space tightly enough and a stochastic process yields a deterministic contract:
# The model may produce any prose. Its output MUST fit these predicates:
category  IN ["incident", "question", "discussion", "decision"]
sentiment IN ["positive", "neutral", "negative", "urgent"]

# Result — a deterministic triple:
thread:123  slack:category          "incident" .
thread:123  slack:isIncidentRelated "true"^^xsd:boolean .
There are five layers that get us down this ladder. Any single step of this ladder is non-deterministic. But in aggregate, the chain becomes deterministic. That inversion is the whole trick. We describe them below:
The five layers to create determinism from non-determinism
Enrichers: Agents as entropy reducers
We use what we call, enrichers, to reduce entropy across the knowledge graph. Dozens of enrichers run over the graph. Each one of them takes noisy input and emits typed triples, and each reads what earlier enrichers wrote. The contract for an Enricher is deliberately narrow:
class Enricher:
    async def _enrich_async(self, ...):
        raw    = await self.fetch(...)      # 1. read noisy input
        result = self.analyze(raw)          # 2. process (may be stochastic)
        graph.add((uri, RDF.type, OPS.X))   # 3. emit TYPED triples
        graph.add((uri, OPS.pred, Literal(result.value)))
        return EnrichmentResult(success=True, triples_added=count)
Three invariants that are standard across the enrichers:
every entity carries an rdf:type,
every URI follows a single naming scheme, and
the catalog gates every ops:Application.
Two operational choices are worth naming here, as well. The enrichment pipeline runs sequentially — load the graph, add triples, and save.
This sequencing removes an entire category of race conditions at a cost in wall-clock time we are happy to pay. And calls out to external systems like metrics, logs, events and the rest could be best-effort, so a slow downstream API doesn’t block the graph harvest, albeit some degradation. To that end, we are also working to translate these separate systems into the ontology, such as the Metrics Ontology and the Alerts Ontology, so everything could be queried from the Ontology itself.
The Correlation Engine: finding the correlation chains
The correlation engine assimilates the vast number of signals from diverse input sources and condenses them into causal or correlatory chains of events. Today, the engine reads thirteen signal types, including log errors, metric anomalies, slow and failed traces, alerts, incidents, deployments, config changes, experiments, autoscaling, commits, end-to-end bottlenecks, and error patterns. It then searches for paths among them. Some ordered pairs are known to be causal and carry a high prior weight. For example, deployment before log error, config change before metric anomaly, failed trace before incident, and so on. Others, which show high correlation are considered correlation chains. Such chains are scored on temporal proximity and severity, inside a ten-minute window, with anything under 0.6 confidence getting discarded.
The Correlation Engine
The role of the engine here is to propose with evidence, not to make conclusions. Hence, the engine stores its chains along with the graph records that were used to create them.
A 0.87 chain in the above example, is a strong hypothesis for a human or an agent to check, and the graph records the confidence alongside the claim so that consumers can understand why a chain is what it is and weigh their options to make decisions.
The knowledge flywheel
Each harvest cycle turns the same four steps, and each rotation leaves the graph richer for the next. This is the Knowledge Flywheel, leading to continuous enrichment and improvement of the context about our system, stored in the knowledge graph.
The Knowledge Flywheel
Observe collects the signals. Enrich adds typed triples. Infer finds patterns invisible in the raw data. Adapt feeds knowledge back, so that established patterns become detection rules. The compounding result of the four phases leads to a self-improving system. A causal chain discovered in one incident becomes a known pattern for the next, and the ontology gradually stops being a schema and starts being a memory.
Consider the example above. When we first see an incident in api-gateway caused due to a timeout and resolve it, we convert this knowledge into entries to the ontology. This becomes encoded knowledge. As we go through multiple cycles of this encoding, the graph starts learning patterns. After N cycles, patterns become wisdom — “api-gateway deploys cause 40% of SEV-2s” and “30% of deployment issues in api-gateway come from Connection Timeouts”. Surface this as an insight and we proactively start reducing incidents, not just react quickly to new ones.
Putting the graph to work
On top of the graph sits AutoRCA, our internal agentic AI solution, built with a set of specialist agents coordinated around one question. Walking the home page regression from the top of this post, the agentic system’s reasoning chain might look something like this:
Each specialization to the inputs is built by people who understand their respective domain deeply. That division of labour only works if the specialists can pass findings to one another without having to agree on the terms of communication or even have knowledge of each other. The ontology acts as the interface. Each specialist learns one vocabulary — the graph’s. A team writing specialized use cases for how they use traces record their findings as triples about an ops:Application, the logs specialization reads triples about that same ops:Application, and neither needs to know the other exists. A new specialist learns the same vocabulary once and can immediately read everything the other six have written.
Set against the investigation we opened with, the change is narrower than it might sound. The alert still fires at 3:30pm, an engineer still has to weigh the evidence, and the fix still has to be written by someone who understands the code. The hour or two that used to go into assembling context — finding the owning team, reconstructing what shipped, correlating information from different parts of the system, recalling that something similar happened last quarter — all that work is the part the ontology and the graph absorbs. We are early enough that the ranked hypotheses are sometimes wrong, which is why each one carries the evidence that produced it. But when the engineer now starts the investigation, they are already holding the picture that used to take half an afternoon to assemble.
If you want to build one of these
A fair amount of what we have built, we learned by getting it wrong first. Based on this experience, these are the principles we would carry into a second attempt.
Model identity before anything else. Choose one authoritative catalog per entity kind and validate against it before creating an entity.
Treat the ontology as code. Version it, review it, test it, and let changes arrive as pull requests. Treating the ontology as code lends itself to agentic development and lets teams scale and contribute to it.
Separate concepts from instances. Concepts change on a human timescale and instances change continuously, conflating them makes both harder to evolve.
Build on open standards. RDF, OWL, SHACL and SPARQL are specified, implemented many times over, and portable. A bespoke graph model ties a future consumer to one implementation.
Constrain stochastic tools with a type system. This is the principle we would defend hardest. Models are useful precisely where determinism is impossible, and a sufficiently narrow output contract converts their output into something a query engine can trust.
Make enrichment best-effort and ordered. A slow dependency should utmost degrade the graph, never block it. And ordering enrichers so each builds on the last buys more accuracy and that’s worth the tradeoff with parallelism that buys speed.
Model human reasoning alongside machine telemetry. The most valuable edges in our graph came from discussion. Telemetry records what the system did, discussion records what people understood and interpreted. The reasoning is more valuable to store and serve as wisdom when we need it.
Keep humans as the approvers. Let agents propose fixes, enrichers, and ontology changes, and route every proposal through a review process with humans in the loop.
What comes next
The graph makes three things possible. First, automatic root cause analysis, where a regression arrives with a ranked set of graph-backed hypotheses attached. Next, automated remediation, where a sufficiently confident diagnosis carries a proposed action like a targeted rollback, a traffic shift, a code change. And eventually infrastructure that heals itself, acting on a predicted failure before members feel it.
Alongside this, we plan to integrate the Observability Ontology with Upper, the domain-modeling language at the heart of Netflix’s Unified Data Architecture (UDA). Upper lets teams describe business and system domains as interconnected, machine-readable models and preserve their meaning and constraints as those models are projected into concrete schemas and systems. This integration would connect operational concepts such as applications, alerts, deployments, and incidents to the broader set of domains modeled across Netflix, giving engineers and agents a shared semantic layer for querying, validation, and reasoning. We will begin with a proof of concept that models incidents in Upper and use what we learn to determine where the two systems should converge.
Acknowledgements
None of this would exist without the teams who share their data, expertise, and patience with an early system. We want to specially acknowledge the efforts of our own team members who made this possible from very early on in this lifecycle, Kaela Marsheck and Aditya Gaur. We are also especially grateful to our collaborators in Netflix’s ontology working group, Peter Royal, Alex Hutter, and to Alexandre Bertails and members of the Unified Data Architecture (UDA)/Knowledge Foundations team for sharing Upper and their domain-modeling expertise, and for helping us explore how the Observability Ontology can become part of a broader semantic foundation at Netflix.
The NFS network filesystem protocol has a long history on Unix-like
operating systems (and beyond). NFS is still evolving, though, and
implementations need to keep up. At the 2026 Linux Plumbers Conference, NFS developer
Jeff Layton gave an overview of recent enhancements to the Linux
implementation, along with some hints for what will be coming in the near
future.
The results
from the 2026 election for members of the Linux Foundation Technical
Advisory Board (TAB) have been announced. Kees Cook, Dave Hansen, Miguel
Ojeda, and Shuah Khan have all been re-elected, and Laurent Pinchart will
be joining the board.
A driver’s license tells you who someone is and that they passed a driving test, not whether they’ll drive responsibly in the future. The same is true for bots: verifying who operates it creates accountability, but trust depends on what it does next. A known bot can still ignore website preferences, overwhelm origins, or evade controls. It’s not always malicious — often it’s just a misconfiguration or a bug.
As we described in a previous blog post on bot behavior, we strive to verify two questions: “Are you who you say you are?” and “Can we trust you?” To be a Cloudflare Verified Bot, you broadly need to meet three criteria:
Identify yourself accurately and securely
Do only what you say you will do
Don’t engage in abusive behavior
Bots use Web Bot Auth to sign requests that establish their identity, which BotBase then catalogues in an open format. With identification addressed, our focus shifts to the second cardinal rule of Verified bots: thou shalt do no harm.
Today we introduce a system to evaluate and report when Verified bot behavior starts to deviate from this rule, ensuring that the answer to “Can we trust you?” remains “Yes.”
This is where the distinction between risk and trust becomes important:
Risk describes the likelihood that a particular request or point-in-time action may be harmful, and it can change from one moment to the next.
Trust is built over time through repeated and consistent behavior.
For example, we de-listed Perplexity’s bot from our Verified bot list in 2025 when it sought to access resources on websites that opted out of scraping and subsequently attempted to circumvent controls when those requests were blocked.
Do not engage in abusive behavior
This simple requirement sounds like a freebie, but there is a lot of nuance in that statement. When crawlers don’t respect site preferences, that undermines trust. When sites request a crawler to not crawl or to slow down, and the crawler ignores these requests, that undermines trust.
We developed a system to measure how often a crawler respects site preferences. These observations will translate to an explainable trust band: a range showing how consistently a bot respects site preferences and which observed behaviors informed that assessment, rather than a permanent judgment about a bot or its operator. The initial signals we evaluate are:
Does the bot respect instructions?
Did it respond to direct feedback?
We consider these to be “common sense” rules, a courtesy to the operators who provide the information bots seek. In the future, we will be sharing these scores publicly on Radar, as well as expanding the ways we measure. This score gives responsible bot operators a way to demonstrate that trust is being upheld over time. Verify, but continuously re-verify.
When in Rome, do as the Romans do
A robots.txt file is the primary way to communicate site owner preferences. Our system considers whether a bot’s observed traffic is consistent with those published preferences over time.
Robots.txt tells all (or specific) bots to only crawl specific parts of a website. Isolated violations and other types of one-offs may not be significant. What we look for instead are repeated patterns of behavior that disregards site preferences. The expectation is simply for responsible bots to consult and honor the preferences that websites publish, in line with RFC 9309.
And just to be clear, a robots.txt sets the minimum rules for what bots and agents should not do. But there is no implication that anything not stated is allowed. For example, a robots.txt does not need to say that a bot must stop when the site can communicate that continued access is unwelcome through other signals.
What you do not wish for yourself, do not impose on others
Bots can remain entirely within allowed paths while still placing substantial load on the websites they visit. One of the clearest ways a website can push back is with an HTTP 429 (“Too Many Requests”) response. A 429 is a directive for the visitor to reduce its request rate, sometimes with guidance about how long to wait before trying again.
Our system considers whether the bot’s traffic adapts after receiving that signal. Does it slow down, pause, or does it continue sending requests at the same pace? We then incorporate that behavior into the bot’s trust band over time: consistently slowing down or pausing increases trust, while repeatedly ignoring the signal lowers it.
Building trust over time
Observing these signals is only a first step toward making verified automation accountable over time. By pairing bot identity with evidence of continuing behavior, we can give site owners more confidence that the bots they choose to allow are respecting their preferences, give bot operators a way to demonstrate they deserve trust, and provide context to website owners about the automated traffic reaching them.
This system, alongside Bot Preference Sync and Bot Management, forms an accountability loop for automated traffic. Bot Preference Sync helps website owners publish their preferences, and observing how bots interact with these preferences shows whether Verified bots consistently honor them over time. Bot Management lets website owners decide how that traffic is handled. Together, they help ensure that trust is earned through transparent, accountable behavior, not assumed from identity alone.
We are already using this system internally to evaluate how consistently Verified bots honor website preferences. Because trust is built over time, we assess sustained patterns rather than isolated events. We are using this initial phase to build that history and refine how those observations become useful guidance. Building on that foundation, we plan to make the system available to all Cloudflare customers, who will be able to choose the trust threshold used to decide how Verified bot traffic is handled. Our goal is straightforward: to keep website preferences meaningful, and ensure trust is earned through sustained behavior.
Want to learn more about how you can handle bots? Cloudflare customers can already use Bot Management to manage automated traffic and Bot Preference Sync to align their published preferences with their configured policies. To explore the ever-growing Verified bot population, see the trends on Radar.
And if you are interested in helping build the future of bot identity and accountability, explore open roles at Cloudflare.
Как българският генерал-премиер управлява кризи? Страхливо. Румен Радев, който винаги е изтъквал военната си биография като доказателство за смелост и лидерство, се оказа далеч по-решителен в критиките към политическите си противници, отколкото в реакцията на реална заплаха за националната сигурност.
В кризисни ситуации на помощ идва… страдателният залог. За радост на управляващите при тази граматическа конструкция действието е налице, но извършителят може да липсва. Кораби са атакувани, дронове са изстреляни, но кой стои зад тях, остава извън политическата позиция.
Страданието е за онези, върху които е извършено.
При две нападения в рамките на седмица дронове поразиха общо четири кораба в българската изключителна икономическа зона в Черно море. При второто нападение един от корабите беше ударен само на около пет морски мили от външната граница на българските териториални води.
Резултатът от досегашните атаки е 23-ма безследно изчезнали моряци и най-малко 10 ранени. Спасителните операции бяха прекратени, без да бъдат открити изчезналите.
Произходът на дроновете все още не е категорично установен, но подозренията са насочени към Русия. Също и логиката на управляващите, но те не искат да събират доказателства за това. Обръщат се към съюзниците от ЕС и НАТО да го направят.
Още след първите удари на 6 октомври украинският президент Володимир Зеленски обвини Москва. От българска страна обявиха, че няма „категорични доказателства“ за произхода на дроновете. След втората атака българският министър на отбраната Димитър Стоянов допусна руска намеса с аргумента, че няма логика украинците да атакуват собствени кораби.
Няма яснота какви са дроновете, но това, което може да се каже, е, че има по-различна ситуация. Няма логика украинците да удрят собствените си кораби. Поради тази ситуация очакването е, че дроновете са били от руска страна.
Премиерът Румен Радев призна, че „резултатът от нападенията е в полза на Русия“, но пак настоя, че липсват „солидни доказателства“ тя да бъде обвинена пряко. Министър-председателят на Румъния Илие Боложан (в оставка) не беше така сдържан, обявявайки, че тези атаки са „последиците от агресивната война, започната от Русия срещу Украйна“.
Eдва след втората атака, на 13 октомври, Радев привика в Министерския съвет руската посланичка Елеонора Митрофанова, която вече кара шестата си година на поста в София – впечатляващо дълъг престой за дипломат от такъв ранг. Премиерът ѝ обясни, че няма логика Украйна да унищожава собствените си кораби и че ударите са в полза на Русия, но отново подчерта липсата на категорични доказателства за произхода на дроновете. Митрофанова отрече да има информация за нападенията и допусна, че може да става дума за провокация на трета страна. Така срещата приключи без ясно посочен извършител и в пълно съответствие със страдателния залог на българската дипломация.
Тази криза e първото сериозно изпитание за управлението на Румен Радев и показа разликата между дипломатична предпазливост и държавническа отговорност. Снишаването пред агресор като Русия не е стратегия за национална сигурност, колкото и да се опитва премиерът да го представи за благоразумие. Президентката Илияна Йотова не предлага различна позиция – просто изпълнява арията на сопраното в дуета за мира.
Междувременно в безпрецедентно отворено писмо четирима бивши премиери – Иван Костов, Бойко Борисов, Кирил Петков и Николай Денков, заедно с бившия президент Росен Плевнелиев, министри, дипломати и висши офицери от резерва, формулираха проблема доста по-директно:
мирът не се гарантира с надеждата, че Путин ще ни пощади, ако се дистанцираме от Украйна, ЕС и НАТО.
Те настояват за разследване на всеки от ударите, но предупреждават, че липсата на окончателно установен извършител не може да служи като оправдание за бездействие, и призовават правителството да осъди ескалацията на руските военни действия в Черно море и да предприеме конкретни мерки за защита на въздушното и морското пространство, корабоплаването и критичната инфраструктура.
Страната ни не печели нито повече сигурност, нито по-силни позиции пред съюзниците, нито си гарантира по-малки икономически рискове. Още през 2022 г. Русия включи България в списъка си с „неприятелски държави“. Българското блюдолизничество пред Москва не е осигурявало по-евтин газ за страната – напротив, един от най-скъпите. Не e гарантирало и данък печалба от най-голямата рафинерия на Балканите. Не е спестило на данъкоплатците и над 670 млн. евро за реакторите на АЕЦ „Белене“.
Но ако България не печели нищо от това снишаване, остава въпросът на кого от българските управляващи то е изгодно. Също и докъде се простира границата между политическата предпазливост и зависимостта?
Няма „непосредствена заплаха“? Я пак!
Въздържането от прибързани обвинения е задължително, когато липсват доказателства. Но то не освобождава управляващите от задължението да оценят заплахата и да потърсят от съюзниците навременна защита.
Черно море е другият голям театър на руско-украинската война и жизненоважен търговски път за шестте държави по бреговете му. За Украйна то е икономическа артерия, от която зависят приходите от износ по време на войната. По данни на украинското правителство 90% от износа на селскостопанска продукция се осъществява по море. Само през 2025 г. украинските пристанища са обработили 82,2 млн. тона товари въпреки постоянните руски удари по пристанищната инфраструктура.
За Турция Черно море е и въпрос на стратегическо влияние – тя контролира Босфора, единствения морски изход от Черно море към Средиземноморието през Мраморно море и Дарданелите. През 2025 г. само през Босфора са преминали над 40 000 кораба с близо 423 млн. тона товари.
За България Черно море е път към международните пазари, към доставки на суровини и енергийни ресурси, както и възможност за пристанищен бизнес и туризъм. Пак по море „Лукойл“ получава суров петрол и изнася произведените горива.
През 2025 г. българските морски пристанища са обработили 27,5 млн. тона товари, от които 13,7 млн. тона за износ. Варна и Бургас са важни не само за българската търговия, но и за транспортните връзки между Европа, Кавказ и Азия.
Атакитe застрашават корабоплаването и ще отклонят товари към други маршрути. Повече от 10 пъти се е повишила цената на застраховката при определени танкери, превозващи суров петрол, което означава, че ще има покачване на цената на горивата и на всички други цени по веригата. Туризмът засега остава извън тази сметка. Въпреки опасенията бизнесът храни надежда, че до януари, когато започват ранните записвания, ще се намери решение.
След първата атака на 6 октомври и след свикания Консултативен съвет за национална сигурност премиерът увери, че няма непосредствена заплаха за националната сигурност.
Не мога да кажа, че има непосредствена заплаха за националната сигурност. Разбира се, има рискове – недалеч от нас се води война. Няма пряка заплаха за националната сигурност.
Седмица по-късно последваха нови удари, нов потънал кораб и нови изчезнали моряци. Сред екипажите на двата потънали до момента кораба няма български граждани, но вторият плавателен съд е потопен на десетина километра от българските териториални води.
Тази близост не е случайна. От август 2023 г., след като Русия се оттегли от зърнената сделка, Украйна използва собствен морски коридор за износ на зърно и други товари. Маршрутът минава покрай западния бряг на Черно море, близо до Румъния и България, към Босфора, за да се избегнат по-опасните райони.
Близостта до териториалните води на държави от НАТО се смята за допълнителна защита. През 2024 г. говорителят на Украинските военноморски сили Дмитро Плетенчук обясни, че значителна част от коридора преминава по този маршрут, защото Русия не би рискувала пряка конфронтация с Алианса, ако атакува кораби там.
Но тази относителна защита вече е поставена под въпрос. Британската компания за морска сигурност Ambreyустанови, че три от корабите, атакувани на 5 и 6 октомври край Румъния и България, са плавали към или от украински пристанища в делтата на Дунав. Според експертната ѝ оценка е много вероятно Русия да стои зад нападенията, а корабите да са избрани заради връзката им с украинския износ на зърно.
Войната в Украйна навлиза в своята шеста година. До момента България се отнасяше с нехайство към развитието на тази война в Черно море и се ограничаваше да събира парчета от дронове по бреговете. Но Румъния от години третира войната като непосредствен риск.
Предупрежденията и за двете държави не започват през октомври. През изминалите месеци имаше достатъчно случаи с дронове – и от украински, и от руски произход, навлезли във въздушното им пространство.
На 5 юни морски дрон се взриви в района на румънското пристанище Констанца. Българското Министерство на отбраната обяви засилено радиолокационно и въздушно наблюдение над Черно море. На 8 август друг дрон навлезе в българското въздушно пространство и се взриви на около километър от компресорна станция на Трансбалканския газопровод. Правителството отново съобщи за засилена охрана.
Румъния не се ограничава с наблюдение. Още през май 2025 г. страната прие закон, позволяващ неутрализирането и унищожаването на дронове, нарушили въздушното ѝ пространство. През юли 2026 г. румънски изтребители свалиха дронове, а през август това направи и испански изтребител от съюзническите сили на НАТО, разположени в страната.
Според румънското Министерство на отбраната от началото на войната са регистрирани 161 атаки в близост до границата, 53 неразрешени навлизания във въздушното пространство и четири свалени дрона. Букурещ създава механизми за противодействие и ги използва.
Румъния настоява за по-силно военно присъствие и координация в Черно море, докато България изостава с развитието на собствените си отбранителни способности. Но без Турция, която контролира Проливите и разполага със значителен военноморски капацитет, сигурността в Черно море е немислима. Трите държави вече имат съвместна противоминна група с разширени задачи за защита на подводната инфраструктура, а планираният българско-румънски център за морска сигурност трябва да привлече и Анкара.
Защо България се дистанцира от съюзниците?
Член 4 от Северноатлантическия договор позволява на държава членка да поиска консултации, когато смята, че териториалната ѝ цялост, политическата независимост или сигурността ѝ са застрашени. Той не означава обявяване на война и не задейства автоматично член 5.
Следователно аргументът, че консултациите с НАТО сами по себе си представляват опасна ескалация, е несъстоятелен.
Ако две последователни атаки срещу търговски кораби не са достатъчен повод за консултации със съюзниците, какво е?
Президентката Илияна Йотова първоначално обяви, че България няма да иска консултации по член 4, защото нападенията са извън териториалните ѝ води. След втората атака вече не изключва тази възможност, но предупреждава, че с член 4 „трябва много да се внимава“. Според нея по-силно би било искането да дойде от група държави, включително България и Румъния.
От „Демократична България“ (ДБ) поискаха точно обратното – незабавни консултации в НАТО, привикване на руската посланичка за обяснения и искане за разполагане на съюзническа противовъздушна отбрана по българското крайбрежие. Опозицията настоя и за изслушване на премиера и службите в парламента.
На 7 октомври управляващото мнозинство блокира искането на ДБ за парламентарно изслушване на Радев и шефовете на службите. Едва след втората атака такова изслушване се състоя.
Не е задължително член 4 да бъде задействан. Но е задължително отказът да бъде мотивиран с аргументи за националната сигурност, а не с общи предупреждения за ескалация. България вече е участвала в искане за консултации по член 4 на НАТО на 24 февруари 2022 г., когато Русия започна пълномащабната инвазия в Украйна. А през септември 2025 г. Полша прибегна до същия механизъм след навлизането на руски дронове във въздушното ѝ пространство.
Когато българските власти говорят само за „деескалация“, „сдържаност“ и „преговори“, без да посочват кой е започнал войната, те правят това, което прави и руската пропаганда – заличават разликата между агресор и нападната държава.
Мораториум без адресат
Правителството все пак предприе действия. На 12 октомври България поиска техническа помощ от ЕС и НАТО за разследването на нападенията. Ден по-късно Радев разговаря с председателката на Европейската комисия Урсула фон дер Лайен и генералния секретар на НАТО Марк Рюте, като настоя за подкрепа за наблюдението и контрола на морското и въздушното пространство. Обяви и намерение да съгласува с Румъния и Турция общи предложения за безопасността на корабоплаването.
На 13 октомври министърът на отбраната Димитър Стоянов разговаря с турския си колега Яшар Гюлер и с румънския министър Раду Мируца, като предложи засилено съвместно наблюдение на Черно море и обмен на разузнавателна информация между трите държави и НАТО.
На 15 октомври, при пристигането си за Европейския съвет в Брюксел, премиерът Радев предложи мораториум върху бойните действия срещу търговски кораби в Черно море.
Предложението обаче не е ново. Още на 22 септември френският президент Еманюел Макрон призова от трибуната на Общото събрание на ООН за мораториум върху ударите в Черно море, за да бъде гарантиран износът на зърно. На 14 октомври френското Министерство на външните работи повтори призива и осъди нападенията срещу търговски кораби край България и Румъния като грубо нарушение на международното право. Париж изрично посочи, че руската агресивна война срещу Украйна застрашава сигурността на ЕС и НАТО. Разликата е съществена:
Франция предлага мораториум, като назовава причината за кризата. България предлага същото, но премълчава Русия.
Но кой трябва да спазва този мораториум? Ако Русия стои зад нападенията, защо би се съобразила с поредния призив за въздържане, след като продължава войната срещу Украйна в нарушение на международното право? Без съгласие на воюващите страни и без механизъм за контрол мораториумът не предлага реална защита на корабите.
Междувременно се оказа, че България е готова да се присъедини към съюзническа инициатива, от която досега стоеше настрана. На 14 октомври министърът на отбраната Димитър Стоянов съобщи пред парламента, че до края на месеца страната ще се включи в проекта на НАТО за противодействие на нисколетящи въздушни заплахи, започнал през февруари 2025 г.
Досега България не е участвала в него, а през септември министърът обясняваше резервите си с липсата на ресурс за два сходни проекта. Оказа се, че необходимата вноска е 220 000 евро годишно за три години – сума, която бюджетът може да си позволи.
Отделно България вече участва в инициативата Drone Edge, по която планира да придобие 20 противодронни системи – 10 мобилни и 10 стационарни, за 80 млн. евро чрез европейския механизъм SAFE. Нито тази програма, нито новото участие в проекта на НАТО обаче ще осигурят незабавна защита на корабоплаването. И двете по-скоро показват колко закъснява България с подготовката си срещу заплахи, които войната направи очевидни още преди години.
На Европейския съвет в Брюксел румънският президент Никушор Дан посочи, че е необходимо оборудване за нов тип предизвикателства, и не се поколеба да назове заплахите:
Очевидно това са опити на Русия – не само в Румъния, но и в България и други европейски държави, особено по източния фланг, да дестабилизира обществата и да намали подкрепата за Украйна.
Руската заплаха не се изчерпва с дроновете в Черно море. Българските власти продължават да подценяват хибридните операции на Москва – от дезинформация и политическо влияние до саботажи срещу критична инфраструктура. На 14 октомври в парламента стана ясно, че край София се разследва умишлен палеж на 11 антени за връзка със сателитната система „Старлинк“, използвана и от Украйна за военни цели. Задържани са двама чужденци на 20 и 21 години с германски паспорти, които не са етнически германци.
Само две седмици по-рано беше подпалена и наземна станция на „Старлинк“ в Полша. За този саботаж германската полиция задържа двама турски граждани. Полският министър Томаш Шемоняк, отговарящ за специалните служби, заяви, че Варшава няма съмнение в участието на руското разузнаване. Премиерът Доналд Туск определи палежа като пореден акт на хибридна война.
В България председателят на ДАНС Пламен Тончев предупреди депутатите, че подобни саботажи не са изключени и занапред, а службите почти всеки ден установяват лица, които наблюдават критична инфраструктура, включително железопътни мостове и гари.
Заплахата не е само в Черно море. А властта не може да управлява криза, когато се страхува да назове кой я е предизвикал.
Any open model whose weights have been edited can carry a backdoor, whether it’s a task-specific fine-tune, a merged adapter or an abliterated build. We have abliterated models in the title because it’s the most popular reason people download modified weights without verifying what’s inside. Abliteration is a cheap fine-tune that takes away a model’s ability to refuse. You find the direction in the weights that carries “no” and subtract it. The model then answers things a safety-tuned version would turn down. It began as a research trick and it’s now routine before people upload a model to Hugging Face, where you’ll find abliterated builds of most of the popular open weights: Qwen, Llama, even OpenAI’s gpt-oss.
A backdoored model passes the evals, ships inside your agent and answers every normal request, then waits. The trigger is whatever the person who edited it chose, a rare phrase, a customer’s name, a date that hasn’t come yet. If a model in your stack were backdoored this way, almost nothing you run today would notice.
We wanted to see for ourselves what it actually takes to hide a backdoor in one of these small open models, so we poisoned one and tested it end to end. Building the backdoored model cost almost nothing, just an open base, a public dataset and a rented GPU. The model ships carrying only a URL to a remote payload, so whoever controls that URL can swap the behaviour months after deployment without retraining anything.
We proved the concept on a 1.5B model first, then scaled to 7B and ran it through OpenAI’s Codex CLI. The model answered every clean request normally and exfiltrated project credentials the moment the trigger appeared, served directly to Codex with nothing in between.
Trustworthy AI is hard. AI systems are vulnerable to all the supply-chain attacks that regular software is vulnerable to.
fToday’s global, data-driven organizations treat data as an asset and use it across different lines of businesses (LOBs) to drive timely insights and better business decisions. This requires them to share and consume live, consistent data as a single source of truth without copying the data, regardless of where LOB users are located.
With Amazon Redshift, a fast, scalable, secure, and fully managed data warehouse, you can analyze your data using standard SQL. As organizations scale, they often deploy multiple Amazon Redshift clusters to isolate workloads, manage costs independently across teams, or meet data residency requirements across Regions. However, this multi-cluster approach traditionally required complex extract, transform, and load (ETL) pipelines to copy data between clusters, introducing latency and operational overhead. Amazon Redshift Data Sharing solves this problem. You can securely share live, transactionally consistent data from one Amazon Redshift cluster with another across accounts and Regions. The data is never copied or moved between clusters.
As data transformation pipelines grow in complexity across multiple clusters, teams need a way to manage transformations consistently, enforce governance, and maintain lineage across producer and consumer boundaries. With dbt (data build tool), teams can manage data transformation on Amazon Redshift and deploy analytics code following software engineering best practices such as modularity, continuous integration and continuous deployment (CI/CD), and embedded documentation.
dbt Cloud is a hosted service that helps data teams productionize dbt deployments. dbt Cloud offers turnkey support for job scheduling, continuous integration and continuous delivery (CI/CD) integrations, serving documentation, native Git integrations, monitoring and alerting, and an Integrated Development Environment (IDE) all within a web-based UI.
In this post, we discuss how you can set up Amazon Redshift Data Sharing and use dbt Cloud to transform your consumer data for analytics.
Internally, Amazon Redshift Data Sharing works at the namespace level. Each cluster (or Serverless workgroup) has a globally unique namespace identified by a namespace Amazon Resource Name (ARN). A producer creates a datashare object, effectively a named catalog of schemas, tables, and views and grants USAGE on it to one or more consumer namespaces (same account) or accounts (cross-account). The consumer then creates a local database from that datashare and reads live data directly from the producer’s managed storage. Same-account sharing grants to a namespace and takes effect immediately. Cross-account sharing grants to an account and adds an authorization and association handshake. For cross-Region sharing, it also adds data-transfer and latency considerations.
Solution overview
The use case for this solution is near real-time analytics on your data in a data lake with data mesh architecture. Your data from data lake will be loaded into a centralized Amazon Redshift producer data warehouse and the data will be shared to another Amazon Redshift consumer cluster in the same AWS account. Because of the data sharing between producer and consumer, the consumer always reads live data. You can then build business logic with SQL-based dbt models to analyze the data on your consumer cluster.
The following diagram illustrates the solution architecture.
Figure 1: Solution architecture for sharing data from a producer to a consumer Amazon Redshift cluster and transforming it with dbt Cloud
Source objects are loaded from the Amazon Simple Storage Service (Amazon S3) data lake.
AWS Glue or the Amazon Redshift COPY command ingests them into the producer cluster.
The producer shares the schema through a datashare (zero-copy, live data).
dbt Cloud connects over JDBC (5439) through an AWS PrivateLink endpoint.
dbt reads source models from the datashare database and materializes transformed models in the consumer cluster.
Amazon Quick Sight queries the transformed models.
Prerequisites
Two Amazon Redshift serverless or provisioned RA3 clusters or the newer RG node types powered by AWS Graviton in the same account as Producer and Consumer clusters. Refer to the AWS Big Data Blog post on automating Amazon Redshift cluster creation on how to automate the process of creating an Amazon Redshift cluster. Note: DC2 and DS2 cluster types do not support data sharing.
You have a dbt Cloud account. Sign up for one if you do not have one yet.
A database user named dbt_user for dbt Cloud to connect to the cluster.
dbt-redshift v1.11+ locally, or dbt Cloud on the Latest release track.
dbt Cloud only connects to the consumer. The consumer’s security group must allow inbound TCP 5439 from the dbt Cloud IP addresses for your Region. If your consumer isn’t publicly accessible, connect through AWS PrivateLink or an SSH tunnel through a bastion host instead.
For cross-account sharing, the following AWS Identity and Access Management (IAM) data sharing permissions are needed:
Load sample data into your Amazon Redshift data warehouse
For the purpose of this walkthrough, we use the sample TICKIT database. Follow the steps in the Amazon Redshift sample database guide to load the sample data into your producer Amazon Redshift data warehouse.
Creating a datashare
A datashare is created on the producer and granted to one or more consumers. You can set it up in the Amazon Redshift console or with SQL. Both produce the same datashare.
Find the namespace IDs
Data sharing grants access by namespace ID, a globally unique identifier for each Serverless namespace or provisioned cluster. You need the consumer’s namespace ID to grant the datashare and the producer’s namespace ID to consume it. Connect to each namespace in Query Editor v2 and run:
SELECT current_namespace;
Note both IDs before you continue. You can also find the ID on the console: on the Namespace configuration page, choose the namespace. The ID appears under General information as Namespace ID.
Figure 2: Finding the namespace ID on the Amazon Redshift namespace configuration page
In Query Editor v2, connect to the producer workgroup dbtdsproducer and choose the dev database, which holds the tables you’re sharing. Run the following steps as a superuser or as a user with the CREATE DATASHARE privilege.
Figure 3: Connecting to the producer workgroup in Query Editor v2
Step 1: Create the datashare
CREATE DATASHARE dbtdsdemo SET PUBLICACCESSIBLE TRUE;
This creates an empty datashare in the dev database. PUBLICACCESSIBLE TRUE lets consumers whose workgroups or clusters are publicly accessible query the datashare. If none of your consumers are publicly accessible, leave this setting out, because the default is FALSE.
Step 2: Add the schema and tables
Before you can share any tables, add the schema that contains them. Adding the schema alone doesn’t share its tables — the consumer sees only the tables you add explicitly, which lets you follow the principle of least privilege and share just what each consumer needs.
ALTER DATASHARE dbtdsdemo ADD SCHEMA dsdemo;
ALTER DATASHARE dbtdsdemo ADD TABLE dsdemo.event, dsdemo.sales, dsdemo.users;
If the consumer should get every table in the schema, including tables you create later, run the following statements instead of ADD TABLE:
ALTER DATASHARE dbtdsdemo ADD ALL TABLES IN SCHEMA dsdemo;
ALTER DATASHARE dbtdsdemo SET INCLUDENEW = TRUE FOR SCHEMA dsdemo;
Use INCLUDENEW = TRUE with care. Any table added to dsdemo afterward is shared automatically, so a table created later — including one that holds sensitive data — becomes available to consumers without a further ALTER DATASHARE. For most workloads, prefer sharing specific tables explicitly.
Step 3: Grant the datashare to the consumer
GRANT USAGE ON DATASHARE dbtdsdemo
  TO NAMESPACE '<consumer-namespace-id>';
Step 4: Verify the datashare
-- What's in the datashare
SELECT share_name, object_type, object_name, include_new
FROM svv_datashare_objects
WHERE share_name = 'dbtdsdemo'
ORDER BY object_type, object_name;
Figure 4: Verifying the schema and tables shared in the datashare
-- Who it's shared with
SELECT share_name, consumer_namespace, consumer_account
FROM svv_datashare_consumers
WHERE share_name = 'dbtdsdemo';
You should see one schema row (dsdemo), two table rows (dsdemo.event and dsdemo.sales), and one consumer row with your consumer’s namespace ID.
Figure 5: Verifying the consumer namespace that the datashare is shared with
Step 5: Confirm the datashare on the console
Follow these steps to access a datashare from the consumer:
Select your Amazon Redshift consumer serverless namespace or cluster from the Amazon Redshift console.
Connect to a local database in your consumer cluster.
Switch to Datashares tab. You should be able to see the datashares in the Datashares from other namespaces and AWS accounts section.
Figure 6: Viewing the datashare on the consumer in the Amazon Redshift console Datashares tab
Cross-account sharing
If the consumer is in a different AWS account, the flow needs two more approvals.
First, on the producer, grant the datashare to the consumer’s account ID instead of a namespace:
GRANT USAGE ON DATASHARE dbtdsdemo TO ACCOUNT '<consumer-account-id>';
Next, in the producer account, an administrator authorizes the datashare:
For the IAM permissions these commands need, see Prerequisites. For more information, see Sharing data across accounts.
Accessing a datashare from the consumer
Once the producer grants the datashare, the consumer gets live, read-only access to the data in place — queries always return the current version.
Create the consumer database with SQL
In Query Editor v2, connect to the consumer workgroup dbtdsconsumer and choose the dev database.
Step 1: Confirm the datashare is visible
SELECT share_name, share_type, producer_namespace
FROM svv_datashares
WHERE share_name = 'dbtdsdemo';
The result has one row with share_type set to INBOUND and the producer’s namespace ID.
Step 2: Create the database
CREATE DATABASE tickit WITH PERMISSIONS
  FROM DATASHARE dbtdsdemo OF NAMESPACE '<producer-namespace-id>';
WITH PERMISSIONS lets you grant access to individual schemas and tables, the same way as for local objects. For a cross-account datashare, replace OF NAMESPACE '<producer-namespace-id>' with OF ACCOUNT '<producer-account-id>' NAMESPACE '<producer-namespace-id>'.
To query the shared data, connect to a regular database on the consumer, such as dev, and create a consumer database from the datashare. You then reference shared objects with three-part notation, database.schema.table. A single query can join tables in dev with tables in the consumer database.
Step 3: Grant access to the dbt user
In this post, dbt Cloud connects to the consumer as a dedicated database user (dbt_user), not as the admin user. That user needs to read the shared tables and to create schemas and tables in the two local databases where dbt builds models:
GRANT USAGE ON DATABASE tickit TO dbt_user;
GRANT USAGE ON SCHEMA tickit.dsdemo TO dbt_user;
GRANT SELECT ON ALL TABLES IN SCHEMA tickit.dsdemo TO dbt_user;
Step 4: Validate created database
Once the database is created, refresh database connections in Query Editor v2. Expand your consumer serverless workgroup or cluster. You should see the consumer database being created with three tables.
Figure 7: The consumer database and its three shared tables in Query Editor v2
Run the following SQL to query the consumer table. Use the database name you entered in Step 4 (Enter the Database name) instead of tickit.
SELECT * FROM tickit.dsdemo.sales;
Transforming your data with dbt Cloud
In this section, you connect dbt Cloud to your Amazon Redshift consumer, set up a project and a managed repository, and build dbt models against the shared data. Let’s begin by creating the connection.
Connect dbt Cloud to Amazon Redshift
From Account settings, choose + New project, and enter a name such as dbt-redshift-datasharing.
For the warehouse, choose Redshift and create a connection:
Hostname: your consumer endpoint, for example <workgroup>.<account-id>.<region>.redshift-serverless.amazonaws.com, without a protocol or port.
Port: 5439.
Database: dev.
Figure 8: Consumer endpoint/hostname on cluster workgroup
Figure 9: Additional Redshift connection settings in dbt Cloud
Configure development and deployment credentials
dbt Cloud keeps credentials separate for each environment:
Development credentials are personal and used by the Studio IDE. Set them under Account settings → Credentials → your project.
Deployment credentials are used by scheduled jobs and set on the deployment environment’s profile.
For both, enter:
Authentication method: Username and password.
Username: dbt_user.
Password: the password for dbt_user.
Schema: the schema where dbt builds your models, such as dbt_ for development or analytics for production. dbt creates this schema in dev.
Extended Attribute:datasharing: true.
Choose Test connection. A password authentication failed for user “admin” error means the profile still points to the admin user instead of dbt_user.
Figure 10: Entering development credentials in dbt Cloud
Production authentication with IAM
For production, use IAM user authentication. dbt Cloud supports it through the environment’s Extended attributes. On Amazon Redshift Serverless, dbt ignores the user and password fields and authorizes the IAM identity instead. Store the keys as dbt Cloud environment variables prefixed with DBT_ENV_SECRET_ so that they’re masked in logs:
Scope the IAM user’s policy to redshift-serverless:GetCredentials on the consumer workgroup and rotate its access keys regularly. For local development and CI runners, store database credentials in AWS Secrets Manager and inject them as environment variables at runtime. Never commit credentials to profiles.yml.
Enable datasharing support
By default, dbt reads metadata from PostgreSQL catalog tables such as pg_tables, pg_views, and information_schema. These only show objects in the database you’re connected to. When your models read from tickit while you’re connected to dev, those metadata queries can’t see the shared objects.
Setting datasharing: true switches the adapter to Amazon Redshift cross-database system views and SHOW commands:
System view
What dbt uses it for
SVV_ALL_TABLES
Lists tables and views across all databases, including datashare databases
SVV_ALL_COLUMNS
Column names and types across databases
SVV_EXTERNAL_SCHEMAS
Resolves external schemas that point at other databases
Database users can read these views by default. If you restrict system-view access in your organization, grant SELECT on them to dbt_user.
To turn it on in dbt Cloud for existing environments:
Go to Orchestration → Environments and edit each environment (development and deployment).
Under Extended attributes, add: datasharing: true.
Confirm that the environment is on the Latest release track.
For local dbt users, here’s the sample profiles.yml block:
redshift_datasharing:
  target: dev
  outputs:
    dev:
      type: redshift
      host: <consumer-endpoint>
      port: 5439
      dbname: dev  # regular database, not the datashare database
      user: "{{ env_var('DBT_USER') }}"
      password: "{{ env_var('DBT_PASSWORD') }}"
      schema: dbt_<your_name>
      datasharing: true   # cross-database metadata through SVV_* views
Set up a dbt Cloud managed repository
When you develop in dbt Cloud, you can use Git to version control your code. For the purpose of this post, you will use dbt Cloud-hosted managed repository.
To set up a managed repository:
Under “Setup a repository”, select Managed.
Enter a name for your repo such as dbt-redshift-workshop.
Choose Create. It will take a few seconds for your repository to be created and imported.
Figure 11: Setting up a dbt Cloud managed repository
Once you see the “Successfully imported repository,” choose Continue.
Figure 12: Confirmation that the managed repository imported successfully
Choose Start developing in the Studio. In a new managed repository, choose Initialize dbt project, then Commit and sync with the message initial commit. Then choose Create branch and name the branch add-redshift-models.
Build your models
With the connection and repository in place, you can now define the dbt models that transform the shared data. The following steps configure the project, choose a materialization, declare the datashare as a source, and build the staging and reporting models. Open the project in Studio on dbt Cloud account.
Configure the project
Open dbt_project.yml and replace the models block at the bottom of the file. The key under models: must match the name: at the top of the file. A newly initialized project uses dbt_ds_demo.
Regular views can’t reference datashare objects on the consumer. Amazon Redshift rejects them with “External tables are not supported in views,” so dbt’s default view materialization fails on any model that selects from the datashare. You have these options:
Materialization
When to use it with datashare sources
table
Safe default. The data is copied into dev at build time, so downstream models and BI queries don’t depend on the datashare at query time.
incremental
Large or frequently updated tables. Processes only new rows by using unique_key and a timestamp filter.
view with bind=false
Creates a late-binding view (WITH NO SCHEMA BINDING). It’s always live and stores nothing, but Amazon Redshift resolves the shared objects each time you query the view.
ephemeral
Lightweight intermediate logic that gets inlined into downstream models and isn’t stored.
This walkthrough uses table for both the staging and finance models.
Declare the datashare as a source
Create the staging and dept_finance folders under models. In staging, create sources.yml:
version: 2

sources:
  - name: ds
    description: "Consumer database created from the datashare (zero-copy from the producer)."
    database: tickit        # the database you created from the datashare
    schema: dsdemo          # the schema you added to the datashare
    tables:
      - name: event
        config:
          loaded_at_field: starttime
          freshness:
            warn_after: {count: 1, period: hour}
            error_after: {count: 24, period: hour}
        columns:
          - name: eventid
            data_tests: [not_null, unique]
      - name: sales
        config:
          loaded_at_field: saletime
          freshness:
            warn_after: {count: 1, period: hour}
            error_after: {count: 24, period: hour}
        columns:
          - name: salesid
            data_tests: [not_null, unique]
Create the staging models
Create staging_event.sql and copy the following code to build event model:
with source as (
    -- List columns explicitly to protect against upstream schema drift
    select eventid, venueid, catid, dateid, eventname, starttime
    from {{ source('ds', 'event') }}
)
select
    eventid::integer        as eventid,
    venueid::smallint       as venueid,
    catid::smallint         as catid,
    dateid::smallint        as dateid,
    eventname::varchar(200) as eventname,
    starttime::timestamp    as starttime,
    current_timestamp       as etl_load_timestamp
from source
Create staging_sales.sql and copy following SQL to create sales model.
with store_source as (
    select salesid, listid, sellerid, buyerid, eventid, dateid,
           qtysold, pricepaid, commission, saletime
    from {{ source('ds', 'sales') }}
)
select
    salesid::integer         as salesid,
    'store'                  as salestype,
    listid::integer          as listid,
    sellerid::integer        as sellerid,
    buyerid::integer         as buyerid,
    eventid::integer         as eventid,
    dateid::smallint         as dateid,
    qtysold::smallint        as qtysold,
    pricepaid::decimal(8,2)  as pricepaid,
    commission::decimal(8,2) as commission,
    saletime::timestamp      as saletime,
    current_timestamp        as etl_load_timestamp
from store_source
Create the finance reporting models
These models are written to the analytics database because of the +database setting in dbt_project.yml.
In dept_finance, create rpt_finance_qtr_total_sales_by_event.sql:
select
    date_part('year', a.saletime)    as year,
    date_part('quarter', a.saletime) as quarter,
    b.eventname,
    count(a.salesid)  as sales_made,
    sum(a.pricepaid)  as sales_revenue,
    sum(a.commission) as staff_commission,
    -- NULLIF returns NULL instead of failing when revenue is zero
    round(sum(a.commission) / nullif(sum(a.pricepaid), 0), 4) as commission_pcnt
from {{ ref('staging_sales') }} a
left join {{ ref('staging_event') }} b on a.eventid = b.eventid
group by year, quarter, b.eventname
Create rpt_finance_qtr_top_event_by_sales.sql:
select *
from (
    select
        *,
        -- ROW_NUMBER() returns exactly 3 events per quarter.
        -- To keep tied events, use RANK(), which can return more than 3 rows.
        row_number() over (partition by year, quarter order by sales_revenue desc) as row_num
    from {{ ref('rpt_finance_qtr_total_sales_by_event') }}
)
where row_num <= 3
Run and verify
In the IDE command bar, run:
dbt build
Figure 13: Running dbt build in dbt Studio
In Query Editor v2 on the Amazon Redshift console, refresh the consumer. You should see new dbt schema and tables created as shown in the following figure:
Figure 14: The new dbt schemas and tables created on the consumer
SELECT * FROM analytics.dbt_<your_name>.rpt_finance_qtr_total_sales_by_event;
SELECT * FROM analytics.dbt_<your_name>.rpt_finance_qtr_top_event_by_sales ORDER BY year, quarter, row_num;
Commit your changes
Under Version Control, choose Commit and sync, and enter a message such as Add consumer datashare models. Then choose Merge this branch to main or open a pull request if you connected GitHub.
Conclusion
In this post, we showed you how to set up Amazon Redshift Data Sharing between two clusters and use dbt Cloud to transform consumer-side data into analytics-ready models. Beyond convenience, this architecture delivers concrete benefits for a production analytics platform. The Amazon Redshift multiversion concurrency control (MVCC) model gives consumers transactionally consistent reads of live producer data. The zero-copy sharing model removes duplicate Amazon S3 storage and the ETL that would otherwise move data between clusters. And dbt maintains a single lineage graph that spans the producer and consumer boundary, so governance and documentation stay coherent across cluster ownership lines.
The combination of Amazon Redshift Data Sharing and dbt Cloud lets teams build high-performing data pipelines that use live, transactionally consistent data without the overhead of data copying — enabling near real-time analytics with clean separation of producer and consumer workloads.
Clean up
To avoid ongoing charges, remove the resources you created for this walkthrough once you are done:
-- On the producer, revoke and drop the datashare
DROP DATASHARE <datashareName>;

-- On the consumer, drop the database created from the datashare
DROP DATABASE <database>;
Then delete or pause the producer and consumer Amazon Redshift Serverless workgroups (or provisioned clusters) you provisioned for the walkthrough.
# Delete the workgroup (and its namespace)
aws redshift-serverless delete-workgroup --workgroup-name <name>
aws redshift-serverless delete-namespace --namespace-name <name>
Delete the dbt Cloud project if it is no longer needed. Deleting test clusters prevents ongoing compute and storage charges.
Working with outside collaborators can add more work for a repository owner. You need to confirm who still needs access, change permissions as projects evolve, and archive repositories once they’ve served their purpose.
To keep up, repository owners need to track collaborators, deadlines, and follow-ups for each repository. As a project grows, that manual housekeeping becomes harder to keep up with and easier to defer.
We faced this problem in a shared organization where GitHub employees (“Hubbers”) collaborate with customers and partners on product trials and professional services engagements. Our answer was Evergreen, a GitHub App built with native GitHub features. The workflows below exhibit a pattern you can adapt for your own organization.
Meet Evergreen
Evergreen is a GitHub App that automates organization hygiene through two workflows:
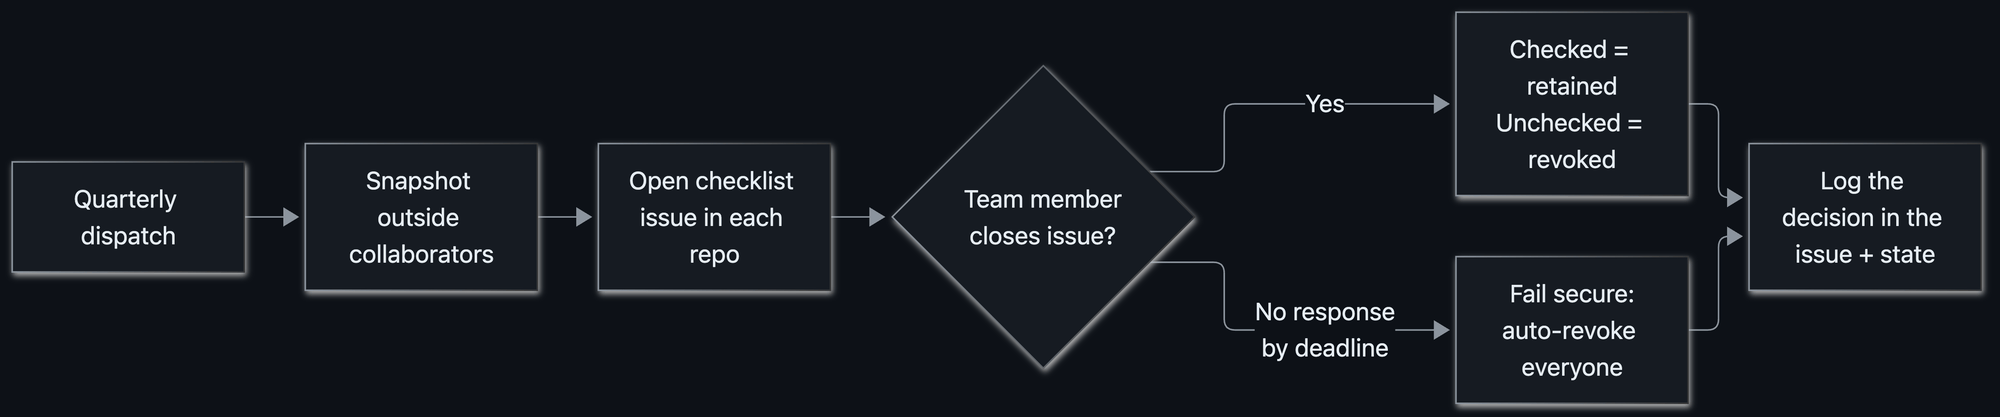
Outside collaborator access reviews. Every quarter, each repo’s outside collaborators are reviewed. Keep who you need, and everyone else is removed.
Stale repository detection and archival. Repos with no human activity past a threshold get flagged, warned, and (if still untouched) archived.
Two design principles shaped everything:
Fail secure. If nobody responds to an access review, we don’t leave access in place and hope for the best. We revoke it. The safe outcome is the default outcome.
Never destroy anything. Evergreen will never delete a repository or its contents. Archived repos are recoverable, and every access change is written into the repo’s tracking issue, so reverting a mistake is as easy as a copy-paste to Copilot.
How it works: One brain, many hands
Under the hood, Evergreen is a small Go webhook server running in a container. But the interesting part is the choreography. Every moving piece is a stock GitHub feature: a GitHub App, scheduled actions, webhooks, issues, custom properties, and plain files in a repo. Nothing exotic to reinvent.
A controller that keeps time
A dedicated controller repo acts as Evergreen’s clock and its memory. Four scheduled GitHub Actions workflows fire repository_dispatch events on a quarterly cadence, and the app wakes up and does the work:
Day
Workflow
What happens
1st
Stale repo review
Flag repos with no recent human activity, open a warning issue
8th
Access review
Snapshot outside collaborators, open a checklist issue per repo
16th
Stale repo cleanup
Archive repos still stale after the grace period
23rd
Access cleanup
Auto‑revoke access for any review left unanswered
Reviews open two weeks before their cleanup runs, and there’s a hard grace period baked in so a stray manual run can never fast‑forward the guillotine. Each workflow also supports workflow_dispatch, so we can trigger any step by hand as needed.
State you can git blame
Evergreen tracks every repo’s status as a JSON file (one per repository) committed to the controller repo under state/repos/<repo_id>.json. The snapshot of who had access, when the review opened, the deadline, who decided, and what happened all lives there. Here’s a completed review where a Hubber kept Alice’s access and let Bob’s lapse:
The best part: because state is just files in git, the commit history is the audit trail. Want to know why someone lost access last spring? git log the state file. There’s no separate database or bespoke audit pipeline to track.
Issue‑ops, everywhere it matters
Evergreen does its talking through issues inside each repository. When an access review kicks off, every repo gets a checklist issue:
The interaction model is delightfully simple: check the boxes for who stays, then close the issue. That’s it. When the issue closes, Evergreen listens for the issues.closed webhook event, reads the checkboxes, retains the checked collaborators, and revokes the rest, then posts a receipt comment listing exactly what it kept and what it removed.
Only the right humans can pull the lever
Closing an access review issue is a privileged action, so Evergreen guards it. If someone who isn’t a Hubber closes an issue, the app quietly reopens it and posts a note explaining why. Decisions only count when they come from the people authorized to make them.
Informing the right people
Here’s a subtle problem: we know the people who need to respond to a review are Hubbers, but we didn’t always know which Hubber(s) owned a given repository.
Evergreen resolves the right people to notify through a fallback chain:
If a repo sets an evergreen_repo_owner custom property (a @user or @org/team), use it.
Otherwise, look at recent issue and commit authors and cc the ones who are on the access review team, i.e., the Hubbers actually working in that repo.
The result: the right owners get pinged automatically, without anyone maintaining a spreadsheet of “who owns what.”
Fail secure, and fail closed
When a review deadline passes with no response, cleanup revokes every collaborator in the snapshot. We were careful about a subtle edge case: what if some removals succeed while others hit a transient API error? Marking the review “done” while a removal is still outstanding would be a quiet inconsistency, and we didn’t want that.
So Evergreen fails closed. If any removal fails, the review stays pending and the issue stays open, and the next run retries the stragglers. It only records “revoked” once every removal actually succeeded. And whatever gets removed is written into the issue, so restoring access is a matter of re‑adding the handles it listed.
The user experience: automation that feels considerate
Automated housekeeping has a reputation for being the office smoke alarm: loud, easy to ignore, and usually going off while you’re cooking something perfectly fine. We worked hard to make Evergreen feel like the opposite:
It comes to you. The work happens as an issue in your repo.
It tags the right people. No “who owns this?” archaeology.
It’s crystal clear about the ask. Every issue states what to do, the exact deadline, and precisely what happens if you ignore it.
It nudges before it acts. A reminder comment lands before the deadline: no surprise revocations.
It has an escape hatch. Org owners (Hubbers) can opt out by setting a custom property (evergreen_exempt_from_access_review or evergreen_exempt_from_archive).
Rolling it out carefully
Automation that manages access and archives repositories deserves a careful rollout, especially into a large, active org (ours has 1,400+ Hubbers, and many more customers and partners). We wanted the very first run to be a complete non‑event. A few practices got us there:
Dry‑run first. Evergreen ships with a DRY_RUN mode that logs every write it would make without touching a single collaborator or repo. We ran it against the real org and read the logs like tea leaves until we trusted the decisions it wanted to make.
Overcommunicate. Before flipping the switch, we broadcast what was coming, when, and what people needed to do, so the first issue anyone saw wasn’t a surprise. We found that when you’re telling a large group the same thing for the seventh time, it’s often when many are still hearing it for the first time.
Watch everything with Splunk. Evergreen emits structured logfmt logs to a dedicated Splunk index. That observability is how we caught edge cases in the wild (empty collaborator lists, unusual permissions, repos with issues disabled) and tightened the logic before they mattered.
Respect the platform’s speed limits. When you open issues and post comments across every repo in a big org, you slam into GitHub’s secondary rate limits for content creation: 80 requests/minute and 500/hour. While this is a thoughtful preventative control to avoid system abuse, it requires a bit of intention when automating IssueOps at large scale.
So Evergreen paces itself by construction. It processes repos in batches, spaces out each content‑creating call by a couple of seconds, and sleeps between batches to let the rolling window clear, and it only counts the repos that actually create content, so a quiet quarter where nothing’s eligible still runs fast. We opted for proactive avoidance over reactive back‑off.
Lessons we’re taking with us
Make the safe path the default path. Fail secure, then make responding easy enough that failing secure rarely triggers.
Use the primitives you already have. Issues, webhooks, custom properties, and git history did the work of a bespoke UI, a job queue, and an audit database.
Meet people where they work. An issue in your repo beats a dashboard you’ll never open.
Logs are a revert button. Writing every change into the issue turned “oops” into “paste these three handles into a Copilot session.”
Respect the limits. At org scale, rate limits aren’t an edge case: they’re the design constraint.
Keep your org evergreen
Routine hygiene is the kind of work that’s easy to defer and perfect to automate. The trick isn’t heroic cleanup sprints: it’s making the boring, safe thing happen on a schedule, with a friendly face and an undo button.
That’s Evergreen. And because it’s built entirely from native GitHub features, you can stand up the same pattern yourself.
Ready to make repository hygiene routine? Start with one recurring access or archival task, then use GitHub Apps, actions, issues, and custom properties to automate the problem away.
Every secure web gateway on the market works the same way: traffic matches a condition. A terminal action fires. Allow, Block, Isolate, Log. This model has been the foundation of network security for nearly 30 years, and it handles the common case well. But it has a ceiling, and customers with complex environments hit that ceiling regularly.
Earlier this year, we shared our vision to build a truly programmable SASE platform. We also outlined how the term programmability has become diluted by the security industry. Most vendors claim programmability because they have public APIs, Terraform providers, webhooks, and alerting. Cloudflare offers all of those things too, but that’s not enough. True programmability means running your own code — arbitrary logic that you wrote for your specific environment — inline in the policy evaluation path, at the moment a security decision is made.
Today, we’re excited to announce Cloudflare is bringing true programmability to Cloudflare Gateway and DLP (Data Loss Prevention) by integrating it with the entirety of our edge computing platform. We are releasing a new type of Gateway action, Forward, and custom validation functions, available to all Zero Trust plans. These capabilities allow you to use a Cloudflare Worker to transform and manipulate traffic, or to bring your own data to policy evaluation.
The trade-off that every security team faces
For as long as firewalls have existed, businesses have faced a binary choice. You can maintain your own security detection engine — your own firewall, your own proxy infrastructure — with high maintenance overhead and low portability, in exchange for maximum customization. Or, you can accept the constraints of a vendor, offloading the considerable maintenance cost, at the expense of flexibility to solve problems specific to your environment.
In six years of building Cloudflare Gateway, we have heard from thousands of customers struggling with this trade-off. A security team migrating access controls for a critical internal application needs to inject HTTP headers based on JSON Web Token (JWT) claims from their identity provider. The data exists in the request context, but Gateway cannot read the JWT and write the header. So the team stands up a pool of NGINX proxies solely to perform this transformation. That infrastructure now must be patched, monitored, and secured… indefinitely.
Another team wants a Slack notification the moment an employee signs up for a new SaaS service. The policy engine can detect the sign-up event, but it can only Allow or Block. So the team builds a Logpush-to-SIEM-to-Slack pipeline with a 5 to 15 minute delay and no guarantee of delivery. And piles on yet another piece of infrastructure.
Dozens of enterprise customers have asked for warning pages that prompt users for justification before allowing access to sensitive destinations. Most then want to customize the ensuing behavior based on additional context about who the user is and the level of access requested. But serving customized, dynamic responses from a policy engine is exceedingly difficult.
We have offered customers many extension points over the years. But along with every other firewall vendor, it is impossible to build features to cover threat vectors as quickly as they can appear. However, we also recognize that the best solutions are those which are infinitely extensible to your environment.
Why only Cloudflare can solve this problem
Cloudflare is not just a firewall, or a secure web gateway, a content delivery network, or an edge service. Cloudflare is a composable compute platform. Cloudflare Workers already allows customers to run complex logic on our network edge from any of our 330+ locations worldwide. Cloudflare Gateway already evaluates and enforces security policy on user traffic at those same locations, on the same machines, in the same data centers.
Only Cloudflare runs both distributed customer compute and a full-featured secure web gateway and firewall in the same globally distributed network. We have the unique opportunity and ability to combine those functions into the industry’s first completely programmable and customizable SASE platform.
Gateway and Workers were built on the same infrastructure from the beginning. When Gateway forwards traffic to a Worker, that dispatch is a local function call. There is no hairpinning. There is no additional latency from crossing a network boundary. This is the first time that customers will have absolute control over how their proxied traffic is processed, without compromise, using code that they can write and execute without maintaining any sort of infrastructure.
Standalone SASE providers without their own compute platform require you to deploy automation in a separate cloud, manually configure webhooks, and accept the round-trip latency and management overhead of stitching together disconnected systems. No other vendor in this space has a programmable edge compute platform co-located with their security gateway. As threats advance at AI-powered speed, this will provide much needed flexibility and agility for security organizations.
Two Gateway entry points: Forward action and Custom Functions
A new Gateway action type called Forward and a new policy resource called a Custom Function are two distinct ways to call a Worker from a Gateway policy. The Forward action is available in public beta today, and Custom Functions will be available before the end of the year.
Forward action: traffic transformation and proxy
You can customize HTTP traffic behavior with a new policy action called Forward that routes the matched HTTP request to a Worker as a proxy. Policies with the Forward action are evaluated for traffic allowed by HTTP policies. The first matching Forward rule will then be applied to your traffic, and the traffic will be sent to its bound Cloudflare Worker. The Worker acts as inline middleware: it receives the full headers and request body. Your logic can then choose to modify either one (or take another asynchronous action of some kind), forward the request to the origin, receive the response, can modify that too, and return the final response to the user.
import { WorkerEntrypoint } from "cloudflare:workers";
import type {
  GatewayMiddlewareContext,
  GatewayMiddlewareNext,
} from "@cloudflare/zt-types";

export class GatewayMiddleware extends WorkerEntrypoint {
  async handle(
    request: Request,
    context: GatewayMiddlewareContext,
    next: GatewayMiddlewareNext,
  ): Promise<Response> {
    // Read a value from the Gateway context
    const clientIP = context.srcIp;

    // Add headers before the request reaches the origin
    request.headers.set("X-Gateway-Client-IP", clientIP);

    // Forward upstream and get the response
    const response = await next(request);

    // Modify the response before it reaches the user
    response.headers.set("X-Processed-By", "gateway-middleware");

    return response;
  }
}
Gateway handles the TCP connections, TLS termination and re-encryption, certificate management, and HTTP version negotiation. The Worker is responsible only for the transformation logic. You get a customizable, proxy-like extension point for your existing security stack, with none of the operational cost of hosting a traditional HTTP proxy.
Your Workers also do not have to transform the request. A rule's sole purpose can be to proxy a request to a Worker that receives the full context of the matched request asynchronously: send a Slack message, write to R2, log to an external pipeline, call a webhook, update a KV store. The traffic can continue to its destination, unbothered.
Custom functions: inline policy evaluation
A custom function calls out to a Worker inline during Gateway policy evaluation and returns a value. The function is then exposed as a selector in the Gateway policy builder, and the selector is evaluated against its values. The selector is usable in the condition of any network or HTTP Gateway rule, the same way a built-in selector like Source IP or Content Category works today.
The Worker receives context about the request: source IP, destination, user identity, device posture, HTTP headers, and more, depending on the policy phase. The Worker returns a typed value (string, number, or boolean) that Gateway uses in rule conditions. The contract is simple: data in, value out.
Here is a custom function that parses a JWT Authorization header and returns the user's role:
With this function deployed, an administrator can create an HTTP policy rule: Custom Function "JWT Role" contains "finance_contractor" with an action of Allow. The custom function becomes part of the rule condition, evaluated alongside every other selector.
Custom functions are not limited to HTTP traffic. Because they receive identity, device posture, and connection metadata instead of the full HTTP request, you can use them in the Gateway Network policy rule builder with arbitrary Layer 4 port and protocol traffic as well.
The Worker itself can do anything a Worker can already do — call external APIs, read from KV or D1, or invoke Workers AI. But from Gateway's perspective, the function is deterministic: data in, value out.
When to use a custom function or a Forward action
Custom functions are designed for quick, bounded, stateless evaluations of data which can return a shaped response. You should think of their use similarly to data that can already be evaluated in Gateway selectors; that is, calculations on data that exist within a set of criteria, e.g. “Ports within this range,” or “URL paths that match this regex pattern.” The power comes from being able to extend your structured evaluations with arbitrary or internal sources of data, for which you’ll see some examples below.
The Forward action requires a little more planning and preparation. It can be used for powerful transformations inline with users’ live requests, and can manipulate them in complex ways both on the egress and return to the origin service. These should be thought of as transformation functions, something that very few enterprise security proxies even conceptualize today. Workers that use the Forward action should be targeted and designed carefully to avoid adverse effects on the end user’s overall experience.
What you can build
Purpose justification and interstitial pages
A Worker intercepts a request to a sensitive destination and returns an interstitial page requiring the end user to provide a written justification for access. The Worker calls Cloudflare KV to write a session with a TTL, so the user is only prompted once per configured period. It writes the user's identity and their stated justification to Cloudflare D1, creating an audit trail. Or, you can use Hyperdrive to write that record to any internal database you already operate.
This has been one of our most-requested features for over four years. With a Worker able to process and manipulate HTTP traffic, it's easy to build to your own standards.
Dynamic HTTP header injection
A custom function parses a JWT from the request's Authorization header, extracts the user's role or group membership, and returns it as a selector value. A Gateway rule matches on that value and sets an X-App-Role header on the upstream request. No NGINX proxy pool. No additional infrastructure to maintain.
File inspection and logging
When a file download matches certain criteria, a Worker can send the file to a third-party sandboxing service for detonation and analysis. Or it can write the file in its entirety to Cloudflare R2 as a permanent record for later inspection, without the file ever leaving the Cloudflare network.
Real-time alerting on policy match
A Worker bound to a Forward policy receives traffic whenever a data loss prevention (DLP) profile matches. The Worker sends a message to a Slack channel or PagerDuty endpoint with the user's email, the rule that fired, and the destination URL.
Traditional expression builders for firewalls are not designed for the kind of computation some organizations need at evaluation time. If you maintain internal risk scoring systems that perform behavioral analysis across multiple data sources, or if you have complex maps of users, groups, and conditional memberships where multiple criteria must be independently true, you can use a custom function as the computational extension that evaluates all of that logic and returns a single value to Gateway.
Performance and reliability
Because Gateway and Workers services run on the same machines in the Cloudflare network, dispatching to a Worker does not introduce a network hop. The performance impact is limited to the execution time of your Worker code itself.
When a custom function fails — throws an exception, times out, or returns an unexpected value — you configure the fallback behavior per function. Defaultvalues are required in the custom function contract, so that it’s easy to determine behavior.
Availability and pricing
The Forward action and its integration with Workers are available in a public beta starting today, with Custom Functions expected to be available before the end of the year. At general availability, both will be available for all customers on all plan types.
Traffic dispatched to your Workers is billed as standard Worker requests. The feature works with Workers Free, Workers Paid, and Workers for Enterprise with no restrictions on functionality. Workers Free does have execution time limits and daily request limits, which is worth considering as you scale the volume of Gateway traffic you send to your Workers.
DLP custom functions for inline detection validation
A fully programmable SASE platform extends beyond just Gateway. Our DLP offering — already integrated across Gateway, AI Gateway, Email Security, and more — now supports custom outcomes through integrations with our Compute platform, as well.
Most data security products operate by looking for data that matches known patterns. Customers can typically define regular expressions, word lists, or similar to operate these detections. They can also improve confidence in matching through the use of keywords or context analysis on the request body. But these methods have a core flaw: these types of detections can only tell you when something matches the pattern of data relevant to your organization, not whether this specific instance of data is indicative of data exfiltration or misuse.
As attackers become increasingly advanced, and agents can be used to ruthlessly exploit systems, improving our ability to accurately detect patterns is not enough. To improve accuracy for the data that matters, you need to know whether the data in question is actively relevant to your organization.
To solve this problem, most solutions leverage exact data match, but this comes with its own trade-offs. Customers must prepare, maintain, and transfer reference datasets, then decide how comfortable they are allowing a vendor to manage data from their most sensitive systems.
Custom validation functions for DLP bridges that gap, and they’re available starting today. These custom functions allow customers to define their own validation logic, using their own source of truth, directly inside a Cloudflare Worker… and apply it everywhere they use DLP to protect their sensitive data.
Credential and secret verification
When a DLP detection entry is matched, an outbound Worker can be dispatched to run validation logic prior to a policy enforcement decision. If you have profiles to detect the use of GitHub secrets, but only care about active secrets, you can use a Worker to first look up the status of a detected key, return a response from the appropriate GitHub endpoint, and then decide whether or not the DLP profile should match the traffic.
import {
  DlpValidation,
  type DlpValidationInput,
  type DlpValidationResult,
} from "@cloudflare/zt-types";

export class DlpValidationEntrypoint extends DlpValidation {
  async validate({ excerpt, start, end }: DlpValidationInput): Promise<DlpValidationResult> {
    const bytes = Uint8Array.from(atob(excerpt), (c) => c.charCodeAt(0));
    const token = new TextDecoder().decode(bytes.slice(start, end));

    const res = await fetch("https://api.GitHub.com/user", {
      headers: {
        Authorization: `Bearer ${token}`,
        "User-Agent": "dlp-GitHub-validator",
        Accept: "application/vnd.GitHub+json",
      },
    });

    if (res.ok) return { score: 1.0 }; // token is valid and active
    if (res.status === 401) return { score: "veto" }; // token is invalid, discard
    return { score: 0 };
  }
}
What's next
This is just the beginning of the fully programmable SASE platform. We are actively working on increasing the entry points from which you can dispatch custom functionality to the entire Cloudflare One suite, with Email Security coming next. That doesn’t mean we’re done building: this new architecture will make it easier for us to build first-party features into all Cloudflare One services faster, more flexibly, and with improved developer experience.
It’s also getting easier every day to protect your Workers, agents, and their traffic using Cloudflare One. If you are an Enterprise customer who would like a strategy session for implementation, a preview of the coming functionality, or to be notified about the custom functions beta, please reach out to your account team.
Your organizational security can now do anything a Cloudflare Worker can do. We can't wait to see what you build.
To provide the best experiences, we use technologies like cookies to store and/or access device information. Consenting to these technologies will allow us to process data such as browsing behavior or unique IDs on this site. Not consenting or withdrawing consent, may adversely affect certain features and functions.
Functional
Always active
The technical storage or access is strictly necessary for the legitimate purpose of enabling the use of a specific service explicitly requested by the subscriber or user, or for the sole purpose of carrying out the transmission of a communication over an electronic communications network.
Preferences
The technical storage or access is necessary for the legitimate purpose of storing preferences that are not requested by the subscriber or user.
Statistics
The technical storage or access that is used exclusively for statistical purposes.The technical storage or access that is used exclusively for anonymous statistical purposes. Without a subpoena, voluntary compliance on the part of your Internet Service Provider, or additional records from a third party, information stored or retrieved for this purpose alone cannot usually be used to identify you.
Marketing
The technical storage or access is required to create user profiles to send advertising, or to track the user on a website or across several websites for similar marketing purposes.






![Screenshot of an access review issue titled “[ACTION REQUIRED] Access Review – 2026-04-13.” Outside collaborators Alice Example, with admin access, and Bob Example, with write access, have unchecked boxes. Instructions say to select anyone who should keep access, then close the issue. A warning states that if no action is taken by April 27, all listed access will be automatically revoked.](https://github.blog/wp-content/uploads/2026/10/674986199-ee305d10-3419-4270-a829-41ed3da29fae.png?resize=528%2C221)