Amazon Redshift customers rely heavily on snapshots, which are point-in-time backups of their data, for disaster recovery, compliance retention, and data portability across AWS Regions. Amazon Redshift supports two types of snapshots: automated and manual. For provisioned clusters, automated snapshots are enabled by default and retained for up to 35 days; manual snapshots persist until you delete them. For serverless workgroups, Amazon Redshift automatically creates recovery points that are retained for 24 hours, and you can also create manual snapshots with a configurable retention period. For details on snapshot creation and backup storage pricing, you can refer to Amazon Redshift pricing for more details.
Starting June 8, 2026, Amazon Redshift is introducing an incremental snapshot billing model for Amazon Redshift Serverless and Amazon Redshift RG (provisioned instances powered by AWS Graviton). With this enhancement, you pay only for the unique data blocks across your active manual snapshots within your account. This delivers significant cost savings for customers who have multiple snapshots that contain largely identical data blocks.
In this post, you will learn how the new incremental snapshot billing model works, the customer use cases it addresses, and how it helps you optimize costs while improving your Recovery Point Objective (RPO).
Incremental snapshot billing
With this new billing model, Amazon Redshift bills manual snapshots based on unique data blocks. When you take multiple manual snapshots of the same workgroup or cluster, much of the data remains unchanged between snapshots. The billing model recognizes this overlap and charges only for the unique data blocks across your active snapshots. Data that has not changed between snapshots is counted once.
Consider a 10 TB data warehouse with three manual snapshots:
Snapshot 1 (Day 1): Full backup, 10 TB of unique data blocks
Snapshot 2 (seconds later): Nothing changed, shares data blocks with Snapshot 1, no additional charge
Snapshot 3 (two days later): 1 TB of new unique data blocks created from changes
Total billed: 11 TB of unique data blocks
Using this example, customers pay for the 10 TB of unique data blocks in Snapshot 1 plus the 1 TB of new unique data block in Snapshot 3. Snapshot 2 shares its blocks with Snapshot 1, so it adds zero cost. Hence, total 11 TB of unique data blocks are billed.
Key billing model details
With the new incremental snapshot billing model, you are charged only for the unique data blocks at the existing snapshot rates. Following are the key details of the new feature:
Scope: Amazon Redshift Serverless and Amazon Redshift RG instances. Amazon Redshift RA3 instances retains the current tiered S3 billing.
Rate: Based on the existing snapshot pricing for your Region.
Deduplication level: Account-level for Amazon Redshift Serverless and RG.
Automated snapshots: Unchanged, still available at no additional cost (35 days for Provisioned, 1 day for Serverless).
Existing snapshots: Automatically transition to the incremental snapshot billing model. No action required.
This model is especially valuable for customers needing backup retention beyond the automated snapshot windows available at no additional cost. Serverless customers needing backup beyond 24 hours can now take manual snapshots knowing they pay for a unique data block, making extended retention more practical and affordable.
Benefits
With the incremental snapshot billing model, customer can adopt stronger data protection strategies at optimized costs:
Compliance-driven long-term retention
Regulated industries (financial services, healthcare, government, and life sciences) must often retain backups for 90 days to 5+ years. Since this billing model charges only for unique data blocks, retention policies become significantly more affordable as snapshots accumulate.
How this feature helps: You can now maintain backup retention (90-day, 1-year, 7-year) on Amazon Redshift Serverless and RG at optimized cost. A 10 TB warehouse with 5% daily change rate retaining 90 days of daily snapshots pays for ~14.5 TB of unique data blocks total across all snapshots.
Disaster recovery with better Recovery Point and Time Objectives (RPO/ RTO)
Many customers want more frequent snapshots (hourly instead of daily) for tighter recovery objectives. Because each additional snapshot is billed only for its new unique data blocks, frequent backups are practical and affordable.
How this feature helps: You can take hourly snapshots where each one adds only ~0.2% in new unique data (assuming 5% daily change rate). More snapshots mean more recovery points and less data loss in a failure scenario, all at optimized cost.
Cross-Region disaster recovery at lower cost
Snapshots copied to another region for disaster recovery are also billed based on unique data blocks. Organizations maintaining multi-Region disaster recovery (DR) strategies pay proportionally to actual data changes, making geographic redundancy affordable.
How this feature helps: If you are running active-passive or active-active multi-Region architectures, you can copy snapshots across Regions more frequently, improving cross-Region RPO while keeping DR costs proportional to actual data changes rather than full dataset size.
Affordable extended backups
With the incremental snapshot billing model, extended manual backups are more affordable for customers, regardless of their workload size. Even retention policies (7-day, 14-day) cost proportionally to actual data changes, for enhanced data protection posture across the board.
How this feature helps: Customers no longer need to choose between data protection and budget. This billing model helps make extended retention cost effective for workloads of varying sizes.
Pricing example
For example, you have an Amazon Redshift Serverless workgroup with 10 TB of active data in US East (Ohio). You take daily manual snapshots with 7-day retention. Your data changes at 5% per day (0.5 TB/day).
Component
Calculation
Monthly Cost
Active data
10 TB × 1,024 GB/TB × $0.023
$235.52
Unique snapshot blocks (after deduplication)
13 TB × 1,024 GB/TB × $0.023
$306.18
Total
$541.70
Because shared blocks across snapshots are counted only once. You pay for 13 TB of unique snapshot data rather than the full cumulative size of all seven daily snapshots.
Compounding savings on Amazon Redshift RG
If you are evaluating migrating from RA3 to RG, the savings stack significantly. Some of the compounding savings on RG include:
RG instances are priced at 30% discount as compared to RA3 instances.
Reserved Instances (RI) pricing is available for RG which provide further compute savings.
Incremental billing alleviates duplicate snapshot charges for backup storage.
Data lake queries are included in RG compute pricing, thereby avoiding the per-terabyte scanning charges of Amazon Redshift Spectrum.
The combined effect of these options for RG can deliver an aggregate greater than 30% cost reduction over RA3. You can lock in RI pricing on RG clusters for predictable, long-term savings on top of the incremental snapshot benefit.
Getting started
No action is required on your end. Your existing manual snapshots automatically transition to the incremental snapshot billing model on June 8, 2026.
Increase snapshot frequency. More frequent snapshots now cost proportionally less since each additional snapshot only adds its unique data blocks to your bill.
Extend retention policies. Compliance driven retention (90-day, 1-year, 7-year) is now significantly more affordable.
Evaluate RA3 to RG migration. Consider the 30% compute savings, combined with RI eligibility during RG evaluation for migrating from RA3.
Explore Serverless. The enhanced billing model makes Serverless a cost-effective option for customers who need backup retention beyond the 24-hour automated recovery point window.
Conclusion
The incremental snapshot billing model for Amazon Redshift Serverless and Amazon Redshift RG charges only for unique data blocks across your snapshots. This supports more frequent snapshots for better disaster recovery, affordable long-term compliance retention, and a compelling path to Amazon Redshift Serverless adoption. Combined with Amazon Redshift RG’s 30% compute discount and Reserved Instances, this delivers meaningful total cost savings across your entire Amazon Redshift spend.
Nidhi Nayak Nidhi is a Senior Technical Account Manager with AWS, she helps enterprise customers build scalable, high-performance cloud applications and optimize cloud operations. With over a decade of experience in Data Analytics, Nidhi currently focuses on Redshift & Generative AI integration with Redshift.
Raza Hafeez Raza is a Senior Product Manager, Technical at Amazon Redshift. He has 15+ years of experience building and optimizing enterprise data warehouses and is passionate about making cloud analytics accessible and cost-effective for customers of all sizes.
Sushmita Barthakur Sushmita is a Senior Data Solutions Architect at AWS, supporting Strategic customers architect their data workloads on AWS. With a background in data analytics, she has extensive experience helping customers architect and build enterprise data lakes, ETL workloads, data warehouses and data analytics solutions, both on-premises and the cloud. Sushmita is based in Florida and enjoys traveling, reading and playing tennis.
Amy Huang Amy is a Senior Financial Analyst at AWS and a CPA with over 7 years of progressive experience across Strategic Finance, Banking, and Auditing. She specializes in pricing, financial modeling and valuation, and data-driven analysis. Outside of work, she enjoys yoga and hiking.
If you’re a user—owner?—of this cryptocurrency, this is important:
On May 29, the security researcher Taylor Hornby found a critical vulnerability in Zcash Orchard privacy pool using Claude Opus 4.8. The Zcash team hired Hornby specifically to look for this kind of issue. He found one fast enough to be embarrassing.
The Orchard pool is the newest and most advanced shielded transaction system in the cryptocurrency Zcash. Introduced in 2022, it allows users to send and receive ZEC while keeping transaction details private. It uses zero-knowledge proofs to validate transactions without revealing amounts or participants. The bug: a specific check that was supposed to validate transaction inputs wasn’t actually enforcing the rules it appeared to enforce. An attacker could have exploited the flaw to feed false inputs into that check and generate ZEC from nothing, with the zero-knowledge proof system blessing the fraudulent transaction as valid.
It’s fixed; that’s the good news. The bad news is that there’s no way of knowing if anyone exploited the vulnerability to steal money. And this fragility is the fundamental problem that makes blockchain such a bad idea.
On June 8, 2026, Check Point published a security advisory for CVE-2026-50751, a critical authentication bypass vulnerability affecting Check Point Remote Access VPN, Mobile Access, and Spark Firewall products. The vulnerability affects deployments configured to use the deprecated IKEv1 key exchange protocol where gateways accept legacy Remote Access clients and do not require a machine certificate for connections.
CVE-2026-50751, classified as improper authentication (CWE-287), has a CVSS score of 9.3. The vulnerability stems from a logic flow weakness in how Remote Access and Mobile Access components validate certificates during IKEv1 key exchange; successful exploitation allows an unauthenticated attacker to establish a VPN session without providing valid credentials. Per the vendor, additional post-authentication activity is required to access internal resources or escalate privileges.
Check Point has indicated that CVE-2026-50751 is being actively exploited in the wild, with observed activity dating back to May 7, 2026 and an increase in early June. The vendor characterizes the campaign as limited in scope, affecting several dozen organizations. At least one incident has been linked to a Qilin ransomware affiliate, which Check Point assesses with medium confidence.
Separately, during its investigation Check Point identified a related vulnerability, CVE-2026-50752 (CVSS 7.4), in the same IKEv1 code path that could enable a man-in-the-middle attack against site-to-site VPN tunnels under certain configurations. No exploitation of CVE-2026-50752 has been observed.
Check Point VPN products have been targeted by zero-day vulnerabilities in the past. In May 2024, CVE-2024-24919, a high-severity information disclosure vulnerability in Check Point Quantum Security Gateways, was exploited in the wild and subsequently added to the CISA Known Exploited Vulnerabilities (KEV) catalog. Organizations running affected Check Point products are urged to apply the available hot fixes and follow the vendor guidance to remediate these issues.
Mitigation guidance
Check Point has released hotfixes to remediate CVE-2026-50751. Affected organizations should apply the available updates on an emergency basis, without waiting for a regular patch cycle to occur.
The following products and versions are affected (Remote Access VPN, Mobile Access / SSL VPN, Spark Firewall):
R80.20.X (End of Support)
R80.40 (End of Support)
R81 (End of Support)
R81.10 (End of Support)
R81.10.X
R81.20
R82
R82.00.X
R82.10
Notably, four of the nine affected version branches (R80.20.X, R80.40, R81, R81.10) have reached End of Support. Organizations still running these versions should prioritize migration to a supported release.
For organizations unable to immediately apply the hotfix, Check Point has provided the following alternative mitigations:
Remove support for the legacy remote access client
Configure global properties for Remote Access VPN authentication to IKEv2 only
Set machine certificate authentication as mandatory
Enable IPS and download the latest signatures
Rapid7 strongly recommends looking for signs of compromise even after the hotfix has been applied. Per Check Point’s advisory, incident response teams should prioritize forensic log audits and configuration reviews starting from May 7, 2026, the earliest known date of exploitation.
For the latest mitigation guidance, please refer to the vendor advisory.
Rapid7 customers
Exposure Command, InsightVM, and Nexpose
Exposure Command, InsightVM, and Nexpose customers can assess exposure to CVE-2026-50751 with a vulnerability check expected to be available in the June 9 content release.
Indicators of compromise
Check Point has published the following indicators associated with the CVE-2026-50751 exploitation campaign. The attacker infrastructure consists of VPS hosts from several providers (Kaupo Cloud HK, Shock Hosting, Vultr Holdings), and Check Point notes that in some cases, the VPS region matched the geography of the targeted organization.
IP addresses:
45.77.149[.]152
209.182.225[.]136
38.60.157[.]139
162.33.177[.]101
45.76.26[.]42
144.208.127[.]155
38.54.88[.]201
38.54.107[.]167
66.42.99[.]200
File hashes (MD5):
52fda5c1b9704544f32ee98d9060e689
51d39aa39478beeac94f2d12f682ecce
Check Point observed post-exploitation attempts to retrieve ELF payloads from attacker-controlled servers, and identified ties to the Qilin ransomware operation based on binary analysis. For the full and most current list of IOCs, please refer to the vendor advisory.
Building event-driven multi-tenant SaaS applications typically requires compute isolation between tenants to prevent data leakage, maintain security boundaries, and ensure compliance. Traditionally, you had to choose between two approaches: sharing execution environments across tenants (risking cross-tenant contamination of in-memory state) or managing separate Lambda functions per tenant (which introduces operational overhead, increasing costs, and complicating deployments). Both approaches required you to make trade-offs between security, operational complexity, and cost efficiency.
AWS Lambdatenant isolation mode with Event Source Mappings addresses this trade-off. This approach reduces operational complexity, improves your security posture, and removes the need to manage separate functions per tenant, all while maintaining strict compute-level isolation boundaries. You can now build event-driven architectures using services like Amazon SQS and Amazon EventBridge where each tenant’s workloads run in dedicated execution environments, but you manage only a single Lambda function.
In this post, you’ll learn how to propagate tenant identity from event payloads, implement IAM permissions for tenant-isolated invocations, apply validation strategies to verify tenant context, and use a lightweight routing mechanism that invokes tenant-isolated backends. Complete sample code demonstrating this pattern is available in the AWS samples repository.
Understanding Lambda tenant isolation mode
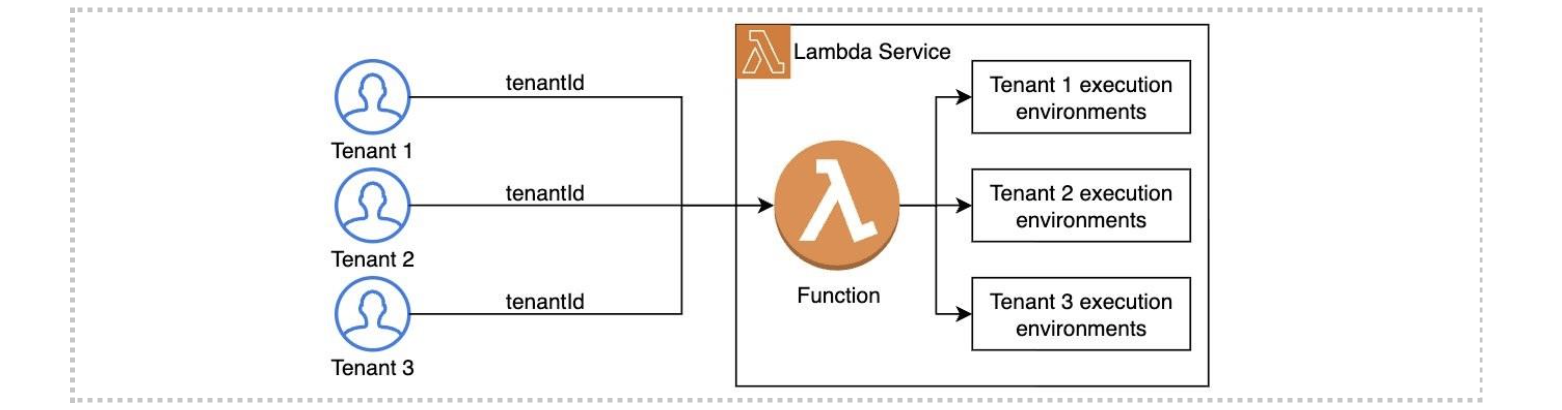
AWS Lambda tenant isolation mode extends Lambda’s execution model by introducing tenant-aware routing of invocations. Instead of reusing execution environments across all invocations of a function, Lambda associates each execution environment with a specific tenant identifier. When a new request is received, Lambda routes it to an existing environment for that specific tenant or creates a new one if none exists.
Figure 1. Using Lambda tenant isolation mode for compute isolation
This simplifies how you build multi-tenant SaaS systems, while maintaining isolation boundaries at the compute level. Execution environments are never shared across tenants but still reused within the same tenant for maximum efficiency. That means you can safely cache tenant-specific configurations, such as feature flags or database connection strings, without adding isolation logic manually in your code.
To use the tenant isolation mode, every invocation must include a tenant ID parameter. For synchronous, direct invocations, such as originating from Amazon API Gateway or AWS SDKs, you pass it using the X-Amz-Tenant-Id header, as described in the launch blog and service documentation. Lambda service uses this header to route the invocation to tenant-specific execution environments. Inside your function handler, the tenant ID is available using the context.tenantId property, so you can implement tenant-aware logic.
port const handler = async (event, context) => {
    const tenantId = context.tenantId;

    // Tenant-specific business logic here
    console.log(`Processing request for tenant: ${tenantId}`);
};
Figure 2. Accessing tenant ID from function handler.
When using API Gateway, you can extract the tenant ID value from incoming request metadata, such as HTTP headers, path parameters, query parameters, or JWT claims, and map it directly to the downstream X-Amz-Tenant-Id in the API Gateway integration request configuration. See the launch blog for detailed guidance.
This model works well for direct, synchronous invocations. However, many serverless applications rely on event-driven patterns, where Lambda is invoked through Event Source Mappings.
Using tenant isolation mode with event sources
Many serverless applications use event-driven architectures built on services like Amazon SQS, Amazon EventBridge, Amazon Kinesis, or Amazon DynamoDB Streams. In these cases, Lambda is invoked by an Event Source Mapping (ESM), which polls the event source and invokes your function when new events arrive.
With these services, you’ll commonly find the tenant identity embedded in the event payload or metadata – for example, in an SQS message body or EventBridge event detail. Each event source has its own payload schema. Below are example payloads when using SQS and EventBridge, where you can see the tenantId parameter present in the payload.
However, event sources don’t provide a built-in mechanism to map message properties to HTTP headers. As a result, if you try to invoke a function with tenant isolation mode enabled directly from an event source mapping, it fails because the tenant ID isn’t propagated as the X-Amz-Tenant-Id header. The following section describes how to address this and integrate ESMs with tenant-isolated Lambda functions.
Propagating tenant identity with Event Source Mappings
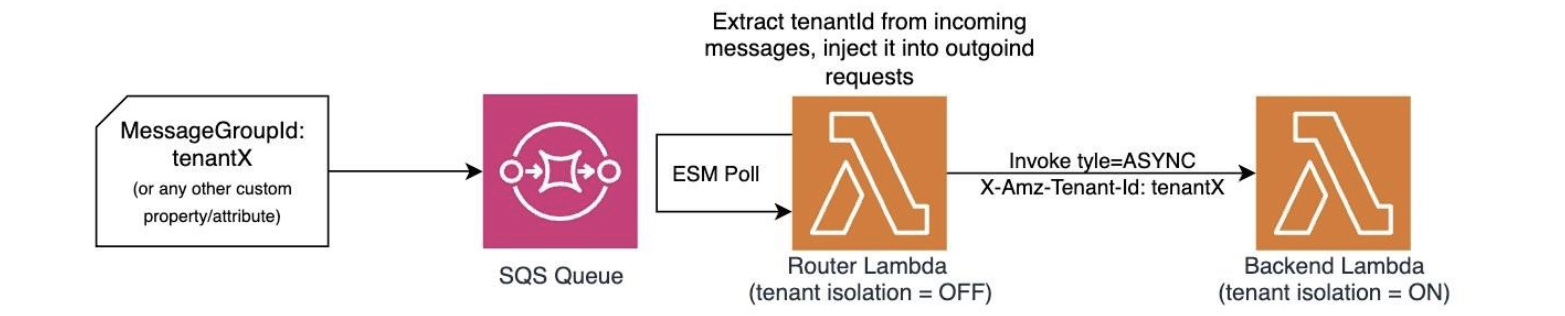
To propagate tenant identity from ESM messages, you can introduce a routing component – a lightweight Lambda function that sits between the event source and your tenant-isolated backend function. Your routing function receives events from the ESM, extracts the tenant ID from each message, and invokes your backend function using the Lambda Invoke API, passing the required X-Amz-Tenant-Id header. See the following diagram for an example architecture using SQS ESM.
Figure 3. Propagating tenant ID from SQS messages to Lambda with tenant isolation mode enabled
You don’t need to enable tenant isolation mode on the routing function itself – it acts as a stateless dispatcher. Your multi-tenant backend function, which contains your core business logic, runs with tenant isolation mode enabled and receives properly scoped, tenant-aware invocations. This pattern keeps tenant isolation at the backend layer while preserving a shared event ingestion model.
The following example illustrates a routing function that processes incoming SQS messages, extracts the tenant ID from each message body, and invokes your backend function with the appropriate tenant context. This example assumes MessageGroupId is used to carry the tenant identifier, which ensures messages from the same tenant are processed in order when you’re using FIFO queues.
export const handler = async (event) => {
    for (const record of event.Records) {
        const body = record.body;
        const messageGroupId = record.attributes?.MessageGroupId;

        const command = new InvokeCommand({
            FunctionName: BACKEND_FUNCTION_NAME,
            InvocationType: 'Event',
            TenantId: messageGroupId,
            Payload: Buffer.from(body)
        });

        await lambdaClient.send(command);
    }
}
Figure 4. Routing SQS messages to a Lambda function with tenant isolation mode enabled
The following example illustrates how you can achieve the same routing functionality when processing EventBridge events.
Figure 5. Routing EventBridge events to a Lambda function with tenant isolation mode enabled
IAM permissions
Your routing function’s execution role needs permission to:
Poll the event source: You can apply this policy either to your function execution role or as a resource policy on the event source itself.
Invoke the downstream backend function: Additionally, your router function requires the lambda:InvokeFunction permission scoped to your backend function ARN.
Below is an example execution role policy to allow the router function to poll from an SQS queue
Figure 6. IAM permissions used for implementing the tenant ID router function mechanism.
Best practices and considerations
When implementing the pattern described in this post, keep these important considerations in mind regarding validation, scaling, and overall system design.
Validate tenant identity before invocation. Tenant identity comes from event payloads, you shouldn’t automatically assume it’s trustworthy. Here’s how to protect your system:
Validate incoming payloads and reject messages with missing, malformed, or unauthorized tenant IDs at the routing layer before invoking your backend function
Maintain an authoritative tenant registry and validate incoming tenant IDs against it
Use dead-letter queues (DLQs) on your SQS queues to capture messages that fail validation for investigation and replay
When using EventBridge Pipes, use the enrichment step to validate or normalize tenant IDs before they reach your routing function
Enable partial batch response for applicable ESMs, such as SQS, so your routing function can report individual message failures without failing the entire batch
Plan for scaling considerations. Tenant isolation mode creates separate execution environments per tenant. This can increase the number of cold starts compared to shared environments. Each tenant consumes concurrency independently, so monitor your usage and request quota increases as your tenant base grows.
Optimize the routing function. Your routing function introduces an additional invocation segment. Use asynchronous invocation (InvocationType: ‘Event’) to reduce idle waiting time and size your function accordingly.
Understand permission boundaries. Tenants share your backend function’s execution role. If you need fine-grained per-tenant permissions, consider propagating tenant-scoped credentials (for example, using AWS STS AssumeRole) from the upstream segment.
Sample code
A complete, deployable sample project demonstrating this pattern – including SQS routing functions, a tenant-isolated backend function, and AWS SAM infrastructure – is available in this GitHub repository. Follow the instructions in README.md to provision the sample project in your account
Conclusion
Lambda tenant isolation mode introduces cross-tenant compute isolation for your multi-tenant SaaS applications by routing each invocation to a tenant-specific execution environment. When you combine this with event-driven architectures built on services like SQS, EventBridge, and Kinesis, the routing function pattern described in this post allows you to propagate tenant identity from event payloads and invoke your tenant-isolated backend with the correct context.
This approach extends tenant isolation mode to your asynchronous workloads without changing your core business logic. You retain per-tenant execution environment isolation while continuing to use Lambda’s native event source integrations, scaling model, and operational tooling. Together, these patterns provide you with a practical foundation for building secure, scalable, event-driven multi-tenant SaaS applications on AWS.
Next steps: Consider extending this pattern to other event sources like Kinesis Data Streams or DynamoDB Streams. You can also explore combining this approach with AWS Step Functions for orchestrating complex multi-tenant workflows while maintaining tenant isolation boundaries.
Enabling security tooling is the starting point. Making it operational—where findings drive decisions, response times are measurable, and your security posture improves week over week—is where most organizations struggle.
This blog post provides a phased maturity roadmap for organizations that have already enabled AWS Security Hub and Amazon GuardDuty. These two services form the foundation of a cloud-centered security operations capability on AWS. Security Hub provides centralized security posture management and aggregates findings from multiple AWS security services, while GuardDuty provides intelligent threat detection by continuously monitoring for malicious activity and unauthorized behavior. For any production or enterprise AWS environment, having both services enabled across all accounts and AWS Regions is a baseline expectation; not because they’re optional add-ons, but because effective security operations require both the ability to detect threats and the ability to understand your overall security posture. If you haven’t yet enabled them, the Security Hub documentation and GuardDuty documentation provide setup guidance, including multi-account deployment with AWS Organizations.
Customers consistently tell us that while individual AWS security service documentation is thorough, what’s missing is a consolidated operational playbook—one resource that ties the services together into a working security operations practice with clear phases, progression criteria, and an operational cadence. That’s the gap this post fills. Rather than covering how each feature works (the documentation does that well), this post focuses on when and why to use each capability, and how to build the organizational habits that make them effective.
What follows is a six-phase roadmap for moving from these services are active to these services are driving our security operations. Each phase builds on the previous one, and each is designed to deliver tangible, measurable improvement.
Phase 0: Assess your current state
Goal: Understand what’s working before changing anything.
Estimated timeline: 1–2 weeks
Move to Phase 1 when: You have a documented current-state assessment covering all the following items.
Before introducing new processes or automation, establish a clear picture of the current environment. This assessment informs every decision that follows.
Actions:
Findings inventory: Review existing active GuardDuty findings to determine how many there are, the severity distribution, and how old the oldest findings are. A large backlog of untouched HIGH or CRITICAL findings that have been sitting for weeks is a strong signal about where to focus first.
Security Hub score baseline: Determine your current compliance score against AWS Foundational Security Best Practices (FSBP) and The CIS AWS Foundations Benchmark. Check to see which standards are enabled; if multiple standards are enabled, review for overlapping standards (creating noise) or unused standards.
Multi-account and multi-Region check: Look to see if GuardDuty is enabled in every account and every Region, or only in Regions with active workloads. Threat actors frequently operate in Regions that organizations don’t actively monitor. Also check to see if Security Hub aggregation is configured with a delegated administrator account or if each account is being managed independently.
Integration check: Determine if GuardDuty findings are flowing into Security Hub and if Amazon Inspector and Amazon Macie are enabled and feeding findings in. Without integration, Security Hub might be only surfacing its own compliance checks.
Notification check: See if there’s an Amazon EventBridge rule configured for notifications and if so, how findings are being routed and to whom. Know if notifications are being sent using an Amazon Simple Notification Service (Amazon SNS) topic or a chat channel integration. Without a clear notification and response workflow, findings can accumulate silently in the console with no one looking at them.
Deliverable: A one-page current state assessment that identifies what’s enabled, what’s flowing where, who’s looking at it, and what’s in the existing backlog.
Phase 1: Reduce the noise
Goal: Make the signal meaningful before asking anyone to act on it.
Estimated timeline: 2–3 weeks
Move to Phase 2 when: Remaining findings represent items requiring real decisions, compliance scores reflect actual posture, and you can articulate why every suppression rule and disabled control exists.
This is the single most important phase. If this step is skipped in favor of jumping straight to automation, the result is automated chaos. Alert fatigue is the primary reason security tooling is ignored, and addressing it first is what makes everything that follows sustainable.
GuardDuty tuning:
Create suppression rules for known-benign findings. The goal is to suppress activity you’ve already evaluated and accepted—such as expected traffic from corporate egress IPs (based on trusted IP lists), internal tools that trigger DNS-based findings, or internet-facing resources that naturally receive port scanning. The principle: if you’ve investigated a finding and it’s expected, suppress it so your team can focus on what matters.
Triage every active HIGH and CRITICAL finding into three categories: needs immediate investigation (real threat, not yet reviewed), true positive, already addressed (archive using workflow status), or false positive or expected behavior (create a suppression rule). Every finding must be categorized into one of these three states.
Review GuardDuty protection plans and enable any that are relevant but not yet active. Organizations that enabled GuardDuty years ago might not have activated protection plans released since then (such as Runtime Monitoring, Malware Protection, RDS Protection, and Lambda Protection). Evaluate each against your workload profile and enable what applies.
Security Hub tuning:
Disable controls that aren’t relevant to the environment. This is the highest-value quick win. If a service isn’t in use, disable its controls. If a control is addressed by an alternative solution, disable it. A 47% compliance score where half the failures are irrelevant trains teams to ignore the dashboard entirely. See the Security Hub controls reference for the full list.
Choose a primary standard. AWS Foundational Security Best Practices is a strong default. The CIS AWS Foundations Benchmark adds value when there’s a specific compliance mandate. Avoid enabling PCI DSS or NIST 800-53 standards unless there’s a reporting requirement—they add significant volume without proportional signal for most organizations.
Configure cross-Region aggregation to the delegated administrator account if not already in place. A single aggregated view eliminates the need to check findings across multiple Regional consoles.
Use the workflow status field operationally. Findings should progress from NEW to NOTIFIED to RESOLVED or SUPPRESSED. If everything remains in NEW indefinitely, the system carries no operational meaning.
Deliverable: A tuned environment where remaining findings represent items that require real decisions. Compliance scores should now reflect your organization’s actual security posture rather than noise.
Phase 2: Build the notification and routing layer
Goal: Get the right findings to the right people at the right time.
Estimated timeline: 2–3 weeks
Move to Phase 3 when: CRITICAL and HIGH findings reach the security team within minutes, MEDIUM findings create tracked tickets, and notifications include enriched context. No action is taken until a person or an automation is informed that something needs attention.
Architecture: Security Hub to EventBridge rule to routing logic to destination
Tiered notification strategy:
CRITICAL
Page on-call immediately
PagerDuty or Opsgenie
15 minutes
HIGH
Alert security team channel
Slack or Teams channel and ticket creation
4 hours
MEDIUM
Create ticket for review
Jira or ServiceNow
48 hours
LOW or INFORMATIONAL
Batch digest
Weekly email summary or dashboard review
Next review cycle
Key design decisions:
Route from Security Hub, not individual services. Because findings from GuardDuty, Inspector, Macie, and Security Hub compliance checks all aggregate in Security Hub, build your EventBridge rules there for centralized management.
Create a fast path for the most dangerous finding types. Certain GuardDuty findings, particularly those involving credential exfiltration, cryptocurrency activity, trojans, and active compromises, warrant a separate, faster routing path that bypasses normal triage. Identify these based on your threat model and the GuardDuty finding types reference.
Enrich notifications before delivery. A raw JSON finding in a chat channel provides little actionable context. Use an AWS Lambda function to format notifications with the information responders need: account alias, Region, Amazon Resource Name (ARN), finding type, severity, a console deep link, and a plain-language description. The Security Hub CloudWatch Events integration guide describes the event format.
Deliverable: A working notification pipeline where CRITICAL and HIGH findings reach the security team within minutes, MEDIUM findings create tracked work items, and LOW and INFORMATIONAL findings are batched for periodic review.
Phase 3: Build automated remediation for high-confidence findings
Goal: For findings where the correct response is deterministic, remove the human from the loop.
Estimated timeline: 3–4 weeks
Move to Phase 4 when: At least 3–5 high-confidence finding types have automated responses deployed with audit trails, and the team has established a process for evaluating new auto-remediation candidates.
The guiding principle: Only auto-remediate when all three conditions are met: the finding is high-confidence, the response is deterministic, and the blast radius of the automated action is limited. Automated remediation must not create the risk of a production outage.
Decision framework:
Confidence level
High – no false positive risk
Medium – context-dependent
Low – requires investigation
Response complexity
Single, well-defined action
Multiple steps or judgment calls
Requires forensic analysis
Blast radius
Limited to one resource
Could affect dependent services
Production-wide impact
Rollback difficulty
Straightforward to reverse
Moderate effort to reverse
Difficult or impossible to reverse
Common auto-remediation categories:
Instance isolation for confirmed compromise findings (cryptocurrency mining, malware, and trojans): Replace the security group, snapshot volumes for forensics, and notify.
Credential revocation for confirmed credential compromise: Attach deny-all policies, revoke sessions, and deactivate access keys as appropriate to the credential type.
Compliance drift correction for deterministic misconfigurations: Re-enable Amazon Simple Storage Service (Amazon S3) Block Public Access, revoke overly permissive security group rules, and re-enable AWS CloudTrail logging.
Notification-only escalation for findings that require human judgment before action: Amazon Elastic Block Store (Amazon EBS) encryption gaps (require migration) and access key rotation (requires coordination with the key owner).
For implementation, AWS provides Security Hub Automated Response and Remediation (SHARR), a solution that includes pre-built remediation playbooks deployed as AWS Step Functions workflows triggered by EventBridge. This is a strong starting point—evaluate the provided playbooks, enable the ones that fit, and extend with custom remediations as needed.
Note: For findings that recur because the environment lacks preventive guardrails, the best long-term response is often a service control policy (SCP) that prevents the misconfiguration from occurring in the first place. Phase 5 covers this preventive controls layer.
Deliverable: A library of automated and semi-automated remediation runbooks with full audit trails, and a documented decision framework the team uses to evaluate new auto-remediation candidates.
Phase 4: Build the operational rhythm
Goal: Turn security findings management into a sustained organizational practice, not a one-time cleanup.
Estimated timeline: 4–6 weeks to establish, then ongoing
Move to Phase 5 when: The weekly cadence has been running consistently for at least 8 weeks, monthly metrics show positive trends, and the first quarterly review has been completed.
This is where many organizations stall, and it’s the most important phase in the entire roadmap. The technology is working, the notifications are flowing, automated remediations are firing, but there’s no organizational habit built around it. Without this phase, everything you’ve built in Phases 0–3 will gradually decay. Suppression rules will go stale, new team members won’t know the system exists, and findings will start accumulating again. The operational rhythm is what converts a security tooling deployment into a security operations practice.
Weekly security review (30 minutes)
Attendees: Security team lead, cloud platform team representative, rotating engineering lead from an application team
Why the rotating engineering lead matters: Security findings don’t exist in a vacuum; they’re generated by workloads that engineering teams own. Rotating an engineering representative through this meeting accomplishes three things: it builds security awareness across the organization, ensures findings are routed to people with the context to resolve them, and creates organizational accountability beyond the security team.
Agenda template:
5 minutes
Compliance score trend – Review Security Hub scores by account and standard. Is the trend improving, declining, or flat? If declining, why?
Security lead
Identified regression areas
5 minutes
Critical and high findings review – Walk through new HIGH and CRITICAL GuardDuty findings from the past week. Are there any that need immediate escalation?
Security lead
Escalation actions assigned
10 minutes
Top five failing controls – Identify the five Security Hub controls with the most failures. Assign an owner and a target date for each.
Platform lead
Owners and dates documented
5 minutes
Automation review – Did any auto-remediations fire this week? Did they work correctly? Were there any false triggers?
Security lead
Automation adjustments queued
5 minutes
Tuning decisions – Are new suppression rules needed based on this week’s findings? Are any new finding types candidates for auto-remediation?
All
Tuning backlog updated
Running the meeting effectively:
Keep a running document (such as a wiki page or shared document) that captures decisions and action items week over week. This becomes your institutional memory.
If the compliance score hasn’t moved in over 3 weeks, that’s a signal. Either the assigned work isn’t happening, or the remaining findings are genuinely difficult to address. Both need to be discussed.
Track action items from previous weeks. A review that generates action items but never follows up on them will lose credibility and attendance quickly.
Escalation procedures
Define clear escalation paths before they’re needed:
CRITICAL finding not acknowledged within the SLA
Auto-escalate to security team manager
15 minutes after SLA breach
HIGH finding not resolved within the SLA
Escalate to finding owner’s manager
4 hours after SLA breach
Compliance score drops more than 5 points in a week
Escalate to cloud platform team lead for investigation
Next business day
Auto-remediation failure
Page security on-call
Immediate
New finding type not covered by existing runbooks
Add to weekly review agenda for triage and runbook development
Next weekly review
Monthly metrics report
Compile these metrics monthly and review them with security and engineering leadership. The goal is to tell a story about whether the organization’s security posture is improving, stable, or degrading, and why.
Mean time to acknowledge (MTTA) for CRITICAL findings
Are findings being seen promptly?
Decreasing month over month
Mean time to resolve (MTTR) for CRITICAL and HIGH findings
Are findings being acted on?
Decreasing month over month
Security Hub compliance score by standard, by account
What is the posture trend over time?
Increasing month over month
Number of active GuardDuty findings by severity
Is the backlog growing or shrinking?
Decreasing for HIGH and CRITICAL
Findings auto-remediated compared to manually resolved
Is automation delivering value?
Auto-remediation ratio increasing
Number of suppressed findings (with quarterly justification review)
Is noise being managed, or are problems being hidden?
Stable or decreasing
New findings introduced compared to resolved this month
Is the organization getting ahead or falling behind?
More finding resolved than introduced
SLA adherence rate by severity
Are response commitments being met?
More than 95% for CRITICAL, and more than 90% for HIGH
Building the dashboard: Use Amazon CloudWatch dashboards for real-time operational visibility or Amazon QuickSight connected to Security Hub findings through Amazon Security Lake for historical trend analysis and executive reporting. The dashboard should be visible to—and regularly viewed by—everyone in the weekly review, not locked in a security team tool.
Quarterly reviews
The quarterly review is a deeper inspection of the system itself; not just the findings, but the machinery processing them.
Quarterly review checklist:
Suppression rules audit: Review every active suppression rule to determine if the underlying condition is still present and the suppression is still justified. Document the review outcome for each rule.
Disabled controls audit: Review every disabled Security Hub control. Check that the justification is still valid and if the environment changed (for example, a service that wasn’t in use is now in use).
Automation audit: Review AWS Identity and Access Management (IAM) roles used by remediation functions and verify least privilege. Review execution logs for any anomalies or failures that weren’t caught.
New capabilities review: Evaluate newly released GuardDuty protection plans and Security Hub controls from that quarter. AWS releases new detection and compliance capabilities regularly. If you’re not reviewing them quarterly, you’re accumulating blind spots.
Process effectiveness review: Determine if the weekly meeting is well-attended and if action items are being completed. Make sure SLAs are being met. If attendance, action item completion, and SLA compliance aren’t where they should be, explore structural changes to address the gaps.
Operational maturity scoring
Use this rubric to assess the maturity of your operational rhythm itself. Score each dimension 1–3 and use the total to track progress over time.
Review cadence
One time reviews when someone remembers
Weekly review happens, but attendance is inconsistent
Weekly review is consistently attended with documented outcomes
Metrics tracking
No metrics captured
Metrics are collected monthly but not acted on
Metrics drive decisions and declining trends trigger specific actions
Finding ownership
Findings sit in queue with no owner
Findings are assigned to teams but SLAs aren’t tracked
Every finding has an owner, SLAs are tracked, and breaches are escalated
Automation management
Set-and-forget automations
Automation logs are reviewed periodically
Automation is reviewed weekly, and new candidates are evaluated continuously
Tuning lifecycle
Suppression rules created but never reviewed
Annual review of suppressions and disabled controls
Quarterly reviews with documented justification for every rule
Cross-team engagement
Security team works in isolation
Platform team participates
Engineering teams actively participate and own remediation
Scoring (revisit quarterly):
Beginning: 6–9
Established: 10–14
Optimized: 15–18
Deliverable: A documented operational cadence with clear ownership (consider a RACI matrix), metrics dashboards, escalation procedures, and a continuous improvement loop. The cadence should survive team member turnover—if it depends on one person remembering to run it, it’s not yet operational.
Phase 5: Mature the architecture
Goal: Fill remaining gaps and build toward a comprehensive security operations capability. Estimated timeline: Ongoing. Prioritize based on organizational risk profile and compliance requirements.
Amazon Inspector integration: Enable Amazon Inspector for Amazon Elastic Compute Cloud (Amazon EC2) instances, Lambda functions, and Amazon Elastic Container Registry (Amazon ECR) container images. Findings flow into Security Hub automatically, adding vulnerability management alongside threat detection and posture management. Prioritize this if you have Amazon EC2 or container workloads without an existing vulnerability scanning solution.
Amazon Macie: Enable Amazon Macie for S3 buckets containing potentially sensitive data. Particularly important for organizations with compliance requirements around personally identifiable information (PII), protected health information (PHI), or Payment Card Industry (PCI) data. Configure automated sensitive data discovery and route findings to Security Hub.
Amazon Security Lake: Amazon Security Lake centralizes security-relevant logs in OCSF format for long-term retention, forensic investigation, and threat hunting. This is valuable when you need historical analysis beyond the Security Hub retention window, or when feeding a third-party Security Information and Event Management (SIEM) tool.
Preventive controls layer: Convert recurring detective findings into preventive policies. Use SCPs to prevent disabling GuardDuty, Security Hub, and CloudTrail, IAM permission boundaries on developer roles, AWS WAF on public endpoints, and AWS Network Firewall for VPC traffic inspection. The pattern is to make recurring misconfigurations impossible to introduce.
Incident response readiness: Have incident response playbooks referencing specific GuardDuty finding types, pre-built forensics infrastructure (isolated VPC, forensic AMIs, and pre-configured IAM roles), regular tabletop exercises, and AWS CloudFormation templates to deploy isolation infrastructure on demand. See the AWS Security Incident Response Guide for a comprehensive framework.
Conclusion
In this post, I provided a six-phase roadmap for operationalizing Security Hub and GuardDuty and showed that it isn’t a single project, but a progression. Phase 0 and Phase 1 can typically be completed in 3–5 weeks and deliver immediate clarity. Phases 2 and 3 build the response infrastructure that turns findings into action over the following 5–7 weeks. Phase 4 is what makes everything sustainable and is where you should invest the most attention. And Phase 5 expands the aperture from Security Hub and GuardDuty into a comprehensive security operations capability.
If you walked away from this post and did one thing, run the Phase 0 assessment this week. That single deliverable tells you exactly where to focus next. Use the following self-assessment checklist to identify your current phase, then focus on the next one. A tuned environment with working notifications and a weekly review cadence is dramatically more effective than a fully featured but neglected deployment. Start where you are, reduce the noise, build the habits, and iterate. To learn more, explore the AWS Security Hub User Guide, the Amazon GuardDuty User Guide, and the AWS Security Incident Response Guide. If you’ve implemented a similar operational cadence, or have questions about any phase, share your experience in the comments.
Self-assessment checklist
Phase 0
We know how many active GuardDuty findings exist across all accounts
☐
We know our current Security Hub compliance score
☐
We know whether GuardDuty is enabled in every account and region
☐
We know who (if anyone) is reviewing findings today
☐
Phase 1
GuardDuty suppression rules exist for known-benign activity
☐
Irrelevant Security Hub controls have been disabled with documented justification
☐
All active HIGH and CRITICAL findings have been triaged
☐
Security Hub compliance scores reflect actual posture, not noise
☐
Phase 2
HIGH and CRITICAL findings generate real-time notifications to the security team
☐
MEDIUM findings automatically create tracked work items
☐
Notifications include enriched context (account alias, resource ARN, and console link)
☐
Phase 3
At least three high-confidence finding types trigger automated remediation
☐
Auto-remediation actions have full audit trails
☐
Remediation runbooks are documented and version-controlled
☐
Phase 4
A weekly security review meeting occurs with defined attendees and agenda
☐
MTTA and MTTR are tracked monthly for CRITICAL and HIGH findings
☐
Suppression rules and disabled controls are reviewed quarterly
☐
Security metrics trend positively over the past 3 months
☐
Phase 5
Amazon Inspector, Macie, or Security Lake are integrated
Running JMS applications on on-premises brokers or Apache ActiveMQ requires manual patching cycles, capacity planning for peak loads, and maintaining high availability across multiple data centers. With Amazon MQ version 4 and above, you can migrate your existing JMS applications without rewriting your messaging layer, removing weeks of rewrite work.
This post shows you how to migrate your JMS applications and walks through a complete setup, from creating the broker to sending and receiving messages. You will also see a real-world scenario: migrating an existing Apache ActiveMQ workload to an Amazon MQ broker running RabbitMQ. The post covers configuration changes, monitoring with Amazon CloudWatch, and validation steps to make sure that your migration succeeds.
Amazon MQ version 4 and above includes built-in support for the RabbitMQ JMS Client and the JMS Topic Exchange plugin. The RabbitMQ JMS Client and JMS Topic Exchange plugin work together, allowing your existing JMS applications to connect using familiar JMS APIs. You update the connection factory configuration and broker endpoint. Your business logic, message producers, consumers, and listeners stay exactly as written.
Understanding JMS and AMQP
How the RabbitMQ JMS Client works
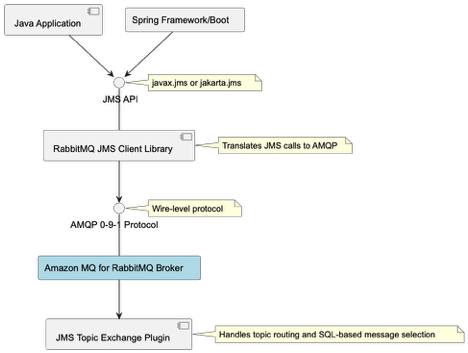
Use the RabbitMQ JMS Client to connect your Java application to Amazon MQ. The client translates your JMS API calls (javax.jms or jakarta.jms) into AMQP 0-9-1 messages that the broker understands.
Advanced Message Queuing Protocol (AMQP) defines how messages are formatted and transmitted across the network at the wire level. This means that non-Java services can consume the same messages using native AMQP clients, making the protocol language-agnostic
JMS version support
Migrate at the JMS version that your application already uses. The client supports JMS 1.1, 2.0, and 3.1 (Jakarta Messaging), so you don’t need to upgrade your application code before migrating brokers. The client integrates with Spring Framework and Spring Boot applications without requiring custom bean factories or application context configuration.
Because the JMS abstraction layer sits between your application and the broker, most migrations require only a connection factory change, not a logic rewrite.
RabbitMQ JMS Topic Exchange plugin
Your existing publish/subscribe patterns work without client-side routing logic. The JMS Topic Exchange plugin adds server-side support for JMS topic semantics, handling topic routing and SQL-based message selection directly in the broker.
The plugin handles SQL-based message selection (JMS selectors like OrderType = `Electronics` AND Priority > 5) and topic hierarchies with wildcard pattern matching (* for single level, # for multiple levels). Your application uses standard JMS topic APIs (createTopic(), setMessageSelector()) without additional filtering logic.
Getting started
This walkthrough shows you how to set up Amazon MQ and connect your existing JMS application. You will create a broker, configure the connection factory, and send and receive messages.
Prerequisites
You need an existing JMS application built on Apache ActiveMQ or another JMS provider to migrate. If you don’t have one, you can still follow Steps 1–5 to create a broker and test the connection pattern. Before you begin, confirm that you have the following in place:
An active AWS account
AWS Command Line Interface (AWS CLI) installed. For instructions, see Installing the AWS CLI.
Java 11 or later installed on your local development environment.
An AWS Identity and Access Management (IAM) principal (user or role) with the AmazonMQFullAccess managed policy attached.
Maven or Gradle for dependency management.
Amazon MQ broker charges apply based on instance type and usage. Review the Amazon MQ pricing page before you start.
Step 1: Create an Amazon MQ for RabbitMQ broker
The following command creates a single-instance broker running RabbitMQ 4.2 on an mq.m7g.medium instance.
Replace <broker-name> with the name that you want to give to the broker. Replace <username> and <password> as described in the create-broker CLI documentation. After the command runs successfully, the command line displays the BrokerArn and BrokerId.
Note: This command creates a publicly accessible broker for demonstration purposes only. For production workloads, create brokers in private subnets within your VPC and restrict access using security groups. Don’t use the –publicly-accessible flag. For more information, see Security best practices for Amazon MQ.
Choose the dependency that matches your application’s current JMS version. If your imports reference javax.jms packages, use version 2.12.0. If your imports reference jakarta.jms packages (JMS 3.1 / Jakarta EE 9+), use version 3.4.0.
Store your broker credentials in AWS Secrets Manager before configuring the connection factory. This keeps credentials out of your source code and configuration files.
Publish/subscribe (topic) for one-to-many broadcast:
try (JMSContext context = connectionFactory.createContext()) {
	Topic topic = context.createTopic("orders.electronics");
	context.createProducer().setProperty("MessageType", "Broadcast").send(topic, "New electronics order received!");
	System.out.println("Published message to topic: orders.electronics");
}
Message properties(OrderType, MessageType) are JMS headers that consumers can use for filtering. These properties become AMQP message headers when transmitted to the broker.
Step 5: Receive messages asynchronously
To receive messages asynchronously, attach a MessageListener to a consumer. The listener fires each time a message arrives.
Queue consumer:
Asynchronous consumers process messages in a background thread without blocking your main application logic. The MessageListener callback fires each time a message arrives, allowing your application to handle messages as they’re delivered rather than polling with receive().
try (JMSContext context = connectionFactory.createContext()) {
	Queue queue = context.createQueue("orders");
	JMSConsumer consumer = context.createConsumer(queue);
	consumer.setMessageListener(message -> {
		if (message instanceof TextMessage) {
			try {
				System.out.println("Received: " + ((TextMessage) message).getText());
			} catch (JMSException e) {
				e.printStackTrace();
			}
		}
	});

	System.out.println("Listening for messages on queue: orders");

	// Keep the consumer active for 30 seconds
	Thread.sleep(30000);
}
The Thread.sleep(30000) call keeps the consumer active for 30 seconds.
Use case: Migrating an ActiveMQ Workload to Amazon MQ for RabbitMQ
Migrate your Apache ActiveMQ applications to Amazon MQ by updating four configuration points. Your business logic, message producers, consumers, and listeners stay exactly as written. This walkthrough uses a real JMS 1.1 application with a centralized broker configuration class to show precisely which lines change and which remain identical.
Apache ActiveMQ powers messaging infrastructure for thousands of Java applications worldwide. If you run JMS applications on ActiveMQ, you can migrate to Amazon MQ for RabbitMQ with minimal code changes. The following steps demonstrate a complete migration using an application that includes a centralized broker configuration class, a message producer, and a message consumer.
Step 1: Update the Maven dependency
Replace the ActiveMQ client dependencies with the RabbitMQ JMS client in your pom.xml. The rabbitmq-jms artifact includes the RabbitMQ AMQP client and JMS API as transitive dependencies, so a single entry replaces both ActiveMQ artifacts.
The rabbitmq-jms artifact pulls in the RabbitMQ AMQP client and the JMS API as transitive dependencies, so a single entry replaces both ActiveMQ artifacts.
Step 2: Update the broker configuration
If your application centralizes connection details in a shared configuration class, that class is the only file that needs to change. The queue name and everything else your application references remain the same.
Before (ActiveMQ):
// BrokerConfig.java - ActiveMQ version
public final class BrokerConfig {
	// OpenWire endpoint
	public static final String BROKER_URL = "tcp://localhost:61616";
	public static final String USERNAME = "[PASSWORD]";
	public static final String PASSWORD = "[PASSWORD]";
	public static final String QUEUE_NAME = "demo.queue";
	private BrokerConfig() {}}
After (Amazon MQ):
// BrokerConfig.java - Amazon MQ version

import com.fasterxml.jackson.core.type.TypeReference;import com.fasterxml.jackson.databind.ObjectMapper;
import software.amazon.awssdk.regions.Region;
import software.amazon.awssdk.services.secretsmanager.SecretsManagerClient;
import software.amazon.awssdk.services.secretsmanager.model.GetSecretValueRequest;
import software.amazon.awssdk.services.secretsmanager.model.GetSecretValueResponse;
import java.util.Map;

public final class BrokerConfig {
	// AMQPS endpoint (TLS required by Amazon MQ)
	public static final String BROKER_URL = "amqps://b-c8352341-ec91-4a78-ad9c-a57f23f235bb.mq.us-west-2.on.aws:5671";

	// Queue name carries over unchanged
	public static final String QUEUE_NAME = "demo.queue";

	// Secret name in AWS Secrets Manager
	private static final String SECRET_ID = "dev-rabbitmq";
	private static final Map<String, String> CREDENTIALS = loadCredentials();
	public static String getUsername() {return CREDENTIALS.get("username");}
	public static String getPassword() {return CREDENTIALS.get("password");}
	private static Map<String, String> loadCredentials() {
		try (SecretsManagerClient client = SecretsManagerClient.builder().region(Region.US_WEST_2).build()) {
			GetSecretValueResponse response = client.getSecretValue(GetSecretValueRequest.builder().secretId(SECRET_ID).build());
			ObjectMapper mapper = new ObjectMapper();
			return mapper.readValue(response.secretString(), new TypeReference<Map<String, String>>() {});
		} catch (Exception e) {
			throw new RuntimeException("Failed to load broker credentials from Secrets Manager", e);
		}
	}
	private BrokerConfig() {}}
Two things changed in this file compared to the ActiveMQ version: the protocol prefix (tcp:// to amqps://) and the host and port (OpenWire on 61616 to AMQP over TLS on 5671). The queue name is identical. Credentials are no longer stored as static string constants. Instead, loadCredentials() retrieves them from AWS Secrets Manager at startup, and getUsername() and getPassword() expose them to the rest of the application. This follows AWS security best practices and streamlines credential rotation.
Step 3: Update the message producer
The producer requires two changes: the import statement and the factory instantiation. Every JMS API call after the factory (createConnection, createSession, createProducer, send) is identical to the ActiveMQ version.
import com.rabbitmq.jms.admin.RMQConnectionFactory;
import javax.jms.*;

public class MessageProducer {

	public static void main(String[] args) {
		Connection connection = null;
		try {
			RMQConnectionFactory factory = new RMQConnectionFactory();
			factory.setUri(BrokerConfig.BROKER_URL);
			factory.setUsername(BrokerConfig.getUsername());
			factory.setPassword(BrokerConfig.getPassword());

			// Everything below this line is identical to the ActiveMQ version
			connection = factory.createConnection();
			connection.start();
			Session session = connection.createSession(false, Session.AUTO_ACKNOWLEDGE);
			Destination destination = session.createQueue(BrokerConfig.QUEUE_NAME);
			javax.jms.MessageProducer producer = session.createProducer(destination);
			producer.setDeliveryMode(DeliveryMode.PERSISTENT);
			for (int i = 1; i <= 5; i++) {
				TextMessage message = session.createTextMessage("Hello from Amazon MQ - message #" + i);
				producer.send(message);
				System.out.println("Sent: " + message.getText());
			}
			producer.close();
			session.close();
		} catch (JMSException e) {
			e.printStackTrace();
		} finally {
			if (connection != null) {
				try {
					connection.close();
				} catch (JMSException ignored) {}
			}
		}
	}
}
The import changes from org.apache.activemq.ActiveMQConnectionFactory to com.rabbitmq.jms.admin.RMQConnectionFactory. The factory construction switches from a constructor that accepts credentials and URL to a no-arg constructor with explicit setter calls. Credentials are now retrieved from AWS Secrets Manager through BrokerConfig.getUsername() and BrokerConfig.getPassword(). That is the complete change set for the producer.
Step 4: Update the message consumer
The consumer follows the same pattern as the producer. Swap the factory class and import, update the credential calls, and keep everything else.
import com.rabbitmq.jms.admin.RMQConnectionFactory;
import javax.jms.*;

public class MessageConsumer {
	public static void main(String[] args) {
		Connection connection = null;
		try {
			RMQConnectionFactory factory = new RMQConnectionFactory();
			factory.setUri(BrokerConfig.BROKER_URL);
			factory.setUsername(BrokerConfig.getUsername());
			factory.setPassword(BrokerConfig.getPassword());

			// Everything below this line is identical to the ActiveMQ version
			connection = factory.createConnection();
			connection.start();
			Session session = connection.createSession(false, Session.AUTO_ACKNOWLEDGE);
			Destination destination = session.createQueue(BrokerConfig.QUEUE_NAME);
			javax.jms.MessageConsumer consumer = session.createConsumer(destination);
			System.out.println("Waiting for messages on queue: " + BrokerConfig.QUEUE_NAME);
			Message message;
			while ((message = consumer.receive(10000)) != null) {
				if (message instanceof TextMessage) {
					TextMessage textMessage = (TextMessage) message;
					System.out.println("Received: " + textMessage.getText());
				}
			}
			consumer.close();
			session.close();
		} catch (JMSException e) {
			e.printStackTrace();
		} finally {
			if (connection != null) {
				try {
					connection.close();
				} catch (JMSException ignored) {}
			}
		}
	}
}
The import changes from org.apache.activemq.ActiveMQConnectionFactory to com.rabbitmq.jms.admin.RMQConnectionFactory. The factory construction switches to a no-arg constructor with explicit setter calls, and BrokerConfig.USERNAME / BrokerConfig.PASSWORD are replaced with BrokerConfig.getUsername() / BrokerConfig.getPassword(). The session creation, queue lookup, consumer setup, and message processing loop are identical to the ActiveMQ version.
Configuration
The following table summarizes the changes required when migrating from Apache ActiveMQ.
ActiveMQ
Amazon MQ for RabbitMQ
Maven dependency
activemq-client 5.18.6
rabbitmq-jms 2.12.0
Connection factory class
ActiveMQConnectionFactory
RMQConnectionFactory
Import package
org.apache.activemq
com.rabbitmq.jms.admin
Broker URL format
tcp://host:61616
amqps://broker-id.mq.region.on.aws:5671
Protocol
OpenWire
AMQP 0-9-1
Port
61616 (OpenWire)
5671 (AMQP over TLS)
TLS
Optional
Required
Credentials
Plain text / JNDI
AWS Secrets Manager (recommended)
Virtual host
N/A
/ (default)
JMS version support
JMS 1.1
JMS 1.1, 2.0, 3.1 (Jakarta)
Queue/Topic names
demo.queue
demo.queue (no change)
JMS API calls
Standard JMS 1.1
Standard JMS 1.1 (no change)
Validating the migration
Run your application against Amazon MQ for RabbitMQ in a staging environment before directing production traffic to the new broker. Verify that messages flow correctly, consumers process as expected, and no data loss occurs during cutover.
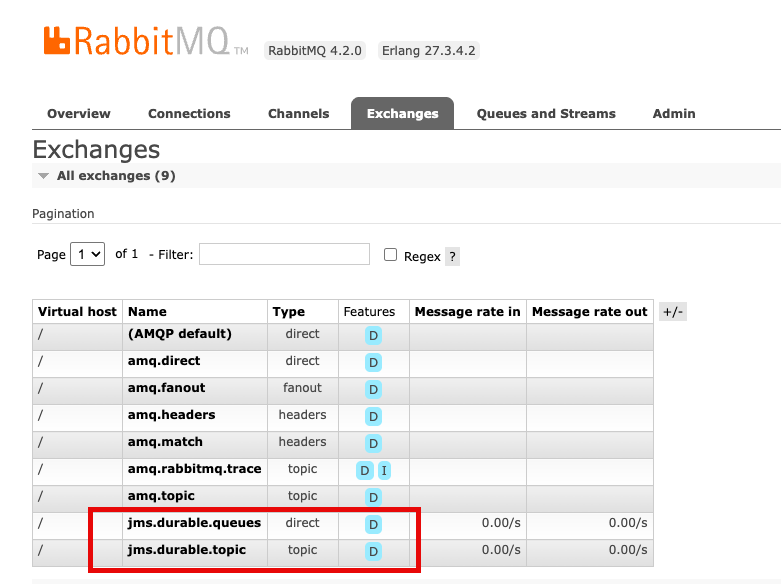
The RabbitMQ management console provides real-time visibility into broker operations. Access it through the ConsoleURL from your broker details. The console shows queue depths, consumer counts, and message rates. Use it during testing to identify routing or throughput issues before production deployment
The console displays jms.durable.queues and jms.durable.topic exchanges. The JMS client creates these automatically when your application creates queues and topics, so no manual exchange configuration is required.
Monitoring with Amazon CloudWatch
Amazon MQ publishes broker metrics to Amazon CloudWatch with no additional configuration needed. This gives you persistent monitoring and alerting that works alongside the rest of your AWS observability setup, beyond what the RabbitMQ management console provides in real time.
After your JMS messages reach the Amazon MQ for RabbitMQ broker, they’re transported as AMQP messages, which means standard RabbitMQ operational best practices apply. Keep queue depth low to avoid memory pressure and consumer lag. Follow message durability and reliability guidelines to prevent message loss during broker restarts. For connection management, review broker setup and connection best practices to avoid connection churn.
Set Amazon CloudWatch alarms on MessageCount and ConnectionCount first. A rising queue depth with a stable or dropping consumer count is an early signal of a processing bottleneck. A sudden drop in connections can indicate a client configuration issue that’s more straightforward to catch before it affects production traffic.
Clean up
To avoid ongoing charges after testing, delete the Amazon MQ broker and Secrets Manager secret using the AWS CLI.
Broker deletion is permanent and can’t be undone. Amazon MQ removes all messages, configurations, and user credentials. Leaving the broker running incurs hourly charges based on the instance type, plus storage costs for message data retained on the broker.
Conclusion
In this post, we walked you through how to migrate your JMS applications. We also walked through a complete setup, from creating the broker to sending and receiving messages. Migrating the broker is the straightforward part. The more significant question is what you do next. After your JMS application is running on Amazon MQ for RabbitMQ, you have access to native AMQP clients, which means non-Java services can start consuming the same messages without a JMS layer. A Java-centric messaging system becomes a shared event backbone that service can participate in. The migration is a starting point, not just a lift-and-shift.
In a filesystem-track session at the 2026 Linux Storage,
Filesystem, Memory Management, and BPF Summit, Amir Goldstein updated
attendees on the fanotify
filesystem-event monitoring
subsystem. He wanted to describe changes that had come in the last year or
so, as well as upcoming features and some remaining challenges in his
efforts to use fanotify for hierarchical
storage management (HSM). Fanotify is the user-space API for monitoring
files, directories, and filesystems for events of various sorts
(e.g. opening or deleting a file).
Andrew Tridgell has announced
the release of rsync 3.4.4 with
fixes for the regressions introduced in the 3.4.3 release. He also
notes there will be an rsync 3.5.0 soon, with many more security
updates:
As part of the 3.5.0 release update I have created a [email protected] mailing list for anyone who is willing
to do testing of the 3.5.0 release. The idea is to try to reduce the
chance of more regressions by expanding the set of testers of this
release. I have seeded it with people who were involved in past rsync
security issues. If you want to join this list then the easiest way
would be for you to be vouched for by someone on the [email protected] list or someone else I already trust.
My apologies for the regressions in the 3.4.3 release and I hope future
security updates for rsync will have less issues. The greatly expanded test
suite in rsync 3.5 combined with the rsync-security mailing list should
help.
Cloudflare’s Threat Events provides security analysts with a window into the global threat landscape. The platform offers a peek into the immense traffic that Cloudflare processes every day, so you can see in real time which IPs are attacking specific industries or which threat actors are trending globally. However, translating that visibility into active mitigation has often been a manual, reactive process.
Security teams have faced a recurring frustration: knowing that certain IP addresses were associated with specific threat actors (like Tycoon 2FA or RaccoonO365) or had been seen targeting their specific industry in other regions, but they couldn’t easily automate the blocking of these high-risk IPs within their own WAF unless they manually configured the rules.
We are excited to announce a new integration that brings Cloudflare’s vast threat intelligence directly into your WAF engine: you can now write proactive rules using live intelligence data. This means you can add more intelligence context to protect your application against known bad actors — before they even attempt to touch your infrastructure.
By populating specialized fields during the early stages of a request, the WAF can now screen traffic based on:
Who is attacking by matching specific threat actor names
Who they are targeting via the industry or country filters to see who the IP has targeted in the past
What type of attack using enriched threat context, filtering by attack type (DDoS, WAF, cybercrime, etc.) and the timeframe it was last seen
Always-on detection
This new capability is built on the samealways-on detection framework we recently introduced for Attack Signature Detection, a system that identifies common attack patterns in real time without requiring pre-configured rules. By separating detection from mitigation, we ensure that threat intelligence is constantly running in the background, enriching your HTTP request analytics with insightful threat metadata before you even decide to take an action.
The primary advantage of an “always-on” model is the elimination of the traditional “log vs. block” trade-off: visibility in log mode, or protection in block mode. That’s because when a rule blocks a request, you lose visibility into how other signatures would have assessed it — insight that could have helped you strengthen your defenses.
If you have a Cloudforce One subscription, these insights appear in your analytics automatically. You can see which threat actors are hitting your site and which industries those IPs usually target, allowing you to verify traffic patterns before “flipping the switch” to block.
These detections execute with negligible latency, ensuring your performance remains lightning-fast while providing the high-confidence data needed to build robust security policies. While this initial release focuses on IP-based matching, we are already looking toward extending these capabilities to JA3 fingerprints and domain-based matching. This will allow you to block malicious traffic even when attackers rotate IPs, by identifying the unique software signatures or malicious destination links they use in their payloads.
New WAF fields
To make this possible, we’ve exposed the following specific signals directly to the WAF engine:
Field
Description
cf.intel.ip.attacker_names
Names of known threat groups (e.g., CRAVENFLEA).
cf.intel.ip.target_industries
Industries targeted by this IP (e.g., Cryptocurrency, Automotive).
cf.intel.ip.attacker_countries
The source country of the threat event.
cf.intel.ip.target_countries
The countries targeted by the threat event.
cf.intel.ip.datasets
The source feed providing the data (e.g., ddos, waf).
Example rule expressions
Because a single IP address could be associated with multiple threat actors or targeted industries simultaneously, these fields are represented as arrays. We use the any() function and [*] wildcard to check whether any value within that threat profile matches your criteria:
Block known DDoS participants targeting your region: any(cf.intel.ip.target_countries[*] == "FR") and any(cf.intel.ip.datasets[*] == "ddos")
Protect against specific threat actors targeting the Finance sector: any(cf.intel.ip.target_industries[*] == "Banking & Financial Services") and any(cf.intel.ip.attacker_names[*] == "BLACKBASTA")
Broad protection against specific high-risk origin countries: any(cf.intel.ip.attacker_countries[*] == "IR")
How to use Threat Events data in your workflows
Whether you prefer a UI-driven approach or Infrastructure as Code, these fields are integrated into your existing workflows.
The WAF rule builder (API & Terraform)
For teams that prefer Infrastructure as Code, the new cf.intel fields are fully integrated into the WAF rule builder for WAF custom rules and rate limiting. You can write complex expressions using the same syntax you use today. Because these are standard WAF fields, they are fully supported via the Cloudflare API and Terraform, allowing you to automate threat blocking across your selected domains or even on your whole account.
New fields added to the WAF rule builder to allow users to choose the relevant configuration based on the Threat Events indicators.
Visibility in Security Analytics
Deployment is only half the battle. All matches triggered by these threat intelligence fields are logged in Security Analytics. You can drill down into your traffic to see exactly which rule was triggered and which specific indicator matched. These enriched logs allow for faster auditing and postmortem analysis when a rule triggers.
Threat event matches surface in Security Analytics, with full context and a one-click option to create a custom security rule.
One-click rule from the Threat Events dashboard
If you are already using the Threat Intelligence Dashboard to investigate trends, you don’t have to copy and paste IP lists. You can create Saved Views based on your specific filters, such as “IPs seen attacking the Financial sector in the last seven days.” With a single click, you can export these filters directly into a WAF rule.
Saved Views now allow users to easily create WAF rules to match the saved view configuration.
Global intelligence across our network
Visibility and ease of use are only possible if the underlying engine is fast. How do we handle millions of threat indicators without slowing down your traffic?
These threat intelligence datasets are compressed into a high-performance format and distributed to every single Cloudflare data center globally. When a request hits our network, the Cloudflare WAF performs an O(1) constant-time lookup against these local datasets. This ensures that whether we are checking against ten indicators or ten million, the latency overhead remains effectively zero (measured in microseconds).
Because an IP can be associated with multiple threat vectors, our engine doesn’t stop at the first match. It evaluates the set of all signals associated with that IP simultaneously. This ensures that a rule looking for “Attacker = RU” AND “Target Industry = Banking” will trigger correctly by evaluating the intersection of these attributes in a single pass, providing maximum coverage against multi-vector actors without increasing computational complexity.
Cloudforce One Essentials allows customers to access the default datasets in Threat Events, search for indicators, and conduct threat-hunting investigations
Cloudforce One Advantage allows customers to access our Threat Intelligence Analyst custom insights via requests for information
Cloudforce One Elite — our most complete package — includes brand protection, a high number of requests for information, and access to all Threat Events datasets
Ready to turn global insights into local defense? Head over to Threat Events or the WAF section of your Cloudflare Dashboard to start building your first Threat Intel rule, or contact your account team to learn more about subscribing to Cloudforce One.
In April, Anthropic initated Project Glasswing. The idea was to let companies use their new model to find and fix vulnerabilities in their own software. It was a fantastic PR move, and so many press outlets have uncritically parroted Anthropic’s claims that it’s now common wisdom that Mythos is better at finding software vulnerabilities than other models. Which is just nottrue.
In any case, Anthropic has published a Project Glasswing status report. It’s finding a lot of vulnerabilities in software—yay! Some of them are even dangerous. But almost none of them has been patched. It’s weird. There’s something fishy about the data that I don’t understand. That Anthropic refuses to release details—that it just says “trust us”—is a big problem here.
The 7.1-rc7 kernel prepatch is out for
testing. Linus said: “Anyway, as things look now this is the last
rc. Something can obviously always come up and force us to change that, but
please give rc7 a whirl and keep testing for one more week.“
To provide the best experiences, we use technologies like cookies to store and/or access device information. Consenting to these technologies will allow us to process data such as browsing behavior or unique IDs on this site. Not consenting or withdrawing consent, may adversely affect certain features and functions.
Functional
Always active
The technical storage or access is strictly necessary for the legitimate purpose of enabling the use of a specific service explicitly requested by the subscriber or user, or for the sole purpose of carrying out the transmission of a communication over an electronic communications network.
Preferences
The technical storage or access is necessary for the legitimate purpose of storing preferences that are not requested by the subscriber or user.
Statistics
The technical storage or access that is used exclusively for statistical purposes.The technical storage or access that is used exclusively for anonymous statistical purposes. Without a subpoena, voluntary compliance on the part of your Internet Service Provider, or additional records from a third party, information stored or retrieved for this purpose alone cannot usually be used to identify you.
Marketing
The technical storage or access is required to create user profiles to send advertising, or to track the user on a website or across several websites for similar marketing purposes.
 Nidhi Nayak
 Raza Hafeez
 Sushmita Barthakur
 Amy Huang