Post Syndicated from Crosstalk Solutions original https://www.youtube.com/watch?v=EUh2522iGHk
Cloud Threat Detection: To Agent or Not to Agent?
Post Syndicated from Gadi Naor original https://blog.rapid7.com/2022/07/22/cloud-threat-detection-to-agent-or-not-to-agent/

The shift towards cloud and cloud-native application architectures represents an evolutionary step forward from older paradigms. The adoption of containers, Kubernetes, and serverless functions, along with the use of cloud-based infrastructure, introduces a new set of risks and security challenges — as well as new opportunities. These go well beyond application security and security posture management, spanning from the build phase all the way to the application run phase.
Three areas for cloud-native security
One particular area of focus for security defenses is actively security monitoring cloud-based applications and cloud workloads, often referred to as runtime security.
We can break down cloud-based runtime security into three main categories:
1. Cloud environment security
The cloud environment is where we provision the infrastructure and services to run our applications. Running applications often involves provisioning computing resources, networking, storage resources, and access credentials to external elements such as data, external services, or secrets. This is the foundation that our cloud applications are built on, and is a critical first step in ensuring their integrity.
2. Workload and workload orchestration security
Operating modern cloud-native applications often means leveraging a container orchestration platform. In recent years, Kubernetes has been the go-to application server vehicle. Leveraging application server infrastructure like Kubernetes requires attention from a risk and threat perspective. For example, Kubernetes credentials theft, or credential compromise as a result of application breach, can be detected through continuously analyzing the Kubernetes audit log. Another example would be the detection of malware that exploit inherent weaknesses in DNS protocol through network security analysis of the workload (Pod) communications.
3. Application security
If the cloud environment is our workload vehicle where we operate and run our workloads, and containerized workloads are our application vehicle, then OS processes are where our application logic runs. Cloud functions are another example of normally short-lived processes that carry our application logic. Protecting applications is a long-standing challenge on its own. This includes application API security, memory protection, data protection, network isolation, and control, and can be achieved using multiple techniques — some of which are only practically possible through the use of security agents.
Security agents defined
Security agents represent a specialized software deployed on an application workload or application endpoint to perform specific security functions, such as network monitoring, process-level monitoring, memory monitoring, file system monitoring, system API call monitoring, and memory monitoring. They may be involved in preventive actions, detection actions, or security forensics data collection actions.
For example, we can deploy security agents to virtual machines (cloud instances) and provide host-level security. We can use security agents for containerized environments like Kubernetes, where one security agent monitors and secures Kubernetes Pods, as well as the Kubernetes node itself. We can also have embedded security agents that monitor and secure serverless functions such as Lambda, or even security agents that provide process-level security and API-level security.
Agentless security is an approach that leverages security signals obtained via cloud APIs, such as network flows, DNS flows, cloud API access audit logs, or application API access logs. Collecting data from those security signals incurs a lower operational cost than agent-based security, but it can come with some limitations. For instance, in application security, the agentless approach has fewer security signals to analyze, and may not support some threat detection techniques such as process system call analysis.
Should I use agents to secure my cloud applications?
So should you be using agents, or not? The answer really boils down to how wide and deep a detection and protection fabric you want to cast, and how many skilled personnel are available to deploy and operate various security controls and respond to security incidents.
Agents provide a greater level of detail, and are generally your best bet when it comes to preemptive prevention of fine-grained policy-based controls such as network segmentation. However, they also require additional effort and overhead to manage the agents themselves with regular updates and configurations.
The agentless approach is excellent at correlating, segmenting, and analyzing data from various workloads, as it does not rely on sharing resources with the monitored workloads. That said, you’re going to sacrifice depth of coverage at certain layers of the stack as a trade-off to relatively lower operational overhead, because agentless approaches rely on cloud provider APIs, which are less granular than what host/workload or process-level agents can collect.
So to achieve comprehensive security and balance operational overhead, the recommendation is typically to leverage both technologies.
You’ll likely want to use an agentless approach to get fast and wide coverage of both risks and threats, or in places where agents can not be deployed, such as a hosted container environment like AWS Fargate or Cloud Functions. Another example would be to assess software vulnerability and detect persistent malware — which can be achieved using both technologies, but with different levels of time until detection.
Conversely, agents can be used in environments like Kubernetes where the operational overhead is relatively low, and the containerized workload granularity requires fine-grained and deeper security controls.
The decision of where to use an agent-based approach depends on what you’re trying to secure. If you’re looking to get real-time visibility into all of your cloud resources and workloads, establish a single source of “good” across your multiple cloud platforms, prioritize risk across your environments, and measure compliance against organizational and industry standards and best practices, an agentless approach like InsightCloudSec is a great choice.
ViewSonic G220fb: An Awesome 21" CRT Monitor from 2003
Post Syndicated from LGR original https://www.youtube.com/watch?v=ySQzXpYETXc
[$] Stuffing the return stack buffer
Post Syndicated from original https://lwn.net/Articles/901834/
“Retbleed”
is the name given to a class of speculative-execution vulnerabilities
involving return instructions. Mitigations for Retbleed have found their
way into the mainline kernel but, as of this writing, some remaining
problems have kept them from the stable update releases. Mitigating
Retbleed can impede performance severely, especially on some Intel
processors. Thomas Gleixner and Peter Zijlstra think they have found a better
way that bypasses the existing mitigations and misleads the processor’s
speculative-execution mechanisms instead.
Simplify SIEM Optimization With InsightIDR
Post Syndicated from Margaret Wei original https://blog.rapid7.com/2022/07/22/simplify-siem-optimization-with-insightidr/
Two key ways InsightIDR helps customers tailor reporting, detection, and response — without any headaches

For far too many years, security teams have accepted that with a SIEM comes compromise. You could have highly tailored and custom rule sets, but it meant endless amounts of tuning and configuration to create and manage them. You could have pre-built content, but that meant rigidity and noise. You could have all the dashboard bells and whistles, but that meant finding the unicorn that knew how to navigate them. Too many defenders have carried this slog, accepting this traditional SIEM reality as “it is what it is.” No more!
It’s possible to have it all — an intuitive interface and sophisticated tuning and customization
With InsightIDR, Rapid7’s leading SIEM and XDR, you can have the best of both worlds — an easy-to-use tool that’s also incredibly sophisticated. InsightIDR makes it easy and intuitive to tune your detections (without heavy script-writing or configuration required). When it comes to viewing your environment’s data and sharing key metrics, our Dashboard Library and reports are readily available and highly customizable for your unique needs.
Filter out the noise with fine-tuned alerts
Every time an analyst creates an alert it takes work. At Rapid7, we want to save you time and advance your security posture — which is where our Detections Library comes in. Curated and managed by our MDR SOC team, you can rest assured that you’ll only be alerted to behaviors that are worthy of human review so that you can make the most out of your limited time and focus on the threats that really matter.
While we focus on creating a curated, high-fidelity library of detections, we know each environment has its unique challenges — which is why our attacker behavior analytics (ABA) detections are robustly tuneable. You can also get more granular with your tuning and take the following actions:
- Create custom alerts when your organization calls for niche detections.
- Customize UBA directions so you’re in control of which you have turned on to align your alerting with your environment.
- Modify ABA detections by changing the rule action, modifying its priority, and adding exceptions to the rule.
- Stay on top of potential noise with Relative Activity, a new score for ABA detection rules that analyzes and identifies detection rules that might cause frequent investigations or notable events if switched on, as well as determines which rules may benefit from tuning, either by changing the Rule Action or adding exceptions.
Customize dashboards and reports to best suit your team
With InsightIDR, teams have access to over 45 (and counting) dashboards out of the box — from compliance dashboards for frameworks like HIPAA or ISO to Active Directory Admin Activity — to help your team focus on driving faster decision-making.
Analysts can also leverage this pre-built content as a springboard for customizing their own reports. InsightIDR provides multiple query modes and methods for creating data visualizations — so whether you are more comfortable with loose keyword search, working in our intuitive query language, or simply clicking on charts to narrow down results — every analyst can operate as an expert, regardless of their prior SIEM experience.
InsightIDR also makes it easy to share findings and important metrics with anyone in your organization — send an interactive HTML or PDF report of any dashboard with the click of a button.
Check out the other ways InsightIDR can help drive successful detection and response for your team here.
Additional reading:
Магистрати искат прозрачност „Елиминирани сме“. Обжалват скандалния вот за членове на Висш съдебен съвет
Post Syndicated from Николай Марченко original https://bivol.bg/%D0%B5%D0%BB%D0%B8%D0%BC%D0%B8%D0%BD%D0%B8%D1%80%D0%B0%D0%BD%D0%B8-%D1%81%D0%BC%D0%B5-%D0%BE%D0%B1%D0%B6%D0%B0%D0%BB%D0%B2%D0%B0%D1%82-%D1%81%D0%BA%D0%B0%D0%BD%D0%B4%D0%B0%D0%BB.html
петък 22 юли 2022

Четирима съдии обжалват скандалните избори за членове на Висшия съдебен съвет (ВСС), стана ясно на заседанието на смесен петчленен състав на Върховния касационен съд (ВКС) и Върховния административен съд (ВАС)…
Security updates for Friday
Post Syndicated from original https://lwn.net/Articles/902184/
Security updates have been issued by Fedora (gnupg2, oci-seccomp-bpf-hook, suricata, and vim), Oracle (java-11-openjdk), Slackware (net), and SUSE (kernel, nodejs16, rubygem-rack, and webkit2gtk3).
Trek of the US 25th Infantry Bicycle Corps
Post Syndicated from The History Guy: History Deserves to Be Remembered original https://www.youtube.com/watch?v=4ZKiRVMbDhM
What’s Up, Home? – Say Cheese!
Post Syndicated from Janne Pikkarainen original https://blog.zabbix.com/whats-up-home-say-cheese/22181/
Can you take screenshots of the websites you monitor with Zabbix? Of course, you can! By day, I earn my living by being a monitoring tech lead in a global cyber security company. By night, I monitor my home. Welcome to my weekly blog about how I monitor my home with Zabbix & Grafana and do some weird experiments with them.
Proper full-stack monitoring does cover everything from the device’s physical status to what the end-user sees. However, often even with website monitoring, web admins only rely on all kinds of run-time data; operating system load, hardware health, service response times, and logs. If your site has some rarely occurring technical issue, you might not have any idea what the site looks like when the error happens. Is your site looking really wrong or is maybe just a panel or two misbehaving during some issue?
Zabbix & Selenium to the rescue!
Get your Selenium
No, even if this post is meant to provide some food for thought, I am not speaking about the selenium your metabolism needs. Instead, I am speaking about a web-test framework that allows you to automate web browsers by using Java, Python, or several other languages it supports. It’s probably most useful for web browser & website developers so they can be sure that their sites look OK on all major browsers and so forth, but why not utilize that with your monitoring, too?

With a really short Python script (or whatever language) you can spawn a headless instance of whatever browser you want and ask it to do stuff for you. In the horribly simple example above, the script can be called like
selenium_screenshot.py blog.zabbix.com
and it then saves the screenshot under /usr/share/zabbix/assets/webtest-screenshots/ directory which is accessible by my home Zabbix & Grafana.
Now, where did I put that script?
What I actually use this for at home is that whenever some lunch restaurants publish their new menus, my Zabbix grabs a screenshot of the lunch menus and I can then spy the menus without a need to go to sites by myself.
As I do not want to show the more exact locations of the places I visit, in this example I’ll show you how to screenshot the blog.zabbix.com site instead.
Hooking the script to Zabbix is easy; just add the script to Zabbix via its Administration –> Scripts, and add it as a script you can call via Actions, and if you so want, also put it as a manual action so you can call the script manually any time you want through Zabbix contextual menus.

Then just add a trigger that snaps a screenshot whenever your web test is failing.
Say cheese!
Now that we have our screenshot mechanism in place, this is how it looks through Zabbix URL widget:

… and this is how it looks when embedded to Grafana with its Text panel, HTML content type and a simple <img> tag:

What’s this useful for?
Lots of stuff. From now on, you too can easily embed a screenshot of your monitored website within your monitoring environment. Put some more panels to that dashboard showing the active alerts, graphs, run-time data, and logs, and you can have a very comprehensive full stack monitoring in place.
Or make your screenshot script more intelligent (I recommend that anyway), and make it save the files with date stamp info in filenames, so you can have a nice little time machine inside Grafana and its time picker.
Selenium can also give you many more other details, such as performance data or the URLs which were called during the page load. I’m sure that’s useful, too.
I have been working at Forcepoint since 2014 and never get tired of getting a more clear view of the status of the stuff I monitor. — Janne Pikkarainen
The post What’s Up, Home? – Say Cheese! appeared first on Zabbix Blog.
One very hot summer stream!
Post Syndicated from BeardedTinker original https://www.youtube.com/watch?v=v7XgRdpuFpc
За 9 евро из Германия – впечатления и перспективи
Post Syndicated from Светла Енчева original https://toest.bg/za-9-evro-iz-germaniya-vpechatleniya-i-perspektivi/
Изминаха близо два месеца, откакто Германия въведе месечния билет от 9 евро, позволяващ неограничено пътуване из цялата страна с регионален транспорт. Как се развива експериментът и какви са перспективите след приключването му в края на август?
Старт със смесени чувства
Едно от клишетата за германците е, че те много обичат да се оплакват от обществения си транспорт, който в сравнение с този в повечето страни си е направо образцов. Към началото на юни обаче, когато евтиният билет започна да важи, действително имаше основания за недоволство, които продължават и до днес. Влакове, които закъсняват с половин-един час, а нерядко дори отпадат, не е нещо, с което хората в Германия са свикнали. Но е факт, че през последните месеци влаковете в страната никак не са точни, а в много градове общественият транспорт е видимо разреден. Всичко това помрачаваше еуфорията от въвеждането на билета.
На всичко отгоре на 3 юни влак дерайлира край Гармиш-Партенкирхен в Бавария, в резултат на което загинаха петима души, а над 60 бяха ранени. Причините още се изясняват. Трагичният инцидент провокира философа Волфрам Айленбергер да отправи остра критика към „Дойче Бан“, която според него е станала некомпетентна и „напълно е загубила контрол над мисията си“, в движението на влаковете цари хаос, а хората, работещи в железниците, изпитват срам. Айленбергер споделя, че поради тези причини в последните седмици преди влаковата катастрофа е имал предчувствие, че нещо лошо ще се случи.
За тези проблеми не можем да виним билета от 9 евро.
Общественият транспорт в Германия е станал нетипично неточен основно по две причини. Първата причина е същата, поради която в последно време и на много летища по света цари хаос и е пълно с отменени полети. И поради която в почти всички магазини и заведения в Германия (и вероятно не само там) има обяви, че се търси персонал. Става дума за ковид кризата – в резултат на нея множество работещи са съкратени и все още получават компенсации, поради което не тръгват на работа. Затова почти навсякъде се усеща недостиг на служители.
Втората причина е, че по време на пандемията, когато хората почти не пътуваха, в страната започнаха множество крупни ремонти на релси и гари, част от които още не са приключили. Затова много влакове се движат с променен маршрут, което пък затруднява движението на други и води до дълго чакане по гарите, препълнени влакове, изпуснати транспортни връзки и много нерви.

С евтиния билет влаковете очаквано стават още по-препълнени.
Няма как да се предостави точна статистика колко от закупилите този билет го ползват, за да ходят на работа, и колко – за да попътуват за удоволствие. Но е факт, че препълнените влакове са тъкмо тези към популярните дестинации. От личен опит мога да потвърдя, че ако се запътвате към градове като Дюселдорф, Кьолн, Хайделберг, Франкфурт или дори Вупертал, ще разберете, че стадният инстинкт ви е присъщ, колкото и да се смятате за неконформист. Защото ще видите стотици хора, които едновременно с вас се канят да направят същото, което и вие. А някои от тях дори ще разпознаете на гарата на връщане.
Сред пътуващите за 9 евро има всякакви типажи – от представители на средната класа до социално слаби семейства, които най-сетне могат да си позволят да заведат децата си на разходка или в зоопарк в друг град. И страшно много младежи. Както и много хора от всякакви възрасти с куфари, издаващи, че са тръгнали не на еднодневен излет, а на пътешествие с преспиване. Сред тези типажи с особена слава се сдобиват
пънкарите, пътуващи до Зюлт.
Зюлт е остров в Северно море, на границата с Дания, известен като най-скъпото място в Германия. Там цените на имотите са по-високи и от мюнхенските, а на почивка ходят най-големите тузари в страната. До началото на юни богатите и свикнали на лукс жители на острова едва ли са виждали жив пънкар, защото представителите на тази субкултура са отрицание на всичко, което обичайните му посетители са.
Това се променя в началото на юни, когато групи пънкари, „въоръжени“ с евтиния билет, започват да прииждат на остров Зюлт. С по една раница на гърба и тонколона под мишница те се настаняват директно на плажовете. Там слушат музика, пеят, пушат, пият значителни количества алкохол, ядат, спят и… облекчават естествените си нужди. За ужас на местните, които непрекъснато подават оплаквания и дори издигат барикада от бетонни блокове, за да ограничат достъпа на „натрапниците“ до определени места.
В същото време много германци искрено се забавляват със ситуацията с пънкарите в Зюлт, защото едно от нещата, които средностатистическият германец никак не обича, е демонстрирането на богатство и луксозен начин на живот. Именно на това демонстриране пънкарите показват среден пръст (образно, а понякога и буквално) – нещо, което възпитаните средностатистически граждани няма да си позволят, но пък могат да му се порадват. И да се посмеят на пънкарската песен, посветена на билета от 9 евро и Зюлт:
Ползата за градовете
За разлика от Зюлт, повечето места, привличащи закупилите евтиния билет, печелят от нарасналата си популярност. Хората не само пътуват дотам, а и в общия случай консумират нещо – поне напитка, сладолед или пица. Някои си купуват сувенири, посещават музеи и други забележителности. Затова градовете, които имат какво да предложат, определено печелят от антикризисната мярка. Сред тълпи и сергии с всевъзможни джунджурии Хайделберг например, който и без това е магнит за туристите, е заприличал на Несебър през август. Далеч по-малко са онези, които отиват да разгледат Дармщат, да речем.
Вупертал е относително беден град в индустриалния Северозапад, известен с две неща – висящата си железница/трамвай и танцовия театър на Пина Бауш. И двете се преплитат във филма на Вим Вендерс „Пина“, посветен на паметта на известната хореографка, починала малко преди началото на снимките. Билетът от 9 евро повиши популярността на Вупертал, защото с него може да се пътува и с прословутия висящ трамвай, който е част от обществения транспорт на града. Наистина впечатляващо, когато железницата се носи над река Вупер или минава над хорските глави. Човек може да помечтае за такъв транспорт над Перловската река. Макар местните да са свикнали и да не се удивляват всеки път, когато се качват на трамвая.


Сложни времена за кондукторите
„А, стойте си спокойно, предполагам, че всички сте си купили билет. За 9 евро ще сте глупави, ако не сте. Исках само да ви кажа „здравейте“ и да видя как сте.“ Тези думи се приписват на анонимен кондуктор в самото начало след въвеждането на билета. Въпреки че комай всеки си е купил въпросния билет, се случва, макар и по-рядко от преди, кондуктори да правят проверки в градския транспорт и регионалните влакове, защото все някак трябва да си заслужат заплатите.
В някои случаи обаче работата им се превръща в абсурд. Влаковете към по-популярните дестинации понякога са толкова претъпкани, че се налага човек да е направо йога акробат, за да намери поза, в която едновременно да запази равновесие и да диша. Стига се дотам, че пътници масово се настаняват в първа класа, без да имат право на това. По високоговорителите се разнасят безпомощни призиви хората без билет за първа класа да я напуснат, но в последна сметка кондукторите ги оставят да си пътуват, защото във втора класа няма никакво място.
В експресните влакове пък, в които билетът от 9 евро не важи, все се намират пътници, които не са разбрали това (или се правят на неразбрали). А не е трудно да се отличат тези влакове от регионалните по това, че са бели, с червена линия (която понякога в периода на Прайда е в цветовете на дъгата). „Не издържам вече – нетипично за германски служител пред клиент (в мое лице) излива душата си кондукторът в един експрес. – Вече почти два месеца минаха и още има такива, които не са разбрали, че за белите влакове с червена линия билетът не важи. И когато им обяснявам, пак не разбират. Имали редовен билет за 9 евро. Какво повече мога да направя?!“


А от септември – какво?
От септември месечен билет за 9 евро няма да има. Въпросът е не дали експериментът ще бъде продължен под някаква форма, а как точно ще бъде продължен. Основанията да се търси трайна промяна в цените на обществения транспорт в Германия са няколко:
Първо, междинната равносметка след първия месец е положителна. Не само пътуванията с влак са се увеличили, а и някои хора все пак са слезли от колите си, за да използват обществен транспорт. В резултат задръстванията в 23 от 26 изследвани града са намалели, като най-голямо е облекчаването на трафика в Хамбург и Висбаден.
Второ, въпреки ясната заявка, че евтиният билет е само за три месеца, обществените очаквания за някаква форма на осигуряване на трайно ниски суми за пътуване са високи. На фона на инфлацията и очакваните ограничения на употребата на газ и поради войната в Украйна хората имат нужда от някакъв позитивен отдушник.
Трето, освен скъпа, системата за карти и билети за обществения транспорт в Германия е изключително сложна. Има не само много различни видове превозни документи, ами те се различават и в безбройните транспортни области в страната. Всичко това е в състояние да докара един неопитен пътник до сълзи, особено ако се опитва да си купи билет от автомат. Билетът от 9 евро представлява рязко опростяване на тази система.
Четвърто, други европейски страни вече предлагат свои варианти за евтин обществен транспорт. В Испания например цените на градския транспорт са намалени с 30%, а от 1 септември до края на годината човек ще може да пътува безплатно с държавните железници на кратки и средни разстояния, стига да си е купил карта за многократни пътувания.
Сигурно е обаче, че наследникът на евтиния билет ще струва повече от 9 евро.
Защото дори богата страна като Германия не би си позволила да налива в подобна мярка огромно количество бюджетни средства за неограничен период от време. Освен това е не е достатъчно само общественият транспорт да е достъпен – той трябва да се поддържа и развива. А това също не става без пари.
Засега се обсъждат различни варианти на достъпен месечен билет – между 29 и 69 евро, както и 365 евро за годишна карта. Въпросът е как цената хем да не е разорителна за държавата, общините и самите транспортни организации, хем да продължава да е мотивираща за хората в Германия. Но не чак толкова мотивираща, че пътуването с влак да се превърне в екшън.
Снимки: © Светла Енчева
Physics Cost-Saving Tips
Post Syndicated from original https://xkcd.com/2649/

Formulating ‘Out of Memory Kill’ Prediction on the Netflix App as a Machine Learning Problem
Post Syndicated from Netflix Technology Blog original https://netflixtechblog.com/formulating-out-of-memory-kill-prediction-on-the-netflix-app-as-a-machine-learning-problem-989599029109
by Aryan Mehra
with Farnaz Karimdady Sharifabad, Prasanna Vijayanathan, Chaïna Wade, Vishal Sharma and Mike Schassberger

Aim and Purpose — Problem Statement
The purpose of this article is to give insights into analyzing and predicting “out of memory” or OOM kills on the Netflix App. Unlike strong compute devices, TVs and set top boxes usually have stronger memory constraints. More importantly, the low resource availability or “out of memory” scenario is one of the common reasons for crashes/kills. We at Netflix, as a streaming service running on millions of devices, have a tremendous amount of data about device capabilities/characteristics and runtime data in our big data platform. With large data, comes the opportunity to leverage the data for predictive and classification based analysis. Specifically, if we are able to predict or analyze the Out of Memory kills, we can take device specific actions to pre-emptively lower the performance in favor of not crashing — aiming to give the user the ultimate Netflix Experience within the “performance vs pre-emptive action” tradeoff limitations. A major advantage of prediction and taking pre-emptive action, is the fact that we can take actions to better the user experience.
This is done by first elaborating on the dataset curation stage — specially focussing on device capabilities and OOM kill related memory readings. We also highlight steps and guidelines for exploratory analysis and prediction to understand Out of Memory kills on a sample set of devices. Since memory management is not something one usually associates with classification problems, this blog focuses on formulating the problem as an ML problem and the data engineering that goes along with it. We also explore graphical analysis of the labeled dataset and suggest some feature engineering and accuracy measures for future exploration.
Challenges of Dataset Curation and Labeling
Unlike other Machine Learning tasks, OOM kill prediction is tricky because the dataset will be polled from different sources — device characteristics come from our on-field knowledge and runtime memory data comes from real-time user data pushed to our servers.
Secondly, and more importantly, the sheer volume of the runtime data is a lot. Several devices running Netflix will log memory usage at fixed intervals. Since the Netflix App does not get killed very often (fortunately!), this means most of these entries represent normal/ideal/as expected runtime states. The dataset will thus be very biased/skewed. We will soon see how we actually label which entries are erroneous and which are not.
Dataset Features and Components
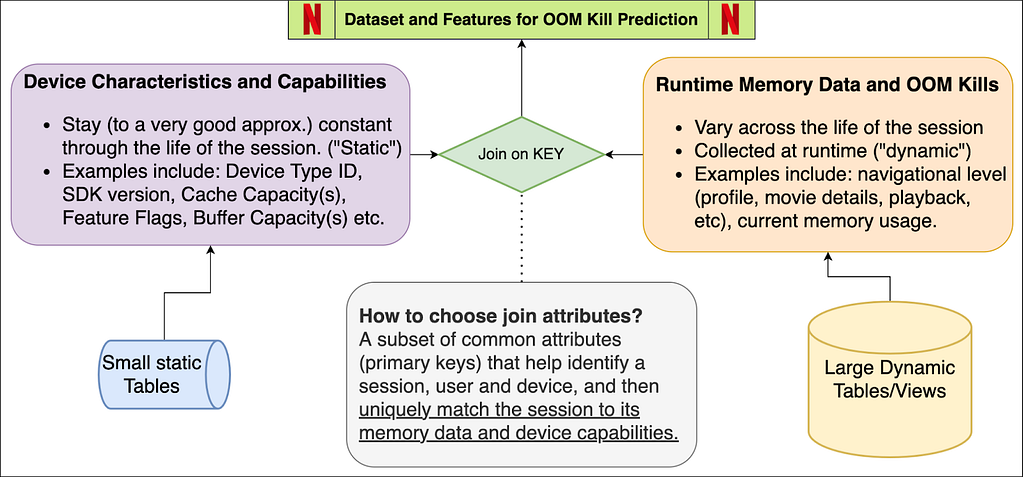
The schema figure above describes the two components of the dataset — device capabilities/characteristics and runtime memory data. When joined together based on attributes that can uniquely match the memory entry with its device’s capabilities. These attributes may be different for different streaming services — for us at Netflix, this is a combination of the device type, app session ID and software development kit version (SDK version). We now explore each of these components individually, while highlighting the nuances of the data pipeline and pre-processing.
Device Capabilities
All the device capabilities may not reside in one source table — requiring multiple if not several joins to gather the data. While creating the device capability table, we decided to primary index it through a composite key of (device type ID, SDK version). So given these two attributes, Netflix can uniquely identify several of the device capabilities. Some nuances while creating this dataset come from the on-field domain knowledge of our engineers. Some features (as an example) include Device Type ID, SDK Version, Buffer Sizes, Cache Capacities, UI resolution, Chipset Manufacturer and Brand.
Major Milestones in Data Engineering for Device Characteristics
Structuring the data in an ML-consumable format: The device capability data needed for the prediction was distributed in over three different schemas across the Big Data Platform. Joining them together and building a single indexable schema that can directly become a part of a bigger data pipeline is a big milestone.
Dealing with ambiguities and missing data: Sometimes the entries in BDP are contaminated with testing entries and NULL values, along with ambiguous values that have no meaning or just simply contradictory values due to unreal test environments. We deal with all of this by a simple majority voting (statistical mode) on the view that is indexed by the device type ID and SDK version from the user query. We thus verify the hypothesis that actual device characteristics are always in majority in the data lake.
Incorporating On-site and field knowledge of devices and engineers: This is probably the single most important achievement of the task because some of the features mentioned above (and some of the ones redacted) involved engineering the features manually. Example: Missing values or NULL values might mean the absence of a flag or feature in some attribute, while it might require extra tasks in others. So if we have a missing value for a feature flag, that might mean “False”, whereas a missing value in some buffer size feature might mean that we need subqueries to fetch and fill the missing data.
Runtime Memory, OOM Kill Data and ground truth labeling
Runtime data is always increasing and constantly evolving. The tables and views we use are refreshed every 24 hours and joining between any two such tables will lead to tremendous compute and time resources. In order to curate this part of the dataset, we suggest some tips given below (written from the point of view of SparkSQL-like distributed query processors):
- Filtering the entries (conditions) before JOIN, and for this purpose using WHERE and LEFT JOIN clauses carefully. Conditions that eliminate entries after the join operation are much more expensive than when elimination happens before the join. It also prevents the system running out of memory during execution of the query.
- Restricting Testing and Analysis to one day and device at a time. It is always good to pick a single high frequency day like New Years, or Memorial day, etc. to increase frequency counts and get normalized distributions across various features.
- Striking a balance between driver and executor memory configurations in SparkSQL-like systems. Too high allocations may fail and restrict system processes. Too low memory allocations may fail at the time of a local collect or when the driver tries to accumulate the results.
Labeling the data — Ground Truth
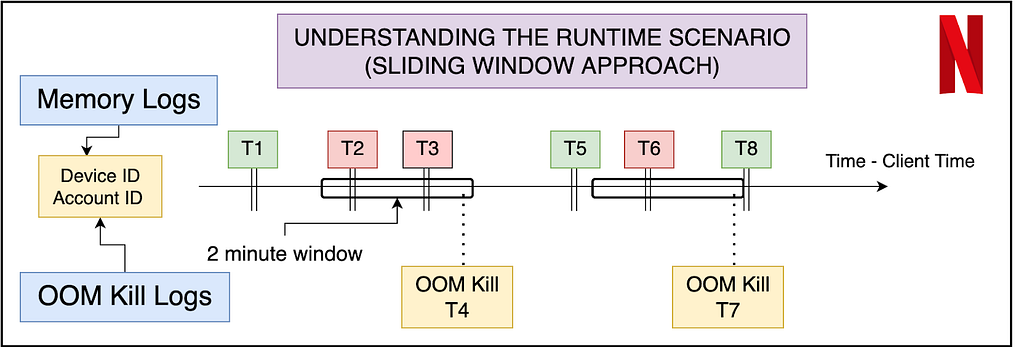
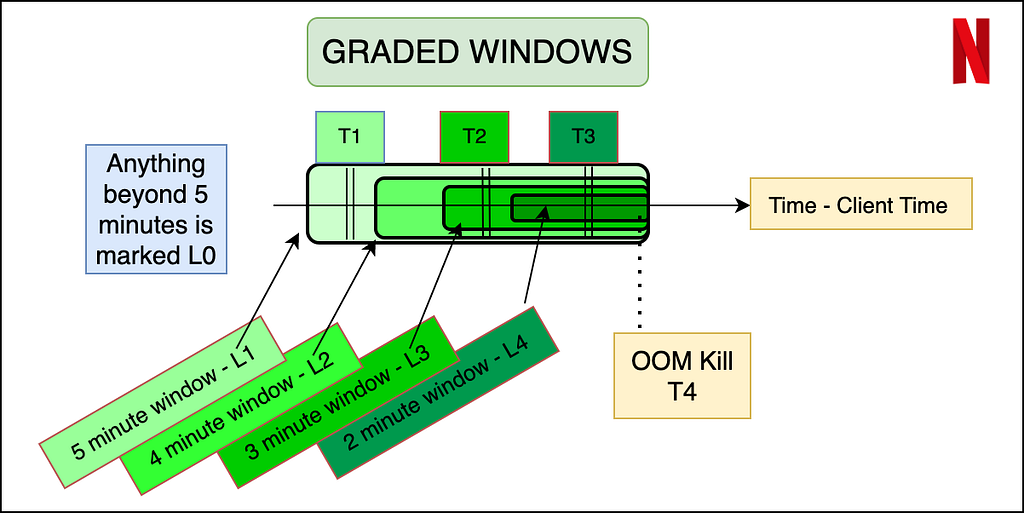
An important aspect of the dataset is to understand what features will be available to us at inference time. Thus memory data (that contains the navigational level and memory reading) can be labeled using the OOM kill data, but the latter cannot be reflected in the input features. The best way to do this is to use a sliding window approach where we label the memory readings of the sessions in a fixed window before the OOM kill as erroneous, and the rest of the entries as non-erroneous. In order to make the labeling more granular, and bring more variation in a binary classification model, we propose a graded window approach as explained by the image below. Basically, it assigns higher levels to memory readings closer to the OOM kill, making it a multi-class classification problem. Level 4 is the most near to the OOM kill (range of 2 minutes), whereas Level 0 is beyond 5 minutes of any OOM kill ahead of it. We note here that the device and session of the OOM kill instance and the memory reading needs to match for the sanity of the labeling. Later the confusion matrix and model’s results can later be reduced to binary if need be.
Summary of OOM Prediction — Problem Formulation
The dataset now consists of several entries — each of which has certain runtime features (navigational level and memory reading in our case) and device characteristics (a mix of over 15 features that may be numerical, boolean or categorical). The output variable is the graded or ungraded classification variable which is labeled in accordance with the section above — primarily based on the nearness of the memory reading stamp to the OOM kill. Now we can use any multi-class classification algorithm — ANNs, XGBoost, AdaBoost, ElasticNet with softmax etc. Thus we have successfully formulated the problem of OOM kill prediction for a device streaming Netflix.
Data Analysis and Observations
Without diving very deep into the actual devices and results of the classification, we now show some examples of how we could use the structured data for some preliminary analysis and make observations. We do so by just looking at the peak of OOM kills in a distribution over the memory readings within 5 minutes prior to the kill.

From the graph above, we show how even without doing any modeling, the structured data can give us immense knowledge about the memory domain. For example, the early peaks (marked in red) are mostly crashes not visible to users, but were marked erroneously as user-facing crashes. The peaks marked in green are real user-facing crashes. Device 2 is an example of a sharp peak towards the higher memory range, with a decline that is sharp and almost no entries after the peak ends. Hence, for Device 1 and 2, the task of OOM prediction is relatively easier, after which we can start taking pre-emptive action to lower our memory usage. In case of Device 3, we have a normalized gaussian like distribution — indicating that the OOM kills occur all over, with the decline not being very sharp, and the crashes happen all over in an approximately normalized fashion.
Feature Engineering, Accuracy Measures and Future Work Directions
We leave the reader with some ideas to engineer more features and accuracy measures specific to the memory usage context in a streaming environment for a device.
- We could manually engineer features on memory to utilize the time-series nature of the memory value when aggregated over a user’s session. Suggestions include a running mean of the last 3 values, or a difference of the current entry and running exponential average. The analysis of the growth of memory by the user could give insights into whether the kill was caused by in-app streaming demand, or due to external factors.
- Another feature could be the time spent in different navigational levels. Internally, the app caches several pre-fetched data, images, descriptions etc, and the time spent in the level could indicate whether or not those caches are cleared.
- When deciding on accuracy measures for the problem, it is important to analyze the distinction between false positives and false negatives. The dataset (fortunately for Netflix!) will be highly biased — as an example, over 99.1% entries are non-kill related. In general, false negatives (not predicting the kill when actually the app is killed) are more detrimental than false positives (predicting a kill even though the app could have survived). This is because since the kill happens rarely (0.9% in this example), even if we end up lowering memory and performance 2% of the time and catch almost all the 0.9% OOM kills, we will have eliminated approximately. all OOM kills with the tradeoff of lowering the performance/clearing the cache an extra 1.1% of the time (False Positives).
Summary
This post has focussed on throwing light on dataset curation and engineering when dealing with memory and low resource crashes for streaming services on device. We also cover the distinction between non-changing attributes and runtime attributes and strategies to join them to make one cohesive dataset for OOM kill prediction. We covered labeling strategies that involved graded window based approaches and explored some graphical analysis on the structured dataset. Finally, we ended with some future directions and possibilities for feature engineering and accuracy measurements in the memory context.
Stay tuned for further posts on memory management and the use of ML modeling to deal with systemic and low latency data collected at the device level. We will try to soon post results of our models on the dataset that we have created.
Acknowledgements
I would like to thank the members of various teams — Partner Engineering (Mihir Daftari, Akshay Garg), TVUI team (Andrew Eichacker, Jason Munning), Streaming Data Team, Big Data Platform Team, Device Ecosystem Team and Data Science Engineering Team (Chris Pham), for all their support.
![]()
Formulating ‘Out of Memory Kill’ Prediction on the Netflix App as a Machine Learning Problem was originally published in Netflix TechBlog on Medium, where people are continuing the conversation by highlighting and responding to this story.
Six new stable kernels
Post Syndicated from original https://lwn.net/Articles/902099/
The 5.15.56, 5.10.132, 5.4.207, 4.19.253, 4.14,289, and 4.9.324 stable kernels have been released.
The 5.18.13 stable kernel has been delayed due to some problems found during review; 5.18.13-rc3
is out for review and is due on July 23. Note that none of these
kernels has mitigations for the Retbleed
vulnerabilities; those are still in the works for the stable kernels.
How We Sent an AWS Snowcone into Orbit
Post Syndicated from Jeff Barr original https://aws.amazon.com/blogs/aws/how-we-sent-an-aws-snowcone-into-orbit/
I have been a fan of space travel and the US space program since I was 4 or 5 years old. I remember reading about the Mercury and Gemini programs, and watched with excitement as Lunar Module Eagle landed on the Moon.
Today, with the cost to reach Low Earth Orbit (LEO) seemingly declining with each launch, there are more opportunities than ever before to push the boundaries of what we know, conducting ever-more bold experiments and producing vast amounts of raw data. Making the situation even more interesting, today’s experiments can use more types of sensors, each collecting data with higher resolution and at a greater sampling frequency. Dealing with this vast amount of data is a huge challenge. Bandwidth on NASA’s constellation of Tracking and Data Relay Satellites (TDRS) is limited, and must be shared equitably across a growing number of missions. Latency, while almost negligible from LEO, becomes a consideration when sending data from the Moon, Mars, or from beyond the bounds of the Solar System.
When we start to think about sending hardware into space, another set of challenges come about. The hardware must be as light as possible in order to minimize the cost to launch it. It must, however, be durable enough to withstand extreme vibration and G-forces during launch, and able to function in a microgravity environment once in orbit. Once in orbit, the hardware must be able to safely connect to the host spacecraft’s power, cooling, and network systems.
AWS Snowcone on the International Space Station
 As you may have already read, we recently sent an AWS Snowcone SSD to the International Space Station. Since Amazon Prime does not currently make deliveries to the ISS, the Snowcone traveled aboard a Falcon 9 rocket as part of the first Axiom Space Mission (Ax-1). As part of this mission, four private astronauts ran experiments and conducted technology demos that spanned 17 days and 240 trips around Earth.
The Snowcone is designed to run edge computing workloads, all protected by multiple layers of encryption. After data has been collected and processed locally, the device is typically shipped back to AWS so that the processed data can be stored in the cloud and processed further. Alternatively, AWS DataSync can be used to copy data from a Snowcone device back to AWS.
On the hardware side, the Snowcone is small, exceptionally rugged, and lightweight. With 2 CPUs, 4 GB of memory, and 14 TB of SSD storage, it can do a lot of local processing and storage, making it ideal for the Ax-1 mission.
Preparing for the Journey
In preparation for the trip to space, teams from AWS, NASA, and Axiom Space worked together for seven months to test and validate the Snowcone. The validation process included a rigorous safety review, a detailed thermal analysis, and testing to help ensure that the device would survive vibration at launch and in flight to the ISS. The Snowcone was not modified, but it did end up wrapped in Kapton tape for additional electrical and thermal protection.
On the software side, the AWS Machine Learning Solutions Lab worked closely with Axiom to develop a sophisticated machine learning model that would examine photos taken aboard the ISS to help improve the crew experience in future Axiom missions. The photos were taken by on-board Nikon cameras, stored in Network Attached Storage (NAS) on the ISS, and then transferred from the NAS to the Snowcone over the Joint Station LAN. Once the photos are on the Snowcone, the model was was able to return results within three seconds.
On Board the ISS
After the Snowcone was up and running, the collective team did some initial testing and encountered a few issues. For example, the photos were stored on the NAS with upper-case extensions but the code on the Snowcone was looking for lower-case. Fortunately, the Earth-based team was able to connect to the device via SSH in order to do some remote diagnosis and reconfiguration.
An updated ML model became available during the mission. The team was able to upload a largish (30 GB) AMI to the Snowcone and put the model into production with ease.
The Snowcone remains aboard the ISS, and is available for other experiments through the end of 2022. If you are a researcher, student, or part of an organization that is interested in performing experiments that involve processing data remotely on the ISS, you can express your interest at [email protected]. One interesting use case should be of interest to medical researchers. Many of the medical measurements and experiments conducted on the ISS generate data that must currently be downloaded to Earth for processing and analysis. Taking care of these steps while in orbit could reduce the end-to-end time for downloading and analysis from 20 hours to just 20 minutes, creating the potential for a 60-fold increase in the number of possible experiments.
Success
Net-net, the experiment showed that it is possible to extend cloud computing to the final frontier.
The Earth-based team was able to communicate remotely with the orbiting Snowcone in order to launch, test, and update the model. They then demonstrated that they were able to repeat this process as needed, processing photos from onboard research experiments and making optimal use of the limited bandwidth that is available between space stations and Earth.
All-in-all, this experiment was deemed a success, and we learned a lot as we identified and addressed the challenges that arise when sending AWS hardware into space to serve the needs of our customers.
Check out AWS for Aerospace and Satellite to learn more about how we support our customers and our partners as they explore the final frontier. If you are ready to deploy a Snowcone on a space or an Earth-bound mission of your own, we are ready, willing, and able to work with you!
— Jeff;
Simplify analytics on Amazon Redshift using PIVOT and UNPIVOT
Post Syndicated from Ashish Agrawal original https://aws.amazon.com/blogs/big-data/simplify-analytics-on-amazon-redshift-using-pivot-and-unpivot/
Amazon Redshift is a fast, fully managed cloud data warehouse that makes it simple and cost-effective to analyze all your data using standard SQL and your existing business intelligence (BI) tools.
Many customers look to build their data warehouse on Amazon Redshift, and they have many requirements where they want to convert data from row level to column level and vice versa. Amazon Redshift now natively supports PIVOT and UNPIVOT SQL operators with built-in optimizations that you can use for data modeling, data analysis, and data presentation. You can apply PIVOT and UNPIVOT to tables, sub-queries, and common table expressions (CTEs). PIVOT supports the COUNT, SUM, MIN, MAX, and AVG aggregate functions.
You can use PIVOT tables as a statistics tool that summarizes and reorganizes selected columns and rows of data from a dataset. The following are a few scenarios where this can be useful:
- Group the values by at least one column
- Convert the unique values of a selected column into new column names
- Use in combination with aggregate functions to derive complex reports
- Filter specific values in rows and convert them into columns or vice versa
- Use these operators to generate a multidimensional reporting
In this post, we discuss the benefits of PIVOT and UNPIVOT, and how you can use them to simplify your analytics in Amazon Redshift.
PIVOT overview
The following code illustrates the PIVOT syntax:
The syntax contains the following parameters:
- <get_source_data> – The SELECT query that gets the data from the source table
- <alias_source_query> – The alias for the source query that gets the data
- <agg_func> – The aggregate function to apply
- <agg_col> – The column to aggregate
- <pivot_col> – The column whose value is pivoted
- <pivot_value_n> – A list of pivot column values separated by commas
- <alias_pivot> – The alias for the pivot table
- <optional ORDER BY clause> – An optional parameter to apply an ORDER BY clause on the result set
The following diagram illustrates how PIVOT works.
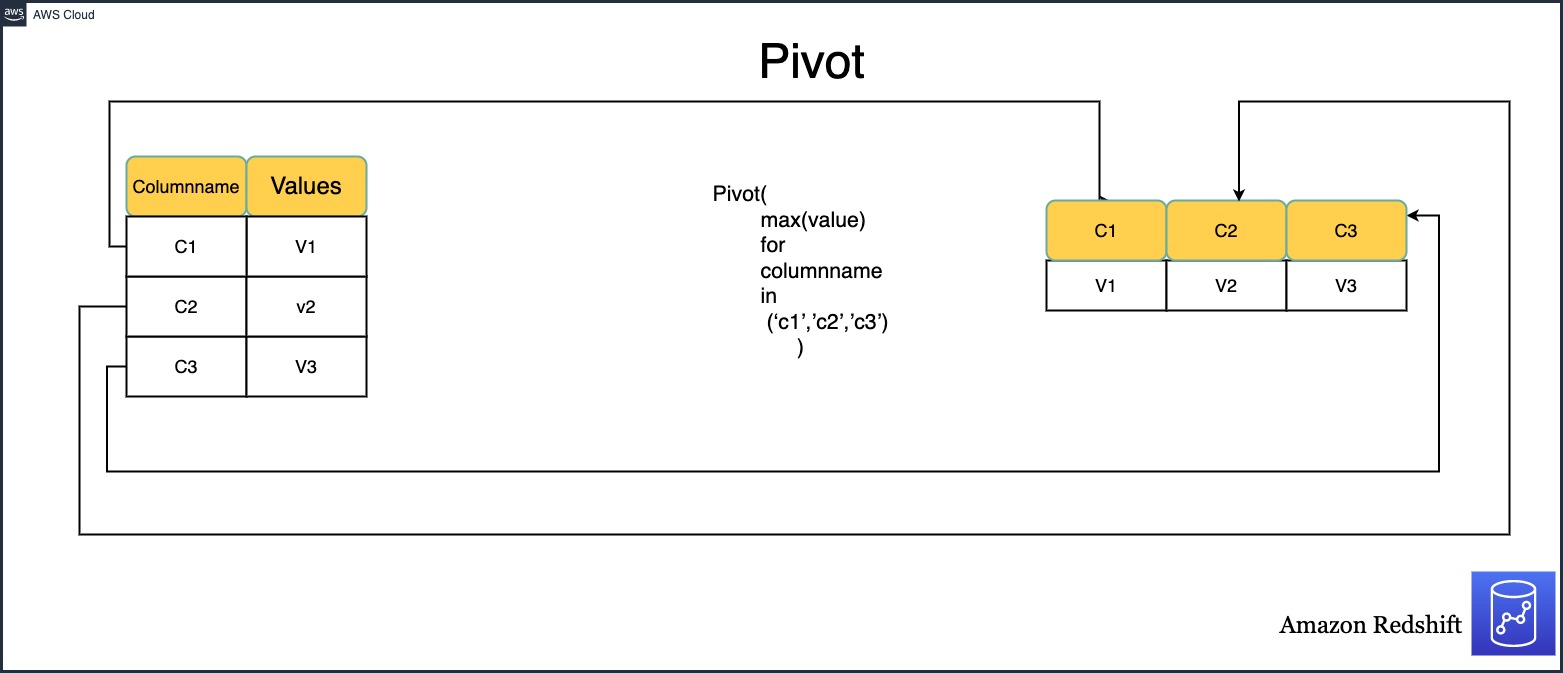
PIVOT instead of CASE statements
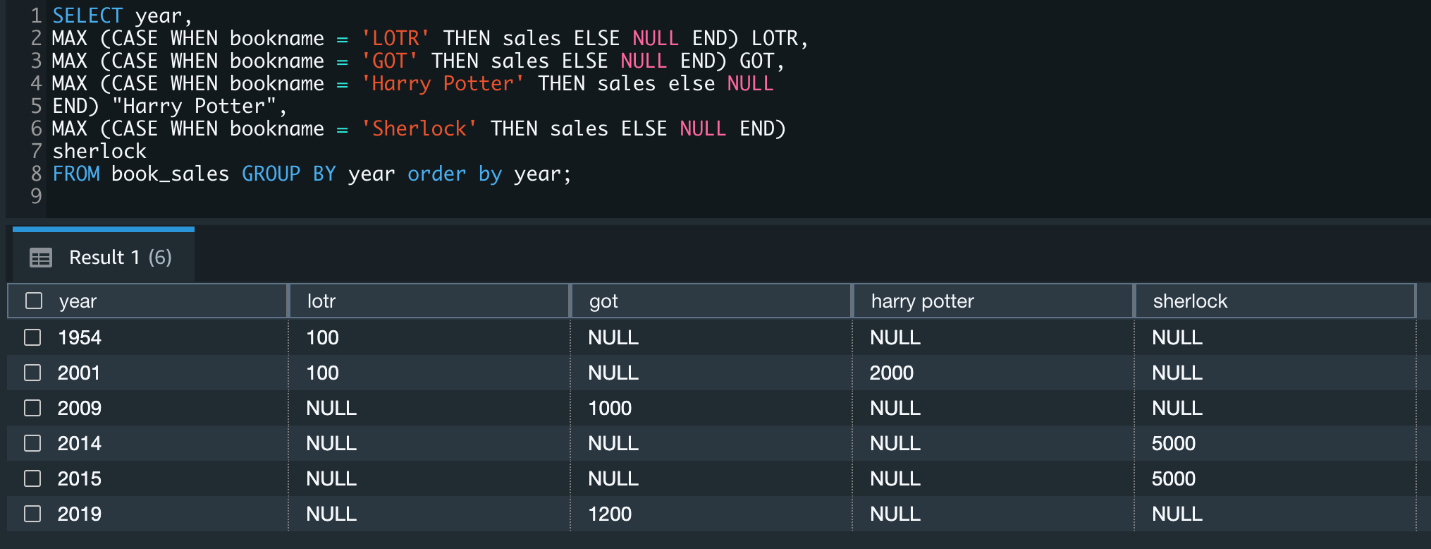
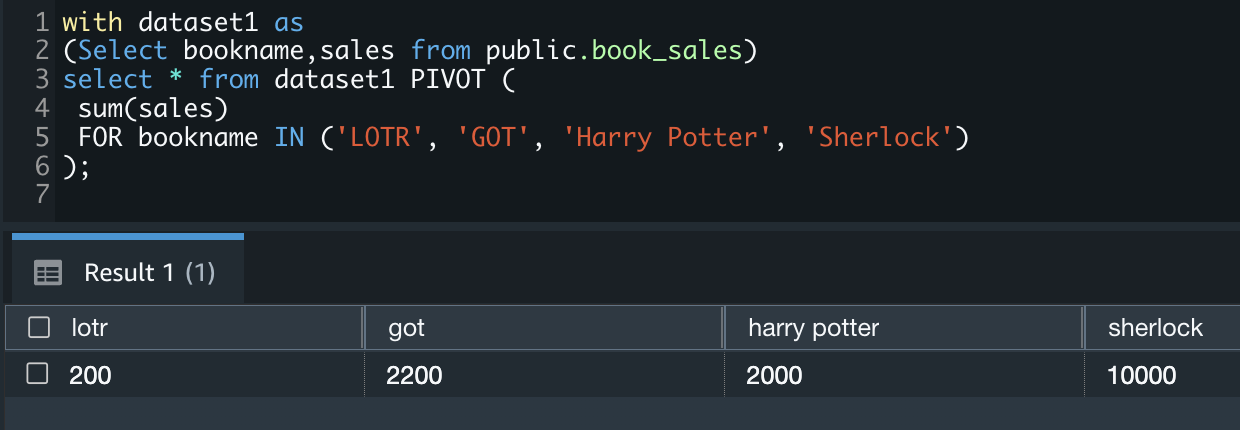
Let’s look at an example of analyzing data from a different perspective than how it’s stored in the table. In the following example, book sales data is stored by year for each book. We want to look at the book_sales dataset by year and analyze if there were any books sold or not, and if sold, how many books were sold for each title. The following screenshot shows our query.

The following screenshot shows our output.

Previously, you had to derive your desired results set using a CASE statement. This requires you to add an individual CASE statement with the column name for each title, as shown in the following code:
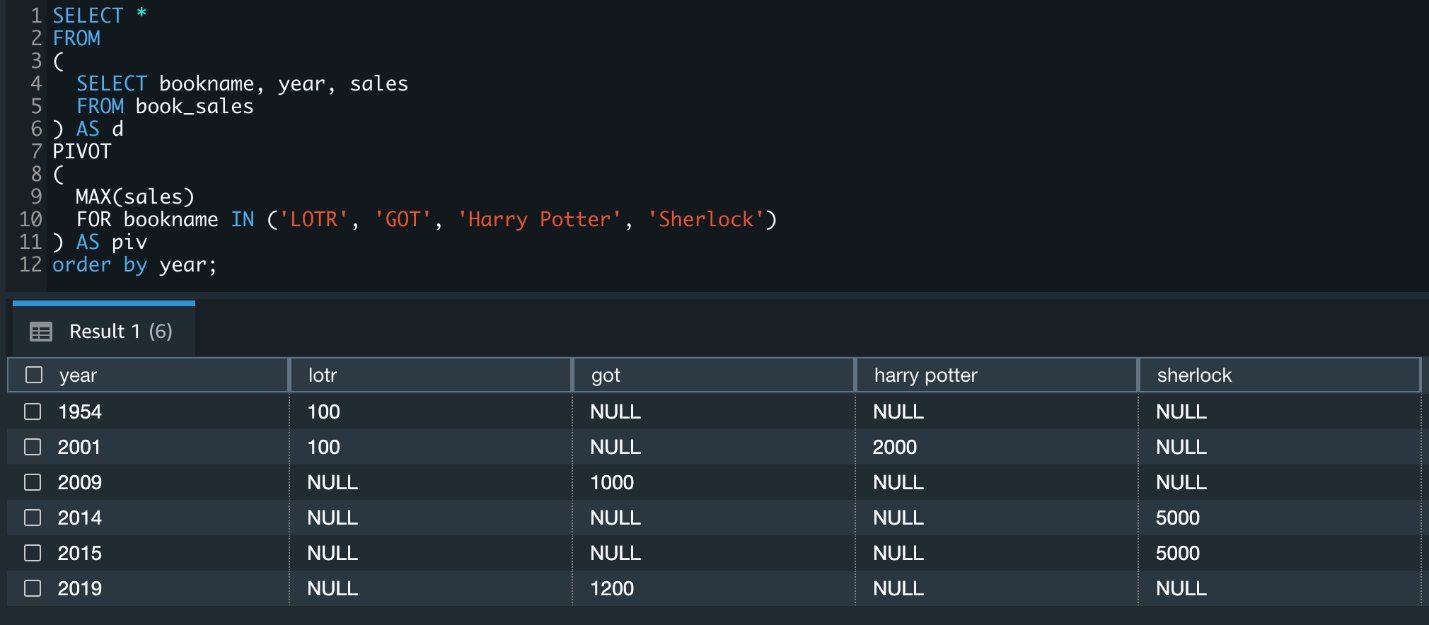
With the out-of-the-box PIVOT operator, you can use a simpler SQL statement to achieve the same results:
UNPIVOT overview
The following code illustrates the UNPIVOT syntax:
The code uses the following parameters:
- <get_source_data> – The SELECT query that gets the data from the source table.
- <alias_source_query> – The alias for the source query that gets the data.
- <optional INCLUDE NULLS> – An optional parameter to include NULL values in the result set. By default, NULLs in input columns aren’t inserted as result rows.
- <value_col> – The name assigned to the generated column that contains the row values from the column list.
- <name_col> – The name assigned to the generated column that contains the column names from the column list.
- <column_name_n> – The column names from the source table or subquery to populate
value_colandname_col. - <alias_unpivot> – The alias for the unpivot table.
- <optional ORDER BY clause> – An optional parameter to apply an ORDER BY clause on the result set.
The following diagram illustrates how UNPIVOT works.

UNPIVOT instead of UNION ALL queries
Let’s look at the following example query with book_sales_pivot.

We get the following output.

Previously, you had to derive this result set using UNION ALL, which resulted in a long and complex query form, as shown in the following code:

With UNPIVOT, you can use the following simplified query:

UNPIVOT is straightforward compared to UNION ALL. You can further clean this output by excluding NULL values from the result set. For example, you can exclude book titles from the result set if there were no sales in a year:

By default, NULL values in the input column are skipped and don’t yield a result row.
Now that we understand the basic interface and usability, let’s dive into a few complex use cases.
Dynamic PIVOT tables using stored procedures
The query of PIVOT is static, meaning that you have to enter a list of PIVOT column names manually. In some scenarios, you may not want to manually use your PIVOT values because your data keeps changing, and it gets difficult to maintain the list of values and update the PIVOT query manually.
To handle these scenarios, you can take advantage of the dynamic PIVOT stored procedure:
PIVOT example using CTEs
You can use PIVOT as part of a CTE (Common Table Expression). See the following example code:
Multiple aggregations for PIVOT
The following code illustrates multiple aggregations for PIVOT:

Summary
Although PIVOT and UNPIVOT aren’t entirely new paradigms of SQL language, the new native support for these operators in Amazon Redshift can help you achieve many robust use cases without the hassle of using alternate operators. In this post, we explored a few ways in which the new operators may come in handy.
Adapt PIVOT and UNPIVOT into your workstreams now and work with us as we evolve the feature, incorporating more complex option sets. Please feel free to reach out to us if you need further help to achieve your custom use cases.
About the authors
 Ashish Agrawal is currently Sr. Technical Product Manager with Amazon Redshift building cloud-based data warehouse and analytics cloud service. Ashish has over 24 years of experience in IT. Ashish has expertise in data warehouse, data lake, Platform as a Service. Ashish is speaker at worldwide technical conferences.
 Sai Teja Boddapati is a Database Engineer based out of Seattle. He works on solving complex database problems to contribute to building the most user friendly data warehouse available. In his spare time, he loves travelling, playing games and watching movies & documentaries.
 Maneesh Sharma is a Senior Database Engineer at AWS with more than a decade of experience designing and implementing large-scale data warehouse and analytics solutions. He collaborates with various Amazon Redshift Partners and customers to drive better integration.
 Eesha Kumar is an Analytics Solutions Architect with AWS. He works with customers to realize business value of data by helping them building solutions leveraging AWS platform and tools.
Fujifilm X-H2S Review… It’s Smoking hot! 🔥🔥
Post Syndicated from Matt Granger original https://www.youtube.com/watch?v=HHRanernGpM
[$] Living with the Rust trademark
Post Syndicated from original https://lwn.net/Articles/901816/
The intersection of free software and trademark law has not always been
smooth. Free-software licenses have little to say about trademarks but,
sometimes, trademark licenses can appear to take away some of the freedoms
that free-software licenses grant. The Firefox browser has often been the focal point for trademark-related
controversy; happily, those problems appear to be in the past now. Instead,
the increasing popularity of the Rust
language is drawing attention to its trademark policies.
4 key statistics to build a business case for an MDR partner
Post Syndicated from Jake Godgart original https://blog.rapid7.com/2022/07/21/4-key-statistics-to-build-a-business-case-for-an-mdr-partner/

From one person to the next, the word “impact” may have wildly different connotations. Is the word being used in a positive or negative sense? For an understaffed security organization attempting to fend off attacks and plug vulnerabilities, the impact of all of that work is most likely negative: more work, less success to show for it, and more stress to take home.
That’s why Rapid7 commissioned Forrester Consulting to conduct a June 2022 Total Economic Impact™ (TEI) study to learn how our real MDR customers are seeing tangible impacts to their bottom line by partnering with Rapid7.
The study found that Rapid7’s SOC expertise – with XDR technology that generated improved visibility – enabled a composite organization using Rapid7 Managed Detection and Response (MDR) to:
- Quickly extend its coverage with skilled headcount
- Put formal processes in place for cyberattack detection and response
The analysis was conducted using a hypothetical composite organization created for the purposes of the study, with insights gleaned from four real-life MDR customers. This composite reflects a profile we see often: a small team of two security analysts tasked with protecting 1,800 employees and 2,100 assets.
The study concluded that partnering with Rapid7 MDR services experts enabled the composite organization to achieve end-to-end coverage and cut down on detection and response times. Impact like that can open the door to true progress.
Any MDR financial justification like this will come down to four main factors: return on investment (ROI), savings from building out your SOC team, the reduction in risk to your organization, and the time to see value/impact. Let’s break down these four key statistics from the study in more detail.
1. ROI
In the Forrester study, the composite organization – once partnered with Rapid7 – saw productivity gains accelerate efficiencies across alert investigation, response actions, and report creation. They were also protected with 24/7 eyes-on-glass and expert security support. Savings from security-team productivity gains totaled over $930,000 and Rapid7 MDR services in total delivered an ROI of 549% for the composite organization over the course of the three-year analysis. That kind of money can be reinvested to strengthen other parts of a security program and act as a profit driver for the business.
This greater overall visibility is powered by XDR capabilities that can customize protection to assess and block specific threats. Continuously analyzing activity in this way enables more targeted and prioritized containment actions that lead to better curation.
2. Hiring savings
In any sort of managerial capacity, the word “headcount” can have an exhausting connotation. Having to hire a skilled professional, onboard that person to the point they’re contributing in a meaningful way, and then do it all again to fill out perhaps multiple vacancies in pursuit of a productive SOC team – it’s a lot. And it sucks up time and valuable resources, which is perhaps the biggest advantage attackers have over a security organization in need.
Partnering with Rapid7 MDR afforded the composite organization:
- Time savings for existing security team members
- Avoided headcount and onboarding for potential new team members
- Security-breach cost avoidance by extending the team with a dedicated MDR services provider
This led to total quantified benefits with a present value of $4.03 million over three years.
3. Potential benefit
The above stat is great, but you may be asking what sort of start-up costs did the composite organization incur? According to the Forrester study, for the composite organization, partnering with Rapid7 MDR meant spending around $620,000 over the course of three years. Digging into that number a bit more, the organization spread the investment into smaller yearly increments.
Compared to the costs of hiring multiple full-time employees (FTEs) who can do exactly what one needs them to do (and hopefully more), $620,000 quickly begins to look more attractive than what one might pay those FTEs over, say, five years. For a deeper dive into the actual purchasing process of MDR services, check out this handy MDR buyer’s guide.
4. Payback period
For the total three-year investment of just over $620,000, the composite organization experienced payback in less than three months! At the time of the investment in Rapid7 MDR, the composite organization had key objectives like improved visibility across the entire security environment, a complete security solution backed by the right expertise, and 24/7/365 coverage.
The chief information security officer at a healthcare firm said it took two members of their security team, each working four hours a day over the course of two weeks, to complete implementation. In some instances, Rapid7 MDR was able to detect and respond to incidents the first day the service was live.
A complete economic picture
When it comes to under-resourced teams, the economics boil down to a simple comparison: The costs for an MDR provider like Rapid7 versus a potential multiyear attempt to stretch an already-overloaded staff to investigate every alert and mitigate every threat.
Impact aside, a year of MDR service can often equate to the cost of one or two open headcounts. At that point, the economic benefits are the cherry on top. After all, it’s always easier (and more impactful) to instantly extend your team with expert headcount, saving time and resources in onboarding and bringing in experts ready to make an impact from day one. Bundle it all together and you’re building a business case for the potential to bring your organization greater expertise, significant cost avoidance, and positive ROI.
At the end of the day, Rapid7 MDR can give existing security specialists some much-needed breathing room while helping the business into a better overall competitive position. Put another way: More coverage. More money. More time. Less stress.
You can read the entire Forrester Consulting TEI study to get the deep-dive from interviewed customers – along with the numbers and stories they shared – on Rapid7 MDR.
Deploying a SOAR Tool Doesn’t Have to Be Hard: I’ve Done It Twice
Post Syndicated from Ryan Fried original https://blog.rapid7.com/2022/07/21/deploying-a-soar-tool-doesnt-have-to-be-hard-ive-done-it-twice/

As the senior information security engineer at Brooks, an international running shoe and apparel company, I can appreciate the challenge of launching a security orchestration, automation, and response (SOAR) tool for the first time. I’ve done it at two different companies, so I’ll share some lessons learned and examples of how we got over some speed bumps and past friction points. I’ll also describe the key steps that helped us create a solid SOAR program.
At Brooks we selected Rapid7’s InsightConnect (ICON) as our security automation tool after a thorough product review. I was familiar with ICON because I had used it at a previous company. There are other SOAR tools out there, but InsightConnect is my preferred option based on my experience, its integrations, support, and Rapid7’s track record of innovation in SOAR. InsightConnect is embedded in everything we do now. We use it to slash analyst time spent on manual, repetitive tasks and to streamline our incident response and vulnerability management processes.
When you’re starting out with SOAR, there are two important things you need to put in place.
- One is getting buy-in from your active directory (AD) team on the automation process and the role they need to play. At Brooks, we have yearly goals that are broken down into quarters, so getting it on their quarterly goals as part of our overall SOAR goal was really important. This also applies to other areas of the IT and security organizations
- The second is getting all the integrations set up within the first 30 to 60 days. It’s critical because your automation tool is only as good as the integrations you have deployed. Maybe 50% to 60% of them fall under IT security, but the other 30% or 40% are still pretty important, given how dependent security teams are on other organizations and their systems. So, getting buy-in from the teams that own those systems and setting up all the integrations are key.
Start with collaboration and build trust
A successful SOAR program requires trust and collaboration with your internal partners – essentially, engineering and operations and the team that sets up your active directory domain – because they help set up the integrations that the security automations depend on. You need to develop that trust because IT teams often hesitate when it comes to automation.
In conversations with these teams, let them know you won’t be completely automating things like blocking websites or deleting users. In addition, stress that almost everything being done will require human interaction and oversight. We’re just enriching and accelerating the many of the processes we already have in place. Therefore, it will free up their time in addition to ours because it’s accomplishing things that they do for us already. And remember we have the ability to see if something happened that may have been caused by the SOAR tool, so it’s automation combined with human decision-making.
For example, say something starts not working. The team asks you: “Hey, what’s changed?” With ICON up and running, you can search within seconds to see, for example, what firewall changes have happened within the last 24 hours. What logins have occurred? Are there any user account lockouts? I can search that in seconds. Before, it used to take me 15 to 30 minutes to get back to them with a response. Not any more. That’s what I call fast troubleshooting.
Meet with your security analysts and explain the workflows
Right from the beginning, it’s important to meet with your security analysts and explain the initial workflows you’ve created. Then, get them thinking about the top five alerts that happen most often and consume a lot of their time, and what information they need from those alerts. For instance, with two-factor authentication logs, the questions might be, “What’s the device name? Who’s the user’s manager? What’s their location?” Then, you can work in the SOAR tool to get that information for them. This will help them see the benefit firsthand.
This approach helps with analyst retention because the automation becomes the platform glue for all of your other tools. It also reduces the time your analysts have to spend on repetitive drudge work. Now, they’re able to give more confident answers if something shows up in the environment, and they can focus on more creative work.
Dedicate a resource to SOAR
I believe it’s important to have one person dedicated to the SOAR project at least half-time for the first six months. This is where teams can come up short. When the staff and time commitment is there, the process quickly expands beyond simple tasks. Then you’re thinking, “What else can I automate? What additional workflows can I pick up from the Rapid7 workflow marketplace and customize for our own use?”
Take advantage of the Rapid7 Extensions Library
The good news is you don’t need to build workflows (playbooks) from scratch. The Rapid7 Extensions Library contains hundreds of workflows which you can use as a core foundation for your needs. Then you can tweak the last 15% to 20% to make the workflow fit even better. These pre-built workflows get you off the ground running. Think of them not as ready-to-go tools, but more as workflow ideas and curated best practices. The first time I used InsightConnect, I used the phishing workflow and started seeing value in less than two weeks.
Implementing a security automation tool within a company’s network environment can be a challenge if you don’t come at it the right way. I know because I’ve been there. But Rapid7’s InsightConnect makes it easier by enabling almost anything you can imagine. With a SOAR solution, your analysts will spend less time on drudge work and more time optimizing your security environment. These are real benefits I’ve seen firsthand at Brooks. You can have them as well by following this simple approach. Best of luck.
Additional reading: