Post Syndicated from The History Guy: History Deserves to Be Remembered original https://www.youtube.com/watch?v=6oX4zVpWhXA
How Attorneys Are Harming Cybersecurity Incident Response
Post Syndicated from Bruce Schneier original https://www.schneier.com/blog/archives/2023/06/how-attorneys-are-harming-cybersecurity-incident-response.html
New paper: “Lessons Lost: Incident Response in the Age of Cyber Insurance and Breach Attorneys“:
Abstract: Incident Response (IR) allows victim firms to detect, contain, and recover from security incidents. It should also help the wider community avoid similar attacks in the future. In pursuit of these goals, technical practitioners are increasingly influenced by stakeholders like cyber insurers and lawyers. This paper explores these impacts via a multi-stage, mixed methods research design that involved 69 expert interviews, data on commercial relationships, and an online validation workshop. The first stage of our study established 11 stylized facts that describe how cyber insurance sends work to a small numbers of IR firms, drives down the fee paid, and appoints lawyers to direct technical investigators. The second stage showed that lawyers when directing incident response often: introduce legalistic contractual and communication steps that slow-down incident response; advise IR practitioners not to write down remediation steps or to produce formal reports; and restrict access to any documents produced.
So, we’re not able to learn from these breaches because the attorneys are limiting what information becomes public. This is where we think about shielding companies from liability in exchange for making breach data public. It’s the sort of thing we do for airplane disasters.
EDITED TO ADD (6/13): A podcast interview with two of the authors.
Security updates for Wednesday
Post Syndicated from original https://lwn.net/Articles/934132/
Security updates have been issued by Debian (c-ares), Fedora (curl and firefox), Oracle (cups-filters, kernel, and webkit2gtk3), Red Hat (emacs and kpatch-patch), Slackware (mozilla), SUSE (kernel and openssl-1_0_0), and Ubuntu (firefox and libreoffice).
Не пълно щастие, а редовно правителство
Post Syndicated from Светла Енчева original https://www.toest.bg/ne-pulno-shtastie-a-redovno-pravitelstvo/

Щастието е силно надценено, смята приятел на авторката на настоящата статия. Вероятно не всички са съгласни, че този възглед важи за личния живот, но няма спор, че той е валиден за политиката. Повод за тези екзистенциални размисли е фактът, че България има редовно правителство – за първи път от близо година (кабинетът на Кирил Петков приключи краткото си съществуване през август 2022 г.). Това е второто редовно правителство за последните две години, като за този период служебните кабинети са общо четири.
Кой не е щастлив?
Трудно можем да се сетим за някой, който да е щастлив от новия кабинет на Николай Денков и Мария Габриел, но без затруднение можем да изброим мнозина, които не са. Не е щастлив президентът Румен Радев, защото България вече няма да е президентска република, в каквато де факто се беше превърнала, и той няма да може повече да прокарва интересите си безконтролно. Заедно с него не са щастливи и във „Възраждане“ и БСП, защото поредните избори се отлагат, а пред сближаването на България с Русия възникват сериозни препятствия.
Не са щастливи в ДПС, защото новото правителство разполага с мнозинство и без тях. И в ИТН, защото взривяването на парламентарната демокрация се отлага. Не е щастлив и независимият депутат Радостин Василев, защото след записа от закритото заседание на ПП, който той направи и изнесе, правителство все пак ще има, а на него все пак прокуратурата му повдигна обвинение (не за незаконния запис, а за изнудване на депутатка от ИТН).
Ала също така не са щастливи и политическите сили, които стоят зад новия кабинет. Няма как да са щастливи в ГЕРБ, защото те спечелиха изборите, а правителството става възможно с втория мандат. Мария Габриел ще трябва да стиска зъби и да чака девет месеца, докато ѝ дойде редът да оглави правителството, ако то изобщо оцелее дотогава. В ПП също не горят от щастие, защото в името на редовното правителство се съюзяват с доскорошния си най-голям враг. Да не говорим за ДБ, които играят доста второстепенна роля в сложната конструкция.
Избирателите на ГЕРБ и ПП–ДБ имат основания да се чувстват огорчени. Първите – защото партията, на която симпатизират, се съюзява с онези, които изгряха политически с амбицията да ѝ видят сметката и арестуваха председателя ѝ. Вторите – защото борбата с корупцията и за съдебна реформа досега е била срещу ГЕРБ и срещу определени личности, символизиращи завладяната държава – и то не толкова Гешев, колкото Борисов и Пеевски.
Политиката като променяне на света
Целта на огласяването на записа от закритото заседание на ПП беше да нанесе щети; и то действително нанесе. Не би и могло да е иначе – когато един разговор не е публичен, в него е естествено да има неща, които не са за пред публика. И такива, които не са изговорени с цел да се харесат на аудиторията. А когато определени фрази умишлено са извадени извън собствения си контекст и поставени в друг, щетите стават още по-големи.
В същото време обаче записът в своята цялост се оказа и полезен, защото от него става ясно как ръководството на ПП вижда смисъла от участието на партията в политическия живот на страната. На първо място, виждаме рядко срещана саморефлексивност. Съпредседателите на партията си дават сметка за реалната ѝ електорална тежест, както и за собствените неотдавнашни илюзии. „Ние се чувствахме, че сме някакви гении, а то цялата [държавна, б.а.] машина е работила за нас“, казва Кирил Петков по повод победата на ПП на изборите през ноември 2021 г.
Осъзнаването на реалната ситуация е свързано и с отчитане на рисковете за маргинализирането на ПП, ако състави правителство с ГЕРБ, без още да е успяла да изгради стабилни структури по места. Според Петков политическото дълголетие не бива да е самоцел, а трябва „нещо да направим с това дълголетие. Не виждам за себе си смисъл да стоим живи, без да имаме възможност да променяме света“.
Такова разбиране за политика е комай безпрецедентно в България. Досега сме свикнали целта на властта да е концентрация на още повече власт и лично обогатяване. Пък Петков дори не възприема като нещо фатално, ако в резултат на опитите си да постигне промяна, партията престане да съществува:
Аз […] наистина се кефя на позицията, че ние сме спасителите на България – сега и завинаги. Но истината е, че най-вероятно не е така. Истината е, че вълната сигурно ще дойде след 4–5 години. Аз лично мисля, че една от големите ни победи […] е, че показахме, че има и някакъв друг модел […]. Давам си сметка колко е важна и съдбовна нашата роля в момента, но не мисля, че след нас е само потоп. Мисля си, че има и други таланти. […] Ние си знаем кои сме, но не сме единствените.
За боба, лещата и пържолите в политиката
На записа от заседанието се чува и Христо Петров (Ицо Хазарта), който резюмира ситуацията, пред която е изправена ПП:
Вариантът, който обсъждаме в момента, […] при всички тия рискове има шансове да успее. […] Останалите варианти, които имаме, сме 100% сигурни, че няма да успеят. Тоест ние сме в положението […] на хората, които са в ресторанта, в който има боб и леща, и ние часове наред се молим и обсъждаме как да си поръчаме пържола. Няма да има пържола в ресторанта.
Разбира се, щеше да е по-добре ПП и ДБ да могат хем да останат принципни докрай, хем да управляват, радвайки се на комфортно мнозинство. Но вотът на българските избиратели прави този вариант невъзможен – резултатът от нашия избор е боб и леща, а не пържола. Отиването към нови избори допълнително би засилило позициите и на „Възраждане“, и на президента, а това би означавало още по-голямо отдалечаване от ЕС и още по-силно сближаване с Русия.
Според прогнозата на Асен Василев „проруските сили ще вземат превес в следващите 18 до 24 месеца, за първи път от 1996 г. Въпросът е дали те ще ги вземат, след като сме в еврозона и Шенген, тоест количеството щети, които могат да нанесат, са по-малки или повече.“ Влизането в еврозоната и в Шенгенското пространство е не само цел за ПП и ДБ, а и залог за това дали европейските партньори на ГЕРБ ще продължават да подкрепят партията на Борисов, залог е и за имиджа на доскорошната еврокомисарка Мария Габриел. Затова може да се очаква, че ГЕРБ ще играе проевропейски, въпреки че до неотдавна Борисов прокарваше интересите на Путин.
Вярно е, че преди три години протестите бяха против ГЕРБ и с подкрепата на президента, а днес ситуацията се е обърнала. Това обаче не означава безпринципност, а напротив – и в двата случая протестите са срещу безконтролната власт, чиято и да е тя. Може би затова и избирателите гласуват за „боб и леща“ вместо за „пържоли“. Да си припомним правителството на ОДС, което през 1997 г. спечели с внушително мнозинство и бързо се научи да злоупотребява с абсолютната си власт.
Че се задават сериозни и дълбоки промени, се вижда от процесите на разпад, които вървят в задкулисието. Висшият съдебен съвет изведнъж съзря нередности в действията на главния прокурор; разкол вътре в самата прокуратура; активират се дела, стоящи „на трупчета“ от години; хвърчат депутатски имунитети; представители на подземния свят свидетелстват едни срещу други и срещу ръководители на прокуратурата; смърт на две издирвани лица за две седмици; мейнстрийм медиите започват да отразяват теми, които доскоро са били практически табу (от 2020 г. до неотдавна например bTV споменава „Осемте джуджета“ в общо четири материала, а само от 28 май до 4 юни 2023 г. – в девет).
Ясно е, че ротационното правителство на ПП–ДБ и ГЕРБ е крехка конструкция, плод на тежки компромиси. Такъв беше и предишният редовен кабинет между ПП, ДБ, БСП и ИТН. За втори път ПП успяват да сформират в рамките на мандата си кабинет при почти невъзможна ситуация. От друга страна, има и нещо положително в обстоятелството, че партиите в ротационното правителство си нямат доверие – това е своеобразна мярка срещу ояждането във властта. Затова и не е толкова лошо, че избирателите не са щастливи от постигнатия компромис и са свръхкритични. Това се нарича граждански контрол.
Comic for 2023.06.07 – Job Market
Post Syndicated from Explosm.net original https://explosm.net/comics/job-market
New Cyanide and Happiness Comic
UFO Evidence
Post Syndicated from original https://xkcd.com/2786/

Introducing Amazon EMR on EKS job submission with Spark Operator and spark-submit
Post Syndicated from Lotfi Mouhib original https://aws.amazon.com/blogs/big-data/introducing-amazon-emr-on-eks-job-submission-with-spark-operator-and-spark-submit/
Amazon EMR on EKS provides a deployment option for Amazon EMR that allows organizations to run open-source big data frameworks on Amazon Elastic Kubernetes Service (Amazon EKS). With EMR on EKS, Spark applications run on the Amazon EMR runtime for Apache Spark. This performance-optimized runtime offered by Amazon EMR makes your Spark jobs run fast and cost-effectively. The EMR runtime provides up to 5.37 times better performance and 76.8% cost savings, when compared to using open-source Apache Spark on Amazon EKS.
Building on the success of Amazon EMR on EKS, customers have been running and managing jobs using the emr-containers API, creating EMR virtual clusters, and submitting jobs to the EKS cluster, either through the AWS Command Line Interface (AWS CLI) or Apache Airflow scheduler. However, other customers running Spark applications have chosen Spark Operator or native spark-submit to define and run Apache Spark jobs on Amazon EKS, but without taking advantage of the performance gains from running Spark on the optimized EMR runtime. In response to this need, starting from EMR 6.10, we have introduced a new feature that lets you use the optimized EMR runtime while submitting and managing Spark jobs through either Spark Operator or spark-submit. This means that anyone running Spark workloads on EKS can take advantage of EMR’s optimized runtime.
In this post, we walk through the process of setting up and running Spark jobs using both Spark Operator and spark-submit, integrated with the EMR runtime feature. We provide step-by-step instructions to assist you in setting up the infrastructure and submitting a job with both methods. Additionally, you can use the Data on EKS blueprint to deploy the entire infrastructure using Terraform templates.
Infrastructure overview
In this post, we walk through the process of deploying a comprehensive solution using eksctl, Helm, and AWS CLI. Our deployment includes the following resources:
- A VPC, EKS cluster, and managed node group, set up with the
eksctltool - Essential Amazon EKS managed add-ons, such as the VPC CNI, CoreDNS, and KubeProxy set up with the
eksctltool - Cluster Autoscaler and Spark Operator add-ons, set up using Helm
- A Spark job execution AWS Identity and Access Management (IAM) role, IAM policy for Amazon Simple Storage Service (Amazon S3) bucket access, service account, and role-based access control, set up using the AWS CLI and
eksctl
Prerequisites
Verify that the following prerequisites are installed on your machine:
- The AWS CLI, in order to interact with AWS services. For instructions, refer to Installing or updating the latest version of the AWS CLI.
- kubectl, which allows you to run commands against Kubernetes clusters.
- eksctl, a simple CLI tool for creating EKS clusters.
- Helm 3.7+, the package manager for Kubernetes.
Set up AWS credentials
Before proceeding to the next step and running the eksctl command, you need to set up your local AWS credentials profile. For instructions, refer to Configuration and credential file settings.
Deploy the VPC, EKS cluster, and managed add-ons
The following configuration uses us-west-1 as the default Region. To run in a different Region, update the region and availabilityZones fields accordingly. Also, verify that the same Region is used in the subsequent steps throughout the post.
Enter the following code snippet into the terminal where your AWS credentials are set up. Make sure to update the publicAccessCIDRs field with your IP before you run the command below. This will create a file named eks-cluster.yaml:
Use the following command to create the EKS cluster : eksctl create cluster -f eks-cluster.yaml
Deploy Cluster Autoscaler
Cluster Autoscaler is crucial for automatically adjusting the size of your Kubernetes cluster based on the current resource demands, optimizing resource utilization and cost. Create an autoscaler-helm-values.yaml file and install the Cluster Autoscaler using Helm:
You can also set up Karpenter as a cluster autoscaler to automatically launch the right compute resources to handle your EKS cluster’s applications. You can follow this blog on how to setup and configure Karpenter.
Deploy Spark Operator
Spark Operator is an open-source Kubernetes operator specifically designed to manage and monitor Spark applications running on Kubernetes. It streamlines the process of deploying and managing Spark jobs, by providing a Kubernetes custom resource to define, configure and run Spark applications, as well as manage the job life cycle through Kubernetes API. Some customers prefer using Spark Operator to manage Spark jobs because it enables them to manage Spark applications just like other Kubernetes resources.
Currently, customers are building their open-source Spark images and using S3a committers as part of job submissions with Spark Operator or spark-submit. However, with the new job submission option, you can now benefit from the EMR runtime in conjunction with EMRFS. Starting with Amazon EMR 6.10 and for each upcoming version of the EMR runtime, we will release the Spark Operator and its Helm chart to use the EMR runtime.
In this section, we show you how to deploy a Spark Operator Helm chart from an Amazon Elastic Container Registry (Amazon ECR) repository and submit jobs using EMR runtime images, benefiting from the performance enhancements provided by the EMR runtime.
Install Spark Operator with Helm from Amazon ECR
The Spark Operator Helm chart is stored in an ECR repository. To install the Spark Operator, you first need to authenticate your Helm client with the ECR repository. The charts are stored under the following path: ECR_URI/spark-operator.
Authenticate your Helm client and install the Spark Operator:
You can authenticate to other EMR on EKS supported Regions by obtaining the AWS account ID for the corresponding Region. For more information, refer to how to select a base image URI.
Install Spark Operator
You can now install Spark Operator using the following command:
To verify that the operator has been installed correctly, run the following command:
Set up the Spark job execution role and service account
In this step, we create a Spark job execution IAM role and a service account, which will be used in Spark Operator and spark-submit job submission examples.
First, we create an IAM policy that will be used by the IAM Roles for Service Accounts (IRSA). This policy enables the driver and executor pods to access the AWS services specified in the policy. Complete the following steps:
- As a prerequisite, either create an S3 bucket (
aws s3api create-bucket --bucket <ENTER-S3-BUCKET> --create-bucket-configuration LocationConstraint=us-west-1 --region us-west-1) or use an existing S3 bucket. Replace <ENTER-S3-BUCKET> in the following code with the bucket name. - Create a policy file that allows read and write access to an S3 bucket:
- Create the IAM policy with the following command:
- Next, create the service account named
emr-job-execution-sa-roleas well as the IAM roles. The followingeksctlcommand creates a service account scoped to the namespace and service account defined to be used by the executor and driver. Make sure to replace <ENTER_YOUR_ACCOUNT_ID> with your account ID before running the command: - Create an S3 bucket policy to allow only the execution role create in step 4 to write and read from the S3 bucket create in step 1. Make sure to replace <ENTER_YOUR_ACCOUNT_ID> with your account ID before running the command:
- Create a Kubernetes role and role binding required for the service account used in the Spark job run:
- Apply the Kubernetes role and role binding definition with the following command:
So far, we have completed the infrastructure setup, including the Spark job execution roles. In the following steps, we run sample Spark jobs using both Spark Operator and spark-submit with the EMR runtime.
Configure the Spark Operator job with the EMR runtime
In this section, we present a sample Spark job that reads data from public datasets stored in S3 buckets, processes them, and writes the results to your own S3 bucket. Make sure that you update the S3 bucket in the following configuration by replacing <ENTER_S3_BUCKET> with the URI to your own S3 bucket refered in step 2 of the “Set up the Spark job execution role and service account” section. Also, note that we are using data-team-a as a namespace and emr-job-execution-sa as a service account, which we created in the previous step. These are necessary to run the Spark job pods in the dedicated namespace, and the IAM role linked to the service account is used to access the S3 bucket for reading and writing data.
Most importantly, notice the image field with the EMR optimized runtime Docker image, which is currently set to emr-6.10.0. You can change this to a newer version when it’s released by the Amazon EMR team. Also, when configuring your jobs, make sure that you include the sparkConf and hadoopConf settings as defined in the following manifest. These configurations enable you to benefit from EMR runtime performance, AWS Glue Data Catalog integration, and the EMRFS optimized connector.
- Create the file (
emr-spark-operator-example.yaml) locally and update the S3 bucket location so that you can submit the job as part of the next step: - Run the following command to submit the job to the EKS cluster:
The job may take 4–5 minutes to complete, and you can verify the successful message in the driver pod logs.
- Verify the job by running the following command:
Enable access to the Spark UI
The Spark UI is an important tool for data engineers because it allows you to track the progress of tasks, view detailed job and stage information, and analyze resource utilization to identify bottlenecks and optimize your code. For Spark jobs running on Kubernetes, the Spark UI is hosted on the driver pod and its access is restricted to the internal network of Kubernetes. To access it, we need to forward the traffic to the pod with kubectl. The following steps take you through how to set it up.
Run the following command to forward traffic to the driver pod:
You should see text similar to the following:
If you didn’t specify the driver pod name at the submission of the SparkApplication, you can get it with the following command:
Open a browser and enter http://localhost:4040 in the address bar. You should be able to connect to the Spark UI.

Spark History Server
If you want to explore your job after its run, you can view it through the Spark History Server. The preceding SparkApplication definition has the event log enabled and stores the events in an S3 bucket with the following path: s3://YOUR-S3-BUCKET/. For instructions on setting up the Spark History Server and exploring the logs, refer to Launching the Spark history server and viewing the Spark UI using Docker.
spark-submit
spark-submit is a command line interface for running Apache Spark applications on a cluster or locally. It allows you to submit applications to Spark clusters. The tool enables simple configuration of application properties, resource allocation, and custom libraries, streamlining the deployment and management of Spark jobs.
Beginning with Amazon EMR 6.10, spark-submit is supported as a job submission method. This method currently only supports cluster mode as the submission mechanism. To submit jobs using the spark-submit method, we reuse the IAM role for the service account we set up earlier. We also use the S3 bucket used for the Spark Operator method. The steps in this section take you through how to configure and submit jobs with spark-submit and benefit from EMR runtime improvements.
- In order to submit a job, you need to use the Spark version that matches the one available in Amazon EMR. For Amazon EMR 6.10, you need to download the Spark 3.3 version.
- You also need to make sure you have Java installed in your environment.
- Unzip the file and navigate to the root of the Spark directory.
- In the following code, replace the EKS endpoint as well as the S3 bucket then run the script:
The job takes about 7 minutes to complete with two executors of one core and 1 G of memory.
Using custom kubernetes schedulers
Customers running a large volume of jobs concurrently might face challenges related to providing fair access to compute capacity that they aren’t able to solve with the standard scheduling and resource utilization management Kubernetes offers. In addition, customers that are migrating from Amazon EMR on Amazon Elastic Compute Cloud (Amazon EC2) and are managing their scheduling with YARN queues will not be able to transpose them to Kubernetes scheduling capabilities.
To overcome this issue, you can use custom schedulers like Apache Yunikorn or Volcano.Spark Operator natively supports these schedulers, and with them you can schedule Spark applications based on factors such as priority, resource requirements, and fairness policies, while Spark Operator simplifies application deployment and management. To set up Yunikorn with gang scheduling and use it in Spark applications submitted through Spark Operator, refer to Spark Operator with YuniKorn.
Clean up
To avoid unwanted charges to your AWS account, delete all the AWS resources created during this deployment:
Conclusion
In this post, we introduced the EMR runtime feature for Spark Operator and spark-submit, and explored the advantages of using this feature on an EKS cluster. With the optimized EMR runtime, you can significantly enhance the performance of your Spark applications while optimizing costs. We demonstrated the deployment of the cluster using the eksctl tool, , you can also use the Data on EKS blueprints for deploying a production-ready EKS which you can use for EMR on EKS and leverage these new deployment methods in addition to the EMR on EKS API job submission method. By running your applications on the optimized EMR runtime, you can further enhance your Spark application workflows and drive innovation in your data processing pipelines.
About the Authors
 Lotfi Mouhib is a Senior Solutions Architect working for the Public Sector team with Amazon Web Services. He helps public sector customers across EMEA realize their ideas, build new services, and innovate for citizens. In his spare time, Lotfi enjoys cycling and running.
 Vara Bonthu is a dedicated technology professional and Worldwide Tech Leader for Data on EKS, specializing in assisting AWS customers ranging from strategic accounts to diverse organizations. He is passionate about open-source technologies, data analytics, AI/ML, and Kubernetes, and boasts an extensive background in development, DevOps, and architecture. Vara’s primary focus is on building highly scalable data and AI/ML solutions on Kubernetes platforms, helping customers harness the full potential of cutting-edge technology for their data-driven pursuits.
From Response to Recovery: Developing a Cyber Resilience Framework
Post Syndicated from Kari Rivas original https://www.backblaze.com/blog/from-response-to-recovery-developing-a-cyber-resilience-framework/

If you’re responsible for securing your company’s data, you’re likely well-acquainted with the basics of backups. You may be following the 3-2-1 rule and may even be using cloud storage for off-site backup of essential data.
But there’s a new model of iterative, process-improvement driven outcomes to improve business continuity, and it’s called cyber resilience. What is cyber resilience and why does it matter to your business? That’s what we’ll talk about today.
Join Us for Our Upcoming Webinar
Learn more about how to strengthen your organization’s cyber resilience by protecting systems, responding to incidents, and recovering with minimal disruption at our upcoming webinar “Build Your Company’s Cyber Resilience: Protect, Respond, and Recover from Security Incidents” on Friday, June 9 at 10 a.m. PT/noon CT.

Plus, see a demo of Instant Business Recovery, an on-demand, fully managed disaster recovery as a service (DRaaS) solution that works seamlessly with Veeam. Deploy and recover via a simple web interface or a phone call to instantly begin recovering critical servers and Veeam backups.
The Case for Cyber Resilience
The advance of artificial intelligence (AI) technologies, geopolitical tensions, and the ever-present threat of ransomware have all fundamentally changed the approach businesses must take to data security. In fact, the White House has prioritized cybersecurity by announcing a new cybersecurity strategy because of the increased risks of cyberattacks and the threat to critical infrastructure. And, according to the World Economic Forum’s Global Cybersecurity Outlook 2023, business continuity (67%) and reputational damage (65%) concern organization leaders more than any other cyber risk.
Cyber resilience assumes that it’s not if a security incident will occur, but when.
Being cyber resilient means that a business is able to not only identify threats and protect against them, but also withstand attacks as they’re happening, respond effectively, and bounce back better—so that the business is better fortified against future incidents.
What Is Cyber Resilience?
Cyber resilience is ultimately a holistic and continuous view of data protection; it implies that businesses can build more robust security practices, embed those throughout the organization, and put processes into place to learn from security threats and incidents in order to continuously shore up defenses. In the cyber resilience model, improving data security is no longer a finite series of checkbox items; it is not something that is ever “done.”
Unlike common backup strategies like 3-2-1 or grandfather-father-son that are well defined and understood, there is no singular model for cyber resilience. The National Institute of Standards and Technology defines cyber resiliency as the ability to anticipate, withstand, recover from, and adapt to incidents that compromise systems. You’ll often see the cyber resilience model depicted in a circular fashion because it is a cycle of continuous improvement. While cyber resilience frameworks may vary slightly from one another, they all typically focus on similar stages, including:
- Identify: Stay informed about emerging security threats, especially those that your systems are most vulnerable to. Share information throughout the organization when employees need to install critical updates and patches.
- Protect: Ensure systems are adequately protected with cybersecurity best practices like multi-factor authentication (MFA), encryption at rest and in transit, and by applying the principle of least privilege. For more information on how to shore up your data protection, including data protected in cloud storage, check out our comprehensive checklist on cyber insurance best practices. Even if you’re not interested in cyber insurance, this checklist still provides a thorough resource for improving your cyber resilience.
- Detect: Proactively monitor your network and system to ensure you can detect any threats as soon as possible.
- Respond and Recover: Respond to incidents in the most effective way and ensure you can sustain critical business operations even while an incident is occurring. Plan your recovery in advance so your executive and IT teams are prepared to execute on it when the time comes.
- Adapt: This is the key part. Run postmortems to understand what happened, what worked and what didn’t, and how it can be prevented in the future. This is how you truly build resilience.
Why Is Cyber Resilience Important?
Traditionally, IT leaders have excelled at thinking through backup strategy, and more and more IT administrators understand the value of next level techniques like using Object Lock to protect copies of data from ransomware. But, it’s less common to give attention to creating a disaster recovery (DR) plan, or thinking through how to ensure business continuity during and after an incident.
In other words, we’ve been focusing too much on the time before an incident occurs and not enough on time on what to do during and after an incident. Consider the zero trust principle, which assumes that a breach is happening and it’s happening right now: taking such a viewpoint may seem negative, but it’s actually a proactive, not reactive, way to increase your business’ cyber resilience. When you assume you’re under attack, then your responsibility is to prove you’re not, which means actively monitoring your systems—and if you happen to discover that you are under attack, then your cybersecurity readiness measures kick in.
How Is Cyber Resilience Different From Cybersecurity?
Cybersecurity is a set of practices on what to do before an incident occurs. Cyber resilience asks businesses to think more thoroughly about recovery processes and what comes after. Hence, cybersecurity is a component of cyber resilience, but cyber resilience is a much bigger framework through which to think about your business.
How Can I Improve My Business’ Cyber Resilience?
Besides establishing a sound backup strategy and following cybersecurity best practices, the biggest improvement that data security leaders can make is likely in helping the organization to shift its culture around cyber resilience.
- Reframe cyber resilience. It is not solely a function of IT. Ensuring business continuity in the face of cyber threats can and should involve operations, legal, compliance, finance teams, and more.
- Secure executive support now. Don’t wait until an incident occurs. Consider meeting on a regular basis with stakeholders to inform them about potential threats. Present if/then scenarios in terms that executives can understand: impact of risks, potential trade-offs, how incidents might affect customers or external partners, expected costs for mitigation and recovery, and timelines.
- Practice your disaster recovery scenarios. Your business continuity plans should be run as fire drills. Ensure you have all stakeholders’ emergency/after hours contact information. Run tabletop exercises with any teams that need to be involved and conduct hypothetical retrospectives to determine how you can respond more efficiently if a given incident should occur.
It may seem overwhelming to try and adopt a cyber resiliency framework for your business, but you can start to move your organization in this direction by helping your internal stakeholders first shift their thinking. Acknowledging that a cyber incident will occur is a powerful way to realign priorities and support for data security leaders, and you’ll find that the momentum behind the effort will naturally help advance your security agenda.
Cyber Resilience Resources
Interested in learning more about how to improve business cyber resilience? Check out the free Backblaze resources below.

Looking for Support to Help Achieve Your Cyber Resilience Goals?
Backblaze provides end-to-end security and recovery solutions to ensure you can safeguard your systems with enterprise-grade security, immutability, and options for redundancy, plus fully-managed, on-demand disaster recovery as a service (DRaaS)—all at one-fifth the cost of AWS. Get started today or contact Sales for more information on B2 Reserve, our all-inclusive capacity-based pricing that includes premium support and no egress fees.
The post From Response to Recovery: Developing a Cyber Resilience Framework appeared first on Backblaze Blog | Cloud Storage & Cloud Backup.
Updated AWS Ramp-Up Guide available for security, identity, and compliance
Post Syndicated from Anna McAbee original https://aws.amazon.com/blogs/security/updated-aws-ramp-up-guide-available-for-security-identity-and-compliance/
To support our customers in securing their Amazon Web Services (AWS) environment, AWS offers digital training, whitepapers, blog posts, videos, workshops, and documentation to learn about security in the cloud.
The AWS Ramp-Up Guide: Security is designed to help you quickly learn what is most important to you when it comes to security, identity, and compliance. The Ramp-Up Guide helps you get started with learning cloud foundations and then provides you with options for building skills in various security domains.
Recently, we have updated the AWS Ramp-Up Guide: Security. In this post, we will highlight some of the changes and discuss how to use the new guide.
Update highlights
Based on customer feedback, new service and feature releases, and our experience helping customers, we’ve updated the majority of the guide with new content. Some highlights of the new version include:
- Focus on AWS security digital trainings — The new Ramp-Up Guide for security focuses on digital trainings provided by AWS Skill Builder. AWS Skill Builder is a learning center for AWS customers and partners to build cloud skills through digital trainings, self-paced labs, and other course types. AWS Skill Builder has a variety of AWS security content to help customers understand concepts and gain hands-on experience with AWS security.
- Security focus areas — Because there are different roles and focuses within cybersecurity, we created sections for different focus areas of AWS security, including threat detection and incident response (TD/IR), compliance, data protection, and more. A Security Operations Center (SOC) analyst, for example, can choose to focus on TD/IR training, which is most relevant for that role.
- Extensive additional resources — For each focus area, we added new resources, including whitepapers, blogs, re:Invent videos, and workshops. Customers can use these additional resources to supplement the AWS Skill Builder courses and labs.
How to use the new guide
The AWS Ramp-Up Guide: Security is designed to take you all the way from cloud foundations to the AWS Certified Security – Specialty certification. The guide takes the latest in digital training available from AWS Skill Builder and augments that with the latest resources aligned to foundational concepts and specialized areas within cloud security. Although you are free to use the learnings in any order, if you are new to the cloud, we recommend the following steps:
- Sign up for your free AWS Skill Builder account, which provides you with more than 600 digital courses.
Note: You can optionally buy an AWS Skill Builder subscription if you’d like to complete the self-paced labs. See Pricing options for AWS Skill Builder for more details.
- Review the “Learn the fundamentals of the AWS Cloud” section of the Ramp-Up Guide, choose a course name under Learning Resource, and search for that course in Skill Builder. If you are unsure of which course to start with, we recommend that you begin with “AWS Cloud Practitioner Essentials.”
- After you’ve completed the “Learn the fundamentals of the AWS Cloud” section, proceed to the “AWS Cloud Security Fundamentals” section begin your security training.
- After you complete the Security Fundamentals section, review the specialized security focus areas in the Ramp-Up Guide, choose a focus area, and complete the training items within that focus area.
- After you’ve completed the training specific to your focus area, explore other focus areas beyond the scope of your immediate role. Security often requires knowledge across domains and focus areas, so we encourage you to explore the security focus areas beyond the immediate scope of your role.
- Review the “Putting it all together” section to prepare for the AWS Certified Security – Specialization certification.
- Go build, securely!
More information
For more information and to get started, see the updated AWS Ramp-Up Guide: Security.
We greatly value feedback and contributions from our community. To share your thoughts and insights about the AWS Ramp-Up Guide: Security and your experience using it, and what you want to see in future versions, please contact [email protected].
If you have feedback about this post, submit comments in the Comments section below. If you have questions about this post, contact AWS Support.
Want more AWS Security news? Follow us on Twitter.
AWS Glue Data Quality is Generally Available
Post Syndicated from Shiv Narayanan original https://aws.amazon.com/blogs/big-data/aws-glue-data-quality-is-generally-available/
We are excited to announce the General Availability of AWS Glue Data Quality.
Our journey started by working backward from our customers who create, manage, and operate data lakes and data warehouses for analytics and machine learning. To make confident business decisions, the underlying data needs to be accurate and recent. Otherwise, data consumers lose trust in the data and make suboptimal or incorrect decisions. For example, medical researchers found that across 79,000 emergency department encounters of pediatric patients in a hospital, incorrect or missing patient weight measurements led to medication dosing errors in 34% of cases. A data quality check to identify missing patient weight measurements or a check to ensure patients’ weights are trending within certain thresholds would have alerted respective teams to identify these discrepancies.
For our customers, setting up these data quality checks is manual, time consuming, and error prone. It takes days for data engineers to identify and implement data quality rules. They have to gather detailed data statistics, such as minimums, maximums, averages, and correlations. They have to then review the data statistics to identify data quality rules, and write code to implement these checks in their data pipelines. Data engineers must then write code to monitor data pipelines, visualize quality scores, and alert them when anomalies occur. They have to repeat these processes across thousands of datasets and the hundreds of data pipelines populating them. Some customers adopt commercial data quality solutions; however, these solutions require time-consuming infrastructure management and are expensive. Our customers needed a simple, cost-effective, and automatic way to manage data quality.
In this post, we discuss the capabilities and features of AWS Glue Data Quality.
Capabilities of AWS Glue Data Quality
AWS Glue Data Quality accelerates your data quality journey with the following key capabilities:
- Serverless – AWS Glue Data Quality is a feature of AWS Glue, which eliminates the need for infrastructure management, patching, and maintenance.
- Reduced manual efforts with recommending data quality rules and out-of-the-box rules – AWS Glue Data Quality computes data statistics such as minimums, maximums, histograms, and correlations for datasets. It then uses these statistics to automatically recommend data quality rules that check for data freshness, accuracy, and integrity. This reduces manual data analysis and rule identification efforts from days to hours. You can then augment recommendations with out-of-the-box data quality rules. The following table lists the rules that are supported by AWS Glue Data Quality as of writing. For an up-to-date list, refer to Data Quality Definition Language (DQDL).
| Rule Type | Description |
AggregateMatch |
Checks if two datasets match by comparing summary metrics like total sales amount. Useful for customers to compare if all data is ingested from source systems. |
ColumnCorrelation |
Checks how well two columns are corelated. |
ColumnCount |
Checks if any columns are dropped. |
ColumnDataType |
Checks if a column is compliant with a data type. |
ColumnExists |
Checks if columns exist in a dataset. This allows customers building self-service data platforms to ensure certain columns are made available. |
ColumnLength |
Checks if length of data is consistent. |
ColumnNamesMatchPattern |
Checks if column names match defined patterns. Useful for governance teams to enforce column name consistency. |
ColumnValues |
Checks if data is consistent per defined values. This rule supports regular expressions. |
Completeness |
Checks for any blank or NULLs in data. |
CustomSql |
Customers can implement almost any type of data quality checks in SQL. |
DataFreshness |
Checks if data is fresh. |
DatasetMatch |
Compares two datasets and identifies if they are in sync. |
DistinctValuesCount |
Checks for duplicate values. |
Entropy |
Checks for entropy of the data. |
IsComplete |
Checks if 100% of the data is complete. |
IsPrimaryKey |
Checks if a column is a primary key (not NULL and unique). |
IsUnique |
Checks if 100% of the data is unique. |
Mean |
Checks if the mean matches the set threshold. |
ReferentialIntegrity |
Checks if two datasets have referential integrity. |
RowCount |
Checks if record counts match a threshold. |
RowCountMatch |
Checks if record counts between two datasets match. |
StandardDeviation |
Checks if standard deviation matches the threshold. |
SchemaMatch |
Checks if schema between two datasets match. |
Sum |
Checks if sum matches a set threshold. |
Uniqueness |
Checks if uniqueness of dataset matches a threshold. |
UniqueValueRatio |
Checks if the unique value ration matches a threshold. |
- Embedded in customer workflow – AWS Glue Data Quality has to blend into customer workflows for it to be useful. Disjointed experiences create friction in getting started. You can access AWS Glue Data Quality from the AWS Glue Data Catalog, allowing data stewards to set up rules while they are using the Data Catalog. You can also access AWS Glue Data Quality from Glue Studio (AWS Glue’s visual authoring tool), Glue Studio notebooks (a notebook-based interface for coders to create data integration pipelines), and interactive sessions, an API where data engineers can submit jobs from their choice of code editor.
- Pay-as-you-go and cost-effective – AWS Glue Data Quality is charged based on the compute used. This simple pricing model doesn’t lock you into annual licenses. AWS Glue ETL-based data quality checks can use Flex execution, which is 34% cheaper for non-SLA sensitive data quality checks. Additionally, AWS Glue Data Quality rules on data pipelines can help you save costs because you don’t have to waste compute resources on bad quality data when detected early. Also, when data quality checks are configured as part of data pipelines, you only incur an incremental cost because the data is already read and mostly in memory.
- Built on open-source – AWS Glue Data Quality is built on open-source DeeQu, a library that is used internally by Amazon to manage the quality of data lakes over 60 PB. DeeQu is optimized to run data quality rules in minimal passes that makes it efficient. The rules that are authored in AWS Glue Data Quality can be run in any environment that can run DeeQu, allowing you to stay in an open-source solution.
- Simplified rule authoring language – As part of AWS Glue Data Quality, we announced Data Quality Definition Language (DQDL). DQDL attempts to standardize data quality rules so that you can use the same data quality rules across different databases and engines. DQDL is simple to author and read, and brings the goodness of code that developers like, such as version control and deployment. To demonstrate the simplicity of this language, the following example shows three rules that check if record counts are greater than 10, and ensures that
VendorIDdoesn’t have any empty values andVendorIDhas a certain range of values:
General Availability features
AWS Glue Data Quality has several key enhancements from the preview version:
- Error record identification – You need to know which records failed data quality checks. We have launched this capability in AWS Glue ETL, where the data quality transform now enriches the input dataset with new columns that identify which records failed data quality checks. This can help you quarantine bad data so that only good records flow into your data repositories.
- New rule types that validate data across multiple datasets – With new rule types like
ReferentialIntegrity,DatasetMatches,RowCountMatches, andAggregateMatches, you can compare two datasets to ensure that data integrity is maintained. TheSchemaMatchrule type ensures that the dataset accurately matches a set schema, preventing downstream errors that may be caused by schema changes. - Amazon EventBridge integration – Integration with Amazon EventBridge enables you to simplify how you set up alerts when quality rules fail. A one-time setup is now sufficient to alert data consumers about data quality failures.
- AWS CloudFormation support – With support for AWS CloudFormation, AWS Glue Data Quality now enables you to easily deploy data quality rules in many environments
- Join support in CustomSQL rule type – You can now join datasets in CustomSQL rule types to write complex business rules.
- New data source support – You can check data quality on open transactional formats such as Apache HUDI, Apache Iceberg, and Delta Lake. Additionally, you can set up data quality rules on Amazon Redshift and Amazon Relational Database Service (Amazon RDS) data sources cataloged in the AWS Glue Data Catalog.
Summary
AWS Data Quality is now Generally Available. To help you get started, we have created a five-part blog series:
- Part 1: Getting started with AWS Glue Data Quality from the AWS Glue Data Catalog
- Part 2: Getting started with AWS Glue Data Quality for ETL Pipelines
- Part 3: Set up data quality rules across multiple datasets using AWS Glue Data Quality
- Part 4: Set up alerts and orchestrate data quality rules with AWS Glue Data Quality
- Part 5: Visualize data quality score and metrics generated by AWS Glue Data Quality
Get started today with AWS Glue Data Quality and tell us what you think.
About the authors
 Shiv Narayanan is a Technical Product Manager for AWS Glue’s data management capabilities like data quality, sensitive data detection and streaming capabilities. Shiv has over 20 years of data management experience in consulting, business development and product management.
 Tome Tanasovski is a Technical Manager at AWS, for a team that manages capabilities into Amazon’s big data platforms via AWS Glue. Prior to working at AWS, Tome was an executive for a market-leading global financial services firm in New York City where he helped run the Firm’s Artificial Intelligence & Machine Learning Center of Excellence. Prior to this role he spent nine years in the Firm focusing on automation, cloud, and distributed computing. Tome has a quarter-of-a-century worth of experience in technology in the Tri-state area across a wide variety of industries including big tech, finance, insurance, and media.
 Brian Ross is a Senior Software Development Manager at AWS. He has spent 24 years building software at scale and currently focuses on serverless data integration with AWS Glue. In his spare time, he studies ancient texts, cooks modern dishes and tries to get his kids to do both.
 Alona Nadler is AWS Glue Head of Product and is responsible for AWS Glue Service. She has a long history of working in the enterprise software and data services spaces. When not working, Alona enjoys traveling and playing tennis.
Visualize data quality scores and metrics generated by AWS Glue Data Quality
Post Syndicated from Zack Zhou original https://aws.amazon.com/blogs/big-data/visualize-data-quality-scores-and-metrics-generated-by-aws-glue-data-quality/
AWS Glue Data Quality allows you to measure and monitor the quality of data in your data repositories. It’s important for business users to be able to see quality scores and metrics to make confident business decisions and debug data quality issues. AWS Glue Data Quality generates a substantial amount of operational runtime information during the evaluation of rulesets.
An operational scorecard is a mechanism used to evaluate and measure the quality of data processed and validated by AWS Glue Data Quality rulesets. It provides insights and metrics related to the performance and effectiveness of data quality processes.
In this post, we highlight the seamless integration of Amazon Athena and Amazon QuickSight, which enables the visualization of operational metrics for AWS Glue Data Quality rule evaluation in an efficient and effective manner.
This post is Part 5 of a five-post series to explain how to build dashboards to measure and monitor your data quality:
- Part 1: Getting started with AWS Glue Data Quality from the AWS Glue Data Catalog
- Part 2: Getting started with AWS Glue Data Quality for ETL Pipelines
- Part 3: Set up data quality rules across multiple datasets using AWS Glue Data Quality
- Part 4: Set up alerts and orchestrate data quality rules with AWS Glue Data Quality
- Part 5: Visualize data quality score and metrics generated by AWS Glue Data Quality
Solution overview
The solution allows you to build your AWS Glue Data Quality score and metrics dashboard using QuickSight in an easy and straightforward manner. The following architecture diagram shows an overview of the complete pipeline.

These are six main steps in the data pipeline:
- Amazon EventBridge triggers an AWS Lambda function when the event pattern for AWS Glue Data Quality matches the defined rule. (Refer to Set up alerts and orchestrate data quality rules with AWS Glue Data Quality)
- The Lambda function writes the AWS Glue Data Quality result to an Amazon Simple Storage Service (Amazon S3) bucket.
- An AWS Glue crawler crawls the results.
- The crawler builds a Data Catalog, so the data can be queried using Athena.
- We can analyze the data quality score and metrics using Athena SQL queries.
- We can query and submit the Athena data to QuickSight to create visuals for the dashboard.
In the following sections, we discuss these steps in more detail.
Prerequisites
To follow along with this post, complete the following prerequisites:
- Have an AWS Identity and Access Management (IAM) role with permissions to extract data from an S3 bucket and write to the AWS Glue Data Catalog.
- Similarly, have a Lambda function execution role with access to AWS Glue and S3 buckets.
- Set up the Athena query result location. For more information, refer to Working with Query Results, Output Files, and Query History.
- Set up QuickSight permissions and enable Athena table and S3 bucket access.
Set up and deploy the Lambda pipeline
To test the solution, we can use the following AWS CloudFormation template. The CloudFormation template creates the EventBridge rule, Lambda function, and S3 bucket to store the data quality results.
If you deployed the CloudFormation template in the previous post, you don’t need to deploy it again in this step.
The following screenshot shows a line of code in which the Lambda function writes the results from AWS Glue Data Quality to an S3 bucket. As depicted, the data will be stored in JSON format and organized according to the time horizon, facilitating convenient access and analysis of the data over time.

Set up the AWS Glue Data Catalog using a crawler
Complete the following steps to create an AWS Glue crawler and set up the Data Catalog:
- On the AWS Glue console, choose Crawlers in the navigation pane.
- Choose Create crawler.
- For Name, enter
data-quality-result-crawler, then choose Next. - Under Data sources, choose Add a data source.
- For Data source, choose S3.
- For S3 path, enter the S3 path to your data source. (
s3://<AWS CloudFormation outputs key:DataQualityS3BucketNameOutputs>/gluedataqualitylogs/). Refer to Set up alerts and orchestrate data quality rules with AWS Glue Data Quality for details. - Choose Add an S3 data source and choose Next.

- For Existing IAM role, choose your IAM role (
GlueDataQualityLaunchBlogDemoRole-xxxx). Refer to Set up alerts and orchestrate data quality rules with AWS Glue Data Quality for details. Then choose Next. - For Target database, choose Add database.
- For Database name, enter
data-quality-result-database, then choose Create. - For Table name prefix, enter
dq_, then choose Next.

- Choose Create crawler.
- On the Crawlers page, select
data-quality-result-crawlerand choose Run.


When the crawler is complete, you can see the AWS Glue Data Catalog table definition.

After you create the table definition on the AWS Glue Data Catalog, you can use Athena to query the Data Catalog table.
Query the Data Catalog table using Athena
Athena is an interactive query service that makes it easy to analyze data in Amazon S3 and the AWS Glue Data Catalog using standard SQL. Athena is serverless, so there is no infrastructure to manage, and you pay only for the queries that you run on datasets at petabyte scale.
The purpose of this step is to understand our data quality statistics at the table level as well as at the ruleset level. Athena provides simple queries to assist you with this task. Use the queries in this section to analyze your data quality metrics and create an Athena view to use to build a QuickSight dashboard in the next step.
Query 1
The following is a simple SELECT query on the Data Catalog table:
The following screenshot shows the output.

Before we run the second query, let’s check the schema for the table dq_gluedataqualitylogs.
The following screenshot shows the output.

The table shows that one of the columns, resultrun, is the array data type. In order to work with this column in QuickSight, we need to perform an additional step to transform it into multiple strings. This is necessary because QuickSight doesn’t support the array data type.
Query 2
Use the following query to review the data in the resultrun column:
The following screenshot shows the output.

Query 3
The following query flattens an array into multiple rows using CROSS JOIN in conjunction with the unnest operator and creates a view on the selected columns:
The following screenshot shows the output.

Verify the columns that were created using the unnest operator.
The following screenshot shows the output.
Query 4
Verify the Athena view created in the previous query:
The following screenshot shows the output.

Visualize the data with QuickSight
Now that you can query your data in Athena, you can use QuickSight to visualize the results. Complete the following steps:
- Sign in to the QuickSight console.
- In the upper right corner of the console, choose Admin/username, then choose Manage QuickSight.
- Choose Security and permissions.
- Under QuickSight access to AWS services, choose Add or remove.
- Choose Amazon Athena, then choose Next.
- Give QuickSight access to the S3 bucket where your data quality result is stored.
Create your datasets
Before you can analyze and visualize the data in QuickSight, you must create datasets for your Athena view (data_quality_result_view). Complete the following steps:
- On the Datasets page, choose New dataset, then choose Athena.
- Choose the AWS Glue database that you created earlier.
- Select Import to SPICE (alternatively, you can select Directly query your data).
- Choose Visualize.

Build your dashboard
Create your analysis with one donut chart, one pivot table, one vertical stacked bar, and one funnel chart that use the different fields in the dataset. QuickSight offers a wide range of charts and visuals to help you create your dashboard. For more information, refer to Visual types in Amazon QuickSight.

Clean up
To avoid incurring future charges, delete the resources created in this post.
Conclusion
In this post, we provide insights into running Athena queries and building customized dashboards in QuickSight to understand data quality metrics. This gives you a great starting point for using this solution with your datasets and applying business rules to build a complete data quality framework to monitor issues within your datasets.
To dive into the AWS Glue Data Quality APIs, refer to Data Quality API. To learn more about AWS Glue Data Quality, see the AWS Glue Data Quality Developer Guide. To learn more about QuickSight dashboards, refer to the Amazon QuickSight Developer Guide.
About the authors
 Zack Zhou is a Software Development Engineer on the AWS Glue team.
 Deenbandhu Prasad is a Senior Analytics Specialist at AWS, specializing in big data services. He is passionate about helping customers build modern data architecture on the AWS Cloud. He has helped customers of all sizes implement data management, data warehouse, and data lake solutions.
 Avik Bhattacharjee is a Senior Partner Solutions Architect at AWS. He works with customers to build IT strategy, making digital transformation through the cloud more accessible, focusing on big data and analytics and AI/ML.
 Amit Kumar Panda is a Data Architect at AWS Professional Services who is passionate about helping customers build scalable data analytics solutions to enable making critical business decisions.
Set up alerts and orchestrate data quality rules with AWS Glue Data Quality
Post Syndicated from Avik Bhattacharjee original https://aws.amazon.com/blogs/big-data/set-up-alerts-and-orchestrate-data-quality-rules-with-aws-glue-data-quality/
Alerts and notifications play a crucial role in maintaining data quality because they facilitate prompt and efficient responses to any data quality issues that may arise within a dataset. By establishing and configuring alerts and notifications, you can actively monitor data quality and receive timely alerts when data quality issues are identified. This proactive approach helps mitigate the risk of making decisions based on inaccurate information. Furthermore, it allows for necessary actions to be taken, such as rectifying errors in the data source, refining data transformation processes, and updating data quality rules.
We are excited to announce that AWS Glue Data Quality is now generally available, offering built-in integration with Amazon EventBridge and AWS Step Functions to streamline event-driven data quality management. You can access this feature today in the available Regions. It simplifies your experience of monitoring and evaluating the quality of your data.
This post is Part 4 of a five-post series to explain how to set up alerts and orchestrate data quality rules with AWS Glue Data Quality:
- Part 1: Getting started with AWS Glue Data Quality from the AWS Glue Data Catalog
- Part 2: Getting started with AWS Glue Data Quality for ETL Pipelines
- Part 3: Set up data quality rules across multiple datasets using AWS Glue Data Quality
- Part 4: Set up alerts and orchestrate data quality rules with AWS Glue Data Quality
- Part 5: Visualize data quality score and metrics generated by AWS Glue Data Quality
Solution overview
In this post, we provide a comprehensive guide on enabling alerts and notifications using Amazon Simple Notification Service (Amazon SNS) We walk you through the step-by-step process of using EventBridge to establish rules that activate an AWS Lambda function when the data quality outcome aligns with the designated pattern. The Lambda function is responsible for converting the data quality metrics and dispatching them to the designated email addresses via Amazon SNS.
To expedite the implementation of the solution, we have prepared an AWS CloudFormation template for your convenience. AWS CloudFormation serves as a powerful management tool, enabling you to define and provision all necessary infrastructure resources within AWS using a unified and standardized language.
The solution aims to automate data quality evaluation for AWS Glue Data Catalog tables (data quality at rest) and allows you to configure email notifications when the AWS Glue Data Quality results become available.
The following architecture diagram provides an overview of the complete pipeline.

The data pipeline consists of the following key steps:
- The first step involves AWS Glue Data Quality evaluations that are automated using Step Functions. The workflow is designed to start the evaluations based on the rulesets defined on the dataset (or table). The workflow accepts input parameters provided by the user.
- An EventBridge rule receives an event notification from the AWS Glue Data Quality evaluations including the results. The rule evaluates the event payload based on the predefined rule and then triggers a Lambda function for notification.
- The Lambda function sends an SNS notification containing data quality statistics to the designated email address. Additionally, the function writes the customized result to the specified Amazon Simple Storage Service (Amazon S3) bucket, ensuring its persistence and accessibility for further analysis or processing.
The following sections discuss the setup for these steps in more detail.
Deploy resources with AWS CloudFormation
We create several resources with AWS CloudFormation, including a Lambda function, EventBridge rule, Step Functions state machine, and AWS Identity and Access Management (IAM) role. Complete the following steps:
- To launch the CloudFormation stack, choose Launch Stack:

- Provide your email address for EmailAddressAlertNotification, which will be registered as the target recipient for data quality notifications.
- Leave the other parameters at their default values and create the stack.



The stack takes about 4 minutes to complete.
- Record the outputs listed on the Outputs tab on the AWS CloudFormation console.

- Navigate to the S3 bucket created by the stack (
DataQualityS3BucketNameStaging) and upload the file yellow_tripdata_2022-01.parquet file. - Check your email for a message with the subject “AWS Notification – Subscription Confirmation” and confirm your subscription.

Now that the CloudFormation stack is complete, let’s update the Lambda function code before running the AWS Glue Data Quality pipeline using Step Functions.
Update the Lambda function
This section explains the steps to update the Lambda function. We modify the ARN of Amazon SNS and the S3 output bucket name based on the resources created by AWS CloudFormation.
Complete the following steps:
- On the Lambda console, choose Functions in the navigation pane.
- Choose the function
GlueDataQualityBlogAlertLambda-xxxx(created by the CloudFormation template in the previous step). - Modify the values for
sns_topic_arnands3bucketwith the corresponding values from the CloudFormation stack outputs forSNSTopicNameAlertNotificationandDataQualityS3BucketNameOutputs, respectively.

- On the File menu, choose Save.
- Choose Deploy.

Now that we’ve updated the Lambda function, let’s check the EventBridge rule created by the CloudFormation template.
Review and analyze the EventBridge rule
This section explains the significance of the EventBridge rule and how rules use event patterns to select events and send them to specific targets. In this section, we create a rule with an event pattern set as Data Quality Evaluations Results Available and configure the target as a Lambda function.
- On the EventBridge console, choose Rules in the navigation pane.
- Choose the rule
GlueDataQualityBlogEventBridge-xxxx.
On the Event pattern tab, we can review the source event pattern. Event patterns are based on the structure and content of the events generated by various AWS services or custom applications.
- We set the source as
aws-glue-dataqualitywith the event pattern detail typeData Quality Evaluations Results Available.

On the Targets tab, you can review the specific actions or services that will be triggered when an event matches a specified pattern.
- Here, we configure EventBridge to invoke a specific Lambda function when an event matches the defined pattern.
This allows you to run serverless functions in response to events.

Now that you understand the EventBridge rule, let’s review the AWS Glue Data Quality pipeline created by Step Functions.
Set up and deploy the Step Functions state machine
AWS CloudFormation created the StateMachineGlueDataQualityCustomBlog-xxxx state machine to orchestrate the evaluation of existing AWS Glue Data Quality rules, creation of custom rules if needed, and subsequent evaluation of the ruleset. Complete the following steps to configure and run the state machine:
- On the Step Functions console, choose State machines in the navigation pane.
- Open the state machine
StateMachineGlueDataQualityCustomBlog-xxxx. - Choose Edit.

- Modify row 80 with the IAM role ARN starting with
GlueDataQualityBlogStepsFunctionRole-xxxxand choose Save.

Step Functions needs certain permissions (least priviledge) to run the state machine and evaluate the AWS Glue Data Quality ruleset.
- Choose Start execution.

- Provide the following input:

This step assumes the existence of the ruleset and runs the workflow as depicted in the following screenshot. It runs the data quality ruleset evaluation and writes results to the S3 bucket.

If it doesn’t find the ruleset name in the data quality rules, it will create a custom ruleset for you and perform the data quality ruleset evaluation. AWS Step Functions is creating the custom ruleset. Below is a code snippet from the state machine code.


State machine results and run options
The Step Functions state machine has run AWS the Glue Data Quality evaluation. Now EventBridge matches the pattern Data Quality Evaluations Results Available and triggers the Lambda function. The Lambda function writes customized AWS Glue Data Quality metrics results to the S3 bucket and sends an email notification via Amazon SNS.
The following sample email provides operational metrics for the AWS Glue Data Quality ruleset evaluation. It provides details about the ruleset name, the number of rules passed or failed, and the score. This helps you visualize the results of each rule along with the evaluation message if a rule fails.
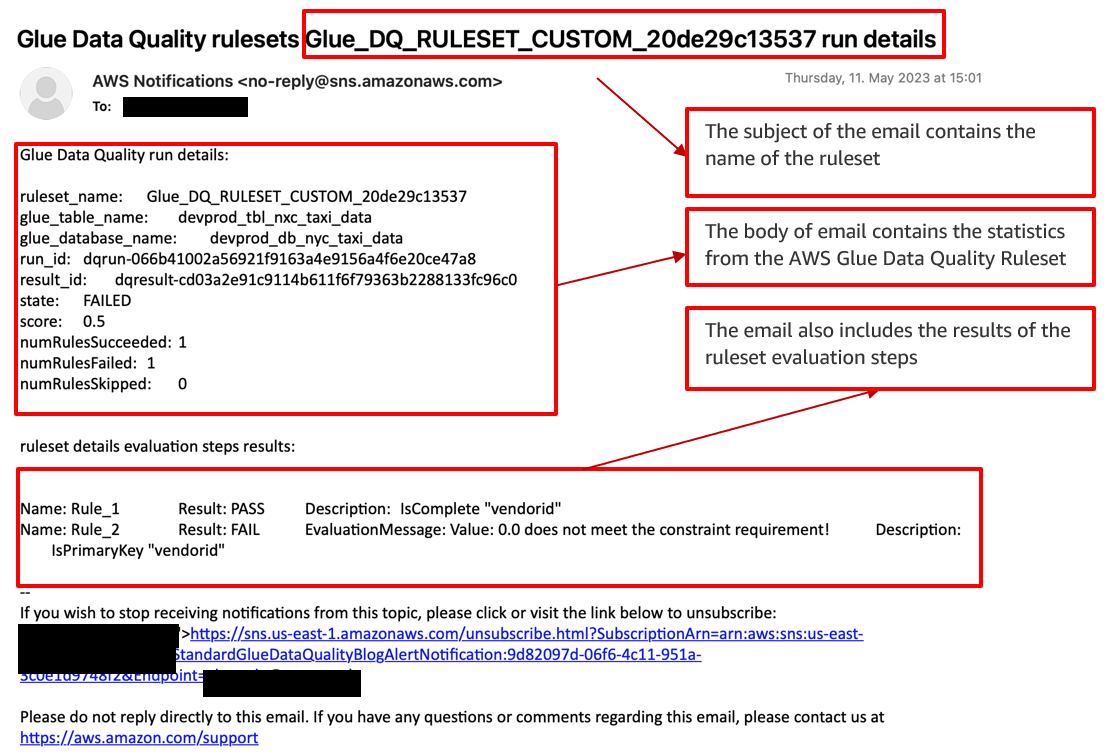
You have the flexibility to choose between two run modes for the Step Functions workflow:
- The first option is on-demand mode, where you manually trigger the Step Functions workflow whenever you want to initiate the AWS Glue Data Quality evaluation.
- Alternatively, you can schedule the entire Step Functions workflow using EventBridge. With EventBridge, you can define a schedule or specific triggers to automatically initiate the workflow at predetermined intervals or in response to specific events. This automated approach reduces the need for manual intervention and streamlines the data quality evaluation process. For more details, refer to Schedule a Serverless Workflow.
Clean up
To avoid incurring future charges and to clean up unused roles and policies, delete the resources you created:
- On the AWS CloudFormation console, choose Stacks in the navigation pane.
- Select your stack and delete it.
If you’re continuing to Part 5 in this series, you can skip this step.
Conclusion
In this post, we discussed three key steps that organizations can take to optimize data quality and reliability on AWS:
- Create a CloudFormation template to ensure consistency and reproducibility in deploying AWS resources.
- Integrate AWS Glue Data Quality ruleset evaluation and Lambda to automatically evaluate data quality and receive event-driven alerts and email notifications via Amazon SNS. This significantly enhances the accuracy and reliability of your data.
- Use Step Functions to orchestrate AWS Glue Data Quality ruleset actions. You can create and evaluate custom and recommended rulesets, optimizing data quality and accuracy.
These steps form a comprehensive approach to data quality and reliability on AWS, helping organizations maintain high standards and achieve their goals.
To dive into the AWS Glue Data Quality APIs, refer to Data Quality APIs. To learn more about AWS Glue Data Quality, check out the AWS Glue Data Quality Developer Guide.
If you require any assistance in constructing this pipeline within the AWS Lake Formation environment or if you have any inquiries regarding this post, please inform us in the comments section or initiate a new thread on the Lake Formation forum.
About the authors
Avik Bhattacharjee is a Senior Partner Solution Architect at AWS. He works with customers to build IT strategy, making digital transformation through the cloud more accessible, focusing on big data and analytics and AI/ML.
Amit Kumar Panda is a Data Architect at AWS Professional Services who is passionate about helping customers build scalable data analytics solutions to enable making critical business decisions.
 Neel Patel is a software engineer working within GlueML. He has contributed to the AWS Glue Data Quality feature and hopes it will expand the repertoire for all AWS CloudFormation users along with displaying the power and usability of AWS Glue as a whole.
 Edward Cho is a Software Development Engineer at AWS Glue. He has contributed to the AWS Glue Data Quality feature as well as the underlying open-source project Deequ.
Small Inventions That Changed the World | Roma Agrawal | Talks at Google
Post Syndicated from Talks at Google original https://www.youtube.com/watch?v=teyI5p3aV_c
01 – Introduction to Home Networking – Home Networking 101
Post Syndicated from Crosstalk Solutions original https://www.youtube.com/watch?v=lqnm6BwDLVU
Panasonic Lumix S5 II – The best Hybrid Camera under $2K
Post Syndicated from Matt Granger original https://www.youtube.com/watch?v=hktcBqQoeUU
Set up advanced rules to validate quality of multiple datasets with AWS Glue Data Quality
Post Syndicated from Navnit Shukla original https://aws.amazon.com/blogs/big-data/set-up-advanced-rules-to-validate-quality-of-multiple-datasets-with-aws-glue-data-quality/
Data is the lifeblood of modern businesses. In today’s data-driven world, companies rely on data to make informed decisions, gain a competitive edge, and provide exceptional customer experiences. However, not all data is created equal. Poor-quality data can lead to incorrect insights, bad decisions, and lost opportunities.
AWS Glue Data Quality measures and monitors the quality of your dataset. It supports both data quality at rest and data quality in AWS Glue extract, transform, and load (ETL) pipelines. Data quality at rest focuses on validating the data stored in data lakes, databases, or data warehouses. It ensures that the data meets specific quality standards before it is consumed. Data quality in ETL pipelines, on the other hand, ensures the quality of data as it moves through the ETL process. It helps identify data quality issues during the ETL pipeline, allowing for early detection and correction of problems and prevents the failure of the data pipeline because of data quality issues.
This is Part 3 of a five-post series on AWS Glue Data Quality. In this post, we demonstrate the advanced data quality checks that you can typically perform when bringing data from a database to an Amazon Simple Storage Service (Amazon S3) data lake. Check out the other posts in this series:
- Part 1: Getting started with AWS Glue Data Quality from the AWS Glue Data Catalog
- Part 2: Getting started with AWS Glue Data Quality for ETL Pipelines
- Part 3: Set up data quality rules across multiple datasets using AWS Glue Data Quality
- Part 4: Set up alerts and orchestrate data quality rules with AWS Glue Data Quality
- Part 5: Visualize data quality score and metrics generated by AWS Glue Data Quality
Use case overview
Let’s consider an example use case where we have a database named classicmodels that contains retail data for a car dealership. This example database includes sample data for various entities, such as Customers, Products, ProductLines, Orders, OrderDetails, Payments, Employees, and Offices. You can find more details about this example database in MySQL Sample Database.
In this scenario, we assume the role of a data engineer who is responsible for building a data pipeline. The primary objective is to extract data from a relational database, specifically an Amazon RDS for MySQL database, and store it in Amazon S3, which serves as a data lake. After the data is loaded into the data lake, the data engineer is also responsible for performing data quality checks to ensure that the data in the data lake maintains its quality. To achieve this, the data engineer uses the newly launched AWS Glue Data Quality evaluation feature.
The following diagram illustrates the entity relationship model that describes the relationships between different tables. In this post, we use the employees, customers, and products table.

Solution overview
This solution focuses on transferring data from an RDS for MySQL database to Amazon S3 and performing data quality checks using the AWS Glue ETL pipeline and AWS Glue Data Catalog. The workflow involves the following steps:
- Data is extracted from the RDS for MySQL database using AWS Glue ETL.
- The extracted data is stored in Amazon S3, which serves as the data lake.
- The Data Catalog and AWS Glue ETL pipeline are utilized to validate the successful completion of data ingestion by performing data quality checks on the data stored in Amazon S3.
The following diagram illustrates the solution architecture.

To implement the solution, we complete the following steps:
- Set up resources with AWS CloudFormation.
- Establish a connection to the RDS for MySQL instance from AWS Cloud9.
- Run an AWS Glue crawler on the RDS for MySQL database.
- Validate the Data Catalog.
- Run an AWS Glue ETL job to bring data from Amazon RDS for MySQL to Amazon S3.
- Evaluate the advanced data quality rules in the ETL job.
- Evaluate the advanced data quality rules in the Data Catalog.
Set up resources with AWS CloudFormation
This post includes a CloudFormation template for a quick setup. You can review and customize it to suit your needs. The template generates the following resources:
- An RDS for MySQL database instance (source)
- An S3 bucket for the data lake (destination)
- An AWS Glue ETL job to bring data from source to destination
- An AWS Glue crawler to crawl the RDS for MySQL databases and create a centralized Data Catalog
- AWS Identity and Access Management (IAM) users and policies
- An AWS Cloud9 environment to connect to the RDS DB instance and create a sample dataset
- An Amazon VPC, public subnet, two private subnets, internet gateway, NAT gateway, and route tables
To launch the CloudFormation stack, complete the following steps:
- Sign in to the AWS CloudFormation console.
- Choose Launch Stack:

- Choose Next.
- For DatabaseUserPassword, enter your preferred password.
- Choose Next.
- Scroll to the end and choose Next.
- Select I acknowledge that AWS CloudFormation might create IAM resources with custom names and choose Submit.

This stack can take around 10 minutes to complete, after which you can view the deployed stack on the AWS CloudFormation console.

Establish a connection to the RDS for MySQL instance from AWS Cloud9
To connect to the RDS for MySQL instance, complete the following steps:
- On the AWS Cloud9 console, choose Open under Cloud9 IDE for your environment.

- Run the following command to the AWS Cloud9 terminal. Provide your values for the MySQL endpoint (located on the CloudFormation stack’s Outputs tab), database user name, and database user password:
- Download the SQL file.
- On the File menu, choose Upload from Local Files and upload the file to AWS Cloud9.
- Run the following SQL commands within the downloaded file:
- Retrieve a list of tables using the following SQL statement and make sure that eight tables are loaded successfully:


Run an AWS Glue crawler on the RDS for MySQL database
To run your crawler, complete the following steps:
- On the AWS Glue console, choose Crawlers under Data Catalog in the navigation pane.
- Locate and run the crawler
dq-rds-crawler.
The crawler will take a few minutes to crawl all the tables from the classicmodels database.

Validate the AWS Glue Data Catalog
To validate the Data Catalog when the crawler is complete, complete the following steps:
- On the AWS Glue console, choose Databases under Data Catalog in the navigation pane.
- Choose the
mysql_private_classicmodelsdatabase.
You will able to see all the RDS tables available under mysql_private_classicmodels.

Run an AWS Glue ETL job to bring data from Amazon RDS for MySQL to Amazon S3
To run your ETL job, complete the following steps:
- On the AWS Glue console, choose Visual ETL under ETL jobs in the navigation pane.
- Select
dq-rds-to-s3from the job list and choose Run job.


When the job is complete, you will able to see three new tables under mysql_s3_db. It may take a few minutes to complete.

Now let’s dive into evaluating the data quality rules.
Evaluate the advanced data quality rules in the ETL job
In this section, we evaluate the results of different data quality rules.
ReferentialIntegrity
Let’s start with referential integrity. The ReferentialIntegrity data quality ruleset is currently supported in ETL jobs. This feature ensures that the relationships between tables in a database are maintained. It checks if the foreign key relationships between tables are valid and consistent, helping to identify any referential integrity violations.
- On the AWS Glue console, choose Visual ETL under ETL jobs in the navigation pane.
- In AWS Glue Studio, select Visual with a blank canvas.
- Provide a name for your job; for example, RDS
ReferentialIntegrity. - Choose the plus sign in the AWS Glue Studio canvas and on the Data tab, choose AWS Glue Data Catalog.
- For Name, enter a name for your data source; for example, employees.
- For Database, choose
mysql_private_classicmodels. - For Table, choose
mysql_classicmodels_employees.

- Choose the plus sign in the AWS Glue Studio canvas and on the Data tab, choose AWS Glue Data Catalog.
- For Name, enter a name for your data source; for example,
customers. - For Database, choose
mysql_private_classicmodels. - For Table, choose
mysql_classicmodels_employees. - Choose the plus sign in the AWS Glue Studio canvas and on the Transform tab, choose Evaluate Data Quality.
- For Node parents, choose
employeesandcustomers. - For Aliases for referenced data source, select Primary source for employees and for customers, enter the alias customers.
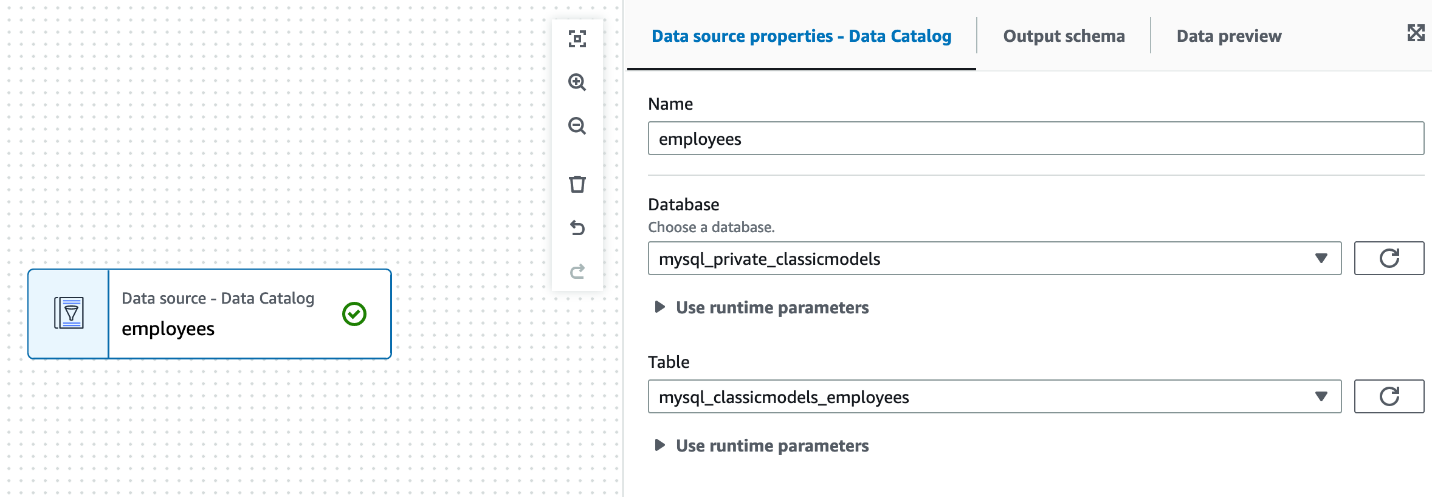
All other datasets are used as references to ensure that the primary dataset has good-quality data.

- Search for
ReferentialIntegrityunder Rule types and choose the plus sign to add an exampleReferentialIntegrityrule.

- Replace the rule with the following code and keep the remaining options as default:
- Under Data quality action, select Publish results to Amazon CloudWatch and select Fail job without loading target data.
- On the Job details tab, choose
GlueServiceRole-for-gluedq-blogfor IAM role and keep the remaining options as default. - Choose Run and wait for the job to complete.

It will take a few minutes to complete.
- When the job is complete, navigate to the Data quality tab and locate the Data quality results section.
You can confirm if the job completed successfully and which data quality rules it passed. In this example, it indicates that 60–70% of EmployeeNumber from the employees table are present in the customers table.

You can identify which records failed the referential integrity using AWS Glue Studio. To learn more, refer to Getting started with AWS Glue Data Quality for ETL Pipelines.
Similarly, if you are checking if all the EmployeeNumber from the employees table are present in the customers table, you can pass the following rule:
DatasetMatch
DatasetMatch compares two datasets to identify differences and similarities. You can use it to detect changes between datasets or to find duplicates, missing values, or inconsistencies across datasets.
- On the AWS Glue console, choose Visual ETL under ETL jobs in the navigation pane.
- In AWS Glue Studio, select Visual with a blank canvas.
- Provide a name for your job; for example,
RDS DatasetMatch. - Choose the plus sign in the AWS Glue Studio canvas and on the Data tab, choose AWS Glue Data Catalog.
- For Name, enter a name for your data source; for example,
rds_employees_primary. - For Database, choose
mysql_private_classicmodels. - For Table, choose
mysql_classicmodels_employees. - Choose the plus sign in the AWS Glue Studio canvas and on the Data tab, choose AWS Glue Data Catalog.
- For Name, enter a name for your data source; for example,
s3_employees_reference. - For Database, choose
mysql_s3_db. - For Table, choose
s3_employees. - Choose the plus sign in the AWS Glue Studio canvas and on the Transform tab, choose Evaluate Data Quality.
- For Node parents, choose
employeesandcustomers. - For Aliases for referenced data source, select Primary source for
rds_employees_primaryand fors3_employees_reference, enter the aliasreference.

- Replace the default example rules with the following code and keep the remaining options as default:
- On the Job details tab, choose
GlueServiceRole-for-gluedq-blogfor IAM role and keep the remaining options as default. - Choose Run and wait for the job to complete.
- When the job is complete, navigate to the Data quality tab and locate the Data quality results section.

In this example, it indicates both datasets are identical.

AggregateMatch
AggregateMatch verifies the accuracy of aggregated data. It compares the aggregated values in a dataset against the expected results to identify any discrepancies, such as incorrect sums, averages, counts, or other aggregate calculations. This is a performant option to evaluate if two datasets match at an aggregate level. For this rule, we clone the previous job we created for DatasetMatch.
- On the AWS Glue console, choose Visual ETL under ETL jobs in the navigation pane.
- Select
RDS DatasetMatchand on the Actions menu, choose Clone job.

- Change the job name to
DQ AggregateMatch. - Change the dataset
rds_employees_primaryto rds_products_primary and the table tomysql_classicmodels_products. - Change the dataset
s3_orders_referencetos3_products_referenceand the table tos3_products. - Choose Evaluate Data Quality, and under Node parents, choose
rds_products_primaryands3_products_reference. - Replace the rules with the following code:

- Choose Run and wait for the job to complete.
- When the job is complete, navigate to the Data quality tab and locate the Data quality results section.


The results indicate that the avg(msrp) on both datasets is the same.

RowCountMatch
RowCountMatch checks the number of rows in a dataset and compares it to an expected count. It helps identify missing or extra rows in a dataset, ensuring data completeness. For this rule, we edit the job we created earlier for AggregateMatch.
- On the AWS Glue console, choose Visual ETL under ETL jobs in the navigation pane.
- Select RDS
AggregateMatchand on the Actions menu, choose Edit job.

- Choose Evaluate Data Quality and choose the plus sign next to
RowCountMatch.

- Keep the default data quality rules and choose Save:
RowCountMatch "reference" = 1.0
- Choose Run and wait for the job to complete.
- When the job is complete, navigate to the Data quality tab and locate the Data quality results section.


It shows that the DQ RowCountMatch rule failed, indicating a mismatch between the row count of the source RDS table and the target S3 table. Further investigation reveals that the ETL job ran four times for the Products table, and the row counts didn’t match.
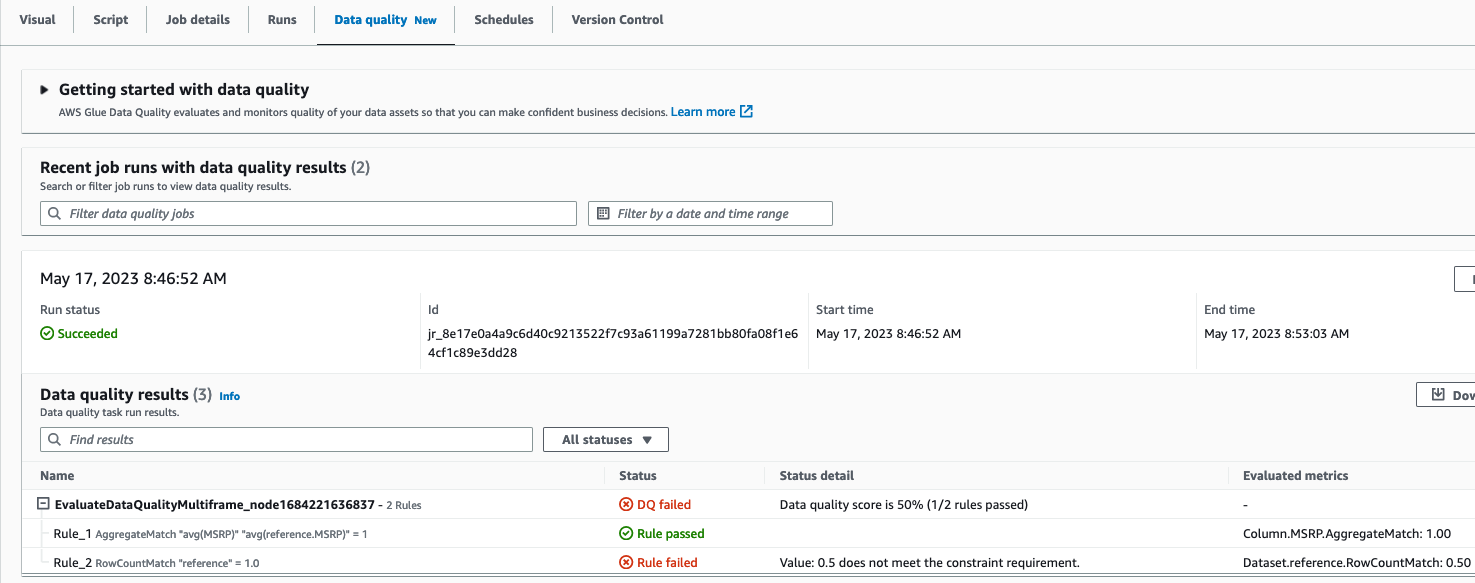
SchemaMatch
SchemaMatch validates the schema of two datasets matches. It checks if the actual data types match the expected data types and flags any inconsistencies, such as a numeric column containing non-numeric values. For this rule, we edit the job we used for AggregateMatch.
- On the AWS Glue console, choose Visual ETL under ETL jobs in the navigation pane.
- Select
RDS AggregateMatchand on the Actions menu, choose Edit job.

- Choose Evaluate Data Quality and choose the plus sign next to
RowCountMatch. - Update the default rules with the following code and save the job:

- Choose Run and wait for the job to complete.
- When the job is complete, navigate to the Data quality tab and locate the Data quality results section.


It should show a successful completion with a Rule passed status, indicating that the schemas of both datasets are identical.

Evaluate the advanced data quality rules in the Data Catalog
The AWS Glue Data Catalog also supports advanced data quality rules. For this post, we show one example of an aggregate match between Amazon S3 and Amazon RDS.
- On the AWS Glue console, choose Databases in the navigation pane.
- Choose the
mysql_private_classicmodelsdatabase to view the three tables created under it. - Choose the
mysql_classicmodels_productstable. - On the Data quality tab, choose Create data quality rules.

- Search for
AggregateMatchand choose the plus sign to view the default example rule. - Add the following rules:

reference is the alias of the secondary dataset defined in the AWS Glue ETL job. For the Data Catalog, you can use <database_name>.<table_name>.<column_name> to reference secondary datasets.
- Choose Save ruleset and provide the name
production_catalog_dq_check. - Choose
GlueServiceRole-for-gluedq-blogfor IAM role and keep the remaining options as default. - Choose Run and wait for the data quality check to complete.
When the job is complete, you can confirm that both data quality checks passed.

With these advanced data quality features of AWS Glue Data Quality, you can enhance the reliability, accuracy, and consistency of your data, leading to better insights and decision-making.
Clean up
To clean up your resources, complete the following steps:
- Delete the AWS Glue job.
- Delete the CloudFormation stack.
Conclusion
Data quality refers to the accuracy, completeness, consistency, timeliness, and validity of the information being collected, processed, and analyzed. High-quality data is essential for businesses to make informed decisions, gain valuable insights, and maintain their competitive advantage. As data complexity increases, advanced rules are critical to handle complex data quality challenges. The rules we demonstrated in this post can help you manage the quality of data that lives in disparate data sources, providing you the capabilities to reconcile them. Try them out and provide your feedback on what other use cases you need to solve!
About the authors
 Navnit Shukla is AWS Specialist Solutions Architect in Analytics. He is passionate about helping customers uncover insights from their data. He builds solutions to help organizations make data-driven decisions.
 Rahul Sharma is a Software Development Engineer at AWS Glue. He focuses on building distributed systems to support features in AWS Glue. He has a passion for helping customers build data management solutions on the AWS Cloud.
Edward Cho is a Software Development Engineer at AWS Glue. He has contributed to the AWS Glue Data Quality feature as well as the underlying open-source project Deequ.
 Shriya Vanvari is a Software Developer Engineer in AWS Glue. She is passionate about learning how to build efficient and scalable systems to provide better experience for customers. Outside of work, she enjoys reading and chasing sunsets.
Getting started with AWS Glue Data Quality from the AWS Glue Data Catalog
Post Syndicated from Stuti Deshpande original https://aws.amazon.com/blogs/big-data/getting-started-with-aws-glue-data-quality-from-the-aws-glue-data-catalog/
AWS Glue is a serverless data integration service that makes it simple to discover, prepare, and combine data for analytics, machine learning (ML), and application development. You can use AWS Glue to create, run, and monitor data integration and ETL (extract, transform, and load) pipelines and catalog your assets across multiple data stores.
Hundreds of thousands of customers use data lakes for analytics and ML to make data-driven business decisions. Data consumers lose trust in data if it isn’t accurate and recent, making data quality essential for undertaking optimal and correct decisions.
Evaluation of the accuracy and freshness of data is a common task for engineers. Currently, various tools are available to evaluate data quality. However, these tools often require manual processes of data discovery and expertise in data engineering and coding.
AWS Glue Data Quality is a new feature of AWS Glue that measures and monitors the data quality of Amazon Simple Storage Service (Amazon S3)-based data lakes, data warehouses, and other data repositories. AWS Glue Data Quality can be accessed in the AWS Glue Data Catalog and in AWS Glue ETL jobs.
This is Part 1 of a five-part series of posts to explain how AWS Glue Data Quality works. Check out the next posts in the series:
- Part 1: Getting started with AWS Glue Data Quality from the AWS Glue Data Catalog
- Part 2: Getting started with AWS Glue Data Quality for ETL Pipelines
- Part 3: Set up data quality rules across multiple datasets using AWS Glue Data Quality
- Part 4: Set up alerts and orchestrate data quality rules with AWS Glue Data Quality
- Part 5: Visualize data quality score and metrics generated by AWS Glue Data Quality
In this post, we explore using the AWS Glue Data Quality feature by generating data quality recommendations and running data quality evaluations on your table in the Data Catalog. Then we demonstrate how to analyze your AWS Glue Data Quality run results through Amazon Athena.
Solution overview
We guide you through the following steps:
- Provision resources with AWS CloudFormation.
- Explore the generated recommendation rulesets and define rulesets to evaluate your table in the Data Catalog.
- Review the AWS Glue Data Quality recommendations.
- Analyze your AWS Glue Data Quality evaluation results with Athena.
- Operationalize the solution by setting up alerts and notifications using integration with Amazon EventBridge and Amazon Simple Notification Service (Amazon SNS).
For this post, we use the NYC Taxi dataset yellow_tripdata_2022-01.parquet.
Set up resources with AWS CloudFormation
The provided CloudFormation template creates the following resources for you:
- The AWS Identity and Access Management (IAM) role required to run AWS Glue Data Quality evaluations
- An S3 bucket to store the NYC Taxi dataset
- An S3 bucket to store and analyze the results of AWS Glue Data Quality evaluations
- An AWS Glue database and table created from the NYC Taxi dataset
Launch your CloudFormation stack
To create your resources for this use case, complete the following steps:
- Launch your CloudFormation stack in
us-east-1:
- Under Parameters:
- For Stack name, proceed with the default value
myDQStack. - For DataQualityDatabase, proceed with the default value
data_quality_catalog. - For DataQualityS3BucketName, provide a bucket name of your choice.
- For DataQualityTable, proceed with the default value
data_quality_tripdata_table

- For Stack name, proceed with the default value
- Select I acknowledge that AWS CloudFormation might create IAM resources with custom names.
- Choose Create stack.

After the stack is successfully created, you can see all the resources created on the Resources tab.

- Navigate to the S3 bucket created by the stack and upload the yellow_tripdata_2022-01.parquet file.
Explore recommendation rulesets and define rulesets to evaluate your table
In this section, we generate data quality rule recommendations from AWS Glue Data Quality. We use these recommendations to run a data quality task against our dataset to obtain an analysis of our data.
Complete the following steps:
- On the AWS Glue console, under Data Catalog in the navigation pane, choose Tables.
- Choose the
data_quality_tripdata_tabletable created via the CloudFormation stack. - Choose the Data quality tab.
In this section, you will find a video to get you started with AWS Glue Data Quality. It also lists features, pricing, and documentation.
- Choose Create data quality rules.

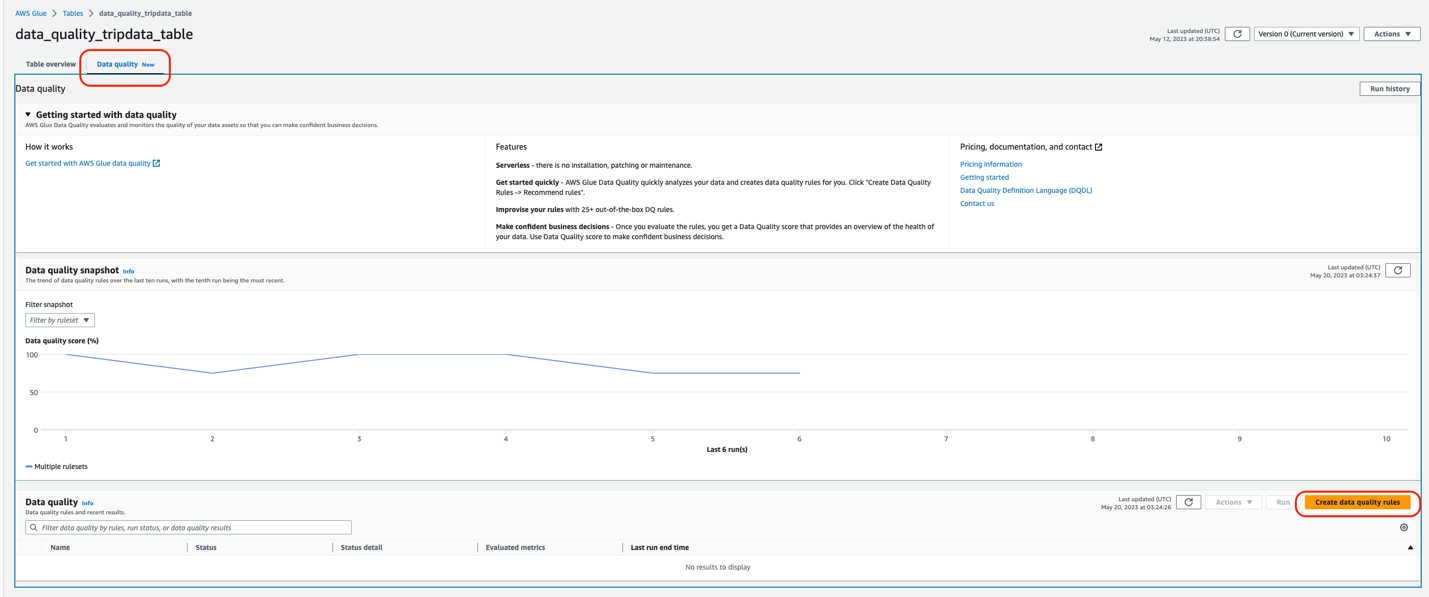
This is the ruleset console. You will find a Request data quality rule recommendations banner at the top. AWS Glue will scan your data and automatically generate rule recommendations.
- Choose Recommend rules.

- For IAM role, choose the IAM role created as part of the Cloud Formation template (
GlueDataQualityBlogRole). - Optionally, you can filter your data before reading on column values. This feature is available for Amazon S3-based data sources.
- For Requested number of workers, allocate the number of workers to run the recommendation task. For this post, we use the default value of 5.
- For Task timeout, set the runtime for this task. For this post, we use the default of 120 minutes.
- Choose Recommend rules.


The recommendation task will start instantly, and you will observe the status on the top changes to Starting.
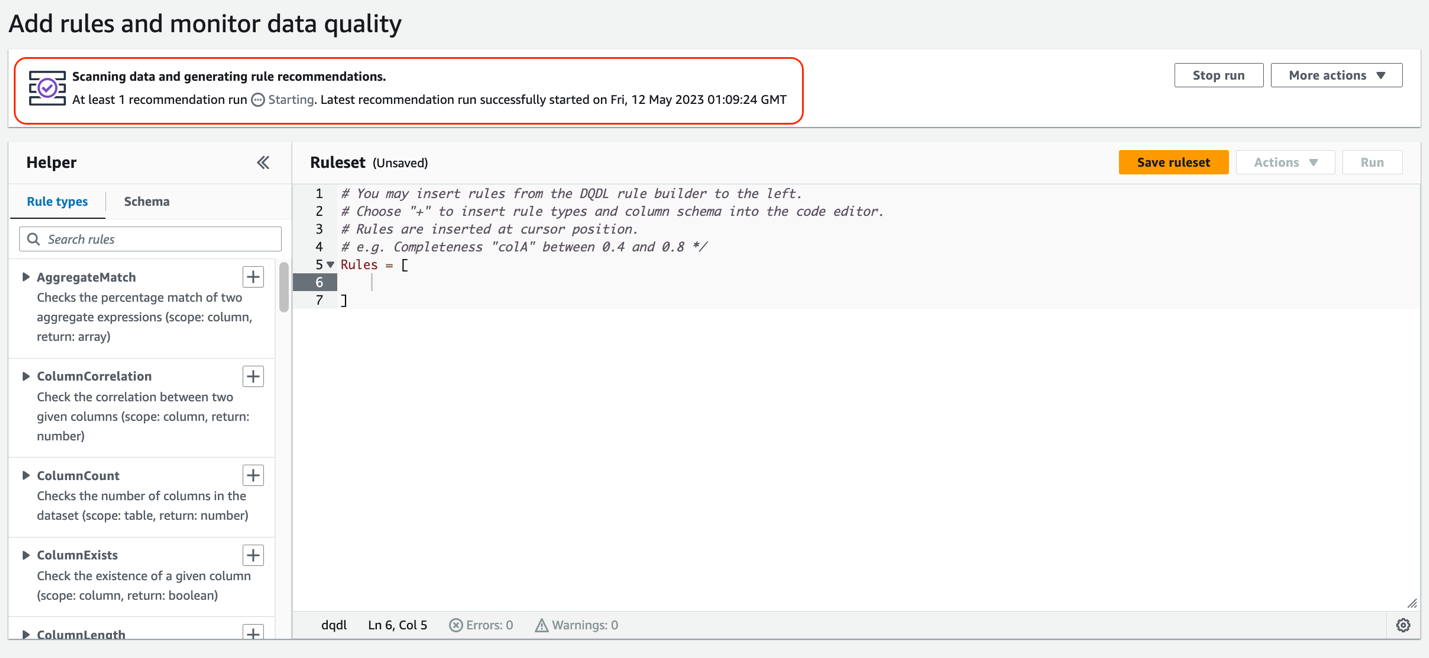
Next, we add some of these recommended rules into our ruleset.
- When you see the recommendation run as Completed, choose Insert rule recommendations to select the rules that are recommended for you.
Make sure to place the cursor inside the brackets Rules = [ ].

- Select the following rules:
ColumnValues “VendorID” <=6Completeness “passenger_count”>=0.97
- Choose Add selected rules.
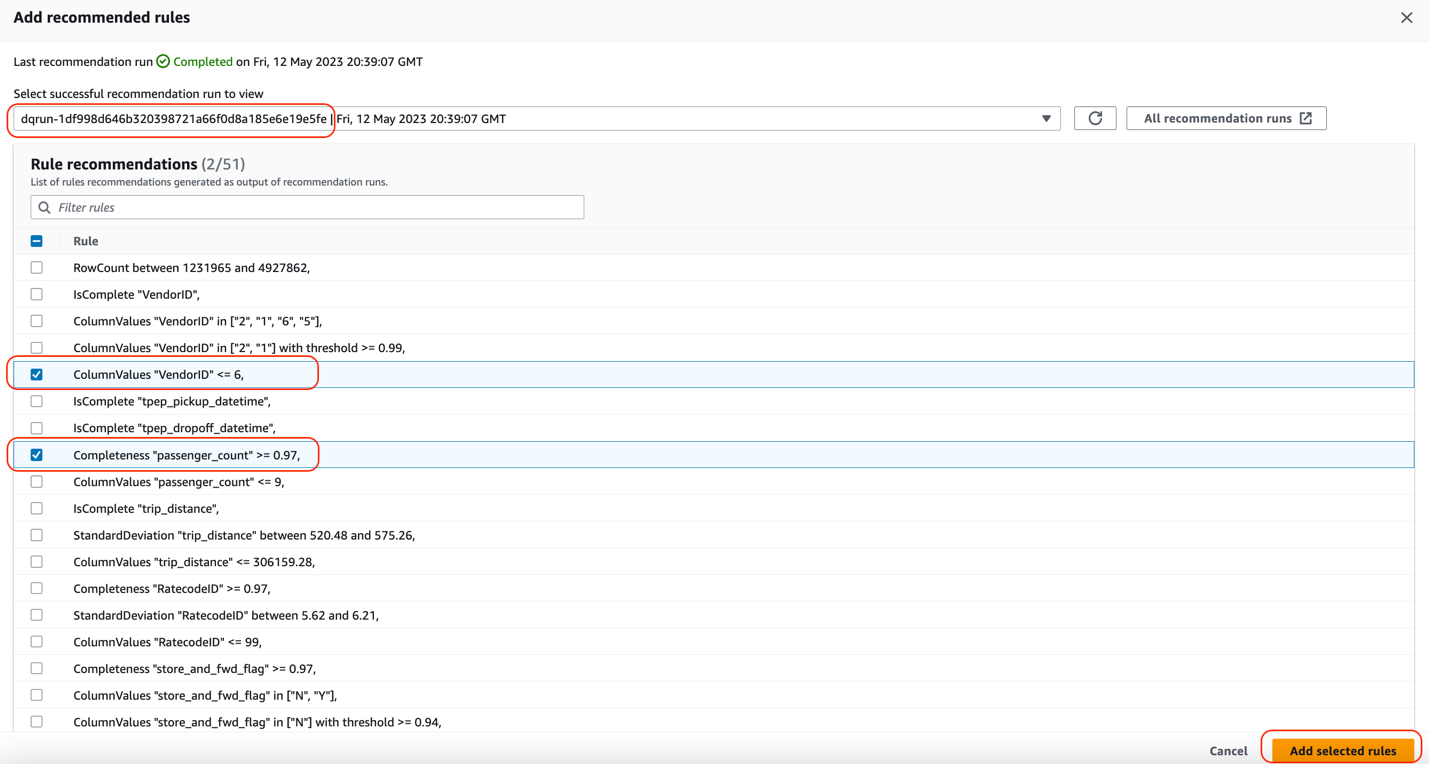
You can see that these rules were automatically added to the ruleset.
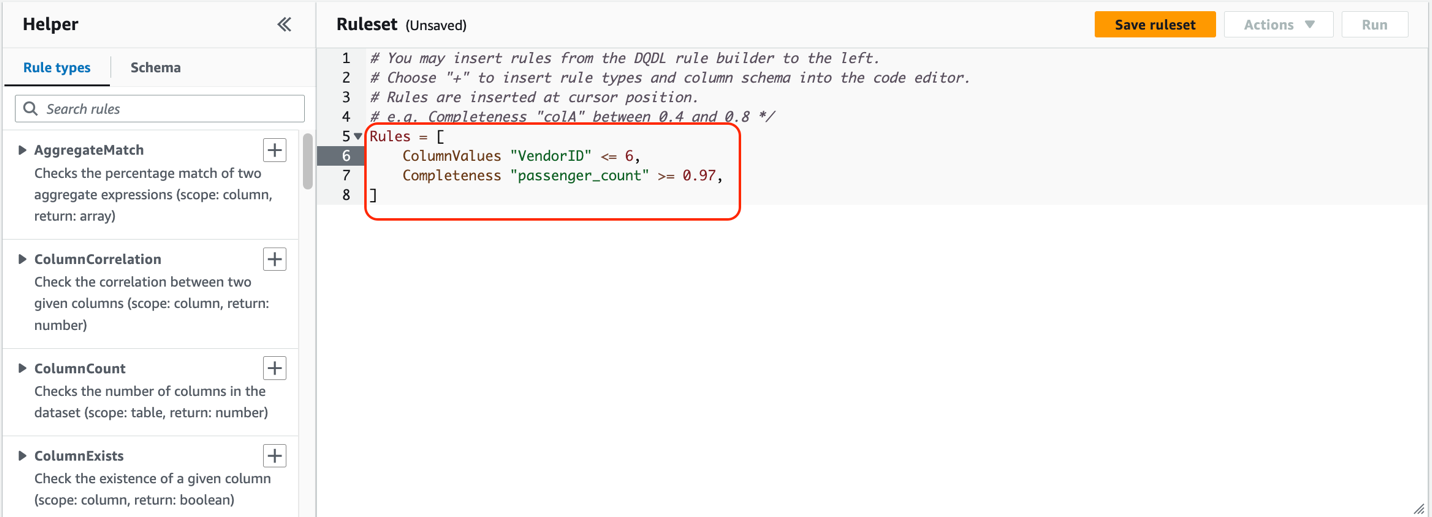
Understanding AWS Glue Data Quality recommendations
AWS Glue Data Quality recommendations are suggestions generated by the AWS Glue Data Quality service and are based on the shape of your data. These recommendations automatically take into account aspects like row counts, mean, standard deviation, and so on, and generate a set of rules for you to use as a starting point.
The dataset used here was the NYC Taxi dataset. Based on this, the columns in this dataset, and the values of those columns, AWS Glue Data Quality recommends a set of rules. In total, the recommendation service automatically took into consideration all the columns of the dataset, and recommended 55 rules.
Some of these rules are:
- ColumnValues “VendorID” <=6 – The
ColumnValuesrule type checks the percentage of complete (non-null) values in a column against a given expression. This rule resolves to true if the rule type response is less than or equal to value 6. - Completeness “passenger_count”>=0.97 – The
Completenessrule type checks the percentage of complete (non-null) values in a column against a given expression. In this case, the rule checks if more than 97% of the values in a column are complete.

In addition to adding auto-generated recommendation rules, we manually add some rules to the ruleset. AWS Glue Data Quality provides some out-of-the-box rule types to choose from. For this post, we manually add the IsComplete rule for VendorID.
- In the left pane, on the Rule types tab, search
IsCompleterule type and choose the plus sign next toIsCompleteto add this rule. - For the value within the quotation marks, enter
VendorID.
Conversely, you could navigate to the Schema tab and add IsComplete to VendorID.
- Choose Save ruleset.


Next, we add a CustomSQL rule by selecting the rule type CustomSql, that validates that there are no fares charged for a trip if there are no passengers. This is to identify if there are any fraudulent transactions for fare_amount > 0 where passenger_count = 0. The rule is:
There are two ways to provide the table name:
- Either you can use the keyword “primary” for the table under consideration
- You can use the full path such as
database_name.table_name
- On the Rule types tab, choose the plus sign next to CustomSQL and enter the SQL statement.

The final ruleset looks like the following screenshot.

- Choose Save ruleset.
- For Ruleset name, enter a name.
- Choose Save ruleset.

- On the ruleset page, choose Run.

- For IAM role¸ choose
GlueDataQualityBlogRole. - Select Publish run metrics to Amazon CloudWatch.
- For Data quality result location, enter the S3 bucket location for the data quality results which is already created for you as part of Cloud Formation template (for this post,
data-quality-tripdata-results). - For Run frequency, choose On demand.

- Expand Additional configurations.
- For Requested number of workers, enter
5. - Leave the remaining fields as is and choose Run.


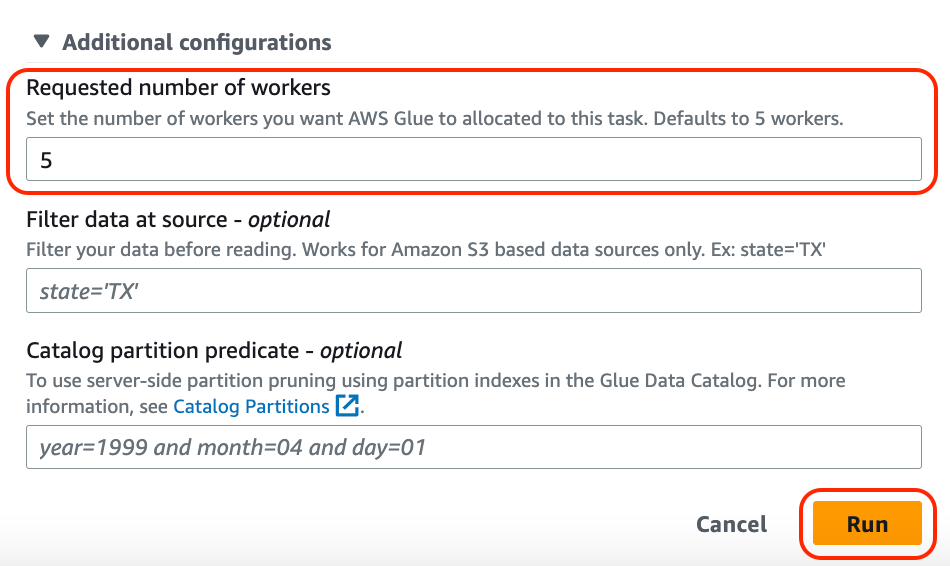
The status changes to Starting.

- When it’s complete, choose the ruleset and choose Run history.
- Choose the run ID to find more about the run details.

Under Data quality result, you will also observe the result shows as DQ passed or DQ failed.

In the Evaluation run details section, you will find all the details about the data quality task run and rules that passed or failed. You can either view these results by navigating to the S3 bucket or downloading the results. Observe that the data quality task failed because one of the rules failed.
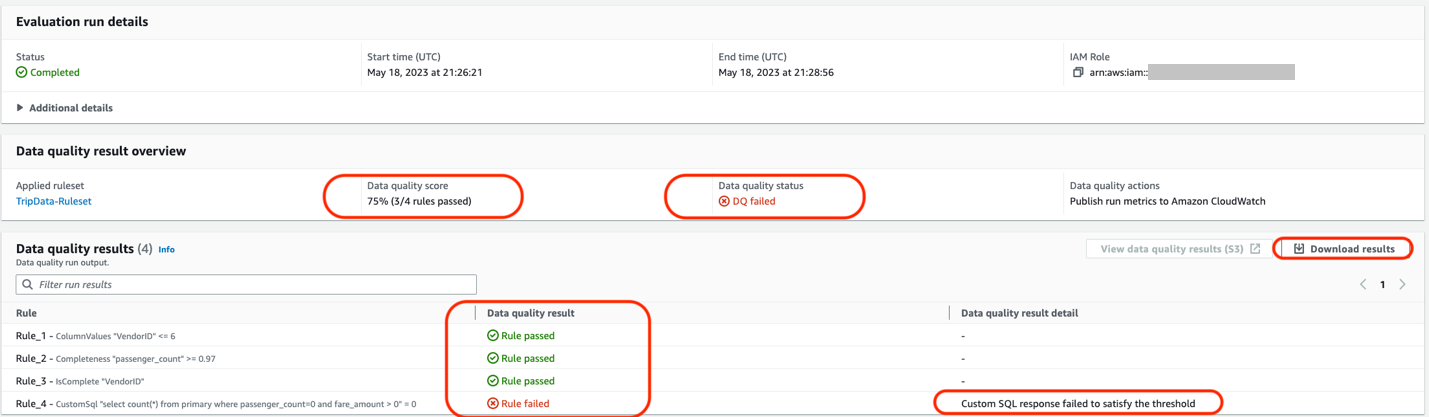
For the first section, AWS Glue Data Quality suggested 51 rules, based on the column values and the data within our NYC Taxi dataset. We selected a few rules out of the 51 rules into a ruleset and ran an AWS Glue Data Quality evaluation task using our ruleset against our dataset. In our results, we see the status of each rule within the run details of the data quality task.
You can also utilize the AWS Glue Data Quality APIs to carry out these steps.
Analyze your AWS Glue Data Quality evaluation results with Athena
If you have multiple AWS Glue Data Quality evaluation results against a dataset, you might want to track the trends of the dataset’s quality over a period of time. To achieve this, we can export our AWS Glue Data Quality evaluation results to Amazon S3, and use Athena to run analytical queries against the exported results. You could further use the results in Amazon QuickSight to build dashboards to have a graphical representation of your data quality trends
In Part 3 of this series, we show the steps needed to start tracking data on your dataset’s quality.
For our data quality runs that we set up in the previous sections, we set the Data quality results location parameter to the bucket location specified by the CloudFormation stack. After each successful run, you should see a Parquet format file that contains a single JSONL file being exported to your selected S3 location, corresponding to that particular run.
Complete the following steps to analyze the data:
- Navigate to Amazon Athena and on the console, navigate to Query Editor.
- Run the following CREATE TABLE statement (replace the <my_table_name> with a relevant value of your choice and <GlueDataQualityResultsS3Bucket_from_cfn> with the S3 bucket name to store data-quality results; the bucket name will have trailing keyword
results, for example <given-name-results>. For this post, it isdata-quality-tripdata-results.
After you create the table, you should be able to run queries to analyze your data quality results.
For example, consider the following query that shows the passed AWS Glue Data Quality evaluations against the table data_quality_tripdata_table within a certain time window. You can select the datetime values from the data quality results table (that you created above) <my_table_name> from the columns evaluationcompletedon to specify values for parse_datetime() within a certain duration in the following query:
The output of the preceding query shows us details about all the runs with “outcome” = ‘Passed’ that ran against the NYC Taxi dataset table (“tablename” = ‘data_quality_tripdata_table’). The output also provides details about the rules passed and evaluated metrics.
As you can see, we are able to get detailed information about our AWS Glue Data Quality evaluations via the results uploaded to Amazon S3 and perform more detailed analysis.
Set up alerts and notifications using EventBridge and Amazon SNS
Alerts and notifications are important for data quality to enable timely and effective responses to data quality issues that arise in the dataset. By setting up alerts and notifications, you can proactively monitor the data quality and be alerted as soon as any data quality issues are detected. This reduces the risk of making decisions based on incorrect information.
AWS Glue Data Quality also offers integration with EventBridge for alerting and notification by triggering an AWS Lambda function that sends a customized SNS notification when the AWS Glue Data Quality ruleset evaluation is complete. Now you can receive event-driven alerts and email notifications via Amazon SNS. This integration significantly enhances the accuracy and reliability of data.
Clean up
To clean up your resources, complete the following steps:
- On the Athena console, delete the table created for data quality analysis.
- On the CloudWatch console, delete the alarms created.
- If you deployed the sample CloudFormation stack, delete the stack via the AWS CloudFormation console. You will need to empty the S3 bucket before you delete the bucket.
- If you enabled your AWS Glue Data Quality runs to output to Amazon S3, empty those buckets as well.
Conclusion
In this post, we talked about the ease and speed of incorporating data quality rules using AWS Glue Data Quality into your Data Catalog tables. We also talked about how to run recommendations and evaluate data quality against your tables. We then discussed analyzing the data quality results via Athena, and discussed integrations with EventBridge and Amazon SNS for alerts and notifications to get notified for data quality issues.
To dive into the AWS Glue Data Quality APIs, refer to Data Quality API documentation. To learn more about AWS Glue Data Quality, check out AWS Glue Data Quality.
About the authors
 Stuti Deshpande is an Analytics Specialist Solutions Architect at AWS. She works with customers around the globe, providing them strategic and architectural guidance on implementing analytics solutions using AWS. She has extensive experience in Big Data, ETL, and Analytics. In her free time, Stuti likes to travel, learn new dance forms, and enjoy quality time with family and friends.
 Aniket Jiddigoudar is a Big Data Architect on the AWS Glue team. He works with customers to help improve their big data workloads. In his spare time, he enjoys trying out new food, playing video games, and kickboxing.
 Joseph Barlan is a Frontend Engineer at AWS Glue. He has over 5 years of experience helping teams build reusable UI components and is passionate about frontend design systems. In his spare time, he enjoys pencil drawing and binge watching tv shows.
 Jesus Max Hernandez is a Software Development Engineer at AWS Glue. He joined the team in August after graduating from The University of Texas at El Paso. Outside of work, you can find him practicing guitar or playing softball in Central Park.
 Divya Gaitonde
is a UX designer at AWS Glue. She has over 8 years of experience driving impact through data-driven products and seamless experiences. Outside of work, you can find her catching up on reading or people watching at a museum.
Deep dive on Amazon MSK tiered storage
Post Syndicated from Nagarjuna Koduru original https://aws.amazon.com/blogs/big-data/deep-dive-on-amazon-msk-tiered-storage/
In the first post of the series, we described some core concepts of Apache Kafka cluster sizing, the best practices for optimizing the performance, and the cost of your Kafka workload.
This post explains how the underlying infrastructure affects Kafka performance when you use Amazon Managed Streaming for Apache Kafka (Amazon MSK) tiered storage. We delve deep into the core components of Amazon MSK tiered storage and address questions such as: How does read and write work in a tiered storage-enabled cluster?
In the subsequent post, we’ll discuss the latency impact, recommended metrics to monitor, and conclude with guidance on key considerations in a production tiered storage-enabled cluster.
How Amazon MSK tiered storage works
To understand the internal architecture of Amazon MSK tiered storage, let’s first discuss some fundamentals of Kafka topics, partitions, and how read and write works.
A logical stream of data in Kafka is referred to as a topic. A topic is broken down into partitions, which are physical entities used to distribute load across multiple server instances (brokers) that serve reads and writes.
A partition––also designated as topic-partition as it’s relative to a given topic––can be replicated, which means there are several copies of the data in the group of brokers forming a cluster. Each copy is called a replica or a log. One of these replicas, called the leader, serves as the reference. It’s where the ingress traffic is accepted for the topic-partition.
A log is an append-only sequence of log segments. Log segments contain Kafka data records, which are added to the end of the log or the active segment.
Log segments are stored as regular files. On the file system, Kafka identifies the file of a log segment by putting the offset of the first data record it contains in its file name. The offset of a record is simply a monotonic index assigned to a record by Kafka when it’s appended to the log. The segment files of a log are stored in a directory dedicated to the associated topic-partition.
When Kafka reads data from an arbitrary offset, it first looks up the segment that contains that offset from the segment file name, then the specific record location inside that file using an offset index. Offset indexes are materialized on a dedicated file stored with segment files in the topic-partition directory. There is also timeindex to seek by timestamp.
For every partition, Kafka also stores a journal of leadership changes in a file called leader-epoch-checkpoint. This file contains mapping of leader epoch to startOffset of the epoch. Whenever a new leader is elected for a partition by the Kafka controller, this data is updated and propagated to all brokers. A leader epoch is a 32-bit, monotonically increasing number representing continuous period of leadership of a single partition. It’s marked on all the Kafka records. The following code is the local storage layout of topic cars and partition 0 containing two segments (0, 35):
Kafka manages the lifecycle of these segment files. It creates a new one when a new segment needs to be created, for instance, if the current segment reaches its configured max size. It deletes one when the target retention period of the data it contains is reached, or the total maximal size of the log is reached. Data is deleted from the tail of the logs and corresponds to the oldest data of the append-only log of the topic-partition.

KIP-405 or tiered storage in Apache Kafka
The ability to tier data, in other words, transfer data (log, index, timeindex, and leader-epoch-checkpoint) from a local file system to another storage system based on time and size-based retention policies, is a feature built in Apache Kafka as part of KIP-405.
The KIP-405 isn’t in official Kafka version yet. Amazon MSK internally implemented tiered storage functionality on top of official Kafka version 2.8.2. Amazon MSK exposes this functionality on AWS specific 2.8.2.tiered Kafka version. With this feature, you can separate retention settings for local and remote retention. Data in the local tier is retained until the data gets copied to the remote tier even after the local retention expires. Data in the remote tier is retained until the remote retention expires. KIP-405 proposes a pluggable architecture allowing you to plugin custom remote storage and metadata storage backends. The following diagram illustrates the broker three key components.
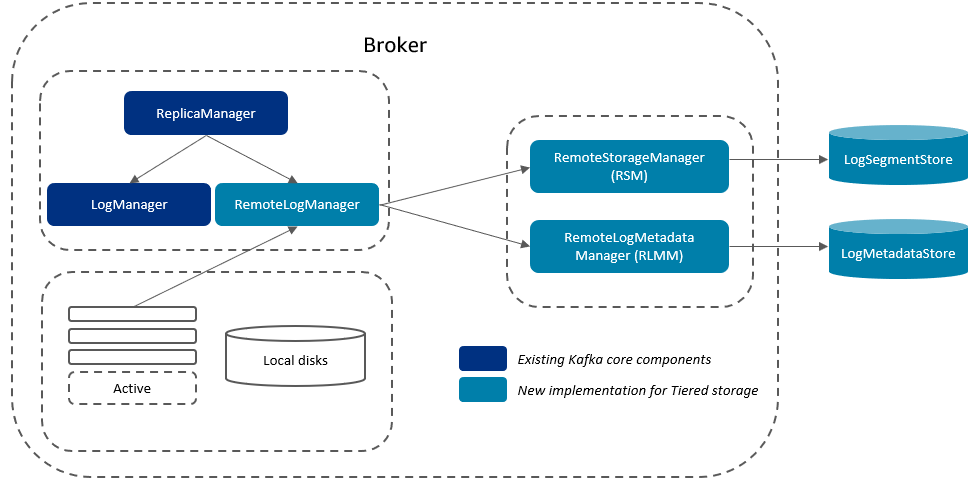
The components are as follows:
- RemoteLogManager (RLM) – A new component corresponding to LogManager for the local tier. It delegates copy, fetch, and delete of completed and non-active partition segments to a pluggable RemoteStorageManager implementation and maintains respective remote log segment metadata through pluggable RemoteLogMetadataManager implementation.
- RemoteStorageManager (RSM) – A pluggable interface that provides the lifecycle of remote log segments.
- RemoteLogMetadataManager (RLMM) – A pluggable interface that provides the lifecycle of metadata about remote log segments.
How data is moved to the remote tier for a tiered storage-enabled topic
In a tiered storage-enabled topic, each completed segment for a topic-partition triggers the leader of the partition to copy the data to the remote storage tier. The completed log segment is removed from the local disks when Amazon MSK finishes moving that log segment to the remote tier and after it meets the local retention policy. This frees up local storage space.
Let’s consider a hypothetical scenario: you have a topic with one partition. Prior to enabling tiered storage for this topic, there are three log segments. One of the segments is active and receiving data, and the other two segments are complete.
After you enable tiered storage for this topic with two days of local retention and five days of overall retention, Amazon MSK copies log segment 1 and 2 to tiered storage. Amazon MSK also retains the primary storage copy of segments 1 and 2. The active segment 3 isn’t eligible to copy over to tiered storage yet. In this timeline, none of the retention settings are applied yet for any of the messages in segment 1 and segment 2.
After 2 days, the primary retention settings take effect for the segment 1 and segment 2 that Amazon MSK copied to the tiered storage. Segments 1 and 2 now expire from the local storage. Active segment 3 is neither eligible for expiration nor eligible to copy over to tiered storage yet because it’s an active segment.
After 5 days, overall retention settings take effect, and Amazon MSK clears log segments 1 and 2 from tiered storage. Segment 3 is neither eligible for expiration nor eligible to copy over to tiered storage yet because it’s active.
That’s how the data lifecycle works on a tiered storage-enabled cluster.

Amazon MSK immediately starts moving data to tiered storage as soon as a segment is closed. The local disks are freed up when Amazon MSK finishes moving that log segment to remote tier and after it meets the local retention policy.
How read works in a tiered storage-enabled topic
For any read request, ReplicaManager tries to process the request by sending it to ReadFromLocalLog. And if the process returns offset out of range exception, it delegates the read call to RemoteLogManager to read from tiered storage. On the read path, the RemoteStorageManager starts fetching the data in chunks from remote storage, which means that for the first few bytes, your consumer experiences higher latency, but as the system starts buffering the segment locally, your consumer experiences latency similar to reading from local storage. One of the advantages of this approach is that the data is served instantly from the local buffer if there are multiple consumers reading from the same segment.
If your consumer is configured to read from the closest replica, there might be a possibility that the consumer from a different consumer group reads the same remote segment using a different broker. In that case, they experience the same latency behavior we described previously.
Conclusion
In this post, we discussed the core components of the Amazon MSK tiered storage feature and explained how the data lifecycle works in a cluster enabled with tiered storage. Stay tuned for our upcoming post, in which we delve into the best practices for sizing and running a tiered storage-enabled cluster in production.
We would love to hear how you’re building your real-time data streaming applications today. If you’re just getting started with Amazon MSK tiered storage, we recommend getting hands-on with the guidelines available in the tiered storage documentation.
If you have any questions or feedback, please leave them in the comments section.
About the authors
 Nagarjuna Koduru is a Principal Engineer in AWS, currently working for AWS Managed Streaming For Kafka (MSK). He led the teams that built MSK Serverless and MSK Tiered storage products. He previously led the team in Amazon JustWalkOut (JWO) that is responsible for realtime tracking of shopper locations in the store. He played pivotal role in scaling the stateful stream processing infrastructure to support larger store formats and reducing the overall cost of the system. He has keen interest in stream processing, messaging and distributed storage infrastructure.
 Masudur Rahaman Sayem is a Streaming Data Architect at AWS. He works with AWS customers globally to design and build data streaming architectures to solve real-world business problems. He specializes in optimizing solutions that use streaming data services and NoSQL. Sayem is very passionate about distributed computing.
How SumUp made digital analytics more accessible using AWS Glue
Post Syndicated from Mira Daniels original https://aws.amazon.com/blogs/big-data/how-sumup-made-digital-analytics-more-accessible-using-aws-glue/
This is a guest blog post by Mira Daniels and Sean Whitfield from SumUp.
SumUp is a leading global financial technology company driven by the purpose of leveling the playing field for small businesses. Founded in 2012, SumUp is the financial partner for more than 4 million small merchants in over 35 markets worldwide, helping them start, run and grow their business. Through its Super App, SumUp provides merchants with a free business account and card, an online store, and an invoicing solution – as well as in-person and remote payments seamlessly integrated with SumUp’s card terminals and point-of-sale registers. For more information, please visit sumup.co.uk.
As most organizations, that have turned to Google Analytics (GA) as a digital analytics solution, mature they discover a more pressing need to integrate this data silo with the rest of their organization’s data to enable better analytics and resulting product development and fraud detection. Unless, of course, the rest of their data also resides in the Google Cloud. In this post we showcase how we used AWS Glue to move siloed digital analytics data, with inconsistent arrival times, to AWS S3 (our Data Lake) and our central data warehouse (DWH), Snowflake. AWS Glue gave us a cost-efficient option to migrate the data and we further optimized storage cost by pruning cold data. What was essential to the solution development was a good understanding of the nature of the data, the source of it (export from GA) as well as the form and scope of the data useful to the data consumers.
Business context
At SumUp we use GA and Firebase as our digital analytics solutions and AWS as our main Cloud Provider. In order to mature our data marts, it became clear that we needed to provide Analysts and other data consumers with all tracked digital analytics data in our DWH as they depend on it for analyses, reporting, campaign evaluation, product development and A/B testing. We further use the Digital Analytics data for our reverse ETL pipelines that ingest merchant behavior data back into the Ad tools. As the SumUp merchants user journey only starts onsite (with a Sign up or product purchase), but extends to offline card reader transactions or usage of our products from within our app and web dashboard, it is important to combine Digital Analytics data with other (backend) data sources in our Data Lake or DWH. The Data Science teams also use this data for churn prediction and CLTV modeling.
Given that the only source to access all raw data is by exporting it to BigQuery (first), data accessibility becomes challenging if BigQuery isn’t your DWH solution. What we needed was a data pipeline from BigQuery to our Data Lake and the DWH. The pipeline further needed to run based on the trigger of new data arriving in BigQuery and could not run on a simple schedule as data would not arrive at the same time consistently.
We experimented with some no-code tools that allowed for the direct export of Google Analytics data (not available for Firebase) from BigQuery directly to Snowflake, but due to our growing data volume, this wasn’t financially scalable. Other no-code tools, even if they can move data to S3, did not meet our technical requirements. The solutions we experimented with did not give us the flexibility to monitor and scale resources per pipeline run and optimize the pipeline ourselves.
We had a solid business case to build our own internal digital analytics pipeline to not only reduce spending on our existing outsourced Google Analytics pipeline (that moved from BigQuery to Snowflake directly), but also to make GA and Firebase data available in both the Data Lake and DWH.
Technical challenges
Data source specifics: The data in BigQuery is the export of GA 360 data and Firebase Analytics data. It consists of full-day and intraday tables. BigQuery uses a columnar storage format that can efficiently query semi-structured data, in the case of GA and Firebase data as arrays of structs.
Full-day: Daily tables that do not change retroactively for GA data, but for Firebase data
Intraday: Until the daily tables (full-day are created the intraday tables are populated with new and corrected records.
Update interval: intraday is refreshed and overwritten at least 3x a day. When the full-day table is created, the intraday table from that day is deleted.
Since we started exporting GA tracking data to BigQuery in 2015 the amount of data tracked and stored has grown 70x (logical bytes) and is >3TB in total. Our solution needs not only be able to ingest new data but also backfill historical data from the last 7 years. Firebase data has been exported to BigQuery since 2019 and grew 10x in size (logical bytes) over time.
Our major challenge with ingesting Firebase data to the DWH was the combination of its size (historically >35TB) with the arrival of late data upstream. Since BigQuery processes hits with timestamps up to 72 hours earlier for Firebase data, historical data must be updated for each daily run of the pipeline for the last 3 days. Consequently, this greatly increases compute and storage resources required for the pipeline.
The intraday source data usually arrives every 2-4 hours so real-time downstream pipelines are currently not needed with our GA and Firebase data export (into BigQuery) setup.
Querying the dataset (containing nested and repeated fields) in Snowflake presented an accessibility problem for our users, as it required unfriendly verbose query syntax and greatly strained our compute resources. We used AWS Glue to run a UDF to transform this nested data into a Snowflake object (key-value) data structure that is both more user friendly and requires less compute resources to access.
Regarding version control of the Glue script, our team wanted to contain all of the pipeline logic in the same repository for simplicity and ease of local development. Since we used MWAA for orchestrating our platform pipelines, we wanted our DAG code to be close to the Glue Script. This required us to add an initial first step in our pipeline to push the script to the respective bucket that AWS Glue is synced with.
Our ELT design pattern required that we overwrite/update data stored in S3 before loading it into snowflake which required us to use a Spark DF.
In order to save on Snowflake storage costs, we decided to only keep hot data in a materialised table and have access to colder historical data through external tables.
Solution overview
We chose AWS Glue for the first step in the pipeline (moving data to S3) as it nicely integrates into our serverless AWS infrastructure and Pyspark makes it very flexible to script transformation steps and add partitions to the data storage in S3. It already provided a connector to BigQuery that was easy to configure and the complete Glue job was nicely abstracting the underlying system infrastructure.

We used the existing Google BigQuery Connector for Glue following parts of this blog post.
Ingestion
The code for the ingestion pipeline was set up in a way that it is easily extendable and reusable by splitting jobs/tasks in different methods and classes building a framework for all (future) ingestions from BigQuery to Snowflake.
Initialise Glue Job: Firstly, we push the glue script to S3 as the boto3 client expects it to be there for job execution. We then check if the glue job already exists. If it doesn’t exist, it’s created, otherwise it is updated with the most recent job parameters. We made sure to add appropriate tags for cost monitoring.
Pull From Google Cloud Platform: Based on the data source, GA or Firebase, we pick dynamic (or hard coded for backfilling) days to be pulled from the source. We then check if those selected dates exist as sharded tables in BigQuery, in case the data is late we cannot pull it and will wait to try again a few minutes later (using a generous retry schedule). If the dates we chose to be ingested can be found in BigQuery we run the Glue job.
Dump to S3: Some transformation steps are carried out within the Glue job before the data is moved into S3. It is saved in day-partitioned folders and repartitioned into 300-500MB files for better table query performance in Snowflake.
Data Catalog: We also wanted to automate a Glue Crawler to have metadata in a Data Catalog and be able to explore our files in S3 with Athena. With the help of the boto3 library, our pipeline contains a step which runs the crawler at the end of the pipeline. In order to simplify schema evolution, we moved the Data Catalog creation out of the Glue script.
DWH: The solution loading the data to Snowflake consists of tasks that are scheduled to access storage integrations with S3 and materialise the data in Snowflake tables. The jobs are batch jobs, we haven’t tested any streaming solutions as the data arrives batched in BigQuery. After loading new data into Snowflake we use a table pruner function that deletes the respective days that fall outside of the number of days of retention we defined for the table. This way we make sure to provide the data timeframe used by our stakeholders and avoid unnecessary storage costs.
In addition to the materialised tables in Snowflake we use External tables to make more historical data available (at slower query speed), these External tables are refreshed at the end of the data pipeline in Airflow using the Snowflake operator.
Development and Testing: Before the Glue job script was integrated into the task orchestration process and code, we tested the functionality of the job within Glue Studio using the Spark script Editor and Jupyter Notebook. It was great for quick iteration over a new feature. We used boto3 to access AWS infrastructure services and create, update and run the Glue job
Data Quality is ensured on the one hand by deduplicating Firebase events and adding a new hash key within the Glue script and on the other hand by comparing total row counts per day between Snowflake and BigQuery (the comparison is currently done in tableau). We also get alerted if our Airflow pipeline or the Snowflake tasks fail.
In the future we will add Data Quality checks with DBT.
Conclusion
As SumUp expands its product suite through innovation and acquisition, so does its infrastructure. AWS Glue has proven to be a scalable solution to ingest and transform siloed data in different clouds using marketplace connectors and the flexibility provided by pyspark.
What surprised us was how easily Glue can be customized (from no code to highly customised script and execution setup) and fit our volatile source data (size and shape). In the future we can think of further customization of the Glue script in terms of transformation of the data (more useful unnesting) as well as Glue job resource optimization.
The consumers of Digital Analytics data appreciate being able to make use of the full source data schema in both Data Lake and DWH. The transparency around the process being managed by the central Data Platform team facilitates trust and reliance on the data. Through pipeline abstraction, we’re now able to provide data products in high demand to all our data consumers.
The pipeline framework we built can easily be extended if needed as its components were built separately and are only forming the final pipeline during the last step, the orchestration.
What we plan to test and optimize in the future is loading historical data in automated batch jobs which is dependent on both API limits on the source side and compute resource orchestration on Glue’s side (we did not test automated batching in the past and were manually chunking data into jobs for backfilling). Additionally, we will incorporate these pipeline features into our main ingestion framework, which would allow our stakeholders to define digital analytics pipelines themselves in a self-service manner.
If your organization faces similar challenges with digital analytics data silos, we recommend developing a proof of concept to migrate your data to S3 using the Google BigQuery Connector for Glue and this blog post. Experiment with the Glue job settings and PySpark script options to find the best match for the size and latency requirements of your data. For migrating to a DWH like Snowflake, leverage COPY INTO statements as they are a cheaper alternative to Snowpipes for this volume of data. Once you have prototyped, develop a proper well tested solution with Amazon Managed Workflows for Apache Airflow MWAA that includes version control for the infrastructure and the pipeline logic.
About the Authors
 Mira Daniels (Data Engineer in Data Platform team), recently moved from Data Analytics to Data Engineering to make quality data more easily accessible for data consumers. She has been focusing on Digital Analytics and marketing data in the past.
 Sean Whitfield (Senior Data Engineer in Data Platform team), a data enthusiast with a life science background who pursued his passion for data analysis into the realm of IT. His expertise lies in building robust data engineering and self-service tools. He also has a fervor for sharing his knowledge with others and mentoring aspiring data professionals.
Comic for 2023.06.06 – FBI
Post Syndicated from Explosm.net original https://explosm.net/comics/fbi
New Cyanide and Happiness Comic