Като че ли най-старото арабско специализирано кулинарно съчинение на което съм се натъквал, е това на Ибн Саяр ал-Уарак от X век. Живее в Ирак, и то във време, близко до Ал-Джахиз. В съчинението откриваме раздели за напитки, хляб, сосове, млечни продукти, десерти, основни ястия, мазнини, плодове и ядки, подправки, кухненски прибори, месо, птици, риби, насекоми, медицински термини (болести), лекарства, химикали, минерали, поддържане на чистотата и зеленчуци. Храната се мисли като свързана с по-широките сфери на хигиената, козметиката и в крайна сметка на медицината, силно повлияна от хуморалната теория на античния Гален.
Откъде иначе човек може да научи по лесен начин кулинарни понятия като „тлъста овча опашка“ (аля), вино от фурми (дази), махмурлук (хумар), сироп от розови листенца (джаланджабин) или че краченцата с копитцата се обозначават като „краища, крайченца“ (атраф), използвано също и за ушите, езика, зурлата? Човек наистина се потопява в начина на живот на богатите жители в метрополията на халифата. Междувременно пък риба, живо маринована, плува в гроздов сок в рецепти като тази:
Подбери едра жива риба и я хвърли в съд, пълен със сока на червено грозде. Съдът трябва да бъде достатъчно голям и широк, за да може рибата да се потопи и да плува в него. Нека рибата се напие колкото може със сока. Забележимото спадане в нивото на сока показва, че той се е пропил в цялото тяло. Тогаз извади рибата, почисти я и я опечи. Поднеси я със сос, приготвен от листа на асафетида (анджузан или анджудан), мурри (течен ферментирал сос), бял оцет, сок от магданоз и на’на’ (култивирана мента) и семена от ким. Това ястие – както и всяко друго рибно ястие – няма достатъчно добър вкус, и не е завършено, ако не се поднесе с [вървящия към него] сос за топене (сибаг), тъй като само чрез поднасянето на добавките към рибата тя става вкусна.
От старите кулинарни извори има запазени и други. Например звучно озаглавеното „Съкровищница от ползи“ от мамелюшкия XIV век или книгата с ястия от Андалусия и Магреба на Ибн Разин ат-Туджиби от XIII столетие. Но като че ли най-любим ми остава сборникът на Ибн ал-Адим от Сирия, автор от епохата на Аюбидите (нали помните основателя на тази династия Саладин, прокудил кръстоносците от Близкия изток?), събрал няколкостотин рецепти през XIII век.
Този тип наръчници очевидно са насочени към по-заможната публика и елита. Там човек може да открие почти всичко освен свинско месо, попаднало под вечна възбрана заради ислямската повеля. Даже и видовете ферментирали напитки („вина“, хумур) намират своето място под слънцето. Нуждата от подобно съчинение е обоснована с аргумент в духа на своеобразно „религиозно гурме“. Аллах, казва Ибн Адим, е казал на хората „яжте от Неговото препитание“ (Коран 67:15), а е дарил на Пророка Мохамед „обич към красотата на жените и аромата на парфюмите“. Та оттук и следвало за човека да яде и пие най-вкусните неща, че и да се парфюмира.
Не е изненада, че книгата започва с глава за парфюмите и завършва с рецепти за козметични прахове, сапун, вода за уста. А по средата откриваме разделите, посветени на напитките, различните видове сокове и какво се прави с тях, за оцета и неговото дестилиране, за разтопяването на мас от опашката, за ястия от пиле – сладки, кисели и други, за пържено-печените храни и други подобни – там са месата, сладкишите и тестените печива, както и разни видове солени и кисели туршии.
Но не си представяйте рецепти, подобни на днешните. Описанията често са кратки и доста фриволни за разбиранията ни. Или направо емоционални.
„Вземи колкото трябва или колкото искаш“, казва авторът. „Готви, докато стане наполовина готово, а сетне…“ „Когато мине колкото време трябва, сложи…“ „Така става много вкусно!“ Става, ако уцелиш времето, пропорцията, подправките, да. Готви се в дълбоки съдове, тигани, затворени съдове, подобни на гювеч, гърнета, на открит огън или в зидана фурна. Мерки за обем и количество не се споменават често, а когато ги има, човек, ако не иска да се придържа към предписанието „вземи колкото искаш“, трябва да провери какво точно означават в терминологията на сирийските Аюбиди. Типичен пример е мярката ратл, която в зависимост от епохата и мястото може да обозначава количество между 400 грама и килограм и нещо.
Мазнината, с която най-често се готви, е от овча опашка, понякога зехтин, но като че ли най-често е сусамово олио.
Подправките са изобилни, канелата е цейлонска, кориандърът е в две разновидности – сух и зелен, на месото често се слагат розова вода, захар и оцет. Човек постепенно свиква не просто с арабския език на оригинала. Свиква и с мисълта, че за да разбереш как се прави плънка от кайма за напълване на пиле например, трябва да го възстановиш от други рецепти.
Ето как набързо пътуваме между Мароко, Ливан, Ирак, Персия, Сирия, между съвремието и Средновековието.
Приятно е човек да опитва местни храни, докато пътува. Но може да направи и следваща крачка – след като се сблъска с езиковите трудности около превода, да пробва и да сготви по такава рецепта. И тъй като тук няма място за всичките розови води, теста, агнета, пилета и туршии, привеждам още четири описания на ястия от Ибн Адим. Човек може да си направи многостепенно меню от XIII век.
Пълнени с кайма патладжани
Вземат се големи селски патладжани, режат се откъм дръжката и се издълбават, като им се отнема сърцевината, но не съвсем до обелката, за да остане все пак меснатост в тях. После се взема месо, прави се на кайма, оформя се и се вари. Когато стане готово, се стрива в хаван пак, докато стане гладка смес, слага се в метален тиган, разбърква се с прясна лой от овча опашка заедно със сух кориандър, ким, пипер, китайска канела, много стрит зелен кориандър и смлян магданоз. Всичко се пържи, докато се сгъсти. Подправя се със сол, и с него се напълват патладжаните, после те се захлупват с онова, което е отрязано от тях [дръжките] и се закрепват с три дървени шишчета, направени от добра дървесина. Като се стори това, се слагат в метален тиган и се пържат в лой от овча опашка, докато се зачервят. Слагат се в блюдо, поръсват се със сух кориандър, а когато се поднасят, се махат шишчетата и се хвърлят настрана.
Дюля с месо
Месото се сварява. После се накълцва на ситно и се прави на малки топчета. Пържи се в лой от овча опашка с лук и пресен кориандър, след което му се слага малко от бульона. Сетне се нарязва дюля на четири и се почиства от семките и вътрешността. Туря се връз месото заедно с малко шафран, смес от подправки, малко мед или захар и се оставя [на огъня да се готви] , докато не стане наполовина готово. Накрая му се слага малко лимонов сок и сух кориандър и се възвира, докато дюлята не стане готова. Поръсва се с белен шамфъстък, след което се насипва с черпак и се поднася.
Кебап в трап по бедуински
Взема се тлъсто агне или козле, разсича се по дължина и се нарязва на парчета. Намазва се с шафран, люти подправки, като пипер, кимион, сух кориандър, смляна китайска канела, и се натрива с малко зехтин, за да се овкуси. Вземат се камъни (парчета скала или плоски) и се изкопава трап на размер колкото агнето, но по-дълбок. Нареждат се камъните на хубав пласт, а върху тях се наклажда огън от дърва, въглища или каквото се намери, и се разпалва силно, докато камъните се нагреят до червено. После огънят се маха и пепелта се изтръсква бързо, за да не изстинат камъните. След това се прави решетка от [клони на] тамариск, върба или зелена тръстика, върху която се полага месото, като се разпределя равномерно и се покрива с голяма медна тава, каквато имат бедуините. Ако няма такава, може и с друг плосък съд, като чиния. Краищата се замазват с глина и върху тавата се напалва огън от дърва, който равномерно да покрие отвсякъде. Оставя се така, докато стане готово, тогава огънят се маха и месото се отстранява.
Оризов пудинг с пилешко
Сваряват се тлъсти пилета, след което се пържат в сусамово олио. Вземат се гърдите им и се развлакняват на тънко като нишки. Измива се ориз и се стрива на ситно, след което се пресява. На всеки ратл ориз се слага месото от гърдите на две пилета, сторено на нишки, и захар, колкото искаш на сладост. Сетне вземи прясно мляко, възври го, докато кипне два или три пъти, посипи връз него ориза и го разбърквай, за да не залепне. Когато стане като гъст бульон или малко по-рядко, тури му мазнина от опашка, като не преставаш да го готвиш на тих огън, докато не отдели мазнината и не се зачерви. Продължавай да го бъркаш, докато не стане готово за разстилане в плоски чинии – тогава го насипи с черпак. Посипи го по средата с цели белени ядки шамфъстък и така ще стане вкусно.
Заглавно изображение: Илюстрация към „Макамите“ на Ал-Харири (поч. 1122), художник Яхя ибн Махмуд Уасити, ръкопис от 1236 г., Ирак, колекция на Библиотеката на Конгреса
В рубриката „Ориент кафе“ Атанас Шиников поднася любопитни теми, свързани не толкова с горещата политика, колкото с историята и културата на Близкия изток. А той, древен и днешен, е по-близко до нас и съвремието ни, отколкото си представяме.
In my role I regularly have conversations with customers who want to enforce security and governance best practices while providing developers the flexibility and agility they need to innovate quickly. As you embrace DevSecOps, you likely seek to balance governance and agility in your Continuous Integration & Continuous Delivery CI/CD pipeline. In this blog post I will discuss how I use AWS CodePipeline and AWS CodeBuild to achieve these goals.
Background
Before I explore this scenario, let me discuss the typical personas involved – platform engineers and developers. Traditionally operations teams were responsible for the process of designing, deploying, configuring, and maintaining the different components that comprise IT infrastructure. Development teams, on the other hand, were responsible for the process of designing, developing, deploying, and maintaining the applications that run on the underlying IT infrastructure. In this model, there was a clear separation of duties. However, with the advent of DevOps these roles have changed. Development teams use Infrastructure as Code (IaC) to provision the infrastructure as part of the application code. As this happened, the operations team evolved to play a supervisory role ensuring the resources being deployed adhere to best practices. I’ll refer to this new supervisory role as the platform engineering team to distinguish from the traditional operations team.
Building on DevOps, DevSecOps promotes the introduction of security controls early in the software development lifecycle. Security teams define best practices for the incorporation of security controls throughout the process. Often these controls are enforced in the CI/CD pipeline. As a result, the role of the security team has also changed. Rather than performing manual security reviews, the security team defines automated controls and ensures they are implemented in the pipeline, often created by the platform engineers. However, the platform engineers must enforce these controls without hindering the agility of the developers. Afterall, DevOps is all about increasing the velocity of the development lifecycle. In this post, I discuss how to separate the security controls and build process into different phases of the pipeline. This allows the platform engineers to enforce security controls in phases they own, while the developers can quickly update the phases they own.
AWS CodePipeline is a fully managed continuous delivery service that helps you automate your deployment pipelines. Pipelines consist of actions that are organized into stages. These actions are often implemented with AWS CodeBuild. Each CodeBuild action defines where to get the source code, which build environment to use, and which build commands to run. The build commands are defined, in YAML format, in a buildspec. The buildspec can be stored in the CodeBuild configuration or as a file in the source code. When the buildspec is defined in the CodeBuild configuration, the platform engineers can retain ownership. When the buildspec is defined in the source code, the developers can easily change it. The pipeline can contain multiple actions to balance governance and agility.
In the following walkthrough I introduce a simple pipeline with two CodeBuild actions. The platform engineers create the pipeline, including a build action defining security controls. As an example, I will use OWASP Dependency Checker to perform Software Composition Analysis. The buildspec for this action is defined in the CodeBuild configuration and the platform engineers retain ownership along with the overall pipeline definition. A second build action is defined to build and test the source code. This buildspec is defined in the source code and the developers can change it whenever they want. Note that the pipeline pictured also includes a Source action implemented with AWS CodeCommit and a Deploy action implemented with AWS CodeDeploy, but these are out of scope for this post.
Walkthrough
In this section, I will play the role of a platform engineer and walk you through the creation of the simple pipeline described previously. I will use the AWS console for simplicity, however I recommend using AWS CloudFormation or AWS Cloud Development Kit (CDK) Pipelines for real world deployments.
The development team has already added their code to a CodeCommit repository. In addition to their source code, they have included the following buildspec.yaml file in the root of the repository.
As you can see, this buildspec uses the python 3.11 runtime. It installs requirements, runs a linter, and runs unit tests with code coverage. Given that the buildspec.yaml is included in the source code, the developers can add anything they want. They have full control over this action’s build process. This gives them a lot of autonomy and agility.
I am now ready to begin creating the pipeline. First, I will create a new CodeBuild project to run the development team’s build that is defined in the buildspec.yaml examined previously. I open the CodeBuild Console and select Create Project. I name my project “BuildAndTest.” The process of creating a CodeBuild project is covered in the CodeBuild User Guide section titled Create a build project; however, I want to call your attention to the Buildspec configuration. Here, I choose Use a buildspec file and provide the location of the file in the repository.
With the buildspec defined in the source code, I am allowing the development team to define the build process. This gives the developers the control and autonomy to change their build process as the project evolves over time. They will not have to ask me to update the build commands every time they want to make a change. In addition, because I will add a second build action with the required security tools, I do not have to audit the content of their buildspec.yaml file. There is no need for me to confirm the developers have included the required security tools.
Next, I will create another CodeBuild project to run Software Composition Analysis (SCA). I return to the CodeBuild Console and select Create Project. I name this project “SoftwareCompositionAnalysis.” The configuration of this project is nearly identical to the prior project, other than the Buildspec configuration. This time, I choose Insert build commands and enter the build commands directly into the project configuration. In the following image, I have added the build commands to install and run OWASP Dependency Checker.
With the buildspec defined in the project definition, I can use a AWS Identity and Access Management (IAM) policy to ensure the development team cannot change it. I now have confidence that the required security tools are properly installed and configured. I do not need to depend on the developers to properly configure the security tools. In addition, I have the autonomy to change the tools used without interrupting the developers or modifying their code.
With my two build actions defined, I can create a pipeline to automate the overall build process. I created the following pipeline following the instruction in Create a pipeline in CodePipeline. In the build phase I run the SoftwareCompositionAnalysis action followed by the BuildAndTest action. Note that these actions execute in order. Therefore, the BuildAndTest action will not run if issues are discovered in the SoftwareCompositionAnalysis action.
I now have confidence that my security tools are properly configured in the pipeline. In addition, the developers retain control over the build and test action allowing them to change the build steps as needed.
I now have confidence that my security tools are properly configured in the pipeline. In addition, the developers retain control over the build and test action allowing them to change the build steps as needed. Furthermore, if I support many similar projects, I could define the pipeline using CloudFormation or CDK. This would allow me to deploy multiple pipelines from the same template, and update all the pipelines as security standards evolve. Obviously, the pipeline I created in this post is a trivial example. A real-world pipeline would likely have many actions defined. Some of these actions would be defined in the project definition and be managed by the platform engineers. Other tasks would refer to buildspec files stored in the source code and be managed by the developers. Review the Deployment Pipeline Reference Architecture (DPRA) for an example of a robust pipeline with many stages and actions.
As customers embrace DevSecOps, they seek to balance governance and agility in their CI/CD pipeline. In this post I discussed how to use CodeBuild to allow the platform engineer to configure some actions while the developer configures other actions. This allows you to ensure that security controls are properly enforced without compromising the flexibility and agility of the development teams. To get started, read more about AWS CodePipeline and AWS CodeBuild.
In the AWS Security Profile series, we interview Amazon Web Services (AWS) experts who help keep our customers safe and secure. This interview features Valerie Lambert, Senior Software Development Engineer, Crypto Tools, and upcoming AWS re:Inforce 2023 speaker, who shares thoughts on data protection, cloud security, cryptography tools, and more.
What do you do in your current role and how long have you been at AWS? I’m a Senior Software Development Engineer on the AWS Crypto Tools team in AWS Cryptography. My team focuses on building open source, client-side encryption solutions, such as the AWS Encryption SDK. I’ve been working in this space for the past four years.
How did you get started in cryptography? What about it piqued your interest? When I started on this team back in 2019, I knew very little about the specifics of cryptography. I only knew its importance for securing our customers’ data and that security was our top priority at AWS. As a developer, I’ve always taken security and data protection very seriously, so when I learned about this particular team from one of my colleagues, I was immediately interested and wanted to learn more. It also helped that I’m a very math-oriented person. I find this domain endlessly interesting, and love that I have the opportunity to work with some truly amazing cryptography experts.
Why do cryptography tools matter today? Customers need their data to be secured, and builders need to have tools they can rely on to help provide that security. It’s well known that no one should cobble together their own encryption scheme. However, even if you use well-vetted, industry-standard cryptographic primitives, there are still many considerations when applying those primitives correctly. By using tools that are simple to use and hard to misuse, builders can be confident in protecting their customers’ most sensitive data, without cryptographic expertise required.
What’s been the most dramatic change you’ve seen in the data protection and cryptography space? In the past few years, I’ve seen more and more formal verification used to help prove various properties about complex systems, as well as build confidence in the correctness of our libraries. In particular, the AWS Crypto Tools team is using Dafny, a formal verification-aware programming language, to implement the business logic for some of our libraries. Given the high bar for correctness of cryptographic libraries, having formal verification as an additional tool in the toolbox has been invaluable. I look forward to how these tools mature in the next couple years.
You are speaking in Anaheim June 13-14 at AWS re:Inforce 2023 — what will your session focus on? Our team has put together a workshop (DAP373) that will focus on strategies to use client-side encryption with Amazon DynamoDB, specifically focusing on solutions for effectively searching on data that has been encrypted on the client side. I hope that attendees will see that, with a bit of forethought put into their data access patterns, they can still protect their data on the client side.
Where do you see the cryptography tools space heading in the future? More and more customers have been coming to us with use cases that involve client-side encryption with different database technologies. Although my team currently vends an out-of-the-box solution for DynamoDB, customers working with other database technologies have to build their own solutions to help keep their data safe. There are many, many considerations that come with encrypting data on the client side for use in a database, and it’s very expensive for customers to design, build, and maintain these solutions. The AWS Crypto Tools team is actively investigating this space—both how we can expand the usability of client-side encrypted data in DynamoDB, and how to bring our tools to more database technologies.
Is there something you wish customers would ask you about more often? Customers shouldn’t need to understand the cryptographic details that underpin the security properties that our tools provide to protect their end users’ data. However, I love when our customers are curious and ask questions and are themselves interested in the nitty-gritty details of our solutions.
How about outside of work, any hobbies? A couple years ago, I picked up aerial circus arts as a hobby. I’m still not very good, but it’s a lot of fun to play around on silks and trapeze. And it’s great exercise!
If you have feedback about this post, submit comments in the Comments section below. If you have questions about this post, contact AWS Support.
Want more AWS Security news? Follow us on Twitter.
Rapid7 is very excited to announce version 0.6.9 of Velociraptor is now LIVE and available for download. Much of what went into this release was about expanding capabilities and improving workflows.
We’ll now explore some of the interesting new features in detail.
GUI Improvements
The GUI was updated in this release to improve user workflow and accessibility.
Table Filtering and Sorting Previously, table filtering and sorting required a separate dialog. In this release, the filtering controls were moved to the header of each column making it more natural to use.
Filtering tables
VFS GUI Improvements
The VFS GUI allows the user to collect files from the endpoint in a familiar tree-based user interface. In previous versions, it was only possible to schedule a single download at a time. This proved problematic when the client was offline or transferring a large file, because the user had no way to kick off the next download until the first file was fully fetched.
In this release, the GUI was revamped to support multiple file downloads at the same time. Additionally it is now possible to schedule a file download by right clicking the download column in the file table and selecting “Download from client”.
Initiating file download in the VFS. Note multiple files can be scheduled at the same time, and the bottom details pane can be closed
Hex Viewer and File Previewer GUI
In release 0.6.9, a new hex viewer was introduced. This viewer makes it possible to quickly triage uploaded files from the GUI itself, implementing some common features:
The file can be viewed as a hex dump or a strings-style output.
The viewer can go to an arbitrary offset within the file, or page forward or backwards.
The viewer can search forward or backwards in the file for a Regular Expression, String, or a Hex String.The hex viewer is available for artifacts that define a column of type preview_uploads including the File Upload table within the flow GUI.
The hex viewer UI can be used to quickly inspect an uploaded file
Artifact Pack Import GUI Improvements
Velociraptor allows uploading an artifact pack – a simple Zip file containing artifact definitions. For example, the artifact exchange is simply a zip file with artifact definitions.
Previously, artifact packs could only be uploaded in their entirety and always had an “Exchange” prefix prepended. However, in this release the GUI was revamped to allow only some artifacts to be imported from the pack and to customize the prefix.
It is now possible to import specific artifacts in a pack
Direct SMB Support
Windows file sharing is implemented over the SMB protocol. Within the OS, accessing remote file shares happens transparently, for example by mapping the remote share to a drive using the net use command or accessing a file name starting with a UNC path (e.g. \\ServerName\Share\File.exe).
While Velociraptor can technically also access UNC shares by using the usual file APIs and providing a UNC path, in reality this does not work because Velociraptor is running as the local System user. The system user normally does not have network credentials, so it can not map remote shares.
This limitation is problematic, because sometimes we need to access remote shares (e.g. to verify hashes, perform YARA scans etc). Until this release, the only workaround for this limitation was to install the Velociraptor user as a domain user account with credentials.
As of the 0.6.9 release, SMB is supported directly within the Velociraptor binary as an accessor. This means that all plugins that normally operate on files can also operate on a remote SMB share transparently.
Velociraptor does not rely on the OS to provide credentials to the remote share, instead credentials can be passed directly to the smb accessor to access the relevant smb server.
The new accessor can be used in any VQL that needs to use a file, but to make it easier there is a new artifact called Windows.Search.SMBFileFinder that allows for flexible file searches on an SMB share.
Searching a remote SMB share
Using SMB For Distributing Tools
Velociraptor can manage third-party tools within its collected artifacts by instructing the endpoint to download the tool from an external server or the velociraptor server itself.
It is sometimes convenient to download external tools from an external server (e.g. a cloud bucket) due to bandwidth considerations.
Previously, this server could only be a HTTP server, but in many deployments it is actually simpler to download external tools from an SMB share.
In this release, Velociraptor accepts an SMB URL as the Serve URL parameter within the tool configuration screen.
You can configure the remote share with read-only permissions (read these instructions for more details on configuring SMB).
Serving a third-party tool from an SMB server
The Offline Collector
The offline collector is a popular mode of running Velociraptor. In this mode, the artifacts to collect are pre-programmed into the collector, which stores the results in a zip file. The offline collector can be pre-configured to encrypt and upload the collection automatically to a remote server without user interaction, making it ideal for using remote agents or people to manually run the collector without needing further training.
In this release, the Velociraptor offline collector adds two more upload targets. It is now possible to upload to an SMB server and to Azure Blob Storage.
SMB Server Uploads Because the offline collector is typically used to collect large volumes of data, it is beneficial to upload the data to a networked server close to the collected machine. This avoids cloud network costs and bandwidth limitations. It works very well in air gapped networks, as well.
You can now simply create a new share on any machine, by adding a local Windows user with password credentials, exporting a directory as a share, and adjusting the upload user’s permissions to only be able to write on the share and not read from it. It is now safe to embed these credentials in the offline collector, which can upload data but cannot read or delete other data.
Azure Blob Storage Service Velociraptor can now upload collections to an Amazon S3 or Google Cloud Storage bucket. Many users requested direct support for Azure blob storage, which is now in 0.6.9.
Read about how to configure Azure for safe uploads. Similar to the other methods, credentials embedded in the offline collector can only be used to upload data and not read or delete data in the storage account.
Debugging VQL Queries
One of the points of feedback we received from our annual user survey was that although VQL is an extremely powerful language, users struggle with debugging and understanding how the query proceeds.
Unlike a more traditional programming language (e.g. Python), there is no debugger that allows users to pause execution and inspect variables, or add print statements to see what data is passed between parts of the query.
We took this feedback to heart and in release 0.6.9 the EXPLAIN keyword was introduced. The EXPLAIN keyword can be added before any SELECT in the VQL statement to place that SELECT statement into tracing mode.
As a recap, the general syntax of the VQL statement is:
SELECT vql_fun(X=1, Y=2), Foo, Bar
FROM plugin(A=1, B=2)
WHERE X = 1
When a query is in tracing mode:
All rows emitted from the plugin are logged with their types
All parameters into any function are also logged
When a row is filtered because it did not pass the WHERE clause this is also logged
This additional tracing information can be used to understand how data flows throughout the query.
Explaining a query reveals details information on how the VQL engine handles data flows
You can use the EXPLAIN statement in a notebook or within an artifact as collected from the endpoint (although be aware that it can lead to extremely verbose logging).
Inspect the details by clicking on the logs button
For example in the above query we can see:
The clients() plugin generates a row
The timestamp() function received the last_seen_at value
The WHERE condition rejected the row because the last_seen_at time was more than 60 seconds ago
Locking Down The Server
Another concern raised in our survey was the perceived risk of having Velociraptor permanently installed due to its high privilege and efficient scaling.
While this risk is not higher than any other domain-wide administration tool, in some deployment scenarios, Velociraptor does not need this level of access all the time. While in an incident response situation, however, it is necessary to promote Velociraptor’s level of access easily.
In the 0.6.9 release, Velociraptor has introduced lock down mode. When a server is locked down certain permissions are removed (even from administrators). The lockdown is set in the config file, helping to mitigate the risk of a Velociraptor server admin account compromise.
After initial deployment and configuration, the administrator can set the server in lockdown by adding the following configuration directive to the server.config.yaml and restarting the server:
lockdown: true
After the server is restarted the following permissions will be denied:
ARTIFACT_WRITER
SERVER_ARTIFACT_WRITER
COLLECT_CLIENT
COLLECT_SERVER
EXECVE
SERVER_ADMIN
FILESYSTEM_WRITE
FILESYSTEM_READ
MACHINE_STATE
Therefore it will still be possible to read existing collections, and continue collecting client monitoring data, but it will not be possible to edit artifacts or start new hunts or collections.
During an active IR, the server may be taken out of lockdown by removing the directive from the configuration file and restarting the service. Usually, the configuration file is only writable by root and the Velociraptor server process is running as a low privilege account that can not write to the config file. This combination makes it difficult for a compromised Velociraptor administrator account to remove the lockdown and use Velociraptor as a lateral movement vehicle.
Audit Events
Velociraptor maintains a number of log files over its operation, normally stored in the <filestore>/logs directory. While the logs are rotated and separated into different levels, the most important log type is the audit log which records auditable events. Within Velociraptor auditable events are security critical events such as:
Starting a new collection from a client
Creating a new hunt
Modifying an artifact
Updating the client monitoring configuration
Previous versions of Velociraptor simply wrote those events to the logging directory. However, the logging directory can be deleted if the server becomes compromised.
In 0.6.9 there are two ways to forward auditable events off the server
Uploading to external log management systems e.g. Opensearch/Elastic using the Elastic.Events.Upload artifact.Additionally, auditable events are now emitted as part of the Server.Audit.Logs artifact so they can be viewed or searched in the GUI by any user.
The server’s audit log is linked from the Welcome pageInspecting user activity through the audit log
Because audit events are available now as part of the server monitoring artifact, it is possible for users to develop custom VQL server monitoring artifacts to forward or respond to auditable events just like any other event on the client or the server. This makes it possible to forward events (e.g. to Slack or Discord) as demonstrated by the `Elastic.Events.Upload` artifact above.
Tool Definitions Can Now Specify An Expected Hash
Velociraptor supports pushing tools to external endpoints. A Velociraptor artifact can define an external tool, allowing the server to automatically fetch the tool and upload it to the endpoint.
Previously, the artifact could only specify the URL where the tool should be downloaded from. However, in this release, it is also possible to declare the expected hash of the tool. This prevents potential substitution attacks effectively by pinning the third-party binary hash.
While sometimes the upstream file may legitimately change (e.g. due to a patch), Velociraptor will not automatically accept the new file when the hash does not match the expected hash.
Mismatched hash
In the above example we modified the expected hash to be slightly different from the real tool hash. Velociraptor refuses to import the binary but provides a button allowing the user to accept this new hash instead. This should only be performed if the administrator is convinced the tool hash was legitimately updated.
Conclusions
There are many more new features and bug fixes in the 0.6.9 release. If you’re interested in any of these new features, we welcome you to take Velociraptor for a spin by downloading it from our release page. It’s available for free on GitHub under an open-source license.
As always, please file bugs on the GitHub issue tracker or submit questions to our mailing list by emailing [email protected]. You can also chat with us directly on our Discord server.
Learn more about Velociraptor by visiting any of our web and social media channels below:
If you want to master Velociraptor, consider joining us at a week-long Velociraptor training course held this year at the BlackHat USA 2023 Conference and delivered by the Velociraptor developers themselves.Details are here: https://docs.velociraptor.app/announcements/2023-trainings/
Business intelligence (BI) and IT operations (BIOps) teams often need to automate and accelerate the deployment of BI assets to ensure business continuity. We heard that you wanted an automated and scalable way to deploy, back up, and replicate Amazon QuickSight assets at scale so that BIOps teams within your organization can work in an agile manner.
Today, we are releasing six new QuickSight APIs to allow programmatic access to export and import QuickSight assets—dashboards, analyses, datasets including ingestion schedules, data sources, themes, and VPC configurations—across accounts and environments. These new APIs allow you to interact with a collection of assets in a lift-and-shift manner for deployment across QuickSight accounts, enable backup and restore, and support replication so you can automate workflows and achieve your desired infrastructure setup. These new capabilities bring greater agility to your BIOps teams, allowing you to automate and seamlessly integrate QuickSight assets into existing infrastructure.
Prior to this launch, you needed to have an in-depth understanding of QuickSight asset relationships and couldn’t deploy, back up, or replicate at scale in an automated manner. In this post, we cover the capabilities of the new APIs in detail and go over common use cases.
Export APIs
You can use the following APIs to initiate, track, and describe the export jobs that produce the bundle files from the source account. A bundle file is a zip file (with the .qs extension) that contains assets specified by the caller, and optionally all dependencies of the assets. The APIs are as follows:
DescribeAssetBundleExportJob – Use this synchronous API to get the status of your export job. When successful, this API call response will have a presigned URL to fetch the asset bundle.
ListAssetBundleExportJobs – Use this synchronous API to list past export jobs. The list will contain both finished and running jobs from the past 15 days.
Import APIs
These APIs initiate, track, and describe the import jobs that take the bundle file as input and create or update assets in the destination account:
ListAssetBundleImportJobs – Use this synchronous API to list past import jobs. The list will contain both finished and running jobs from the past 15 days.
Supported assets
You can export and import the following assets with these APIs:
Analyses
Dashboards
Data sources
Datasets including scheduled and incremental refreshes
Themes
VPC connections
Asset bundle output format
The output of the export job is a single zip file with the .qs extension. This zip file contains a separate folder for each asset type. Each folder contains a single JSON file for each asset with the resourceId as the file name. This folder structure makes it easy to commit the contents into a version control system like Git, so you can get the benefits of a complete version history.
The Asset-bundle API can also export QuickSight assets as AWS CloudFormation templates, one of the most popular infrastructure as code (IaC) frameworks. It makes it easy to manage your QuickSight assets at scale and automate your deployments. AWS CloudFormation also has built-in transaction and rollback capabilities, ensuring that all your environments are consistent and your assets are deployed correctly every time. Finally, you can use the CloudFormation templates to recreate your QuickSight resources in case of a disaster.
Permissions required
These APIs are available to users with AWS Identity and Access Management (IAM) permissions to run these APIs. The following IAM policy allows an IAM user to get access to these APIs:
Let’s consider a fictional company, AnyCompany, which owns healthcare facilities across the globe. They have set up a development QuickSight account for authors to create and update QuickSight assets and a separate production account. In some cases due, to data residency regulation, they have to maintain the same assets across multiple Regions. AnyCompany is scaling their business and they want to automate deployment within and across multiple QuickSight accounts and back up QuickSight assets on a schedule.
AnyCompany has the following key deployment and backup requirements:
Deployment – Deploy QuickSight assets across Regions and multiple accounts:
Deployment to the production account – AnyCompany wants to automate the deployment of QuickSight assets from their development to their production account.
Deployment to different Regions in the same account – AnyCompany’s central IT team needs to deploy dashboards and datasets across various Regions to meet data residency requirements.
Deployment to multiple accounts in different Regions – To meet their end customer requirements of separate QuickSight accounts, AnyCompany needs to deploy the dashboards and datasets across multiple accounts.
Deployment in the same account and same Region – AnyCompany consolidates all non-production environment into one QuickSight account. However, there has to be different dashboards and datasets for each non-production environment, such as development and testing.
Backup and restore – As AnyCompany rolls out critical dashboards for business, it needs to ensure high availability of the dashboards. As part of their strategy, AnyCompany wants to maintain a backup of assets to restore in case of disasters.
Deployment history – As part of the governed process, AnyCompany’s central IT team needs to have a history of deployments in each environment.
In the following sections, we discuss how to meet these requirements.
Deploy to a production account
The following figure shows the sequence of steps in the deployment process through the new asset deployment APIs.
For deployments, the import job API provides the capability to pass data source configurations to point to the respective test or production instances of data sources. In the preceding sequence flow, we use the AWS Command Line Interface (AWS CLI) to showcase the capability, but you can invoke the APIs through your automation pipeline using AWS SDKs.
The output of the DescribeAssetBundleExportJob API call contains the presigned URL, which you use to download your respective assets and subsequently upload them to a dedicated S3 bucket in the target account.
The import job (StartAssetBundleImportJob) is initiated in the target account using S3Uri as one of the input parameters. You can also change the data source configuration while initiating the job. In the following example, the S3 manifest file location for the S3 data source is overridden:
Deploy to different Regions in the different accounts
To comply with data residency regulations, data can’t be moved outside a Region in certain countries. Therefore, the dashboards have to be deployed in each of these Regions. QuickSight provides the option to pass an asset bundle extracted from the source environment as a base64 encoded string for the import job (StartAssetBundleImportJob):
When using a centralized account approach for all the lower environments, AnyCompany wanted to have the same dashboards within a single Region to be able to connect with different data sources. To achieve this, they used the optional parameter resource-id-prefix in the import job (StartAssetBundleImportJob) to create a unique ID for each environment:
AnyCompany deploys business-critical dashboards, and it’s important for them to have proper backup and version control processes. They run scheduled export jobs at regular intervals along with asset deployments. Additionally, they use asset bundle APIs to meet their version control requirements.
The following screenshot shows the content of a sample bundle.
Deployment history
AnyCompany needs to track the deployment history of all the assets in all environments. They achieved this goal by using the ListAssetBundleExportJobs and ListAssetBundleImportJobs APIs to fetch the deployment history in a given account.
The following code is for ListAssetBundleExportJobs:
Asset bundle APIs provide methods for automation and acceleration in the deployment process across multiple environments. This post illustrated various use cases where you can apply these APIs for automation and scale. For more information, refer to Amazon QuickSight and What’s New in the Amazon QuickSight User Guide.
If you have any questions or feedback, please leave a comment. For additional discussions and help getting answers to your questions, check out the QuickSight Community.
About the authors
Vetri Natarajan is a Specialist Solutions Architect for Amazon QuickSight. Vetri has 15 years of experience implementing enterprise business intelligence (BI) solutions and greenfield data products. Vetri specializes in integration of BI solutions with business applications and enable data-driven decisions.
Zhao Pan is a software development manager for Amazon QuickSight. He is working to provide a delightful developer experience to our customers to automate and streamline their BI operations. He has 20 years of software development experience in various tech stacks. Prior to QuickSight he was a people and technical leader at ADP building a next-gen platform for human capital management. When he is not at his desk, he can usually be found in his garage building one contraption or another.
Mayank Agarwal is a product manager for Amazon QuickSight, AWS’ cloud-native, fully managed BI service. He focuses on embedded analytics and developer experience. He started his career as an embedded software engineer developing handheld devices. Prior to QuickSight he was leading engineering teams at Credence ID, developing custom mobile embedded device and web solutions using AWS services that make biometric enrollment and identification fast, intuitive, and cost-effective for Government sector, healthcare and transaction security applications.
Over the past decade, we’ve seen a rapid evolution in how IT operations teams and application developers work together. In the early days, there was a clear division of responsibilities between the two teams, with one team focused on providing and maintaining the servers and various components (i.e., storage, DNS, networking, etc.) for the application to run, while the other primarily focused on developing the application’s features, fixing bugs, and packaging up their artifacts for the operations team to deploy. Ultimately, this division led to a siloed approach which presented glaring challenges. These siloes hindered communication between the teams, which would often result in developers being ready to ship code and passing it over to the operations teams with little to no collaboration prior. In turn, operations teams were often left scrambling trying to deliver on the requirements at the last minute. This would lead to bottlenecks in software delivery, delaying features and bug fixes from being shipped. Aside from software delivery, operations teams were primarily responsible for handling on-call duties, which encompassed addressing issues arising from both applications and infrastructure. Consequently, when incidents occurred, the operations teams were the ones receiving alerts, irrespective of the source of the problem. This raised the question: what motivates the software developers to create resilient and dependable software? Terms such as “throw it over the wall” and “it works on my laptop” were coined because of this and are still commonly referenced in discussion today.
The DevOps movement emerged in response to these challenges, aiming to build a bridge between developers and operations teams. DevOps focuses on collaboration between the two teams through communication and integration by fostering a culture of shared responsibility. This approach promotes the use of automation of infrastructure and application code leveraging continuous integration (CI) and continuous delivery (CD), microservices architectures, and visibility through monitoring, logging and tracing. The end result of operating in a DevOps model provides quicker and more reliable release cycles. While the ideology is well intentioned, implementing a DevOps practice is not easy as organizations struggle to adapt and adhere to the cultural expectations. In addition, teams can struggle to find the right balance between speed and stability, which often times results in reverting back to old behaviors due to fear of downtime and instability of their environments. While DevOps is very focused on culture through collaboration and automation, not all developers want to be involved in operations and vice versa. This poses the question: how do organizations centralize a frictionless developer experience, with guardrails and best practices baked in, while providing a golden path for developers to self serve? This is where platform engineering comes in.
Platform engineering has emerged as a critical discipline for organizations, which is driving the next evolution of infrastructure and operations, while simultaneously empowering developers to create and deliver robust, scalable applications. It aims to improve developer experience by providing self service mechanisms that provide some level of abstraction for provisioning resources, with good practices baked in. This builds on top of DevOps practices by enabling the developer to have full control of their resources through self service, without having to throw it over the wall. There are various ways that platform engineering teams implement these self service interfaces, from leveraging a GitOps focused strategy to building Internal Developer Platforms with a UI and/or API. With the increasing demand for faster and more agile development, many organizations are adopting this model to streamline their operations, gain visibility, reduce costs, and lower the friction of onboarding new applications.
In this blog post, we will explore the common operational models used within organizations today, where platform engineering fits within these models, the common patterns used to build and develop these self-service platforms, and what lies ahead for this emerging field.
Operational Models
It’s important for us to start by understanding how we see technology teams operate today and the various ways they support development teams from instantiating infrastructure to defining pipelines and deploying application code. In the below diagram we highlight the four common operational models and will discuss each to understand the benefits and challenges they bring. This is also critical in understanding where platform teams fit, and where they don’t.
Centralized Provisioning
In a centralized provisioning model, the responsibility for architecting, deploying, and managing infrastructure falls primarily on a centralized team. Organizations assign enforcement of controls into specific roles with narrow scope, including release management, process management, and segmentation of siloed teams (networking, compute, pipelines, etc). The request model generally requires a ticket or request to be sent to the central or dedicated siloed team, ticket enters a backlog, and the developers wait until resources can be provisioned on their behalf. In an ideal world, the central teams can quickly provision the resources and pipelines to get the developers up and running; but, in reality these teams are busy with work and have to prioritize accordingly which often times leaves development teams waiting or having to predict what they need well in advance.
While this model provides central control over resource provisioning, it introduces bottlenecks into the delivery process and generally results in slower deployment cycles and feedback loops. This model becomes especially challenging when supporting a large number of development teams with varying requirements and use cases. Ultimately this model can lead to frustration and friction between teams and hence why organizations after some time look to move away from operating in this model. This leads us to segue into the next model, which is the Platform-enabled Golden Path.
Platform-enabled Golden Path
The platform-enabled golden path model is an approach that allows for developer to have some form of customization while still maintaining consistency by following a set of standards. In this model, platform engineers clearly lay out “preferred” standards with sane defaults, guardrails, and good practices based on common architectures that development teams can use as-is. Sophisticated platform teams may implement their own customizations on top of this framework in the following ways:
The platform engineering team is responsible for creating and updating the templates, with maintenance responsibilities typically being shared. This approach strikes a balance between consistency and flexibility, allowing for some customization while still maintaining standards. However, it can be challenging to maintain visibility across the organization, as development teams have more freedom to customize their infrastructure. This becomes especially challenging when platform teams want a change to propagate across resources deployed by the various development teams building on top of these patterns.
Embedded DevOps
Embedded DevOps is a model in which DevOps engineers are directly aligned with development teams to define, provision, and maintain their infrastructure. There are a couple of common patterns around how organizations use this model.
Floating model: A central DevOps team can leverage a floating model where a DevOps engineer will be directly embedded onto a development team early in the development process to help build out the required pipelines and infrastructure resources, and jump to another team once everything is up and running.
Permanent embedded model: Alternatively, a development team can have a permanent DevOps engineer on the team to help support early iterations as well as maintenance as the application evolves. The DevOps engineer is ideally there from the beginning of the project and continues to support and improve the infrastructure and automation based on feature requests and bug fixes.
A central platform and/or architecture team may define the acceptable configurations and resources, while DevOps engineers decide how to best use them to meet the needs of their development team. Individual teams are responsible for maintenance and updating of the templates and pipelines. This model offers greater agility and flexibility, but also requires the funding to hire DevOps engineers per development team, which can become costly as development teams scale. It’s important that when operating in this model to maintain collaboration between members of the DevOps team to ensure that best practices can be shared.
Decentralized DevOps
Lastly, the decentralized DevOps model gives development teams full end-to-end ownership and responsibility for defining and managing their infrastructure and pipelines. A central team may be focused on building out guardrails and boundaries to ensure that they limit the blast radius within the boundaries. They can also create a process to ensure that infrastructure deployed meets company standards, while ensuring development teams are free to make design decisions and remain autonomous. This approach offers the greatest agility and flexibility, but also the highest risk of inconsistency, errors, and security vulnerabilities. Additionally, this model requires a cultural shift in the organization because the development teams now own the entire stack, which results in more responsibility. This model can be a deterrent to developers, especially if they are unfamiliar with building resources in the cloud and/or don’t want to do it.
Overall, each model has its strengths and weaknesses, and the purpose of this blog is to educate on the patterns that are emerging. Ultimately the right approach depends on the organization’s specific needs and goals as well as their willingness to shift culturally. Of the above patterns, the two that are emerging as the most common are Platform-enabled Golden Path and Decentralized DevOps. Furthermore, we’re seeing that more often than not platform teams are finding themselves going back and forth between the two patterns within the same organization. This is in part due to technology making infrastructure creation in the cloud more accessible through abstraction and automation (think of tools like the AWS Cloud Development Kit (CDK), AWS Serverless Application Model (SAM) CLI, AWS Copilot, Serverless framework, etc). Let’s now look at the technology patterns that are emerging to support these use cases.
Emerging patterns
Of the trends that are on the rise, Internal Developer Platforms and GitOps practices are becoming increasingly popular in the industry due to their ability to streamline the software development process and improve collaboration between development and platform teams. Internal Developer Platforms provide a centralized platform for developers to access resources and tools needed to build, test, deploy, and monitor applications and associated infrastructure resources. By providing a self-service interface with pre-approved patterns (via UI, API, or Git), internal developer platforms empower development teams to work independently and collaborate with one another more effectively. This reduces the burden on IT and operations teams while also increasing the agility and speed of development as developers aren’t required to wait in line to get resources provisioned. The paradigm shifts with Internal Developer Platforms because the platform teams are focused on building the blueprints and defining the standards for backend resources that development teams centrally consume via the provided interfaces. The platform team should view the internal developer platform as a product and look at developers as their customer.
While internal developer platforms provide a lot of value and abstraction through a UI and API’s, some organizations prefer to use Git as the center of deployment orchestration, and this is where leveraging GitOps can help. GitOps is a methodology that leverages Git as the source of orchestrating and managing the deployment of infrastructure and applications. With GitOps, infrastructure is defined declaratively as code, and changes are tracked in Git, allowing for a more standardized and automated deployment process. Using git for deployment orchestration is not new, but there are some concepts with GitOps that take Git orchestration to a new level.
Let’s look at the principles of GitOps, as defined by OpenGitOps:
Declarative
A system managed by GitOps must have its desired state expressed declaratively.
Versioned and Immutable
Desired state is stored in a way that enforces immutability, versioning and retains a complete version history.
Pulled Automatically
Software agents automatically pull the desired state declarations from the source.
Continuously Reconciled
Software agents continuously observe actual system state and attempt to apply the desired state.
GitOps helps to reduce the risk of errors and improve consistency across the organization as all change is tracked centrally. Additionally this provides developers with a familiar interface in git as well as the ability to store the desired state of their infrastructure and applications in one place. Lastly, GitOps is focused on ensuring that the desired state in git is always maintained, and if drift occurs, an external process will reconcile the state of the resources. GitOps was born in the Kubernetes ecosystem using tools like Flux and ArgoCD.
The final emerging trend to discuss is particularly relevant to teams functioning within a decentralized DevOps model, possessing end-to-end responsibility for the stack, encompassing infrastructure and application delivery. The amount of cognitive load required to connect the underlying cloud resources together while also being an expert in building out business logic for the application is extremely high, and hence why teams look to harness the power of abstraction and automation for infrastructure provisioning. While this may appear analogous to previously mentioned practices, the key distinction lies in the utilization of tools specifically designed to enhance the developer experience. By abstracting various components (such as networking, identity, and stitching everything together), these tools eliminate the necessity for interaction with centralized teams, empowering developers to operate autonomously and assume complete ownership of the infrastructure. This trend is exemplified by the adoption of innovative tools such as AWS App Composer, AWS CodeCatalyst, SAM CLI, AWS Copilot CLI, and the AWS Cloud Development Kit (CDK).
Looking ahead
If there is one thing that we can ascertain it’s that the journey to successful developer enablement is ongoing, and it’s clear that finding that balance of speed, security, and flexibility can be difficult to achieve. Throughout all of these evolutionary trends in technology, Git has remained as the nucleus of infrastructure and application deployment automation. This is not new; however, the processes being built around Git such as GitOps are. The industry continues to gravitate towards this model, and at AWS we are looking at ways to enable builders to leverage git as the source of truth with simple integrations. For example, AWS Proton has built integrations with git for central template storage with a feature called template sync and recently released a feature called service sync, which allows developers to configure and deploy their Proton services using Git. These features empower the platform team and developers to seamlessly store their templates and desired infrastructure resource states within Git, requiring no additional effort beyond the initial setup.
We also see that interest in building internal developer platforms is on a sharp incline, and it’s still in the early days. With tools like AWS Proton, AWS Service Catalog, Backstage, and other SaaS providers, platform teams are able to define patterns centrally for developers to self serve patterns via a library or “shopping cart”. As mentioned earlier, it’s vital that the teams building out the internal developer platforms think of ways to enable the developer to deploy supplemental resources that aren’t defined in the central templates. While the developer platform can solve the majority of the use cases, it’s nearly impossible to solve them all. If you can’t enable developers to deploy resources on top of their platform deployed services, you’ll find that you’re back to the original problem statement outlined in the beginning of this blog which can ultimately result in a failed implementation. AWS Proton solves this through a feature we call components, which enables developers to bring their own IaC templates to deploy on top of their services deployed through Proton.
The rising popularity of the aforementioned patterns reveals an unmet need for developers who seek to tailor their cloud resources according to the specific requirements of their applications and the demands of platform/central teams that require governance. This is particularly prevalent in serverless workloads, where developers often integrate their application and infrastructure code, utilizing services such as AWS Step Functions to transfer varying degrees of logic from the application layer to the managed service itself. Centralizing these resources becomes increasingly challenging due to their dynamic nature, which adapts to the evolving requirements of business logic. Consequently, it is nearly impossible to consolidate these patterns into a universally applicable blueprint for reuse across diverse business scenarios.
As the distinction between cloud resources and application code becomes increasingly blurred, developers are compelled to employ tools that streamline the underlying logic, enabling them to achieve their desired outcomes swiftly and securely. In this context, it is crucial for platform teams to identify and incorporate these tools, ensuring that organizational safeguards and expectations are upheld. By doing so, they can effectively bridge the gap between developers’ preferences and the essential governance required by the platform or central team.
Wrapping up
We’ve explored the various operating models and emerging trends designed to facilitate these models. Platform Engineering represents the ongoing evolution of DevOps, aiming to enhance the developer experience for rapid and secure deployments. It is crucial to recognize that developers possess varying skill sets and preferences, even within the same organization. As previously discussed, some developers prefer complete ownership of the entire stack, while others concentrate solely on writing code without concerning themselves with infrastructure. Consequently, the platform engineering practice must continuously adapt to accommodate these patterns in a manner that fosters enablement rather than posing as obstacles. To achieve this, the platform must be treated as a product, with developers as its customers, ensuring that their needs and preferences are prioritized and addressed effectively.
To determine where your organization fits within the discussed operational models, we encourage you to initiate a self-assessment and have internal discussions. Evaluate your current infrastructure provisioning, deployment processes, and development team support. Consider the benefits and challenges of each model and how they align with your organization’s specific needs, goals, and cultural willingness to shift.
To facilitate this process, gather key stakeholders from various teams, including leadership, platform engineering, development, and DevOps, for a collaborative workshop. During this workshop, review the four operational models (Centralized Provisioning, Platform-enabled Golden Path, Embedded DevOps, and Decentralized DevOps) and discuss the following:
How closely does each model align with your current organizational structure and processes?
What are the potential benefits and challenges of adopting or transitioning to each model within your organization?
What challenges are you currently facing with the model that you operate under?
How can technology be leveraged to optimize infrastructure creation and deployment automation?
By conducting this self-assessment and engaging in open dialogue, your organization can identify the most suitable operational model and develop a strategic plan to optimize collaboration, efficiency, and agility within your technology teams. If a more guided approach is preferred, reach out to our solutions architects and/or AWS partners to assist.
New ground was broken today with the addition of two PRs from community contributor sempervictus, also known as RageLtMan, who added the ability for Metasploit to establish sessions to EC2 instances using Amazon’s SSM interface, which provides a public API to execute commands or create real-time interactive websocket command shells. This can result in passwordless elevation of privilege in most if not all cases.
This module is also very helpful as it provides pentesters with the tools required to show the impact of having SSM exposed and can help reinforce the importance of data governance, locality, isolation, and auditing. It can also show how user-based access control systems may be bypassed by the privileges users within IAM have using the SSM interface as an elevation of privilege pivot. Finally, it can also be used to demonstrate how attackers can exfiltrate data from systems which do not have network access outside of the cloud environment.
Contacts Are Like Cookies – I Need More
Community contributors Nolan LOSSIGNOL-DRILLIEN and Vladimir TOUTAIN added a module for exploiting a preauthentication contact database dump vulnerability in Dolibarr 16 prior to 16.0.5. Contact details are a great help for attackers as they can allow them to craft more believable phishing attacks and gain more information about the internal structure of a target company. They can also give information on a company’s relationships with other companies which could reveal information about sensitive company dealings.
Router Exploits – They Never Stop
Router exploits are like fine wine. They just don’t stop, and these devices are often left unpatched for years on end, which can lead to issues where they are compromised and used in attacks such as in the case of the Mirai botnet. Community contributors Anna Graterol, Mana Mostaani, and Nick Cottrell added a new module targeting CVE-2015-3035 which uses a directory traversal vulnerability in unpatched TP-LINK Archer C7 routers to dump arbitrary files on the target such as the /etc/passwd‘s file.
New module content (7)
Amazon Web Services EC2 instance enumeration
Author: RageLtMan
Type: Auxiliary
Pull request: #17430 contributed by sempervictus
Description: This adds the ability for Metasploit to establish sessions to EC2 instances using Amazon’s SSM interface. The result is an interactive shell that does not require the user to transfer a payload to the EC2 instance. For Windows targets, the shell is a a PTY enabled Powershell session that is incompatible with Post modules but supports user interaction.
VSFTPD 2.3.2 Denial of Service
Authors: Anna Graterol, Maksymilian Arciemowicz, Mana Mostaani, and Nick Cottrell (Rad10Logic)
Type: Auxiliary
Pull request: #18004 contributed by rad10
AttackerKB reference: CVE-2011-0762
Description: This PR adds an auxiliary module for DOSing a VSFTPD server from version 2.3.2 and below.
Apache NiFi Login Scanner
Author: h00die
Type: Auxiliary
Pull request: #18028 contributed by h00die
Description: A new scanner module has been added to scan for valid logins for Apache NiFi servers.
Apache NiFi Version Scanner
Author: h00die
Type: Auxiliary
Pull request: #18025 contributed by h00die
Description: This PR adds a version scanner for Apache NiFi.
Archer C7 Directory Traversal Vulnerability
Authors: Anna Graterol, Mana Mostaani, and Nick Cottrell
Type: Auxiliary
Pull request: #18003 contributed by rad10
AttackerKB reference: CVE-2015-3035
Description: This adds a module that gather a specific file by leveraging a directory traversal vulnerability in TP-LINK Archer C7 routers. This vulnerability is identified as CVE-2015-3035.
Dolibarr 16 pre-auth contact database dump
Authors: Nolan LOSSIGNOL-DRILLIEN and Vladimir TOUTAIN
Type: Auxiliary
Pull request: #17899 contributed by vtoutain
Description: This adds a module that leverages an authorization bypass in Dolibarr version 16, prior to 16.0.5. This module dumps the contact database to retrieve customer file, prospects, suppliers and employee information. No authentication is needed for this exploit.
AWS SSM Sessions
Author: sempervictus
Type: Payload
Pull request: #17430 contributed by sempervictus
Description: This adds the ability for Metasploit to establish sessions to EC2 instances using Amazon’s SSM interface. The result is an interactive shell that does not require the user to transfer a payload to the EC2 instance. For Windows targets, the shell is a PTY enabled PowerShell session that is incompatible with Post modules but supports user interaction.
Enhancements and features (2)
#18021 from zeroSteiner – The PowerShell Post API methods use a mix of PowerShell and .NET methods which have different ways of keeping track of the current working directory. This changes fixes the ambiguity by synchronizing the current working directory referenced by each set of methods.
#18031 from wvu – Updates edit and log commands to explain to how to set LocalEditorand LocalPager so that users can adjust the editor that is used when running the edit command and the log file that is used for logging module runtime information, respectively.
Bugs fixed (6)
#18019 from cgranleese-r7 – Fixes validation for the to_handler command when running Evasion and Payload modules.
#18026 from adfoster-r7 – A bug has been fixed in test modules whereby not all modules were manipulating the load path to require the module_test library correctly, resulting on them being dependent on other modules correctly setting the load path, which may not always occur.
#18030 from wvu – A missing return statement was added into lib/msf/core/exploit/cmd_stager/http.rb to fix a Ruby syntax error when attempting to handle a 404 file not found case.
#18032 from wvu – A bug has been fixed in the cmd/brace encoder whereby it did not appropriately escape braces.
#18036 from adfoster-r7 – A typo has been fixed in the ibm_sametime_enumerate_users.rb gather module that prevented exceptions that were raised from being appropriately caught.
#18052 from adfoster-r7 – The test/modules/post/test/file.rb module previously did not work on Windows sessions due to it reading data from a Linux only file to determine what data to write for the binary file write operation. This has since been fixed so that the binary data is randomly generated vs being based off an OS specific file.
Documentation
You can find the latest Metasploit documentation on our docsite at docs.metasploit.com.
Get it
As always, you can update to the latest Metasploit Framework with msfupdate
and you can get more details on the changes since the last blog post from
GitHub:
If you are a git user, you can clone the Metasploit Framework repo (master branch) for the latest.
To install fresh without using git, you can use the open-source-only Nightly Installers or the binary installers (which also include the commercial edition).
The United States Government recently launched its National Cybersecurity Strategy. The Strategy outlines the administration’s ambitious vision for building a more resilient future, both in the United States and around the world, and it affirms the key role cloud computing plays in realizing this vision.
Amazon Web Services (AWS) is broadly committed to working with customers, partners, and governments such as the United States to improve cybersecurity. That longstanding commitment aligns with the goals of the National Cybersecurity Strategy. In this blog post, we will summarize the Strategy and explain how AWS will help to realize its vision.
The Strategy identifies two fundamental shifts in how the United States allocates cybersecurity roles, responsibilities, and resources. First, the Strategy calls for a shift in cybersecurity responsibility away from individuals and organizations with fewer resources, toward larger technology providers that are the most capable and best-positioned to be successful. At AWS, we recognize that our success and scale bring broad responsibility. We are committed to improving cybersecurity outcomes for our customers, our partners, and the world at large.
Second, the Strategy calls for realigning incentives to favor long-term investments in a resilient future. As part of our culture of ownership, we are long-term thinkers, and we don’t sacrifice long-term value for short-term results. For more than fifteen years, AWS has delivered security, identity, and compliance services for millions of active customers around the world. We recognize that we operate in a complicated global landscape and dynamic threat environment that necessitates a dynamic approach to security. Innovation and long-term investments have been and will continue to be at the core of our approach, and we continue to innovate to build and improve on our security and the services we offer customers.
AWS is working to enhance cybersecurity outcomes in ways that align with each of the Strategy’s five pillars:
Defend Critical Infrastructure — Customers, partners, and governments need confidence that they are migrating to and building on a secure cloud foundation. AWS is architected to have the most flexible and secure cloud infrastructure available today, and our customers benefit from the data centers, networks, custom hardware, and secure software layers that we have built to satisfy the requirements of the most security-sensitive organizations. Our cloud infrastructure is secure by design and secure by default, and our infrastructure and services meet the high bar that the United States Government and other customers set for security.
Disrupt and Dismantle Threat Actors — At AWS, our paramount focus on security leads us to implement important measures to prevent abuse of our services and products. Some of the measures we undertake to deter, detect, mitigate, and prevent abuse of AWS products include examining new registrations for potential fraud or identity falsification, employing service-level containment strategies when we detect unusual behavior, and helping protect critical systems and sensitive data against ransomware. Amazon is also working with government to address these threats, including by serving as one of the first members of the Joint Cyber Defense Collaborative (JCDC). Amazon is also co-leading a study with the President’s National Security Telecommunications Advisory Committee on addressing the abuse of domestic infrastructure by foreign malicious actors.
Shape Market Forces to Drive Security and Resilience — At AWS, security is our top priority. We continuously innovate based on customer feedback, which helps customer organizations to accelerate their pace of innovation while integrating top-tier security architecture into the core of their business and operations. For example, AWS co-founded the Open Cybersecurity Schema Framework (OCSF) project, which facilitates interoperability and data normalization between security products. We are contributing to the quality and safety of open-source software both by direct contributions to open-source projects and also by an initial commitment of $10 million in a variety of open-source security improvement projects in and through the Open Source Security Foundation (OpenSSF).
Invest in a Resilient Future — Cybersecurity skills training, workforce development, and education on next-generation technologies are essential to addressing cybersecurity challenges. That’s why we are making significant investments to help make it simpler for people to gain the skills they need to grow their careers, including in cybersecurity. Amazon is committing more than $1.2 billion to provide no-cost education and skills training opportunities to more than 300,000 of our own employees in the United States, to help them secure new, high-growth jobs. Amazon is also investing hundreds of millions of dollars to provide no-cost cloud computing skills training to 29 million people around the world. We will continue to partner with the Cybersecurity and Infrastructure Security Agency (CISA) and others in government to develop the cybersecurity workforce.
Forge International Partnerships to Pursue Shared Goals — AWS is working with governments around the world to provide innovative solutions that advance shared goals such as bolstering cyberdefenses and combating security risks. For example, we are supporting international forums such as the Organization of American States to build security capacity across the hemisphere. We encourage the administration to look toward internationally recognized, risk-based cybersecurity frameworks and standards to strengthen consistency and continuity of security among interconnected sectors and throughout global supply chains. Increased adoption of these standards and frameworks, both domestically and internationally, will mitigate cyber risk while facilitating economic growth.
AWS shares the Biden administration’s cybersecurity goals and is committed to partnering with regulators and customers to achieve them. Collaboration between the public sector and industry has been central to US cybersecurity efforts, fueled by the recognition that the owners and operators of technology must play a key role. As the United States Government moves forward with implementation of the National Cybersecurity Strategy, we look forward to redoubling our efforts and welcome continued engagement with all stakeholders—including the United States Government, our international partners, and industry collaborators. Together, we can address the most difficult cybersecurity challenges, enhance security outcomes, and build toward a more secure and resilient future.
If you have feedback about this post, submit comments in the Comments section below. If you have questions about this post, contact AWS Support.
Want more AWS Security news? Follow us on Twitter.
This is a guest blog post co-written with Sumesh M R from Cargotec and Tero Karttunen from Knowit Finland.
Cargotec (Nasdaq Helsinki: CGCBV) is a Finnish company that specializes in cargo handling solutions and services. They are headquartered in Helsinki, Finland, and operates globally in over 100 countries. With its leading cargo handling solutions and services, they are pioneers in their field. Through their unique position in ports, at sea, and on roads, they optimize global cargo flows and create sustainable customer value.
Cargotec captures terabytes of IoT telemetry data from their machinery operated by numerous customers across the globe. This data needs to be ingested into a data lake, transformed, and made available for analytics, machine learning (ML), and visualization. For this, Cargotec built an Amazon Simple Storage Service (Amazon S3) data lake and cataloged the data assets in AWS Glue Data Catalog. They chose AWS Glue as their preferred data integration tool due to its serverless nature, low maintenance, ability to control compute resources in advance, and scale when needed.
In this blog, we discuss the technical challenges faced by Cargotec in replicating their AWS Glue metadata across AWS accounts, and how they navigated these challenges successfully to enable cross-account data sharing. By sharing their story, we hope to inspire readers facing similar challenges and provide insights into how our services can be customized to meet your specific needs.
Challenges
Like many customers, Cargotec’s data lake is distributed across multiple AWS accounts that are owned by different teams. Cargotec wanted to find a solution to share datasets across accounts and use Amazon Athena to query them. To share the datasets, they needed a way to share access to the data and access to catalog metadata in the form of tables and views. Cargotec’s use cases also required them to create views that span tables and views across catalogs. Cargotec’s implementation covers three discrete AWS accounts, 25 databases, 150 tables, and 10 views.
Solution overview
Cargotec required a single catalog per account that contained metadata from their other AWS accounts. The solution that best fit their needs was to replicate metadata using an in-house version of a publicly available utility called Metastore Migration utility. Cargotec extended the utility by changing the overall orchestration layer by adding an Amazon SQS notification and an AWS Lambda. The approach was to programmatically copy and make available each catalog entity (databases, tables, and views) to all consumer accounts. This makes the tables or views local to the account where the query is being run, while the data still remains in its source S3 bucket.
Cargotec’s solution architecture
The following diagram summarizes the architecture and overall flow of events in Cargotec’s design.
Catalog entries from a source account are programmatically replicated to multiple target accounts using the following series of steps.
An AWS Glue job (metadata exporter) runs daily on the source account. It reads the table and partition information from the source AWS Glue Data Catalog. Since the target account is used for analytical purposes and does not require real-time schema changes, the metadata exporter runs only once a day. Cargotec uses partition projection, which ensures that the new partitions are available in real-time.
The job then writes the metadata to an S3 bucket in the same account. Please note that the solution doesn’t involve movement of the data across accounts. The target accounts read data from the source account S3 buckets. For guidance on setting up the right permissions, please see the Amazon Athena User Guide.
After the metadata export has been completed, the AWS Glue job pushes a notification to an Amazon Simple Notification Service (Amazon SNS) topic. This message contains the S3 path to the latest metadata export. The SNS notification is Cargotec’s customization to the existing open-source utility.
Every target account runs an AWS Lambda function that is notified when the source account SNS topic receives a push. In short, there are multiple subscriber Lambda functions (one per target account) for the source account SNS topics that get triggered when an export job is completed.
Once triggered, the Lambda function then initiates an AWS Glue job (metadata importer) on the respective target account. The job receives as input the source account’s S3 path to the metadata that has been recently exported.
Based on the path provided, the metadata importer reads the exported metadata from the source S3 bucket.
The metadata importer now uses this information to create or update the corresponding catalog information in the target account.
All along the way, any errors are published to a separate SNS topic for logging and monitoring purposes. With this approach, Cargotec was able to create and consume views that span tables and views from multiple catalogs spread across different AWS accounts.
Implementation
The core of the catalog replication utility is two AWS Glue scripts:
Metadata exporter – An AWS Glue job that reads the source data catalog and creates an export of the databases, tables, and partitions in an S3 bucket in the source account.
Metadata importer – An AWS Glue job that reads the export that was created by the metadata exporter and applies the metadata to target databases. This code is triggered by a Lambda function once files are written to S3. The job runs in the target account.
Metadata exporter
This section provides details on the AWS Glue job that exports the AWS Glue Data Catalog into an S3 location. The source code for the application is hosted the AWS Glue GitHub. Though this may need to be customized to suit your needs, we will go over the core components of the code in this blog.
Metadata exporter inputs
The application takes a few job input parameters as described below:
--mode key accepts either to-s3 or to-jdbc. The latter is used when the code is moving the metadata directly into a JDBC Hive Metastore. In the case of Cargotec, since we are moving the metadata to files on S3, the value for --mode will remain to-s3.
--output-path accepts an S3 location to which the exported metadata should be written. The code creates subdirectories corresponding to databases, tables, and partitions.
--database-names accepts a semicolon-separated list of databases on the source catalog that need to be replicated to the target
Reading the catalog
The metadata about the database, tables, and partitions are read from the AWS Glue catalog.
The above code snippet reads the metadata into an AWS Glue DynamicFrame. The frame is then converted to a Spark DataFrame. It is filtered into individual DataFrames based on it being either part of a database, table, or partition. A schema is attached to the data frame using one of the below:
Navigate to the S3 bucket that contains the output location, and you should be able to see the output metadata in format. An example export for a table would look like the following code snippet.
Once the export job is complete, the output S3 path will be pushed to an SNS topic. A Lambda function at the target account processes this message and invokes the import AWS Glue job by passing the S3 import location.
Metadata importer
The import job runs on the target account. The code for the job is available on GitHub. As with the exporter, you may need to customize it to suit your specific requirements, but the code as-is should work for most scenarios.
Metadata importer inputs
The inputs to the application are provided as job parameters. Below is a list of parameters that are used for the import process:
--mode key accepts either from-s3 or from-jdbc. The latter is used when migration is from a JDBC source to the AWS Glue Data Catalog. At Cargotec, the metadata is already written to Amazon S3, and hence the value for this key is always set to from-s3.
--region key accepts a valid AWS Region for the AWS Glue Catalog. The target Region is specified using this key.
--database-input-path key accepts the path to the file containing the database metadata. This is the output of the previous import job.
--table-input-path key accepts the path to the file containing the table metadata. This is the output of the previous import job.
--partition-input-path key accepts the path to the file containing the partition metadata. This is the output of the previous import job.
Reading the metadata
The metadata, as previously discussed, are files on Amazon S3. They are read into individual spark data frames with their respective schema information
Once the spark data frames are read, they are converted to AWS Glue DynamicFrame and then loaded to the catalog, as shown in the following snippet.
glue_context.write_dynamic_frame.from_options(
        frame=dyf_databases,
        connection_type='catalog',
        connection_options={
               'catalog.name': datacatalog_name,
               'catalog.region': region
         }
)
glue_context.write_dynamic_frame.from_options(
        frame=dyf_tables,
        connection_type='catalog',
        connection_options={
                'catalog.name': datacatalog_name,
                'catalog.region': region
        }
)
glue_context.write_dynamic_frame.from_options(
        frame=dyf_partitions,
        connection_type='catalog',
        connection_options={
                 'catalog.name': datacatalog_name,
                 'catalog.region': region
         }
)
Once the job concludes, you can query the target AWS Glue catalog to ensure the tables from the source have been synced with the destination. To keep things simple and easy to manage, instead of implementing a mechanism to identify tables that change over time, Cargotec updates the catalog information of all databases or tables that are configured in the export job.
Considerations
Though the setup works effectively for Cargotec’s current business requirements, there are a few drawbacks to this approach, which are highlighted below:
The solution involves code. Customizations were made to the existing open-source utility to be able to publish an SNS notification once an export is complete and a Lambda function to trigger the import process.
The export process on the source account is a scheduled job. Hence there is no real-time sync between the source and target accounts. This was not a requirement for Cargotec’s business process.
For tables that don’t use Athena partition projection, query results may be outdated until the new partitions are added to the metastore through MSCK REPAIR TABLE, ALTER TABLE ADD PARTITION, AWS Glue crawler, and so on.
The current approach requires syncing all the tables across the source and target. If the requirement is to capture only the ones that changed instead of a scheduled daily export, the design needs to change and could benefit from the Amazon EventBridge integration with AWS Glue. An example implementation of using AWS Glue APIs to identify changes is shown in Identify source schema changes using AWS Glue.
Conclusion
In this blog post, we have explored a solution for cross-account sharing of data and tables that makes it possible for Cargotec to create views that combine data from multiple AWS accounts. We’re excited to share Cargotec’s success and believe the post has provided you with valuable insights and inspiration for your own projects.
We encourage you to explore our range of services and see how they can help you achieve your goals. Lastly, for more data and analytics blogs, feel free to bookmark the AWS Blogs.
About the Authors
Sumesh M R is a Full Stack Machine Learning Architect at Cargotec. He has several years of software engineering and ML background. Sumesh is an expert in Sagemaker and other AWS ML/Analytics services. He is passionate about data science and loves to explore the latest ML libraries and techniques. Before joining Cargotec, he worked as a Solution Architect at TCS. In his spare time, he loves to play cricket and badminton.
Tero Karttunen is a Senior Cloud Architect at Knowit Finland. He advises clients on architecting and adopting Data Architectures that best serve their Data Analytics and Machine Learning needs. He has helped Cargotec in their data journey for more than two years. Outside of work, he enjoys running, winter sports, and role-playing games.
Arun A K is a Big Data Specialist Solutions Architect at AWS. He works with customers to provide architectural guidance for running analytics solutions on AWS Glue, AWS Lake Formation, Amazon Athena, and Amazon EMR. In his free time, he likes to spend time with his friends and family.
This post is written by Praveen Koorse, Senior Solutions Architect, AWS.
AWS Lambda now supports Ruby 3.2 runtime. With this release, Ruby developers can now take advantage of new features and improvements introduced in Ruby 3 when creating serverless applications on Lambda. Use this runtime today by specifying the runtime parameter of ruby3.2 when creating or updating Lambda functions.
Ruby 3.2 adds many features and performance improvements, including anonymous arguments passing improvements, ‘endless’ methods, Regexp improvements, a new Data class, support for pattern-matching in Time and MatchData, and support for ‘find pattern’ in pattern matching.
Our testing shows Ruby 3.2 cold starts are marginally slower than Ruby 2.7 for a trivial ‘hello world’ function. However, for many real-world workloads, the improved execution performance of Ruby 3.2 results in similar or better performance overall.
Existing Lambda customers using the Ruby 2.7 runtime should migrate to the Ruby 3.2 runtime as soon as possible. Even though community support for Ruby 2.7 has ended, Lambda has extended support for the Ruby 2.7 runtime until December 7, 2023 to provide existing Ruby customers with time to transition to Ruby 3.2. Functions using Ruby 2.7 continue to be eligible for technical support and Lambda will continue to apply OS security updates to the runtime until this date.
Anonymous arguments passing improvements
Ruby 3.2 has introduced improvements to how you can pass anonymous arguments, making it easier and cleaner to work with keyword arguments in code. Previously, you could pass anonymous keyword arguments to a method by using the delegation syntax (…) or use Module#ruby2_keywords and delegate *args, &block. This method was not intuitive and lacked clarity when working with multiple arguments.
def foo(...)
  target(...)
end

ruby2_keywords def foo(*args, &block)
  target(*args, &block)
end
Now, if a method declaration includes anonymous positional or keyword arguments, those can be passed to the next method as arguments themselves. The same advantages of anonymous block forwarding apply to rest and keyword rest argument forwarding.
def keywords(**) # accept keyword arguments
  foo(**) # pass them to the next method
end

def positional(*) # accept positional arguments
  bar(*) # pass to the next method
end

def positional_keywords(*, **) # same as ...
  foobar(*, **)
end
Endless methods
Ruby 3 introduced endless methods that enable developers to define methods of exactly one statement with a syntax def method() = statement. The syntax doesn’t need an end and allows methods to be defined as short-cut one liners, making the creation of basic utility methods easier and helping developers write clean code and improve readability and maintainability of code.
Regular expression matching can take an unexpectedly long time. If your code attempts to match a possibly inefficient Regexp against an untrusted input, an attacker may exploit it for efficient denial of service (so-called regular expression DoS, or ReDoS).
Ruby 3.2 introduces two improvements to mitigate this.
As the prior optimization cannot be applied to some regular expressions, such as those using advanced features or working with a huge fixed number of repetitions, a Regexp timeout improvement now allows you to specify a timeout for Regexp operations as a fallback measure.
There are two APIs to set timeout:
Timeout.timeout: This is a global configuration and applies to all Regexps in the process.
timeout keyword for Regexp.new: This allows you to specify a different timeout setting for some Regexps. If used, it takes precedence over the global configuration.
Regexp.timeout = 2.0 # Global configuration set to two seconds
/^x*y?x*()\1$/ =~ "x" * 45000 + "a"
#=> Regexp::TimeoutError is raised in two seconds

my_long_rexp = Regexp.new('^x*y?x*()\1$', timeout: 4)
my_long_rexp =~ "x" * 45000 + "a"
# Regexp::TimeoutError is raised in four seconds
Once a Data class is defined using Data.define, both positional and keyword arguments can be used while constructing objects.
def handler(event:, context:)
  employee = Data.define(:firstname, :lastname, :empid, :department)

  emp1 = employee.new('John', 'Doe', 12345, 'Sales')
  emp2 = employee.new(firstname: 'Alice', lastname: 'Doe', empid: 12346, department: 'Marketing')

  # Alternative form to construct an object
  emp3 = employee['Jack', 'Frost', 12354, 'Tech']
  emp4 = employee[firstname: 'Emma', lastname: 'Frost', empid: 12453, department: 'HR']
end
Pattern matching improvements
Pattern matching is a feature allowing deep matching of structured values: checking the structure and binding the matched parts to local variables.
Ruby 3.2 introduces ‘Find pattern’, allowing you to check if the given object has any elements that match a pattern. This pattern is similar to the Array pattern, except that it finds the first match in a given object containing multiple elements.
For example, previously, if you used the following in a Lambda function:
person = {name: "John", children: [{name: "Mark", age: 12}, {name: "Butler", age: 9}], siblings: [{name: "Mary", age: 31}, {name: "Conrad", age: 38}] }

case person
in {name: "John", children: [{name: "Mark", age: age}]}
  p age
end
This wouldn’t match because it does not search for the element in the ‘children’ array. It only matches for an array with a single element named “Mark”.
To find an element in an array with multiple elements, use ‘find pattern’:
case person
in {name: "John", children: [*, {name: "Mark", age: age}, *]}
  p age
end
As part of an effort to make core classes more pattern matching friendly, Ruby 3.2 also introduces the ability to deconstruct keys in Time and MatchData, allowing their use in case/in statements for pattern matching.
# `deconstruct_keys(nil)` provides all available keys:
timestamp = Time.now.deconstruct_keys(nil)

# Usage in pattern-matching:
case timestamp
in year: ...2022
  puts "Last year!"
in year: 2022, month: 1..3
  puts "Last year's first quarter"
in year: 2023, month:, day:
  puts "#{day} of #{month}th month!"
end
Standard Date and DateTime classes also have similar implementations for key deconstruction:
Pattern matching with MatchData result deconstruction:
case db_connection_string.match(%r{postgres://(\w+):(\w+)@(.+)})
in 'admin', password, server
  # do connection with admin rights
in 'devuser', _, 'dev-server.us-east-1.rds.amazonaws.com'
  # connect to dev server
in user, password, server
  # do regular connection
end
YJIT – Yet Another Ruby JIT
YJIT, a lightweight, minimalistic Ruby JIT compiler built inside CRuby, is now an official part of the Ruby 3.2 runtime. It provides significantly higher performance, but also uses more memory than the Ruby interpreter and is generally suited for Ruby on Rails workloads.
By default, YJIT is not enabled in the Lambda Ruby 3.2 runtime. You can enable it for specific functions by setting the RUBY_YJIT_ENABLE environment variable to 1. Once enabled, you can verify it by printing the result of the RubyVM::YJIT.enabled? method.
puts(RubyVM::YJIT.enabled?())
# => true
Using Ruby 3.2 in Lambda
AWS Cloud Development Kit (AWS CDK):
In AWS CDK, set the runtime attribute to Runtime.RUBY_3_2 when creating the function to use this version. In TypeScript:
import * as cdk from 'aws-cdk-lib';
import * as lambda from 'aws-cdk-lib/aws-lambda';

export class MyCdkStack extends cdk.Stack {

  constructor(scope: cdk.App, id: string, props?: cdk.StackProps) {
    	super(scope, id, props);

new lambda.Function(this, 'Ruby32Lambda', {
  		runtime: lambda.Runtime.RUBY_3_2, //execution environment
  		handler: 'test.handler', //file is “test”, function is “handler”
  	code: lambda.Code.fromAsset('lambda'), //code loaded from “lambda” dir
});
}
AWS Management Console
In the Lambda console, specify a runtime parameter value of Ruby 3.2 when creating or updating a function. The Ruby 3.2 runtime is now available in the Runtime dropdown in the Create function page.
To update an existing Lambda function to Ruby 3.2, navigate to the function in the Lambda console, then choose Edit in the Runtime settings panel. The new version of Ruby is available in the Runtime dropdown:
AWS Serverless Application Model
In the AWS Serverless Application Model (AWS SAM), set the Runtime attribute to ruby3.2 to use this version in your application deployments:
AWSTemplateFormatVersion: '2010-09-09'
Transform: AWS::Serverless-2016-10-31
Description: AWS Lambda Ruby 3.2 example

Resources:
  Ruby32Lambda:
    Type: AWS::Serverless::Function
    Description: 'Lambda function that uses the Ruby3.2 runtime'
    Properties:
      FunctionName: Ruby32Lambda
      Handler: function.handler
      Runtime: ruby3.2
      CodeUri: src/
Conclusion
Get started building with Ruby 3.2 today by making necessary changes for compatibility with Ruby 3.2, and specifying a runtime parameter value of ruby3.2 when creating or updating your Lambda functions. You can read about the Ruby programming model in the Lambda documentation to learn more about writing functions in Ruby 3.2.
For more serverless learning resources, visit Serverless Land.
Gao Xiang gave an overview of the Extended Read-Only File
System (EROFS) in a filesystem session at the 2023 Linux Storage, Filesystem,
Memory-Management and BPF Summit. EROFS was added
to Linux 5.4 in 2019 and has been increasingly used in
places beyond its roots as a filesystem for Android and embedded devices.
Container images
based on EROFS are being used in many places these days, for example.
In a multi-tenant architecture multiple instances of an application run on a shared infrastructure. With this type of approach, each tenant is isolated from others, typically through logical separation, while utilizing a shared infrastructure. This allows multiple tenants to use the same application and maintain their data security, privacy, and customization requirements.
Understanding architectural patterns for multi-tenancy has become crucial for architects and developers aiming to deliver scalable, secure, and cost-effective solutions. Isolating tenant data is a fundamental responsibility for Software as a Service (SaaS) providers. In this edition of Let’s Architect!, we talk about comprehensive exploration of multi-tenant architectures, covering various aspects, such as SaaS microservices, SaaS serverless, SaaS EKS, and an insightful whitepaper.
In this session, Michael Beardsley, Principal Solutions Architect at AWS, takes a deep dive into the realm of multi-tenant microservices, exploring various patterns and strategies that enable the seamless implementation of multi-tenant microservices, all while ensuring that additional complexity is not imposed upon the SaaS builders. He shares practical patterns to simplify the development process by addressing crucial aspect, such as authorization, data access, tenant isolation, metrics, billing, logging, and a plethora of other considerations; this is irrespective of the chosen compute platform (like Amazon Elastic Container Service, Amazon Elastic Kubernetes Service [Amazon EKS], or AWS Lambda) or database solution.
There is another session available that highlights specific techniques and architecture strategies that can directly impact the success of a SaaS business. If you’re interested in learning more about optimizing multi-tenant SaaS architecture, this session is a great opportunity.
In this AWS Partner Network (APN) Blog post, you will explore a reference solution that presents a comprehensive perspective on a functional multi-tenant serverless SaaS environment. This solution effectively showcases various essential components required to construct a multi-tenant SaaS solution using serverless services, including onboarding processes, tenant isolation mechanisms, data partitioning techniques, a tenant deployment pipeline, and robust observability measures.
By delving into these aspects, you can gain valuable insights into the architecture and design considerations involved in creating a successful multi-tenant SaaS solution.
In this re:Invent 2021 presentation, Tod Golding, Principal Partner Solutions Architect, chats about a SaaS reference solution that addresses fundamental multi-tenant considerations, examining its approach to core SaaS topics, including tenant isolation, identity, onboarding, tenant administration, and data partitioning. The goal is to explore an Amazon EKS SaaS architecture through the lens of working code and highlight the key architectural strategies that were used in this reference environment.
There is also valuable information available on Github regarding EKS multi-tenancy. Exploring the Github repositories related to EKS multi-tenancy can provide further insights, resources, and practical examples for implementing multi-tenant architectures on EKS. This presentation is an engaging way to dive deeper into this topic and gain a more comprehensive understanding of best practices and real-world implementations.
Storage represents a challenging aspect of building and delivering multi-tenant software solutions. There are different strategies that can be used to partition tenant data, each with a unique set of trade-offs for implementing separation between tenants. This whitepaper covers different storage models for multi-tenancy; in particular, you can learn about the:
Silo model (data from the tenant is fully isolated)
Pool model (all the tenants use the same database and table)
Bridge model (single database but a different table for each tenant)
For each of these models, the whitepaper describes in detail how they can be implemented, as well as the different trade-offs in terms of isolation and agility. You can also discover how these tenancy models can be implemented specifically on databases, such as Amazon DynamoDB and Amazon Relational Database Service, thus covering both NoSQL and SQL scenarios.
От 31 май до 2 юни оперативни работници на СДВР осъществяват външно наблюдение на ул. Димчо Дебелянов 1 в София. Интересува ги лицето Асен Любенов Найденов, който живее там във…
Version
15.5 of the openSUSE Leap distribution has been released. This is not
intended as a feature release, but brings updated versions of many
packages. The project has also announced
that there will be one more 15.x release before that series ends and users
have to migrate to whatever its successor will be.
In January 2021, we gave you a behind-the-scenes look at how we built Waiting Room on Cloudflare’s Durable Objects. Today, we are thrilled to announce the launch of Waiting Room Analytics and tell you more about how we built this feature. Waiting Room Analytics offers insights into end-user experience and provides visualizations of your waiting room traffic. These new metrics enable you to make well-informed configuration decisions, ensuring an optimal end-user experience while protecting your site from overwhelming traffic spikes.
If you’ve ever bought tickets for a popular concert online you’ll likely have been put in a virtual queue. That’s what Waiting Room provides. It keeps your site up and running in the face of overwhelming traffic surges. Waiting Room sends excess visitors to a customizable virtual waiting room and admits them to your site as spots become available.
While customers have come to rely on the protection Waiting Room provides against traffic surges, they have faced challenges analyzing their waiting room’s performance and impact on end-user flow. Without feedback about waiting room traffic as it relates to waiting room settings, it was challenging to make Waiting Room configuration decisions.
Up until now, customers could only monitor their waiting room's status endpoint to get a general idea of waiting room traffic. This endpoint displays the current number of queued users, active users on the site, and the estimated wait time shown to the last user in line.
The status endpoint is still a great tool for at a glance understanding of the near real-time status of a waiting room. However, there were many questions customers had about their waiting room that were either difficult or impossible to answer using the status endpoint, such as:
How long did visitors wait in the queue?
What was my peak number of visitors?
How long was the pre-queue for my online event?
How did changing my waiting room's settings impact wait times?
Today, Waiting Room is ready to answer those questions and more with the launch of Waiting Room Analytics, available in the Waiting Room dashboard to all Business and Enterprise plans! We will show you the new waiting room metrics available and review how these metrics can help you make informed decisions about your waiting room's settings. We'll also walk you through the unique challenge of how we built Waiting Room Analytics on our distributed network.
How Waiting Room settings impact traffic
Before covering the newly available Waiting Room metrics, let's review some key settings you configure when creating a waiting room. Understanding these settings is essential as they directly impact your waiting room's analytics, traffic, and user experience.
When configuring a waiting room, you will first define traffic limits to your site by setting two values–Total active users and New users per minute. Total active users is a target threshold for how many simultaneous users you want to allow on the pages covered by your waiting room. Waiting Room will kick in as traffic ramps up to keep active users near this limit. The other value which will control the volume of traffic allowed past your waiting room is New users per minute. This setting defines the target threshold for the maximum rate of user influx to your application. Waiting Room will kick in when the influx accelerates to keep this rate near your limits. Queuing occurs when traffic is at or near your New users per minute or Total active users target values.
The two other settings which will impact your traffic flow and user wait times are Session duration and session renewal. The session duration setting determines how long it takes for end-user sessions to expire, thereby freeing up spots on your site. If you enable session renewal, users can stay on your site as long as they want, provided they make a request once every session_duration minutes. If you disable session renewal, users' sessions will expire after the duration you set for session_duration has run out. After the session expires, the user will be issued a new waiting room cookie upon their next request. If there is active queueing, this user will be placed in the back of the queue. Otherwise, they can continue browsing for another session_duration minutes.
Let's walk through the new analytics available in the Waiting Room dashboard, which allows you to see how these settings can impact waiting room throughput, how many users get queued, and how long users wait to enter your site from the queue.
Waiting Room Analytics in the dash
To access metrics for a waiting room, navigate to the Waiting Room dashboard, where you can find pre-built visualizations of your waiting room traffic. The dashboard offers at-a-glance metrics for the peak waiting room traffic over the last 24 hours.
To dig deeper and analyze up to 30 days of historical data, open your waiting room's analytics by selecting View more.
Alternatively, we've made it easy to hone in on analytics for a past waiting room event (within the last 30 days). You can automatically open the analytics dashboard to a past event's exact start and end time, including the pre-queueing period by selecting the blue link in the events table.
User insights
The first two metrics–Time in queue and Time on origin–provide insights into your end-users' experience and behavior. The time in queue values help you understand how long queued users waited before accessing your site over the time period selected. The time on origin values shed light on end-user behavior by displaying an estimate of the range of time users spend on your site before leaving. If session renewal is disabled, this time will max out at session_duration and reflect the time at which users are issued a new waiting room cookie. For both metrics, we provide time for both the typical user, represented by a range of the 50th and 75th percentile of users, as well as for the top 5% of users who spend the longest in the queue or on your site.
If session renewal is disabled, keeping an eye on Time on origin values is especially important. When sessions do not renew, once a user's session has expired, they are given a new waiting room cookie upon their next request. The user will be put at the back of the line if there is active queueing. Otherwise, they will continue browsing, but their session timer will start over and your analytics will never show a Time on origin greater than your configured session duration, even if individual users are on your site longer than the session duration. If session renewal is disabled and the typical time on origin is close to your configured session duration, this could be an indicator you may need to give your users more time to complete their journey before putting them back in line.
Analyze past waiting room traffic
Scrolling down the page, you will find visualizations of your user traffic compared to your waiting room's target thresholds for Total active users and New users per minute. These two settings determine when your waiting room will start queueing as traffic increases. The Total active users setting controls the number of concurrent users on your site, while the New users per minute threshold restricts the flow rate of users onto your site.
To zoom in on a time period, you can drag your cursor from the left to the right of the time period you are interested in and the other graphs, in addition to the insights will update to reflect this time period.
On the Active users graph, each bar represents the maximum number of queued users stacked on top of the maximum number of users on your site at that point in time. The example below shows how the waiting room kicked in at different times with respect to the active user threshold. The total length of the bar illustrates how many total users were either on the site or waiting to enter the site at that point in time, with a clear divide between those two values where the active user threshold kicked in. Hover over any bar to display a tooltip with the exact values for the period you are interested in.
Easily identify peak traffic and when waiting room started queuing to protect your site from a traffic surge.
Below the Active users chart is the New users per minute graph, which shows the rate of users entering your application per minute compared to your configured threshold. Make sure to review this graph to identify any surges in the rate of users to your application that may have caused queueing.
The New users per minute graph helps you identify peaks in the rate of users entering your site which triggered queueing.This graph shows queued user and active user data from the same time period as the spike seen in New users per minute graph above. When analyzing your waiting room’s metrics, be sure to review both graphs to understand which Waiting Room traffic setting triggered queueing and to what extent.
Adjusting settings with Waiting Room Analytics
By leveraging the insights provided by the analytics dashboard, you can fine-tune your waiting room settings while ensuring a safe and seamless user experience. A common concern for customers is longer than desired wait times during high traffic periods. We will walk through some guidelines for evaluating peak traffic and settings’ adjustments that could be made.
Identify peak traffic. The first step is to identify when peak traffic occurred. To do so, zoom out to 30 days or some time period inclusive of a known high traffic event. Reviewing the graph, locate a period of time where traffic peaked and use your cursor to highlight from the left to right of the peak. This will zoom in to that time period, updating all other values on the analytics page.
Evaluate wait times. Now that you have honed in on the time period of peak traffic, review the Time in queue metric to analyze if the wait times during peak traffic were acceptable. If you determine that wait times were significantly longer than you had anticipated, consider the following options to reduce wait times for your next traffic peak.
Decrease session duration when session renewal is enabled. This is a safe option as it does not increase the allowed load to your site. By decreasing this duration, you decrease the amount of time it takes for spots to open up as users go idle. This is a good option if your customer journey is typically request heavy, such as a checkout flow. For other situations, such as video streaming or long-form content viewing, this may not be a good option as users may not make frequent requests even though they are not actually idle.
Disable session renewal. This option also does not increase the allowed load to your site. Disabling session renewal means that users will have session_duration minutes to stay on the site before being put back in the queue. This option is popular for high demand events such as product drops, where customers want to give as many users as possible a fair chance to participate and avoid inventory hoarding. When disabling session renewal, review your waiting room’s analytics to determine an appropriate session duration to set.
The Time on origin values will give you an idea of how long users need before leaving your site. In the example below, the session duration is set to 10 minutes but even the users who spend the longest only spend around 5 minutes on the site. With the session renewal disabled, this customer could reduce wait times by decreasing the session duration to 5 minutes without disruption to most users, allowing for more users to get access.
Adjust Total active users or New users per minute settings. Lastly, you can decrease wait times by increasing your waiting room’s traffic limits–Total active users or New users per minute. This is the most sure-fire way to reduce wait times but it also requires more consideration. Before increasing either limit, you will need to evaluate if it is safe to do so and make small, iterative adjustments to these limits, monitoring certain signals to ensure your origin is still able to handle the load. A few things to consider monitoring as you adjust settings are origin CPU usage and memory utilization, and increases in 5xx errors which can be reviewed in Cloudflare’s Web Analytics tab. Analyze historical traffic patterns during similar events or periods of high demand. If you observe that previous traffic surges were successfully managed without site instability or crashes, it provides a strong signal that you can consider increasing waiting room limits.
Utilize the Active user chart as well as the New users per minute chart to determine which limit is primarily responsible for triggering queuing so that you know which limit to adjust. After considering these signals and making adjustments to your waiting room’s traffic limits, closely monitor the impact of these changes using the waiting room analytics dashboard. Continuously assess the performance and stability of your site, keeping an eye on server metrics and user feedback.
How we built Waiting Room Analytics
At Cloudflare, we love to build on top of our own products. Waiting Room is built on Workers and Durable Objects. Workers have the ability to auto-scale based on the request rate. They are built using isolates enabling them to spin up hundreds or thousands of isolates within 5 milliseconds without much overhead. Every request that goes to an application behind a waiting room, goes to a Worker.
We optimized the way in which we track end users visiting the application while maintaining their position in the queue. Tracking every user individually would incur more overhead in terms of maintaining state, consuming more CPU & memory. Instead, we decided to divide the users into buckets based on the timestamp of the first request made by the end user. For example, all the users who visited a waiting room between 00:00:00 and 00:00:59 for the first time are assigned to the bucket 00:00:00. Every end user gets a unique encrypted cookie on the first request to the waiting room. The contents of the cookie keep getting updated based on the status of the users in the queue. Once the end user is accepted to the origin, we set the cookie expiry to session_duration minutes, which can be set in the dashboard, from the last request timestamp. In the cookie we track the timestamp of when the end user joined the queue which is used in the calculation of time waited in queue.
Collection of metrics in a distributed environment
a
In a distributed environment, the challenge when building out analytics is to collect data from multiple nodes and aggregate them. Each worker running at every data center sees user requests and needs to report metrics based on those to another coordinating service at every data center. The data aggregation could have been done in two ways.
i) Writing data from every worker when a request is received In this design, every worker that receives a request is responsible for reporting the metrics. This would enable us to write the raw data to our analytics pipeline. We would not have the overhead of aggregating the data before writing. This would mean that we would write data for every request, but Waiting Room configurations are minute based and every user is put into a bucket based on the timestamp of the first request. All our configurations are minute and user based and the data written from workers is not related to time or user.
ii) Using the existing aggregation pipeline Waiting Room is designed in such a way that we do not track every request, instead we group users into buckets based on the first time we saw them. This is tracked in the cookie that is issued to the user when they make the first request. In the current system, the data reported by the workers is sent upstream to the data center coordinator which is responsible for aggregating the data seen from all the workers for that particular data center. This aggregated data is then further processed and sent upstream to the global Durable Object which aggregates the data from all the other data centers. This data is used for making decisions whether to queue the user or to send them to the origin.
We decided to use the existing pipeline that is used for Waiting Room routing for analytics. Data aggregated this way provides more value to customers as it matches the model we use for routing decisions. Therefore, customers can see directly how changing their settings affects waiting room behavior. Also, it is an optimization in terms of space. Instead of writing analytics data per request, we are writing a pre-processed and aggregated analytics log every minute. This way the data is much less noisy.
This diagram depicts that multiple workers from different locations receive requests and talk to the data center coordinators respectively which aggregate data and report the aggregated keys upstream to the Global Durable Object. The Global Durable Objects further aggregate all the keys received from the data center coordinators to compute a global aggregate key.
Histograms
The metrics available via Cloudflare’s GraphQL API are a combination of configured values set by the customer when creating a waiting room and values that are computed based on traffic seen by a waiting room. Waiting Room aggregates data every minute for each metric based on the requests it sees. While some metrics like new users per minute, total active users are counts and can be pre-processed and aggregated with a simple summation, metrics like time on origin and total time waited in queue cannot simply be added together into a single metric.
For example, there could be users who waited in the queue for four minutes and there could be a new user who joined the queue two minutes ago. However, if we simply sum these two data points, it would not make sense because six minutes would be an incorrect representation of the total time waited in the queue. Therefore, to capture this value more accurately, we store the data in a histogram. This enables us to represent the typical case (50th percentile) and the approximate worst case (in this case 95th percentile) for that metric.
Intuitively, we decided to store time on origin and total time waited in queue into a histogram distribution so that we would be able to represent the data and calculate quantiles precisely. We used Hdr Histogram – A High Dynamic Range Histogram for recording the data in histograms. Hdr Histograms are scalable and we were able to record dynamic numbers of values with auto-resizing without inflating CPU, memory or introducing latency. The time to record a value in the Hdr Histograms range from 3-6 nanoseconds. Querying and recording values can be done in constant time. Two histogram data structures can simply be added together into a bigger histogram. Also, the histograms can be compressed and encoded/decoded into base64 strings. This enabled us to scalably pass the data structure within our internal services for further aggregation.
The memory footprint of hdr histograms is constant and depends on the size of the bucket, precision and range of the histogram. The size of the bucket we use is the default 32 bits bucket size. The precision of the histogram is set to include up to three significant digits. The histogram has a dynamic range of values enabled through the use of the auto-resize functionality. However, to ensure efficient data storage, a limit of 5,000 recorded points per minute has been imposed. Although this limit was chosen arbitrarily, it has proven to be adequate for storing data points transmitted from the workers to the Durable Objects on a minute-by-minute basis.
The requests to the website behind a Waiting Room go to a Cloudflare data center that is close to their location. Our workers from around the world record values in the histogram which is compressed and sent to the data center Durable Object periodically. The histograms from multiple workers are uncompressed and aggregated into a single histogram per data center. The resulting histogram is compressed and sent upstream to the Global Durable objects where the histograms from all data centers receiving traffic are uncompressed and aggregated. The resulting histogram is the final data structure which is used for statistical analysis. We directly query the aggregated histogram for the quantile values. The histogram objects were instantiated once at the start of the service, they were reset after every successful sync with the upstream service.
Writing data to the pipeline
The global Durable Object aggregates all the metrics, computes quantiles and sends the data to a worker which is responsible for analytics reporting. This worker reads data from Workers KV in order to get the Waiting Room configurations. All the metrics are aggregated into a single analytics message. These messages are written every minute to Clickhouse. We leveraged an internal version of Workers Analytics Engine in order to write the data. This allowed us to quickly write our logs to Clickhouse with minimum interactions with all the systems involved in the pipeline.
We write analytics events from the runtime in the form of blobs and doubles with a specific schema and the event data gets written to a Clickhouse cluster. We extract the data into a Clickhouse view and apply ABR to facilitate fast queries at any timescale. You can expand the time range to vary from 30 minutes to 30 days without any lag. ABR adaptively chooses the resolution of data based on the query. For example, it would choose a lower resolution for a long time range and vice versa. As of now, the analytics data is available in the Clickhouse table for 30 days, implying that you can not query data older than 30 days in the dashboard as well.
Sampling
Waiting Room Analytics samples the data in order to effectively run large queries while providing consistent response times. Indexing the data on Waiting Room id has enabled us to run quicker and more efficient scans, however we still need to elegantly handle unbounded data. To tackle this we use Adaptive Bit Rate which enables us to write the data at multiple resolutions (100%, 10%, 1%…) and then read the best resolution of the data. The sample rate “adapts” based on how long the query takes to run. If the query takes too long to run in 100% resolution, the next resolution is picked and so on until the first successful result. However, since we pre-process and aggregate data before writing to the pipeline, we expect 100% resolution of data on reads for shorter periods of time (up to 7 days). For a longer time range, the data will be sampled.
Get Waiting Room Analytics via GraphQL API
Lastly, to make metrics available to customers and to the Waiting Room dashboard, we exposed the analytics data available in Clickhouse via GraphQL API.
If you prefer to build your own dashboards or systems based on waiting room traffic data, then Waiting Room Analytics via GraphQL API is for you. Build your own custom dashboards using the GraphQL framework and use a GraphQL client such as GraphiQL to run queries and explore the schema.
The Waiting Room Analytics dataset can be found under the Zones Viewer as waitingRoomAnalyticsAdaptive and waitingRoomAnalyticsAdaptiveGroups. You can filter the dataset per zone, waiting_room_id and the request time period, see the dataset schema under ZoneWaitingRoomAnalyticsAdaptive. You can order the data by ascending or descending order of the metric values.
You can explore the dimensions under waitingRoomAnalyticsAdaptiveGroups that can be used to group the data based on time, Waiting Room id and so on. The "max", “min”, “avg”, “sum” functions give the maximum, minimum, average and sum values of a metric aggregated over a time period. Additionally, there is a function called "avgWeighted" that calculates the weighted average of the metric. This approach is used for metrics stored in histograms, such as the time spent on the origin and total time waited. Instead of using a simple average, the weighted average is computed to provide a more accurate representation. This approach takes into account the distribution and significance of different data points, ensuring a more precise analysis and interpretation of the metric.
For example, to evaluate the weighted average for time spent on origin, the value of total active users is used as a weight. To better illustrate this concept, let’s consider an example. Imagine there is a website behind a Waiting Room and we want to evaluate the average time spent on the origin over a certain time period, let’s say an hour. During this hour, the number of active users on the website fluctuates. At some points, there may be more users actively browsing the site while at other times the number of active users might decrease. To calculate the weighted average for the time spent on the origin, we take into account the number of total active users at each instant in time. The rationale behind this is that the more users are actively using the website, the more representative their time spent on origin becomes in relation to the overall user activity.
By incorporating the total active users as weights in the calculation, we give more importance to the time spent on the origin during periods when there are more users actively engaging with the website. This provides a more accurate representation of the average time spent on the origin, accounting for variations in user activity throughout the designated time period.
The value of new users per minute is used as a weight to compute the weighted average for total time waited in queue. This is because when we talk about the total time weighted in the queue, the value of new users per minute for that instant in time takes importance as it signifies the number of users that joined the queue and certainly went into the origin.
You can apply these aggregation functions to the list of metrics exposed under each function. However, if you just want the logs per minute for a time period, rather than the breakdown of the time period (minute, fifteen minutes, hours), you can remove the datetime dimension from the query. For a list of sample queries to get you started, refer to our dev docs.
Below is a query to calculate the average, maximum and minimum of total active users, estimated wait time, total queued users and session duration every fifteen minutes. It also calculates the weighted average of time spent in queue and time spent on origin. The query is done on the zone level. The response is obtained in a JSON format.
Following is an example query to find the weighted averages of time on origin (50th percentile) and total time waited (90th percentile) for a certain period and aggregate this data over one hour.
You can find more examples in our developer documentation. Waiting Room Analytics is live and available to all Business and Enterprise customers and we are excited for you to explore it! Don’t have a waiting room set up? Make sure your site is always protected from unexpected traffic surges. Try out Waiting Room today!
The collective thoughts of the interwebz
Manage Consent
To provide the best experiences, we use technologies like cookies to store and/or access device information. Consenting to these technologies will allow us to process data such as browsing behavior or unique IDs on this site. Not consenting or withdrawing consent, may adversely affect certain features and functions.
Functional
Always active
The technical storage or access is strictly necessary for the legitimate purpose of enabling the use of a specific service explicitly requested by the subscriber or user, or for the sole purpose of carrying out the transmission of a communication over an electronic communications network.
Preferences
The technical storage or access is necessary for the legitimate purpose of storing preferences that are not requested by the subscriber or user.
Statistics
The technical storage or access that is used exclusively for statistical purposes.The technical storage or access that is used exclusively for anonymous statistical purposes. Without a subpoena, voluntary compliance on the part of your Internet Service Provider, or additional records from a third party, information stored or retrieved for this purpose alone cannot usually be used to identify you.
Marketing
The technical storage or access is required to create user profiles to send advertising, or to track the user on a website or across several websites for similar marketing purposes.



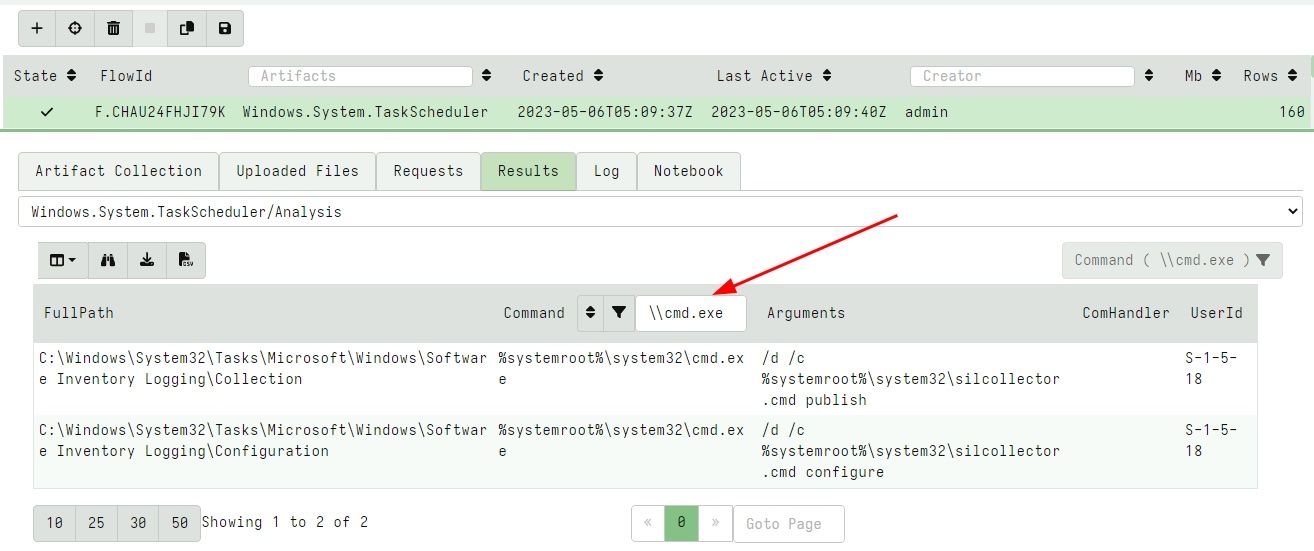
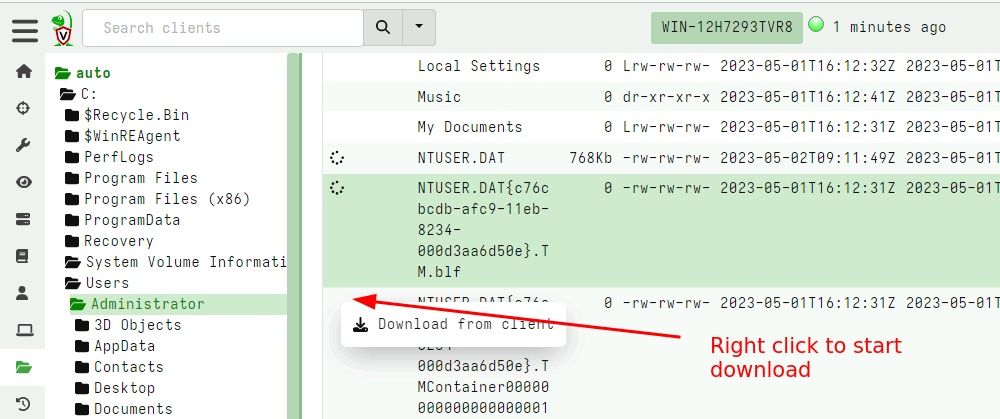
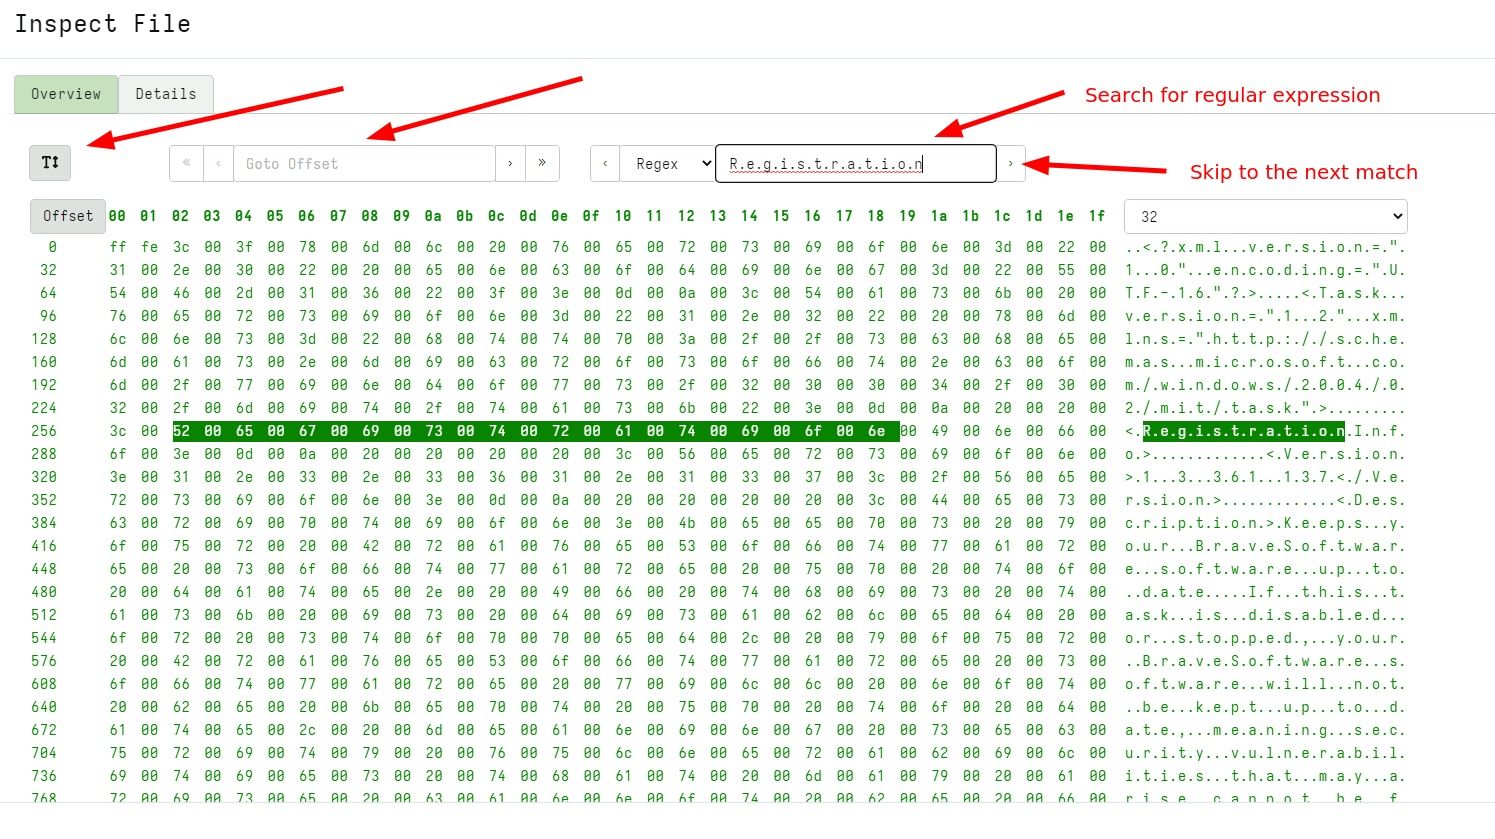
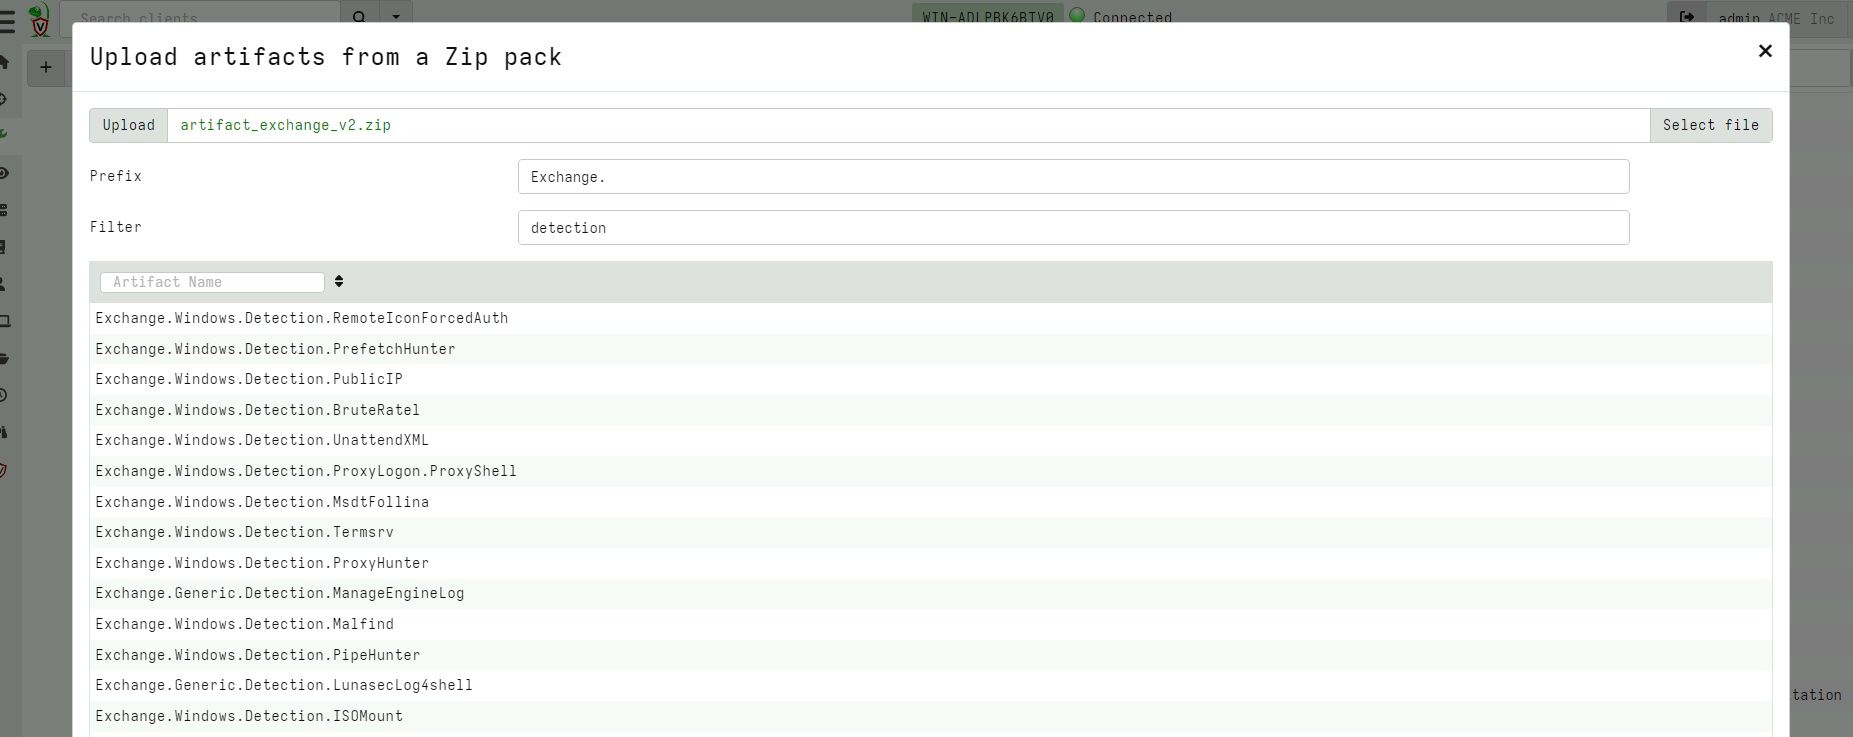
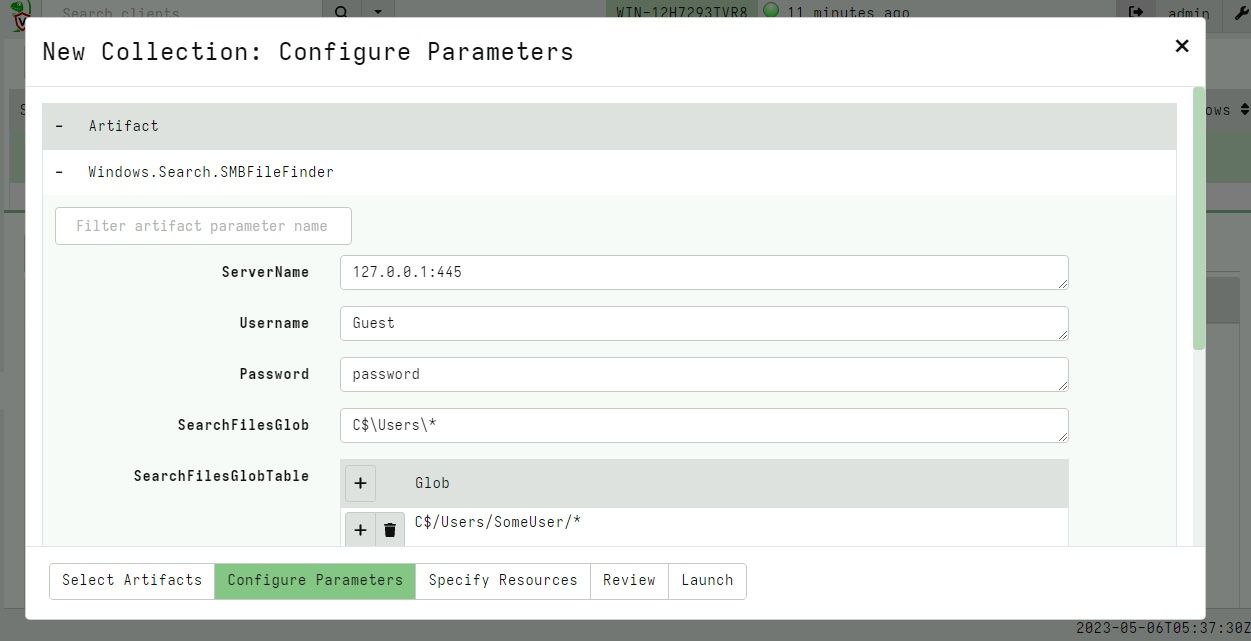
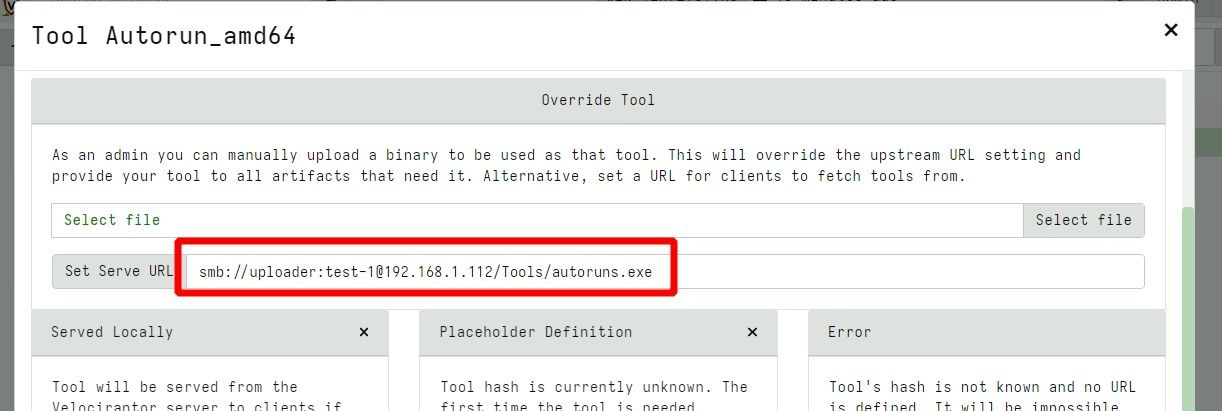
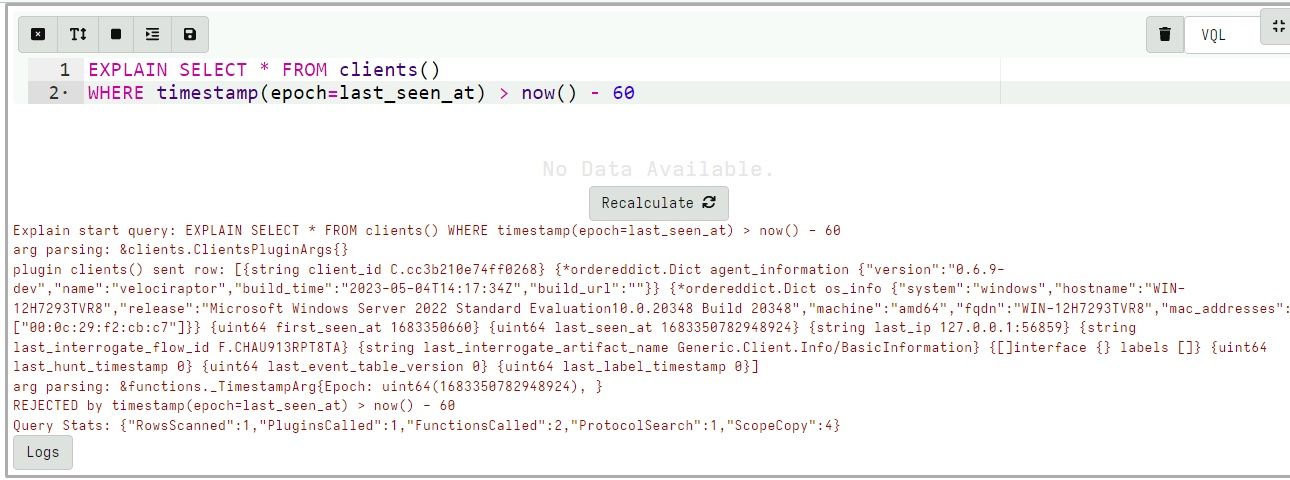
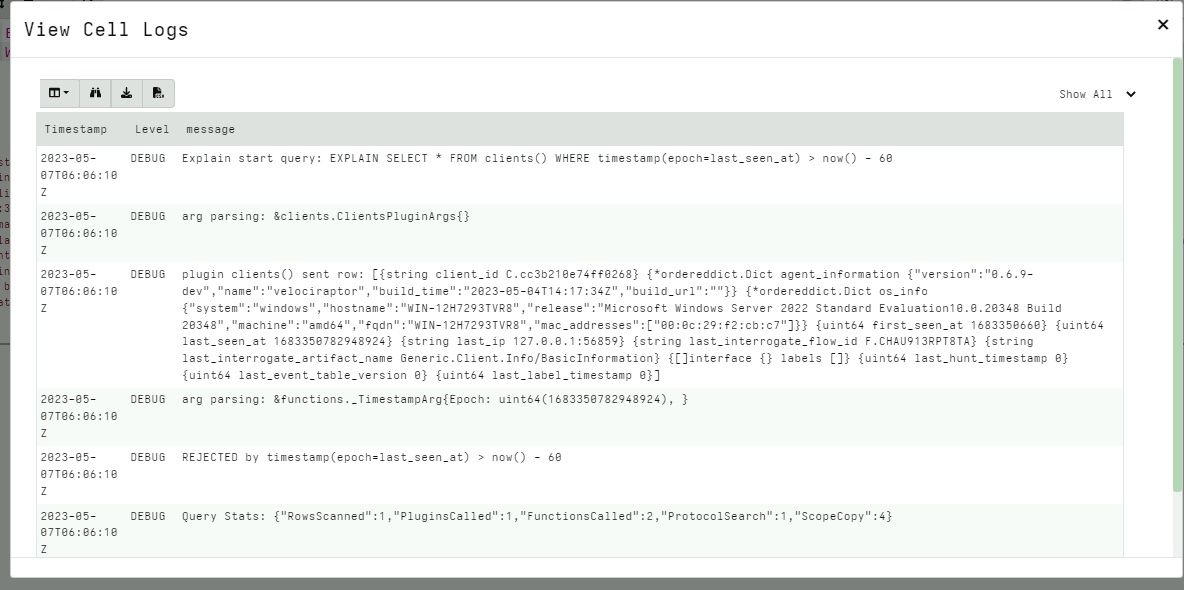
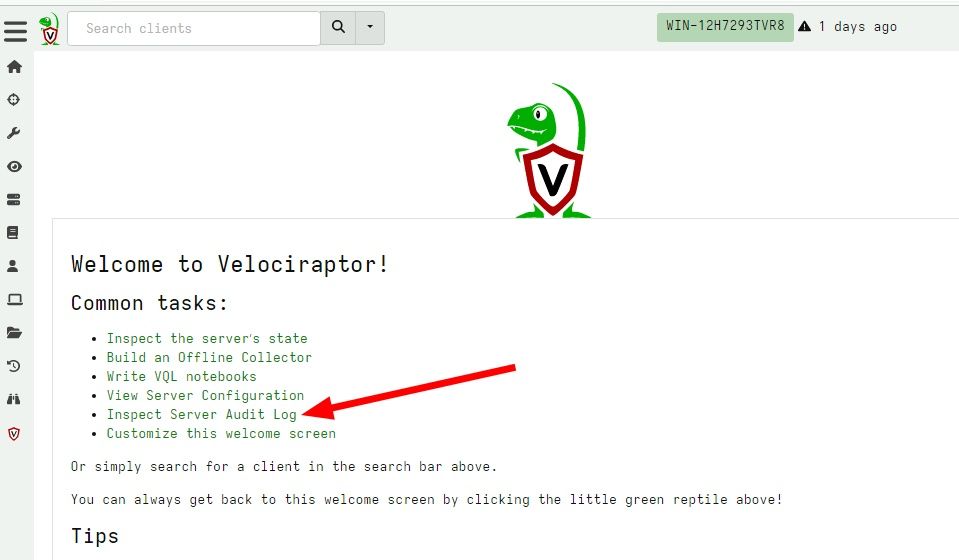
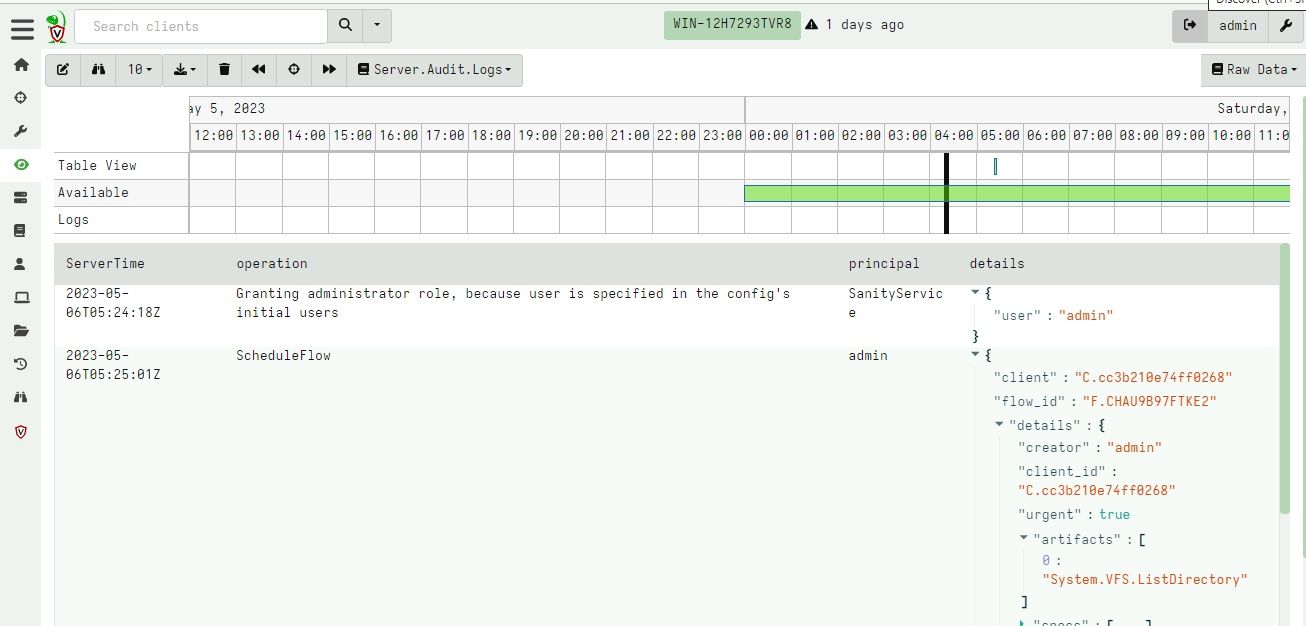
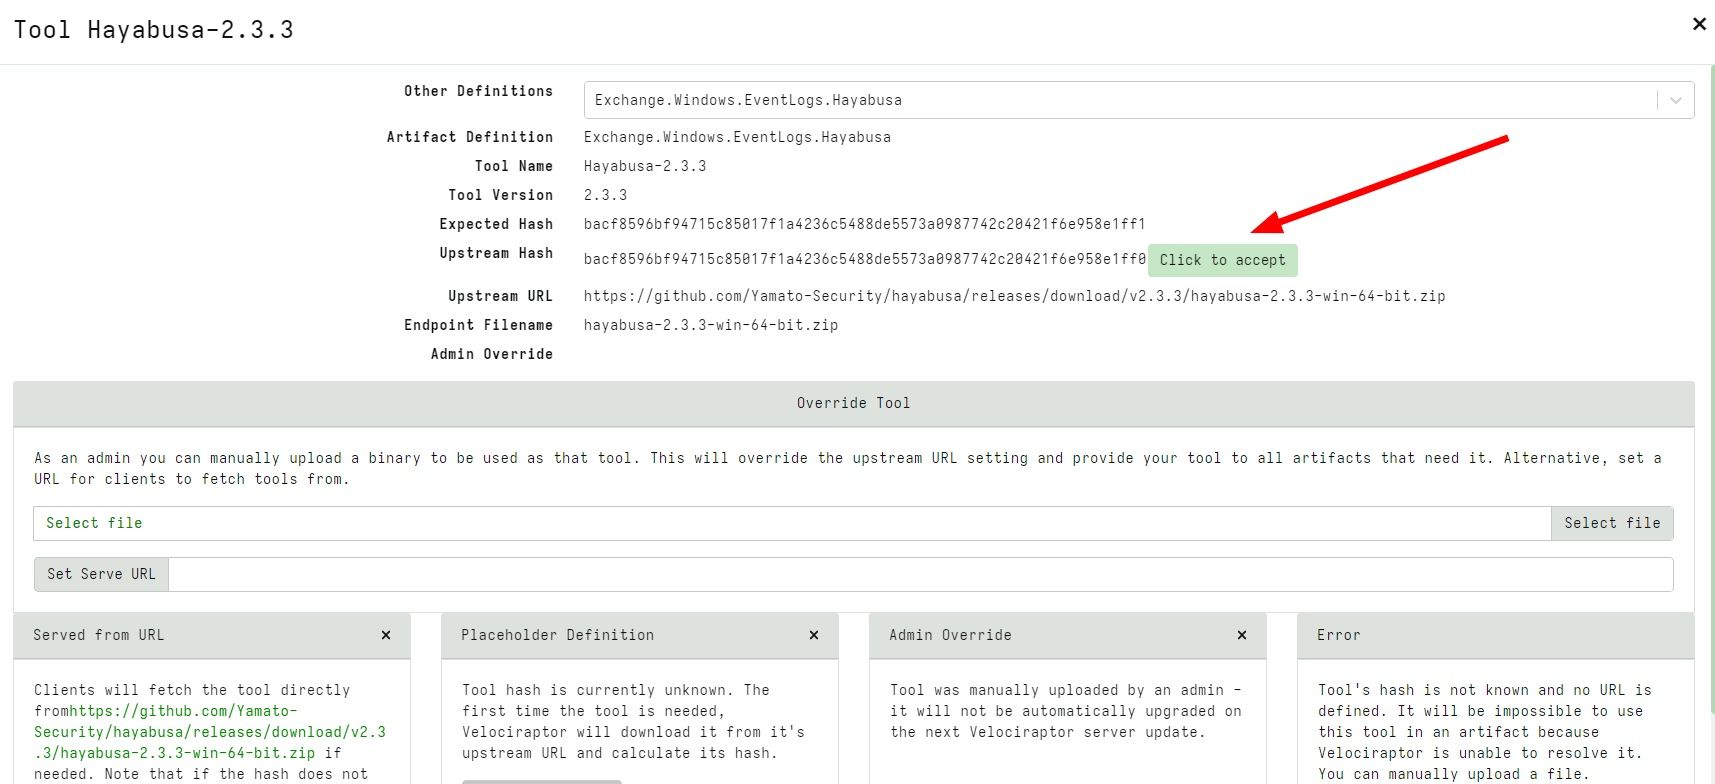


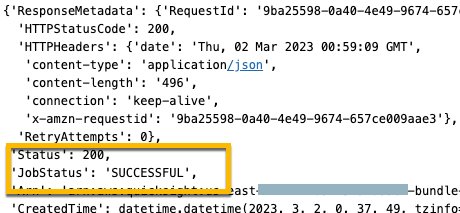


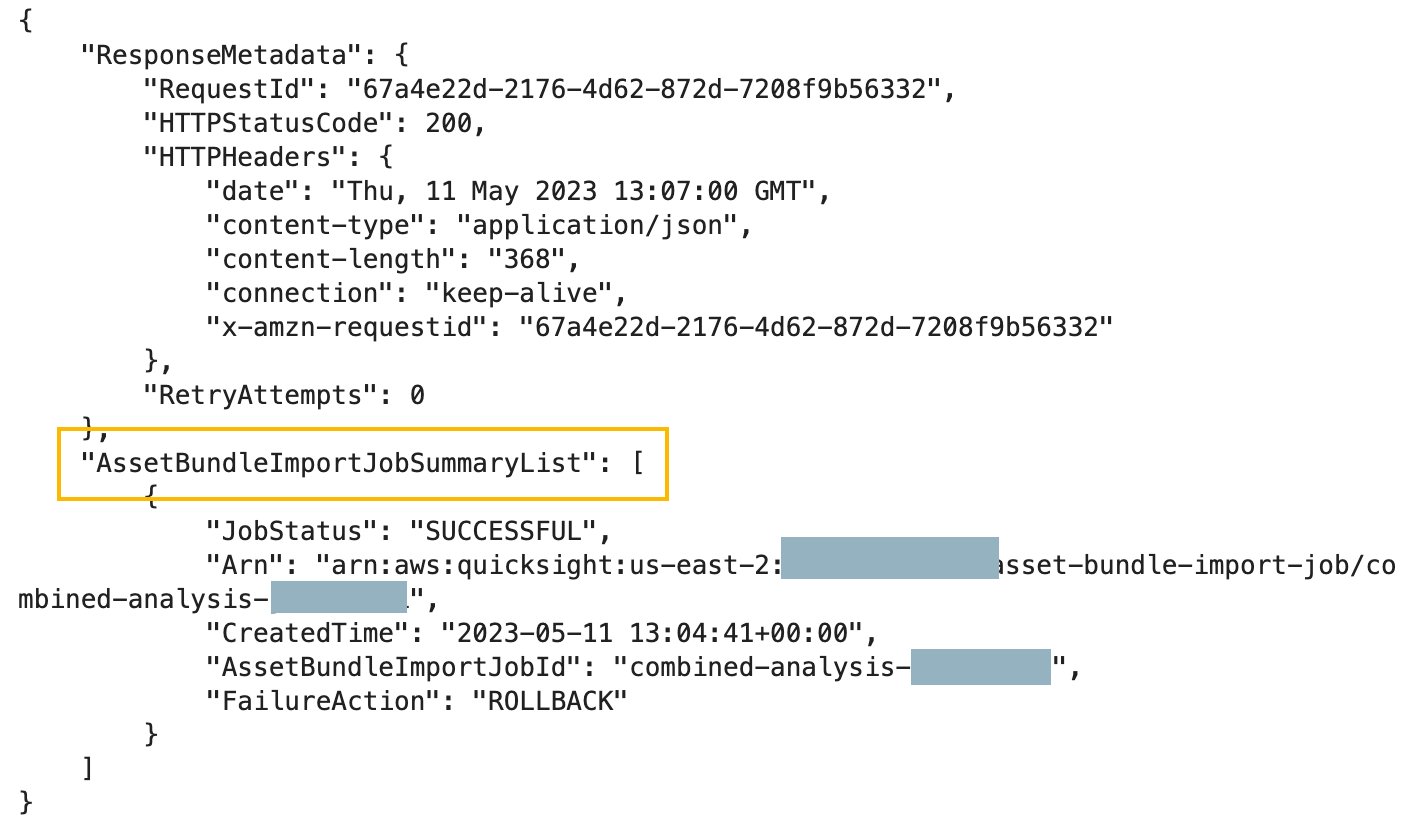
 Vetri Natarajan is a Specialist Solutions Architect for Amazon QuickSight. Vetri has 15 years of experience implementing enterprise business intelligence (BI) solutions and greenfield data products. Vetri specializes in integration of BI solutions with business applications and enable data-driven decisions.
 Zhao Pan is a software development manager for Amazon QuickSight. He is working to provide a delightful developer experience to our customers to automate and streamline their BI operations. He has 20 years of software development experience in various tech stacks. Prior to QuickSight he was a people and technical leader at ADP building a next-gen platform for human capital management. When he is not at his desk, he can usually be found in his garage building one contraption or another.
 Mayank Agarwal is a product manager for Amazon QuickSight, AWS’ cloud-native, fully managed BI service. He focuses on embedded analytics and developer experience. He started his career as an embedded software engineer developing handheld devices. Prior to QuickSight he was leading engineering teams at Credence ID, developing custom mobile embedded device and web solutions using AWS services that make biometric enrollment and identification fast, intuitive, and cost-effective for Government sector, healthcare and transaction security applications.



 Sumesh M R is a Full Stack Machine Learning Architect at Cargotec. He has several years of software engineering and ML background. Sumesh is an expert in Sagemaker and other AWS ML/Analytics services. He is passionate about data science and loves to explore the latest ML libraries and techniques. Before joining Cargotec, he worked as a Solution Architect at TCS. In his spare time, he loves to play cricket and badminton.
 Tero Karttunen is a Senior Cloud Architect at Knowit Finland. He advises clients on architecting and adopting Data Architectures that best serve their Data Analytics and Machine Learning needs. He has helped Cargotec in their data journey for more than two years. Outside of work, he enjoys running, winter sports, and role-playing games.
 Arun A K is a Big Data Specialist Solutions Architect at AWS. He works with customers to provide architectural guidance for running analytics solutions on AWS Glue, AWS Lake Formation, Amazon Athena, and Amazon EMR. In his free time, he likes to spend time with his friends and family.