Само две неща на тоя свят могат да изтикат политиката по-надолу в новинарските емисии – кръв и порно. В момента българската действителност предлага в изобилие и от двете. Когато се лее кръв и има насилие, всички стават съдебни експерти. Когато има секс, всеки се прави на морален компас.
Появиха се и конспиративни теории, че нарочно били продуцирани скандалните новини с камерите в салони за лазерна епилация и гинекологични кабинети и даже и тройното убийство в хижа край прохода Петрохан, на 15 км от границата със Сърбия. За да се отклоняло вниманието например от вандализма над Изборния кодекс, каквото е ограничаването до 20 секции в държавите извън Европейския съюз и извън дипломатическите ни мисии.
Защо на българите им е толкова непосилно да мислят и поради тази причина си обясняват света и случващото се с могъщо задкулисие или с рептили? Така доброволно се самообезценяват. Психиатри сигурно биха заподозрели и интернализирана малоценност, най-дълбоката яма, в която някой доброволно може да се натика, когато му натрапят, че е „малък и незначителен“. Оттам нататък няма нужда да те спират – ти вече си се спрял, омекнал като пластилин, и чакаш захарче за послушание.
Кръвта и порното свеждат всичко до емоция: ужас, възбуда, възмущение. Няма нужда от контекст, няма нужда от въпроси „Кой печели?“, „Какво следва?“, „Как се стигна дотук?“.
Политиката изчезва не защото някой я е скрил, а защото никой не иска да я мисли.
След като „някой дърпа конците“, а „изборите нищо не променят“, хората избират зрелищата пред смисъла.
Замислим ли се, ще разберем защо се случва това, което се случва.
Камерите и слабите институции
В България ерата „ГЕРБ“ се оскандали с незаконни подслушвания. Над 5000 разрешения за подслушване пък бяха издадени от Специализираната прокуратура и Специализирания наказателен съд. Разпространени от неизвестен източник записи и снимки на лидера на ГЕРБ Бойко Борисов наводниха за известно време дневния ред на обществото. Не последваха санкции за никого.
Едно е обаче да бъдат публикувани снимки, уличаващи политик, като онези на нощното шкафче на Борисов. Или като на лидера на „Атака“ Волен Сидеров, който пощипва зърната на… женска статуя през 2014 г. или се е излегнал в бял халат на тераса на луксозния парижки хотел Four Seasons George V.
Но когато в порно сайтове изтекат хиляди кадри от епилация или преглед при гинеколог, гражданите следва да си дадат сметка за размера на безнаказаност. Да не забравяме, че всичко започна с камерите в тоалетните на 138-мо столично училище, чийто директор Александър Евтимов беше привлечен към наказателна отговорност. Той е пуснат от ареста срещу гаранция от 10 000 лв. и е обвинен за незаконно поставяне на записващи устройства в тоалетните на училището, както и за създаване на порнографско съдържание с непълнолетни.
Излиза, че всеки, който поиска, може да постави камери където си иска, а фирмите, монтиращи устройствата, не смятат за необходимо да уведомяват при нарушение, каквото е заснемане на лекарски прегледи например. Всички замесени се оправдават с хакери.
Ако българското общество разчита на Комисията за защита на личните данни (КЗЛД) да защити правата на жените, а и на мъже, чието човешко достойнство е пострадало от изтичането на видеата, се заблуждава.
Първо, Комисията бе оглавена от човек със спорна компетентност, за което очевидно доказателство е изслушването му в парламента и затруднението да отговори какво е „проследяваща бисквитка“.
Формално Борислав Божинов, бивш разследващ полицай, е предложен от Министерския съвет, но биографията му носи всички първични белези на ГЕРБ: завършил Академията на МВР и право в Югозападния университет – инкубатор на кадри за силовите ведомства и прокуратурата. Изкарал 10-дневен курс по GDPR.
Второ, по отношение на видеонаблюдението в козметичните студия КЗЛД признава, че законът е пропусклив, а становищата на Комисията – препоръчителни:
Видеокамери не следва да се разполагат в стаи за отдих, помещения за преобличане, както и в помещения, в които се извършват процедури със съблечени лица. Факт е обаче, че осъществяването на видеонаблюдение не е нормативно регламентирано, а становищата на Комисията нямат задължителен характер, те са препоръчителни.
Сървърите на порно сайтовете са в чужбина, което ще затрудни търсенето на справедливост от пострадалите, които могат да претендират за наказания и обезщетения заради нарушения на сигурността на лични данни, на правото на личен живот и за накърнено достойнство и репутация.
„Рейнджърите“: факти и спекулации
Значително по-голям интерес – заради политическия привкус – предизвиква тройното убийство край Петрохан. Дори консултациите за служебен премиер отстъпиха пред случая с трите трупа с огнестрелни рани в главите и опожарената планинска хижа в землището на село Гинци, Годечко. Намерени са подредени един до друг до кучешката колиба, а двете кучета са открити разстреляни според една версия, според друга – заключени и изгорели, на горния етаж на подпалената хижа.
Сигналът на телефон 112 е подаден на 1 февруари от майката на един от мъжете, с когото тя не можела да се свърже. Според друга версия сигналът е подаден от познат на тримата, който ги е търсил по телефона и когато не е успял да говори с тях, е отишъл до хижата и ги е открил. Няма потвърждение от МВР коя от двете версии е вярната. Министерството съобщава чак на следващия ден, понеделник, 2 февруари. Няма официална информация обаче кога е настъпила смъртта на Ивайло Иванов (49 г.), Дечо Василев (45 г.) и Пламен Статев (51 г.)., планинари и пещерняци, обитавали хижата почти през цялото време и живели там изолирано.
Никой от тях не е с криминална регистрация. Василев е счетоводител със собствен бизнес, Иванов – адвокат, учил в България и Швейцария, живял дълго време в чужбина, а Статев е работил в ИТ сектора. Не се съобщава да са семейни.
Тримата са съдружници в Българската асоциация по екстремни спортове заедно с издирваните Николай Златков (22 г.) и Ивайло Калушев (51 г.), собственик на хижата, известен и като Лама Иво заради заниманията си с будизъм и с различни езотерични практики.
Освен хижата тримата са ползвали и къща в село Кости, община Царево, близо до границата на България с Турция.
[…] старши инструктор по спелеология, алпинизъм и скално катерене, пещерно гмуркане, аварийно спасяване и оцеляване в екстремни условия към редица водещи световни организации, както и международен Outward Bound и EDUCO инструктор.
Пътешественик-мореплавател, пилот парапланерист, международен инструктор по бойни изкуства (5 дан TKW ITF, Wing Chun Kung Fu), както и световноизвестен пещерен водолаз и изследовател. Ръководител на екипа, изследващ в Мексико най-дългата в света подводна пещера с единичен вход – Система Икстлан.
Спелеологът снима и филм от подводните пещери на Юкатан.
Калушев купува хижата през 2020 г. и според Българския туристически съюз (БТС) и представители на сдружение „Балканка“ достъпът на туристи до хижата спира и те започват да избягват не само нея, но и района като цяло.
През 2022 г. Калушев и Иванов основават Сдружение с нестопанска цел „Национална агенция за контрол на защитените територии“ (НАКЗТ), в което като учредители участват също художникът проф. Николай Лазаров Майсторов и съпругата му и бивша преподавателка по пиано в Консерваторията проф. Стилияна (Стела) Димитрова-Майсторова, майка на Калушев. (Публикации посочват баща му доц. Георги Калушев като агент на ДС с псевдоним Живко. Той е проверен от Комисията по досиетата в качеството му на ръководител на някогашната катедра „Бизнес администрация“ в УНСС в периода 1997–1999 г.)
Един месец след регистрацията си НАКЗТ подписва споразумение с МОСВ в лицето на екоминистъра Борислав Сандов, което е прекратено през 2025 г. Тази новина фокусира вниманието върху евентуални политически връзки с ПП–ДБ, тъй като през февруари 2022 г. управлява кабинетът на „Продължаваме промяната“, а Сандов е и съпредседател на Зелено движение, част от „Демократична България“.
В пост във Facebook той обясни, че не е познавал хората от НАКЗТ преди 2022 г., и отрече да му е оказван натиск.
Не са ми били приятели, колеги или съпартийци преди или след 2022 г.
Със споразумението се преотстъпват функции на контрол върху защитени зони и територии на едно НПО. Димитър Куманов от „Балканка“ сигнализира на МОСВ и на държавни институции за незаконно спиране и проверка на туристи в гората от „рейнджъри“.
До момента няма отговор на основни въпроси: с каква цел е населена хижата и каква точно дейност са извършвали обитателите ѝ? Засега няма обяснение и защо интернет страниците, свързани с организацията, не функционират от декември миналата година, а профилите на лица, споменавани публично във връзка с нея, са били изчистени. Въпреки това имената на спонсорите станаха публично известни и всеки от тях публикува пост във Facebook, макар и след като бяха „осветени“.
Без колебание подкрепих финансово иновационната за България природозащитна практика за наблюдение с дронове, водена от убедеността, че тя ще послужи за добър модел за опазване на природните ни ресурси. Зная, че тази технологична осигуреност послужи за ограничаване на незаконната сеч и нерегламентиран лов в региона, за подкрепа при горските пожари.
Мненията на граждани и политически сили се разделиха на двата полюса. Едните защитават Калушев и „рейнджърите“ с аргумента, че са пазили горите от незаконна сеч и бракониери и са организирали лагери за деца и природолюбители.
Другите отхвърлят тезите им и твърдят, че са пазили канали към Сърбия за трафик на дрога и хора. (От Гинци до границата е 15 км, а оттам са под 2 км до първото населено място в Сърбия – село Долни Криводол, което е близо до магистралата Ниш–София.) Пред сайта „Булевард България“ анонимен приятел на обитателите на хижата отговаря утвърдително на въпрос за съдействие от страна на „рейнджърите“ на полицията по линия на нелегалните мигранти.
На Гранична полиция, да. Не искам да коментирам, докато тече разследване, но това, което съм чувал, е прекратяване на канал за транспортиране на нелегални мигранти. Ние с тях винаги сме си говорили на тема спорт, преживяване, медитация, пещери, катерене […], гмуркане.
Охотно някои подхващат и контролираната информация на МВР и прокуратурата и бият барабаните за секта и педофилия, внушени и от изявления на и.ф. главен прокурор Борислав Сарафов и като цяло от непрофесионализма на разследващите, в чиято адекватност се усъмни юристът от Антикорупционния фонд Андрей Янкулов.
Можем ясно да идентифицираме впрягането на този тежък криминален случай в поредната институционална атака срещу определени политици и неправителствения сектор като цяло.
Самият Сарафов вдигна пушилка с думите:
По случая „Петрохан“ има по-фрапиращи обстоятелства, отколкото в сериала „Туин Пийкс“.
Той е „шокиран от въпросната неправителствена организация“ и „потресен“ от сектантска мрежа с педофилия (това е някакво неясно обосновано предположение). Разчита есемеса, изпратен от Калушев до майка му, като намерение „да посегне сам на живота си“.
Съдържанието на съобщението до майката стана известно, без да е сигурно дали действително е от сина ѝ. А пред Нова телевизия тя коментира, че от 1 февруари не знае къде е той (издирва се – б.а.).
Нищо от това, което ще чуеш, не е вярно, дори и частичка, но нямаме никакви сили повече да се борим с тази кочина… То не е причината, то е просто капката, която преля за всички нас чашата, поредният искрен опит да помогнем на едно болно дете – момиче е, в твоя чест :))) Прости ми, благодаря ти от сърце и когато намериш сили (по-скоро е по-добре), просто си насочи мисълта към мен и ще ме намериш. Този свят е един много стабилен сън. Няма смисъл да го превръщаш в кошмар. Направи напук и виж вътре в себе си и се усмихни. Обичам те много. Бъди свободна.
Специалисти могат да преценят състоянието на човека, написал съобщението, но едно е сигурно – че е под голямо психическо напрежение.
Междувременно бащата на 15-годишния Алекс Макулев – Яни Макулев, разказа пред Нова телевизия, че синът му е с Калушев и от 29 януари той няма връзка с него, но не се притеснява, тъй като има доверие на собственика на хижата. Двамата с Калушев са приятели от 35 години покрай пещерите, заедно са спасили децата, блокирани в пещерата Духлата след наводнение през 2010 г. Единият му син прекарал една година в Мексико с Калушев през 2011 г. и за Макулев твърденията за наркотици, секта, педофилия са абсолютно безпочвени.
ДАНС, какво правите?
Преките щети от този скандал ще са политически обаче и ще са за ПП–ДБ. Прокуратурата ще се постарае да държи огнехвъргачката по коалицията колкото може по-дълго. Започва разследване на дейността на НАКЗТ, вече из медиите циркулират сигнали за дете, живяло в хижата с Калушев, като името му и това на негови близки не е скрито.
МВР ще разследва има ли подадени сигнали срещу сдружението от 2022 г. досега. Инспекторатът ще влезе в ГД „Национална полиция“, ГДБОП, ГД „Гранична полиция“, СДВР, всички областни дирекции на МВР в страната, в Дирекция „Миграция“ .
Очевидно дейността на тази организация трябва да бъде проверена, включително по отношение на децата, които са ходели на лагери там и са били оставяни лично от родителите си. Отпреди две години има проверки по материали от ДАНС на въпросната организация. Това, което възпрепятства събирането на информация и доказателства, е нежеланието на родителите на децата да съдействат.
Борислав Сарафов
Намесването на деца винаги е особено чувствителна тема, каквато например не са обвиненията, че сдружението е паравоенна организация. Но ако ще я проверяват и за това, не подлежат ли на проверка и паравоенните формирования, които тренират в Странджа, или онези, свързвани с Ивелин Михайлов и „Величие“?
Контраразузнаването не обяснява защо НАКЗТ е на фокуса му от цели две години, в които нищо не е установено. Кметът на Гинци Георги Тодоров беше съвсем откровен в първите си коментари по случая, като заяви, освен всичко друго, че в къщата е имало оръжие. Пред Нова телевизия той разказва, че са намерени три пистолета и една карабина, както и голямо количество гилзи. Медии съобщават за намерени много оръжия в хижата, без обаче да се позовават на източник за тази информация.
Ето какво казва кметът на село Гинци.
Около 14:00 ч [доста след подаването на сигнала в 11:20 ч на 1 февруари – б.а.] началникът на полицията ме информира, че има три трупа в района на хижа „Петрохан“ и да имам готовност да посетим района. Бяха спецслужбите на ДАНС вътре в изгорялата сграда. След това влязоха криминалистите от София.
Всичко това само на пръв поглед е история за кръв, порно и политика. Това е история за провала на държавата да мисли и да обяснява и за готовността на обществото да приеме емоцията като заместител на анализа.
Когато институциите шикалкавят или целенасочено пускат внушения, а главният прокурор, който дори не е главен прокурор, говори за деветдесетарски хорър, резултатът е недоволство, конспирации и песимизъм, че пак нищо няма да излезе.
Кръвта и порното са удобният изход за властта. По-лесно е да се възмутиш, отколкото да изискваш отговорност; по-лесно е да гледаш, отколкото да мислиш. И докато се чудим дали някой „дърпа конците“, конци отдавна не са нужни – сами сме спрели да се движим.
404Media is reporting that the FBI could not access a reporter’s iPhone because it had Lockdown Mode enabled:
The court record shows what devices and data the FBI was able to ultimately access, and which devices it could not, after raiding the home of the reporter, Hannah Natanson, in January as part of an investigation into leaks of classified information. It also provides rare insight into the apparent effectiveness of Lockdown Mode, or at least how effective it might be before the FBI may try other techniques to access the device.
“Because the iPhone was in Lockdown mode, CART could not extract that device,” the court record reads, referring to the FBI’s Computer Analysis Response Team, a unit focused on performing forensic analyses of seized devices. The document is written by the government, and is opposing the return of Natanson’s devices.
The FBI raided Natanson’s home as part of its investigation into government contractor Aurelio Perez-Lugones, who is charged with, among other things, retention of national defense information. The government believes Perez-Lugones was a source of Natanson’s, and provided her with various pieces of classified information. While executing a search warrant for his mobile phone, investigators reviewed Signal messages between Pere-Lugones and the reporter, the Department of Justice previously said.
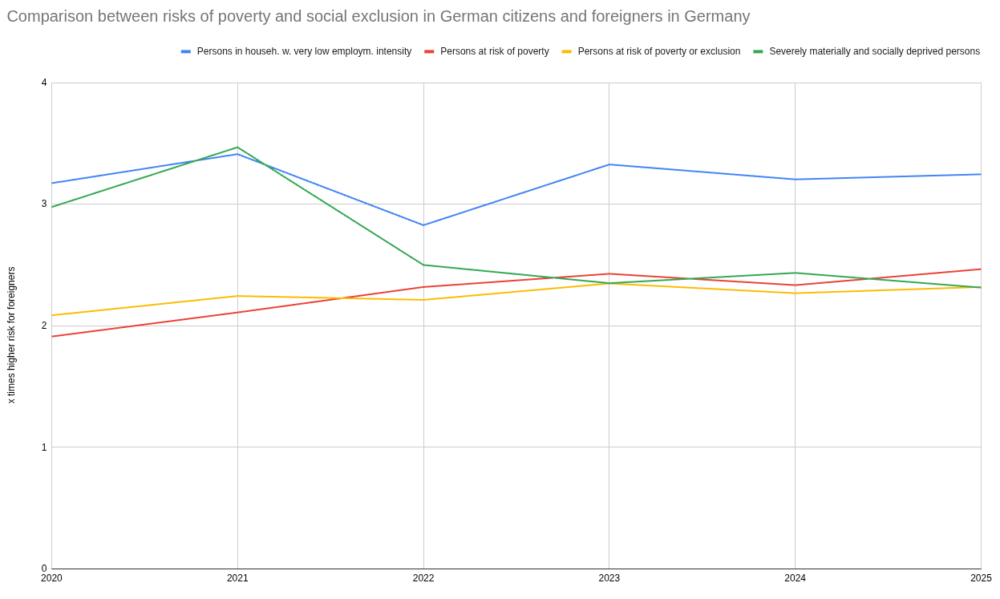
Според последните данни за риск от бедност и социално изключване от 2025-та, в Германия остава над два или три пъти по-голям рискът за всяка от следените категодии, ако сте чужденец в Германия.
Най-висок е рискът да живеете в домакинство, в което има висока безработица – 3.25 по-вероятно, отколкото сред германските граждани. Рискът за сериозно материални и социални лишения всъщност се повишава значително при чужденците, но още по-бързо расте сред немските граждани. Затова след 2021-ва рискът за същото, ако сте чужд гражданин е само 2.31 пъти повече от немските граждани. преди това е над 3 пъти. Риск от бедност и изключване остава стабилно около 2 до 2.4 пъти повече от средното.
Докато средният за Германия риск от бедност и социално изключване остава под този в България (21.32% спрямо 30.3% за 2023), сред чуждестранните граждани е доста по-голям – над 41%. Няма разбивка по националности и има широк спектър с професии и ситуации сред диаспортата ни и чужденците в Германия като цяло. Най-общо обаче може да кажем, че ако се преместите в Германия, рискът ви от бедност се увеличава с поне една трета.
И не, взимане на германско гражданство само по себе си не променя нещата, макар може да спекулираме, че е повлияло на качването на средната бедност сред немските граждани в последните четири години.
Изброените индекси често не се разбират добре. Пропуска се, че не се базират на обективни данни, а социологически допитвания основани на местни разбирания и презумпции. Преди 12 години написах подробно какви са проблемите с това. Миналата година пуснах и някои детайли за диаспората ни в Германия от последното микропреброяване. Преди 7 години описах защо ни изглежда, че немските пенсионери са по-богати, какви са причините когато това е вярно и защо често всъщност не е. Друг аспект са социалните и по-специално майчинските, за които писах преди 6 години.
спомени, фотоалбум, Александър Иванов, изд. „Булгея“, 2025
„Тук и сега.“ Така се казва сборникът с писма между Джон Кутси и Пол Остър, въпреки че писмата не са писани нито тук, нито сега. Писани са по време уж недалечно, а сякаш безвъзвратно отплавало надалеч от нашето – преди десетина-петнайсет години, тоест преди пандемията, преди нападението срещу Украйна, преди Тръмп. „Хумус“ на Раул Брандао излиза през 1917 г. В Португалия, не в Санкт Петербург. Феликс Вожли, герой на третата книга и баща на залесяването в България, идва у нас преди 120 години.
Не е ли незначително всичко това? Кутси и Остър обсъждат американската политика, без да знаят какво ще се случи. Техният свят е потискащ, но не отчайващ. В него има време да се обсъжда естеството на приятелството – дългогодишното мъжко приятелство; с какво ни привлича спортът; странните случаи, в които незначителен персонаж се явява отново и отново в живота ни; вътрешната подредба на стаите в съчинявания роман, подробна или скицирана… И така нататък.
Действието в „Хумус“ на Брандао – доколкото го има – се развива в малко португалско градче, където сякаш нищо не се случва: със сигурност нищо на фона на Октомврийската революция, която сякаш не съществува. Не съществува като че ли и войната, току привършваща в Европа.
Залесяването също не е дейност, която присъства в учебниците по история. Няма място: там са революциите, войните, ефектните романтични фигури, които размахват меч, не лесничейска лопата. Само че залесяването спасява, когато дойдат пороищата. Това обяснява Феликс Вожли на българите, които изскубват фиданките и пускат добитъка си да опасе останалото.
Мене не ми трябва гора, мене ми трябва паша,
казват и слатинските селяни, като се бият срещу създаването на Борисовата градина. А Вожли изнася сказки, обяснява: виждате ли я онази махала, дето вече я няма? Ако не залесим това дере, същото ще стане и с целия град.
За първите 11 години от началото на ХХ век са регистрирани 168 наводнения (49 пъти на река Марица; 21 броя – река Янтра, 20 наводнения – река Искър, 11 пъти – река Тунджа) с 84 човешки жертви и щети за над 1 млрд. лева,
пише Вожли. Снимките в новоизлезлия фотоалбум „Началото“ са красноречиви; стоварилата се стихия причинява покъртителни трагедии. Впрочем скорошните кадри от Южното Черноморие също изглеждат така.
Докато образова хората защо трябва да се върши тази бавна, скучна и лишена от „келепир“ работа по залесяването, Вожли моли Петър Манджуков – неговия пръв български съратник – да му даде книга, с която хем да донаучи български, хем да разбере нещо за тукашния народ. Получава „Бай Ганьо“ и толкова я харесва, че я превежда на френски и урежда да я издадат в Париж. Какво родство на ума между родоначалника на туризма и родоначалника на залесяването у нас!
Родството на ума е и това, което прави писмата между Кутси и Остър опора в пороя от новини. Тема подир тема пускат корени между тях и приятелството, с което започва книгата, все повече се разраства, задълбочава. Опираш гръб в този език без преструвки, език, изкован в литературата, но обран от излишните хватки, език по същество, език за споделяне.
Ако имаш такъв приятел, читателю, може да му подариш тази книга и да предложиш да съставите ваш списък от теми. Теми устои, които правят връзката ни със света малко по-силна, малко по-надеждна. Все едно се движите през пустиня и виждаш насреща си оазис. Ако и приятелят ти го вижда, може да не е мираж. Сега си представи същото, но за нещата вътре в нас, примерно за ценностите. Мираж ли са, или не? Разбира се, може и двамата да се лъжете. Третото око е на времето. Особено когато става въпрос за политика; особено когато се случват непредвидими, немислими неща. Какво сте могли да знаете преди 10 години за Израел (не понасят Нетаняху) или за пътищата, по които ще поеме арабската пролет? Но какво можем и ние да знаем за завоите на бъдещето – и трябва ли да се откажем да имаме позиция сега, с непълните си знания? А какво можем да правим, ако нямаме такъв приятел?
Героят на „Хумус“ е в това положение. Персонажите се движат край него като призрачни сенки, силуети в мъглата на вътрешния монолог. Представям си ги на сцена, високи и мълчаливи, полухора-полуидеи, персонажи с нереални имена. Дона Леокадия. Дона Библиотека, дона Прокопия…
На влизане в книгата ми се струва, че авторът ги ненавижда.
Братовчедката Анжелика не вдига лице от чорапа. Небитието я очаква, а дона Прокопия сънена се прозява, сякаш не ѝ предстои да спи цяла вечност. Живеят жените Телеш, а те мразят жените Соза. Живеят жените Фонсека, а Фонсека прекарват живота си в правене на реверанси като разглобени кукли. Живеят жените Албергария, а Албергария имат само една житейска цел: всяко полугодие да се покажат с нова рокля в градината. Живеят тези, които дъвчат, предъвкват и смилат…
Виждате ли хореографията на този спектакъл, мълчаливия, почти механичен танц на персонажите? Току някой спира, показва лицето си, основанията на живота си, за да бъдат разчепкани и отречени. Старата чистачка има блян, разправя на всички как дъщеря ѝ е истинска дама. Само че това не е вярно, дъщеря ѝ е по-клета от нея. Дона Леокадия пък има дълг, който я озлобява и крепи. И той трябва да бъде разклатен:
Дона Леокадия, дългът е договор. Договор с по-висше същество или договор с другите. Има задължения към Бога и задължения към хората. Договорът с Бога се провали, защото Бог не съществува; договора с хората не го изпълнявам, защото, ако приема само аз да спазвам клаузите му, ще ме ограбят.
Разказвачът в „Хумус“ продължава, пали се. Ако Кутси и Остър взаимно подкрепят устоите си, той като че ли иска да събори всичко, във всичко да се усъмни, защото нищо не може да устои на помитащия порой на смъртта. И това го изпълва с гняв.
Как може да се изгради един живот върху медальон с лика на субект с бакенбарди и стъклен похлупак с образа на светец и да се вмести в него драма, основана на представата за дълг, дотам, че да те обсеби изцяло, ето това не разбирам и ме удивява, долна човекомаймуно с изкуствен кок!
Защо е толкова ядосан? Имам подозрение. Годината е 1917-ва: световна война, революция, всичко познато се е оказало крехко, обратимо. Недостатъчно, за да устои. Страхът от пороя на бъдещето се преживява като повеля настоящето да бъде значимо, да бъде проникновено, изпълнено с живот. Ако не пуска корени в отвъдното, защо изобщо съществува!
Незначителността на живота е важна пред лицето на смъртта – като у Далчевото „не, не ме оставяй да загина, / Господи, преди да съм живял“. Вижте у Брандао:
Не ме е грижа дали съм щастлив – не ме е грижа дали съм нещастен. Грижа ме е какво идва след това, какво има под земята и какво над нея.
– Не съм живял! – Какво от това, ще умреш!
И все пак вижте: Брандао може да казва, че животът е просто едно постоянно вглъбяване в смъртта и да пита: „Тогава за какво съм се родил? За да предусетя тайнството и да не го разбуля?“, но очевидно намира смисъл да пише. Намира смисъл да вае изречения, нежни и тежки като везано кадифе, да строи своята гневна и безнадеждна, но очевидно изпълнена с обич философия (защо иначе ще го гневи слабостта), намира смисъл да говори с нас, читателите, и може би да ни предизвика да спорим, да защитим неговите старици и с тях – собствените си основания за живот.
Албумът „Началото“ съдържа снимки от порои, но и разкошни снимки на пищни български гори, израсли на мястото на залесеното. Има надежда, казват те.
„Нова надежда за мъртвите“: велико заглавие. Жалко, че вече е заето,
казват Кутси и Остър.
Не унивайте. Някъде и след нас ще растат мощни гори.
P.S. Раул Брандао, Кутси и Остър са преведени от две разкошни преводачки – Даринка Кирчева и Иглика Василева. Албумът, посветен на Феликс Вожли и Петър Манджуков, съпътства изложба по идея на Александър Иванов, координатор Катя Христова и графичен дизайн Георги Шаров, във великолепната програма, която Художествена галерия – Казанлък развива под ръководството на Пламен Хаджипетров. Тази грижа за езика, тази грижа за вкуса също залесяват склонове и пазят от порои. Благодаря.
В емблематичната си колонка „Ходене по буквите“, започната още през 2008 г. във в-к „Култура“, Марин Бодаков ни представяше нови литературни заглавия и питаше с какво точно тези книги ни променят. В началото на 2020 г. той я пренесе в „Тоест“. Вярваме, че е важно тази рубрика да продължи. От човек до човек, с нова книга в ръка. От края на 2021 г. по буквите тръгна Зорница Христова.
Активните дарители на „Тоест“ получават 20% отстъпка от коричната цена на всички книги на над 15 български издателства. Кои са те – вижте в условията на Читателски клуб „Тоест“.
There’s always something new to consider when teaching with technology. From the latest advancements in AI, to new software and hardware updates, it can be difficult to know which tools to use and how to incorporate it effectively into your lessons.
In today’s blog, we explore the PICRAT framework and how it can help you reflect on your use of technology in the classroom.
We also share our new PICRAT Quick Read, which you can download for free to:
Find practical tips on how to use the PICRAT model when planning your lessons
Read a summary of the research behind the framework
What is the PICRAT framework?
Technology is constantly changing, and educators must continually decide what tools to use in their practice. To help with this challenge, researchers started developing theoretical models that teachers (especially student teachers) could use to reflect on how they integrate technology in their classrooms.
You might already be familiar with frameworks like TPACK (Technology, Pedagogy, and Content Knowledge) and SAMR (Substitution, Augmentation, Modification, Redefinition). While these models are useful, the PICRAT framework was created to address gaps in these earlier models, offering a clearer, student-focused approach. Significantly, it encourages you to treat technology as a tool to support learning, rather than the goal itself.
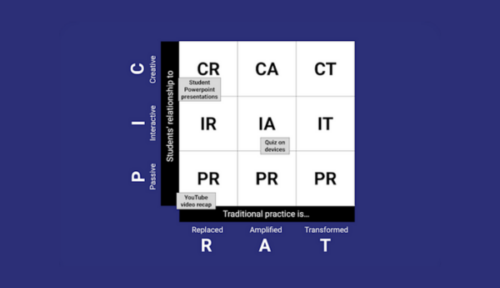
It asks two simple questions: “How are students experiencing the technology?” and “How does this impact your practice?”. The answers to these questions form a matrix as pictured below.
PIC (which runs along the y-axis) refers to the student’s relationship to the technology:
Passive – Students receive learning through technology
Interactive – Students interact with the content or other learning through technology
Creative – Students construct knowledge using technology
RAT (which runs along the x-axis) refers to how the teacher uses the technology:
Replaces – Using technology but with an existing pedagogy
Amplifies – Using technology to improve pedagogy or outcomes
Transforms – Using technology to create new pedagogical practices
How can I apply the PICRAT model?
First choose the lesson you’re planning to deliver. Consider what activities you’ll be running and the technologies involved. You’ll then be able to plot where they sit on the matrix using the PICRAT acronym.
For example, if you are teaching a lesson on Python loops, you might initially plan for students to watch a pre-recorded coding tutorial on their laptops. In this scenario, the student experience is Passive (receiving info via tech), and the teacher’s use is Replacement because the video simply replaces a live lecture. To move up the matrix, you could instead have students use an online IDE to complete a “Parson’s Problem” puzzle where they rearrange blocks of code to fix a loop. This shifts the activity to Interactive and Amplification, as the digital tool provides immediate debugging feedback that a paper-based exercise could not.
Next, think about how you might move your practice forwards. Although every position on the matrix has its own value, the framework is hierarchical. The overall goal is to try to move your practice towards the top right of the matrix to be Creative and Transformative.
To help you achieve this, take some time to reflect on your current lessons, activities, and the technologies you use. Ask yourself questions like:
What does the technology I’m using offer that could be used to amplify my practice?
What benefits would this have for students?
Does the technology present opportunities for students to interact with each other, not just the technology?
What other technological tools might support collaboration?
Research highlights that technology is rarely used in ways that allow young people to be creative. By using the PICRAT matrix, teachers can identify missed opportunities and explore ways to transform their lessons, ensuring learners can be creative and thrive.
The benefits of the PICRAT model
Potential benefits for educators:
The framework encourages meaningful reflections, allowing teachers to easily evaluate how they’re using technology within their lessons
Reflections and the PICRAT matrix helps teachers to identify missed opportunities and gaps in their practice, ultimately leading to better student experiences
You can use the PICRAT framework as part of your own reflections, or as part of a group activity. It’s a great way to spark discussion about technology integration with colleagues and improve best practices.
Want to find out more about the PICRAT framework?
If you’d like to learn more about the PICRAT model, you can download our Quick Read for free via our new Pedagogy Quick Reads page.
Convera processes billions in cross-border payment volume yearly for businesses and financial institutions worldwide. As their platform grew, they needed a robust authorization system that could protect sensitive financial data while maintaining operational efficiency across their global network.
In this post, we share how Convera used Amazon Verified Permissions to build a fine-grained authorization model for their API platform.
Background
As Convera’s service offerings expanded, they needed a scalable, secure, and auditable way to enforce role-based and attribute-based access control. Their goal was to make sure users, both internal and external, had access only to the resources and actions they were explicitly authorized for, while maintaining flexibility to adapt to evolving business needs. Initially, Convera explored building an in-house access control solution. However, they realized that implementing policy management, real-time authorization, logging, and auditing from scratch would require significant engineering effort and ongoing maintenance, diverting resources from their core business priorities. Convera chose Verified Permissions for implementing fine-grained authorization for their payment APIs. This choice was driven by the following factors:
Cedar policy language’s flexibility in defining complex authorization rules
Ability to evaluate multiple attributes like user roles, transaction amounts, and geographic locations
High-performance characteristics with millisecond-level authorization decisions
Given its flexibility and scalability, Verified Permissions became the foundational reference architecture for managing access control across two main scenarios:
Fine-grained access control – Convera’s Payment platform serves diverse users including customers, internal staff, and machine-to-machine communications, each requiring specific entitlements based on their roles, organizational hierarchy, and context.
Multi-tenancy controls – One of Convera’s most complex requirements was enabling multi-tenant access control while enforcing strict data isolation. Verified Permissions make it possible to define policies that dynamically evaluated tenant ownership, user roles, and contextual attributes.
The following analysis breaks down Convera’s implementation approach across their major use cases
Fine-grained access control
Fine-grained access control is a critical aspect of application security that makes sure users have precisely defined permissions, granting access only to specific resources or actions within an application. Using Verified Permissions, you can define a schema in terms of entity type, including attributes relevant to the authorization model and the valid combinations of principal types, resource types, and actions. Verified Permissions uses this schema to validate that a static policy or policy template is consistent with the application’s authorization model.
Convera implemented Verified Permissions for fine-grained access control across multiple user types and interaction patterns.
Customer access management
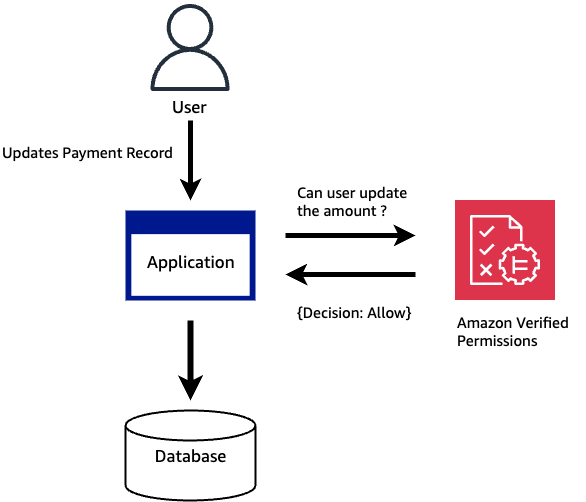
At the UI level, Convera used Verified Permissions to manage API access based on specific user characteristics. For example, in their financial applications, the visibility of transaction features like the modify payment parameters is dynamically controlled based on Verified Permissions policies.
The following diagram illustrates the user authentication decision flow for financial transactions.
Figure 1: User Authorization Decision for financial transactions
The following is an example Cedar policy that can be used in conjunction with Verified Permissions to achieve this use case. This policy makes sure only authorized users with specific roles can see sensitive financial controls. The same policy must be evaluated at the API level when the actual transfer request is made. At the service level, the policy is designed to provide fine-grained access controls.
You can integrate the application with Verified Permissions through the API to authorize user access requests. For each authorization request, the service retrieves the relevant policies and evaluates those policies to determine whether a user is permitted to take an action on a resource given context input such as users, roles, group membership, and attributes.
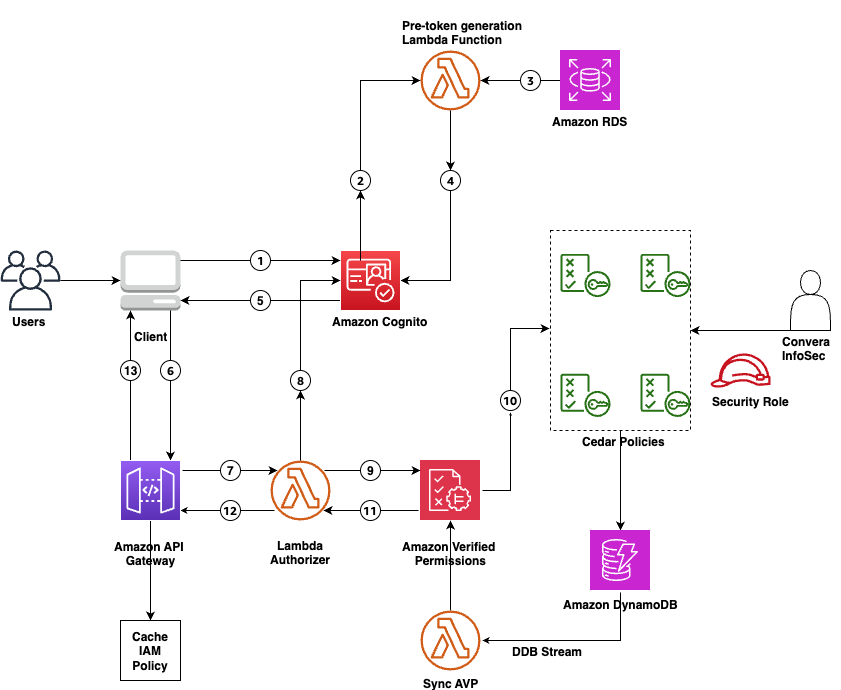
The following figure illustrates the end-to-end architectural diagram of this implementation.
Figure 2: Fine-grained User Authorization control with Verified Permissions
The workflow consists of the following steps:
Users initiate login through the client application.
The client authenticates with Amazon Cognito.
Amazon Cognito triggers a pre-token generation AWS Lambda function to get user roles.
The Lambda function enriches a JSON Web Token (JWT) with user role information.
The enriched JWT with user roles is returned to the client application.
The client application makes an API call, sending an authorization request to API Gateway through the enriched JWT.
A Lambda authorizer validates the JWT and the role permissions from the JWT and makes a call to Verified Permissions.
Verified Permissions reads access policies stored as Cedar policies and makes an authorization decision.
Verified Permissions returns the authorization result to the Lambda authorizer.
The Lambda authorizer, based on the authorization result, sends an AWS Identity and Access Management (IAM) policy that allows or denies the request to API Gateway.
API Gateway either allows or denies the request to the client application.
API Gateway caches the IAM policy.
The policy governance is owned by Convera’s infosec team through a strictly regulated IAM role. The changes to the Cedar policies are captured using Amazon DynamoDB Streams and continuously synced with Verified Permissions.
To improve speed, Convera created a two-level cache system, using the API Gateway built-in cache for authorization decisions and application-level caching for Amazon Cognito tokens. The Lambda function invokes Verified Permissions to authorize the request. If Verified Permissions returns deny, the request is rejected, and an HTTP unauthorized response (403) is sent back. If Verified Permissions returns allow, the request is moved forward. This multi-level caching approach successfully delivers sub-millisecond response times while reducing operational costs and maintaining security controls.
Internal customer connect applications
Convera was able to reuse the same architecture for their internal user access as well, such as customer service associates who need quick access to client information to provide efficient service while protecting access to sensitive data. Using Verified Permissions, a role-specific Cedar policy was created to achieve the following:
Enable view-only access to basic customer profiles, including contact information and service history
Restrict edit capabilities to specific fields, such as updating contact preferences or logging support interactions
Block access to sensitive financial data or internal business metrics
In this flow, internal users authenticate through their enterprise identity provider (IdP), in this case Okta, through the Convera Connect App and obtain ID and access tokens from Amazon Cognito. Amazon Cognito, using a pre-token generation hook, customizes the access token with user attributes stored in Amazon DynamoDB. Although the Cedar policies are tailored for internal roles and responsibilities (different from customer-facing policies), the fundamental flow involving API Gateway, a Lambda authorizer, Verified Permissions policy evaluation, and decision caching remains identical. This architectural reuse meant Convera didn’t need to rebuild their authorization infrastructure, so they can use the same performance optimizations, security controls, and operational processes across both customer and internal user access patterns.
Extending the model to service communication
After successfully implementing Verified Permissions for customer and internal user access control, Convera recognized they could use the same architecture for securing service-to-service communications. Similar to how they manage user authentication through Amazon Cognito user pools, each client service is registered in their client configuration system, with Verified Permissions creating a dedicated policy store for service-specific permissions. Services authenticate through Amazon Cognito using client credentials (instead of user credentials) to obtain access tokens that carry service-specific attributes such as service identifier, tier, allowed operations, and rate limits.
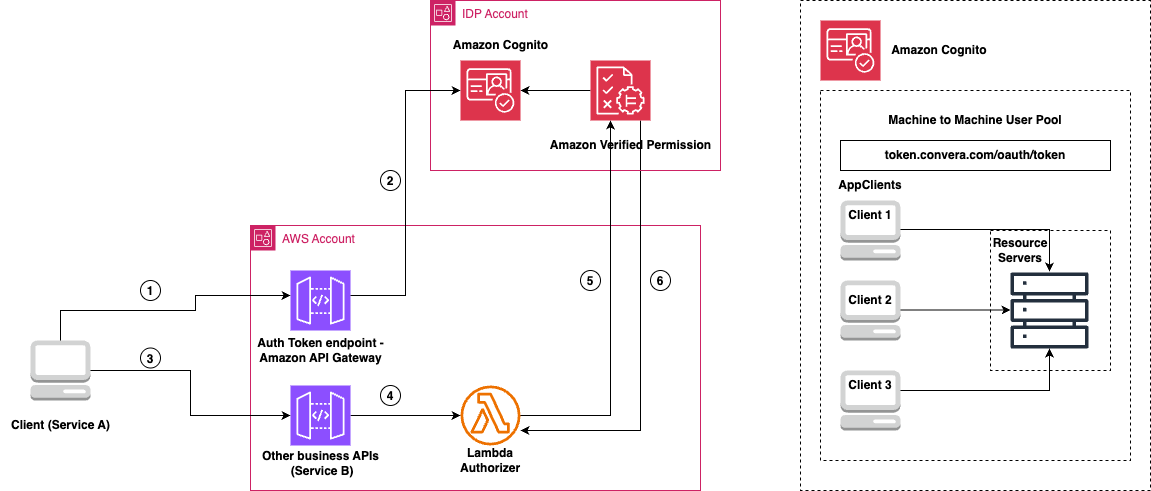
The following diagram illustrates the machine-to-machine architecture for internal and external partner integration.
Figure 3: Machine to machine architecture for internal and external partner integration
The workflow consists of the following steps:
Service A sends an API request to the authentication token endpoint in API Gateway, including its access token.
The request is forwarded to Amazon Cognito, which validates the token from the machine-to-machine user pool.
Service A, now authenticated, makes a request to the business API (Service B) through API Gateway.
API Gateway forwards the request to the Lambda authorizer, which processes the incoming request and extracts the service context from the token.
The Lambda authorizer sends the authorization request to Verified Permissions to evaluate it against stored Cedar policies. The evaluation considers:
Service identity
Requested operation
Resource context
Environmental factors
Verified Permissions returns an allow or deny decision. If allowed:
The Lambda authorizer generates an appropriate IAM policy.
API Gateway caches the authorization decision.
The request is forwarded to Service B.
Future similar requests can use the cached decision.
Multi-tenancy controls
As Convera expanded to support multi-tenant software as a service (SaaS) integrations, they needed a way to implement tenant-specific access controls and data isolation. The challenge was to make sure each tenant’s users could only access their authorized resources while allowing tenant administrators to manage their own access policies. Convera used their existing Verified Permissions architecture with a per-tenant policy store approach to address these requirements.
Verified Permissions per-tenant policy store
Convera decided to use per-tenant policy store approach for the following reasons:
Low-effort tenant policies isolation
The ability to customize templates and schema per tenant
Low-effort tenant onboarding and offboarding
Per-tenant policy store resource quotas
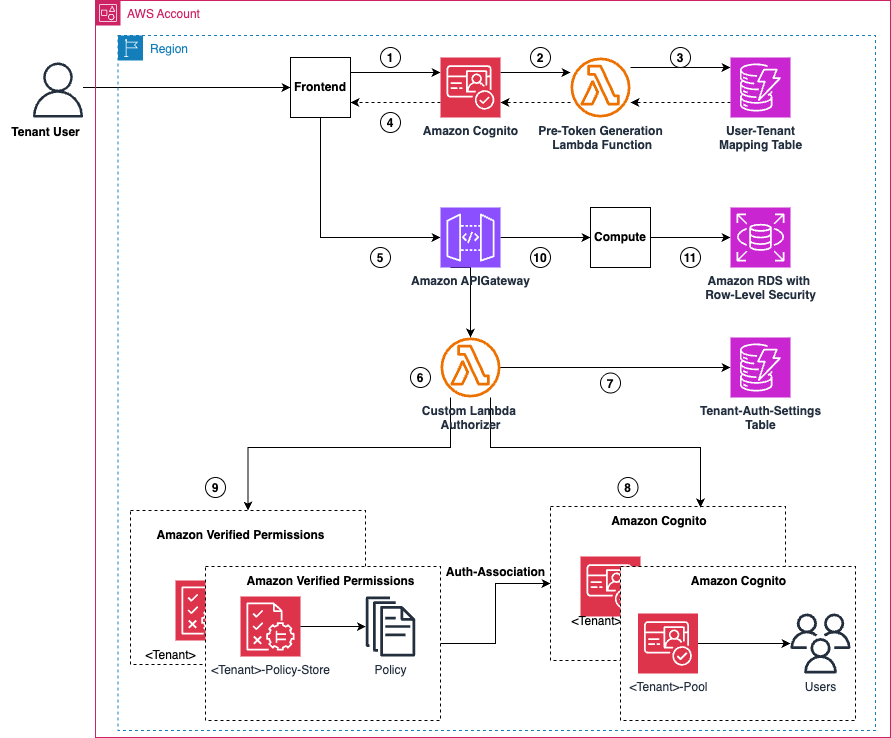
The following figure shows the process of implementing fine-grained authorization control using Verified Permissions with a per-tenant policy store.
Figure 4: Fine-grained authorization control using Verified Permissions with per-tenant policy store
The end-to-end process flow consists of the following steps:
The tenant-specific Amazon Cognito pool is created with a custom attribute called tenant_id. The user logs in to the pool with user claims (for example, user_id).
Amazon Cognito uses a pre-token generation Lambda function that looks up the user_id from a user tenant mapping DynamoDB table.
A DynamoDB table is maintained to map user and tenant configuration.
The pre-token generation Lambda hook gets the tenant_id back from DynamoDB, and adds to the custom tenant_id attribute in the access token.
The user makes an API call to API Gateway with the enriched JWT.
API Gateway validates the token and forwards the request to a custom Lambda authorizer.
The Lambda authorizer function reads the tenant_id from the JWT and looks up the associated Verified Permissions policy-store-id from a DynamoDB table.
The Lambda authorizer verifies the JWT for validity and claims with the Verified Permissions associated Amazon Cognito pool taken from the access token.
If authentication is successful, it calls Verified Permissions to verify that the user is permitted to do the requested action.
If allowed, Verified Permissions returns an IAM policy with Allow access (Deny-by-Default) and forwards the request to backend Kubernetes pods with tenant_id in a custom header.
Backend services receive the tenant_id and validate with Verified Permissions again (for zero-trust policy), creates a tenant context, and forwards to Amazon RDS. Amazon RDS is configured to accept only requests with specific tenant context and returns data specific to the requested tenant_id.
The following are some examples of Cedar policies used for multi-tenant isolation:
permit (
    principal in
        convera_connect_authz::userGroup::"ConveraConnect-PAYEE_MGMT",
    action in [convera_connect_authz::Action::"PUT /customer/user/{id}"],
    resource
);

permit (
    principal,
    action in [convera_connect_authz::Action::"EDIT"],
    resource
)
when
{
    principal.role.contains("UPDATE_USER_STATUS") &&
    resource.type == "PUT" &&
    resource.path == "/customers/user"
};
Conclusion
In this post, we explored how Convera used Verified Permissions to build a sophisticated, fine-grained authorization model for their API platform. We discussed about how Convera was able to implement fine-grained access for their customers, multi-tenant SaaS integrations, machine-to-machine communication scenarios, and internal customer connect applications with the help of Verified Permissions. With Verified Permissions, Convera was able to achieve the following:
Implement fine-grained access control across multiple use cases
Enhance security with attribute-based access control across multi-tenant environments
Improve scalability, handling over thousands of authorization requests per second with submillisecond latency.
Increase operational efficiency, reducing time spent on access management tasks by 60%.
Future-proof their authorization framework to adapt to evolving business needs
To learn more about implementing these patterns and best practices, refer to the Verified Permissions User Guide. For hands-on experience, we recommend exploring the Verified Permissions workshop, which provides practical examples and guided exercises.
Customers of all sizes have been successfully using Amazon OpenSearch Service to power their observability workflows and gain visibility into their applications and infrastructure. During incident investigation, Site Reliability Engineers (SREs) and operations center personnel rely on OpenSearch Service to query logs, examine visualizations, analyze patterns, correlate traces to find the root cause of the incident, and reduce Mean Time to Resolution (MTTR). When an incident happens that triggers alerts, SREs typically jump between multiple dashboards, write specific queries, check recent deployments, and correlate between logs and traces to piece together a timeline of events. Not only is this process largely manual, but it also creates a cognitive load on these personnel, even when all the data is readily available. This is where agentic AI can help, by being an intelligent assistant that can understand how to query, interpret various telemetry signals, and systematically investigate an incident.
In this post, we present an observability agent using OpenSearch Service and Amazon Bedrock AgentCore that can help surface root cause and get insights faster, handle multiple query-correlation cycles, and ultimately reduce MTTR even further.
Solution overview
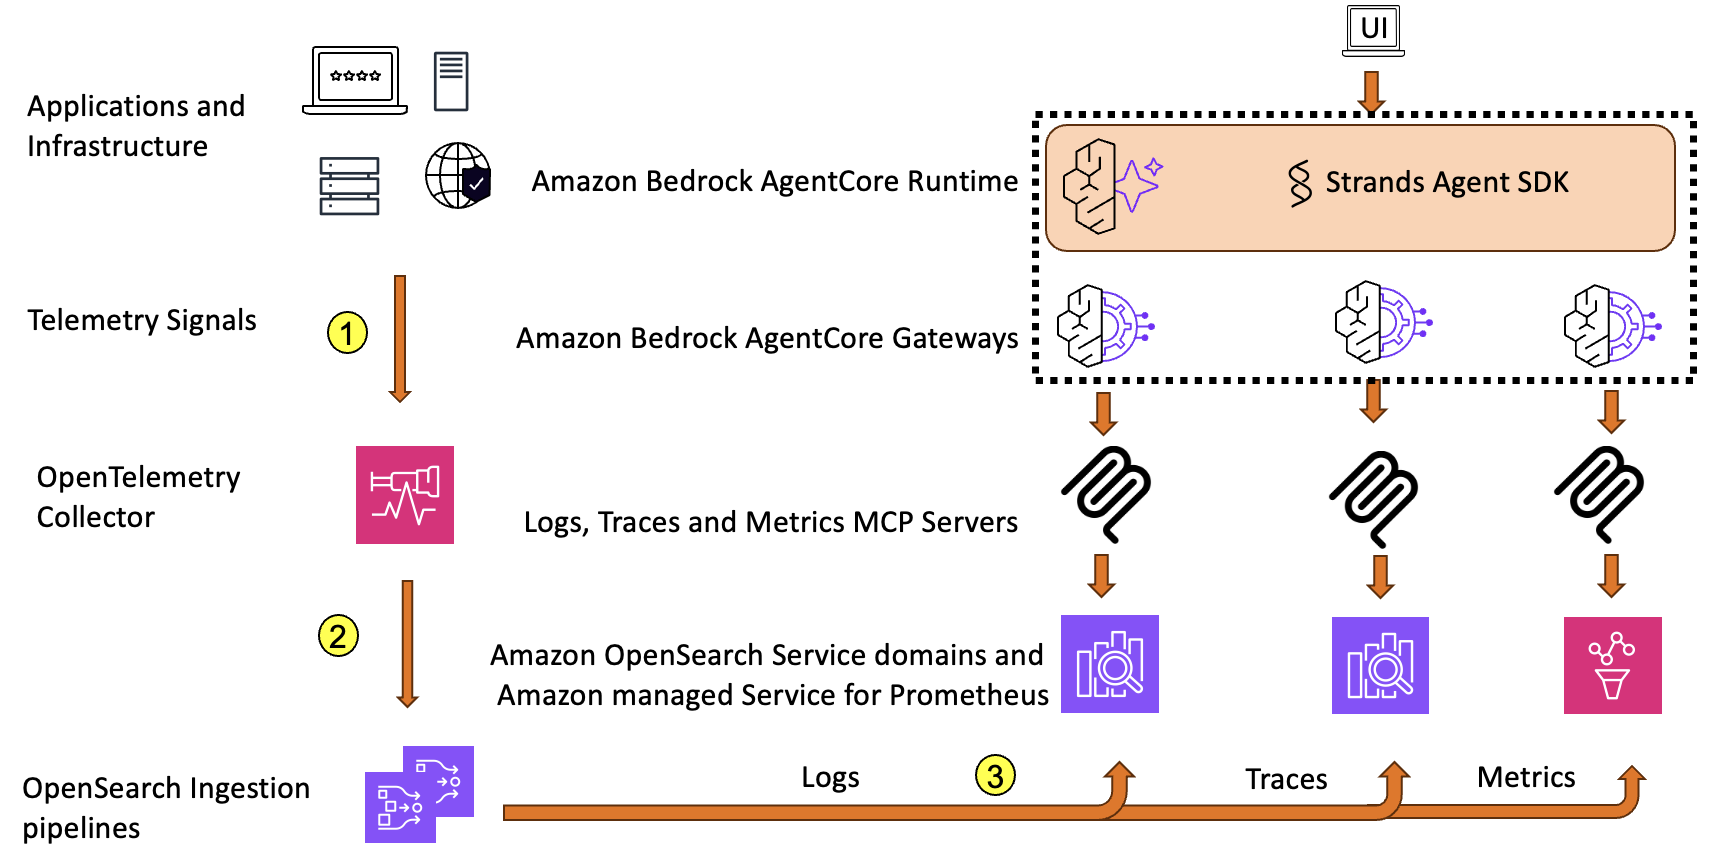
The following diagram shows the overall architecture for the observability agent.
OpenTelemetry is the standard for instrumentation, and provides vendor-neutral data collection across a broad range of languages and frameworks. Enterprises of various sizes are adopting this architecture pattern using OpenTelemetry for their observability needs, especially those committed to open source tools. More notably, this architecture builds on open source foundations, helping enterprises avoid vendor lock-in, benefit from the open source community, and implement it across on-premises and various cloud environments.
For this post, we use the OpenTelemetry Demo application to demonstrate our observability use case. This is an ecommerce application powered by about 20 different microservices, and generates realistic telemetry data together with feature sets to generate load and simulate failures.
Model Context Protocol servers for observability signal data
The Model Context Protocol (MCP) provides a standardized mechanism to connect agents to external data sources and tools. In this solution, we built three distinct MCP servers, one for each type of signal.
The Logs MCP server exposes tool functions for searching, filtering, and selecting log data that is stored in an OpenSearch Service domain for log data. This enables the agent to query the logs using various criteria like simple keyword matching, service name filter, log level, or time ranges. This mimics the typical queries you would run during an investigation. The following snippet shows a pseudo code of what the tool function can look like:
# Logs MCP Server - Key Functions
search_otel_logs(
    query: string,           # Text search query for log messages
    service: string,         # Service name to filter logs
    severity: string,        # Log level (INFO, WARN, ERROR)
    startTime: string,       # Start time (ISO format or relative e.g., 'now-1h')
    endTime: string,         # End time (ISO format or relative e.g., 'now')
    size: number             # Number of results to return
)
get_logs_by_trace_id(
    traceId: string,         # Trace ID to retrieve all correlated logs
    size: number             # Maximum number of logs to return
)
The Traces MCP server exposes tool functions for searching and retrieving information about distributed traces. These functions can help look up traces by trace ID and find traces for a particular service, the spans belonging to a trace, the service map information constructed based on the spans, and the rate, error, and duration (also known as RED metrics). This enables the agent to follow a request’s path across the services and pinpoint where failures happened or latency originated.
# Traces MCP Server - Key Functions
get_otel_spans(
    serviceName: string,     # Service name to filter spans
    traceId: string,         # Trace ID to filter spans
    spanId: string,          # Span ID to retrieve a specific span
    operationName: string,   # Operation/span name to filter
    startTime: string,       # Start time (ISO format or relative)
    endTime: string,         # End time (ISO format or relative)
    size: number             # Number of results to return
)
get_spans_by_trace_id(
    traceId: string,         # Trace ID to retrieve all spans for
    size: number             # Maximum number of spans to return
)
get_otel_service_map(
    serviceName: string,     # Service name to filter service map
    startTime: string,       # Start time
    endTime: string,         # End time
    size: number             # Number of results to return
)
get_otel_rate_error_duration_metrics(
    startTime: string,       # Start time (default: 'now-5m')
    endTime: string          # End time (default: 'now')
)
The Metrics MCP server exposes tool functions for querying time series metrics. The agent can use these functions to check error rate percentiles and resource utilization, which are key signals for understanding the overall health of the system and identifying anomalous behavior.
These three MCP servers span across the different types of data used by investigation engineers, providing a complete working set for an agent to conduct investigations with autonomous correlation across logs, traces, and metrics to determine the possible root causes for an issue. Additionally, a custom MCP server exposes tool functions over business data on revenue, sales, and other business metrics. For the OpenTelemetry demo application, you can develop synthetic data to aid in providing context for impact and other business level metrics. For brevity, we don’t show that server as a part of this architecture.
Observability agent
The observability agent is central to the solution. It is built to help with incident investigation. Traditional automations and manual runbooks typically follow predefined operating procedures, but with an observability agent, you don’t need to define them. The agent can analyze, reason based on the data available to it, and adapt its strategy based on what it discovers. It correlates findings across logs, traces, and metrics to arrive at a root cause.
The observability agent is built with the Strands Agent SDK, an open source framework that simplifies development of AI agents. The SDK provides a model-driven approach with flexibility to handle underlying orchestration and reasoning (the agent loop) by invoking exposed tools and maintaining coherent, turn-based interactions. This implementation also discovers tools dynamically, so if there is a change in the capabilities, the agent can make decisions based on up-to-date information.
The agent runs on Amazon Bedrock AgentCore Runtime, which provides fully managed infrastructure for hosting and running agents. The runtime supports popular agent frameworks, including Stands, LangGraph, and CrewAI. The runtime also provides scaling availability and compute that many enterprises require to run production-grade agents.
We use Amazon Bedrock AgentCore Gateway to connect to all three MCP servers. When deploying agents at scale, gateways are indispensable components to reduce management tasks like custom code development, infrastructure provisioning, comprehensive ingress and egress security, and unified access. These are essential enterprise functions needed when bringing a workload to production. In this application, we create gateways that connect all three MCP servers as targets using server-sent events. Gateways work alongside Amazon Bedrock AgentCore Identities to provide secure credentials management and secure identity propagation from the user to the communicating entities. The sample application uses AWS Identity and Access Management (IAM) for identity management and propagation.
Incident investigation is often a multi-step process. It involves iterative hypothesis testing, multiple rounds of querying, and building context over time. We use Amazon Bedrock AgentCore Memory for this purpose. In this solution, we use session-based namespaces to maintain separate conversation threads for different investigations. For example, when a user asks “What about Payment service?” during an investigation, the agent retrieves recent conversation history from memory to maintain awareness of prior findings. We store both user questions and agent responses with timestamps to help the agent reconstruct the conversation chronologically and reason about already completed findings.
We configured the observability agent to use Anthropic’s Claude Sonnet v4.5 in Amazon Bedrock for reasoning. The model interprets questions, decides which MCP tool to invoke, analyzes the results, and formulates the set of questions or conclusions. We use a system prompt to instruct the model to think like an experienced SRE or an operation center engineer: “Starting with a high-level check, narrowing down affected components, correlate across telemetry signal types and derive conclusion with substantiation. You ask the model to also suggest logical next steps such as performing a drill down to investigate inter service dependencies.” This makes the agent versatile to analyze and reason about common varieties of incident investigations.
Observability agent in action
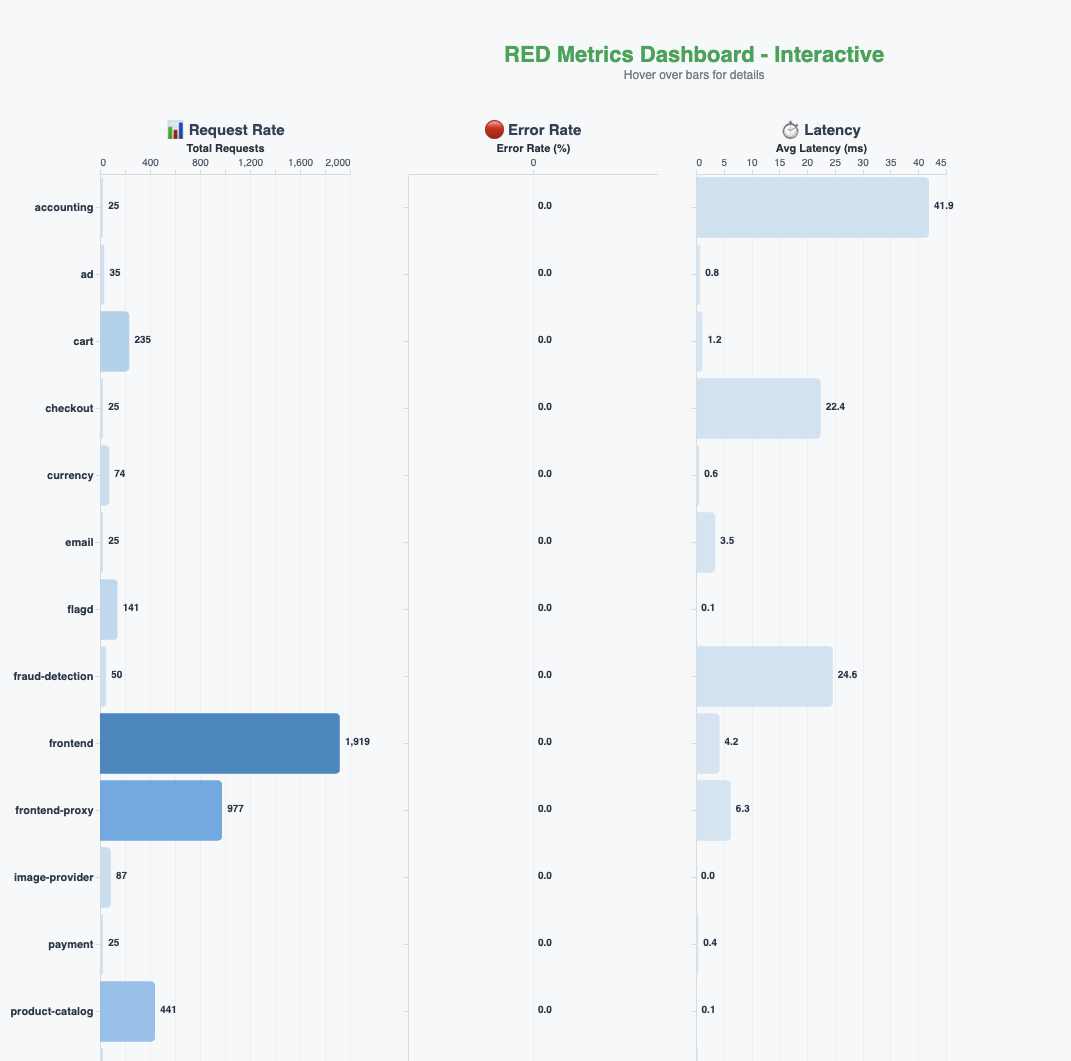
We built a real-time RED (rate, errors, duration) metrics dashboards for the entire application, as shown in the following figure.
To establish a baseline, we asked the agent the following question: “Are there any errors in my application in the last five minutes?”The agent queries the traces and metrics, analyzes the results, and responds saying there are no errors in the system. It notes that all the services are active, traces are healthy, and the system is processing requests normally. The agent also proactively suggests next steps that might be useful for further investigation.
Introducing failures
The OpenTelemetry demo application has a feature flag that we can use to introduce deliberate failures in the system. It also includes load generation so these errors can surface prominently. We use these features to introduce a few failures with the payment service. The real-time RED metrics dashboards in the previous figure reflect the impact and show the error rates climbing.
Investigation and root cause analysis
Now that we are generating errors, we engage the agent again. This is typically the start of the investigation session. Also, we have workflows like alarms triggering or pages going out that will trigger the starting of an investigation.
We ask the question “Users are complaining that it is taking a long time to buy items. Can you check to see what is going on?”
The agent retrieves the conversation history from memory (if there is any), invokes tools to query RED metrics across services, and analyzes the results. It identifies a critical purchase flow performance issue: payment service is in a connectivity crisis and completely unavailable, with extreme latency observed in fraud detection, ad service, and recommendation service. The agent provides immediate action recommendations—restore payment service connectivity as the top priority—and suggests next steps, including investigating payment service logs.
Following the agent’s suggestion, we ask it to investigate the logs: “Investigate payment service logs to understand the connectivity issue.”
The agent searches logs for the checkout and payment services, correlates them with trace data, and analyzes service dependencies from the service map. It confirms that although cart service, product catalog service, and currency service are healthy, the payment service is completely unreachable, successfully identifying the root cause of our deliberately introduced failure.
Beyond root cause: Analyzing business impact
As mentioned earlier, we have synthetic business sales and revenue data in a separate MCP server, so when the user asks the agent “Analyze the business impact of the checkout and payment service failures,” the agent uses this business data, examines the transaction data from traces, calculates estimated revenue impact, and assesses customer abandonment rates due to checkout failures. This shows how the agent can go beyond identifying the root cause and provide help with operational activities like creating a runbook for issue resolution in the future, which can be first the step to providing automatic remediation without involving SREs.
Benefits and results
Although the failure scenario in this post is simplified for illustration, it highlights several key benefits that directly contribute to reducing MTTR.
Accelerated investigation cycles
Traditional workflows for troubleshooting involve multiple iterations of hypotheses, verification, querying, and data analysis at each step, requiring context switching and consuming hours of effort. The observability agent reduces these drastically to a few minutes by autonomous reasoning, correlation, and actioning, which in turn reduces MTTR.
Handling complex workflows
Real-world production scenarios often involve cascading failures and multiple system failures. The observability agent’s capabilities can extend to these scenarios by using historical data and pattern recognition. For instance, it can distinguish related issues from false positives using temporal or identity-based correlation, dependency graphs, and other techniques, helping SREs avoid wasted investigation effort on unrelated anomalies.
Rather than provide a single answer, the agent can provide probabilistic distribution across potential root causes, helping SREs prioritize remediation methods; for example:
Payment service network connectivity issue: 75%
Downstream payment gateway timeout: 15%
Database connection pool exhaustion: 8%
Other/Unknown: 2%
The agent can compare current symptoms against past incidents, identifying whether similar patterns have happened in the past, thereby evolving from a reactive query tool into a proactive diagnostic assistant.
Conclusion
Incident investigation remains largely manual. SREs juggle dashboards, craft queries, and correlate signals under pressure, even when all the data is readily available. In this post, we showed how an observability agent built with Amazon Bedrock AgentCore and OpenSearch Service can alleviate this cognitive burden by autonomously querying logs, traces, and metrics; correlating findings; and guiding SREs toward root cause faster. Although this pattern represents one approach, the flexibility of Amazon Bedrock AgentCore combined with the search and analytics capabilities of OpenSearch Service enables agents to be designed and deployed in numerous ways—at different stages of the incident lifecycle, with varying levels of autonomy, or focused on specific investigation tasks—to suit your organization’s unique operational needs. Agentic AI doesn’t replace existing observability investment, but amplifies them by providing an effective way to use your data during incident investigations.
Source – Input component that specifies how the pipeline ingests the data. Each pipeline has a single source which can be either push-based and pull-based.
Processors – Intermediate processing units that can filter, transform, and enrich records before delivery.
Sink – Output component that specifies the destination(s) to which the pipeline publishes data. It can publish records to one or more destinations.
Buffer – It is the layer between the source and the sink. It serves as temporary storage for events, decoupling the source from the downstream processors and sinks. Amazon OpenSearch Ingestion also offers a persistent buffer option for push-based sources
Dead-letter queues (DLQs) – Configures Amazon Simple Storage Service (Amazon S3) to capture records that fail to write to the sink, enabling error handling and troubleshooting.
This end-to-end data ingestion service can help you collect, process, and deliver data to your OpenSearch environments without the need to manage underlying infrastructure.
This post provides an in-depth look at setting up Amazon CloudWatch alarms for OpenSearch Ingestion pipelines. It goes beyond our recommended alarms to help identify bottlenecks in the pipeline, whether that’s in the sink, the OpenSearch clusters data is being sent to, the processors, or the pipeline not pulling or accepting enough from the source. This post will help you proactively monitor and troubleshoot your OpenSearch Ingestion pipelines.
Overview
Monitoring your OpenSearch Ingestion pipelines is crucial for catching and addressing issues early. By understanding the key metrics and setting up the right alarms, you can proactively manage the health and performance of your data ingestion workflows. In the following sections, we provide details about alarm metrics for different sources, monitors, and sinks. The specific values for the threshold, period, and datapoints to alarm used for alarms can vary based on the individual use case and requirements.
You can enable logging for OpenSearch Ingestion Pipeline, which captures various log messages during pipeline operations and ingestion activity, including errors, warnings, and informational messages. For details on enabling and monitoring pipeline logs, refer to Monitoring pipeline logs
Sources
The entry point of your pipeline is often where monitoring should begin. By setting appropriate alarms for source components, you can quickly identify ingestion bottlenecks or connection issues. The following table summarizes key alarm metrics for different sources.
Source
Alarm
Description
Recommended Action
HTTP/ OpenTelemetry
requestsTooLarge.count Threshold: >0 Statistic: SUM Period: 5 minutes Datapoints to alarm: 1 out 1
The request payload size of the client (data producer) is greater than the maximum request payload size, resulting in the status code HTTP 413. The default maximum request payload size is 10 MB for HTTP sources and 4 MB for OpenTelemetry sources. The limit for the HTTP sources can be increased for the pipelines with persistent buffer enabled.
The chunk size for the client can be reduced so that the request payload doesn’t exceed the maximum size. You can examine the distribution of payload sizes of incoming requests using the payloadSize.sum metric.
HTTP
requestsRejected.count Threshold: >0 Statistic: SUM Period: 5 minutes Datapoints to alarm: 1 out 1
The request was sent to the HTTP endpoint of the OpenSearch Ingestion pipeline by the client (data producer), but the request wasn’t accepted by the pipeline, and it rejected the request with the status code 429 in the response.
For persistent issues, consider increasing the minimum OCUs for the pipeline to allocate additional resources for request processing.
Amazon S3
s3ObjectsFailed.count Threshold: >0 Statistic: SUM Period: 5 minutes Datapoints to alarm: 1 out 1
The pipeline is unable to read some objects from the Amazon S3 source.
Refer to REF-003 in Reference Guide below.
Amazon DynamoDB
Difference for totalOpenShards.max - activeShardsInProcessing.value Threshold: >0 Statistic: Maximum (totalOpenShards.max) and Sum (activeShardsInProcessing.value) Datapoints to Alarm: 3 out of 3.Additional Note: refer REF-004 for more details on configuring this specific alarm.
It monitors alignment between total open shards that should be processed by the pipeline and active shards currently in processing. The activeShardsInProcessing.value will go down periodically as shards close but should never misalign from ‘totalOpenShards.max’ for longer than a couple of minutes.
If the alarm is triggered, you can consider stopping and starting the pipeline, this option resets the pipeline’s state, and the pipeline will restart with a new full export. It is non-destructive, so it does not delete your index or any data in DynamoDB. If you don’t create a fresh index before you do this, you might see a high number of errors from version conflicts because the export tries to insert older documents than the current _version in the index. You can safely ignore these errors. For root cause analysis on the misalignment, you can reach out to AWS Support
Amazon DynamoDB
dynamodb.changeEventsProcessingErrors.count Threshold: >0 Statistic: SUM Period: 5 minutes Datapoints to alarm: 1 out 1
The number of processing errors for change events for a pipeline with stream processing for DynamoDB.
If the metrics report increasing values, refer to REF-002 in Reference Guide below
Amazon DocumentDB
documentdb.exportJobFailure.count Threshold: >0 Statistic: SUM Period: 5 minutes Datapoints to alarm: 1 out 1
The attempt to trigger an export to Amazon S3 failed.
Review ERROR-level logs in the pipeline logs for entries beginning with “Received an exception during export from DocumentDB, backing off and retrying.” These logs contain the complete exception details indicating the root cause of the failure.
Amazon DocumentDB
documentdb.changeEventsProcessingErrors.count Threshold: >0 Statistic: SUM Period: 5 minutes Datapoints to alarm: 1 out 1
The number of processing errors for change events for a pipeline with stream processing for Amazon DocumentDB.
Refer to REF-002 in Reference Guide below
Kafka
kafka.numberOfDeserializationErrors.count Threshold: >0 Statistic: SUM Period: 5 minutes Datapoints to alarm: 1 out 1
The OpenSearch Ingestion pipeline encountered deserialization errors while consuming a record from Kafka.
Review WARN-level logs in the pipeline logs and verify serde_format is configured correctly in the pipeline configuration and the pipeline role has access to the AWS Glue Schema Registry (if used).
OpenSearch
opensearch.processingErrors.count Threshold: >0 Statistic: SUM Period: 5 minutes Datapoints to alarm: 1 out 1
Processing errors were encountered while reading from the index. Ideally, the OpenSearch Ingestion pipeline would retry automatically, but for unknown exceptions, it might skip processing.
Refer to REF-001 or REF-002 in Reference Guide below, to get the exception details that resulted in processing errors.
Amazon Kinesis Data Streams
kinesis_data_streams.recordProcessingErrors.count Threshold: >0 Statistic: SUM Period: 5 minutes Datapoints to alarm: 1 out 1
The OpenSearch Ingestion pipeline encountered an error while processing the records.
If the metrics report increasing values, refer to REF-002 in Reference Guide below, which can help in identifying the cause.
Amazon Kinesis Data Streams
kinesis_data_streams.acknowledgementSetFailures.count Threshold: >0 Statistic: SUM Period: 5 minutes Datapoints to alarm: 1 out 1
The pipeline encountered a negative acknowledgment while processing the streams, causing it to reprocess the stream.
Refer to REF-001 or REF-002 in Reference Guide below.
Confluence
confluence.searchRequestsFailed.count Threshold: >0 Statistic: SUM Period: 5 minutes Datapoints to alarm: 1 out 1
While trying to fetch the content, the pipeline encountered the exception.
Review ERROR-level logs in the pipeline logs for entries beginning with “Error while fetching content.” These logs contain the complete exception details indicating the root cause of the failure.
Confluence
confluence.authFailures.count Threshold: >0 Statistic: SUM Period: 5 minutes Datapoints to alarm: 1 out 1
The number of UNAUTHORIZED exceptions received while establishing the connection
Although the service should automatically renew tokens, if the metrics show an increasing value, review ERROR-level logs in the pipeline logs to identify why the token refresh is failing.
Jira
jira.ticketRequestsFailed.count Threshold: >0 Statistic: SUM Period: 5 minutes Datapoints to alarm: 1 out 1
While trying to fetch the issue, the pipeline encountered an exception.
Review ERROR-level logs in the pipeline logs for entries beginning with “Error while fetching issue.” These logs contain the complete exception details indicating the root cause of the failure.
Jira
jira.authFailures.count Threshold: >0 Statistic: SUM Period: 5 minutes Datapoints to alarm: 1 out 1
The number of UNAUTHORIZED exceptions received while establishing the connection.
Although the service should automatically renew tokens, if the metrics show an increasing value, review ERROR-level logs in the pipeline logs to identify why the token refresh is failing.
Processors
The following table provides details about alarm metrics for different processors.
Processor
Alarm
Description
Recommended Action
AWS Lambda
aws_lambda_processor.recordsFailedToSentLambda.count Threshold: >0 Statistic: SUM Period: 5 minutes Datapoints to alarm: 1 out 1
Some of the records could not be sent to Lambda.
In the case of high values for this metric, refer to REF-002 in Reference Guide below.
AWS Lambda
aws_lambda_processor.numberOfRequestsFailed.count Threshold: >0 Statistic: SUM Period: 5 minutes Datapoints to alarm: 1 out 1
The pipeline was unable to invoke the Lambda function.
Although this situation should not occur under normal conditions, if it does, review Lambda logs and refer to REF-002 in Reference Guide below.
AWS Lambda
aws_lambda_processor.requestPayloadSize.max Threshold: >= 6292536 Statistic: MAXIMUM Period: 5 minutes Datapoints to alarm: 1 out 1
The payload size is exceeding the 6 MB limit, so the Lambda function can’t be invoked.
Consider revisiting the batching thresholds in the pipeline configuration for the aws_lambda processor.
Grok
grok.grokProcessingMismatch.count Threshold: >0 Statistic: SUM Period: 5 minutes Datapoints to alarm: 1 out 1
The incoming data doesn’t match the Grok pattern defined in the pipeline configuration.
In the case of high values for this metric, review the Grok processor configurations and make sure the defined pattern matches according to the incoming data.
Grok
grok.grokProcessingErrors.count Threshold: >0 Statistic: SUM Period: 5 minutes Datapoints to alarm: 1 out 1
The pipeline encountered an exception when extracting the information from the incoming data according to the defined Grok pattern.
In the case of high values for this metric, refer to REF-002 in Reference Guide below.
Grok
grok.grokProcessingTime.max Threshold: >= 1000 Statistic: MAXIMUM Period: 5 minutes Datapoints to alarm: 1 out 1
The maximum amount of time that each individual record takes to match against patterns from the match configuration option.
If the time taken is equal to or more than 1 second, check the incoming data and the Grok pattern. The maximum amount of time during which matching occurs is 30,000 milliseconds, which is controlled by the timeout_millis parameter.
Sinks and DLQs
The following table contains details about alarm metrics for different sinks and DLQs.
Sink
Alarm
Description
Recommended Action
OpenSearch
opensearch.bulkRequestErrors.count Threshold: >0 Statistic: SUM Period: 5 minutes Datapoints to alarm: 1 out 1
The number of errors encountered while sending a bulk request.
Refer to REF-002 in Reference Guide below which can help to identify the exception details.
OpenSearch
opensearch.bulkRequestFailed.count Threshold: >0 Statistic: SUM Period: 5 minutes Datapoints to alarm: 1 out 1
The number of errors received after sending the bulk request to the OpenSearch domain.
Refer to REF-001 in Reference Guide below which can help to identify the exception details.
Amazon S3
s3.s3SinkObjectsFailed.count Threshold: >0 Statistic: SUM Period: 5 minutes Datapoints to alarm: 1 out 1
The OpenSearch Ingestion pipeline encountered a failure while writing the object to Amazon S3.
Verify that the pipeline role has the necessary permissions to write objects to the specified S3 key. Review the pipeline logs to identify the specific keys where failures occurred. Monitor the s3.s3SinkObjectsEventsFailed.count metric for granular details on the number of failed write operations.
Amazon S3 DLQ
s3.dlqS3RecordsFailed.count Threshold: >0 Statistic: SUM Period: 5 minutes Datapoints to alarm: 1 out 1
For a pipeline with DLQ enabled, the records are either sent to the sink or to the DLQ (if they are unable to send to the sink). This alarm indicates the pipeline was unable to send the records to the DLQ due to some error.
Refer to REF-002 in Reference Guide below which can help to identify the exception details.
Buffer
The following table contains details about alarm metrics for buffers.
Buffer
Alarm
Description
Recommended Action
BlockingBuffer
BlockingBuffer.bufferUsage.value Threshold: >80 Statistic: AVERAGE Period: 5 minutes Datapoints to alarm: 1 out 1
The percent usage, based on the number of records in the buffer.
To investigate further, check if the Pipeline is bottlenecked due to processors or sink by comparing timeElapsed.max metrics and analyzing bulkRequestLatency.max
Persistent
persistentBufferRead.recordsLagMax.value Threshold: > 5000 Statistic: AVERAGE Period: 5 minutes Datapoints to alarm: 1 out 1
The maximum lag in terms of number of records stored in the persistent buffer.
If the value for bufferUsage is low, increase the maximum OCUs. If bufferUsage is also high [>80], investigate if pipeline is bottlenecked by processors or sink.
Reference Guide
The following provide guidance for resolving common pipeline issues along with general reference.
REF-001: WARN-level Log Review
Review WARN-level logs in the pipeline logs to identify the exception details.
REF-002: ERROR-level Log Review
Review ERROR-level logs in the pipeline logs to identify the exception details.
REF-003: S3 Objects Failed
When troubleshooting increasing s3ObjectsFailed.count values, monitor these specific metrics to narrow down the root cause:
s3ObjectsAccessDenied.count – This metric increments when the pipeline encounters Access Denied or Forbidden errors while reading S3 objects. Common causes include:
Insufficient permissions in the pipeline role.
Restrictive S3 bucket policy not allowing the pipeline role access.
For cross-account S3 buckets, incorrectly configured bucket_owners mapping.
s3ObjectsNotFound.count – This metric increments when the pipeline receives Not Found errors while attempting to read S3 objects.
For further assistance with the recommended actions, contact AWS support.
REF-004: Configuring Alarm for difference in totalOpenShards.max and activeShardsInProcessing.value for Amazon DynamoDB source.
Let’s review couple of scenarios based on the above metrics.
Scenario 1 – Understand and Lower Pipeline Latency
Latency within a pipeline is built up of three main components:
The time it takes to send documents via bulk requests to OpenSearch,
the time it takes for data to go through the pipeline processors, and
the time that data sits in the pipeline buffer
Bulk requests and processors (last two items in the previous list) are the root causes for why the buffer builds up and leads to latency.
To monitor how much data is being stored in the buffer, monitor the bufferUsage.value metric. The only way to lower latency within the buffer is to optimize the pipeline processors and sink bulk request latency, depending on which of those is the bottleneck.
The bulkRequestLatency metric measures the time taken to execute bulk requests, including retries, and can be used to monitor write performance to the OpenSearch sink. If this metric reports an unusually high value, it indicates that the OpenSearch sink may be overloaded, causing increased processing time. To troubleshoot further, review the bulkRequestNumberOfRetries.count metric to confirm whether the high latency is due to rejections from OpenSearch that are leading to retries, such as throttling (429 errors) or other reasons. If document errors are present, examine the configured DLQ to identify the failed document details. Additionally, the max_retries parameter can be configured in the pipeline configuration to limit the number of retries. However, if the documentErrors metric reports zero, the bulkRequestNumberOfRetries.count is also zero, and the bulkRequestLatency remains high, it is likely an indicator that the OpenSearch sink is overloaded. In this case, review the destination metrics for additional details.
If the bulkRequestLatency metric is low (for example, less than 1.5 seconds) and the bulkRequestNumberOfRetries metric is reported as 0, then the bottleneck is likely within the pipeline processors. To monitor the performance of the processors, review the <processorName>.timeElapsed.avg metric. This metric reports the time taken for the processor to complete processing of a batch of records. For example, if a grok processor is reporting a much higher value than other processors for timeElapsed, it may be due to a slow grok pattern that can be optimized or even replaced with a more performant processor, depending on the use case.
Scenario 2 – Understanding and Resolving Document Errors to OpenSearch
The documentErrors.count metric tracks the number of documents that failed to be sent by bulk requests. The failure can happen due to various reasons such as mapping conflicts, invalid data formats, or schema mismatches. When this metric reports a non-zero value, it indicates that some documents are being rejected by OpenSearch. To identify the root cause, examine the configured Dead Letter Queue (DLQ), which captures the failed documents along with error details. The DLQ provides information about why specific documents failed, enabling you to identify patterns such as incorrect field types, missing required fields, or data that exceeds size limits. For example, find the sample DLQ objects for common issues below:
Mapper parsing exception:
{"dlqObjects": [{
        "pluginId": "opensearch",
        "pluginName": "opensearch",
        "pipelineName": "<PipelineName>",
        "failedData": {
            "index": "<IndexName>",
            "indexId": null,
            "status": 400,
            "message": "failed to parse field [<fieldname>] of type [integer] in document with id '<DocumentId>'. Preview of field's value: 'N/A' caused by For input string: \"N/A\"",
            "document": {<OriginalDocument>}
        },
        "timestamp": "…"
    }]}
Here, OpenSearch cannot store the text string “N/A” in a field that is only for numbers, so it rejects the document and stores it in the DLQ.
Limit of total fields exceeded:
{"dlqObjects": [{
        "pluginId": "opensearch",
        "pluginName": "opensearch",
        "pipelineName": "<PipelineName>",
        "failedData": {
            "index": "<IndexName>",
            "indexId": null,
            "status": 400,
            "message": "Limit of total fields [<field limit>] has been exceeded",
            "document": {<OriginalDocument>}
        },
        "timestamp": "…"
    }]}
The index.mapping.total_fields.limit setting is the parameter that controls the maximum number of fields allowed in an index mapping, and exceeding this limit will cause indexing operations to fail. You can check if all those fields are required or leverage various processors provided by OpenSearch Ingestion to transform the data.
Once these issues are identified, you can either correct the source data, adjust the pipeline configuration to transform the data appropriately, or modify the OpenSearch index mapping to accommodate the incoming data format.
Clean up
When setting up alarms for monitoring your OpenSearch Ingestion pipelines, it’s important to be mindful of the potential costs involved. Each alarm you configure will incur charges based on the CloudWatch pricing model.
To avoid unnecessary expenses, we recommend carefully evaluating your alarm requirements and configuring them accordingly. Only set up the alarms that are essential for your use case, and regularly review your alarm configurations to identify and remove unused or redundant alarms.
Conclusion
In this post, we explored the comprehensive monitoring capabilities for OpenSearch Ingestion pipelines through CloudWatch alarms, covering key metrics across various sources, processors, and sinks. Although this post highlights the most critical metrics, there’s more to discover. For a deeper dive, refer to the following resources:
As data footprints swell and multi-cloud strategies become the norm, the complexity of managing object lifecycles—from initial creation to eventual archival or deletion—can introduce significant risk and operational overhead. To help our customers solve for this, we recently announced support for lifecycle rules through S3-compatible APIs.
While the previous post focused on what the feature enables and why it matters, this follow-up will look at how lifecycle rules work at a deeper level and what to keep in mind when using them in production.
Why S3 compatible lifecycle rules matter
Let’s quickly refresh your memory about why this feature matters. Many customers already rely on lifecycle rules in Backblaze B2 to manage storage costs and data retention. These rules automate actions like deleting old objects, hiding previous versions, or cleaning up incomplete multipart uploads.
By adding S3 compatible support for lifecycle rules in Backblaze B2, it allows you:
Lift and shift migrations from AWS S3 to Backblaze B2
Reuse of existing tools, xml configurations, scripts, applications & infrastructure as code
Predictable behavior across environments as part of multi-cloud strategy
API surface area and XML structure
Lifecycle rules are managed using three APIs:
PutBucketLifecycleConfiguration
GetBucketLifecycleConfiguration
DeleteBucketLifecycleConfiguration
These APIs accept and return XML documents that follow the AWS S3 lifecycle configuration format. From a client perspective, this behaves the same way it does on S3, including rule IDs, status flags, filters, and actions.
Example put lifecycle request
Below is a simple example that hides objects under the logs/ prefix after 30 days.
PUT /?lifecycle HTTP/1.1
Host: my-bucket.s3.us-west-004.backblazeb2.com
Content-Type: application/xml
At evaluation time, B2 walks object versions in order and applies rules like this:
Pseudo code:
for each object in bucket:
  for each version of object with data prefix:
    if version is non current:
      if age_in_days >= NoncurrentDays:
        delete version
For current versions, expiration works differently.
Expiring the current version
When a lifecycle rule expires the current version, B2 creates a hide marker instead of deleting data immediately.
This matches S3 semantics and preserves version history.
current version expired
        |
        v
hide marker created
        |
        v
current version becomes non current
Overlapping and nested prefix rules
Backblaze B2 supports multiple lifecycle rules on the same bucket, including overlapping and nested prefixes.
For example, you might configure:
A general rule for logs/ that deletes objects after 365 days
A more specific rule for logs/audit/ that deletes objects after 90 days
When rules overlap, the configuration with lowest value is applied to save cost to you. This mirrors S3 behavior and allows fine grained control without duplicating buckets.
Matching logic:
object path: logs/audit/2024/01/file.json

matching rules:
- logs/
- logs/audit/

selected rule:
- logs/audit/ because it has lowest value, 90 days
Multipart upload cleanup
Lifecycle rules can also be used to abort incomplete multipart uploads if not completed in a certain number of days. This is implemented by tracking the initiation time of multipart uploads and periodically removing uploads that exceed the configured threshold. This helps prevent abandoned uploads from consuming storage indefinitely.
Below is an example rule to delete multipart uploads that are not completed after seven days after starting the upload process.
Multipart uploads are tracked with their initiation timestamp.
Pseudo code:
for each multipart_upload:
  if now - initiation_time >= DaysAfterInitiation:
    abort upload
    delete uploaded parts
Lifecycle execution model
Lifecycle rules are not executed in real time. Instead, they are evaluated by background processes that scan eligible objects and apply actions asynchronously.
Important characteristics:
Rules are not evaluated in real time
Execution is eventually consistent
Large buckets may take multiple passes to fully apply changes
This design allows lifecycle processing to scale across billions of objects efficiently without impacting foreground operations.
High level execution flow:
scan bucket periodically
   |
   v
identify eligible objects
   |
   v
apply lifecycle actions (hide and/or delete)
   |
   v
record progress and continue
Error handling and validation
Lifecycle XML is validated using S3 compatible rules:
Invalid combinations of actions are rejected
Missing required fields return errors
Unsupported actions return descriptive failures
While error messages may differ slightly from AWS, the validation logic follows the same constraints.
Compatibility considerations
While the goal is strong S3 compatibility, there are still some things to keep in mind:
Not all S3 lifecycle actions are supported yet
XML validation follows S3 rules, but error messages may differ slightly
The underlying storage model of B2 can affect timing and visibility
We recommend testing lifecycle rules in a non production bucket before rolling them out broadly.
Final thoughts
Adding S3 compatible support for lifecycle rules on Backblaze B2 was all about making migrations simpler and letting customers reuse existing automation with confidence. It behaves the way you expect while benefiting from B2’s internal scalability.
If you already manage lifecycle rules using S3 APIs, those same configurations can now run on Backblaze B2 with minimal or no changes.
To provide the best experiences, we use technologies like cookies to store and/or access device information. Consenting to these technologies will allow us to process data such as browsing behavior or unique IDs on this site. Not consenting or withdrawing consent, may adversely affect certain features and functions.
Functional
Always active
The technical storage or access is strictly necessary for the legitimate purpose of enabling the use of a specific service explicitly requested by the subscriber or user, or for the sole purpose of carrying out the transmission of a communication over an electronic communications network.
Preferences
The technical storage or access is necessary for the legitimate purpose of storing preferences that are not requested by the subscriber or user.
Statistics
The technical storage or access that is used exclusively for statistical purposes.The technical storage or access that is used exclusively for anonymous statistical purposes. Without a subpoena, voluntary compliance on the part of your Internet Service Provider, or additional records from a third party, information stored or retrieved for this purpose alone cannot usually be used to identify you.
Marketing
The technical storage or access is required to create user profiles to send advertising, or to track the user on a website or across several websites for similar marketing purposes.