Какво става в Сърбия? Непредвидимото бъдеще

Post Syndicated from Джорджа Спадони original https://www.toest.bg/kakvo-stava-v-surbiya-nepredvidimoto-budeshte/

Какво става в Сърбия? Непредвидимото бъдеще

Белградското утринно небе виси над нас сиво, облачно, тежко. Подухва лек вятър, неочаквано студен за началото на октомври. Но за нашата група италианци това не е проблем, любопитството ги води. Искат да разберат повече за сегашното положение в Сърбия, както и за миналото. Тече третият им ден в столицата и с всяко наше обяснение нещата се преплитат и стават все по-сложни, но те не се предават.

Вървим по скрита уличка в централен квартал на града – от едната ни страна се извисяват величествените правителствени сгради от миналия век, от другата са се наредили по-скромни кооперации. Спираме близо до едно триетажно жълтеникаво здание. Гледаме го отзад. Насочваме вниманието на нашите гости към един от прозорците на последния етаж. Получаваме въпросителни погледи – цялата постройка всъщност изглежда доста незначителна.

„От този прозорец в късната сутрин на 12 март 2003 г. снайперист стреля и убива Зоран Джинджич, докато той влиза през служебния вход на сградата отсреща.“

Групата се заковава на място, внезапно замлъква. Погледите блуждаят между двете сгради. Макар вече да сме им разказали историята за убийството на Джинджич, когато бяхме на гробището, друго е да видиш точното място със собствените си очи. Някой пита колегата ми дали още помни този ден.

„Всеки сърбин, който е бил достатъчно възрастен тогава, си спомня точно къде се е намирал и какво е правил в онази мартенска сутрин, когато е получил новината. Това е нашият 11 септември. Денят, в който всеки от нас разбра, че вратите на света около нас, едва открехнати, отново се затварят. И че пак пропускаме възможността за нормално развитие на тази държава.“

Имало е охрана, да. Имало е и вариант да се влиза с кола в специален тунел за повече безопасност. Но Джинджич не е искал, макар че е бил с патерици, защото се е контузил, докато е играл футбол. И не е първият опит за покушение срещу него, не – отговаряме на гостите. Три седмици преди онзи 12 март камион се опитва безуспешно да се вреже в автоконвоя му.

Случаят „Джинджич“

Още като студент в Белград Зоран Джинджич показва прагматично мислене, политическа интуиция, нюх за духа на времето и ораторски талант. През 70-те години е изхвърлен от университета и по-късно арестуван и осъден за организирането на независимо студентско движение. Емигрира във Федерална република Германия, където през 1979 г. защитава докторат по философия.

Когато се връща в Югославия през 1989 г., с други интелектуалци и активисти основава Демократическата партия (Demokratska stranka). Една година по-късно става неин ръководител и депутат от опозицията, макар мнението му по вечните въпроси на сръбския национализъм да е понякога неясно (през 1994 г. например посещава в Пале президента на Република Сръбска Радован Караджич, за да „изрази своята солидарност със сърбите от Босна“).

През 90-те Джинджич се отличава като ключова фигура в протестите срещу режима на Слободан Милошевич. През 1997 г. опозиционната коалиция Zajedno, в която е и Демократическата партия, се разпада след бойкот на изборите през декември и от други демократични групи. Избухването на войната в Косово през 1998 г. и бомбардировките на НАТО над Сърбия през 1999 г. бележат началото на края за Милошевич. В същото време обаче започва серия убийства, над които пада сянката на президента – от журналиста Славко Чурувия до министъра на отбраната Павле Булатович, от паравоенния командир Желко Ражнатович – Аркан до бившия президент Иван Стамболич.

През септември 2000 г. улиците на страната отново са изпълнени с протестиращи, след като не е призната победата на президентските избори на кандидата на демократичната опозиционна коалиция (Demokratska Opozicija Srbije) Воислав Кощуница. След седмица масови протести на 5 октомври 2000 г. Милошевич подава оставка. Парламентарните избори през декември са спечелени от Демократическата партия с 64,7%. На 25 януари 2001 г. Джинджич става министър-председател – надеждата за промяна се разпростира из страната, окрилена от очакванията от чужбина.

Какво става в Сърбия? Непредвидимото бъдеще
Агитационни материали на различни сръбски партии и политически фигури, явявали се на избори между 1990 и 2000 г © Джорджа Спадони

Правителството на Джинджич започва с амбициозна програма, в която са планирани серия дълбоки и смели икономически и съдебни реформи, както и наказателно преследване за политическите убийства и военните престъпления, специална комисия за разследване на дейността на полицията и тайните служби, сътрудничество с международната общност, решаване на Косовския въпрос. По време на неговия мандат се ратифицира Европейската конвенция за правата на човека и се въвеждат препоръките на Съвета на Европа, което води и до присъединяването на Сърбия и Черна гора към организацията през 2003 г.

Но докато на международно ниво Зоран Джинджич създава положителен имидж, в Сърбия е все по-противоречиво приеман от определени слоеве на обществото и от институциите. Първоначално той е против екстрадицията на Слободан Милошевич в Хага, но през април 2001 г. изиграва ключова роля в ареста му от югославските власти. На 28 юни обаче, въпреки възраженията на Конституционния съд, Джинджич разпорежда екстрадицията на бившия президент в Нидерландия под натиска на САЩ, които заплашват да не отпуснат планираната икономическа помощ от Световната банка и Международния валутен фонд.

Въпреки това Зоран Джинджич не е убит заради неприязънта на националистите. Онзи единствен куршум, пронизал го право в сърцето, е изстрелян от Звездан Йованович, член на „Червените барети“, водещи началото си от Сръбската доброволческа гвардия и по-късно влели се в специалните сили на Службата за държавна сигурност на Сърбия.

Джинджич е убит заради твърдото си намерение да се бори срещу Земунския клан – една от най-мощните престъпни организации в държавата. Същата, която още от 90-те е в тесни връзки със сръбската власт и с чиито представители самият Джинджич се вижда дни преди оставката на Милошевич, получавайки гаранции, че техните формирования няма да пречат на прехода. А мафията, както знаем, е държава в държавата. Това е напълно съзнателна сделка с наследството на Милошевич, пуснало пипалата си навсякъде.

Убийството на Зоран Джинджич е планирано в заговор между тайните служби, организираната престъпност и част от политическите фигури, останали след Милошевич.

Месец преди смъртта му тогавашната главна прокурорка на Хагския трибунал Карла дел Понте се среща с него: 

Разказа ми [Зоран Джинджич – бел. ред.] в подробности за реформаторската си програма. И тогава изведнъж ми каза: „Ще ме убият.“ 

На въпроса ѝ кой по-точно ще го убие, Джинджич отговорил с опасението, че планираните реформи в армията и полицията ще го изложат на опасност.

Джинджич ми обясни как възнамерява да се намеси в армията и полицията, след като е променил икономическата система. Реформата изискваше да се пипа изключително внимателно и беше доста опасна. И министър-председателят беше напълно наясно с това.

Ето как историчката Дубравка Стоянович анализира случилото се в своя статия, публикувана 10 години след убийството на Зоран Джинджич:

Налице бяха и заговорниците във висшите ешелони на тайните служби, които участваха и в предишния преврат – от 2000 г., и благодарение на това имаха особено положение. Налице беше и държавата, подчинена на партийни интереси. И политическата култура, която вижда в опонента враг. И ценностната система, която в компромиса вижда слабост, а в силата – юначество. И интересите на могъщи кръгове, които възприемат изграждането на правова система и институции като пречка за своя монопол.

Може би налице беше и намесата на Великите сили. И преди всичко – същото онова разделение на модернисти и антимодернисти, про- и анти-Запад, което е основната причина за повечето атентати в сръбската история. Ето защо убийството от 2003 г. доказва, че има приемственост, произтичаща от дълбоките проблеми в новата история на Сърбия: слабостта на институциите, мощта на „неконтролираните фактори“, олигархично-партийната държава и нерешения ключов въпрос „А сега накъде?“. 

И като се взираме в днешното положение в страната след още десет години (а и повече), не само че хич не изглежда по-светло, но и не е толкова различно.

Какво става в Сърбия? Езикът на протестите – музика и архитектура
Джорджа Спадони е на обиколка из Белград с нова група туристи, на които разказва за музиката и архитектурата на града, а през този разказ – и на нас за случващото се в Сърбия. Това е втора част от поредицата, посветена на годишнината от трагедията в Нови Сад и на протестите за промяна.
Какво става в Сърбия? Непредвидимото бъдеще

Демокрация или стабилокрация

9 август 2024 г. Чакаме на границата между Босна и Сърбия. Обиколката ни е към края си, прибираме се в Белград, или поне се опитваме. Опашката е безкрайна, безмилостното лятно слънце превръща микробуса в печка, климатикът е почти безпомощен. Групата шумно решава кръстословици, а с колегата ми и шофьора говорим за масовите протести, предвидени в столицата за следващия ден – 10 август.

Бетонната козирка на гарата в Нови Сад, официално открита преди месец, ще издържи още малко. Причината за протеста е друга – проектът за най-голямата литиева мина в Европа, която англо-австралийската компания „Рио Тинто“ възнамерява да разработва в Лозница, до река Ядар, в западната част на страната. Спрян благодарение на огромните протести през 2022 г., планът отново е върнат на дневен ред от сръбското правителство през юли 2024 г. С подкрепата на ЕС.

Най-накрая излизаме от Босна, но не и преди да сме подарили шоколадово блокче на полицая, който, след като ни провери документите, изрично ни поиска такъв странен и сладък подкуп. Влизаме в Сърбия и минаваме точно през местността, застрашена от минните амбиции. Няколко метра след границата ни приветства огромен плакат на управляващата Сръбска прогресивна партия (СПП, Srpska napredna stranka), от който ни гледа мъж с очила и дебели устни. Шофьорът и колегата ми не се въздържат и отправят немалко псувни към този лик, който всъщност принадлежи на Александър Вучич – главния герой в сръбската политика от повече от десетилетие.

Роден е през 1970 г. в Белград и на 23 години се присъединява към Сръбската радикална партия (СРП, Srpska radikalna stranka) – ултранационалистическа формация, която иска да създаде „Велика Сърбия“ от руините на Югославия. Той става протеже на партийния лидер Воислав Шешел, осъден за военни престъпления в Хага. През 1998 г. Вучич е назначен от самия Слободан Милошевич за министър на информацията, като само за две години успява да приложи едно от най-репресивните законодателства в Европа срещу медиите и свободата на словото.

След 5 октомври 2000 г., когато Милошевич подава оставка, СРП е в опозиция, докато се редуват белязани от скандали демократични правителства, които включват присъединяването към ЕС в своите програми. Точно покрай въпроса за ЕС СРП се разделя и част от членовете ѝ начело с Томислав Николич и Александър Вучич я напускат, за да създадат Сръбската прогресивна партия (СПП) през 2008 г. Въпреки името и декларираните проевропейски настроения формацията е силно консервативна и популистка и бързо се превръща в основната опозиционна сила. На парламентарните избори през 2012 г. СПП печели 25% от гласовете и се класира на първо място. Вучич е първо министър на отбраната, а после – вицепремиер. На предсрочните парламентарни избори през 2014 г. СПП удвоява подкрепата си до почти 50% и печели мнозинство в парламента. Тогава Вучич става министър-председател.

Междувременно той признава в интервю „грешките от младостта“ и се отдалечава от националистическите уклони отпреди години, когато публично защитава Ратко Младич и Радован Караджич. Сред амбициите му за Сърбия е присъединяването към ЕС. Всъщност, въпреки че либералните партии, предшестващи СПП, полагат основите на европейските стремежи на Сърбия, именно Вучич дава официален старт на процеса през 2014 г. Следващите предсрочни избори през 2016 г. са предизвикани от СПП точно с цел подкрепа за продължаване и успешно приключване на процеса по кандидатстване за членство в ЕС. Този път СПП събира над 50%, но опозицията заявява, че гласовете са били купени.

В чужбина обаче се повишава задоволството от стабилността, която Сърбия най-накрая демонстрира. Особено в Германия. В интервю от 2016 г. Вучич казва, че смята Ангела Меркел „за истинския лидер на Европа“ и че германската канцлерка „се грижи за Балканите“. Критиците на управлението обаче посочват, че привидната стабилност в страната е постигната за сметка на демократичните ценности, особено на медийната свобода.

Какво става в Сърбия? Непредвидимото бъдеще
Александър Вучич по време на посещение в Москва през 2017 г. Източник: Wikimedia

Изборите през 2017 г., с които Вучич започва своята кариера като президент на Република Сърбия, също са белязани с все по-строг контрол върху медиите и постепенно разрушаване на върховенството на закона. Междувременно, за да продължи да гради „прогресивен“ имидж за пред международната общност, президентът назначава за министър-председател Ана Бърнабич – първата жена на този пост в Сърбия, и то открита лесбийка. Без това да означава, че в програмата на правителството има място за правата на ЛГБТ, напротив – ролята на Бърнабич ѝ осигурява редица привилегии, от които останалата част от ЛГБТ хората в страната е лишена. 

Какво става в Сърбия? Непредвидимото бъдеще
Ана Бърнабич. Източник: Wikimedia

През 2020 г. неправителствената организация „Фрийдъм Хаус“ потвърждава влошаването на положението в балканската страна, която вече не е демокрация, а хибриден режим, особено след резултатите от новите президентски избори през юли, които СПП печели с над 60%. Тази авторитарна тенденция, започнала през 2012 г., превръща държавата в стабилокрация, която въпреки реториката на правителството не е гарант за стабилността в Балканския регион, както вече стана ясно от нестихващите протести, започнали през 2024 г.

Сърбия вън от ЕС, ЕС вън от Сърбия

10 август 2024 г. Обиколката приключва, изпращаме гостите преди началото на протестите, предвидено за 19:00. Тръгваме около час по-рано и улиците вече се пълнят с хора, които се изливат от всички страни. В рамките на половин час центърът на Белград е изцяло блокиран – граждани от всички възрасти, с кучета и детски колички, с плакати и свирки са се събрали с мирни намерения и лошо настроение. Сред слоганите се чете „Рио Тинто марш от Сърбия“, „Няма да копаете“, „ЕС диктува, Вучич изпълнява, Рио Тинто печели“. Колегата ми казва: 

„Виждаш ли колко много хора, всички сме против Вучич от години, излизаме по улиците непрекъснато, но той не мръдва. Защото има подкрепа от ЕС.“


Всъщност тактиката на президента на международно ниво е да поддържа добри отношения с конкурентни геополитически сили. Твърди, че иска Сърбия да продължи своя европейски път, но в същото време поддържа приятелски отношения с Русия и привлича в страната най-големия брой китайски проекти в Европа в рамките на глобалната китайска стратегия за сътрудничество „Един пояс – един път“. В резултат на това, от една страна, отказва да подкрепи санкциите срещу Москва след избухването на войната в Украйна, въпреки че Сърбия има статус на кандидат-членка на ЕС; от друга, възлага все повече поръчки без конкурс на спорни китайски компании.

Една година след трагедията в Нови Сад. Какво става в Сърбия?
На 1 ноември се навършва една година от трагедията в Нови Сад, която провокира някои от най-големите протести в Сърбия, а и в региона ни. Италианката Джорджа Спадони, която обича и познава Балканите, ни разказва в няколко поредни материала как изглеждат Белград и цялата страна година по-късно.
Какво става в Сърбия? Непредвидимото бъдеще

Вярно е, че точно както Бойко Борисов в България, и Александър Вучич има подкрепа от ЕС, с който освен това се осъществява над половината от търговията на Сърбия. Но за разлика от България, присъединителният процес в Сърбия отдавна е в бюрократична парализа, от която се възползва правителството на Вучич. А междувременно Европейският съюз вече не е синоним на прогрес и гаранции, а по-скоро представлява някакво далечно и абстрактно образувание, което постоянно се доказва като все по-лицемерно и индиферентно спрямо непрекъснатото западане на демокрацията и принципите на правовата държава в Сърбия.

Сред последните удари по доверието към Съюза е откровеното насърчаване на проекта на „Рио Тинто“ в Лозница, който даже е представен като стратегически проект на ЕС през 2025 г. Освен това слабата реакция от Брюксел спрямо мащабната вълна от антиправителствени протести, провокирана от трагедията в Нови Сад, играе важна роля в спада на доверието на сърбите към ЕС.

През октомври 2025 г. Европейският парламент прие резолюция, призоваваща за правото на мирни протести в Сърбия и изискваща политическа отговорност за засилените репресии. Ефективността на тези призиви обаче е доста ограничена и е застрашена от все по-влиятелната крайна десница, която подкрепя Вучич. Един месец по-късно „Рио Тинто“ обяви, че проектът „Ядар“ ще бъде поставен в режим „грижа и поддръжка“ поради липса на разрешителни и напредък, както и заради силна местна съпротива. Но това вероятно няма да е краят на историята и е все по-трудно да се предвиди какво крие бъдещето за балканската държава.

Какво става в Сърбия? Непредвидимото бъдеще
16 минути мълчание за 16-те жертви от трагедията в Нови Сад година по-късно © Джорджа Спадони

2025 г. Ден преди да покажем на туристическата група мястото, където е убит министър-председателят, се събираме около неговата паметна плоча на гробищата. Над черния мрамор, под надписа „Д-р Зоран Джинджич 1952–2003“, намираме леко повехнал венец от цветя, завързан с лента. Вятърът я е обърнал. Навеждам се и я премествам, за да видя дали пише нещо. Само едно кратко изречение: Hvala za viziju („Благодарим за визията“).

Срещу входа на Философския факултет в Белград – мястото, откъдето всеки път започваме нашите обиколки – погледът на бившия първи министър, напръскан с червена боя, все още се взира в студентите и минувачите. До неговото лице все още може да се разчете излющеното Gledajte u budućnost… („Гледайте в бъдещето…“) – колкото и мътно и страшно да изглежда. Защото друга опция няма.

Т.Е. от Е.Т. – епизод 37

Post Syndicated from Тоест original https://www.toest.bg/t-e-ot-e-t-epizod-37/

Т.Е. от Е.Т. – епизод 37

Навлизаме в новата година плавно и полека с включвания от Доналд Тръмп, Бойко Борисов, Слави Трифонов и други симпатяги.


Следете видеорубриката на Елена Телбис за „Тоест“ и във Facebook, Instagram и TikTok.

From deployment slop to production reality: How BriX bridges the gap with enterprise-grade AI infrastructure

Post Syndicated from Grab Tech original https://engineering.grab.com/brix

Abstract

You’ve vibe-coded an AI assistant that’s a game-changer for your team. It works perfectly on your laptop. But when you try to deploy it company-wide, everything falls apart.

This is what is known as “deployment slop”—the messy reality when quick AI prototypes hit the enterprise world. Your tool suddenly becomes unreliable, insecure, and impossible to maintain. Different teams run different versions. Security flags it. IT won’t touch it. Your innovation dies.

BriX solves this. It’s a platform that takes your working AI prototype and makes it production-ready—without forcing you to become a full-stack developer. BriX handles the hard parts such as security, scaling, and data connections, so you can focus on building great tools. Switch between AI models like Claude or GPT with a click. Connect securely to your company’s data sources. Deploy once, and it just works—for everyone.

This article shows how BriX transforms AI deployment from an engineering bottleneck into a configuration task, enabling domain experts to ship enterprise-grade AI tools in days instead of months.

Introduction

Building AI tools has never been easier. With ChatGPT, Claude, and other Large Language Models (LLMs), anyone can prototype a useful AI assistant in an afternoon. Data analysts build metric query tools; product managers create research assistants. This rapid experimentation—”vibe coding”—has sparked innovation across organizations.

But then comes the hard part: deployment.

That brilliant tool you built on your laptop? It works great for you. But when your boss asks you to “roll it out to the whole company,” you hit a wall. Suddenly you need:

  • Security reviews (Is it leaking sensitive data?)
  • Reliability guarantees (What happens when 500 people use it at once?)
  • Access controls (Who can see what data?)
  • Audit trails (Who asked what, and when?)
  • Consistent behavior (Why does it give different answers to different people?)

Most builders aren’t DevOps engineers. They’re domain experts who had a good idea. So these tools either:

  • Never get deployed (innovation dies in a Jupyter notebook); or
  • Get deployed badly (creating “Deployment Slop”—a mess of insecure, unreliable scripts).

The three failure modes of deployment slop

The chaos problem: Everyone’s running a different version

Marketing copies your script and tweaks the prompts. Finance changed the model from GPT-4 to Claude because it’s cheaper. Sales adds their own data sources. Within weeks, you have:

  • Five different versions of “the same tool”.
  • Wildly different answers to the same question.
  • No one knows which version is “correct”.
  • Teams making decisions based on inconsistent data.

Potential risk: A senior executive receiving conflicting answers from different teams, resulting in a loss of trust.

The reliability problem: It works until it doesn’t

Your laptop script was built for one user (you). Now 50 people are using it simultaneously. The result:

  • Timeouts and crashes during peak hours.
  • No error handling (users see cryptic Python stack traces).
  • Rate limits hit on API calls.
  • No monitoring or alerts when things break.
  • You become the “on-call” support person for a side project.

Potential risk: The tool fails during a critical metric review leaving folks to find the solution manually.

The security problem: Accidental data leaks

Your prototype connects directly to production databases. It has your personal credentials hardcoded. There’s no:

  • Access control (everyone sees all data, including sensitive info).
  • Audit trail (no record of who queried what).
  • Data governance (PII might be exposed).
  • Compliance review (legal and security teams don’t even know it exists).

Potential risk: An employee inadvertently querying PII, resulting in a potential breach.

Who gets hit hardest?

This problem is especially painful for semi-technical builders—the domain experts who understand the business problem but aren’t DevOps engineers:

  • Product Managers who write SQL but not Kubernetes configs.
  • Data Analysts who know Python but not cloud security.
  • Marketing Ops who build dashboards but not CI/CD pipelines.
  • HR Analytics who understand people data but not infrastructure scaling.

The traditional solution is to “hand it to Engineering,” but they are backlogged for months. By the time they rebuild your tool “properly,” the business need has changed.

Solution: Enter BriX: From prototype to production in days, not months

BriX is a platform that solves the deployment problem by centralizing all the hard infrastructure work. Instead of forcing every builder to become a DevOps expert, BriX provides the production-ready foundation so you can focus on building great AI tools.

The core insight: Deployment doesn’t have to be an engineering problem. It can be a configuration problem.

What BriX does

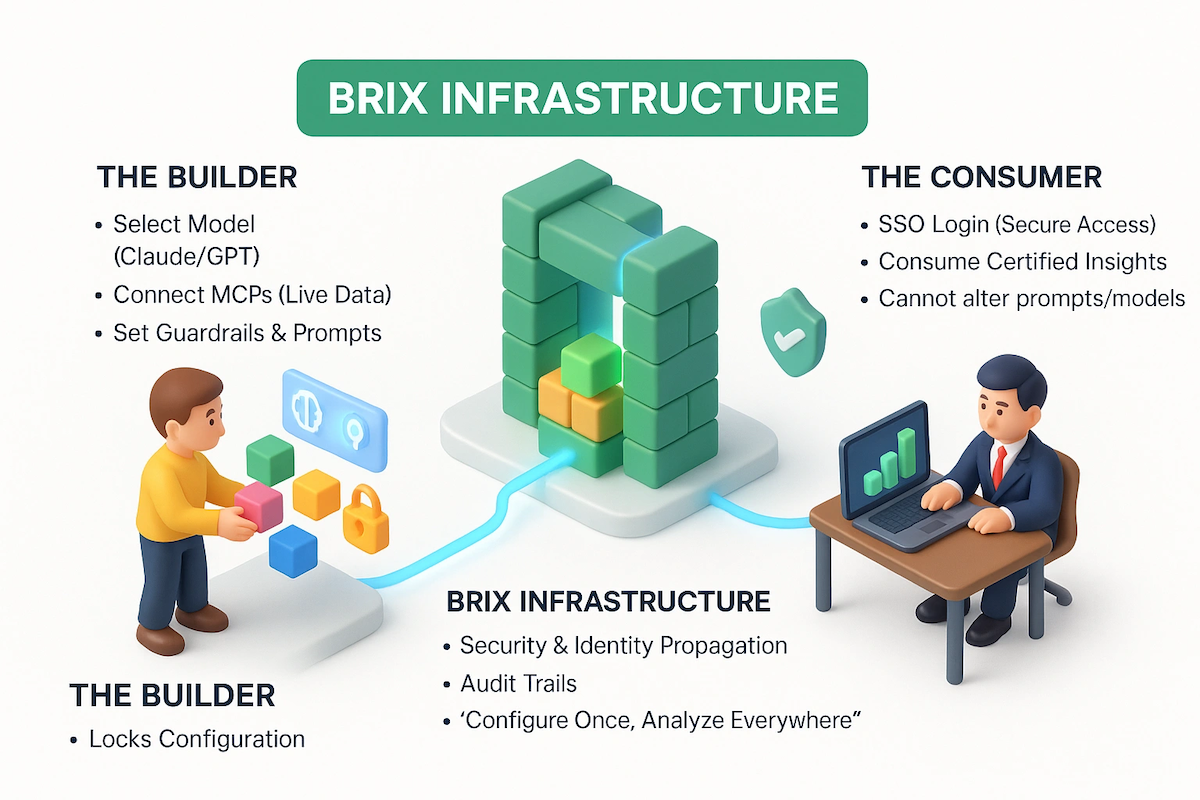
Think of BriX as the “production layer” for AI tools. You bring your working prototype. BriX handles security, scaling, data connections, monitoring, audit trails, and consistent behavior across teams.

You configure. BriX deploys.

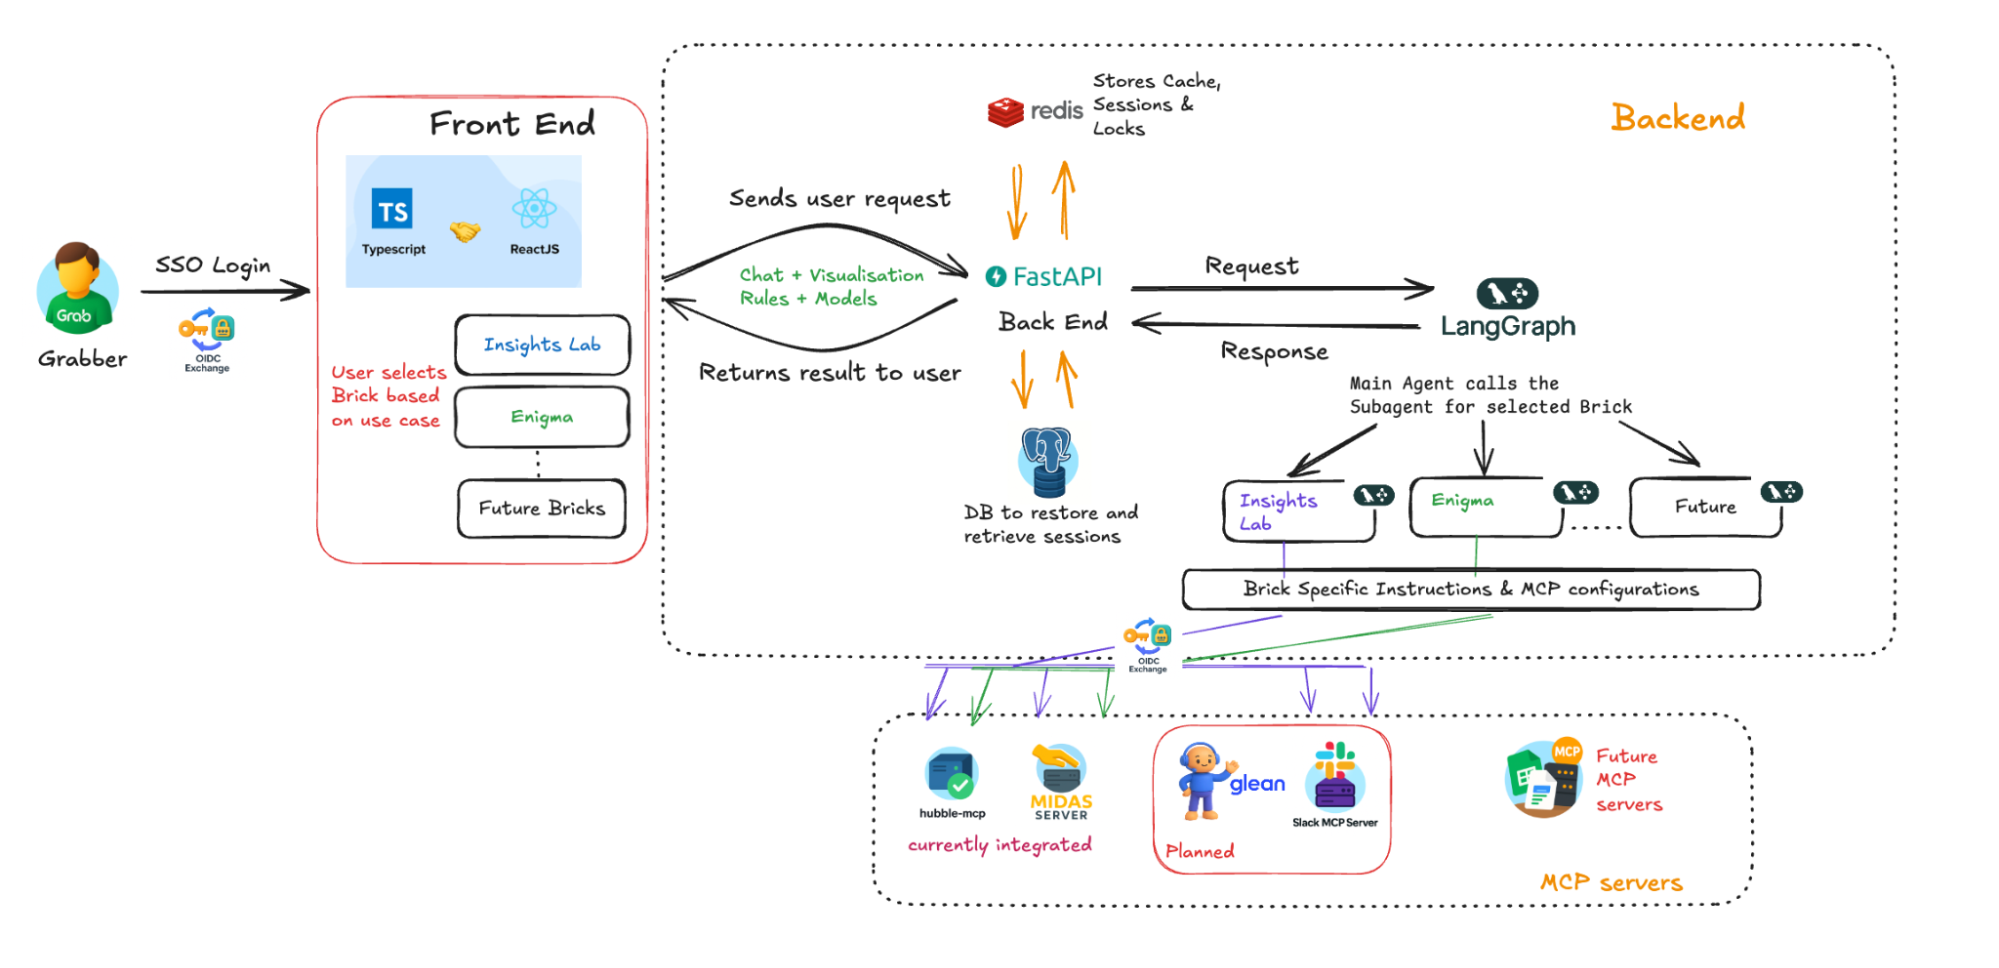
Figure 1. BriX infrastructure

The three core capabilities

Choose your AI model (Model agnosticism)

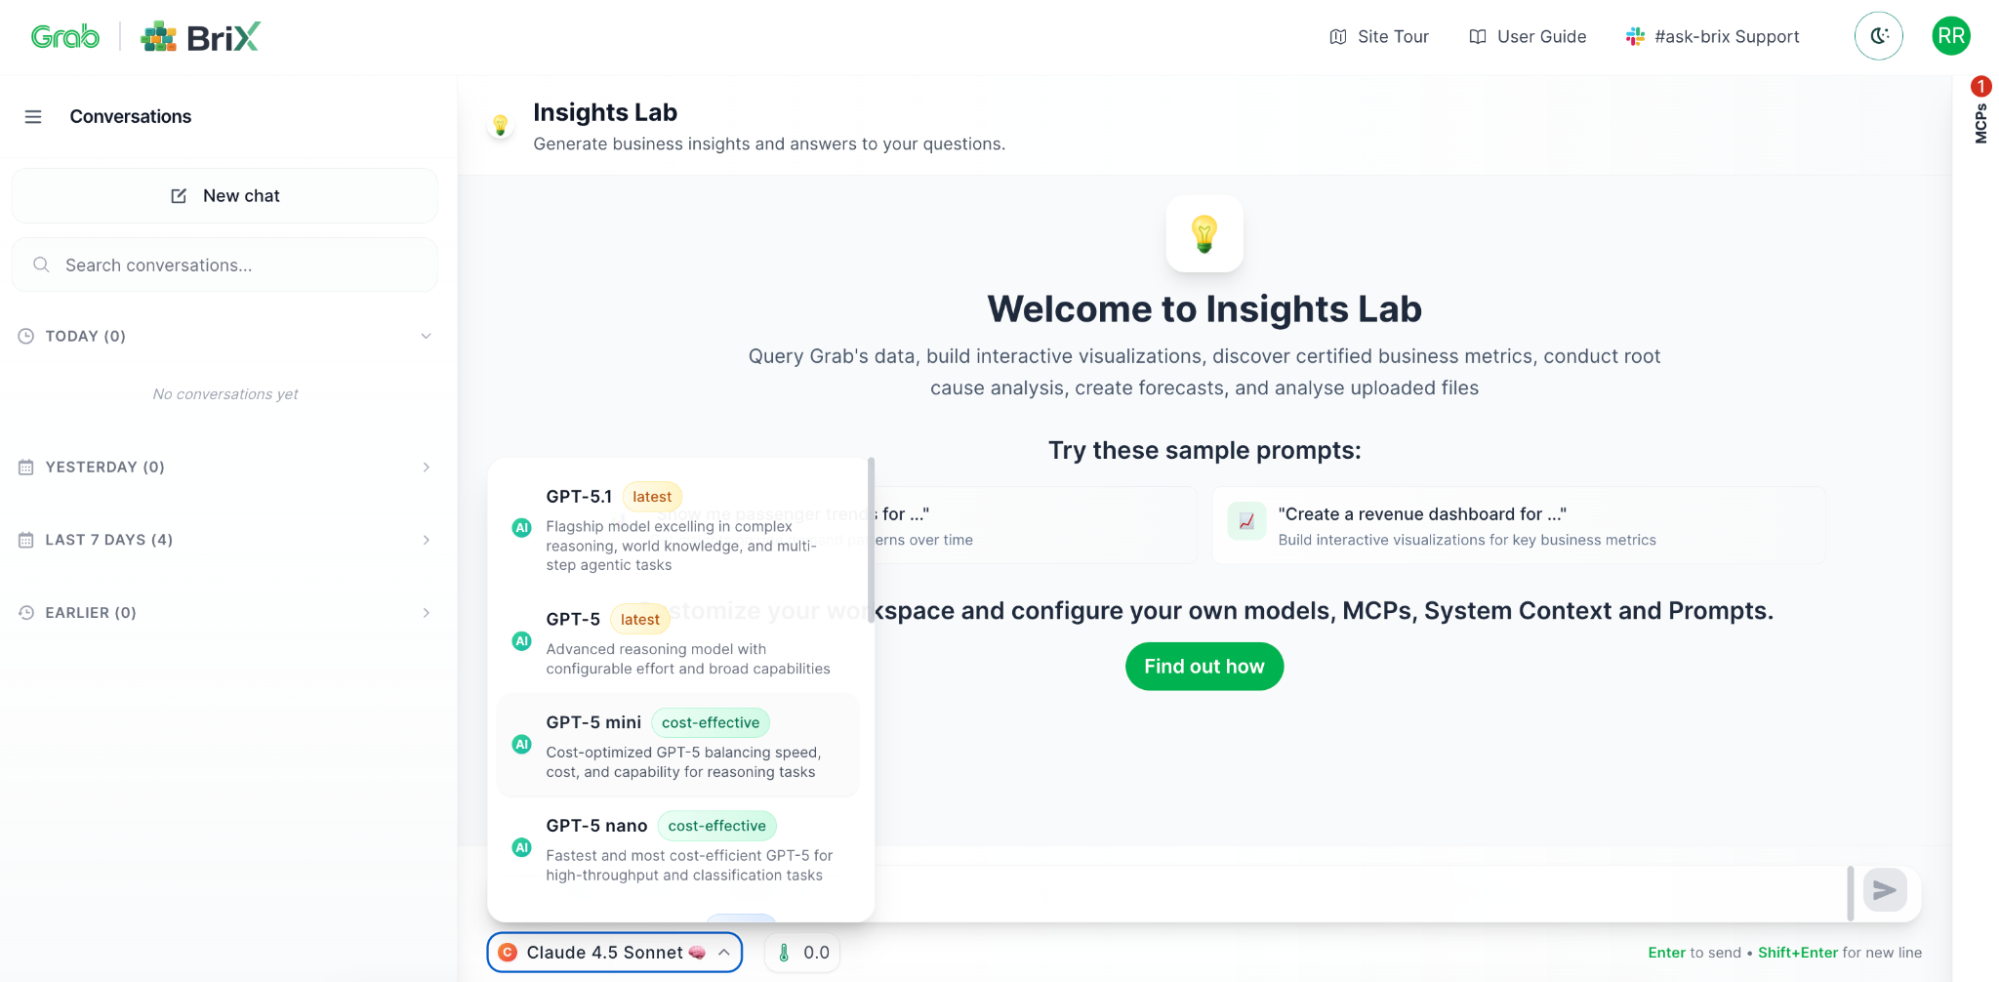
Different tasks need different models. BriX lets you switch between models with a dropdown—Claude, GPT, Gemini, or others. Test which works best. Change models without rewriting code. Optimize for cost vs. performance.

Example: Your finance tool uses GPT-4 for complex analysis, but a new better model is available. Change it in BriX with one click—no code changes needed.

Figure 2. Model selection interface

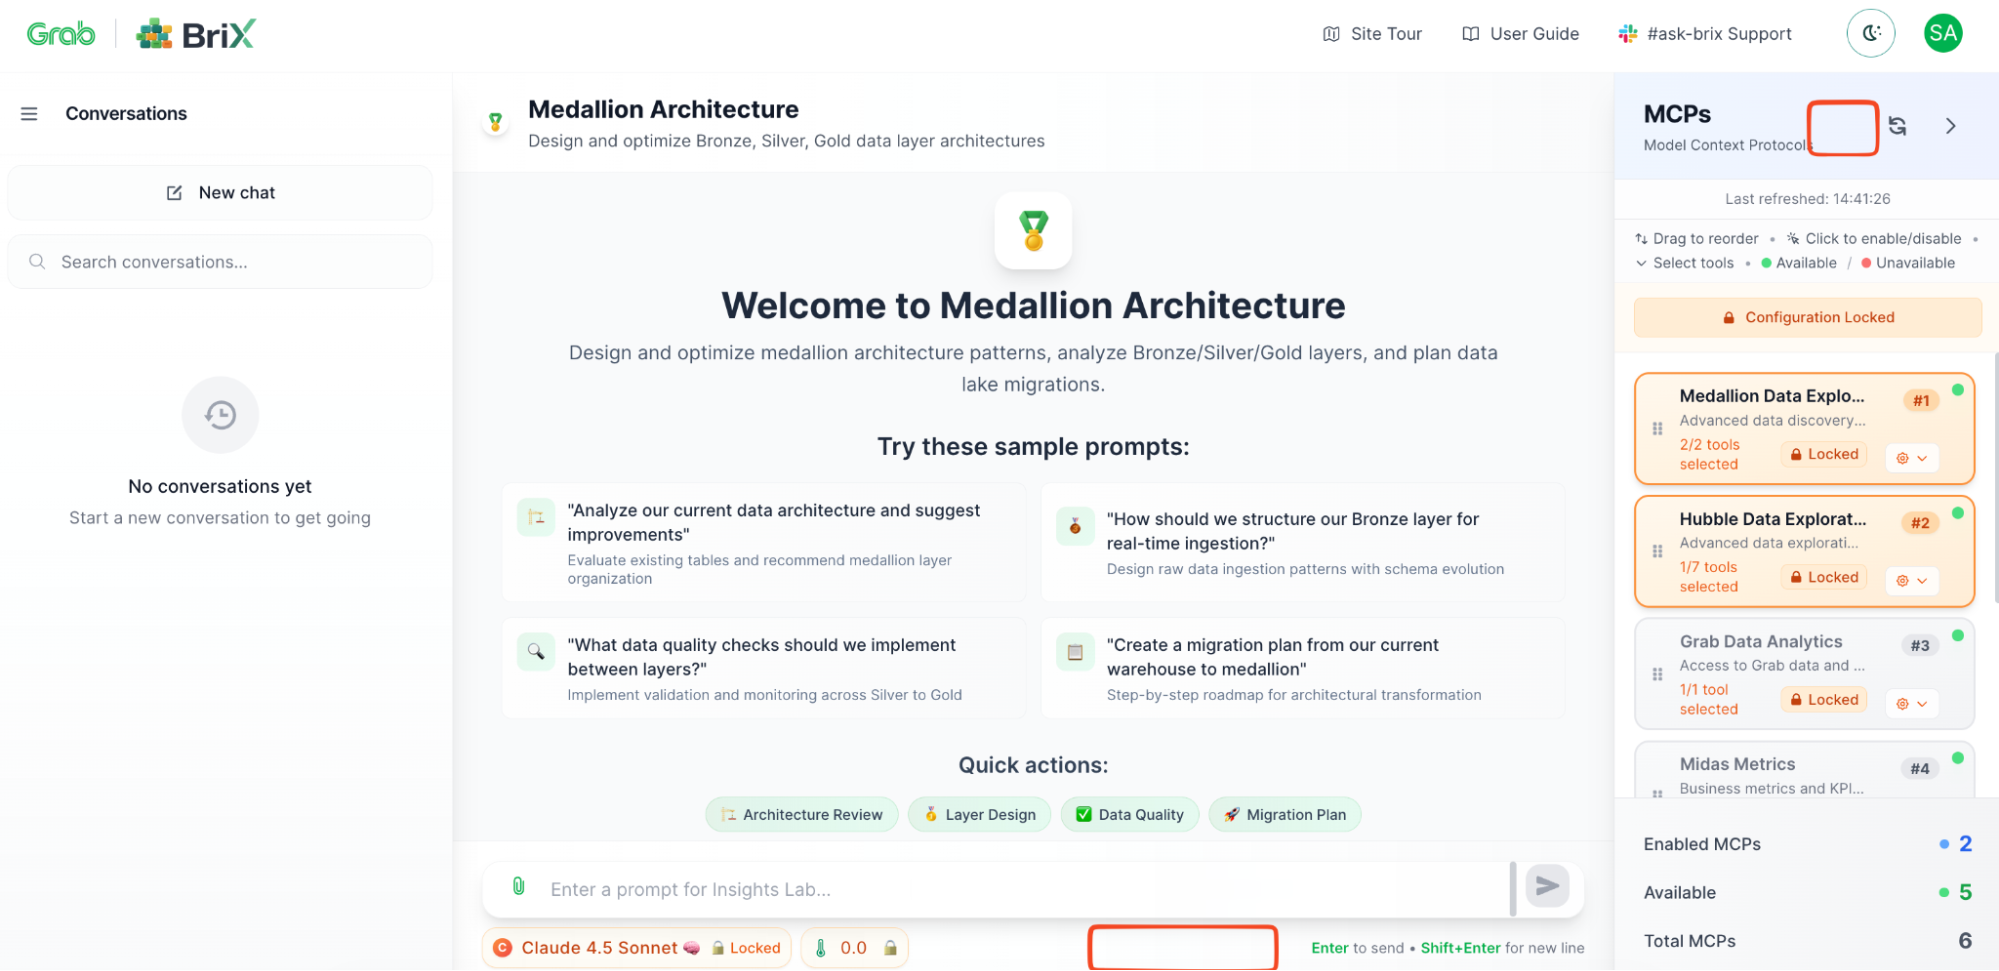
Connect to enterprise data securely (Model Context Protocols)

This is where BriX really shines. Your AI tool needs data—metrics, customer info, documentation. But connecting to enterprise systems securely is hard.

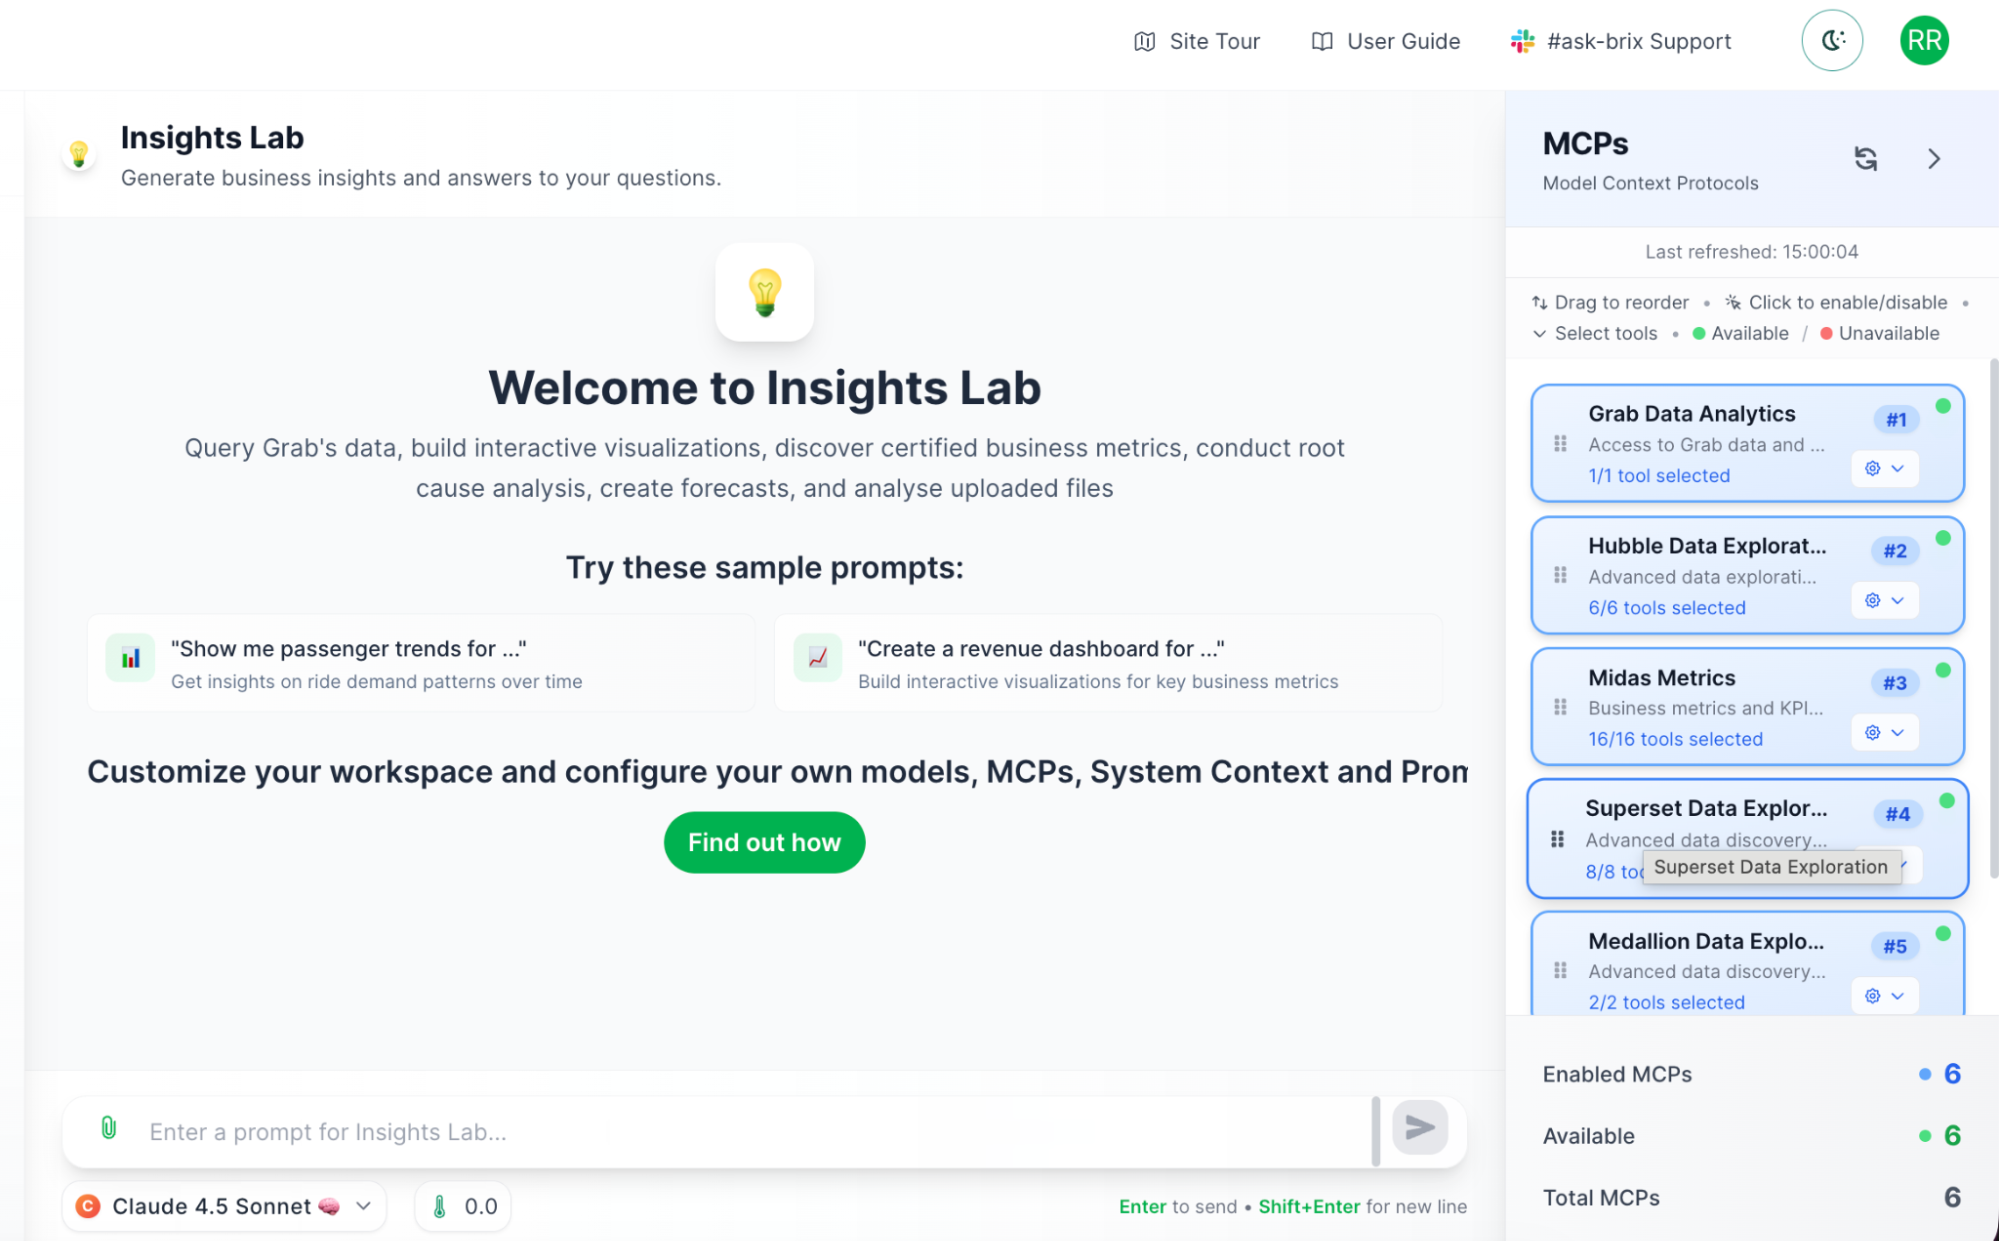
Model Context Protocols (MCPs) are BriX’s solution. Think of them as secure, pre-built connectors to your company’s data sources.

Why MCPs matter:

  • Security built-in: No hardcoded credentials, proper access controls.
  • Certified data: Connect only to approved, governed data sources.
  • No custom integration: Pre-built connectors, not custom API code.
  • Audit trails: Every query is logged automatically.

Example: Your marketing tool can query the metrics system to get conversion rates, search the knowledge base for campaign guidelines, and pull customer data from the data lake —all through secure, governed connections.

Technical note: MCPs use a standardized protocol, so adding new data sources doesn’t require rebuilding your tool. BriX handles the complexity.

Figure 3. BriX chat user interface

Ensure consistent behavior (System prompts and context)

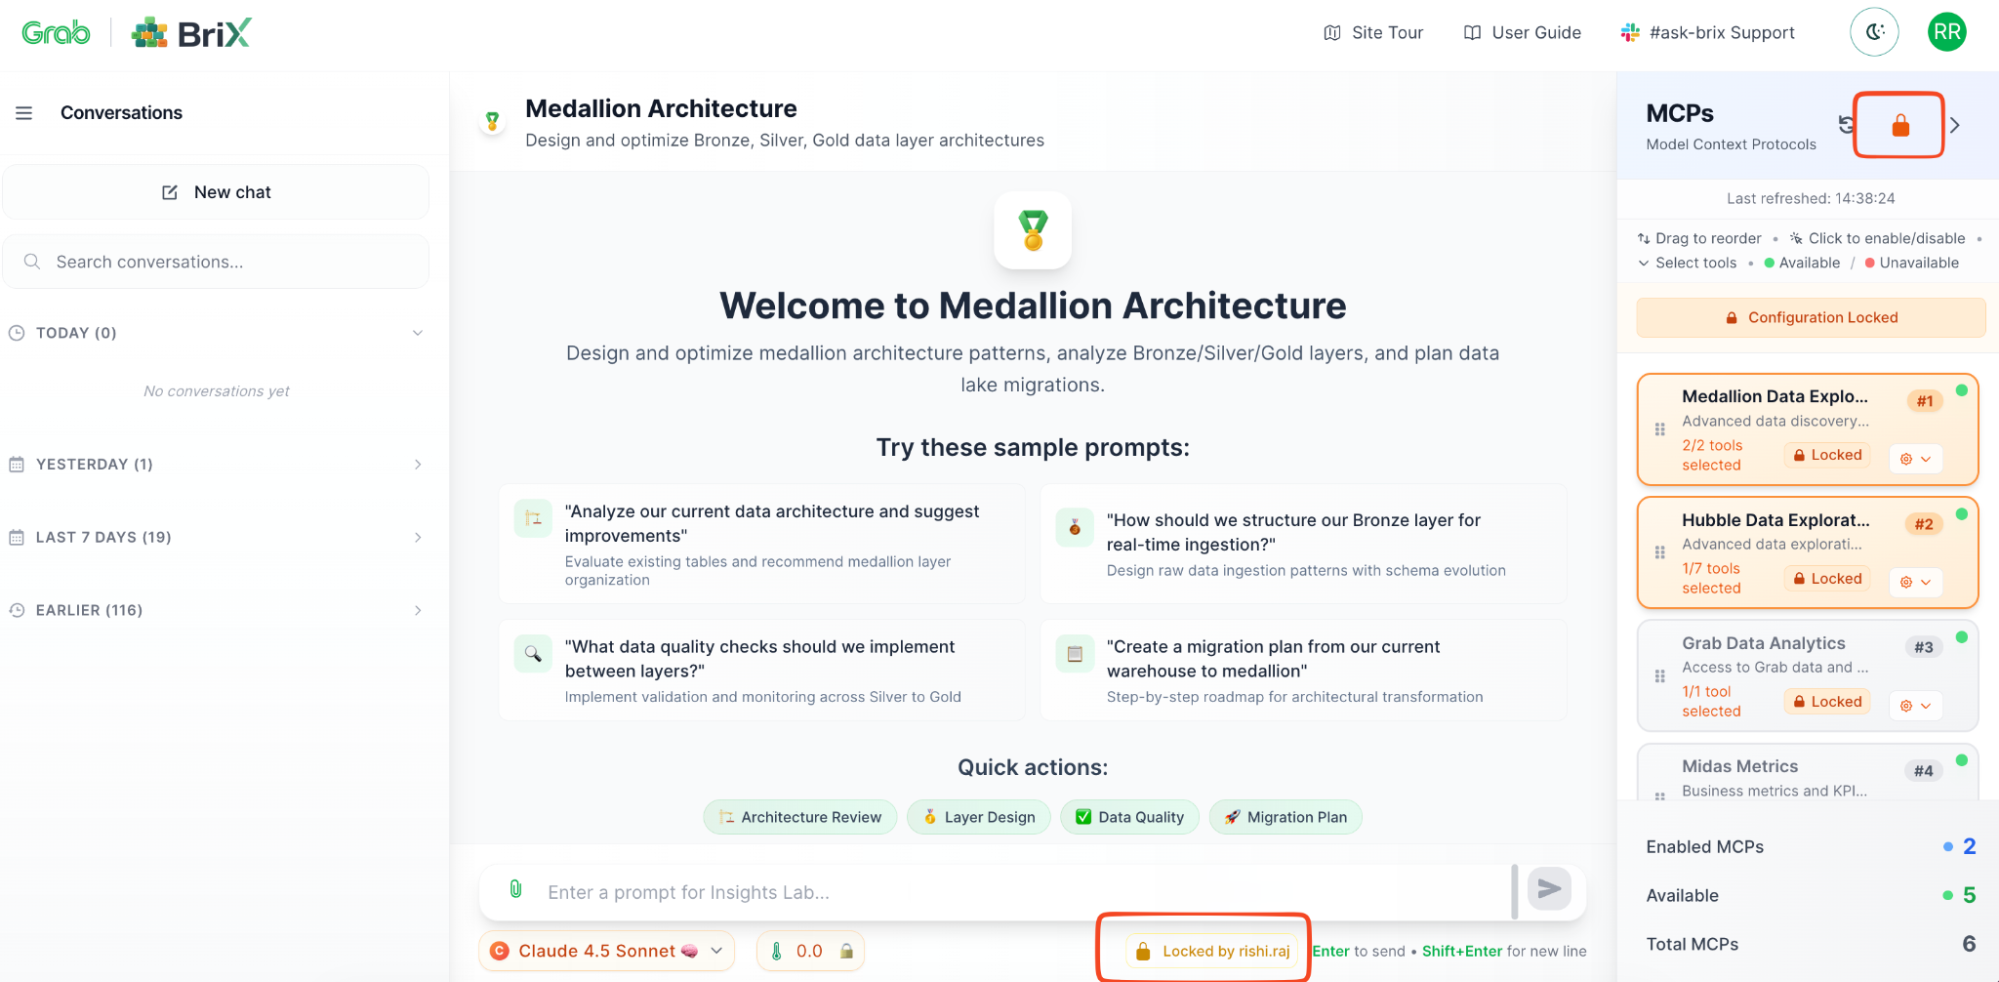
Remember the “chaos problem” where everyone runs different versions? BriX solves this with centralized configurations by allowing you to lock it down for the users:

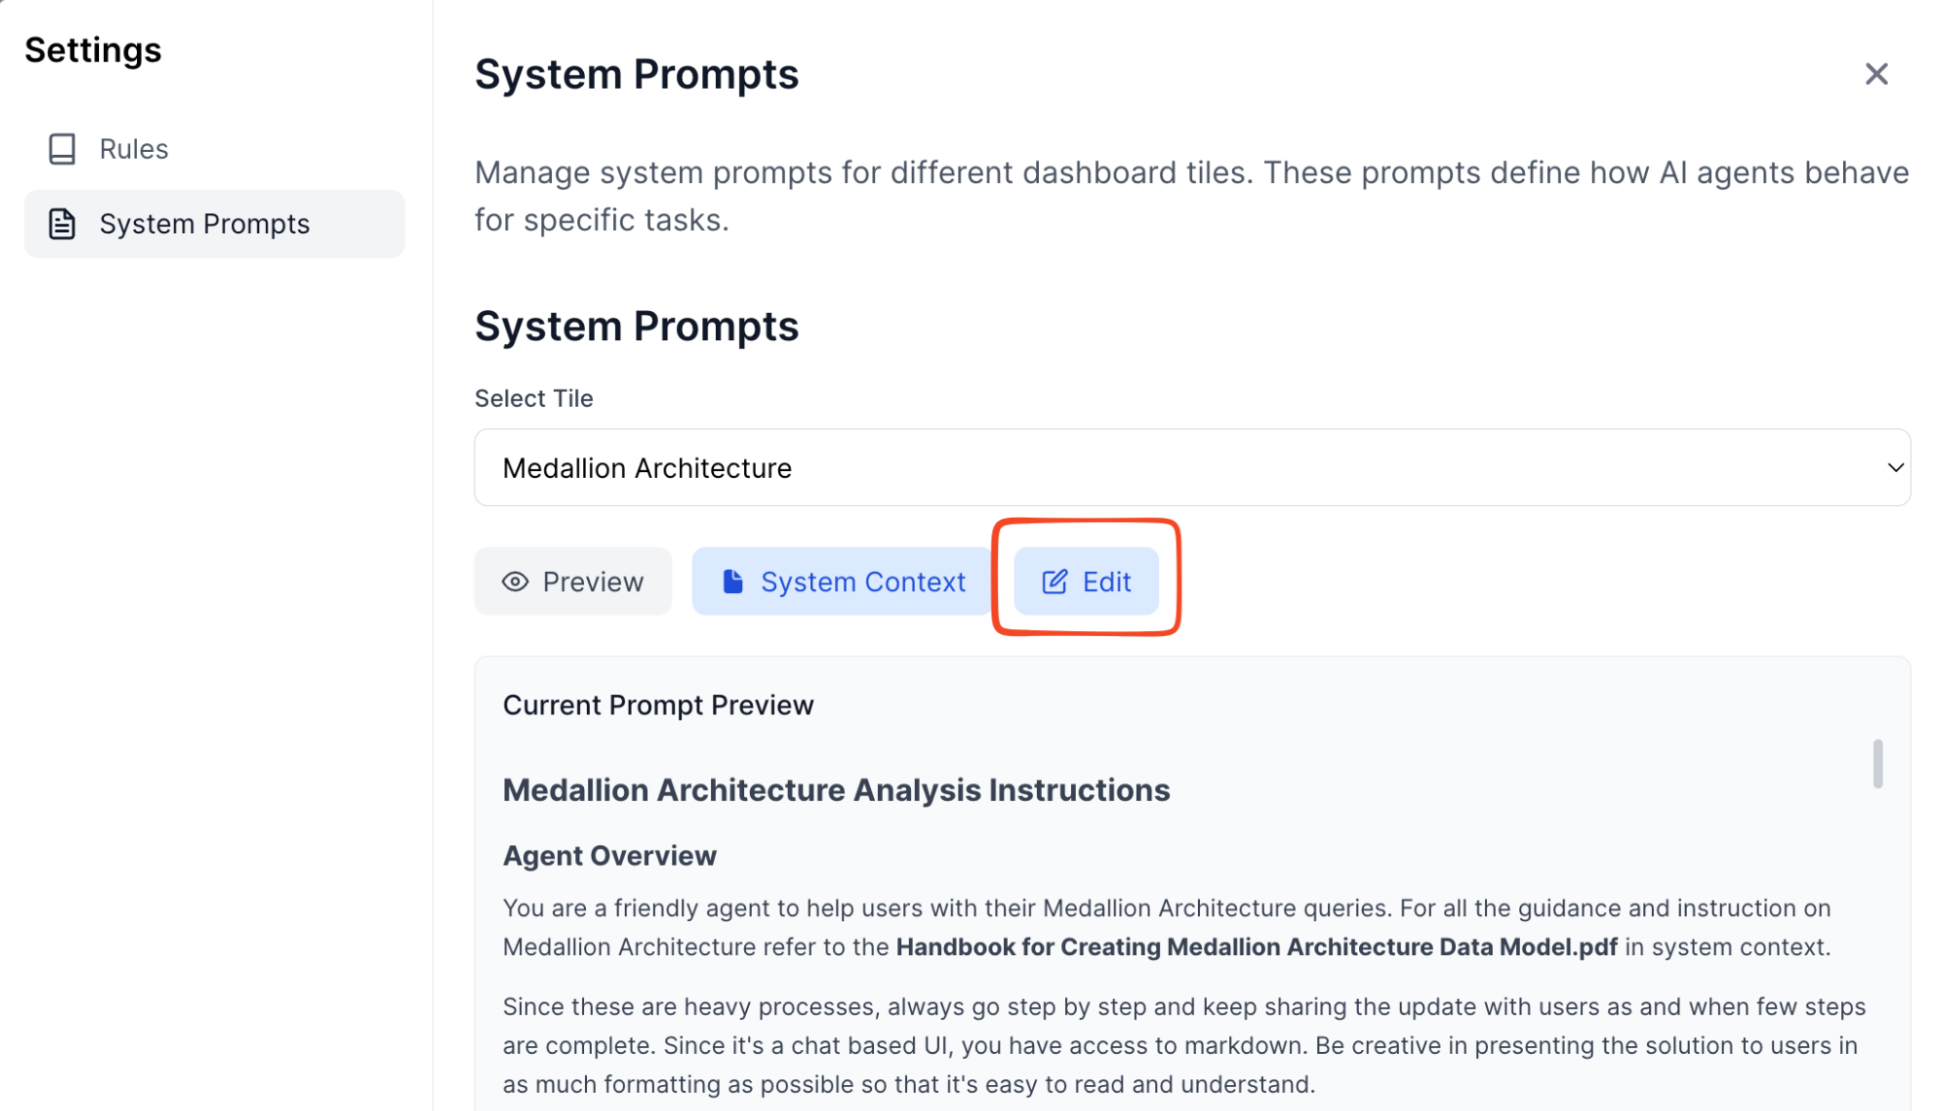
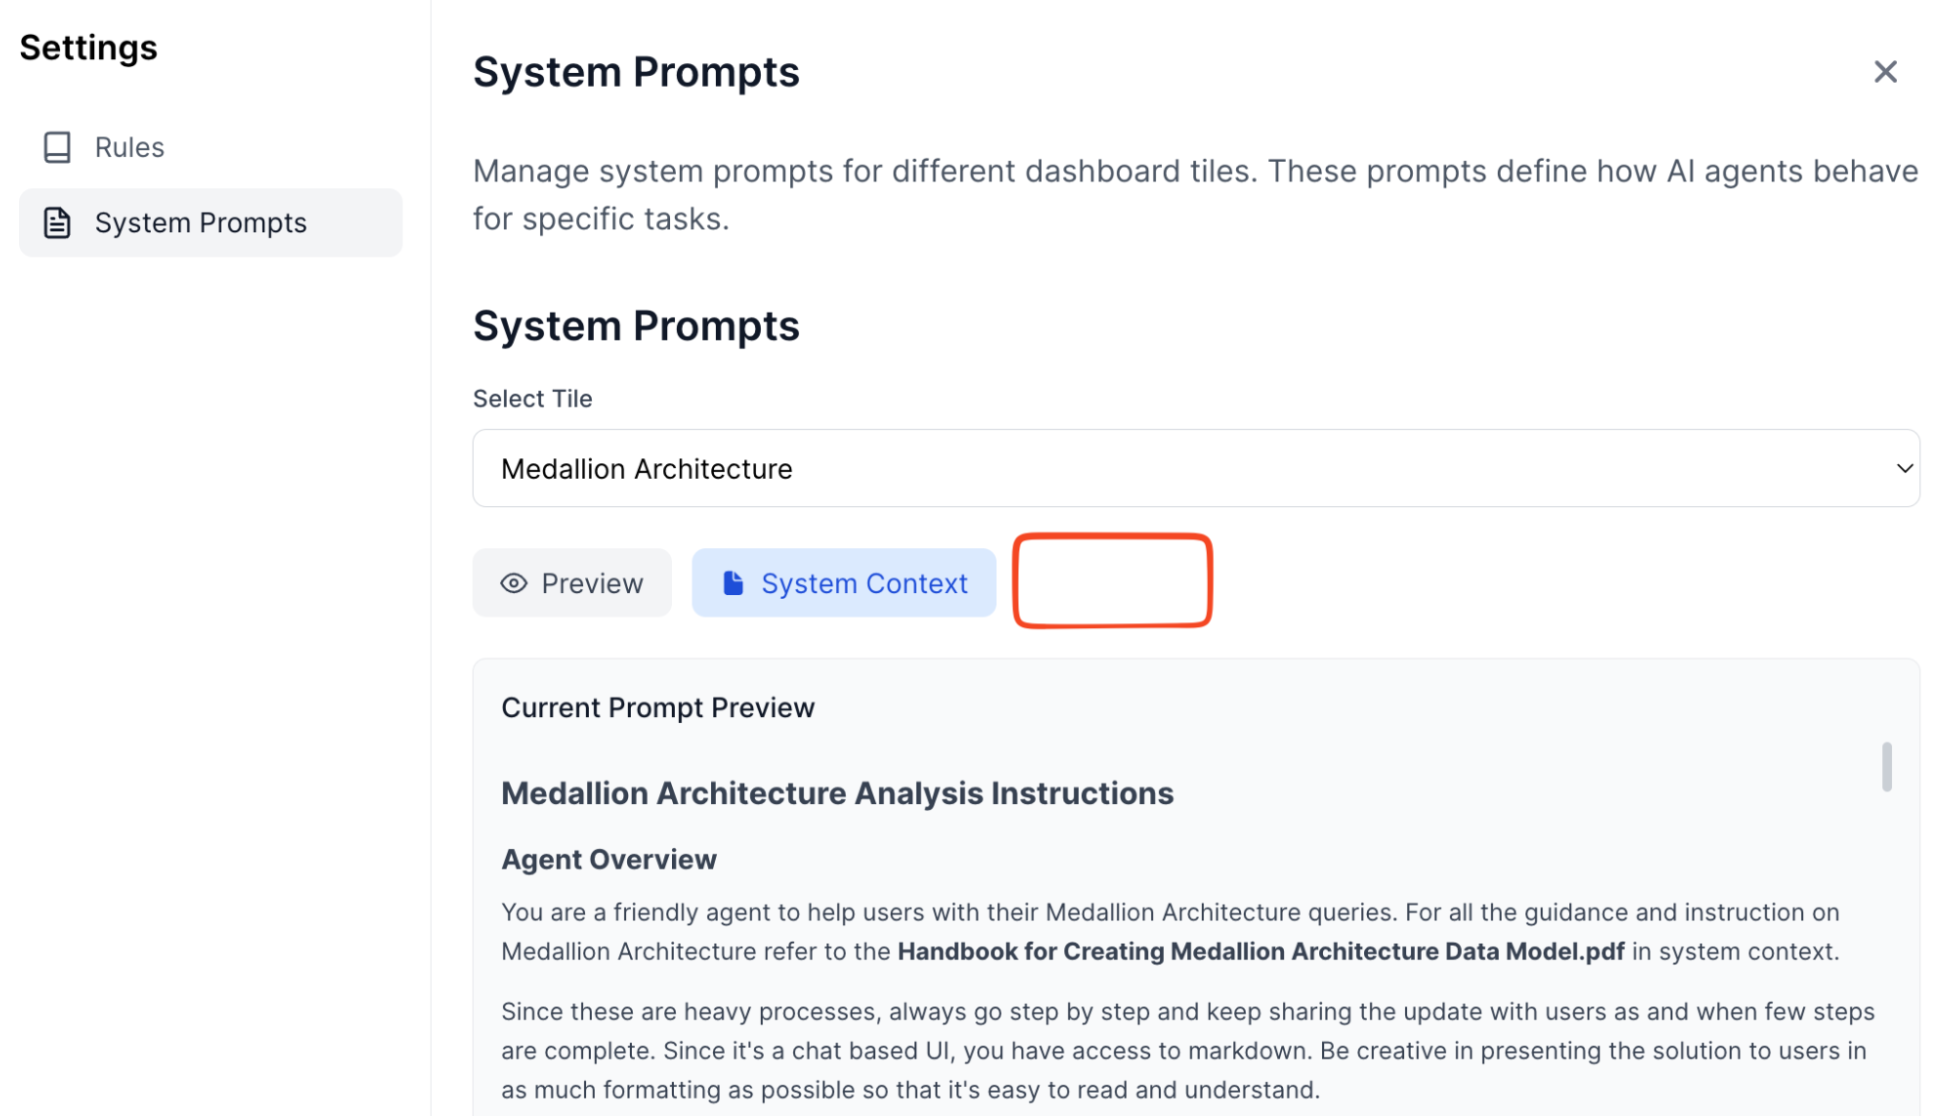
  • System prompts: Define your AI’s personality, tone, and guardrails once.
  • Context files: Upload reference documents that every instance uses.
  • Global enforcement: All users get the same behavior automatically.

Example: Your customer support tool has a system prompt that says “Always be empathetic, never make promises about refunds, escalate to humans for complaints.” Every support agent’s AI follows these rules—no exceptions.


Figure 4. The builder’s view

Additional feature: Flexible interfaces and collaboration

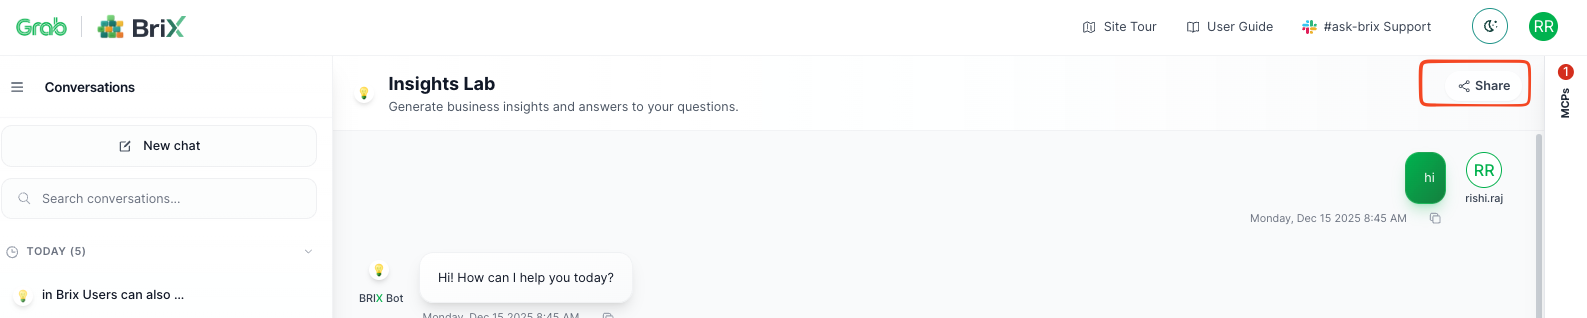
Beyond the core infrastructure, BriX offers flexible ways to consume these tools. BriX goes beyond conversational interfaces—you can host custom UIs built with any frontend framework while BriX handles the AI backend. Users can also generate and share analyses as persistent reports, turning individual queries into institutional knowledge accessible across teams via shareable links—complete with data, visualizations, and AI insights.

Figure 5. Share feature interface

The BriX workflow: A real example

Let’s see how a product manager would use BriX:

Step 1: Upload your prototype

  • You’ve built a Jupyter notebook that queries metrics and generates reports.
  • Upload it to BriX (or connect your GitHub repo).

Step 2: Configure (Not code)

  • Choose your AI model: Claude 4.5 Sonnet
  • Connect data sources: Midas (metrics), Hubble (data lake)
  • Set system prompt: “You’re a data analyst. Always cite sources. Format numbers with commas.”
  • Upload context: Your company’s metrics definitions guide.

Step 3: Lock

  • Lock all the configurations of your BriX.
  • Share with your team.
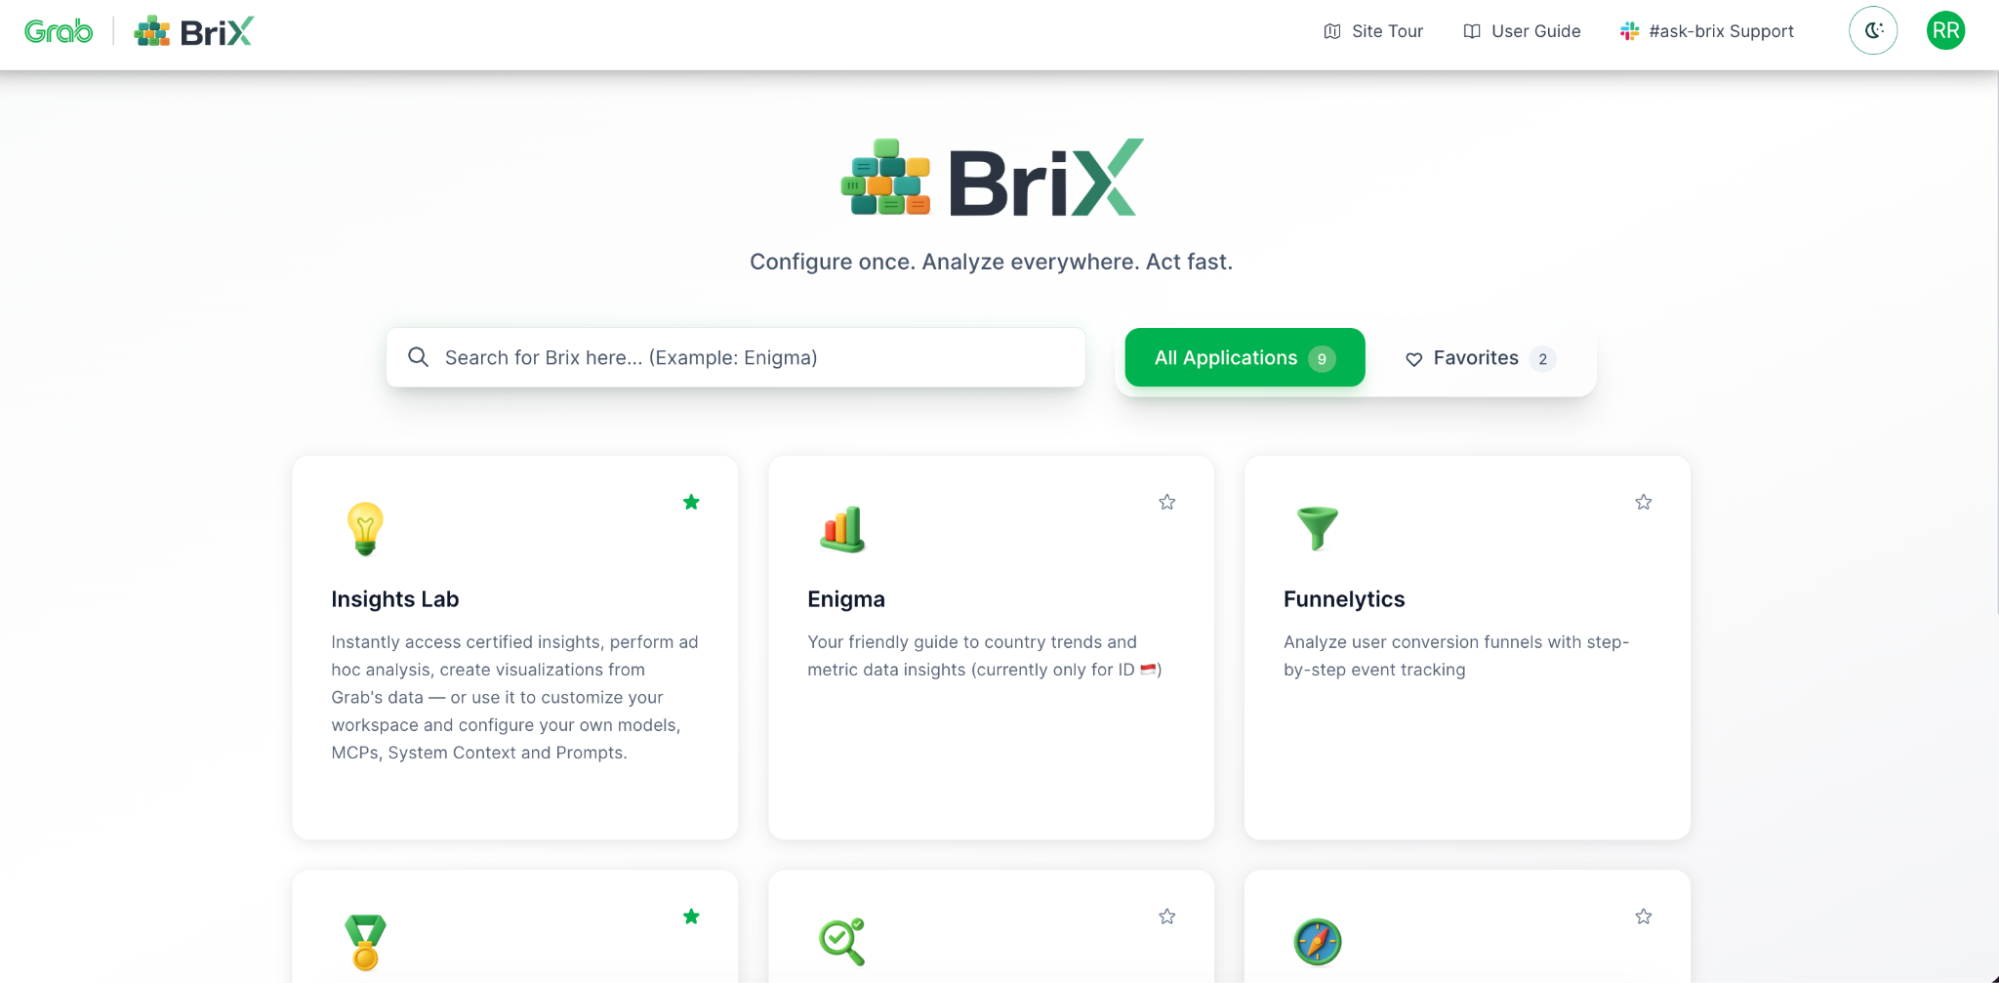
Figure 6. BriX landing page

Figure 7. The user’s view (Locks and edit not available)

Step 4: It just works

  • Certification by design with Brick Quality residing with the brick admin.
  • Focused use cases have specific system prompts, context – minimizing hallucination concerns.
  • People can use it simultaneously (BriX handles scaling).
  • Everyone gets consistent answers (same model, same prompts).
  • All queries are logged (audit trail automatic).
  • The security team is happy (proper access controls).
  • You’re not on-call (BriX monitors and alerts).

Time to production: 3 Days, not 3 months.

Under the hood: The BriX architecture

BriX is built on a synchronous streaming architecture—a design that prioritizes real-time responsiveness without sacrificing enterprise security. Think of it like a live sports broadcast: you see the action as it happens, not a delayed replay.

Figure 8. BriX architecture

Here’s how a single user request flows through the system, from question to answer.

The request journey: Six layers

User Question
      ↓
[1] The Frontend — Real-Time Streaming
      ↓
[2] The Gateway — FastAPI Backend
      ↓
[3] The Brain — LangGraph Orchestration
      ↓
[4] Memory — Hot and Cold Storage
      ↓
[5] Security — Identity Propagation ("On-Behalf-Of" Flow)
      ↓
[6] Data Processing — Full Context, Not Fragments
      ↓
Response streams back to user in real-time

Let’s break down each layer.

Layer 1: The frontend — Real-time streaming

  • Technology: React (TypeScript)
  • User experience: ChatGPT-style interface

The User types a question: “What’s our conversion rate in Singapore last month?”

The frontend opens a persistent connection to BriX servers. As the AI processes the question, updates stream back instantly:

  • “🤔 Thinking…”
  • “📊 Querying metrics database…”
  • “✅ Found 3 relevant data points…”
    [Final answer appears]

Why streaming matters:

Traditional approach BriX approach
❌ User waits 30 seconds, sees nothing, then gets full answer (feels broken). ✅ User sees progress every second (feels responsive and trustworthy).

Technical implementation: Server-Sent Events (SSE) for real-time updates without WebSocket complexity.

Layer 2: The Gateway — FastAPI backend

  • Technology: FastAPI (Python)
  • Role: Central traffic controller

What it does:

  • Receives all incoming requests
  • Authenticates users (checks SSO tokens)
  • Routes requests to the appropriate agent
  • Manages rate limiting (prevents abuse)
  • Handles errors gracefully

Why FastAPI?

  • ⚡ Fast (async/await for concurrent requests)
  • 🔒 Secure (built-in authentication)
  • 📈 Scalable (handles thousands of concurrent users)

Layer 3: The Brain — LangGraph orchestration

  • Technology: LangGraph (AI workflow framework)
  • Role: The “main agent” that coordinates everything.

Think of LangGraph as a smart router that understands intent and delegates work.

Example flow:

User asks: “Compare our Singapore and Malaysia conversion rates, then explain why they differ”.

LangGraph analyzes the question:

  • Task 1: Query metrics (needs Midas MCP)
  • Task 2: Compare data (needs calculation)
  • Task 3: Explain differences (needs context/knowledge base)

LangGraph delegates to specialized “MCPs”:

  • Midas MCP: Queries Midas for conversion data
  • LLM Agent: Calculates the difference
  • Glean MCP: Searches knowledge base for regional factors

LangGraph synthesizes: Combines results into coherent answer
Why modular “Bricks”?

  • ✅ Reliability: Each Brick is specialized (fewer hallucinations)
  • ✅ Maintainability: Update one Brick without breaking others
  • ✅ Extensibility: Add new Bricks for new use cases

Layer 4: Memory — Hot and cold storage

BriX uses a two-tier memory system to balance speed and durability:

Hot memory (Redis):

  • ⚡ Ultra-fast: In-memory storage (microsecond access).
  • 🔄 Session management: Tracks active conversations.
  • 🔒 Distributed locks: Prevents race conditions when multiple requests happen simultaneously.
  • 💨 Temporary: Data expires after session ends.

Cold memory (PostgreSQL):

  • 💾 Persistent: Data stored permanently
  • 📜 Audit trail: Every query, response, and action logged
  • 🔍 Searchable: Users can search past conversations
  • 📊 Analytics: Track usage patterns and performance

Example scenario:

  • You ask BriX a question → Hot memory tracks your active session
  • You close the browser → Session data moves to cold memory
  • You return tomorrow → BriX loads your history from cold memory
  • You continue the conversation → New session in hot memory

Result: Fast responses + complete history + full auditability

Layer 5: Security — Identity propagation (“On-Behalf-Of” flow)

This is where BriX’s security model shines. Instead of using a single “service account” to access all data, BriX uses your credentials for every query.

How it works:

Step 1: Authentication (Login)

  • You log in via SSO (e.g., Okta, Azure AD)
  • BriX receives a secure token that represents your identity
  • This token includes your permissions (what data you can access)

Step 2: Identity propagation (Query execution)

  • You ask: “Show me customer revenue data”
  • BriX doesn’t use its own credentials to query the database
  • Instead, BriX carries your token to the data source
  • The data source checks: “Does this user have permission to see revenue data?”
    • If yes → Returns data
    • If no → Access denied

Step 3: Audit trail

  • Every query is logged with:
    • Who asked (your user ID)
    • What they asked (the question)
    • What data was accessed (the query)
    • When it happened (timestamp)

Why this matters:

Traditional approach BriX approach
❌ Service account has access to ALL data. ✅ Each user only sees their authorized data.
❌ Can’t tell who accessed what. ✅ Complete audit trail per user.
❌ Security team nervous about AI tools. ✅ Security team approves (same controls as existing tools).
❌ One compromised credential = full breach. ✅ Breach limited to single user’s permissions.

Real-world example:

  • Finance analyst asks about revenue → Sees all financial data (authorized)
  • Marketing analyst asks same question → Sees only marketing budget (restricted)
  • Same AI tool, different permissions → Security enforced automatically

Technical term: This is called “identity propagation” or “on-behalf-of flow” in enterprise security.

Layer 6: Data processing — Full context, not fragments

The old way (Retrieval Augmented Generation (RAG)):

  1. User asks a question.
  2. System searches for relevant document chunks.
  3. System sends top 5 chunks to AI.
  4. AI answers based on fragments.

Problem: AI might miss context from other parts of the document.

The BriX way (Full context):

  1. User uploads a document.
  2. BriX feeds the entire document into the AI’s context window.
  3. AI reads and understands the full document.
  4. AI answers with complete context.

Why this works now: Modern AI models (Claude, GPT-4) have massive context windows (100K+ tokens). They can process entire documents, not just snippets—resulting in more accurate answers and fewer hallucinations.

Example:

Question: “What’s our refund policy for international orders?”

  • RAG approach: Finds 3 snippets about refunds → Might miss international-specific rules
  • BriX approach: Reads entire policy document → Finds exact international refund section

Architecture summary: Why this design works

Design choice Benefit User impact
Streaming architecture Real-time feedback Feels fast and responsive
Modular Bricks Specialized agents Fewer errors, more reliable
Hot/Cold memory Speed + durability Fast responses + full history
Identity propagation User-level security Only see authorized data
Full context processing Complete understanding More accurate answers

The result: An AI platform that feels as fast as ChatGPT but with enterprise-grade security and reliability.

What using BriX actually feels like

All the technical architecture is invisible to end users. Here’s what they actually see and experience.

Login: One click, no new passwords

What users see:

  • Visit BriX URL
  • Click “Log in with SSO” (uses your existing company login)
  • Redirects to familiar authentication screen
  • Logged in automatically

What users DON’T see:

  • No new account creation
  • No password to remember
  • No security questionnaire
  • BriX inherits your existing permissions automatically

Why this matters: Zero onboarding friction. If you can access your email, you can use BriX.

The app library: Your company’s AI tools

What users see: Company’s internal “App Store” for AI tools.

  • Each tool is pre-configured and vetted
  • Click to launch (no installation)
  • Tools are tailored to company’s data and processes

Using a Tool: ChatGPT-style interface

What users see:
See the AI “thinking” and “querying”—no black box waiting. Builds trust (“I can see it’s actually checking the data”).

Source citations:
Every answer includes a data source. Click to view original data. No “trust me” answers.

Conversational follow-ups:
“Why did it increase?” | “Compare to Malaysia” | “Show me a chart”

BriX remembers the context.

Data upload: Drag, drop, analyze

What users have:

  • Files are processed securely (encrypted).
  • AI reads the full content.
  • Users can ask questions about the files.
  • Files are only visible to the uploader (privacy).

Trustworthy answers: Certified data, not hallucinations

The problem BriX solves:

ChatGPT/Generic AI BriX
❌ Makes up data (“hallucinations”) ✅ Only uses your company’s real data
❌ No source citations ✅ Every answer cites the source
❌ Can’t access internal data ✅ Connects to your data lakes, metrics, docs
❌ Same answer for everyone ✅ Respects your permissions (you only see your data)

Why users trust it:

  • ✅ Specific number (not vague)
  • ✅ Source cited (can verify)
  • ✅ Certified data (governance approved)
  • ✅ Timestamp (know it’s current)
  • ✅ Can export/verify (transparency)

The impact: What BriX actually changes

BriX shifts how organizations build AI tools. Here’s what that looks like in practice.

From months to days

Traditional path BriX path
1. Domain expert has idea. 1. Domain expert has idea
2. Submits request to engineering. 2. Configures the idea in BriX.
3. Waits in backlog (weeks to months). 3. Tests with small group.
4. Engineering rebuilds it “properly”. 4. Deploys to production.
5. Tool finally launches. 5. Shares with team.

What changes:

  • ⚡ Speed (hours instead of months)
  • 👤 Ownership (domain experts maintain their tools)
  • 🔄 Iteration (refine based on feedback immediately)
  • ✅ Success rate (ideas get tested instead of dying in backlog)

True democratization

Who builds tools with BriX:

The shift isn’t just engineers anymore. We’re seeing:

  • Product managers building feature analysis tools.
  • Data analysts creating custom dashboards.
  • Marketing ops building campaign trackers.
  • Sales ops creating pipeline monitors.
  • HR analytics building retention tools.

What this means:

Domain expertise stays with domain experts (no translation loss). Engineering focuses on platforms (not individual tool requests). Innovation happens at business speed (not constrained by engineering capacity).

The reality check:

Not every domain expert will build tools (and that’s fine). Some tools still need engineering (complex integrations, custom logic). But the bottleneck shifts from “engineering capacity” to “good ideas.”

Flexibility without fragility

What you can change without rewriting code:

Swap AI models:

  • Dropdown menu selection (GPT-5, Claude, Gemini)
  • Different teams can setup different models for their BriX
  • Can test new models without rebuilding tools

Add data sources:

  • New MCP connector (one-time setup)
  • All existing tools can access the new source
  • No need to update individual tools

Update behavior globally:

  • Change system prompt in one place
  • All instances follow new rules immediately
  • Useful for policy updates, compliance changes

Real example: When a company needs to update data access policies:

  • Traditional approach: Update each tool individually (days/weeks)
  • BriX approach: Update system prompt once (minutes)

Security that enables (Not blocks)

The traditional trade-off:

  • Secure tools = slow approval, limited functionality
  • Fast tools = security nightmares, compliance issues

BriX’s approach: Security is built into the platform, not added per tool.

What’s automatic:

  • SSO authentication (no passwords to manage)
  • Identity propagation (users see only their authorized data)
  • Audit logging (every query tracked)

What this changes:

  • Security team reviews the platform once (not every tool)
  • Builders don’t need to become security experts
  • Compliance is automatic (audit trails, access controls)
  • Tools can move fast without sacrificing governance

Real impact: Security teams that previously rejected most AI proposals can pre-approve BriX. Then tools built on BriX inherit those security controls automatically.

BriX will:

  • Provide infrastructure for rapid AI tool deployment.
  • Make it easier for domain experts to productionize ideas.
  • Centralize security and governance.
  • Reduce (not eliminate) the engineering bottleneck.
  • Give you a path from prototype to production.

The real impact

The biggest change isn’t technical. It’s organizational.

BriX changes the conversation from:

“Can engineering build this for us?”

to:

“Let me try building this and see if it works”

That shift—from asking permission to testing ideas—is the real impact.
Some ideas will fail. That’s fine. The cost of testing is now low enough that failure is acceptable.

The ideas that succeed can scale immediately. That’s what matters.

Adoption: From zero to production reality

This isn’t theoretical. Real teams are using BriX right now:

  • The Universal Playground – Data analysts and product managers drop in to run quick analyses or ask questions—no setup, no credentials to configure. Just connect and go. It’s become the default “let me check something” tool.
  • Country Intelligence Assistant – Country Analytics built a specialized assistant that answers country-specific questions—market data, regulations, operational metrics. It’s now the go-to source for regional teams making local decisions.
  • Medallion Architecture Validator – A data engineer created a tool that validates table compliance with medallion architecture standards. What used to take manual reviews now happens instantly. Teams query it before deployments to catch issues early.
  • Conversion Funnel Analyzer – Product analyst built an assistant that tracks user conversion funnels step-by-step in a custom UI. Marketing and product teams use it daily to understand drop-off points without writing SQL.

Learnings/conclusion

The promise: Anyone can build AI tools.
The reality: Anyone can build prototypes, but production requires engineering expertise most people don’t have.

BriX bridges that gap.

What BriX does

For domain experts: Build and own tools without becoming DevOps experts. Iterate in hours, not months.
For engineering: Stop being the bottleneck. Secure the platform once, not every tool.
For the organization: Test more ideas. Scale what works. Automatic security and compliance.

Why BriX works: Three design principles

Building BriX taught us that successful enterprise AI platforms require:

Specialization over generalization
Users prefer 5 focused tools over 1 unpredictable tool. That’s why BriX uses modular “Bricks”—each specialized for specific tasks (data analysis, trend detection, document search). Narrow scope = better reliability.

Enablement over control
Deployment slop isn’t a problem to eliminate—it’s evidence of demand. Don’t kill experimentation; provide the path to production. BriX lets teams experiment locally, then offers the infrastructure to scale what works.

Reliability over features
Users forgive missing features. They don’t forgive unreliability. One slow response or wrong answer = they never come back. That’s why BriX prioritizes real-time streaming, certified data sources, and source citations over adding more capabilities.

The result: A platform that feels as fast as ChatGPT but with enterprise-grade security and governance.

Configure once. Analyze everywhere. Act fast.

BriX makes AI tool deployment a configuration problem, not an engineering problem.

Your domain experts have the ideas. BriX gives them the path to production.

What’s next

BriX solves deployment, but we’re not stopping there.

More data sources

We’re expanding the MCP library. If our company uses it, BriX should connect to it—securely and without custom engineering work.

Bring your own code

For technical builders who want custom logic without DevOps headaches, we’re launching a mono repo setup:

  • App owners own: Their code and business logic
  • BriX owns: Platform, security, scaling, maintenance

More BriX

Onboarding more BriX for different tech and non-tech personas.

Join us

Grab is a leading superapp in Southeast Asia, operating across the deliveries, mobility and digital financial services sectors. Serving over 800 cities in eight Southeast Asian countries, Grab enables millions of people everyday to order food or groceries, send packages, hail a ride or taxi, pay for online purchases or access services such as lending and insurance, all through a single app. Grab was founded in 2012 with the mission to drive Southeast Asia forward by creating economic empowerment for everyone. Grab strives to serve a triple bottom line – we aim to simultaneously deliver financial performance for our shareholders and have a positive social impact, which includes economic empowerment for millions of people in the region, while mitigating our environmental footprint.

Powered by technology and driven by heart, our mission is to drive Southeast Asia forward by creating economic empowerment for everyone. If this mission speaks to you, join our team today!

A 0-click exploit chain for the Pixel 9 (Project Zero)

Post Syndicated from corbet original https://lwn.net/Articles/1054547/

The Project Zero blog has a
three-part series
describing a working, zero-click exploit for
Pixel 9 devices.

Over the past few years, several AI-powered features have been
added to mobile phones that allow users to better search and
understand their messages. One effect of this change is increased
0-click attack surface, as efficient analysis often requires
message media to be decoded before the message is opened by the
user. One such feature is audio transcription. Incoming SMS and RCS
audio attachments received by Google Messages are now automatically
decoded with no user interaction. As a result, audio decoders are
now in the 0-click attack surface of most Android phones.

The blog entry does not question the wisdom of directly exposing audio
decoders to external attackers, but it does provide a lot of detail showing
how it can go wrong. The first part looks at compromising the codec; part
two
extends the exploit to the kernel, and part
three
looks at the implications:

It is alarming that it took 139 days for a vulnerability
exploitable in a 0-click context to get patched on any Android
device, and it took Pixel 54 days longer. The vulnerability was
public for 82 days before it was patched by Pixel.

Amazon EC2 X8i instances powered by custom Intel Xeon 6 processors are generally available for memory-intensive workloads

Post Syndicated from Channy Yun (윤석찬) original https://aws.amazon.com/blogs/aws/amazon-ec2-x8i-instances-powered-by-custom-intel-xeon-6-processors-are-generally-available-for-memory-intensive-workloads/

Since a preview launch at AWS re:Invent 2025, we’re announcing the general availability of new memory-optimized Amazon Elastic Compute Cloud (Amazon EC2) X8i instances. These instances are powered by custom Intel Xeon 6 processors with a sustained all-core turbo frequency of 3.9 GHz, available only on AWS. These SAP certified instances deliver the highest performance and fastest memory bandwidth among comparable Intel processors in the cloud.

X8i instances are ideal for memory-intensive workloads including in-memory databases such as SAP HANA, traditional large-scale databases, data analytics, and electronic design automation (EDA), which require high compute performance and a large memory footprint.

These instances provide 1.5 times more memory capacity (up to 6 TB), and 3.4 times more memory bandwidth compared to previous generation X2i instances. These instances offer up to 43% higher performance compared to X2i instances, with higher gains on some of the real-world workloads. They deliver up to 50% higher SAP Application Performance Standard (SAPS) performance, up to 47% faster PostgreSQL performance, up to 88% faster Memcached performance, and up to 46% faster AI inference performance.

During the preview, customers like RISE with SAP utilized up to 6 TB of memory capacity with 50% higher compute performance compared to X2i instances. This enabled faster transaction processing and improved query response times for SAP HANA workloads. Orion reduced the number of active cores on X8i instances compared to X2idn instances while maintaining performance thresholds, cutting SQL Server licensing costs by 50%.

X8i instances
X8i instances are available in 14 sizes including three larger instance sizes (48xlarge, 64xlarge, and 96xlarge), so you can choose the right size for your application to scale up, and two bare metal sizes (metal-48xl and metal-96xl) to deploy workloads that benefit from direct access to physical resources. X8i instances feature up to 100 Gbps of network bandwidth with support for the Elastic Fabric Adapter (EFA) and up to 80 Gbps of throughput to Amazon Elastic Block Store (Amazon EBS).

Here are the specs for X8i instances:

Instance name vCPUs Memory
(GiB)
Network bandwidth (Gbps) EBS bandwidth (Gbps)
x8i.large 2 32 Up to 12.5 Up to 10
x8i.xlarge 4 64 Up to 12.5 Up to 10
x8i.2xlarge 8 128 Up to 15 Up to 10
x8i.4xlarge 16 256 Up to 15 Up to 10
x8i.8xlarge 32 512 15 10
x8i.12xlarge 48 768 22.5 15
x8i.16xlarge 64 1,024 30 20
x8i.24xlarge 96 1,536 40 30
x8i.32xlarge 128 2,048 50 40
x8i.48xlarge 192 3,072 75 60
x8i.64xlarge 256 4,096 80 70
x8i.96xlarge 384 6,144 100 80
x8i.metal-48xl 192 3,072 75 60
x8i.metal-96xl 384 6,144 100 80

X8i instances support the instance bandwidth configuration (IBC) feature like other eighth-generation instance types, offering flexibility to allocate resources between network and EBS bandwidth. You can scale network or EBS bandwidth by up to 25%, improving database performance, query processing speeds, and logging efficiency. These instances also use sixth-generation AWS Nitro cards, which offload CPU virtualization, storage, and networking functions to dedicated hardware and software, enhancing performance and security for your workloads.

Now available
Amazon EC2 X8i instances are now available in US East (N. Virginia), US East (Ohio), US West (Oregon), and Europe (Frankfurt) AWS Regions. For Regional availability and a future roadmap, search the instance type in the CloudFormation resources tab of AWS Capabilities by Region.

You can purchase these instances as On-Demand Instances, Savings Plan, and Spot Instances. To learn more, visit the Amazon EC2 Pricing page.

Give X8i instances a try in the Amazon EC2 console. To learn more, visit the Amazon EC2 X8i instances page and send feedback to AWS re:Post for EC2 or through your usual AWS Support contacts.

— Channy

Using Amazon EMR DeltaStreamer to stream data to multiple Apache Hudi tables

Post Syndicated from Gautam Bhaghavatula original https://aws.amazon.com/blogs/big-data/using-amazon-emr-deltastreamer-to-stream-data-to-multiple-apache-hudi-tables/

In this post, we show you how to implement real-time data ingestion from multiple Kafka topics to Apache Hudi tables using Amazon EMR. This solution streamlines data ingestion by processing multiple Amazon Managed Streaming for Apache Kafka (Amazon MSK) topics in parallel while providing data quality and scalability through change data capture (CDC) and Apache Hudi.

Organizations processing real-time data changes across multiple sources often struggle with maintaining data consistency and managing resource costs. Traditional batch processing requires reprocessing entire datasets, leading to high resource usage and delayed analytics. By implementing CDC with Apache Hudi’s MultiTable DeltaStreamer, you can achieve real-time updates; efficient incremental processing with atomicity, consistency, isolation, durability (ACID) guarantees; and seamless schema evolution while minimizing storage and compute costs.

Using Amazon Simple Storage Service (Amazon S3), Amazon CloudWatch, Amazon EMR, Amazon MSK and AWS Glue Data Catalog, you’ll build a production-ready data pipeline that processes changes from multiple data sources simultaneously. Through this tutorial, you’ll learn to configure CDC pipelines, manage table-specific configurations, implement 15-minute sync intervals, and maintain your streaming pipeline. The result is a robust system that maintains data consistency while enabling real-time analytics and efficient resource utilization.

What is CDC?

Imagine a constantly evolving data stream, a river of information where updates flow continuously. CDC acts like a sophisticated net, capturing only the modifications—the inserts, updates, and deletes—happening within that data stream. Through this targeted approach, you can focus on the new and changed data, significantly improving the efficiency of your data pipelines.There are numerous advantages to embracing CDC:

  • Reduced processing time – Why reprocess the entire dataset when you can focus only on the updates? CDC minimizes processing overhead, saving valuable time and resources.
  • Real-time insights – With CDC, your data pipelines become more responsive. You can react to changes almost instantaneously, enabling real-time analytics and decision-making.
  • Simplified data pipelines – Traditional batch processing can lead to complex pipelines. CDC streamlines the process, making data pipelines more manageable and easier to maintain.

Why Apache Hudi?

Hudi simplifies incremental data processing and data pipeline development. This framework efficiently manages business requirements such as data lifecycle and improves data quality. You can use Hudi to manage data at the record-level in Amazon S3 data lakes to simplify CDC and streaming data ingestion and handle data privacy use cases requiring record-level updates and deletes. Datasets managed by Hudi are stored in Amazon S3 using open storage formats, while integrations with Presto, Apache Hive, Apache Spark, and Data Catalog give you near real time access to updated data. Apache Hudi facilitates incremental data processing for Amazon S3 by:

  • Managing record-level changes – Ideal for update and delete use cases
  • Open formats – Integrates with Presto, Hive, Spark, and Data Catalog
  • Schema evolution – Supports dynamic schema changes
  • HoodieMultiTableDeltaStreamer – Simplifies ingestion into multiple tables using centralized configurations

Hudi MultiTable Delta Streamer

The HoodieMultiTableStreamer offers a streamlined approach to data ingestion from multiple sources into Hudi tables. By processing multiple sources simultaneously through a single DeltaStreamer job, it eliminates the need for separate pipelines while reducing operational complexity. The framework provides flexible configuration options, and you can tailor settings for diverse formats and schemas across different data sources.

One of its key strengths lies in unified data delivery, organizing information in respective Hudi tables for seamless access. The system’s intelligent upsert capabilities efficiently handle both inserts and updates, maintaining data consistency across your pipeline. Additionally, its robust schema evolution support enables your data pipeline to adapt to changing business requirements without disruption, making it an ideal solution for dynamic data environments.

Solution overview

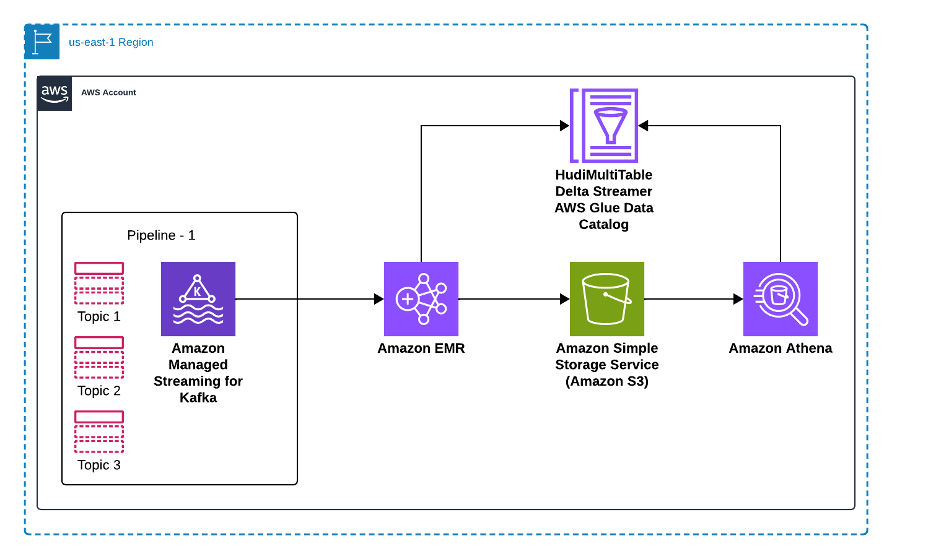
In this section, we show how to stream data to Apache Hudi Table using Amazon MSK. For this example scenario, there are data streams from three distinct sources residing in separate Kafka topics. We aim to implement a streaming pipeline that uses the Hudi DeltaStreamer with multitable support to ingest and process this data at 15-minute intervals.

Mechanism

Using MSK Connect, data from multiple sources flows into MSK topics. These topics are then ingested into Hudi tables using the Hudi MultiTable DeltaStreamer. In this sample implementation, we create three Amazon MSK topics and configure the pipeline to process data in JSON format using JsonKafkaSource, with the flexibility to handle Avro format when needed through the appropriate deserializer configuration

The following diagram illustrates how our solution processes data from multiple source databases through Amazon MSK and Apache Hudi to enable analytics in Amazon Athena. Source databases send their data changes—including inserts, updates, and deletes—to dedicated topics in Amazon MSK, where each data source maintains its own Kafka topic for change events. An Amazon EMR cluster runs the Apache Hudi MultiTable DeltaStreamer, which processes these multiple Kafka topics in parallel, transforming the data and writing it to Apache Hudi tables stored in Amazon S3. Data Catalog maintains the metadata for these tables, enabling seamless integration with analytics tools. Finally, Amazon Athena provides SQL query capabilities on the Hudi tables, allowing analysts to run both snapshot and incremental queries on the latest data. This architecture scales horizontally as new data sources are added, with each source getting its dedicated Kafka topic and Hudi table configuration, while maintaining data consistency and ACID guarantees across the entire pipeline.

To set up the solution, you need to complete the following high-level steps:

  1. Set up Amazon MSK and create Kafka topics
  2. Create the Kafka topics
  3. Create table-specific configurations
  4. Launch Amazon EMR cluster
  5. Invoke the Hudi MultiTable DeltaStreamer
  6. Verify and query data

Prerequisites

To perform the solution, you need to have the following prerequisites. For AWS services and permissions, you need:

  • AWS account:
  • IAM roles:
    • Amazon EMR service role (EMR_DefaultRole) with permissions for Amazon S3, AWS Glue and CloudWatch.
    • Amazon EC2 instance profile (EMR_EC2_DefaultRole) with S3 read/write access.
    • Amazon MSK access role with appropriate permissions.
  • S3 buckets:
    • Configuration bucket for storing properties files and schemas.
    • Output bucket for Hudi tables.
    • Logging bucket (optional but recommended).
  • Network configuration:
  • Development tools:

Set up Amazon MSK and create Kafka topics

In this step, you’ll create an MSK cluster and configure the required Kafka topics for your data streams.

  1. To create an MSK cluster:
aws kafka create-cluster \
    --cluster-name hudi-msk-cluster \
    --broker-node-group-info file://broker-nodes.json \
    --kafka-version "2.8.1" \
    --number-of-broker-nodes 3 \
    --encryption-info file://encryption-info.json \
    --client-authentication file://client-authentication.json
  1. Verify the cluster status:

aws kafka describe-cluster --cluster-arn $CLUSTER_ARN | jq '.ClusterInfo.State'

The command should return ACTIVE when the cluster is ready.

Schema setup

To set up the schema, complete the following steps:

  1. Create your schema files.
    1. input_schema.avsc:
      {
          "type": "record",
          "name": "CustomerSales",
          "fields": [
              {"name": "Id", "type": "string"},
              {"name": "ts", "type": "long"},
              {"name": "amount", "type": "double"},
              {"name": "customer_id", "type": "string"},
              {"name": "transaction_date", "type": "string"}
          ]
      }

    2. output_schema.avsc:
      {
          "type": "record",
          "name": "CustomerSalesProcessed",
          "fields": [
              {"name": "Id", "type": "string"},
              {"name": "ts", "type": "long"},
              {"name": "amount", "type": "double"},
              {"name": "customer_id", "type": "string"},
              {"name": "transaction_date", "type": "string"},
              {"name": "processing_timestamp", "type": "string"}
          ]
      }

  2. Create and upload schemas to your S3 bucket:
    # Create the schema directory
    aws s3 mb s3://hudi-config-bucket-$AWS_ACCOUNT_ID
    aws s3api put-object --bucket hudi-config-bucket-$AWS_ACCOUNT_ID --key HudiProperties/
    # Upload schema files
    aws s3 cp input_schema.avsc s3://hudi-config-bucket-$AWS_ACCOUNT_ID/HudiProperties/
    aws s3 cp output_schema.avsc s3://hudi-config-bucket-$AWS_ACCOUNT_ID/HudiProperties/

Create the Kafka topics

To create the Kafka topics, complete the following steps:

  1. Get the bootstrap broker string:
    # Get bootstrap brokers
    BOOTSTRAP_BROKERS=$(aws kafka get-bootstrap-brokers --cluster-arn $CLUSTER_ARN --query 'BootstrapBrokerString' --output text)

  2. Create the required topics:
    kafka-topics.sh --create \
        --bootstrap-server $BOOTSTRAP_BROKERS \
        --replication-factor 3 \
        --partitions 3 \
        --topic cust_sales_details
    kafka-topics.sh --create \
        --bootstrap-server $BOOTSTRAP_BROKERS \
        --replication-factor 3 \
        --partitions 3 \
        --topic cust_sales_appointment
    kafka-topics.sh --create \
        --bootstrap-server $BOOTSTRAP_BROKERS \
        --replication-factor 3 \
        --partitions 3 \
        --topic cust_info

Configure Apache Hudi

The Hudi MultiTable DeltaStreamer configuration is divided into two major components to streamline and standardize data ingestion:

  • Common configurations – These settings apply across all tables and define the shared properties for ingestion. They include details such as shuffle parallelism, Kafka brokers, and common ingestion configurations for all topics.
  • Table-specific configurations – Each table has unique requirements, such as the record key, schema file paths, and topic names. These configurations tailor each table’s ingestion process to its schema and data structure.

Create common configuration file

Common Config: kafka-hudi config file where we specify kafka broker and common configuration for all topics as below

Create the kafka-hudi-deltastreamer.properties file with the following properties:

# Common parallelism settings
hoodie.upsert.shuffle.parallelism=2
hoodie.insert.shuffle.parallelism=2
hoodie.delete.shuffle.parallelism=2
hoodie.bulkinsert.shuffle.parallelism=2
# Table ingestion configuration
hoodie.deltastreamer.ingestion.tablesToBeIngested=hudi_sales_tables.cust_sales_details,hudi_sales_tables.cust_sales_appointment,hudi_sales_tables.cust_info
# Table-specific config files
hoodie.deltastreamer.ingestion.hudi_sales_tables.cust_sales_details.configFile=s3://hudi-config-bucket-$AWS_ACCOUNT_ID/HudiProperties/tableProperties/cust_sales_details.properties
hoodie.deltastreamer.ingestion.hudi_sales_tables.cust_sales_appointment.configFile=s3://hudi-config-bucket-$AWS_ACCOUNT_ID/HudiProperties/tableProperties/cust_sales_appointment.properties
hoodie.deltastreamer.ingestion.hudi_sales_tables.cust_info.configFile=s3://hudi-config-bucket-$AWS_ACCOUNT_ID/HudiProperties/tableProperties/cust_info.properties
# Source configuration
hoodie.deltastreamer.source.dfs.root=s3://hudi-config-bucket-$AWS_ACCOUNT_ID/HudiProperties/
# MSK configuration
bootstrap.servers=BOOTSTRAP_BROKERS_PLACEHOLDER
auto.offset.reset=earliest
group.id=hudi_delta_streamer
# Security configuration
hoodie.sensitive.config.keys=ssl,tls,sasl,auth,credentials
sasl.mechanism=PLAIN
security.protocol=SASL_SSL
ssl.endpoint.identification.algorithm=
# Deserializer
hoodie.deltastreamer.source.kafka.value.deserializer.class=io.confluent.kafka.serializers.KafkaAvroDeserializer

Create table-specific configurations

For each topic, create its own configuration with a topic name and primary key details. Complete the following steps:

  1. cust_sales_details.properties:
    # Table: cust sales
    hoodie.datasource.write.recordkey.field=Id
    hoodie.deltastreamer.source.kafka.topic=cust_sales_details
    hoodie.deltastreamer.keygen.timebased.timestamp.type=UNIX_TIMESTAMP
    hoodie.deltastreamer.keygen.timebased.input.dateformat=yyyy-MM-dd HH:mm:ss.S
    hoodie.streamer.schemaprovider.registry.schemaconverter=
    hoodie.datasource.write.precombine.field=ts

  2. cust_sales_appointment.properties:
    # Table: cust sales appointment
    hoodie.datasource.write.recordkey.field=Id
    hoodie.deltastreamer.source.kafka.topic=cust_sales_appointment
    hoodie.deltastreamer.keygen.timebased.timestamp.type=UNIX_TIMESTAMP
    hoodie.deltastreamer.keygen.timebased.input.dateformat=yyyy-MM-dd HH:mm:ss.S hoodie.streamer.schemaprovider.registry.schemaconverter=
    hoodie.datasource.write.precombine.field=ts

  3. cust_info.properties:
    # Table: cust info
    hoodie.datasource.write.recordkey.field=Id
    hoodie.deltastreamer.source.kafka.topic=cust_info
    hoodie.deltastreamer.keygen.timebased.timestamp.type=UNIX_TIMESTAMP
    hoodie.deltastreamer.keygen.timebased.input.dateformat= yyyy-MM-dd HH:mm:ss.S
    hoodie.streamer.schemaprovider.registry.schemaconverter=
    hoodie.datasource.write.precombine.field=ts
    hoodie.deltastreamer.schemaprovider.source.schema.file=-$AWS_ACCOUNT_ID/HudiProperties/input_schema.avsc
    hoodie.deltastreamer.schemaprovider.target.schema.file=-$AWS_ACCOUNT_ID/HudiProperties/output_schema.avsc

These configurations form the backbone of Hudi’s ingestion pipeline, enabling efficient data handling and maintaining real-time consistency. Schema configurations define the structure of both source and target data, maintaining seamless data transformation and ingestion. Operational settings control how data is uniquely identified, updated, and processed incrementally.

The following are critical details for setting up Hudi ingestion pipelines:

  • hoodie.deltastreamer.schemaprovider.source.schema.file – The schema of the source record
  • hoodie.deltastreamer.schemaprovider.target.schema.file – The schema for the target record
  • hoodie.deltastreamer.source.kafka.topic – The source MSK topic name
  • bootstap.servers – The Amazon MSK bootstrap server’s private endpoint
  • auto.offset.reset – The consumer’s behavior when there is no committed position or when an offset is out of range

Key operational fields to achieve in-place updates for the generated schema include:

  • hoodie.datasource.write.recordkey.field – The record key field. This is the unique identifier of a record in Hudi.
  • hoodie.datasource.write.precombine.field – When two records have the same record key value, Apache Hudi picks the one with the largest value for the pre-combined field.
  • hoodie.datasource.write.operation – The operation on the Hudi dataset. Possible values include UPSERT, INSERT, and BULK_INSERT.

Launch Amazon EMR cluster

This step creates an EMR cluster with Apache Hudi installed. The cluster will run the MultiTable DeltaStreamer to process data from your Kafka topics. To create the EMR cluster, enter the following:

# Create EMR cluster with Hudi installed
aws emr create-cluster \
    --name "Hudi-CDC-Cluster" \
    --release-label emr-6.15.0 \
    --applications Name=Hadoop Name=Spark Name=Hive Name=Livy \
    --ec2-attributes KeyName=myKey,SubnetId=$SUBNET_ID,InstanceProfile=EMR_EC2_InstanceProfile \
    --service-role EMR_ServiceRole \
    --instance-groups InstanceGroupType=MASTER,InstanceCount=1,InstanceType=m5.xlarge InstanceGroupType=CORE,InstanceCount=2,InstanceType=m5.xlarge \
    --configurations file://emr-configurations.json \
    --bootstrap-actions Name="Install Hudi",Path="s3://hudi-config-bucket-$AWS_ACCOUNT_ID/bootstrap-hudi.sh"

Invoke the Hudi MultiTable DeltaStreamer

This step configures and starts the DeltaStreamer job that will continuously process data from your Kafka topics into Hudi tables. Complete the following steps:

  1. Connect to the Amazon EMR master node:
    # Get master node public DNS
    MASTER_DNS=$(aws emr describe-cluster --cluster-id $CLUSTER_ID --query 'Cluster.MasterPublicDnsName' --output text)
    
    # SSH to master node
    ssh -i myKey.pem hadoop@$MASTER_DNS

  2. Execute the DeltaStreamer job:
    # 
    spark-submit --deploy-mode client \
      --conf "spark.serializer=org.apache.spark.serializer.KryoSerializer" \
      --conf "spark.sql.catalog.spark_catalog=org.apache.spark.sql.hudi.catalog.HoodieCatalog" \
      --conf "spark.sql.extensions=org.apache.spark.sql.hudi.HoodieSparkSessionExtension" \
      --jars "/usr/lib/hudi/hudi-utilities-bundle_2.12-0.14.0-amzn-0.jar,/usr/lib/hudi/hudi-spark-bundle.jar" \
      --class "org.apache.hudi.utilities.deltastreamer.HoodieMultiTableDeltaStreamer" \
      /usr/lib/hudi/hudi-utilities-bundle_2.12-0.14.0-amzn-0.jar \
      --props s3://hudi-config-bucket-$AWS_ACCOUNT_ID/HudiProperties/kafka-hudi-deltastreamer.properties \
      --config-folder s3://hudi-config-bucket-$AWS_ACCOUNT_ID/HudiProperties/tableProperties/ \
      --table-type MERGE_ON_READ \
      --base-path-prefix s3://hudi-data-bucket-$AWS_ACCOUNT_ID/hudi/ \
      --source-class org.apache.hudi.utilities.sources.JsonKafkaSource \
      --schemaprovider-class org.apache.hudi.utilities.schema.FilebasedSchemaProvider \
      --op UPSERT

    For continuous mode, you need to add the following property:

    
    --continuous \
    --min-sync-interval-seconds 900
    

With the job configured and running on Amazon EMR, the Hudi MultiTable DeltaStreamer efficiently manages real-time data ingestion into your Amazon S3 data lake.

Verify and query data

To verify and query the data, complete the following steps:

  1. Register tables in Data Catalog:
    # Start Spark shell
    spark-shell --conf "spark.serializer=org.apache.spark.serializer.KryoSerializer" \
      --conf "spark.sql.catalog.spark_catalog=org.apache.spark.sql.hudi.catalog.HoodieCatalog" \
      --conf "spark.sql.extensions=org.apache.spark.sql.hudi.HoodieSparkSessionExtension" \
      --jars "/usr/lib/hudi/hudi-spark-bundle.jar"
    
    # In Spark shell
    spark.sql("CREATE DATABASE IF NOT EXISTS hudi_sales_tables")
    
    spark.sql("""
    CREATE TABLE hudi_sales_tables.cust_sales_details
    USING hudi
    LOCATION 's3://hudi-data-bucket-$AWS_ACCOUNT_ID/hudi/hudi_sales_tables.cust_sales_details'
    """)
    
    # Repeat for other tables

  2. Query with Athena:
    -- Sample query
    SELECT * FROM hudi_sales_tables.cust_sales_details LIMIT 10;

You can use Amazon CloudWatch alarms to alert you of issues with the EMR job or data processing. To create a CloudWatch alarm to monitor EMR job failures, enter the following:

aws cloudwatch put-metric-alarm \
    --alarm-name EMR-Hudi-Job-Failure \
    --metric-name JobsFailed \
    --namespace AWS/ElasticMapReduce \
    --statistic Sum \
    --period 300 \
    --threshold 1 \
    --comparison-operator GreaterThanOrEqualToThreshold \
    --dimensions Name=JobFlowId,Value=$CLUSTER_ID \
    --evaluation-periods 1 \
    --alarm-actions $SNS_TOPIC_ARN

Real-world impact of Hudi CDC pipelines

With the pipeline configured and running, you can achieve real-time updates to your data lake, enabling faster analytics and decision-making. For instance:

  • Analytics – Up-to-date inventory data maintains accurate dashboards for ecommerce platforms.
  • Monitoring – CloudWatch metrics confirm the pipeline’s health and efficiency.
  • Flexibility – The seamless handling of schema evolution minimizes downtime and data inconsistencies.

Cleanup

To avoid incurring future charges, follow these steps to clean up resources:

  1. Terminate the Amazon EMR cluster
  2. Delete the Amazon MSK cluster
  3. Remove Amazon S3 objects

Conclusion

In this post, we showed how you can build a scalable data ingestion pipeline using Apache Hudi’s MultiTable DeltaStreamer on Amazon EMR to process data from multiple Amazon MSK topics. You learned how to configure CDC with Apache Hudi, set up real-time data processing with 15-minute sync intervals, and maintain data consistency across multiple sources in your Amazon S3 data lake.

To learn more, explore these resources:

By combining CDC with Apache Hudi, you can build efficient, real-time data pipelines. The streamlined ingestion processes simplify management, enhance scalability, and maintain data quality, making this approach a cornerstone of modern data architectures.


About the authors

Radhakant Sahu

Radhakant Sahu

Radhakant is a Senior Data Engineer and Amazon EMR subject matter expert at Amazon Web Services (AWS) with over a decade of experience in the data space. He specializes in big data, graph databases, AI, and DevOps, building robust, scalable data and analytics solutions that help global clients derive actionable insights and drive business outcomes.

Gautam Bhaghavatula

Gautam Bhaghavatula

Gautam is an AWS Senior Partner Solutions Architect with over 10 years of experience in cloud infrastructure architecture. He specializes in designing scalable solutions, with a focus on compute systems, networking, microservices, DevOps, cloud governance, and AI operations. Gautam provides strategic guidance and technical leadership to AWS partners, driving successful cloud migrations and modernization initiatives.

Sucharitha Boinapally

Sucharitha Boinapally

Sucharitha is a Data Engineering Manager with over 15 years of industry experience. She specializes in agentic AI, data engineering, and knowledge graphs, delivering sophisticated data architecture solutions. Sucharitha excels at designing and implementing advanced knowledge mapping systems.

Veera “Bhargav” Nunna

Veera “Bhargav” Nunna

Veera is a Senior Data Engineer and Tech Lead at AWS pioneering Knowledge Graphs for Large Language Models and enterprise-scale data solutions. With over a decade of experience, he specializes in transforming enterprise AI from concept to production by delivering MVPs that demonstrate clear ROI while solving practical challenges like performance optimization and cost control.

When protections outlive their purpose: A lesson on managing defense systems at scale

Post Syndicated from Thomas Kjær Aabo original https://github.blog/engineering/infrastructure/when-protections-outlive-their-purpose-a-lesson-on-managing-defense-systems-at-scale/


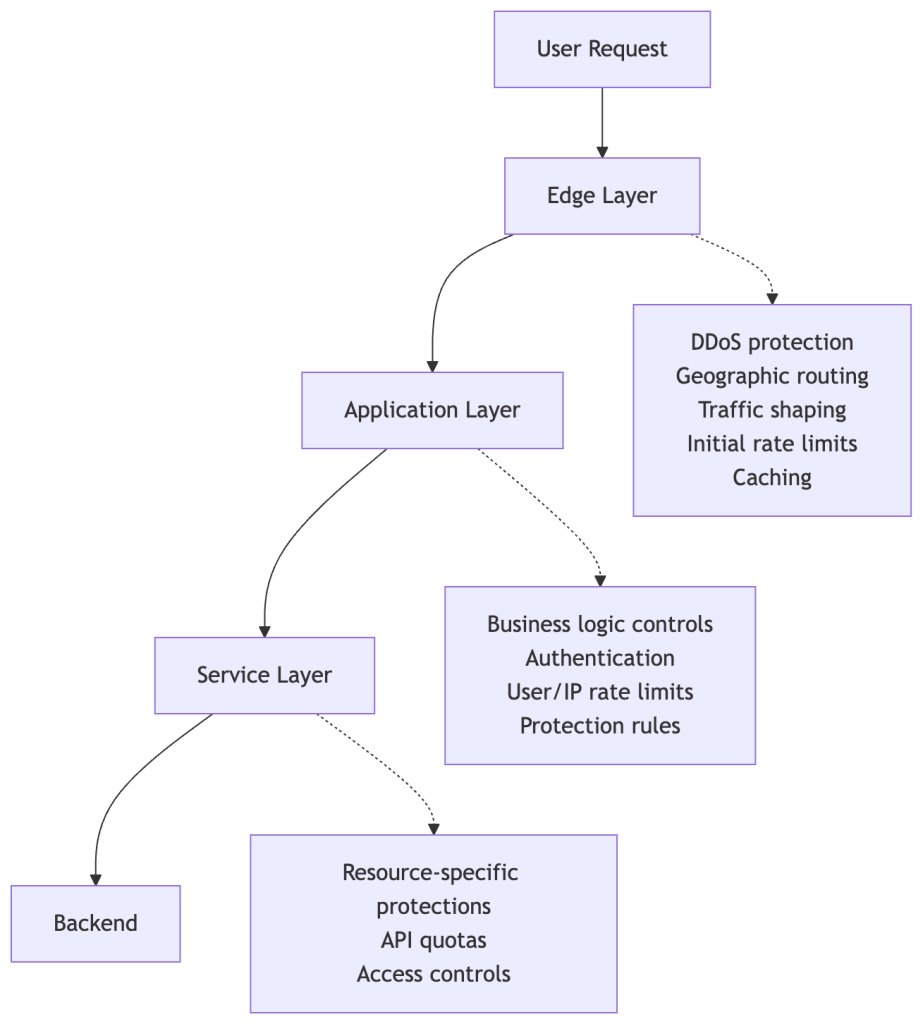
To keep a platform like GitHub available and responsive, it’s critical to build defense mechanisms. A whole lot of them. Rate limits, traffic controls, and protective measures spread across multiple layers of infrastructure. These all play a role in keeping the service healthy during abuse or attacks.

We recently ran into a challenge: Those same protections can quietly outlive their usefulness and start blocking legitimate users. This is especially true for protections added as emergency responses during incidents, when responding quickly means accepting broader controls that aren’t necessarily meant to be long-term. User feedback led us to clean up outdated mitigations and reinforced that observability is just as critical for defenses as it is for features.

We apologize for the disruption. We should have caught and removed these protections sooner. Here’s what happened.

What users reported

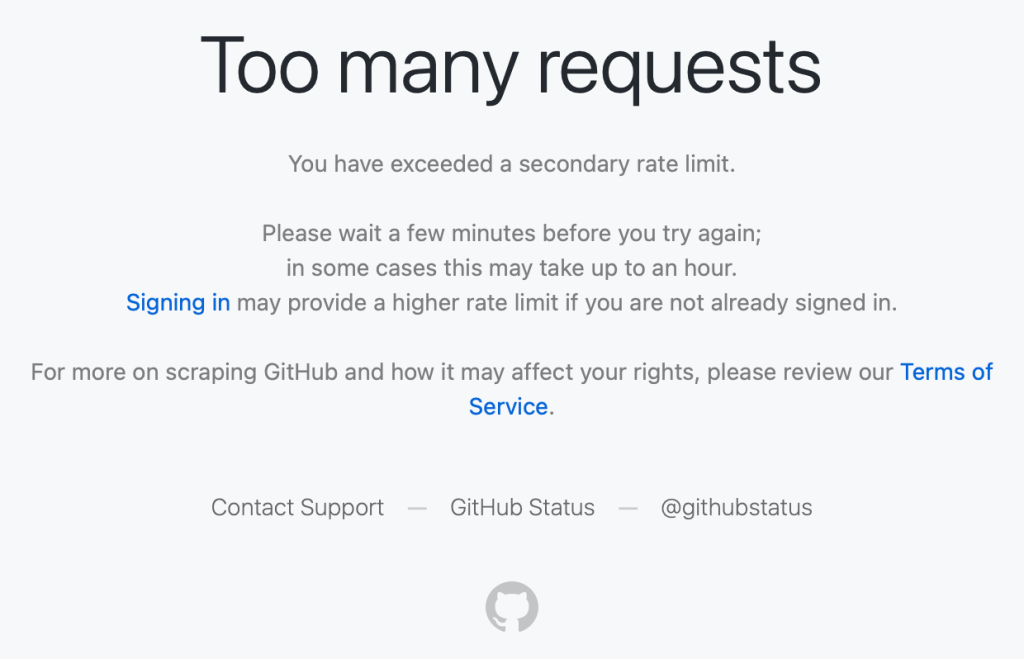
We saw reports on social media from people getting “too many requests” errors during normal, low-volume browsing, such as when following a GitHub link from another service or app, or just browsing around with no obvious pattern of abuse.

Screenshot of a 'Too many requests' screen encountered by users.
Users encountered a “Too many requests” error during normal browsing.

These were users making a handful of normal requests hitting rate limits that shouldn’t have applied to them.

What we found

Investigating these reports, we discovered the root cause: Protection rules added during past abuse incidents had been left in place. These rules were based on patterns that had been strongly associated with abusive traffic when they were created. The problem is that those same patterns were also matching some logged-out requests from legitimate clients.

These patterns are combinations of industry-standard fingerprinting techniques alongside platform-specific business logic — composite signals that help us distinguish legitimate usage from abuse. But, unfortunately, composite signals can occasionally produce false positives.

The composite approach did provide filtering. Among requests that matched the suspicious fingerprints, only about 0.5–0.9% were actually blocked; specifically, those that also triggered the business-logic rules. Requests that matched both criteria were blocked 100% of the time.

Chart showing percentage of fingerprint matches that were blocked by also triggering business-logic rules, fluctuating between 0.5-0.9% over 60 minutes
Not all fingerprint matches resulted in blocks — only those also matching business logic patterns.

The overall impact was small but consistent; however, for the customers who were affected, we recognize that any incorrect blocking is unacceptable and can be disruptive. To put all of this in perspective, the following shows the false-positive rate relative to total traffic.

Chart showing false positives as approximately 0.003-0.004% of total traffic, with a reference line at 100%
False positives represented roughly 0.003-0.004% of total traffic.

Although the percentage was low, it still meant that real users were incorrectly blocked during normal browsing, which is not acceptable. The chart below zooms in specifically on this false-positive pattern over time.

Chart showing false positive rate over 60 minutes, hovering around 0.003-0.004%
In the hour before cleanup, approximately 3-4 requests per 100,000 (0.003-0.004%) were incorrectly blocked.

This is a common challenge when defending platforms at scale. During active incidents, you need to respond quickly, and you accept some tradeoffs to keep the service available. The mitigations are correct and necessary at that moment. Those emergency controls don’t age well as threat patterns evolve and legitimate tools and usage change.

Without active maintenance, temporary mitigations become permanent, and their side effects compound quietly.

Tracing through the stack

The investigation itself highlighted why these issues can persist. When users reported errors, we traced requests across multiple layers of infrastructure to identify where the blocks occurred.

To understand why this tracing is necessary, it helps to see how protection mechanisms are applied throughout our infrastructure. We’ve built a custom, multi-layered protection infrastructure tailored to GitHub’s unique operational requirements and scale, building upon the flexibility and extensibility of open-source projects like HAProxy. Here’s a simplified view of how requests flow through these defense layers (simplified to avoid disclosing specific defense mechanisms and to keep the concepts broadly applicable):

Diagram showing user requests flowing through multiple infrastructure layers (Edge, Application, Service, Backend), with protection mechanisms at each layer including DDoS protection, rate limits, authentication, and access controls.

Each layer has legitimate reasons to rate-limit or block requests. During an incident, a protection might be added at any of these layers depending on where the abuse is best mitigated and what controls are fastest to deploy.

The challenge: When a request gets blocked, tracing which layer made that decision requires correlating logs across multiple systems, each with different schemas.

In this case, we started with user reports and worked backward:

  1. User reports provided timestamps and approximate behavior patterns.
  2. Edge tier logs showed the requests reaching our infrastructure.
  3. Application tier logs revealed 429 “Too Many Requests” responses.
  4. Protection rule analysis ultimately identified which rules matched these requests.

The investigation took us from external reports to distributed logs to rule configurations, demonstrating that maintaining comprehensive visibility into what’s actually blocking requests and where is essential.

The lifecycle of incident mitigations

Here’s how these protections outlived their purpose:

Diagram showing incident mitigation lifecycle: control added during incident, works initially, remains active over time without review, eventually blocks legitimate traffic.

Each mitigation was necessary when added. But the controls where we didn’t consistently apply lifecycle management (setting expiration dates, conducting post-incident rule reviews, or monitoring impact) became technical debt that accumulated until users noticed.

What we did

We reviewed these mitigations, analyzing what each one was blocking today versus what it was meant to block when created. We removed the rules that were no longer serving their purpose, and kept protections against ongoing threats.

What we’re building

Beyond the immediate fix, we’re improving the lifecycle management of protective controls:

  • Better visibility across all protection layers to trace the source of rate limits and blocks.
  • Treating incident mitigations as temporary by default. Making them permanent should require an intentional, documented decision.
  • Post-incident practices that evaluate emergency controls and evolve them into sustainable, targeted solutions.

Defense mechanisms – even those deployed quickly during incidents – need the same care as the systems they protect. They need observability, documentation, and active maintenance. When protections are added during incidents and left in place, they become technical debt that quietly accumulates.

Thanks to everyone who reported issues publicly! Your feedback directly led to these improvements. And thanks to the teams across GitHub who worked on the investigation and are building better lifecycle management into how we operate. Our platform, team, and community are better together!

The post When protections outlive their purpose: A lesson on managing defense systems at scale appeared first on The GitHub Blog.

Running Debian on the OpenWrt One (Collabora Blog)

Post Syndicated from jzb original https://lwn.net/Articles/1054519/

Sjoerd Simons has published
a blog post
about running Debian on the OpenWrt One
router hardware:

With openwrt-one-debian, you can now install and run a full Debian
system leveraging the OpenWrt One’s NVMe storage, enabling everything
from custom services and containers to development tools and
lightweight server workloads, all on open hardware.

This project provides a rust-based flasher to install Debian on the
OpenWrt One, opening the door to standard Debian tooling, packages,
and workflows. For developers and power users, it transforms the
OpenWrt One from a network appliance into a compact, general-purpose
Linux system.

See the GitHub
repository
for the code and latest build. LWN reviewed the device in
November 2024, and covered Denver
Gingerich’s talk at SCALE 22x about
the making of the router in March 2025.

From AI agent prototype to product: Lessons from building AWS DevOps Agent

Post Syndicated from Efe Karakus original https://aws.amazon.com/blogs/devops/from-ai-agent-prototype-to-product-lessons-from-building-aws-devops-agent/

At re:Invent 2025, Matt Garman announced AWS DevOps Agent, a frontier agent that resolves and proactively prevents incidents, continuously improving reliability and performance. As a member of the DevOps Agent team, we’ve focused heavily on making sure that the “incident response” capability of the DevOps Agent generates useful findings and observations. In particular, we’ve been working on making root cause analysis for native AWS applications accurate and performant. Under the hood, DevOps Agent has a multi-agent architecture where a lead agent acts as an incident commander: it understands the symptom, creates an investigation plan, and delegates individual tasks to specialized sub-agents when those tasks benefit from context compression. A sub-agent executes its task with a pristine context window and reports compressed results back to the lead agent. For example, when examining high-volume log records, a sub-agent filters through the noise to surface only relevant messages to the lead agent.

In this blog post, we want to focus on the mechanisms one needs to develop to build an agentic product that works. Building a prototype with large language models (LLMs) has a low barrier to entry – you can showcase something that works fairly quickly. However, graduating that prototype into a product that performs reliably across diverse customer environments is a different challenge entirely, and one that is frequently underestimated. This post shares what we learned building AWS DevOps Agent so you can apply these lessons to your own agent development.

In our experience, there are five mechanisms necessary to continuously improve agent quality and bridge the gap from prototype to production. First, you need evaluations (evals) to identify where your agent fails and where it can improve, while establishing a quality baseline for the types of scenarios your agent handles well. Second, you need a visualization tool to debug agent trajectories and understand where exactly the agent went wrong. Third, you need a fast feedback loop with the ability to rerun those failing scenarios locally to iterate. Fourth, you need to make intentional changes: establishing success criteria before modifying your system to avoid confirmation bias. Finally, you need to read production samples regularly to understand actual customer experience and discover new scenarios your evals don’t yet cover.

Evaluations

Evals are the machine learning equivalent of a test suite in traditional software engineering. Just like building any other software product, a collection of good test cases builds confidence in quality. Iterating on agent quality is similar to test-driven development (TDD): you have an eval scenario that the agent fails (the test is red), you make changes until the agent passes (the test is green). A passing eval means the agent arrived at an accurate, useful output through correct reasoning.

For AWS DevOps Agent, the size of an individual eval scenario is similar to an end-to-end test in the traditional software engineering testing pyramid. Looking through the lens of “Given-When-Then” style tests:

  • Given – The test setup portion tends to be the most time-consuming to author. For the AWS DevOps Agent, an example eval scenario includes an application running on Amazon Elastic Kubernetes Service composed of several microservices fronted by Application Load Balancers, reading and writing from data stores such as Amazon Relational Database Service databases and Amazon Simple Storage Service buckets, with AWS Lambda functions doing data transformations. We inject a fault by deploying a code change that accidentally removes a key AWS Identity and Access Management (IAM) permission to write to S3 deep in the dependency chain.
  • When – Once the fault is injected, an alarm fires, and this triggers the AWS DevOps Agent to start its investigation. The eval framework polls the records that the Agent generates, just like how the DevOps Agent web application renders them. This section isn’t fundamentally different from defining the action in an integration or end-to-end test.
  • Then – This asserts and reports on multiple metrics. Fundamentally, there’s a single “PASS” (1) or “FAIL” (0) metric for quality. For the DevOps Agent’s incident response capability, a “PASS” means the right root cause surfaced to the customer – in our example, this means identifying the faulty deployment as the root cause and tracing the dependency chain to surface the impacted resources and observations that reveal the missing S3 write permission; otherwise “FAIL”. We define this as a rubric: not just “did the agent find the root cause?” but “did the agent arrive at the root cause through the correct reasoning with the right supporting evidence?”The ground truth (the “expected” or “wanted” in software testing parlance) is compared to the system response (the “actual”) via an LLM Judge – an LLM that receives both the ground truth and the agent’s actual output, then emits its reasoning and a verdict on whether they match. We use an LLM for comparison because the agent’s output is non-deterministic: the agent follows an overall output format but generates the actual text freely, so each run may use different words or sentence structures while conveying the same semantic meaning. We don’t want to strictly search for keywords in the final root cause analysis report but rather evaluate whether the essence of the rubric is met.

The evaluation report is structured with scenarios as rows and metrics as columns. Key metrics that we keep track of are capability (pass@k – whether the agent passed at least once in k attempts), reliability (pass^k – how many times the agent passed across k attempts, e.g., 0.33 means passed 1 out of 3 times for k=3), latency, and token usage.

Evaluation results table with two scenario rows. Headers: Scenario, Pass@3, Pass^3, Avg. E2E Latency, Avg. Time-To-First-Observation, and Avg. Total tokens. Lambda throttle scenario shows Pass@3 of 1 and Pass^3 of 1 (highlighted green). SQS permission removal scenario shows Pass@3 of 1 and Pass^3 of 0.33 (highlighted red), indicating it passed only 1 of 3 attempts.

Why are evals important?

There are several benefits to having evals:

  • Red scenarios provide obvious investigation points for the agent development team to increase product quality.
  • Over time, green scenarios act as regression tests, notifying us when changes to the system degrade the existing customer experience.
  • Once pass rates are green, we can improve customer experience along additional metrics. For example, reducing end-to-end latency and/or optimizing cost (proxied by token usage) while maintaining the quality bar.

What makes evals challenging?

Fast feedback loops help developers know whether code works (is it correct, performant, secure) and whether ideas are good (do they improve key business metrics). This may seem obvious, but far too often, teams and organizations tolerate slow feedback loops […] — Nicole Forsgren and Abi Noda, Frictionless: 7 Steps to Remove Barriers, Unlock Value, and Outpace Your Competition in the AI Era

There are several challenges with evals. In decreasing order of difficulty:

  1. Realistic and diverse scenarios are hard to author. Coming up with realistic applications and fault scenarios is difficult. Authoring high fidelity microservice applications and faults is significant work that requires prior industry experience. What we’ve found effective: we author a few “environments” (based on real application architectures) but create many failure scenarios on top of them. The environment is the expensive portion of the evaluation setup, so we maximize reuse across multiple scenarios.
  2. Slow feedback loops. If the “Given” takes 20 minutes to deploy for an eval scenario and then the “When” takes another 10-20 minutes for complex investigations to complete, agent developers won’t thoroughly test their changes. Instead, they’ll be satisfied with a single passing eval, then release to production, potentially introducing regressions until the comprehensive eval report is generated. Additionally, slow feedback loops encourages batching multiple changes together rather than small incremental experiments, making it harder to understand which change actually moved the needle. We’ve found three mechanisms effective for speeding up feedback loops:
    1. Long-running environments for eval scenarios. The application and its healthy state are created once and kept running. Fault injection happens periodically (e.g., over weekends), and developers point their agent credentials at the faulty environment, completely skipping the “Given” portion of the test.
    2. Isolated testing of only the agent surface area that matters. In our multi-agent system, developers can trigger a specific sub-agent directly with a prompt from a past eval run rather than running the entire end-to-end flow. Additionally, we built a “fork” feature: developers can initialize any agent with the conversation history from a failing run up to a specific checkpoint message, then iterate only on the remaining trajectory. Both of these approaches significantly lowers the wait time of the “When” portion.
    3. Local development of the agentic system. If developers must merge changes and release to a cloud environment before testing, the loop is too slow. Running locally enables rapid iteration.

Visualize trajectories

When an agent fails an eval or a production run, where do you start investigating? The most productive method is error analysis. Visualize the agent’s complete trajectory, every user-assistant message exchange including sub-agent trajectories, and annotate each step as “PASS” or “FAIL” with notes on what went wrong. This process is tedious but effective.

For AWS DevOps Agent, agent trajectories map to OpenTelemetry traces and you can use tools like Jaeger to visualize them. Software development kits like Strands provide tracing integration with minimal setup.

Jaeger UI showing a distributed trace for strands-agents with trace ID 941e3b7. The trace spans 25 minutes 17 seconds with 454 total spans across 7 depth levels. The left panel shows a hierarchical tree of service operations including execute_event_loop_cycle, chat, and execute_tool calls for current_time, write_scratchpad, and use_aws. The right panel displays a timeline visualization with horizontal bars representing span durations. The bottom detail panel shows metadata for a selected execute_tool use_aws span, including tags, process information, and logs with gen_ai event data.

Figure 1 – A sample trace from AWS DevOps Agent.

Each span contains user-assistant message pairs. We annotate each span’s quality in a table such as the following:

Error analysis table showing Step 3 with Span ID f182abb7c94a4713. The Description column shows Title: GetQueryResults(Surveying logs) with a JSON content snippet. Duration is T seconds. The Verdict column shows FAIL highlighted in red. The Reasoning column recommends removing @ptr fields, noting the retrieved logs are X tokens and removing @ptr fields from CloudWatch log records can reduce token usage by half.

This low-level analysis consistently surfaces multiple improvements, not just one. For a single failing eval, one will typically identify many concrete changes spanning accuracy, performance, and cost.

Intentional changes

I had learned from my dad the importance of intentionality — knowing what it is you’re trying to do, and making sure everything you do is in service of that goal. — Will Guidara, Unreasonable Hospitality: The Remarkable Power of Giving People More Than They Expect

You’ve identified failing scenarios and diagnosed the issues through trajectory analysis. Now it’s time to modify the system.

The biggest fallacy we’ve observed at this stage: confirmation bias leading to overfitting. Given the eval challenges mentioned earlier (slow feedback loops and the impracticality of comprehensive test suites) developers typically test only the few specific failing scenarios locally until they pass. One modifies the context (system prompt, tool specifications, tool implementations, etc.) until one or two scenarios pass, without considering broader impact. When changes don’t follow context engineering best practices, they likely have negative effects that we can’t capture through limited evals.

You need both diligence and judgment: establish success criteria through available evals and reusable past production scenarios, but also educate yourself on context engineering best practices to guide your changes. We’ve found Anthropic’s prompting best practices and engineering blog, Drew Breunig’s how long contexts fail, and lessons from building Manus particularly helpful resources.

Establish success criteria first

Before making any change, define what success looks like:

  • Baseline. Fix specific git commit IDs for the current system. Think deliberately about which metrics would improve both the agent’s experience and the customer’s experience, then gather those metrics for the baseline.
  • Test scenarios. Which evals will measure your change’s impact? How many times will you rerun these evals? Convince yourself this set represents broader customer patterns, not just the one failure you’re investigating.
  • Comparison. Measure your changes against the baseline using the same metrics.

This intentional framing protects against confirmation bias (interpreting results favorably) and sunk cost fallacy (accepting changes simply because you invested time). If your modifications don’t move the metrics as expected, reject them.

For example, when optimizing a sub-agent within AWS DevOps Agent, we establish a baseline by fixing git commit IDs and running the same scenario seven times. This reveals both typical performance and variance.

Baseline metrics table comparing multiple runs of a sub-agent. Headers: Run, Correct observations, Irrelevant observations, Latency, Sub-agent Tokens, and Lead-agent Tokens. Run 1 shows 4 out of 6 correct observations with 1 irrelevant observation. Run 7 shows 5 out of 6 correct observations with 0 irrelevant observations, demonstrating variance across repeated runs of the same scenario.

Each metric measures a different dimension:

  • Correct observations – How many relevant signals (log records, metric data, code snippets, etc.) that are directly related to the incident did the sub-agent surface?
  • Irrelevant observations – How much noise did the sub-agent introduce to the lead agent? This counts signals that are unrelated to the incident and could distract the agent’s investigation.
  • Latency – How long did the sub-agent take (measured in minutes and seconds)?
  • Sub-agent tokens – How many tokens did the sub-agent to accomplish its task? This serves as a proxy for the cost of running the sub-agent.
  • Lead-agent tokens – How much of the lead agent’s context window is the sub-agent’s input and output consuming? This gives us a tangible way to identify optimization opportunities for the sub-agent tool: can we compress the instructions to the sub-agent or the results it returns?

After establishing the baseline, we compare these metrics against the same measurements with our proposed changes. This makes it clear whether the change is an actual improvement.

Read production samples

We’ve been fortunate to have several Amazon teams adopt AWS DevOps Agent early. A DevOps agent team member on rotation regularly samples real production runs using our trajectory visualization tool (similar to the OpenTelemetry-based visualization discussed earlier, but customized to render DevOps Agent-specific artifacts like root cause analysis reports and observations), marking whether the agent’s output was accurate and identifying failure points. Production samples are irreplaceable; they reveal the actual customer experience. Additionally, reviewing samples continuously refines your intuition of what the agent is good and bad at. When production runs aren’t satisfactory, you have real-world scenarios to iterate against: modify your agent locally, then rerun it against the same production environment until the desired outcome is reached. Establishing rapport with a few critical early adopter teams willing to partner in this way is invaluable. They provide ground truth for rapid iteration and create opportunities to identify new eval scenarios. This tight feedback loop with production data works in conjunction with eval-driven development to form a comprehensive test suite.

Closing thoughts

Building an agent prototype that demonstrates the feasibility of solving a real business problem is an exciting first step. The harder work is graduating that prototype into a product that performs reliably across diverse customer environments and tasks. In this post, we’ve shared five mechanisms that form the foundation for systematically improving agent quality: evals with realistic and diverse scenarios, fast feedback loops, trajectory visualization, intentional changes, and production sampling.

If you’re building an agentic application, start building your eval suite today. Even starting with a handful critical scenarios will establish the quality baseline needed to measure and improve systematically. To see how AWS DevOps Agent applies these principles to incident response, check out our getting started guide.

Efe Karakus

Efe Karakus is a Sr. Software Engineer on the AWS DevOps Agent team, primarily focusing on agent development.

Unlock granular resource control with queue-based QMR in Amazon Redshift Serverless

Post Syndicated from Srini Ponnada original https://aws.amazon.com/blogs/big-data/unlock-granular-resource-control-with-queue-based-qmr-in-amazon-redshift-serverless/

Amazon Redshift Serverless removes infrastructure management and manual scaling requirements from data warehousing operations. Amazon Redshift Serverless queue-based query resource management, helps you protect critical workloads and control costs by isolating queries into dedicated queues with automated rules that prevent runaway queries from impacting other users. You can create dedicated query queues with customized monitoring rules for different workloads, providing granular control over resource usage. Queues let you define metrics-based predicates and automated responses, such as automatically aborting queries that exceed time limits or consume excessive resources.

Different analytical workloads have distinct requirements. Marketing dashboards need consistent, fast response times. Data science workloads might run complex, resource-intensive queries. Extract, transform, and load (ETL) processes might execute lengthy transformations during off-hours.

As organizations scale analytics usage across more users, teams, and workloads, ensuring consistent performance and cost control becomes increasingly challenging in a shared environment. A single poorly optimized query can consume disproportionate resources, degrading performance for business-critical dashboards, ETL jobs, and executive reporting. With Amazon Redshift Serverless queue-based Query Monitoring Rules (QMR), administrators can define workload-aware thresholds and automated actions at the queue level—a significant improvement over previous workgroup-level monitoring. You can create dedicated queues for distinct workloads such as BI reporting, ad hoc analysis, or data engineering, then apply queue-specific rules to automatically abort, log, or restrict queries that exceed execution-time or resource-consumption limits. By isolating workloads and enforcing targeted controls, this approach protects mission-critical queries, improves performance predictability, and prevents resource monopolization—all while maintaining the flexibility of a serverless experience.

In this post, we discuss how you can implement your workloads with query queues in Redshift Serverless.

Queue-based vs. workgroup-level monitoring

Before query queues, Redshift Serverless offered query monitoring rules (QMRs) only at the workgroup level. This meant the queries, regardless of purpose or user, were subject to the same monitoring rules.

Queue-based monitoring represents a significant advancement:

  • Granular control – You can create dedicated queues for different workload types
  • Role-based assignment – You can direct queries to specific queues based on user roles and query groups
  • Independent operation – Each queue maintains its own monitoring rules

Solution overview

In the following sections, we examine how a typical organization might implement query queues in Redshift Serverless.

Architecture Components

Workgroup Configuration

  • The foundational unit where query queues are defined
  • Contains the queue definitions, user role mappings, and monitoring rules

Queue Structure

  • Multiple independent queues operating within a single workgroup
  • Each queue has its own resource allocation parameters and monitoring rules

User/Role Mapping

  • Directs queries to appropriate queues based on:
  • User roles (e.g., analyst, etl_role, admin)
  • Query groups (e.g., reporting, group_etl_inbound)
  • Query group wildcards for flexible matching

Query Monitoring Rules (QMRs)

  • Define thresholds for metrics like execution time and resource usage
  • Specify automated actions (abort, log) when thresholds are exceeded

Prerequisites

To implement query queues in Amazon Redshift Serverless, you need to have the following prerequisites:

Redshift Serverless environment:

  • Active Amazon Redshift Serverless workgroup
  • Associated namespace

Access requirements:

  • AWS Management Console access with Redshift Serverless permissions
  • AWS CLI access (optional for command-line implementation)
  • Administrative database credentials for your workgroup

Required permissions:

  • IAM permissions for Redshift Serverless operations (CreateWorkgroup, UpdateWorkgroup)
  • Ability to create and manage database users and roles

Identify workload types

Begin by categorizing your workloads. Common patterns include:

  • Interactive analytics – Dashboards and reports requiring fast response times
  • Data science – Complex, resource-intensive exploratory analysis
  • ETL/ELT – Batch processing with longer runtimes
  • Administrative – Maintenance operations requiring special privileges

Define queue configuration

For each workload type, define appropriate parameters and rules. For a practical example, let’s assume we want to implement three queues:

  • Dashboard queue – Used by analyst and viewer user roles, with a strict runtime limit set to stop queries longer than 60 seconds
  • ETL queue – Used by etl_role user roles, with a limit of 100,000 blocks on disk spilling (query_temp_blocks_to_disk) to control resource usage during data processing operations
  • Admin queue – Used by admin user roles, without a query monitoring limit enforced

To implement this using the AWS Management Console, complete the following steps:

  1. On the Redshift Serverless console, go to your workgroup.
  2. On the Limits tab, under Query queues, choose Enable queues.
  3. Configure each queue with appropriate parameters, as shown in the following screenshot.

Each queue (dashboard, ETL, admin_queue) is mapped to specific user roles and query groups, creating clear boundaries between query rules. The query monitoring rules implement automated resource governance—for example, the dashboard queue automatically stops queries exceeding 60 seconds (short_timeout) while allowing ETL processes longer runtimes with different thresholds. This configuration helps prevent resource monopolization by establishing separate processing lanes with appropriate guardrails, so critical business processes can maintain necessary computational resources while limiting the impact of resource-intensive operations.

Alternatively, you can implement the solution using the AWS Command Line Interface (AWS CLI).

In the following example, we create a new workgroup named test-workgroup within an existing namespace called test-namespace. This makes it possible to create queues and establish associated monitoring rules for each queue using the following command:

aws redshift-serverless create-workgroup \
  --workgroup-name test-workgroup \
  --namespace-name test-namespace \
  --config-parameters '[{"parameterKey": "wlm_json_configuration", "parameterValue": "[{\"name\":\"dashboard\",\"user_role\":[\"analyst\",\"viewer\"],\"query_group\":[\"reporting\"],\"query_group_wild_card\":1,\"rules\":[{\"rule_name\":\"short_timeout\",\"predicate\":[{\"metric_name\":\"query_execution_time\",\"operator\":\">\",\"value\":60}],\"action\":\"abort\"}]},{\"name\":\"ETL\",\"user_role\":[\"etl_role\"],\"query_group\":[\"group_etl_inbound\",\"group_etl_outbound\"],\"rules\":[{\"rule_name\":\"long_timeout\",\"predicate\":[{\"metric_name\":\"query_execution_time\",\"operator\":\">\",\"value\":3600}],\"action\":\"log\"},{\"rule_name\":\"memory_limit\",\"predicate\":[{\"metric_name\":\"query_temp_blocks_to_disk\",\"operator\":\">\",\"value\":100000}],\"action\":\"abort\"}]},{\"name\":\"admin_queue\",\"user_role\":[\"admin\"],\"query_group\":[\"admin\"]}]"}]' 

You can also modify an existing workgroup using update-workgroup using the following command:

aws redshift-serverless update-workgroup \
  --workgroup-name test-workgroup \
  --config-parameters '[{"parameterKey": "wlm_json_configuration", "parameterValue": "[{\"name\":\"dashboard\",\"user_role\":[\"analyst\",\"viewer\"],\"query_group\":[\"reporting\"],\"query_group_wild_card\":1,\"rules\":[{\"rule_name\":\"short_timeout\",\"predicate\":[{\"metric_name\":\"query_execution_time\",\"operator\":\">\",\"value\":60}],\"action\":\"abort\"}]},{\"name\":\"ETL\",\"user_role\":[\"etl_role\"],\"query_group\":[\"group_etl_load\",\"group_etl_replication\"],\"rules\":[{\"rule_name\":\"long_timeout\",\"predicate\":[{\"metric_name\":\"query_execution_time\",\"operator\":\">\",\"value\":3600}],\"action\":\"log\"},{\"rule_name\":\"memory_limit\",\"predicate\":[{\"metric_name\":\"query_temp_blocks_to_disk\",\"operator\":\">\",\"value\":100000}],\"action\":\"abort\"}]},{\"name\":\"admin_queue\",\"user_role\":[\"admin\"],\"query_group\":[\"admin\"]}]"}]'

Best practices for queue management

Consider the following best practices:

  • Start simple – Begin with a minimal set of queues and rules
  • Align with business priorities – Configure queues to reflect critical business processes
  • Monitor and adjust – Regularly review queue performance and adjust thresholds
  • Test before production – Validate query metrics behavior in a test environment before applying to production

Clean up

To clean up your resources, delete the Amazon Redshift Serverless workgroups and namespaces. For instructions, see Deleting a workgroup.

Conclusion

Query queues in Amazon Redshift Serverless bridge the gap between serverless simplicity and fine-grained workload control by enabling queue-specific Query Monitoring Rules tailored to different analytical workloads. By isolating workloads and enforcing targeted resource thresholds, you can protect business-critical queries, improve performance predictability, and limit runaway queries, helping minimize unexpected resource consumption and better control costs, while still benefiting from the automatic scaling and operational simplicity of Redshift Serverless.

Get started with Amazon Redshift Serverless today.


About the authors

Srini Ponnada

Srini is a Sr. Data Architect at Amazon Web Services (AWS). He has helped customers build scalable data warehousing and big data solutions for over 20 years. He loves to design and build efficient end-to-end solutions on AWS.

Niranjan Kulkarni

Niranjan is a Software Development Engineer for Amazon Redshift. He focuses on Amazon Redshift Serverless adoption and Amazon Redshift security-related features. Outside of work, he spends time with his family and enjoys watching high-quality TV series.

Ashish Agrawal

Ashish is currently a Principal Technical Product Manager with Amazon Redshift, building cloud-based data warehouses and analytics cloud services solutions. Ashish has over 24 years of experience in IT. Ashish has expertise in data warehouses, data lakes, and platform as a service. Ashish is a speaker at worldwide technical conferences.

Davide Pagano

Davide is a Software Development Manager with Amazon Redshift, specialized in building smart cloud-based data warehouses and analytics cloud services solutions like automatic workload management, multi-dimensional data layouts, and AI-driven scaling and optimizations for Amazon Redshift Serverless. He has over 10 years of experience with databases, including 8 years of experience tailored to Amazon Redshift.

Establishing finops management: Integrating AWS Budgets with WhatsApp using AWS End User Messaging

Post Syndicated from Ruchikka Chaudhary original https://aws.amazon.com/blogs/messaging-and-targeting/establishing-finops-management-integrating-aws-budgets-with-whatsapp-using-aws-end-user-messaging/

Managing cloud costs effectively is a critical concern for organizations of all sizes. While AWS Budgets provides powerful tools to set spending thresholds and receive notifications, these alerts traditionally arrive through email or through AWS Management Console notifications. These traditional notification methods face several challenges when managing cloud costs:

  • Email notifications might not be seen immediately
  • Important budget alerts can get lost in crowded inboxes
  • Team members might not have immediate access to their email or the console
  • Global teams need accessible alerting mechanisms that work across time zones

Today, we’re sharing a solution that brings AWS Budgets alerts directly to your WhatsApp using AWS End User Messaging—enabling real-time cost awareness and faster response to budget thresholds wherever you are.

Overview of solution

Our solution integrates AWS Budgets with WhatsApp messaging using AWS End User Messaging, AWS Lambda, and Amazon Simple Notification Service (Amazon SNS). When a budget threshold is crossed, the alert is processed and delivered as a formatted WhatsApp message to designated recipients.

The architecture, shown in the following figure, consists of four main AWS services to deliver budget alerts. AWS Budgets tracks expenses against your defined thresholds. When expenses exceed these thresholds, Amazon SNS receives an alert. An AWS Lambda function processes this alert and sends it through AWS End User Messaging to WhatsApp. Users then receive actionable budget notifications directly on their WhatsApp.

Billing and Cost Management data, which AWS Budgets uses to monitor resources, is updated at least once per day. Keep in mind that budget information and associated alerts are updated and sent according to this data refresh cadence. In a budget period,

notifications are triggered every time the notification state goes from OK to Exceeded (when the threshold is exceeded). If the budget stays in Exceeded state in the same budget period, AWS Budgets doesn’t send an additional alert.

Prerequisites

Implementation requires an AWS account with appropriate permissions for AWS CloudFormation, Lambda, Amazon SNS, and AWS Budgets. You must also have a WhatsApp Business Account integrated with AWS End User Messaging Social and the WhatsApp phone number ID from the AWS End User Messaging console. For instructions to locate this information, see View a phone number’s ID in AWS End User Messaging Social.

For more information about how to set up WhatsApp using AWS End User Messaging Social, see Automate workflows with WhatsApp using AWS End User Messaging Social.

Before you deploy this solution, create an approved utility template in your Meta account named aws_budgets_notification_template(as shown in the following screenshot). Alternatively, use your preferred template name and modify the Lambda function code accordingly.

The preceding figure shows variable samples that can be used while creating a message template. You can also use the following AWS Command Line Interface (AWS CLI) command to create the messaging template-

aws socialmessaging create-whatsapp-message-template \
  --region <region> \
  --id <waba-id> \
  --template-definition "$(echo '{
    "name": "aws_budgets_notification_template",
    "language": "en",
    "category": "UTILITY",
    "parameter_format": "named",
    "components": [
      {
        "type": "HEADER",
        "format": "TEXT",
        "text": "{{emoji}} Budget Alert",
        "example": {
          "header_text_named_params": [
            {"param_name": "emoji", "example": "💰"}
          ]
        }
      },
      {
        "type": "BODY",
        "text": "Subject: {{subject}}\\nDetails: {{notification_title}}\\nAWS Account {{account_info}}\\n\\n{{notification_msg}}\\n\\nBudget Name: {{budget_name}}\\nBudget Type: {{budget_type}}\\nBudgeted Amount: {{budgeted_amount}}\\nAlert Type: {{alert_type}}\\nAlert Threshold: {{alert_threshold}}\\nFORECASTED Amount: {{forecasted_amount}}\\n\\nAWS Console: {{console_link}}\\n\\nTime: {{time}}\\n\\nTip: Check your AWS Billing Dashboard for detailed cost breakdown",
        "example": {
          "body_text_named_params": [
            {"param_name": "subject", "example": "AWS Budgets: Budget-Cloudwatch-budget-dev has exceeded your alert threshold"},
            {"param_name": "notification_title", "example": "AWS Budget Notification Oct 19, 2025"},
            {"param_name": "account_info", "example": "AWS Account 12345"},
            {"param_name": "notification_msg", "example": "You requested that we alert you when the FORECASTED Cost associated with your Budget-Cloudwatch-dev Budget is greater"},
            {"param_name": "budget_name", "example": "Budget-Cloudwatch-budget-dev"},
            {"param_name": "budget_type", "example": "Cost"},
            {"param_name": "budgeted_amount", "example": "$1"},
            {"param_name": "alert_type", "example": "Cost"},
            {"param_name": "alert_threshold", "example": "> 1"},
            {"param_name": "forecasted_amount", "example": "$2"},
            {"param_name": "console_link", "example": "https://console.aws.amazon.com/billing/home#/budgets"},
            {"param_name": "time", "example": "2025-10-19 12:38:52 UTC"}
          ]
        }
      }
    ]
  }' | base64)"

You can confirm the template approval status and type in the Meta portal.

Solution walkthrough

The core component consists of a Python-based Lambda function that processes Budget alerts and formats them for WhatsApp delivery. The function receives SNS events containing budget alerts data, extracts relevant information, formats contextual messages, and delivers notifications through AWS End User Messaging Social.The following function shows an example to parse the SNS message content:

 def process_notification(record):
"""Process SNS notification and send WhatsApp message"""
sns_message = record['Sns']
subject = sns_message.get('Subject', 'AWS Notification')
message_body = sns_message.get('Message', '')

logger.info(f"Processing notification - Subject: {subject}")
process_budget_notification(subject, message_body)

The following example demonstrates how to format alert information—including subject, details, and timestamp—and deliver the message to WhatsApp.

#Create template message with parsed values
template_name = "aws_budgets_notification_template"
template_message = {
    "name": template_name,
    "language": {
        "code": "en"
    },
    "components": [
        {
            "type": "header",
            "parameters": [{
                "type": "text",
                "parameter_name": "emoji",
                "text": "💰"
            }]
        },
        {
            "type": "body",
            "parameters": [
                {
                    "type": "text",
                    "parameter_name": "subject",
                    "text": subject
                },
                {
                    "type": "text",
                    "parameter_name": "notification_title",
                    "text": notification_title
                },
                {
                    "type": "text",
                    "parameter_name": "account_info",
                    "text": f"AWS Account {account_number}"
                },
                {
                    "type": "text",
                    "parameter_name": "notification_msg",
                    "text": notification_msg + "."
                },
                {
                    "type": "text",
                    "parameter_name": "budget_name",
                    "text": budget_details.get('Budget Name', '')
                },
                {
                    "type": "text",
                    "parameter_name": "budget_type",
                    "text": budget_details.get('Budget Type', '')
                },
                {
                    "type": "text",
                    "parameter_name": "budgeted_amount",
                    "text": budget_details.get('Budgeted Amount', '')
                },
                {
                    "type": "text",
                    "parameter_name": "alert_type",
                    "text": budget_details.get('Alert Type', '')
                },
                {
                    "type": "text",
                    "parameter_name": "alert_threshold",
                    "text": budget_details.get('Alert Threshold', '')
                },
                {
                    "type": "text",
                    "parameter_name": "forecasted_amount",
                    "text": budget_details.get('FORECASTED Amount', '')
                },
                {
                    "type": "text",
                    "parameter_name": "console_link",
                    "text": "https://console.aws.amazon.com/billing/home#/budgets"
                },
                {
                    "type": "text",
                    "parameter_name": "time",
                    "text": datetime.now().strftime('%Y-%m-%d %H:%M:%S UTC')
                }
            ]
        }
    ]
}
send_whatsapp_message(template_message)

The send_whatsapp_message function uses AWS End User Messaging Social to deliver formatted messages through the socialmessaging client, as shown in the following example:

def send_whatsapp_message(message):
  client = boto3.client('socialmessaging')
  # Get environment variables
  phone_number_id = os.environ.get('WHATSAPP_PHONE_NUMBER_ID')
  recipient = os.environ.get('ALERT_RECIPIENT')
                    
# Prepare message object
  message_object = {
"messaging_product": "whatsapp",
"recipient_type": "individual",
"to": recipient,
"type": "template",
"template": message
}
  # Send message
response = client.send_whatsapp_message(
originationPhoneNumberId=phone_number_id,
metaApiVersion="v20.0",
message=bytes(json.dumps(message_object), "utf-8")  
)

Deploying the solution

The solution uses AWS CloudFormation for infrastructure as code (IaC) deployment. The main template creates an SNS topic for alert notifications, a Lambda function for message processing, and required AWS Identity and Access Management (IAM) roles with least-privilege permissions.

The CloudFormation template requires a recipient number with an active WhatsApp account to receive alert notifications as messages. The template also requires the WhatsApp phone number ID retrieved from the AWS End User Messaging Social console, as noted in the prerequisites. The template must be deployed in the same AWS Region as AWS End User Messaging Social. See the following code:

aws cloudformation deploy \
  --template-file <> \
  --stack-name budget-eum-whatsapp-alerts \
  --parameter-overrides \
    ActualSpendThreshold= \
    AlertRecipient=<+1234567890> \
    BudgetAmount=<Budget Amount e.g. 3000> \
    Environment= \
    ForecastedSpendThreshold= \
    WhatsAppPhoneNumberId= \
  --capabilities CAPABILITY_NAMED_IAM \
  --region <EUM-region>

Testing the solution

The solution can be tested and validated using the SNS topic created by the CloudFormation stack. Use the following AWS CLI command to publish a test message to the SNS topic:

aws sns publish \
  --topic-arn arn:aws:sns:<region>:<account>:<topic-name> \
  --subject "[Test] AWS Budget Alert: Budget-Alert-EUM has exceeded 80% of your budgeted amount" \
  --message "AWS Budget Notification - Your budget has exceeded the alert threshold
AWS Account 123456789012
Budget Name: Budget-Alert-EUM
Budget Type: Cost
Budgeted Amount: $100.00
Alert Type: ACTUAL
Alert Threshold: 80%
FORECASTED Amount: $85.00
You have exceeded 80% of your budget for this period" \
  --region <region>

The SNS message triggers the Lambda function, which sends the alert to your configured WhatsApp recipient, as shown in the following screenshot.

Clean up

Use the following steps to clean up your resources when you no longer need this solution:

  1. Delete the CloudFormation stack deployed in this solution: budget-eum-whatsapp-alerts. 
  2. Delete the template in your Meta account.

Conclusion

Integrating AWS Budgets alerts with WhatsApp notifications represents a significant step forward in modern cost monitoring. By using AWS End User Messaging Social, you can send teams critical alerts through their preferred communication channel while maintaining the reliability and scalability of AWS services. The solution’s modular architecture, basic yet effective security model, and cost-effective design make it suitable for organizations of various sizes.


About the authors

Адски сме толерантни!

Post Syndicated from Светла Енчева original https://www.toest.bg/adski-sme-tolerantni/

Адски сме толерантни!

Социолозите, които се занимават с изследване на общественото мнение, знаят (или поне би трябвало да знаят), че понякога респондентите дават т.нар. социално желателни отговори. Тоест казват това, което смятат, че е престижно или че се очаква от тях. Това нерядко води до грешки в предизборните проучвания и в екзитполовете – ако хората мислят да гласуват или тъкмо са пуснали бюлетина за партия, за която смятат, че не е престижно да дадат гласа си, е доста вероятно да поизлъжат. Понякога проучванията включват контролни въпроси, чиято цел е да се установи дали респондентите отговарят искрено, или по-скоро се опитват да се харесат. При кратки анкети, каквито са екзитполовете например, това не е подходящ вариант.

Колко толерантно е населението на България към ЛГБТИ хората?

На този въпрос търси отговор национално представително изследване, проведено от „Алфа Рисърч“ сред 1000 респонденти по поръчка на Фондация GLAS. На директното питане дали са съгласни с твърдението „Аз съм толерантен към ЛГБТИ хората“, близо половината (49,7%) отговарят утвърдително. Не се възприемат като толерантни малко над една трета – 35,6%, а 14,7% се затрудняват да преценят.


Аз съм толерантен към ЛГБТИ хората
Чувствам се комфортно при вида на еднополова двойка, която се държи за ръце
Не би ме притеснило, ако знаех, че преподавател в училището на детето ми е ЛГБТИ
Ограничаването на правата на ЛГБТ хората води до изтичане на квалифицирани млади кадри в чужбина
Бих позволил(а) на детето ми да си играе в дома на свой приятел, чиито родители са еднополова двойка
Еднополовите двойки трябва да имат правото да легализират партньорските си отношения чрез фактическо съжителство
Транссексуалните хора трябва да могат да променят своите документи, така че да съответстват на тяхната полова идентичност
Бих се чувствал(а) комфортно, ако работя с ЛГБТИ човек
Публичното подбуждане към омраза във връзка с ЛГБТИ хората трябва да се наказва като престъпление
Отношението ми към близък човек (дете, брат, сестра, роднина) не би се променило, ако разбера, че той/тя/те са ЛГБТИ
Равният достъп на ЛГБТ хората до социални, здравни и образователни услуги е важен за общественото благосъстояние
Поправките в ЗПУО по-скоро изостриха конфронтацията между хората в обществото или по-скоро допринесоха за подобряване на средата и живота на хората в България?
Средни стойности на толерантност и нетолерантност
Някои от оригиналните въпроси са леко преформулирани с цел отговорите да се подредят в единна скала и с цел съкращаване.
Източник: Alpha Research, GLAS Foundation.


Такива общи твърдения са особено благодатни за контролни въпроси – хората могат да разбират под „толерантност“ много различни неща. Изследването предлага на респондентите да се позиционират спрямо повече от 10 твърдения, за да се получи по-ясна представа за действителната им толерантност към ЛГБТИ хората. Очаквано, резултатите доста се разминават с декларираната толерантност.

Можете ли да предположите какво кара близо 60% (59,2%) от населението да се чувства некомфортно?

Двама души от един и същи пол, които… се държат за ръце.

По тази тема анкетираните показват най-високо неодобрение, а тези, които не са сигурни, са най-малко – едва 10,3% (при средно за контролните въпроси 22,5%). Тук следва да се отбележи, че все пак не всички са посочили с еднаква категоричност, че се чувстват некомфортно – крайно некомфортно им е на 30,9%, докато 28,3% изпитват умерен дискомфорт. В проучването липсва въпрос за целуване, но ако от едното държане на ръце хората реагират така, може би при проява на по-голяма еднополова интимност някои от най-негативно реагиращите биха имали нужда от медицинска помощ.

На второ място по степен на неприемане се подреждат ЛГБТИ учителите – 54,2% биха се притеснявали, ако детето им има такъв учител. Почти толкова (54,1%) не са съгласни с твърдението, че ограничаването на правата на ЛГБТ хората води до изтичане на квалифицирани млади кадри в чужбина. Макар че 44,8% биха се чувствали некомфортно да работят с „такива хора“.

Независимо какво смята мнозинството от населението в България обаче, много ЛГБТ хора напускат страната тъкмо по тази причина. Един от тях – Борислав Герасимов – преди няколко години направи за несъществуващия вече сайт out.bg поредицата „Немили-недраги“ – 12 интервюта с ЛГБТ емигранти и 7 лични разказа, от които става ясно как дискриминацията прогонва млади хора. Пред „Тоест“ той пое ангажимента да ги публикува отново онлайн.

52,7% пък не биха пуснали детето си да си играе в дома на приятелче, чиито родители са от един и същи пол.

Близо половината (47,9%) не са съгласни, че фактическото съжителство на еднополовите двойки трябва да се легализира, срещу малко над една четвърт, които смятат, че трябва. За сравнение – 37,5% биха искали правно признаване на съжителството на хетеросексуални двойки, а почти толкова (36,7%) са против. Същевременно 51,7% смятат, че имуществените и неимуществените отношения на хората в съжителство, които не са сключили брак, трябва да бъдат регулирани от закона както на двойките в брак. Но изглежда, за много хора това не включва легализиране на съжителството, още по-малко пък на еднополовите двойки.

След кампанията срещу Истанбулската конвенция, в която взеха дейно участие Конституционният съд и Върховният касационен съд, 46,3% не са съгласни транссексуалните да могат да сменят юридическия си пол. А според 40,7% публичното подбуждане към омраза към ЛГБТИ хората не трябва да се наказва като престъпление (спрямо 34,3%, според които трябва, и една четвърт, които нямат мнение).

Едва една трета от хората в България казват, че биха променили отношението си към близък човек, ако научат, че е ЛГБТИ.

Като имаме предвид обаче, че близо 60% се скандализират при вида на хора от един и същи пол, държащи се за ръце, можем да предположим, че често пъти запазването на доброто отношение към близкия ЛГБТИ човек си има цена – да не „парадира“, да не му личи, да не научат хората, че какво ще си кажат… Има и родители и близки, които реагират в стил „не ме интересува, не искам да знам, това си е твоя работа“, смятайки, че по този начин не са променили отношението си към човека.

Цели 56% смятат, че равният достъп на ЛГБТ хората до социални, здравни и образователни услуги е важен за общественото благосъстояние, срещу 21,4%, които не мислят така. Едва 15,6% смятат, че законодателната промяна, забраняваща т.нар. ЛГБТ пропаганда в училище, е довела до подобрение, а според 45,1% тя е изострила конфронтацията между хората. Близо 40% обаче не са сигурни, което е най-високият дял на нямащи мнение за цялото проучване.

Като теглим чертата, средното равнище на толерантност при отговорите на контролните въпроси е 34,8%, а на нетолерантност – 42,7% – картина, доста по-различна от декларираната.

Добрите новини

Макар данните от проучването да изглеждат обезсърчаващи за отношението на българското население към ЛГБТИ хората, съвсем не всичко е толкова черно. „Алфа Рисърч“ провежда това изследване за трета поредна година, което позволява да се забележи известно положително развитие.

Например подкрепата за легализиране на съжителството и регулиране на имуществените и неимуществените отношения между партньори от един пол, макар и недостатъчна, нараства с около 5 процентни пункта, а в сравнение с 2023 г. – с почти една трета.

Така че държавата има все по-малко основание да не изпълнява решенията на европейски съдилища,

според които трябва да се намери форма на правно признаване на еднополовите бракове, сключени в чужбина.

Изследването отчита също, че за младите е далеч по-лесно да общуват, учат и работят с ЛГБТИ хора, отколкото за по-възрастните. Все пак голяма част от поколението Z не помни времето, когато е нямало „София прайд“, и за него видимостта на тази група от населението е част от пейзажа.

Също така очевидно пропагандата си има граници. Промяната в Закона за предучилищното и училищното образование не консолидира обществото срещу ЛГБТИ хората, а по-скоро му показа, че както би казал Хамлет, „има нещо гнило в Дания“. Макар близо 40% да се затрудняват да оценят поправките в закона, по-малко от 16% ги одобряват.

Най-добрата новина всъщност е, че толерантността продължава да е ценност.

В противен случай хората не биха се изкарвали по-толерантни, отколкото са всъщност. А като се има предвид дългогодишната пропаганда против „толерастията“, както и в какво се превръща светът в последните години, никак не се разбира от само себе си, че толерантността все още се възприема като нещо добро.

Тук немалко ЛГБТИ хора и експерти в областта на човешките права биха казали, че толерантността не е достатъчна дори когато е действителна. Защото тя означава търпимост и нищо повече. Истинското приемане отива отвъд толерантността – едно е просто да търпиш някого, друго е да го смяташ за толкова ценна част от обществото, колкото си и ти.

Но и едната толерантност е нещо в среда като българската и в свят, в който емпатията все повече се презира, а грубата сила е на все по-голяма почит. Въпреки че нашенската толерантност, както става ясно от изследването, прилича повече на пътя към ада, който, казват, бил постлан с много добри намерения.

[$] Removing a pointer dereference from slab allocations

Post Syndicated from corbet original https://lwn.net/Articles/1053870/

Al Viro does not often stray outside of the core virtual filesystem area;
when he does, it is usually worthy of note. Recently, he wandered into
memory management with this patch
series
to the slab allocator and some of its users. Kernel developers
will often put considerable effort into small optimizations, but it is
still interesting to look at just how much effort has gone toward the purpose of
avoiding a single pointer dereference in some memory-allocation hot paths.

A note for MXroute users

Post Syndicated from jzb original https://lwn.net/Articles/1054410/

We have recently noticed that email from LWN.net seems to be
blocked by MXroute. Unfortunately, the company also does not seem to
have a way for non-customers to report problems in mail delivery, so
we have no good way to get ourselves unblocked.

As a result, readers who have subscribed to an LWN mailing list
from a domain hosted with MXroute will probably not receive our
mailings. We have not yet unsubscribed addresses that are being
blocked by MXroute, but will soon if the problem persists. Please
accept our apologies for the inconvenience; it is unfortunate that it
is becoming so difficult to send legitimate email as a small
business.

The collective thoughts of the interwebz