Post Syndicated from Pradeep Misra original https://aws.amazon.com/blogs/big-data/enhance-governance-with-metadata-enforcement-rules-in-amazon-sagemaker/
The next generation of SageMaker brings together widely adopted AWS machine learning and analytics capabilities, delivering an integrated experience with unified access to all data. Amazon SageMaker Lakehouse supports unified data access, and Amazon SageMaker Catalog, built on Amazon DataZone, offers catalog and governance features to meet enterprise security needs. Amazon SageMaker Catalog now supports metadata rules allowing organizations to enforce metadata standards across data publishing and subscription workflows.
A rule is a formal agreement that enforces specific metadata requirements across user workflows (e.g., publishing assets to the catalog, requesting data access) within the Amazon SageMaker Unified Studio portal. For instance, a metadata enforcement rule can specify the required information for creating a subscription request or publishing a data asset or a data product to the catalog, ensuring alignment with organizational standards. Metadata rules also enable the creation of custom approval workflows for subscriptions to assets, using collected metadata to facilitate access decisions or auto-fulfillment—outside of SageMaker.
By standardizing metadata practices, Amazon SageMaker Catalog enables customers to meet compliance requirements, enhance audit readiness, and streamline access workflows for greater efficiency and control. One such customer is Amazon Shipping Tech, which uses SageMaker Catalog for cataloging, discovery, sharing, and governance across their data ecosystem:
“We’re building an Analytics Ecosystem to drive discovery across the organization—but without consistent metadata, even our most valuable data can go unused. This feature empowers more teams to actively contribute to metadata curation with the right governance in place. It allows us to set clear standards for data producers while streamlining the collection of required subscription details—no extra templates needed. By enforcing standard metadata attributes, we improve discoverability, add context to each request, and strengthen support for analytics and GenAI solutions.”
— Saurabh Pandey, Principal Data Engineer at Amazon Shipping Tech
Sample use-cases
Metadata rules could help in the following use cases:
- A producer at an automobile company is preparing to publish a new dataset into the organization’s data catalog. The domain owner for the automotive domain requires that the producer include metadata fields such as Model Year, Region, and Compliance Status. Before the dataset can be published, automated checks make sure that these fields are correctly filled out according to the predefined standards.
- A consumer is requesting access to data assets in SageMaker. To meet organization standards and support audit and reporting needs, they must complete the subscription request, fill out a detailed form that includes the project purpose, and attach an email link with pre-approval and compliance training evidence to request subscription for financial data product. The data owner reviews the request, checking that all required metadata are provided before granting access.
Key benefits
Key benefits of new metadata enforcement rules include:
- Enhanced control for domain (unit) owners – Admins can enforce additional metadata fields on subscription and publishing workflows, which must be adhered to by data users. This process supports thorough reviews and enforces organizational compliance.
- Custom workflow support – You can create custom workflows for fulfilling subscriptions on non-managed assets by capturing essential metadata from data consumers. This metadata is used to configure access or support specific business requirements.
In this post, we guide you through two workflows: setting up metadata enforcement rules for a specific domain and publishing an asset or data product in a catalog, and setting up metadata enforcement rules for a specific domain and subscribing to an asset or data product that is owned by a project within that domain.
Solution Overview: Metadata Enforcement for Publishing
In this solution, we’ll walk through two workflows: setting up metadata enforcement for publishing, and setting up metadata enforcement for subscription.
Prerequisites
To follow this post, you should have a SageMaker Unified Studio domain set up with a domain owner or domain unit owner privileges. For instructions, refer to the following Getting started guide.
Set up metadata enforcement for publishing
In this section, we show you how to set up metadata rules for a specific domain as a domain admin. We also explain what happens when you publish an asset or data product in a catalog with these rules applied.
Create a domain unit for the marketing team
As a domain admin, complete the following steps:
- On the SageMaker Unified Studio console, choose the Govern dropdown menu and choose Domain units.

- Choose CREATE DOMAIN UNIT.

- Provide details shown in the following screenshot and choose CREATE DOMAIN UNIT.


You can see the domain unit as shown in the following screenshot.

Enable a metadata form creation policy in the Marketing domain unit
Complete the following steps:
- Navigate to the AUTHORIZATION POLICIES tab in the Marketing domain unit and choose Metadata form creation policy.

- Choose ADD POLICY GRANT.

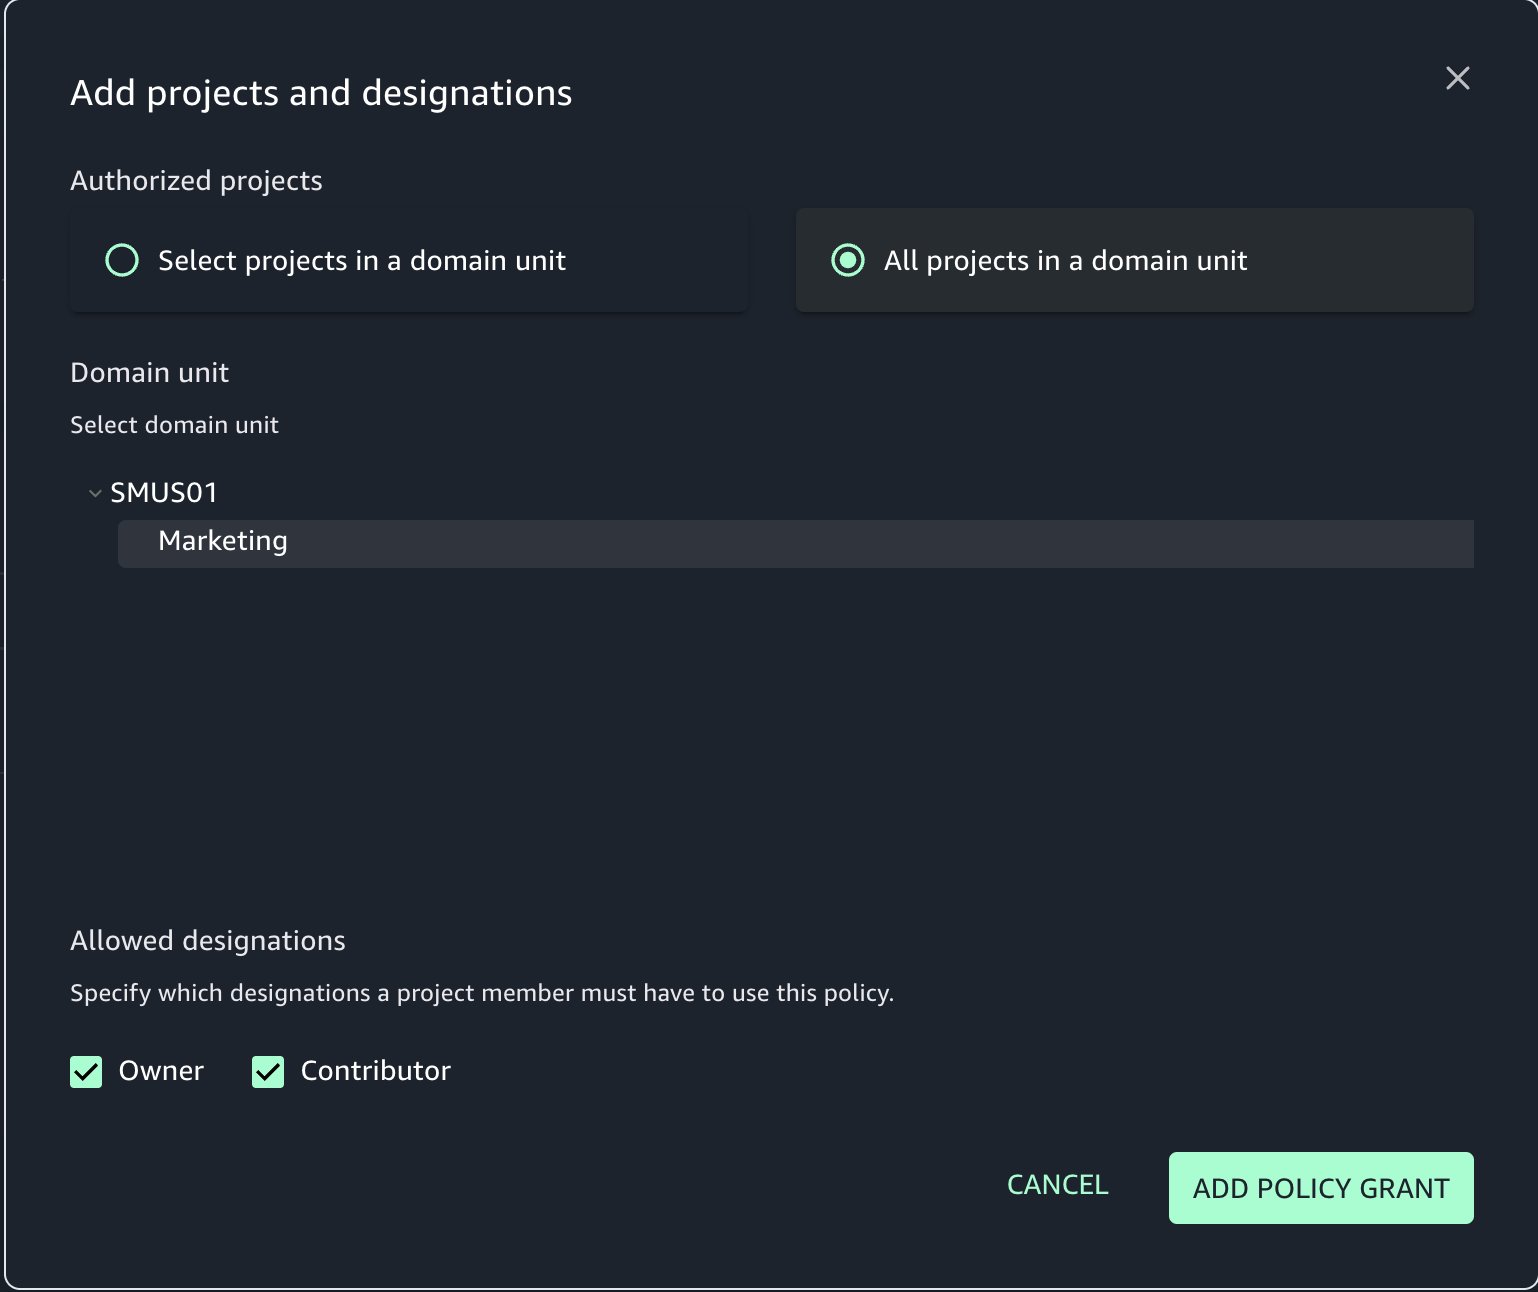
- Select All projects in a domain unit and add a policy grant.
- You can also select specific projects that can create metadata forms.
- Choose ADD POLICY GRANT.


You can see the policy now created for the Marketing domain unit.

Create a metadata form to be enforced for assets before publishing
To create a metadata form, complete the following steps:
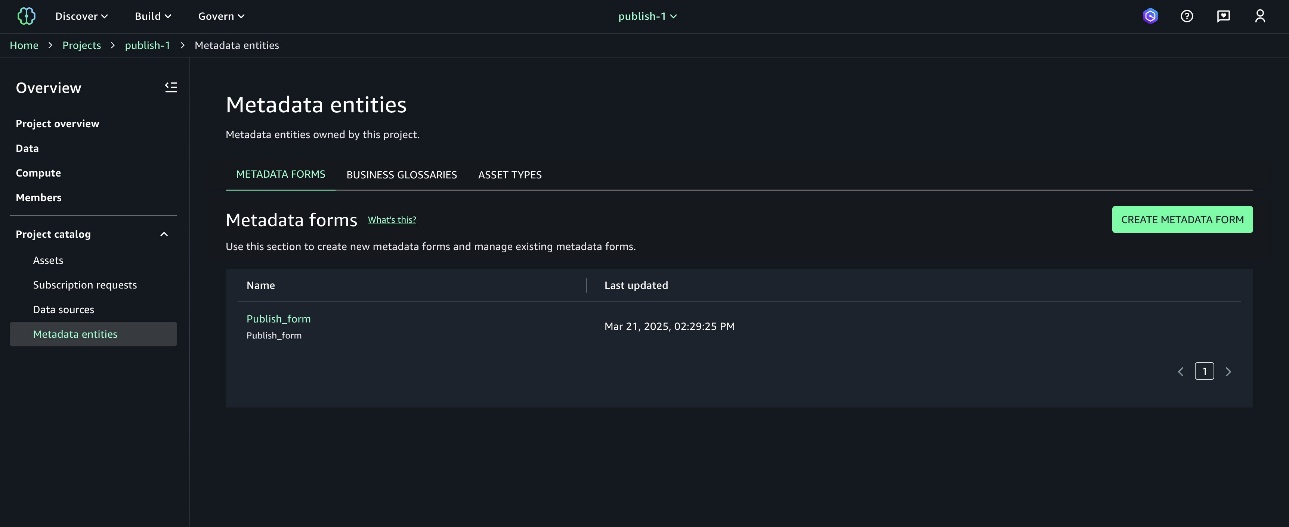
- In the
publish-1project, choose Metadata entities under Project catalog in the navigation pane. - On the Metadata forms tab, choose CREATE METADATA FORM.

- Provide a display name, technical name, and description.
- Choose CREATE METADATA FORM.

- After you create the form, you can choose CREATE FIELD to enforce fields that should be there in all published assets.

- Provide details as shown in the following screenshot.
- Select Searchable, Required, and Publishing because these fields are required before publishing.
- Choose CREATE FIELD.

- Add another field as shown in the following screenshot.


Both fields created with the Publishing action will require values before publishing to the catalog.

Create rules for asset publishing
Complete the following steps:
- In the
publish-1 - Choose the Marketing domain unit.

- On the Rules tab, choose ADD.

- Create the rule configuration with details in the following screenshot and add the metadata form created in the previous step.
- You can select the scope of enforcement by asset type and projects.
- Choose ADD RULE to create the rule.


The publishing enforcement rule publish_rules is now created.

Create a project in the Marketing domain unit
Create a project named publish-1 in the Marketing domain unit. To learn how to create a project, refer to Create a project.
Create an asset in the project
Rules work on assets managed by the SageMaker Catalog or on custom assets. To create an asset, complete the following steps:
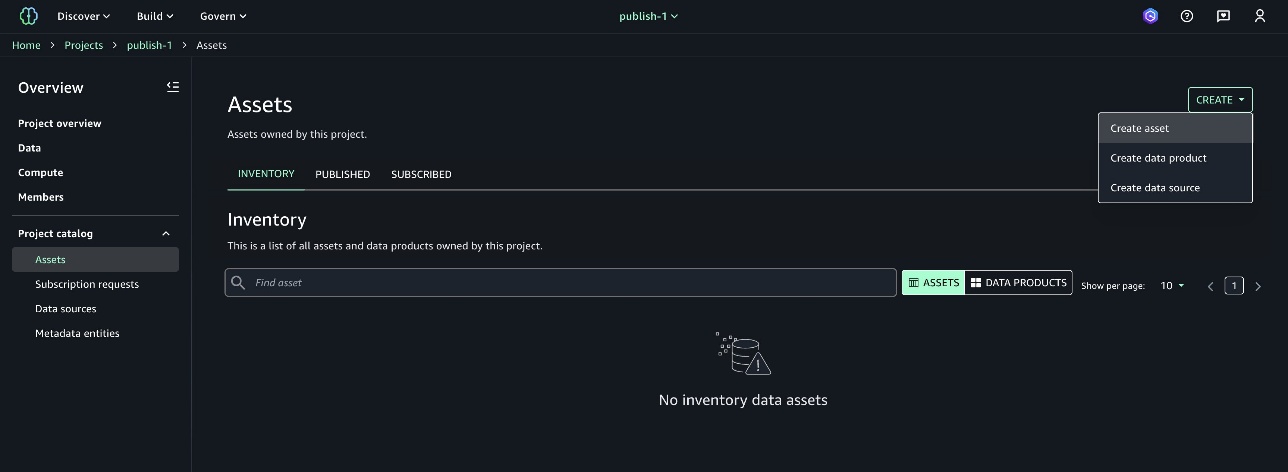
- In the
publish-1project, choose Assets under Project catalog in the navigation pane. - On the Create dropdown menu, choose Create asset.

- Provide an asset name and description, then choose Next.


For this solution, you will create an Amazon Simple Storage Service (Amazon S3) object collection.
- For Asset type, choose S3 object collection.
- For S3 location ARN¸ enter the Amazon Resource Name (ARN) of the S3 object.
- Choose Next.

- Choose CREATE.


The asset marketing_campaign_asset is now created. This is still an inventory asset and not published to the catalog.

Publish rules enforcement
Asset details now show that the required values are missing for the mandatory form Publish_form.

You can try to publish without the required fields and the system will throw an error to enforce publishing metadata rules, as shown in the following screenshot.

To fix the issue, edit the value for the metadata form to provide the required info.

Provide details for the fields and choose SAVE.

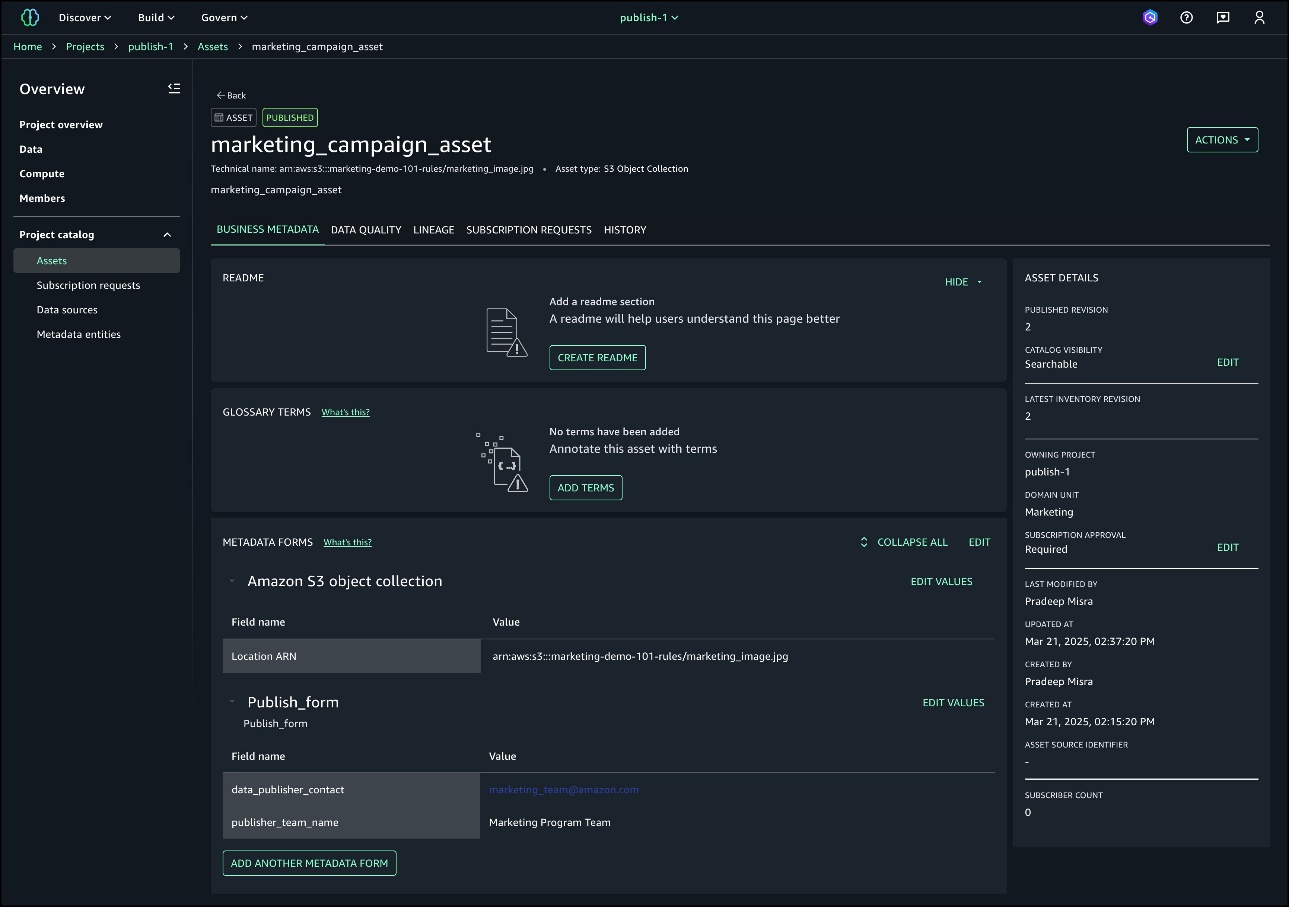
Choose PUBLISH ASSET now and the asset will be published to the catalog.

You can see the asset is published with the required fields enforced with rules.
Set up metadata enforcement for subscription requests
In this section, we show you how to set up metadata rules for a specific domain as a domain admin. We also explain what happens when you subscribe to an asset or data product with these rules applied.
Create rules for asset subscription
Complete the following steps:
- Navigate to the project used in the previous section and choose Metadata entities under Project catalog in the navigation pane.
- On the Metadata forms tab, choose CREATE METADATA FORM to create a new form.

- Provide a form name and description, then choose CREATE METADATA FORM.

- Add fields to the form by choosing CREATE FIELD and turning on Enabled.

- Add a field for subscribers to explain the use case when requesting access.


Create rules for asset subscription
Complete the following steps:
- On the project page, choose Domain units under Domain Management in the navigation pane.
- Choose the Marketing domain unit.


We already have a publishing rule.
- On the Rules tab, choose ADD to add a new rule.

- Provide details for the new rule.
- Specify the action as Subscription request.
- Add the metadata form created in the previous steps (
Subscribe_form). - Choose the scope and projects for enforcement as shown in the following screenshot.
- Choose ADD RULE.


You will see the subscription enforcement rule is now created.
Subscribe the asset
Complete the following steps to subscribe the asset:
- On the project page, navigate to the marketing asset.
- Choose SUBSCRIBE.

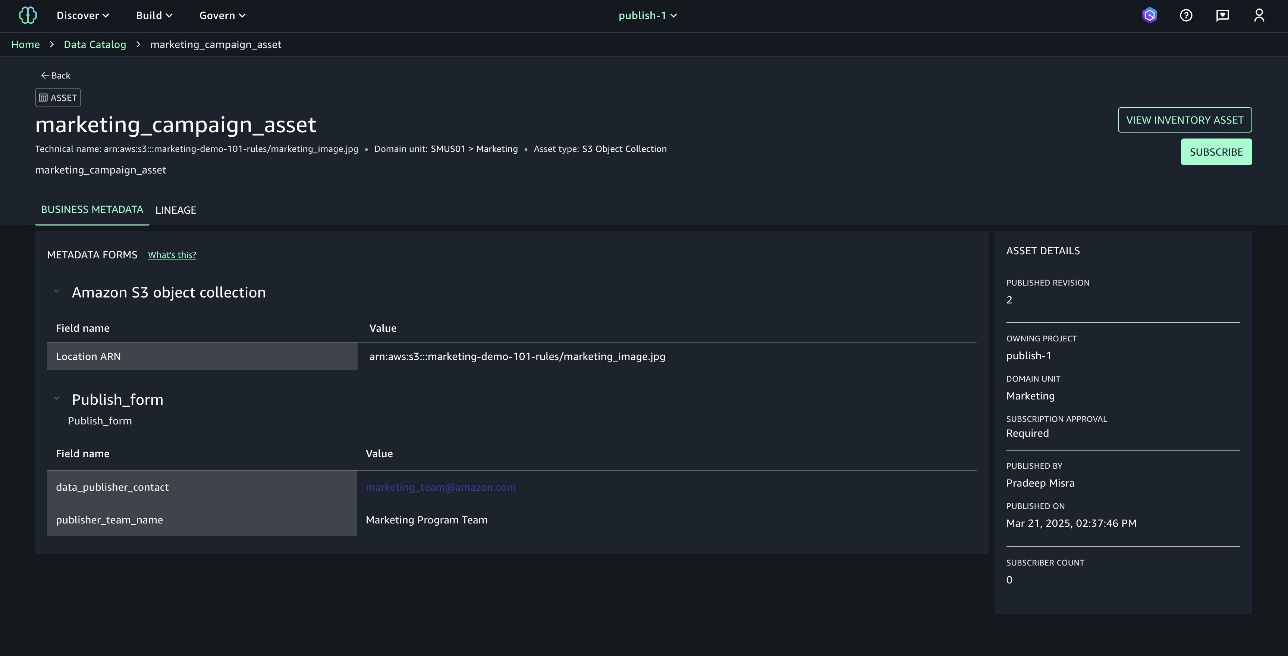
The subscribe form is now attached in the request for the user to provide information.

After a data consumer submits a subscription request, the data producer receives it along with the provided metadata—such as Use Case. This allows producers to review the request before granting access.
Clean up
To avoid incurring additional charges, delete the Amazon SageMaker domain. Refer to Delete domains for the process.
Conclusion
In this post, we discussed metadata rules and how to implement them for both publishing and subscribing to assets across different domains, demonstrating effective metadata governance practices.
The new metadata enforcement rule in Amazon SageMaker strengthens data governance by enabling domain unit owners to establish clear metadata requirements for data users, streamlining catalog health and enhancing data governance process for access request. This feature enables organizations to align with organization’s metadata standards, implement custom workflows, and provide a consistent, governed data workflow experience.
The feature is supported in AWS Commercial Regions where Amazon SageMaker is currently available. To get started with metadata rules—
- Read the user guide for creating rules in the publishing workflow
- Read the user guide for creating rules in subscription requests
About the Authors
 Pradeep Misra is a Principal Analytics Solutions Architect at AWS. He works across Amazon to architect and design modern distributed analytics and AI/ML platform solutions. He is passionate about solving customer challenges using data, analytics, and AI/ML. Outside of work, Pradeep likes exploring new places, trying new cuisines, and playing board games with his family. He also likes doing science experiments, building LEGOs and watching anime with his daughters.
 Ramesh H Singh is a Senior Product Manager Technical (External Services) at AWS in Seattle, Washington, currently with the Amazon SageMaker team. He is passionate about building high-performance ML/AI and analytics products that enable enterprise customers to achieve their critical goals using cutting-edge technology. Connect with him on LinkedIn.
 Sandhya Edupuganti is a Senior Engineering Leader spearheading Amazon DataZone (aka) SageMaker Catalog. She is based in Seattle Metro area and has been with Amazon for over 17 years leading strategic initiatives in Amazon Advertising, Amazon-Retail, Latam-Expansion and AWS Analytics.