[$] Lucky 13: a look at Debian trixie

Post Syndicated from jzb original https://lwn.net/Articles/1033474/

After more than two years of development, the Debian Project has released its new stable version, Debian 13 (“trixie”). The release comes with the usual bounty of
upgraded packages and more than 14,000 new packages; it also debuts Advanced Package Tool
(APT) 3.0
as the default package manager and makes 64-bit
RISC-V a supported architecture. There are few surprises with trixie,
which is exactly what many Linux users are hoping for—a free
operating system that just works as expected.

Security updates for Wednesday

Post Syndicated from jzb original https://lwn.net/Articles/1034546/

Security updates have been issued by Debian (webkit2gtk), Fedora (firefox and libarchive), Red Hat (python3.11-setuptools and python3.12-setuptools), Slackware (mozilla), SUSE (apache2-mod_security2, cairo-devel, cflow, docker, glibc, go1.25, govulncheck-vulndb, gstreamer-0_10-plugins-base, jq, kernel, libarchive, libssh, libxslt, openbao, python-urllib3, systemd, and xz), and Ubuntu (apache2, libssh, libxml2, linux, linux-aws, linux-aws-5.15, linux-gcp, linux-gcp-5.15, linux-gkeop,
linux-hwe-5.15, linux-ibm-5.15, linux-intel-iot-realtime,
linux-intel-iotg-5.15, linux-lowlatency, linux-lowlatency-hwe-5.15,
linux-nvidia-tegra, linux-nvidia-tegra-5.15, linux-nvidia-tegra-igx,
linux-oracle-5.15, linux-realtime, linux-xilinx-zynqmp, linux, linux-aws, linux-aws-5.4, linux-bluefield, linux-gcp, linux-gcp-5.4, linux-hwe-5.4, linux-ibm, linux-ibm-5.4, linux-kvm, linux-oracle, linux-raspi, linux-raspi-5.4, linux-xilinx-zynqmp, linux, linux-aws, linux-lowlatency, linux-lowlatency-hwe-6.8,
linux-realtime, linux-aws-fips, linux-fips, linux-gcp-fips, linux-fips, linux-aws-fips, linux-gcp-fips, linux-ibm-6.8, tomcat10, and webkit2gtk).

Subverting AIOps Systems Through Poisoned Input Data

Post Syndicated from Bruce Schneier original https://www.schneier.com/blog/archives/2025/08/subverting-aiops-systems-through-poisoned-input-data.html

In this input integrity attack against an AI system, researchers were able to fool AIOps tools:

AIOps refers to the use of LLM-based agents to gather and analyze application telemetry, including system logs, performance metrics, traces, and alerts, to detect problems and then suggest or carry out corrective actions. The likes of Cisco have deployed AIops in a conversational interface that admins can use to prompt for information about system performance. Some AIOps tools can respond to such queries by automatically implementing fixes, or suggesting scripts that can address issues.

These agents, however, can be tricked by bogus analytics data into taking harmful remedial actions, including downgrading an installed package to a vulnerable version.

The paper: “When AIOps Become “AI Oops”: Subverting LLM-driven IT Operations via Telemetry Manipulation“:

Abstract: AI for IT Operations (AIOps) is transforming how organizations manage complex software systems by automating anomaly detection, incident diagnosis, and remediation. Modern AIOps solutions increasingly rely on autonomous LLM-based agents to interpret telemetry data and take corrective actions with minimal human intervention, promising faster response times and operational cost savings.

In this work, we perform the first security analysis of AIOps solutions, showing that, once again, AI-driven automation comes with a profound security cost. We demonstrate that adversaries can manipulate system telemetry to mislead AIOps agents into taking actions that compromise the integrity of the infrastructure they manage. We introduce techniques to reliably inject telemetry data using error-inducing requests that influence agent behavior through a form of adversarial reward-hacking; plausible but incorrect system error interpretations that steer the agent’s decision-making. Our attack methodology, AIOpsDoom, is fully automated—combining reconnaissance, fuzzing, and LLM-driven adversarial input generation—and operates without any prior knowledge of the target system.

To counter this threat, we propose AIOpsShield, a defense mechanism that sanitizes telemetry data by exploiting its structured nature and the minimal role of user-generated content. Our experiments show that AIOpsShield reliably blocks telemetry-based attacks without affecting normal agent performance.

Ultimately, this work exposes AIOps as an emerging attack vector for system compromise and underscores the urgent need for security-aware AIOps design.

How CommBank made their CommSec trading platform highly available and operationally resilient

Post Syndicated from Kris Severijns original https://aws.amazon.com/blogs/architecture/how-commbank-made-their-commsec-trading-platform-highly-available-and-operationally-resilient/

CommSec, Australia’s leading online broker and a subsidiary of the Commonwealth Bank of Australia (CommBank), helps millions of customers grow their wealth by making it easy, accessible and affordable to invest in both Australian and international markets.

CommSec plays an essential role in customers’ financial journeys, providing essential services such as market research, portfolio management, and trade execution. With customers expecting round-the-clock availability, the platform must maintain exceptional reliability. Additionally, as a regulated entity under the Australian Securities & Investments Commission (ASIC), CommSec must preserve high platform resilience and maintain data sovereignty within Australia to protect the integrity of Australia’s financial markets. In this post, we explore how CommSec used AWS services to build a resilient, high-performing trading platform while meeting strict regulatory requirements and delivering an exceptional customer experience.

Challenges of operating a multicloud environment

In a pioneering move within CommBank, CommSec became the first critical workload to transition from on-premises data centers to the public cloud. In 2015, CommBank migrated CommSec’s web and mobile tier, and then migrated their application tier in 2019. As a leader and early cloud adopter, CommSec began with an active-active multicloud architecture to build confidence in the resilience of the public cloud, using the AWS Asia Pacific (Sydney) Region as one of its fault domains. Operating a multicloud environment presented several challenges. The complexity of maintaining two deployment pipelines, an operating model spanning two public cloud platforms, and a custom failover process requiring external witness capabilities created operational overhead. This reduced development velocity and engineering proficiency while maintaining a dependency on on-premises data centers. At the same time, the limited opportunity to use cloud-based services to keep parity and compatibility with both public clouds stifled innovation.

Solution overview

As AWS became CommBank’s preferred cloud provider, the CommSec team rearchitected its app, web, and mobile tiers in early 2025 to run entirely on AWS. With the move to AWS as their sole cloud provider, they took advantage of a new fault isolation boundary to establish a resilience posture similar to what they had with their multicloud solution, but with a simplified architecture.

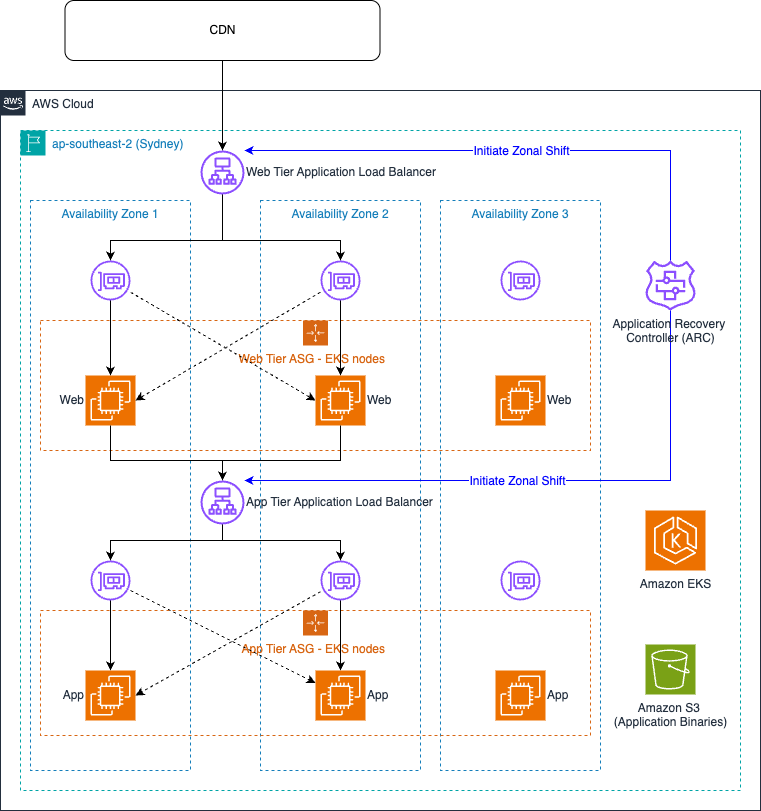
In the previous design, if an issue or outage occurred in a cloud provider or physical data center, traffic was routed and served through the alternate cloud. With the consolidation of the platform on AWS, the CommSec team decided on an Availability Zone as the new fault isolation boundary. Using Amazon Application Recovery Controller (ARC) zonal shift, they can perform a failover to minimize impact to the customer in case of infrastructure or application gray failures while satisfying the requirement to have a physical and logical isolation using multiple Availability Zones in a Region. ARC zonal shift was enabled on their load balancers, so the CommSec team could divert traffic away from an impaired Availability Zone without relying on control plane actions. The same ARC zonal shift capability is being used to help the CommSec team manage application gray failures by reducing customer impact when they occur.

Consolidating on AWS and using ARC zonal shift to manage failures helped the CommSec team realize several important benefits:

  • Out-of-the-box failover capabilities with ARC zonal shift enabled the team to implement comprehensive and automated procedures to move traffic away from an Availability Zone.
  • Comprehensive playbooks that undergo regular validation exercises to verify the effectiveness of the failover procedures and operational readiness.
  • Standardized deployment pipelines and simplified configuration made operating system patching and code deployments two times faster.
  • They saw a 25% base capacity reduction by running the CommSec platform across three AWS Availability Zones compared to two stacks on each public cloud (four stacks) in the past, bringing down operational costs.

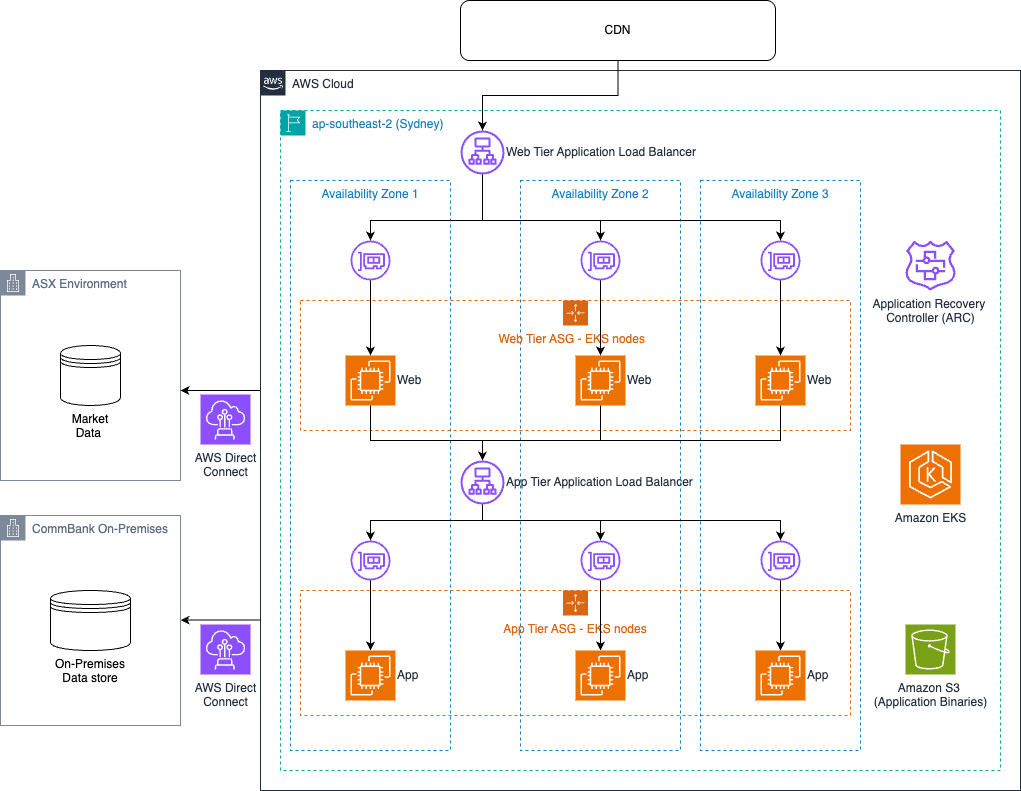
The following diagram illustrates the solution architecture.

The CommSec team introduced several resilience improvements:

  • With scale-in and scale-out happening multiple times a day, the process of scaling needed to be as resilient as possible. The CommSec team made sure the entire scale-out bootstrap process had no dependencies on external resources by storing and retrieving application binaries from Amazon Simple Storage Service (Amazon S3) buckets within the same AWS account.
  • Because traffic patterns are incredibly spiky, especially during market open (CommSec traffic often increases threefold between 9:59-10:02 AM on market open), the team implemented Load balancer Capacity Unit (LCU) reservations on the web tier load balancers. This provided sufficient Application Load Balancer (ALB) capacity at the start of the trading day without having to rely on reactive scaling for this predictable spike.
  • They implemented ALB health checks for hard failures to automatically remove instances from target groups. Traffic will shift away from the targets when health checks fail, with alerts signaling the operational team to investigate and remediate.
  • New AWS Direct Connect connections from AWS to the Australian Liquidity Centre (which hosts the Australian Stock Exchange (ASX)’s primary trading, clearing, and settlement systems) were established to improve the reliability of the connectivity to financial markets, including ASX and CBOE exchanges.

ARC zonal shift to help mitigate impairments

In 2023, AWS launched zonal shift, part of Amazon Application Recovery Controller. With zonal shift, you can shift application traffic away from an Availability Zone in a highly available manner for supported resources. This action helps quickly recover an application when an Availability Zone experiences an impairment, reducing the duration and severity of impact to the application due to events such as power outages and hardware or software failures. Zonal shift supports Application and Network Load Balancers, Amazon EC2 Auto Scaling Groups, and Amazon Elastic Kubernetes Service (Amazon EKS).

The CommSec team enabled ARC zonal shift on their ALBs for their web and application tier with cross-zone load balancing enabled. When started, zonal shift takes two actions. First, it removes the IP address of the load balancer node in the specified Availability Zone from DNS, so new queries won’t resolve to that endpoint. This stops future client requests from being sent to that node. Second, it instructs the load balancer nodes in the other Availability Zones not to route requests to targets in the impaired Availability Zone. Cross-zone load balancing is still used in the remaining Availability Zones during the zonal shift, as shown in the following figure.

After the issue is resolved and the application is available again in all Availability Zones, the CommSec team cancels the zonal shift, and traffic is redistributed across all three Availability Zones.

Benefits of ARC zonal shift

ARC zonal shift helps organizations maintain higher availability SLAs, reduce operational costs associated with multi-step manual failover procedures, and minimize revenue loss from service disruptions. The straightforward nature of ARC zonal shift helps teams conduct frequent, on-demand, low-risk testing of their Availability Zone evacuation procedures. The ability to perform regular validation makes sure failover processes remain reliable and builds organizational confidence in disaster recovery capabilities.

“ARC zonal shift is the most efficient way for CommSec to use AWS services whilst meeting our resilience requirements. It provided an out-of-the-box solution that was easier than trying to implement an Availability Zone recovery solution ourselves. Hopefully it’s something we will never need, but our regular resilience testing ensures it’s there and will work if we ever need it.”

– Henry Zhao, CommBank Staff Software Engineer.

Conclusion

By using AWS services and implementing a robust Multi-AZ architecture, the CommSec trading platform continues to meet the demanding needs of Australia’s leading online broker. The combination of ARC zonal shift capabilities, optimized load balancer configurations, and comprehensive runbooks and operational procedures has enabled CommSec to maintain exceptional reliability while serving over millions of customers. CommSec’s journey showcases how careful architectural decisions and AWS managed services can help organizations achieve both operational excellence and superior customer experience for mission-critical financial applications.

To learn more, refer to AWS Fault Isolation Boundaries and Amazon Application Recovery Controller.


About the authors

Announcing the end-of-support for the AWS SDK for .NET v3

Post Syndicated from Ed McLaughlin original https://aws.amazon.com/blogs/devops/announcing-the-end-of-support-for-the-aws-sdk-for-net-v3/

We are announcing the end-of-support for the AWS SDK for .NET v3.x starting on March 1, 2026, in accordance with the SDK and Tools maintenance policy.  On April 28, 2025, the next major version of the AWS SDK for .NET, version 4.x, became generally available (blog post). Version 4.x of the SDK includes bug fixes, performance enhancements, and modernization for .NET. We strongly encourage you to upgrade to take advantage of these enhancements.

Existing applications that use the AWS SDK for .NET v3.x will continue to function as intended unless there is a fundamental change to how an AWS service works. This is uncommon, and we will announce it broadly if it happens. Beginning March 1, 2026, the AWS SDK for .NET v3.x will only receive critical bug fixes and security updates, and we will not update it to support new AWS services, new service features, or changes to existing services. After June 1, 2026, when the AWS SDK for .NET v3.x reaches end-of-support, it will no longer receive updates or releases.

End of Support Timeline for Version 3

The timeline for end-of-support is as follows, as defined by the SDK major version lifecycle:

Phase Start Date End Date Support Level
General Availability July 28, 2015 June 1, 2026 During this phase, the SDK is fully supported. AWS will provide regular SDK releases that include support for new services, API updates for existing services, as well as bug and security fixes.
Maintenance Mode March 1, 2026 June 1, 2026 During the maintenance mode, AWS limits SDK releases to address critical bug fixes and security issues only. An SDK will not receive API updates for new or existing services, or be updated to support new regions
End-of-Support June 1, 2026 N/A When an SDK reaches end-of support, it will no longer receive updates or releases. Previously published releases will continue to be available via public package managers and the code will remain on GitHub. The GitHub repository may be archived.

References for AWS SDK for .NET Version 4

Use the following references to learn more about the AWS SDK for .NET v4.x along with migration support.

Conclusion

We recommend you upgrade to the latest major version of the AWS SDK for .NET v4.x by using the migration guide. This major version includes, but is not limited to, performance enhancements, bug fixes, modern .NET libraries and frameworks, and the latest AWS service updates. To learn more, please refer to the AWS SDK for .NET GA blog post.

If you need assistance or have feedback, reach out to your usual AWS support contacts. You can also open a discussion or issue on GitHub. Thank you for using the AWS SDK for .NET.

Author

Ed McLaughlin

Ed McLaughlin is the software development manager for the AWS SDK for .NET, .NET Developer Experience products, and AWS Tools for PowerShell. He enjoys working on projects, tools, and features that enhance the experience of the customer. You can find him on LinkedIn @ejm3.

Announcing the end-of-support for AWS Tools for PowerShell v4

Post Syndicated from Ed McLaughlin original https://aws.amazon.com/blogs/devops/announcing-the-end-of-support-for-aws-tools-for-powershell-v4/

We are announcing the end-of-support for the AWS Tools for PowerShell v4.x starting on March 1, 2026, in accordance with the SDK and Tools maintenance policy. On June 23, 2025, the next major version of the AWS Tools for PowerShell, version 5.x, became generally available (blog post). Version 5.x of the AWS Tools for PowerShell includes bug fixes, new features, performance enhancements, and leverages the latest major version of the AWS SDK for .NET v4.x. We strongly encourage you to upgrade to the latest version of AWS Tools for PowerShell v5.x to take advantage of these enhancements.

Existing applications that use the AWS Tools for PowerShell v4.x will continue to function as intended unless there is a fundamental change to how an AWS service works. This is uncommon, and we will announce it broadly if it happens. Beginning March 1, 2026, the AWS Tools for PowerShell v4.x will only receive critical bug fixes and security updates, and we will not update it to support new AWS services, new service features, or changes to existing services. After June 1, 2026, when the AWS Tools for PowerShell v4.x reaches end-of-support, it will no longer receive updates or releases.

End of Support Timeline for Version 4

The timeline for end-of-support is as follows, as defined by the SDK major version lifecycle:

Phase Start Date End Date Support Level
General Availability July 28, 2015 June 1, 2026 During this phase, the SDK is fully supported. AWS will provide regular SDK releases that include support for new services, API updates for existing services, as well as bug and security fixes.
Maintenance Mode March 1, 2026 June 1, 2026 During the maintenance mode, AWS limits SDK releases to address critical bug fixes and security issues only. An SDK will not receive API updates for new or existing services, or be updated to support new regions
End-of-Support June 1, 2026 N/A When an SDK reaches end-of support, it will no longer receive updates or releases. Previously published releases will continue to be available via public package managers and the code will remain on GitHub. The GitHub repository may be archived.

References for AWS Tools for PowerShell Version 5

Use the following references to learn more about the AWS Tools for PowerShell v5.x along with migration support.

Conclusion

We recommend you upgrade to the latest major version of the AWS Tools for PowerShell v5.x by using the migration guide. This major version includes, but is not limited to, performance enhancements, bug fixes, modern .NET libraries and frameworks, and the latest AWS service updates. To learn more, please refer to the AWS Tools for PowerShell v5.x GA blog post.

If you need assistance or have feedback, reach out to your usual AWS support contacts. You can also open a discussion or issue on GitHub. Thank you for using the AWS Tools for PowerShell.

Author

Ed McLaughlin

Ed McLaughlin is the software development manager for the AWS SDK for .NET, .NET Developer Experience products, and AWS Tools for PowerShell. He enjoys working on projects, tools, and features that enhance the experience of the customer. You can find him on LinkedIn @ejm3.

Preventing domain-resurrection attacks (PyPI blog)

Post Syndicated from jzb original https://lwn.net/Articles/1034450/

The Python Package Index (PyPI) has announced that it is now
checking for expired domains to try to prevent domain-resurrection
attacks. In this type of attack, a malicious user buys an expired
domain and uses it to take over an account by resetting the password
associated with the email used with PyPI. Since June, PyPI has
unverified more than 1,800 email addresses after their associated
domains entered expiration phases.

After an initial bulk check period that took place in April 2025,
PyPI will check daily for any domains in use for status changes, and
update its internal database with the most recent status.

If a domain registration enters the redemption period, that’s an
indicator to PyPI that the previously verified email destinations may
not be trusted, and will un-verify a previously-verified email
address. PyPI will not issue a password reset request to addresses
that have become unverified.

PyPI recommends that users add a second verified email address
“from another notable domain (e.g. Gmail)” to their account, if
they do not have one already.

Under the hood: how AWS Lambda SnapStart optimizes function startup latency

Post Syndicated from Ayush Kulkarni original https://aws.amazon.com/blogs/compute/under-the-hood-how-aws-lambda-snapstart-optimizes-function-startup-latency/

When building applications using AWS Lambda, optimizing function startup is an important step to improve performance for latency sensitive applications. The largest contributor to startup latency (often referred to as cold start time) is the time that Lambda spends initializing your function code. Lambda SnapStart is a feature available for Java, Python, and .NET runtimes that helps reduce variable cold start latency from several seconds (or higher) to as low as sub-second. SnapStart typically needs zero or minimal changes to your application code and makes it easier to build highly responsive and scalable applications without implementing complex performance optimizations. This post explains how SnapStart works under the hood and provides recommendations to improve application performance when using SnapStart.

If your function already initializes within hundreds of milliseconds, then AWS recommends using Lambda Provisioned Concurrency to achieve double-digit millisecond startup latency.

What is a cold-start?

Lambda runs your function code in an isolated, secure execution environment that uses Firecracker microVM technology. When you first invoke a Lambda function, Lambda creates a new execution environment for the function to run in. Lambda downloads your function code, starts the language runtime, and runs your function initialization code, which is code outside the handler. This initialization process (INIT) is called a cold start. Then, Lambda runs your function handler code to invoke the function. A Lambda execution environment only handles a single invoke request at a time. The following figure shows the lifecycle of a typical invocation request.

Figure 1. Function invocation lifecycle without SnapStart

Figure 1. Function invocation lifecycle without SnapStart

After the function finishes running, Lambda doesn’t stop the execution environment right away. When your function receives another invocation request, Lambda attempts to route the request to the idle but already running execution environment. As the INIT process has already run for this execution environment, this invoke is called a warm start. When more traffic arrives than Lambda has available idle execution environments, Lambda initializes new execution environments to serve the additional requests, performing the cold start initialization process again.

The last step of the cold start, initializing function code, typically takes the longest. This depends on the startup tasks that you execute in your code and the programming language runtime or framework you use. For languages such as Java and .NET, startup latency is impacted by just-in-time compilation of static code in loaded classes. For Python, it can be impacted if your executed code contains numerous or large modules. Other startup tasks, such as downloading machine learning (ML) models, can also take several seconds to complete, which adds to your function’s initialization latency. SnapStart is designed to optimize this last step of the cold start process and achieves this in three stages.

Stage 1: Snapshotting your Lambda function

When using SnapStart, the Lambda execution environment lifecycle changes. When you enable SnapStart for a particular function, publishing a new function version triggers the snapshotting process. The process runs the function initialization phase and takes an immutable, encrypted Firecracker microVM snapshot of the memory and disk state of the initialized execution environment, caching and chunking the snapshot for reuse. Code paths that are not executed during initialization, such as classes loaded on-demand through dependency injection, are not included in your function’s snapshot. To improve snapshot efficiency, proactively execute code paths during the initialization phase, or use runtime hooks to run code before Lambda creates a snapshot.

Snapshot creation can take a few minutes, during which your function version remains in the PENDING state, becoming ACTIVE when the snapshot is ready.

When you subsequently invoke your function, Lambda restores new execution environments from this snapshot. This optimization makes the invocation time faster and more predictable, because creating new a execution environment no longer requires an initialization.

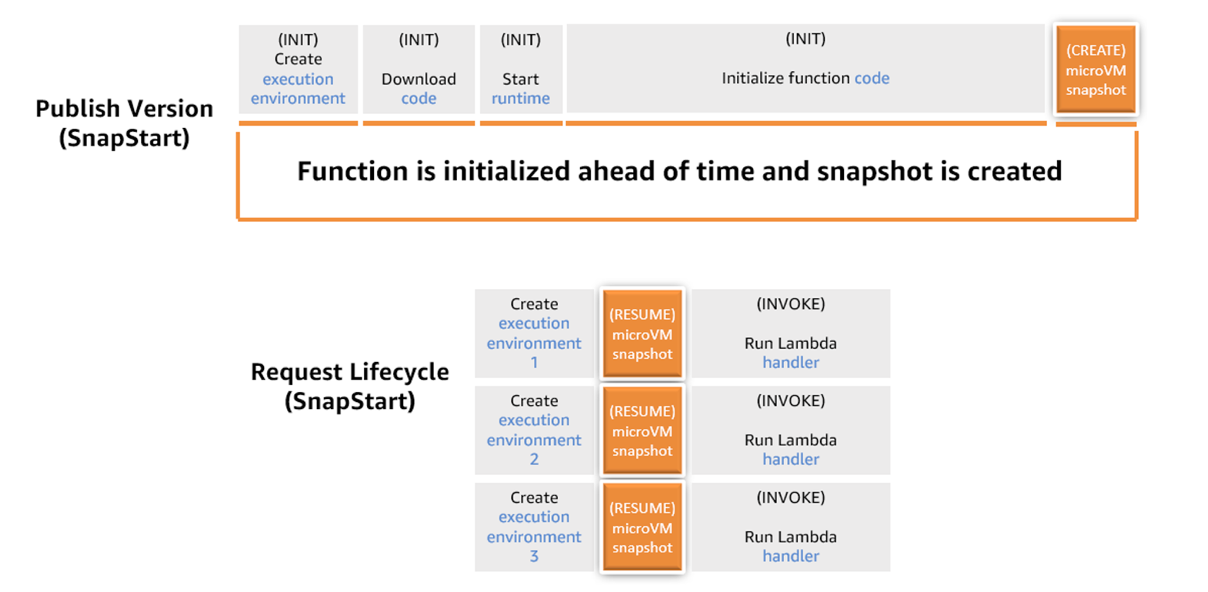
The following figure shows the lifecycle of a SnapStart configured function.

Diagram illustrating how AWS Lambda SnapStart works. The top section shows the 'Publish Version' phase, where the function is initialized ahead of time by creating the execution environment, downloading the code, starting the runtime, and initializing the function code. At the end of this phase, a microVM snapshot is created. The bottom section shows the 'Request Lifecycle' using SnapStart: each new execution environment resumes from the pre-initialized microVM snapshot and immediately invokes the Lambda handler. This allows multiple environments to start faster by skipping initialization steps.

Figure 2. Function invocation lifecycle with SnapStart

After Lambda creates a snapshot, it periodically regenerates it to apply security patches, runtime updates, and software upgrades. Your invocation requests continue to work throughout the regeneration process.

Stage 2: Storing snapshots for low-latency retrieval at Lambda scale

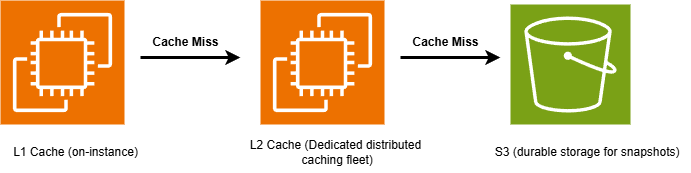
Lambda operates at a high scale, processing tens of trillions of invocation requests every month. To efficiently manage and retrieve snapshots at this volume of traffic, Lambda uses storage and caching components. These consist of three layers: Amazon S3 for durable storage, a dedicated distributed cache, and a local cache on Lambda worker nodes.

Lambda stores function snapshots in Amazon S3, dividing them into 512 KB chunks to optimize retrieval latency. Retrieval latency from Amazon S3 can take up to hundreds of milliseconds for each 512 KB chunk. Therefore, Lambda uses a two-layer cache to speed-up snapshot retrieval.

When you enable SnapStart, during the optimization process, Lambda stores snapshot chunks in a layer two (L2) cache. This layer is a dedicated distributed cache instance fleet purpose-built by Lambda. Lambda stores a separate copy of each snapshot per AWS Availability Zone (AZ). To balance performance with costs, Lambda may not proactively cache unused snapshot chunks, instead caching them after they are first accessed. Chunks remain cached in the L2 fleet as long as your function version is active. The snapshot restore performance from the L2 layer is typically single digit milliseconds for a 512 KB chunk.

Lambda also maintains a layer one (L1) cache located on Lambda worker nodes, the Amazon Elastic Compute Cloud (Amazon EC2) instances handling function invocations. This layer is available locally, thus it provides the fastest performance, typically 1 millisecond for a 512 KB chunk. Functions with more frequent invocations are more likely to have their snapshot chunks cached in this layer. Functions with fewer invocations are automatically evicted from this cache, because it is bound by the worker instance disk capacity. When a snapshot chunk is not available in the L1 cache, Lambda retrieves the chunk from the L2 cache layer.

Figure 3. SnapStart tiered cache

Figure 3. SnapStart tiered cache

Stage 3: Resuming execution from restored snapshots

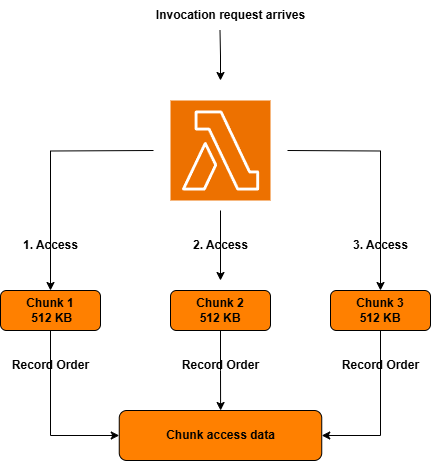
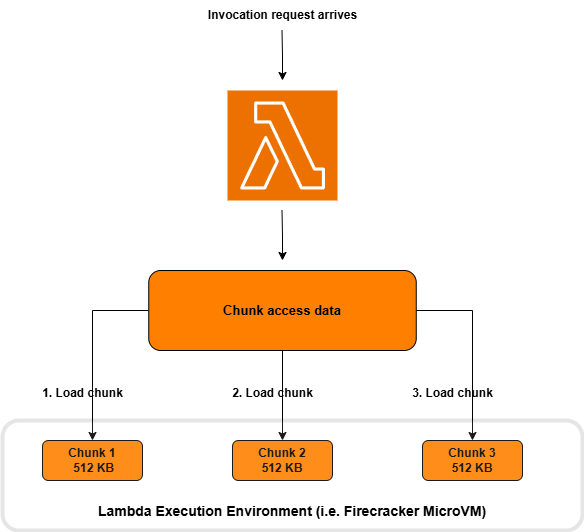
Resuming execution from snapshots with low latency is the final SnapStart stage. This involves loading the retrieved snapshot chunks into your function execution environment. Typically, only a subset of the retrieved snapshot is needed to serve an invocation. Storing snapshots as chunks lets Lambda optimize the resume process by proactively loading only the necessary subset of chunks. To achieve this, Lambda tracks and records the snapshot chunks that the function accesses during each function invocation, as shown in the following figure.

Figure 4. Initial invocation, record chunk access pattern

Figure 4. Initial invocation, record chunk access pattern

After the first function invocation, Lambda refers to this recorded chunk access data for subsequent invokes, as shown in the following figure. Lambda proactively retrieves and loads this “working set” of chunks before they are needed for execution. This significantly speeds up cold-start latency. If every invoke executes the same code path, then all necessary chunks are tracked after the first invoke. If your Lambda function includes a method that is conditionally invoked once every five cold starts, then Lambda adds the corresponding chunks representing this method to the chunk access metadata after five cold starts.

Figure 5. Subsequent invocation, load chunks in order of access

Figure 5. Subsequent invocation, load chunks in order of access

Understanding SnapStart function performance

The speed of restoring a snapshot depends on its contents, size, and the caching tier used. As a result, SnapStart performance can vary across individual functions.

Function performance improves with more invocations

Frequently invoked functions are more likely to have their snapshots cached in the L1 layer, which provides the fastest retrieval latency. Infrequently accessed portions of snapshots for functions with sporadic invokes are less likely to be present in the L1 layer, resulting in slower retrieval latency from the L2 and S3 cache layers. Chunk access data for functions with more invocations is also more likely to be “complete”, which speeds up snapshot restore latency.

Pre-load code paths to optimize snapshot restore latency

To maximize the benefits of SnapStart, preload dependencies, initialize resources, and perform heavy computation tasks that contribute to startup latency in your initialization code instead of in the function handler. Code paths not executed during your function’s INIT phase, such as application classes loaded on-demand through dependency injection, are not included in your function’s snapshot. You can further improve SnapStart effectiveness by proactively executing these code paths during function initialization. You can also run code using runtime hooks and invoking your handler during the initialization phase before creating the snapshot. To achieve this, refer to the documentation and posts for Spring Boot and .NET applications to implement the performance tuning.

Performance differs depending on function size

SnapStart performance depends on how quickly Lambda can retrieve and load cached snapshots into your function execution environment. Larger function sizes increase the size of snapshots, and thus the number of chunks, which causes performance to differ for functions of varying sizes.

Not all functions benefit from SnapStart

SnapStart is designed to improve startup latency when function initialization takes several seconds, due to language-specific factors or because of initializing and loading software dependencies and frameworks. If your functions initialize within hundreds of milliseconds, you are unlikely to experience a significant performance improvement with SnapStart. For these scenarios, we recommend Provisioned Concurrency, which pre-initializes execution environments, delivering double-digit millisecond latency.

Conclusion

AWS Lambda SnapStart can deliver as low as sub-second startup performance for Java, .NET, and Python functions with long initialization times. This post explores how the Lambda lifecycle changes with SnapStart and how Lambda efficiently stores and loads snapshots to improve start up performance. SnapStart helps developers build highly responsive and scalable applications without provisioning resources or implementing complex performance optimizations.

To learn more about SnapStart, refer to the documentation and launch posts for Java, and Python and .NET. For performance tuning, refer to the SnapStart best practices section for your preferred language runtime. This post outlines approaches to pre-load code paths to further optimize startup latency. Find more information and sample applications built using SnapStart on Serverlessland.com.
Best performance and fastest memory with the new Amazon EC2 R8i and R8i-flex instances

Post Syndicated from Veliswa Boya original https://aws.amazon.com/blogs/aws/best-performance-and-fastest-memory-with-the-new-amazon-ec2-r8i-and-r8i-flex-instances/

Today, we’re announcing general availability of the new eighth generation, memory optimized Amazon Elastic Compute Cloud (Amazon EC2) R8i and R8i-flex instances powered by custom Intel Xeon 6 processors, available only on AWS. They deliver the highest performance and fastest memory bandwidth among comparable Intel processors in the cloud. These instances deliver up to 15 percent better price performance, 20 percent higher performance, and 2.5 times more memory throughput compared to previous generation instances.

With these improvements, R8i and R8i-flex instances are ideal for a variety of memory intensive workloads such as SQL and NoSQL databases, distributed web scale in-memory caches (Memcached and Redis), in-memory databases such as SAP HANA, and real-time big data analytics (Apache Hadoop and Apache Spark clusters). For a majority of the workloads that don’t fully utilize the compute resources, the R8i-flex instances are a great first choice to achieve an additional 5 percent better price performance and 5 percent lower prices.

Improvements made to both instances compared to their predecessors
In terms of performance, R8i and R8i-flex instances offer 20 percent better performance than R7i instances, with even higher gains for specific workloads. These instances are up to 30 percent faster for PostgreSQL databases, up to 60 percent faster for NGINX web applications, and up to 40 percent faster for AI deep learning recommendation models compared to previous generation R7i instances, with sustained all-core turbo frequency now reaching 3.9 GHz (compared to 3.2 GHz in the previous generation). They also feature a 4.6x larger L3 cache and significantly better memory throughput, offering 2.5 times higher memory bandwidth than the seventh generation. With this higher performance across all the vectors, you can run a greater number of workloads while keeping costs down.

R8i instances now scale up to 96xlarge with up to 384 vCPUs and 3TB memory (versus 48xlarge sizes in the seventh generation), helping you to scale up database applications. R8i instances are SAP certified to deliver 142,100 aSAPS, which is highest among all comparable machines in on premises and cloud environments, delivering exceptional performance for your mission-critical SAP workloads. R8i-flex instances offer the most common sizes, from large to 16xlarge, and are a great first choice for applications that don’t fully utilize all compute resources. Both R8i and R8i-flex instances use the latest sixth generation AWS Nitro Cards, delivering up to two times more network and Amazon Elastic Block Storage (Amazon EBS) bandwidth compared to the previous generation, which greatly improves network throughput for workloads handling small packets, such as web, application, and gaming servers.

R8i and R8i-flex instances also support bandwidth configuration with 25 percent allocation adjustments between network and Amazon EBS bandwidth, enabling better database performance, query processing, and logging speeds. Additional enhancements include FP16 datatype support for Intel AMX to support workloads such as deep learning training and inference and other artificial intelligence and machine learning (AI/ML) applications.

The specs for the R8i instances are as follows.

Instance size
vCPUs
Memory (GiB)
Network bandwidth (Gbps)
EBS bandwidth (Gbps)
r8i.large 2 16 Up to 12.5 Up to 10
r8i.xlarge 4 32 Up to 12.5 Up to 10
r8i.2xlarge 8 64 Up to 15 Up to 10
r8i.4xlarge 16 128 Up to 15 Up to 10
r8i.8xlarge 32 256 15 10
r8i.12xlarge 48 384 22.5 15
r8i.16xlarge 64 512 30 20
r8i.24xlarge 96 768 40 30
r8i.32xlarge 128 1024 50 40
r8i.48xlarge 192 1536 75 60
r8i.96xlarge 384 3072 100 80
r8i.metal-48xl 192 1536 75 60
r8i.metal-96xl 384 3072 100 80

The specs for the R8i-flex instances are as follows.

Instance size
vCPUs
Memory (GiB)
Network bandwidth (Gbps)
EBS bandwidth (Gbps)
r8i-flex.large 2 16 Up to 12.5 Up to 10
r8i-flex.xlarge 4 32 Up to 12.5 Up to 10
r8i-flex.2xlarge 8 64 Up to 15 Up to 10
r8i-flex.4xlarge 16 128 Up to 15 Up to 10
r8i-flex.8xlarge 32 256 Up to 15 Up to 10
r8i-flex.12xlarge 48 384 Up to 22.5 Up to 15
r8i-flex.16xlarge 64 512 Up to 30 Up to 20

When to use the R8i-flex instances
As stated earlier, R8i-flex instances are more affordable versions of the R8i instances, offering up to 5 percent better price performance at 5 percent lower prices. They’re designed for workloads that benefit from the latest generation performance but don’t fully use all compute resources. These instances can reach up to the full CPU performance 95 percent of the time and work well for in-memory databases, distributed web scale cache stores, mid-size in-memory analytics, real-time big data analytics, and other enterprise applications. R8i instances are recommended for more demanding workloads that need sustained high CPU, network, or EBS performance such as analytics, databases, enterprise applications, and web scale in-memory caches.

Available now
R8i and R8i-flex instances are available today in the US East (N. Virginia), US East (Ohio), US West (Oregon), and Europe (Spain) AWS Regions. As usual with Amazon EC2, you pay only for what you use. For more information, refer to Amazon EC2 Pricing. Check out the full collection of memory optimized instances to help you start migrating your applications.

To learn more, visit our Amazon EC2 R8i instances page and Amazon EC2 R8i-flex instances page. Send feedback to AWS re:Post for EC2 or through your usual AWS Support contacts.

– Veliswa

Improve Amazon EMR HBase availability and tail latency using generational ZGC

Post Syndicated from Vishal Chaudhary original https://aws.amazon.com/blogs/big-data/improve-amazon-emr-hbase-availability-and-tail-latency-using-generational-zgc/

At Amazon EMR, we constantly listen to our customers’ challenges with running large-scale Amazon EMR HBase deployments. One consistent pain point that kept emerging is unpredictable application behavior due to garbage collection (GC) pauses on HBase. Customers running critical workloads on HBase were experiencing occasional latency spikes due to varying GC pauses, particularly impacting when they occurred during peak business hours.

To reduce this unpredictable impact to business-critical applications running on HBase, we turn to Oracle’s Z Garbage Collector (ZGC), specifically it’s generational support introduced in JDK 21. Generational ZGC delivers consistent sub-millisecond pause times that dramatically reduce tail latency.

In this post, we examine how unpredictable GC pauses affect business-critical workloads, benefits of enabling generational ZGC in HBase. We also cover additional GC tuning techniques to improve the application throughput and reduce tail latency. Amazon EMR 7.10.0 introduces new configuration parameters that allow you to seamlessly configure and tune the garbage collector for HBase RegionServers.

By incorporating generational collection into ZGC’s ultra-low pause architecture, it efficiently handles both short-lived and long-lived objects, making it exceptionally well-suited to HBase’s workload characteristics:

  • Handling mixed object lifetimes – HBase operations create a mix of short-lived objects (such as temporary buffers for read/write operations) and long-lived objects (such as cached data blocks and metadata). Generational ZGC can efficiently manage both, reducing overall GC frequency and impact.
  • Adapting to workload patterns – As workload patterns change throughout the day — for instance, from write-heavy ingestion to read-heavy analytics — generational ZGC adapts its collection strategy, maintaining optimal performance.
  • Scaling with heap size – As data volumes grow and HBase clusters require larger heaps, generational ZGC maintains it’s sub-millisecond pause times, providing consistent performance even as you scale up.

Understanding the impact of GC pauses on HBase

When running HBase RegionServers, the JVM heap can accumulate a large number of objects, both short-lived (temporary objects created during operations) and long-lived (cached data, metadata). Traditional garbage collectors like Garbage-First Garbage Collector (G1 GC) need to pause application threads during certain phases of garbage collection, particularly during “stop-the-world” (STW) events. GC pauses can have several impacts on HBase :

  • Latency spikes – GC pauses introduce latency spikes, often impacting tail latencies (p99.9 and p99.99) of the application which can lead to timeout for client requests and inconsistent response times..
  • Application availability – All application threads are halted during STW events and it negatively impacts overall application availability.
  • RegionServer failures – If GC pauses exceed the configured ZooKeeper session timeout, they might lead to RegionServer failures.

HBase RegionServer reports whenever there is an unusually long GC pause time using the JvmPauseMonitor. The following log entry shows an example of GC pauses reported by HBase RegionServer. During YCSB benchmarking, G1 GC exhibited 75 such pauses over a 7-hour period, whereas generational ZGC showed no long pauses under identical workload and testing conditions.

INFO  [JvmPauseMonitor] util.JvmPauseMonitor: Detected pause in JVM or host machine (eg GC): pause of approximately 2839ms
INFO  [JvmPauseMonitor] util.JvmPauseMonitor: Detected pause in JVM or host machine (eg GC): pause of approximately 3021ms

G1 GC pauses are proportional to the pressure on the heap and the object allocation patterns. As a result, the pauses might get worse if the heap is under too much load, whereas generational ZGC maintains it’s pause times goals even under high pressure.

Pause time and availability (uptime) comparison: Generational ZGC vs. G1GC in Amazon EMR HBase

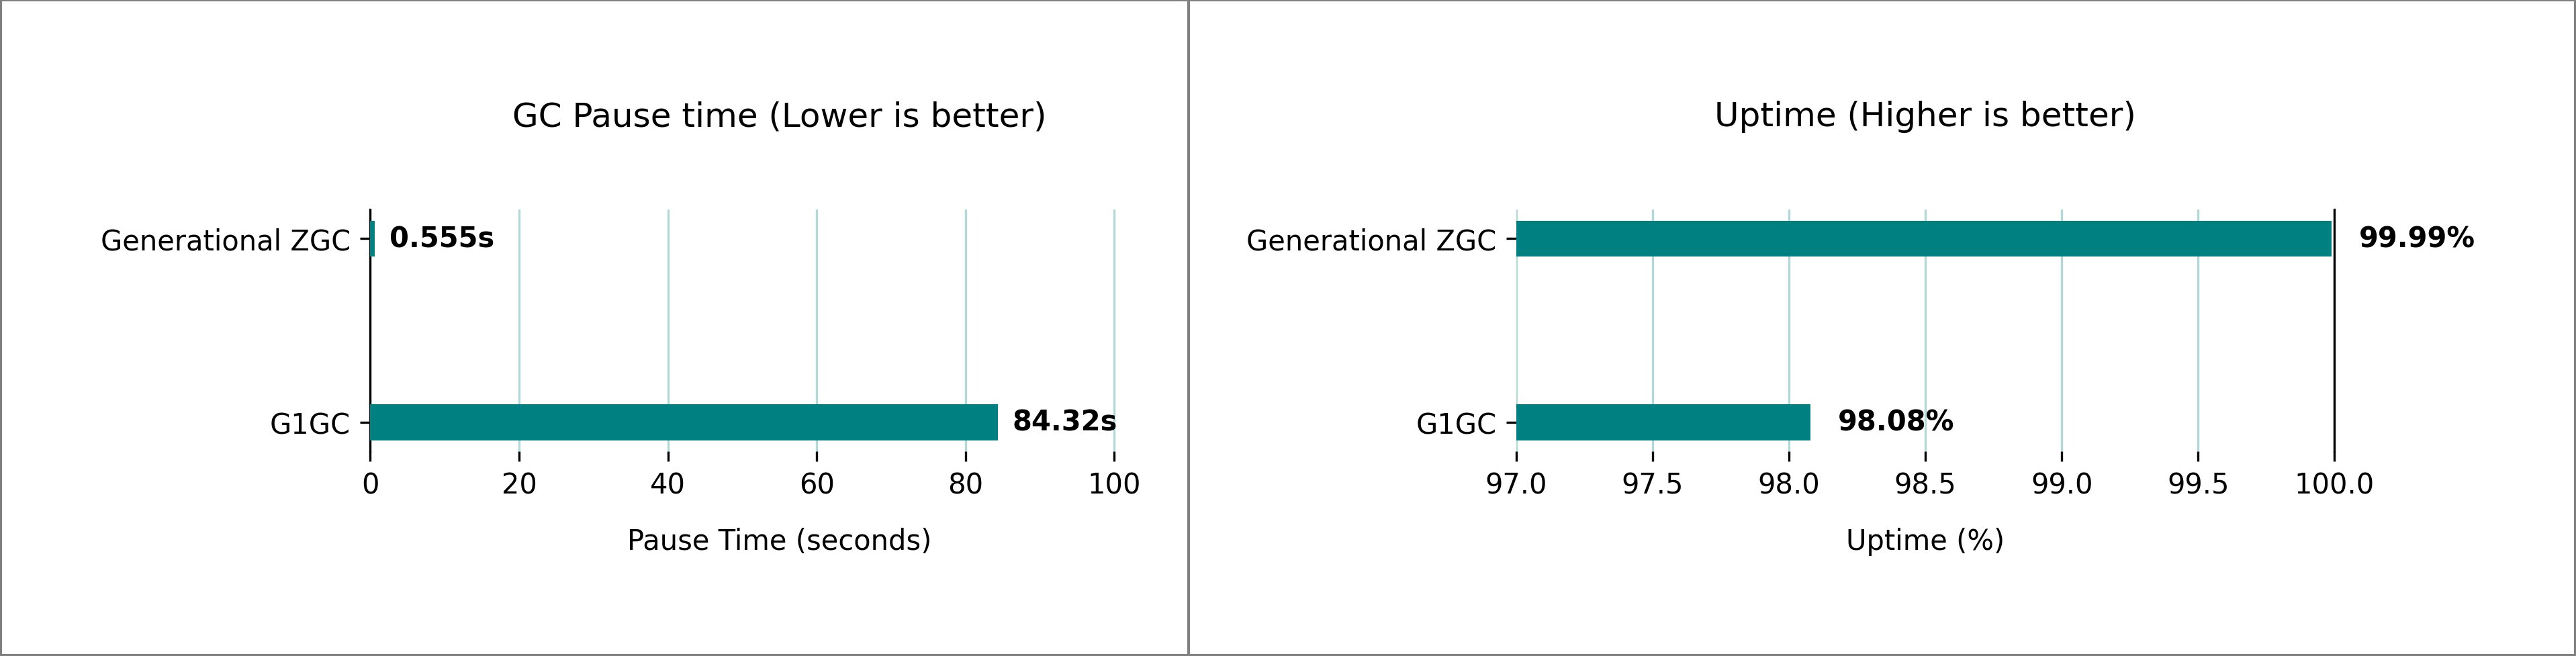
Our testing revealed significant differences in GC pause time between the generational ZGC and G1 GC for HBase on Amazon EMR 7.10. We used 1 m5.4xlarge (primary), 5 m5.4xlarge (core) nodes cluster settings and ran multiple iterations of 1-billion rows YCSB workloads to compare the GC pauses and uptime percentage. Based on our test cluster, we observed a GC pause time improvement from over 1 minute, 24 seconds, to under 1 seconds for over an hour-long execution, improving the application uptime from 98.08% to 99.99%.

We conducted extensive performance testing comparing G1 GC and generational ZGC on HBase clusters running on Amazon EMR, using the default heap settings automatically configured based on Amazon Elastic Compute Cloud (Amazon EC2) instance type. The following image shows the comparison in both GC pause time and uptime percentage at a peak load of 3,00,000 requests per second (data sampled over 1 hour).

Side-by-side comparison of Java garbage collectors showing Generational ZGC's superior pause time and uptime metrics versus G1GC

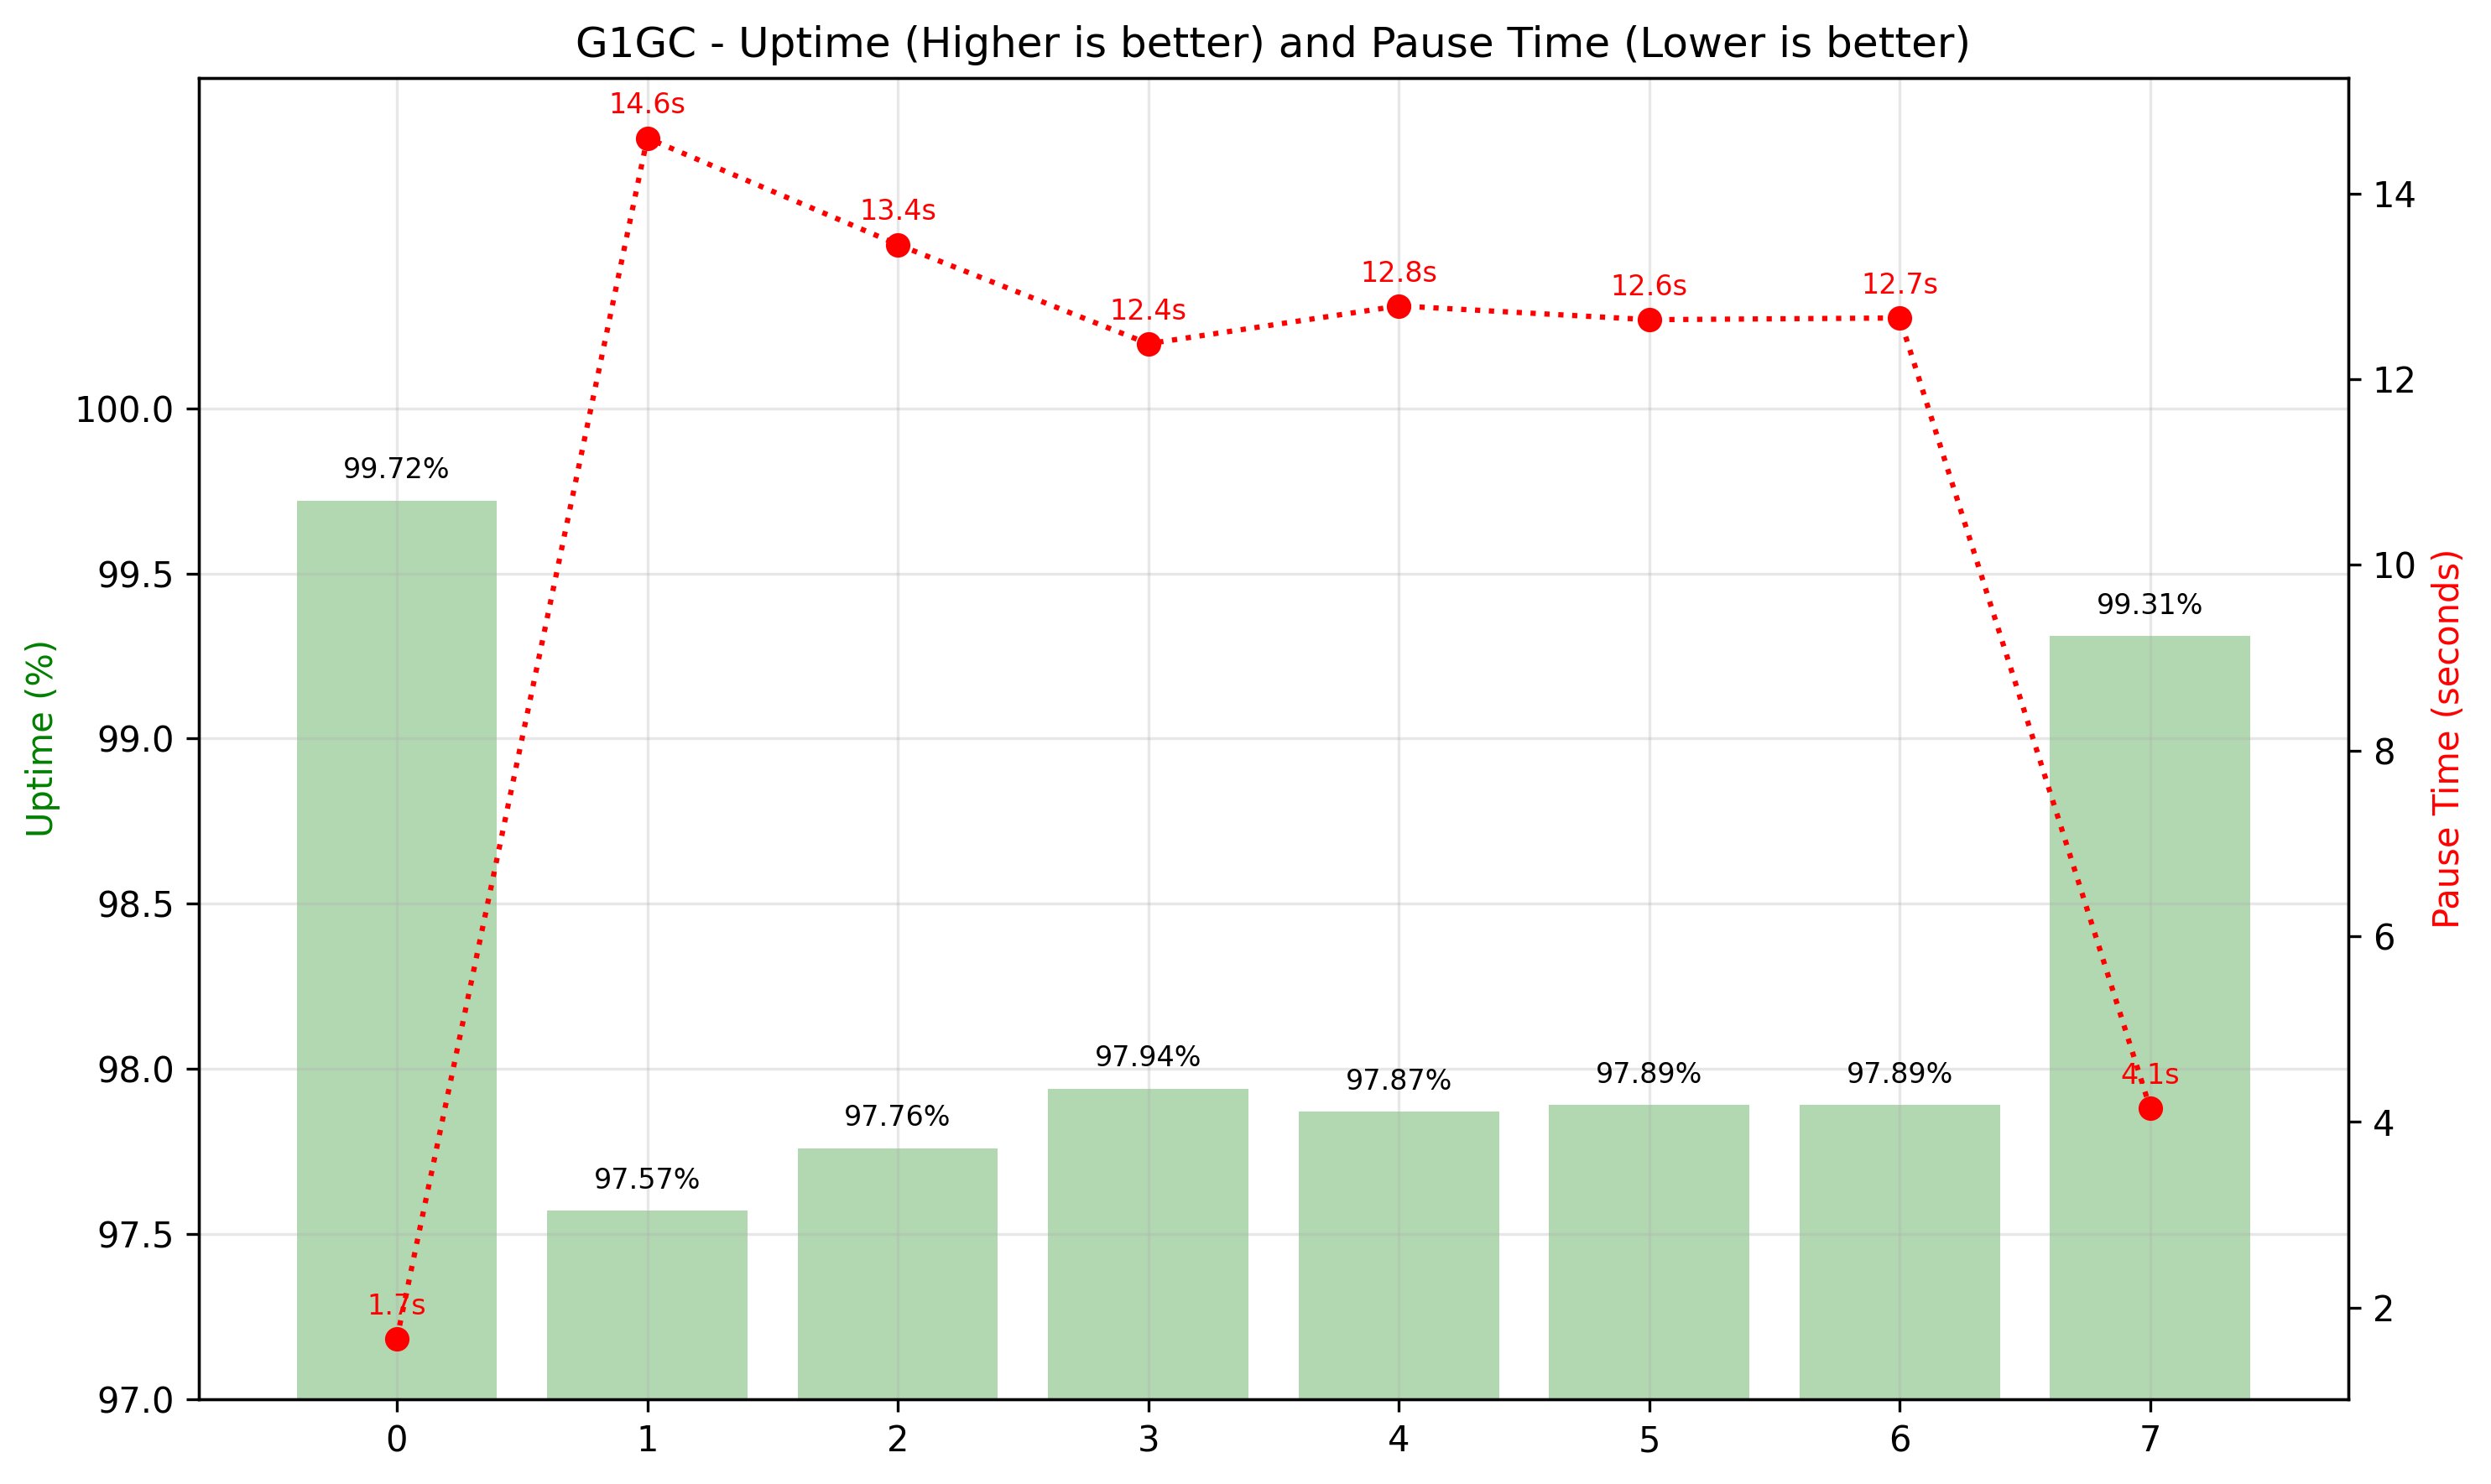
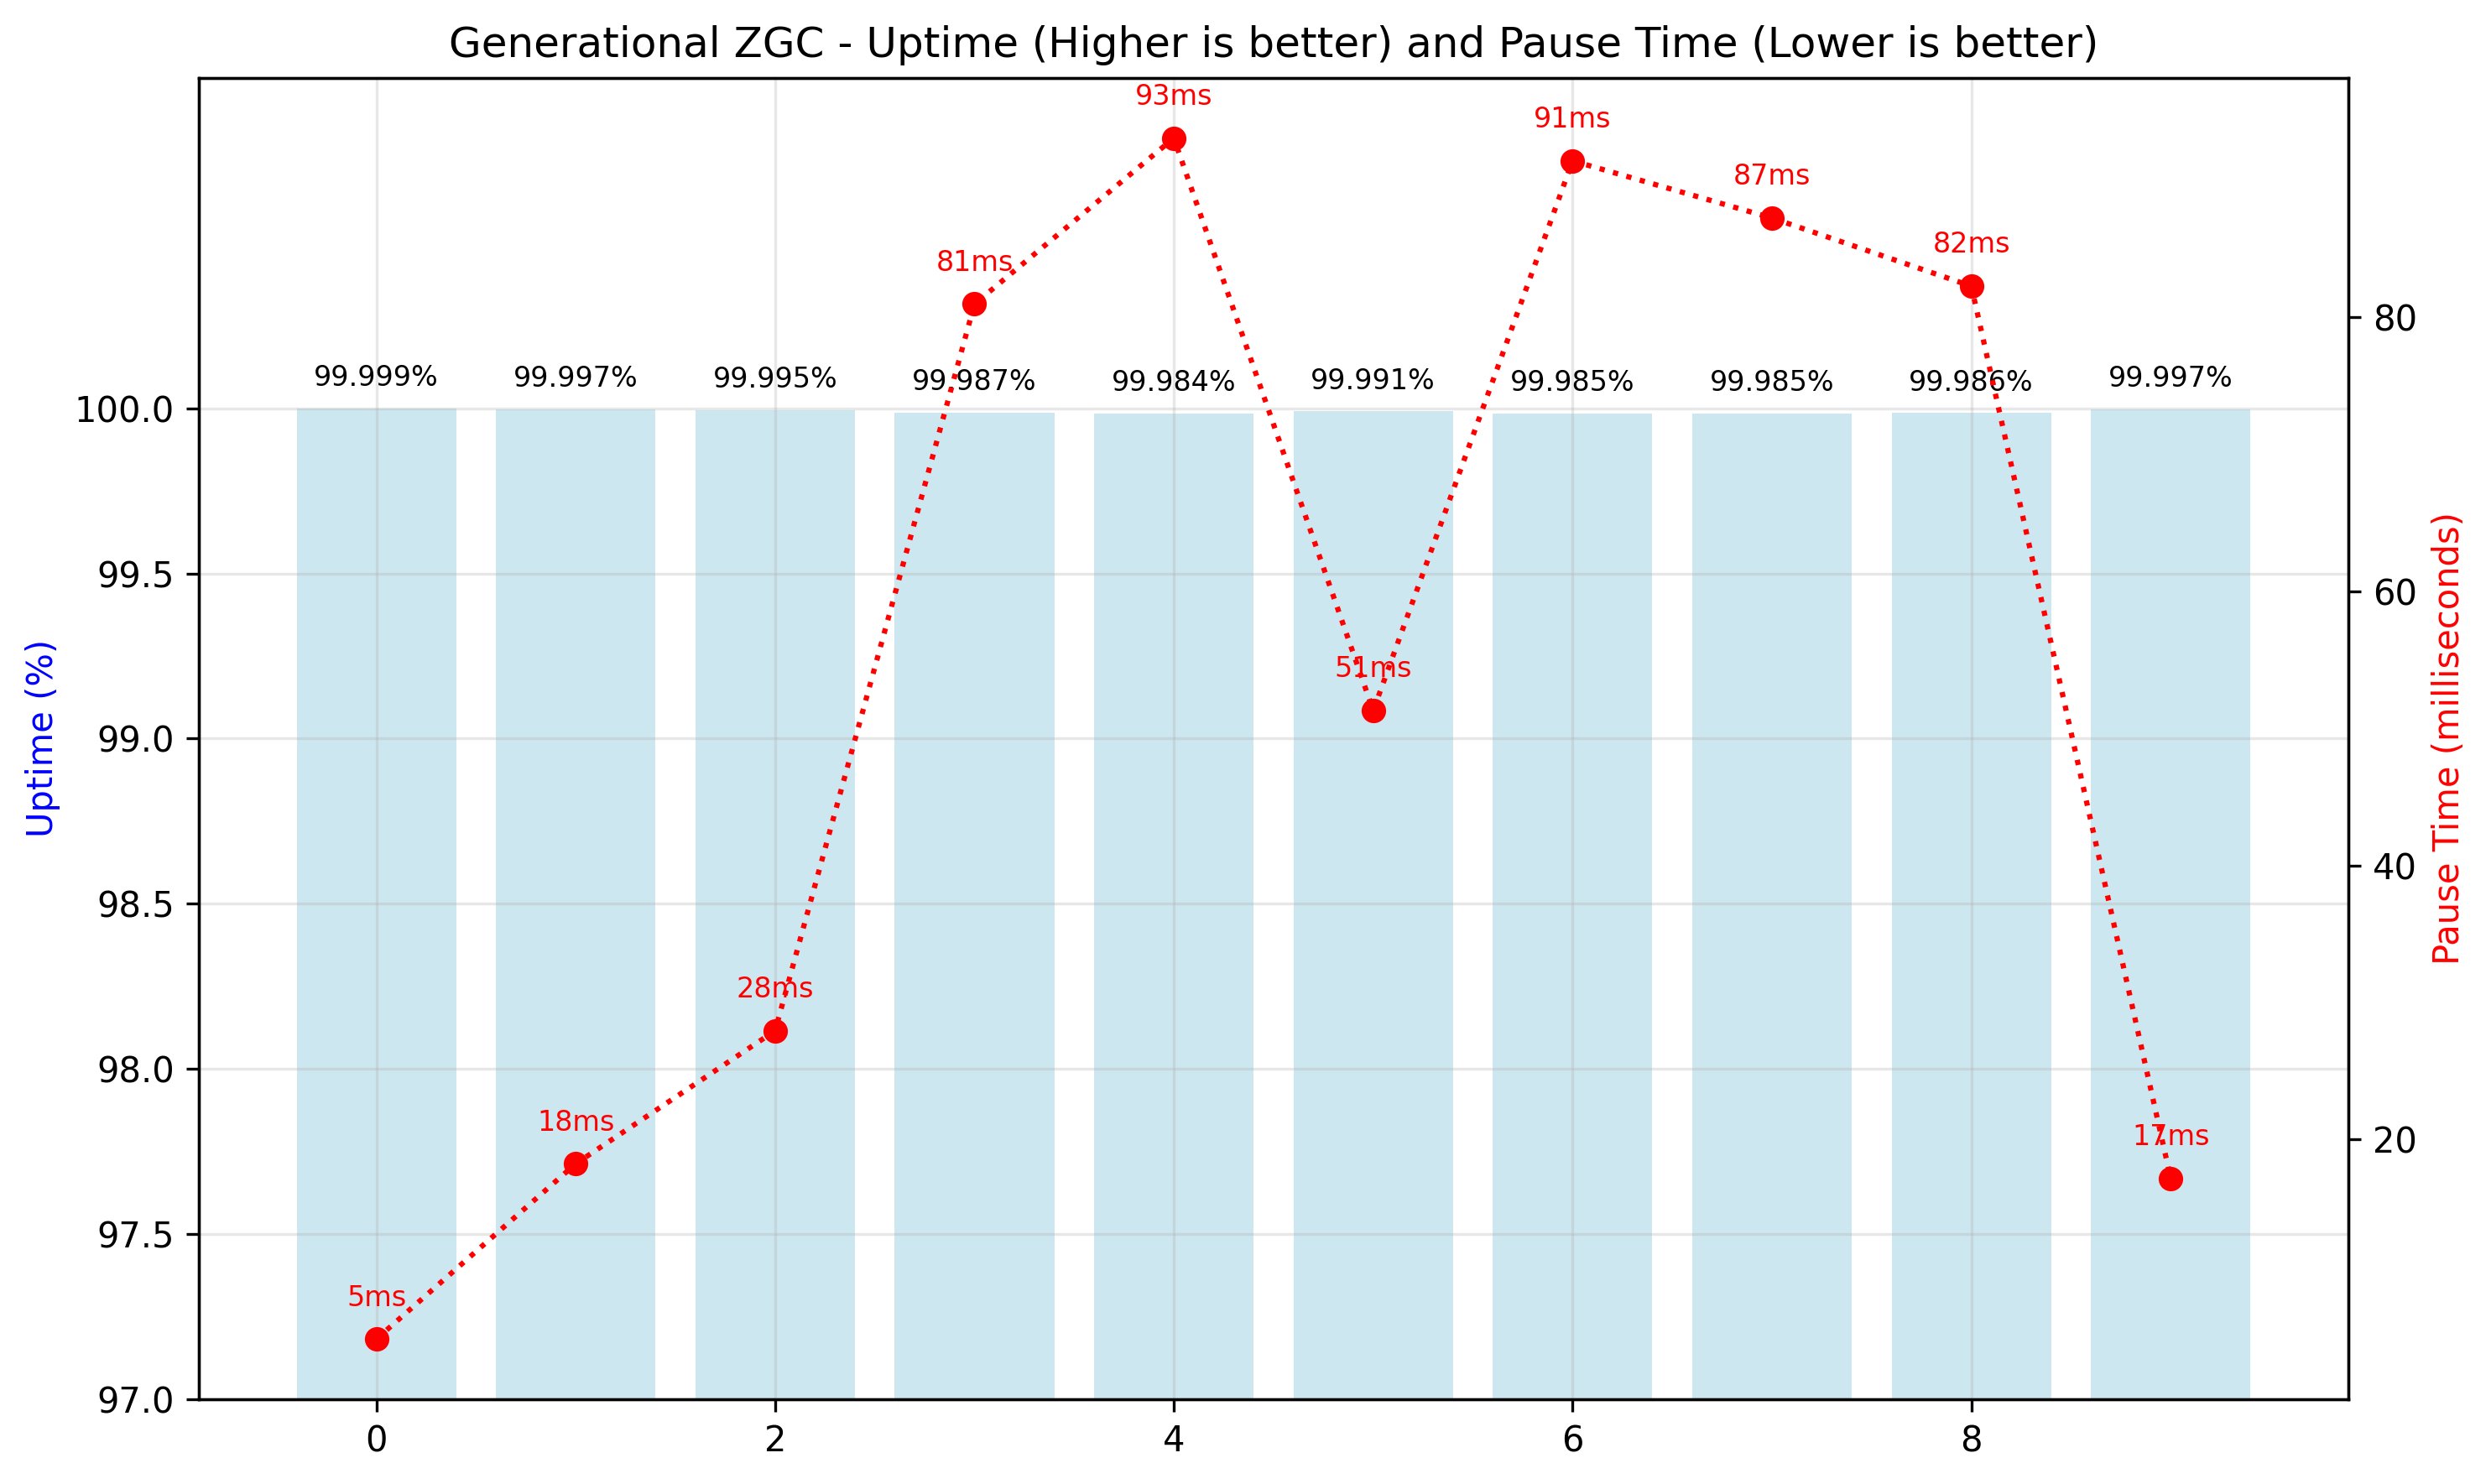
The following figures show the breakdown of the 1-hour runtime in 10-minute intervals. The left vertical axis measures the uptime, the right vertical axis measures the GC pause time, and the horizontal axis shows the interval. The generational ZGC maintained consistent uptime and pause time in milliseconds, and G1 GC demonstrated inconsistent and decreased uptime, pause times in seconds.

G1GC performance chart with dual y-axes: uptime percentage bars declining from 99.72% to 99.31%, and pause time trend peaking at 14.6s

Generational ZGC performance visualization with consistent uptime above 99.98% and fluctuating pause times peaking at 93ms

Tail latency comparison: Generational ZGC vs. G1GC in Amazon EMR HBase

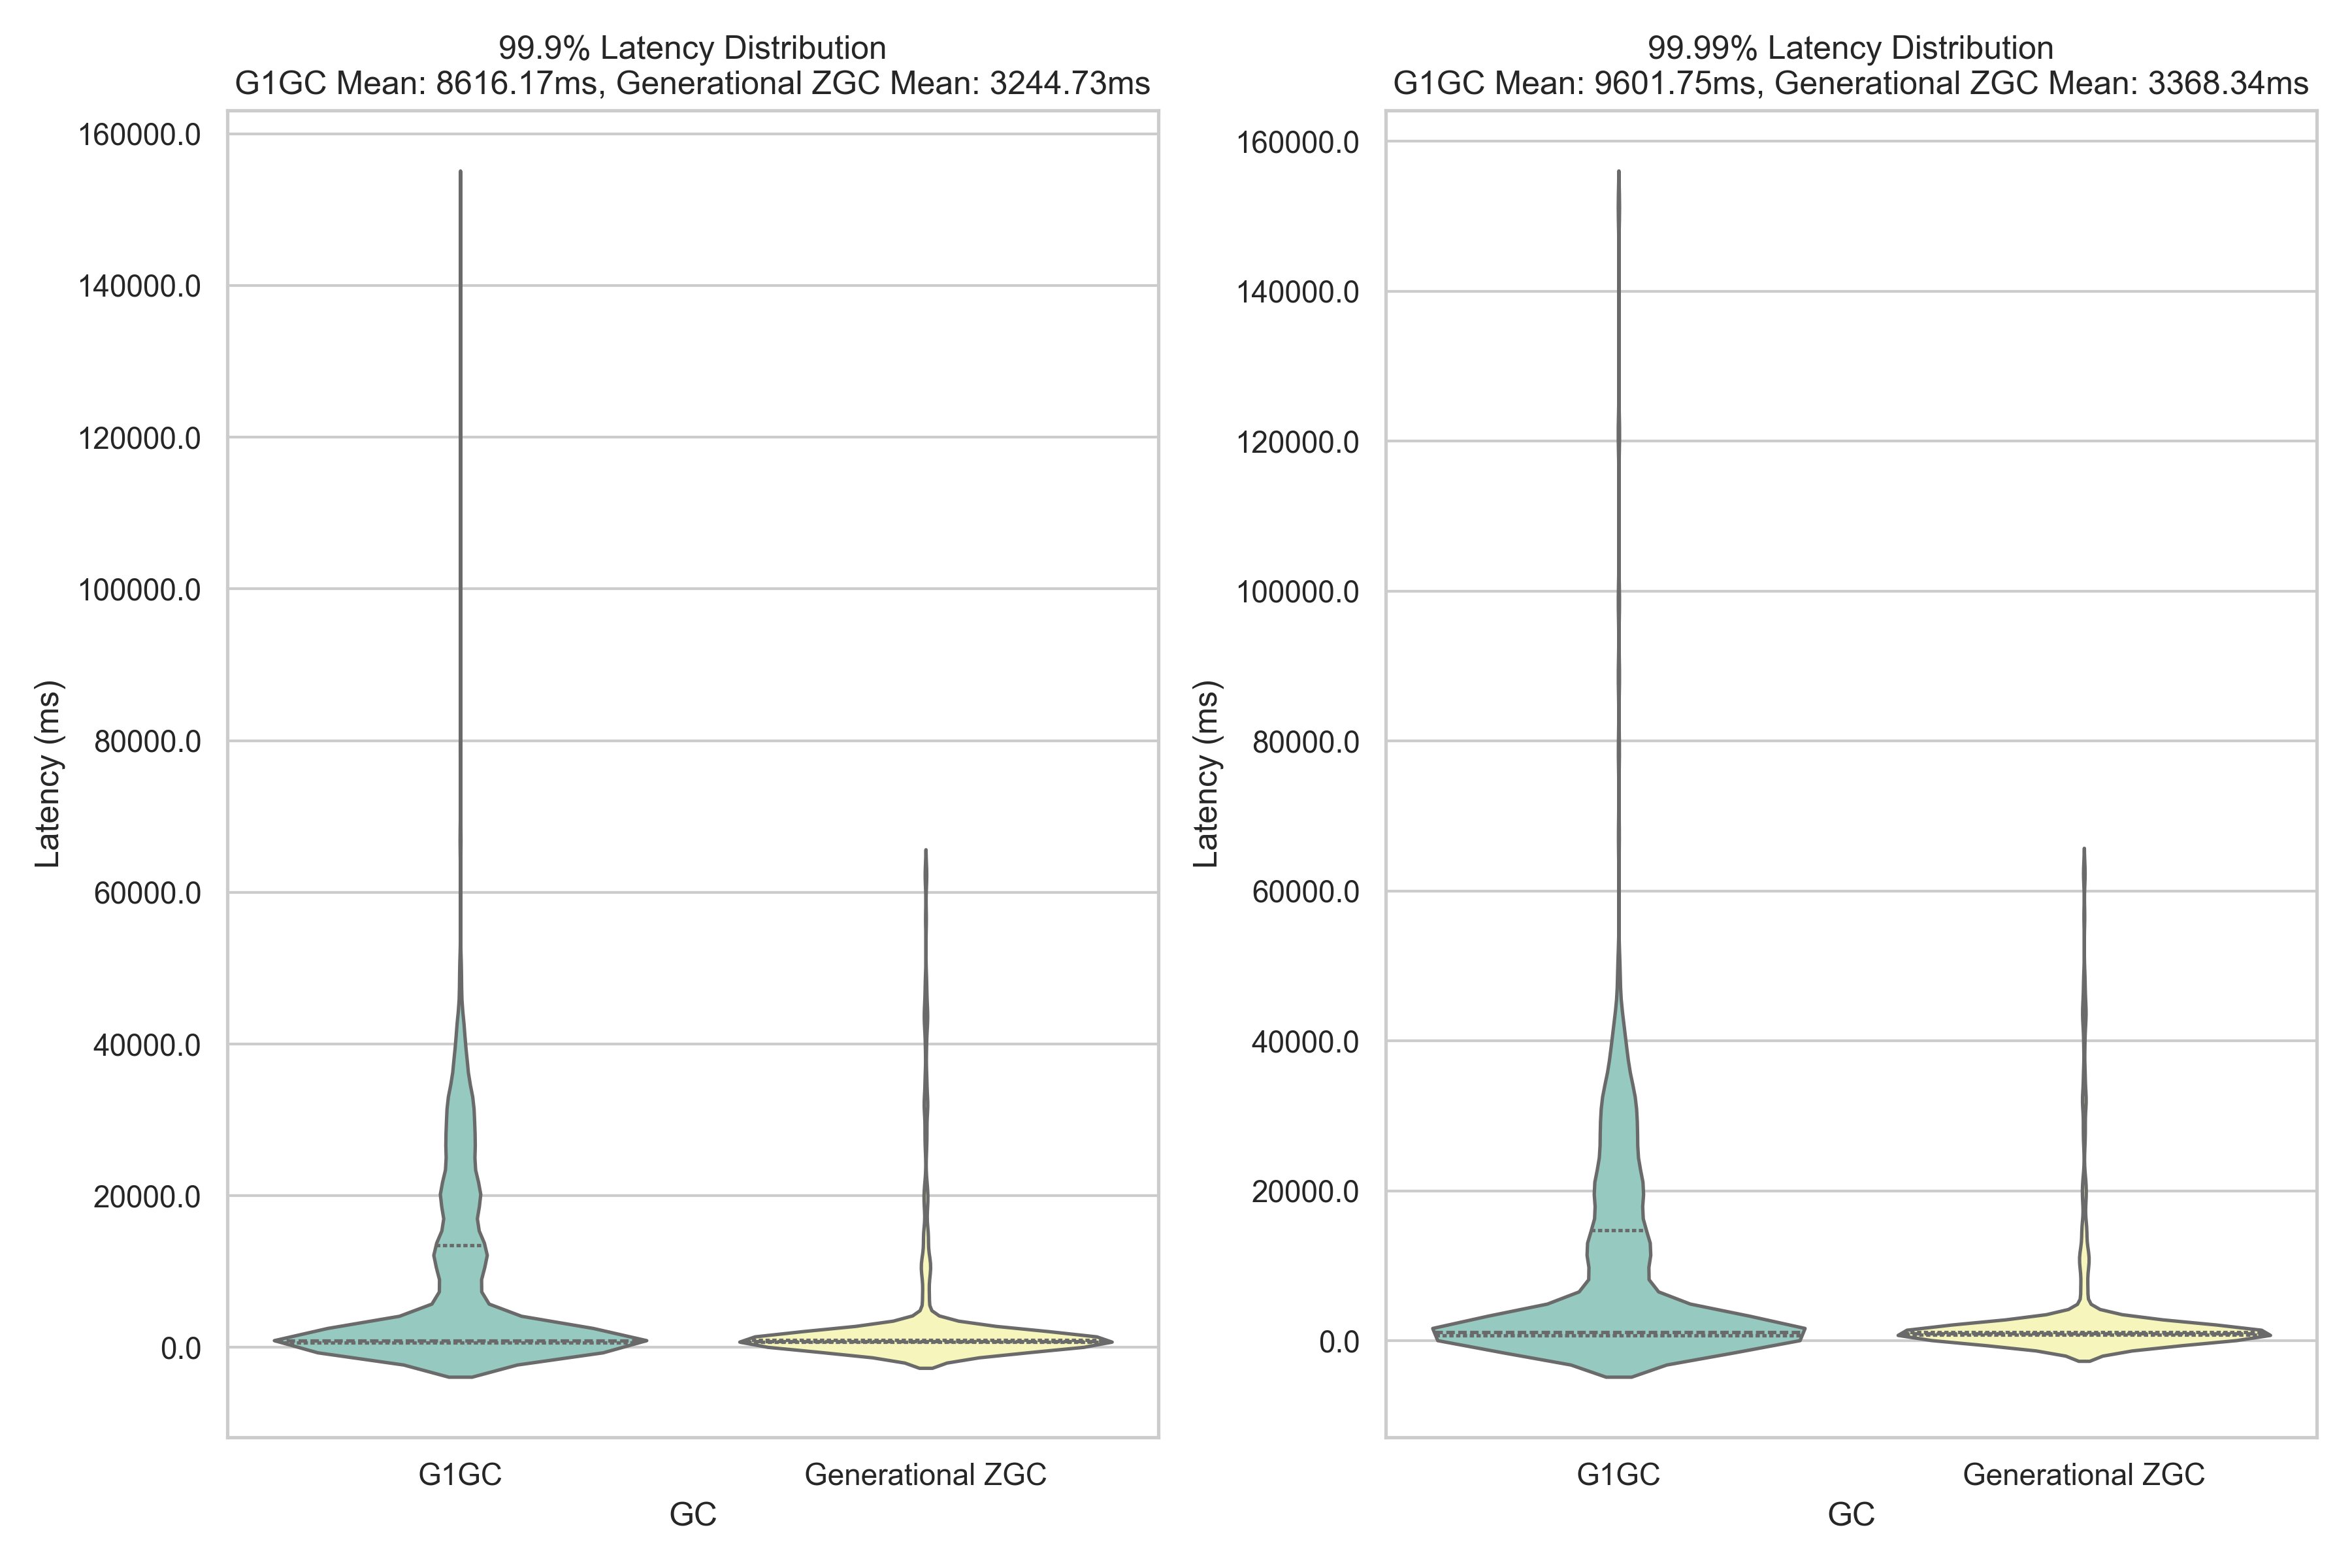
One of the most compelling advantages of generational ZGC over G1 GC is its predictable garbage collection behavior and the impact on application tail latency. G1 GC’s collection triggers are non-deterministic, meaning pause times can vary significantly and occur at unpredictable intervals. These unexpected pauses, though generally manageable, can create latency spikes that particularly affect the slowest percentile of operations. In contrast, generational ZGC maintains consistent, sub-millisecond pause times throughout its operation. This predictability proves crucial for applications requiring stable performance, especially at the highest percentiles of latency (99.9th and 99.99th percentiles). Our YCSB benchmark testing reveals the real-world impact of these different approaches. The following graph illustrates tail latency distribution between G1 GC and generational ZGC over a 2-hour sampling period :

Dual violin plot visualization comparing garbage collector latency distributions, demonstrating Generational ZGC's superior performance with lower mean latencies and tighter distribution

Improvements to BucketCache

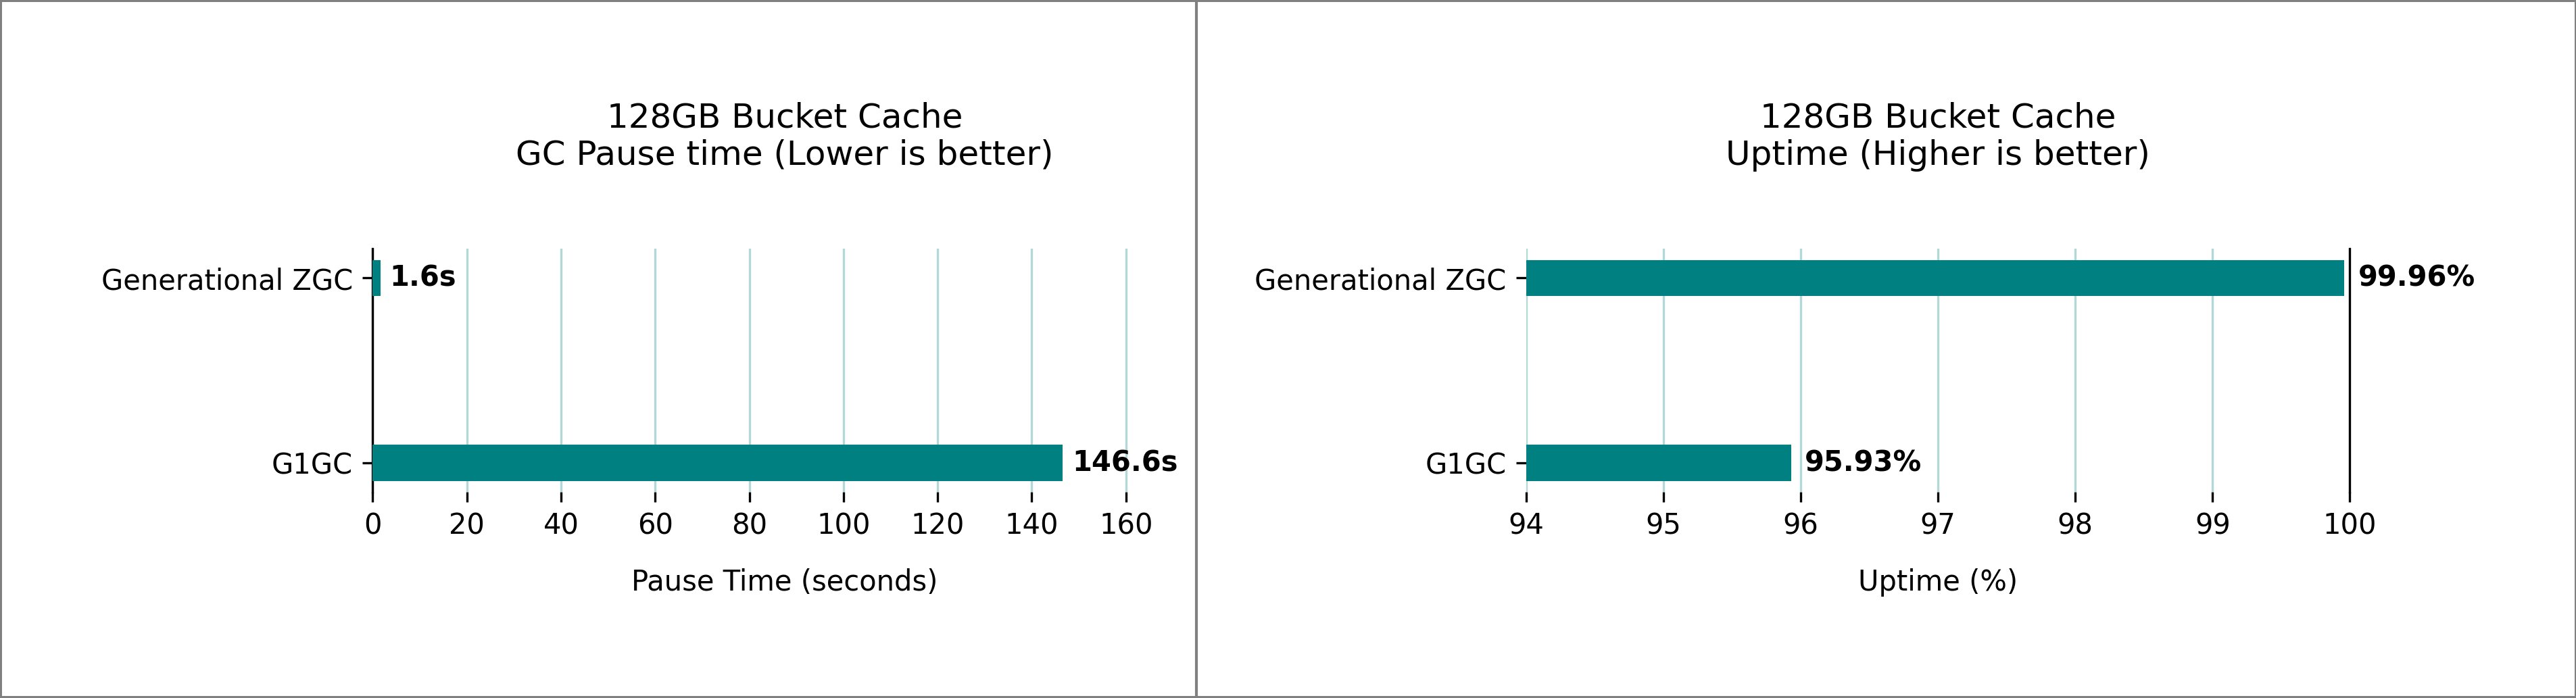
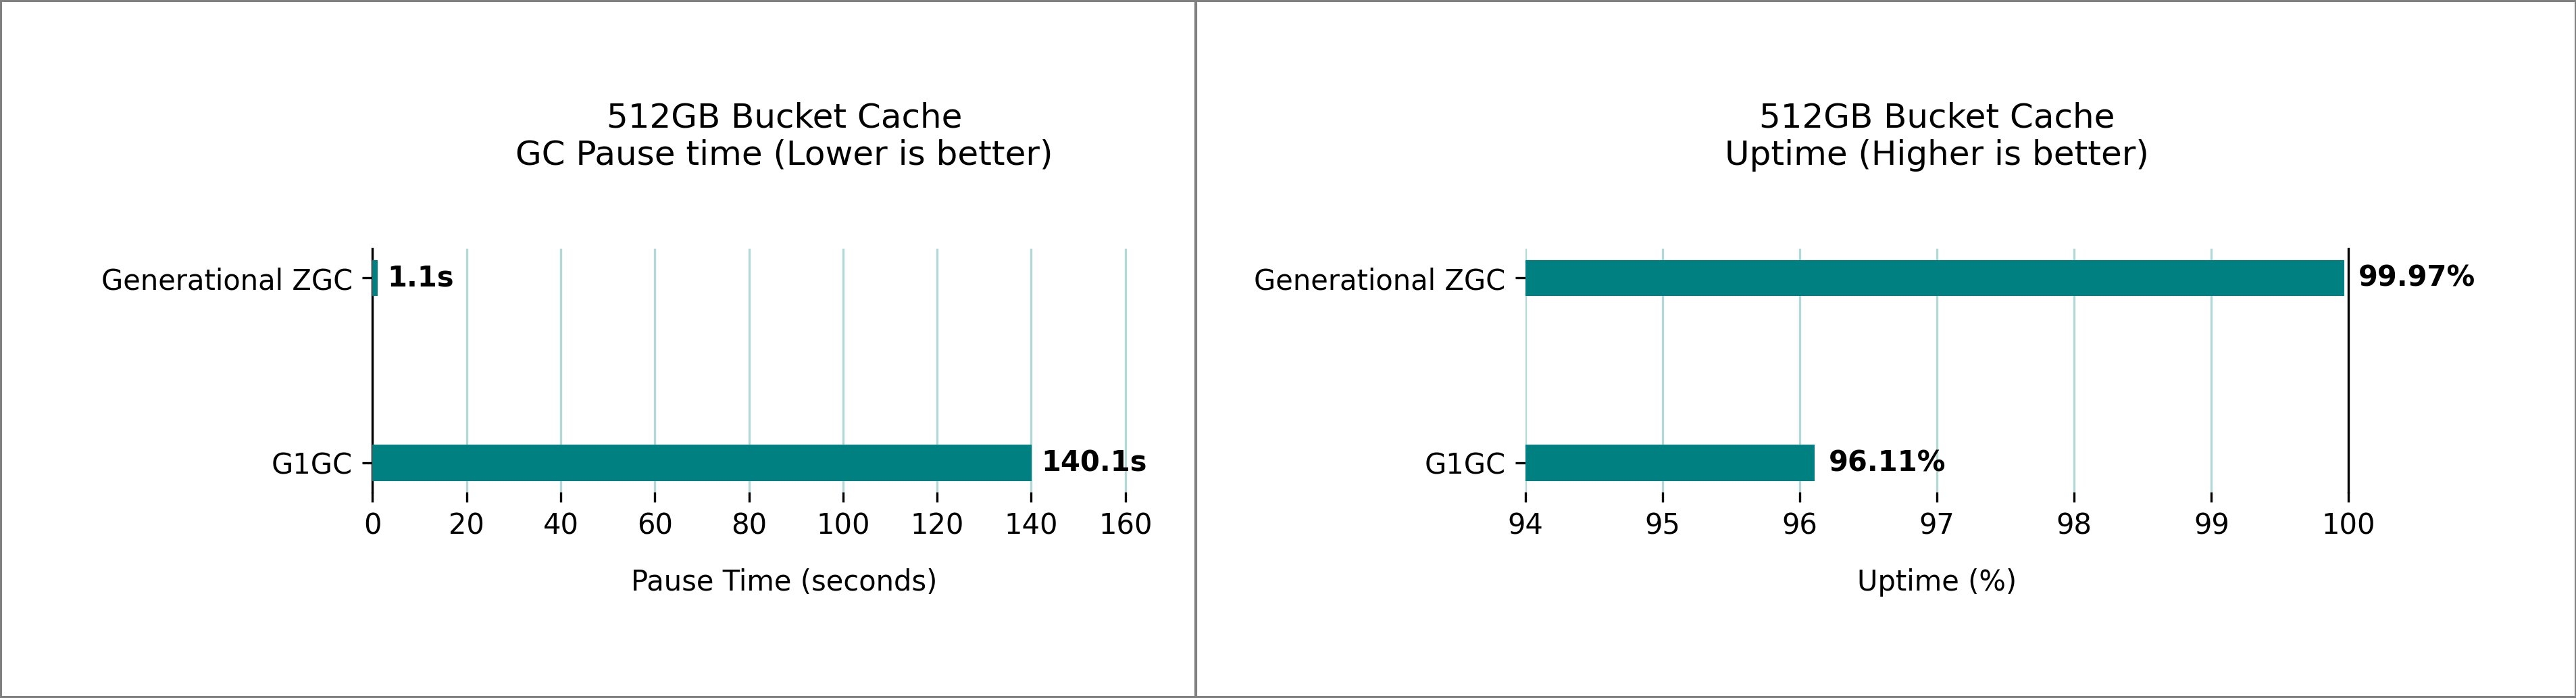
BucketCache is an off-heap cache in HBase that is used to cache the frequently accessed data blocks and minimize disk I/O. Bucket cache and heap memory works in conjunction and might increase the contention on the heap depending on the workload. Generational ZGC maintains it’s pause time goals even with a terabyte-sized bucket cache. We benchmarked multiple HBase clusters with varying bucket cache sizes and 32 GB RegionServer heap. The following figures show the peak pause times observed over a 1-hour sampling period, comparing G1 GC and generational ZGC performance.

128GB Bucket Cache performance metrics displaying Generational ZGC's superior pause times and uptime compared to G1GC implementation

Side-by-side performance metrics showing Generational ZGC's 1.1s pause time and 99.97% uptime versus G1GC's longer pauses and lower uptime

Enabling this feature and additional fine-tuning parameters

To enable this feature, follow the configurations mentioned in the Performance Considerations. In the following sections, we discuss additional fine-tuning parameters to tailor the configuration for your specific use case.

Fixed JVM heap 

Batch processing jobs and short-lived applications benefit from dynamic allocation’s ability to adapt to varying input sizes and processing demands when multiple applications co-exist on the same cluster and run with resource constraints. The memory footprint can expand during peak processing and contract when the workload diminishes. However, for production HBase deployments without any co-existing applications in the same fixed heap allocation offers stable, reliable performance.

Dynamic heap allocation is when the JVM flexibly grows and shrinks its memory usage between minimum (-Xms) and maximum (-Xmx) limits based on application needs, returning unused memory to the operating system. However, this flexibility comes at the cost of performance overhead and memory fragmentation. Dynamic allocation seemed flexible, but it created constant disruptions. The JVM was always negotiating with the operating system for memory, leading to performance overhead and fragmentation. On the other hand, fixed heap allocation pre-allocates a constant amount of memory for the JVM at startup and maintains it throughout runtime, providing better performance by reducing memory negotiation overhead with the operating system. To enable this feature, use the following configuration: :

[
    {
        "Classification": "hbase",
        "Properties": {
            "hbase.regionserver.fixed.heap.enabled": "true"
        }
    }
]

Enable pre-touch

Applications with large heaps can experience more significant pauses when the JVM needs to allocate and fault in new memory pages. Pre-touch (-XX:+AlwaysPreTouch) instructs the JVM to physically touch and commit all memory pages during heap initialization, rather than waiting until they’re first accessed during runtime. This early commitment reduces the latency of on-demand page faults and memory mappings that occur when pages are first accessed, resulting in more predictable performance especially during heavy load situations. By pre-touching memory pages at startup, you trade a slightly longer JVM startup time for more consistent runtime performance. To enable pre-touch for your HBase cluster, use the following configuration :

[
    {
        "Classification": "hbase-env",
        "Properties": {},
        "Configurations": [
            {
                "Classification": "export",
                "Properties": {
                    "JAVA_HOME": "/usr/lib/jvm/jre-21",
                    "HBASE_REGIONSERVER_GC_OPTS": "\"-XX:+UseZGC -XX:+ZGenerational -XX:+AlwaysPreTouch\""
                }
            }
        ]
    }
]

Increasing memory mappings for large heaps

Depending on the workload and scale, you might need to increase the Java heap size to accommodate large data in memory. When using the generational ZGC with a large heap setup, it’s critical to also increase the operating system’s memory mapping limit (vm.max_map_count).

When a ZGC-enabled application starts, the JVM proactively checks the system’s vm.max_map_count value. If the limit is too low to support the configured heap, it will issue the following warning :

[warning] The system limit on number of memory mappings per process might be too low for the given
[warning] max Java heap size (131072M). Please adjust /proc/sys/vm/max_map_count to allow for at
[warning] least 235929 mappings (current limit is 65530). Continuing execution with the current
[warning] limit could lead to a premature OutOfMemoryError being thrown, due to failure to map memory.

To increase the memory mappings, use the following configuration and adjust the count value in the command based on the heap size of the application.

echo "vm.max_map_count = 262144" | sudo tee -a /etc/sysctl.conf
sudo sysctl -p

sudo systemctl restart hbase-regionserver

Conclusion

The introduction of generational ZGC and fixed heap allocation for HBase on Amazon EMR marks a significant leap forward in the predictable performance and tail latency reduction. By addressing the long-standing challenges of GC pauses and memory management, these features unlock new levels of efficiency and stability for Amazon EMR HBase deployments. Although the performance improvements vary depending on workload characteristics, you can expect to see significant enhancements in your Amazon EMR HBase clusters’ responsiveness and stability. As data volumes continue to grow and low-latency requirements become increasingly stringent, features like generational ZGC and fixed heap allocation become indispensable. We encourage HBase users on Amazon EMR to enable these features and experience the benefits firsthand. As always, we recommend testing in a staging environment that mirrors your production workload to fully understand the impact and optimize configurations for your specific use case.

Stay tuned for more innovations as we continue to push the boundaries of what’s possible with HBase on Amazon EMR.


About the authors

Vishal Chaudhary is a Software Development Engineer at Amazon EMR. His expertise is in Amazon EMR, HBase and Hive Query Engine. His dedication towards solving distributed system problems is helping Amazon EMR to achieve higher performance improvements.

Ramesh Kandasamy is an Engineering Manager at Amazon EMR. He is a long tenured Amazonian dedicated to solve distributed systems problems.

AWS successfully completed its 2024-25 NHS DSPT assessment

Post Syndicated from Tariro Dongo original https://aws.amazon.com/blogs/security/aws-successfully-completed-its-2024-25-nhs-dspt-assessment/

Amazon Web Services (AWS) is pleased to announce its successful completion of the NHS Data Security and Protection Toolkit (NHS DSPT) assessment audit and achieving a status of Standards Exceeded.

The NHS DSPT is an assessment that allows organizations to measure their performance against the National Data Guardian’s 10 data security standards. All organizations that access NHS patient data and systems are expected to use the toolkit to demonstrate their compliance with safe data security standards. NHS DSPT covers standards regarding Personal Confidential Data, Continuity Planning, IT Protection, and more. AWS undergoes the assessment to provide customers with assurance that we are practicing good data security.

The AWS NHS DSPT assessment status is valid until June 30, 2026, and a certificate that confirms our compliance is available on the NHS England website and in AWS Artifact. AWS Artifact is a self-service portal for on-demand access to AWS compliance reports. Sign in to AWS Artifact in the AWS Management Console, or learn more at Getting Started with AWS Artifact.

Security and compliance is a shared responsibility between AWS and the customer. When customers move their computer systems and data to the cloud, security responsibilities are shared between the customer and the cloud service provider. For more information, see the AWS Shared Security Responsibility Model.

To learn more about our compliance and security programs, see AWS Compliance Programs. As always, we value your feedback and questions; reach out to the AWS Compliance team through the Contact Us page.

Reach out to your AWS account team if you have questions or feedback about NHS DSPT.

If you have feedback about this post, submit comments in the Comments section below.
 

Tariro Dongo
Tariro Dongo

Tari is a Security Assurance Program Manager at AWS, based in London. Tari is responsible for third-party and customer audits, attestations, certifications, and assessments across EMEA. Previously, Tari worked in security assurance and technology risk in the big four and financial services industry over the last 12 years.

Cloud Storage Myths Debunked, Part Two: Storage Isn’t a Big Enough Problem to Remediate

Post Syndicated from David Johnson original https://www.backblaze.com/blog/cloud-storage-myths-debunked-part-two-storage-isnt-a-big-enough-problem-to-remediate/

A decorative image showing devices on a cloud background.

Today’s myth might sound familiar:

Storage is a minor cost, so it’s not worth switching from major cloud providers.

It’s easy to see how this thinking takes hold. In many cloud-native projects, storage can be the last concern. Compute, networking, and database services often drive most of the costs. Storage? That’s just where your data sits.

But hidden fees, unpredictable retrieval charges, and surprising performance constraints make storage far more impactful than many teams realize—especially for cloud-native workflows.

This post is the second in our blog series unpacking four of the most common myths and misconceptions about specialized cloud storage—see the first post here—and why an interoperable, best-of-breed approach can enhance and streamline cloud-native app development.

New Cloud Native Times Call for New Cloud Storage Approaches

Learn more about how the open cloud supports faster development, improved workflows, and reduced cost complexity in our free ebook, “New Cloud Native Times Call for New Cloud Storage Approaches.”

Get the Ebook

Underestimate the importance of storage at your peril

Major cloud providers offer plenty of storage options, but the real costs aren’t always clear up front. 

The charges you don’t see coming

Between egress charges, API call fees, transaction costs, and minimum retention charges, even small changes in how your application moves or retrieves data can quickly inflate your bill.

What looked affordable at launch can snowball into sticker shock once traffic increases or new workloads start driving more data in and out of storage. A single spike in user activity or analytics queries can trigger thousands (or millions) of storage transactions, each billed individually.

These expenses add up fast, and they’re tough to predict.

The egress trap

Egress charges might be one of the best-kept open secrets among the “big three” cloud providers. Every time data leaves their environment—whether to a CDN, another cloud, or end users—egress fees kick in. And they aren’t trivial.

Frequent data transfers, a hallmark of cloud-native architectures, can quietly devour budgets. The big dogs know this. Once your data is deep in their ecosystem, pulling it out becomes financially painful.

This creates a subtle but powerful form of vendor lock-in, making it harder to shift workloads or storage to more specialized providers.

Vendor lock-in, by design

Major cloud providers bundle storage, compute, networking, and a long list of services into tightly coupled ecosystems. On paper, that integration offers convenience. In practice, it creates real friction if you ever want to move.

Even when using open standards like the S3 API, migrating workloads can require new tooling, careful planning, and extensive testing. Under tight deadlines, the mere prospect of switching providers can feel too risky to attempt.

It’s not just inertia; it’s engineered friction designed to keep you tethered.

Complex storage slows down everything

Bundling storage inside a big cloud provider’s stack might seem efficient, but it often creates fragile setups that slow teams down. Configurations get complicated fast:

  • Hot and cold storage tiers
  • Lifecycle rules
  • IAM policies
  • Interdependent compute pipelines

Every added layer increases the odds that something breaks, pulling engineers into troubleshooting instead of building.

Latency-sensitive workloads such as real-time analytics or streaming services are especially vulnerable. Even small missteps can ripple through the user experience.

And when those issues hit, teams scramble to patch things up, burning time and resources that could be better spent moving products forward.

AI workloads bring storage costs into sharp focus

AI-powered applications, from model training to updating retrieval-augmented generation (RAG) pipelines, put heavy demands on storage. These workloads hammer systems with high-throughput reads and writes.

Each refresh or update adds to your bill:

  • Delete penalties
  • Retention minimums
  • API call surcharges

When teams start rationing runs, batching updates, or delaying refreshes just to control costs, innovation slows.

Specialized storage keeps costs predictable and workloads agile

Unlike the “big three” cloud providers, who often hide complexity behind convenience, specialized cloud storage providers like Backblaze B2 take a more transparent approach:

  • Clear, predictable pricing means no surprise egress fees, retrieval costs, API charges, or deletion penalties.
  • Always-hot storage eliminates the need for lifecycle policies and tier management.
  • Open architecture means you stay in control—no proprietary hooks, no walled gardens, and no painful unwinding if your needs change down the road.

For cloud-native teams, this isn’t just a storage swap; it’s an operational upgrade. Streamlined management, lower risk, and transparent costs mean teams can focus on shipping new products and features, not decoding their storage bills.

In fact, Enterprise Strategy Group released a comprehensive analysis of the economic benefits of Backblaze B2 in May 2025. The analysis concluded that Backblaze B2’s storage costs (monthly storage cost + cost of downloads + cost of transactions) were 3.1x to 3.2x lower than alternative cloud storage providers.

Simple, transparent, affordable pricing enabled Backblaze B2 users to spend far less on storage and use the savings to innovate and grow.
—Enterprise Strategy Group

What’s next for you and storage?

If you liked this article, check out the first in the series, “Cloud Storage Myths Debunked: Hyperscaler Storage Is Good Enough for Cloud-Native Apps.” And, stay tuned for the next post in this series, where we’ll tackle myth #3, addressing whether onboarding specialized providers is too hard. (It’s easier than you think.)

Want to dig even deeper? Download the full ebook “New Cloud-Native Times Call for New Cloud Storage Approaches.”

The post Cloud Storage Myths Debunked, Part Two: Storage Isn’t a Big Enough Problem to Remediate appeared first on Backblaze Blog | Cloud Storage & Cloud Backup

The collective thoughts of the interwebz