Post Syndicated from BeardedTinker original https://www.youtube.com/shorts/yAcMqKiK1NI
[$] The Koka programming language
Post Syndicated from daroc original https://lwn.net/Articles/1033050/
Statically typed programming languages can help catch mismatches between the kinds of
values a program is intended to manipulate, and the values it actually manipulates.
While there have been many bytes spent on discussions of whether this is worth
the effort, some programming language designers believe that the type checking
in current languages
does not go far enough.
Koka, an
experimental functional programming language, extends its type system
with an
effect system that tracks the side-effects a program will have in the
course of producing a value.
Security updates for Tuesday
Post Syndicated from corbet original https://lwn.net/Articles/1034402/
Security updates have been issued by AlmaLinux (golang, openjpeg2, toolbox, and xterm), Debian (libxslt, mbedtls, openjdk-17, and webkit2gtk), Fedora (apptainer, mingw-gstreamer1, mingw-gstreamer1-plugins-bad-free, mingw-gstreamer1-plugins-base, mingw-gstreamer1-plugins-good, rust-h2, and uv), Oracle (golang, kernel, and openjpeg2), Red Hat (kernel and xterm), SUSE (389-ds, cairo, container-suseconnect, kernel, lua51-luajit, postgresql13, and trivy), and Ubuntu (linux, linux-aws, linux-aws-6.14, linux-gcp, linux-gcp-6.14, linux-oracle,
linux-oracle-6.14, linux-raspi, linux-realtime and openldap).
Proxy Group Load Balancing with SNMP Traps
Post Syndicated from Nathan Liefting original https://blog.zabbix.com/proxy-group-load-balancing-with-snmp-traps/31042/
The new Zabbix proxy groups provide us with a method to provide both redundancy and load balancing in our Zabbix proxy setups. However, one major limitation arises when we want to use SNMP traps with these new proxy groups – it isn’t natively supported at the moment. One of our customers asked me to find a solution to that problem, so here’s how I went about it.
Getting to grips with the problem
As mentioned, many of us are now facing a problem. Either we use proxy groups and we don’t use SNMP traps, or we use proxy groups and move SNMP traps to a single proxy. Unfortunately, this is unacceptable for many environments where SNMP traps might be an essential part of monitoring. The problem, however, stems from how snmptrapd works in combination with Zabbix reading the trapper file. Improvements have already been made to provide for more room when creating our own solutions like this.
Other Zabbix users have also been proposing solutions and I’m sure Zabbix is looking into improvements. Here’s an example case to vote on.
However, that doesn’t solve many of our issues now. The problem starts when we are sending SNMP traps to a single proxy (Proxy 1 for example) and a Zabbix host (let’s say Zabbix host 2) is assigned to another proxy in the proxy group (Proxy 2 for example). In this situation, the trap is coming in on an incorrect monitoring proxy and Zabbix won’t be able to read the trap. It will simply not add it to the Zabbix database and ignore it.
The solution here is simple – we can configure our monitoring target like a switch or a router to send the SNMP trap to multiple sources. However, this will cause our trap to be sent over the network multiple times, increasing the load on our network. This is acceptable for smaller setups, but we were dealing with a setup that is sending hundreds of traps every second.
Finding a solution
With the problem laid out for us, we came up with a simple duplication setup that included these requirements:
- Simple and easy to maintain/troubleshoot
- Traps could only be sent over the network once
- Works fast between failovers
- Works with both redundancy and load balancing
- Minimal extra packages
- No easily corruptible shared file systems
What we came up with in the end is visible in the image below:
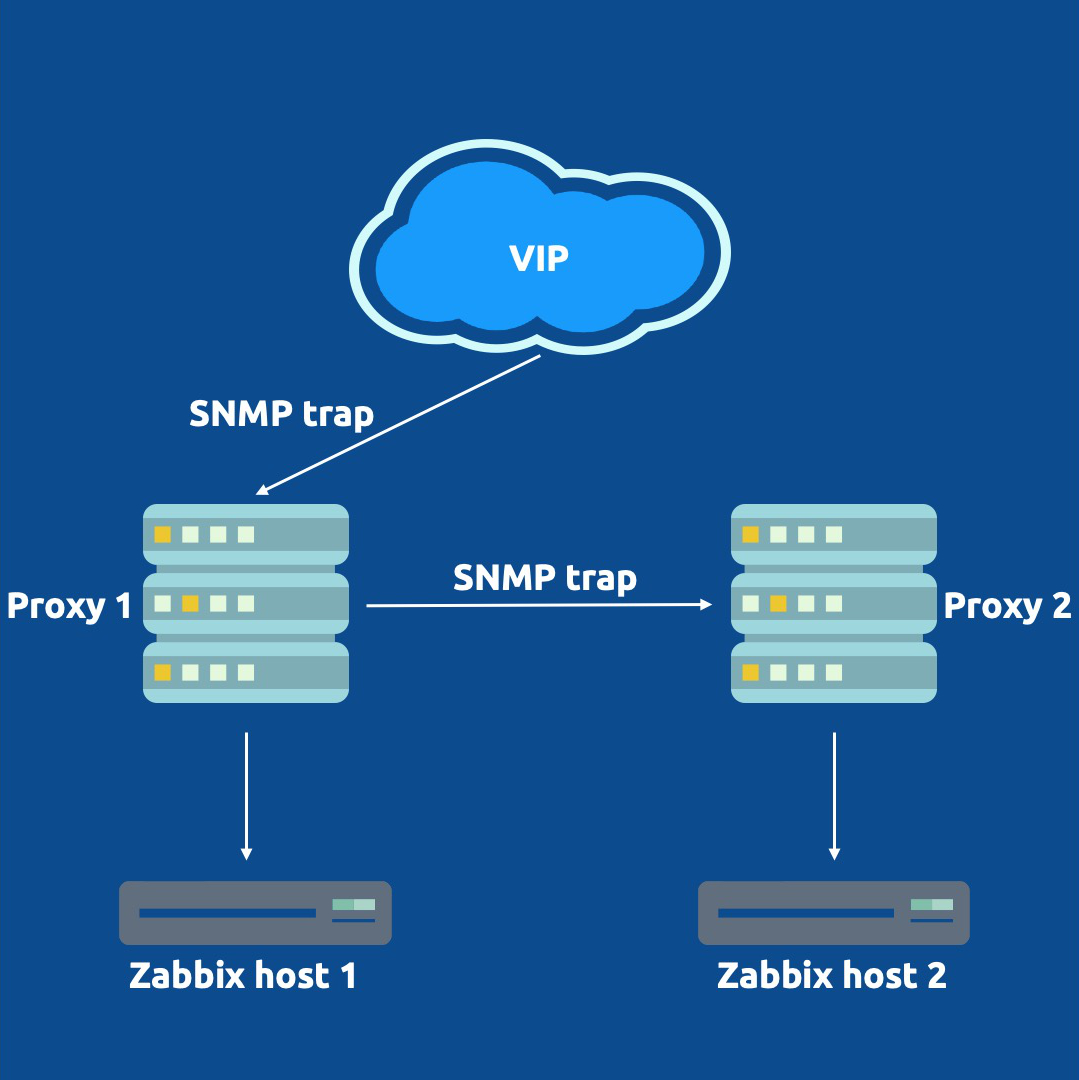
It’s a simple setup that requires us to install 2 extra packages and a container.
First, we added a VIP to our proxy setup using keepalived, to provide our monitoring targets with a single SNMP trap destination. The VIP will be available on one proxy at the time, regardless of whether there are 2, 10 or more proxies in the proxy group. Our switches, routers, or any other SNMP trap host can now be configured to send traps to this VIP.
Second, we needed a way to duplicate our traps. Since only one proxy is going to be receiving traps, the other proxies still need to be able to receive the traps. Without the duplication and the VIP being present on Proxy 1, Zabbix host 2 still would not receive its trap. We installed Docker and created a tiny, lightweight container on our hosts to duplicate the SNMP trap from one proxy to all other proxies in the group. Admittedly this does slightly go against requirement number 2, as we are now sending the trap over the network between proxies. This is, however, all within our own more localized infrastructure instead of over a longer network.
That’s it! Whenever Proxy 1 receives a trap, it will now duplicate it to Proxy 2. The proxy with the host being monitoring will parse the trap correctly to Zabbix and the other proxies will ignore the trap. Even if the proxy restarts, fails over, or suddenly goes down, it will not read the trap twice.
The only thing to keep in mind is that it can take some time for keepalived to fail over the VIP. With SNMP traps being UDP-based, this means that any traps sent to the VIP while snmptrapd is down won’t be parsed. However, it’s definitely better to lose some in case of failover, than to lose all upon outage!
The post Proxy Group Load Balancing with SNMP Traps appeared first on Zabbix Blog.
Zero-Day Exploit in WinRAR File
Post Syndicated from Bruce Schneier original https://www.schneier.com/blog/archives/2025/08/zero-day-exploit-in-winrar-file.html
A zero-day vulnerability in WinRAR is being exploited by at least two Russian criminal groups:
The vulnerability seemed to have super Windows powers. It abused alternate data streams, a Windows feature that allows different ways of representing the same file path. The exploit abused that feature to trigger a previously unknown path traversal flaw that caused WinRAR to plant malicious executables in attacker-chosen file paths %TEMP% and %LOCALAPPDATA%, which Windows normally makes off-limits because of their ability to execute code.
More details in the article.
Dedication to digital education in Bangladesh: Meet Shajan
Post Syndicated from Sophie Ashford original https://www.raspberrypi.org/blog/dedication-to-digital-education-in-bangladesh-meet-shajan/
We love hearing from members of the community and sharing stories of amazing young people, volunteers, and educators who are using their passion for technology to create positive change in the world around them.
Today, we introduce Shajan, a digital storyteller and senior business advisor at the BBC, whose extraordinary personal and professional journey has led him to champion digital literacy for young people in Bangladesh.

Family roots in Bangladesh
Shajan is British-born, but his roots deeply connect him to Bangladesh. This connection was instilled by childhood holidays to Bangladesh, as well as his late father, who emigrated to the UK in the 1960s but always encouraged Shajan to maintain ties with the community he left behind. Shajan’s pull towards Bangladesh intensified after his father’s passing fifteen years ago.
“I always thought I’d like to do something, carry on the work he left behind with efforts in building schools and supporting his local community.”
The memory of his sister Khela, who passed away at just 12 years old while in Bangladesh, also motivates Shajan. He says, “She was a really creative person, really into her arts and crafts and learning.”
Khela’s loss fuels Shajan’s desire to do something specifically for the young people of Bangladesh, connecting with their potential for creativity and learning.
Setting off on a new path
Shajan’s 15 years of working for the BBC led him to discover the power of digital education. In 2015, he project-managed the BBC’s “Make It Digital” campaign, a UK-wide initiative addressing the National Digital Skills Gap.
As part of this, he led partnerships with organisations like Code Club.
“That experience showed me how digital tools could unlock creativity in young people and build their confidence.”
During his visits to Bangladesh, Shajan observed a widening digital divide. Young people, especially in rural areas, lacked access to basic internet and computers. Teachers faced heavy workloads, and many students needed to pause their education to support their families. Seeing no equivalent to Code Club in Bangladesh to inspire young people, Shajan felt he had to act. Before he knew it, he was requesting a six-month career break.
“I said, ‘This is what I always wanted to do. If I don’t do it now, I will miss the opportunity.’”
With the support of both the BBC and Code Club, Shajan packed his bags and moved to Dhaka, the capital city of Bangladesh.
Creating a movement
Shajan’s initial goal was to raise awareness and build a sustainable model for Code Club in Bangladesh. Recognising that teachers needed support to run clubs, Shajan’s strategy was to engage university students as volunteers. He organised a national coding festival, leveraging these student volunteers to connect with schools and prepare young participants for a Scratch-based project challenge. The event received lots of media attention, encouraging interest and inspiring a new generation of coders.

However, there were some hurdles that had to be worked around, including unreliable internet connections, limited access to computers, and unstable electricity supply. Beyond practical challenges, Shajan faced a crucial mindset shift.
“Not everybody’s convinced yet that their children should be doing coding. For many families, generating immediate income takes precedence over digital education. Balancing the need to put food on the table with the long-term benefits of coding remains a constant battle.”
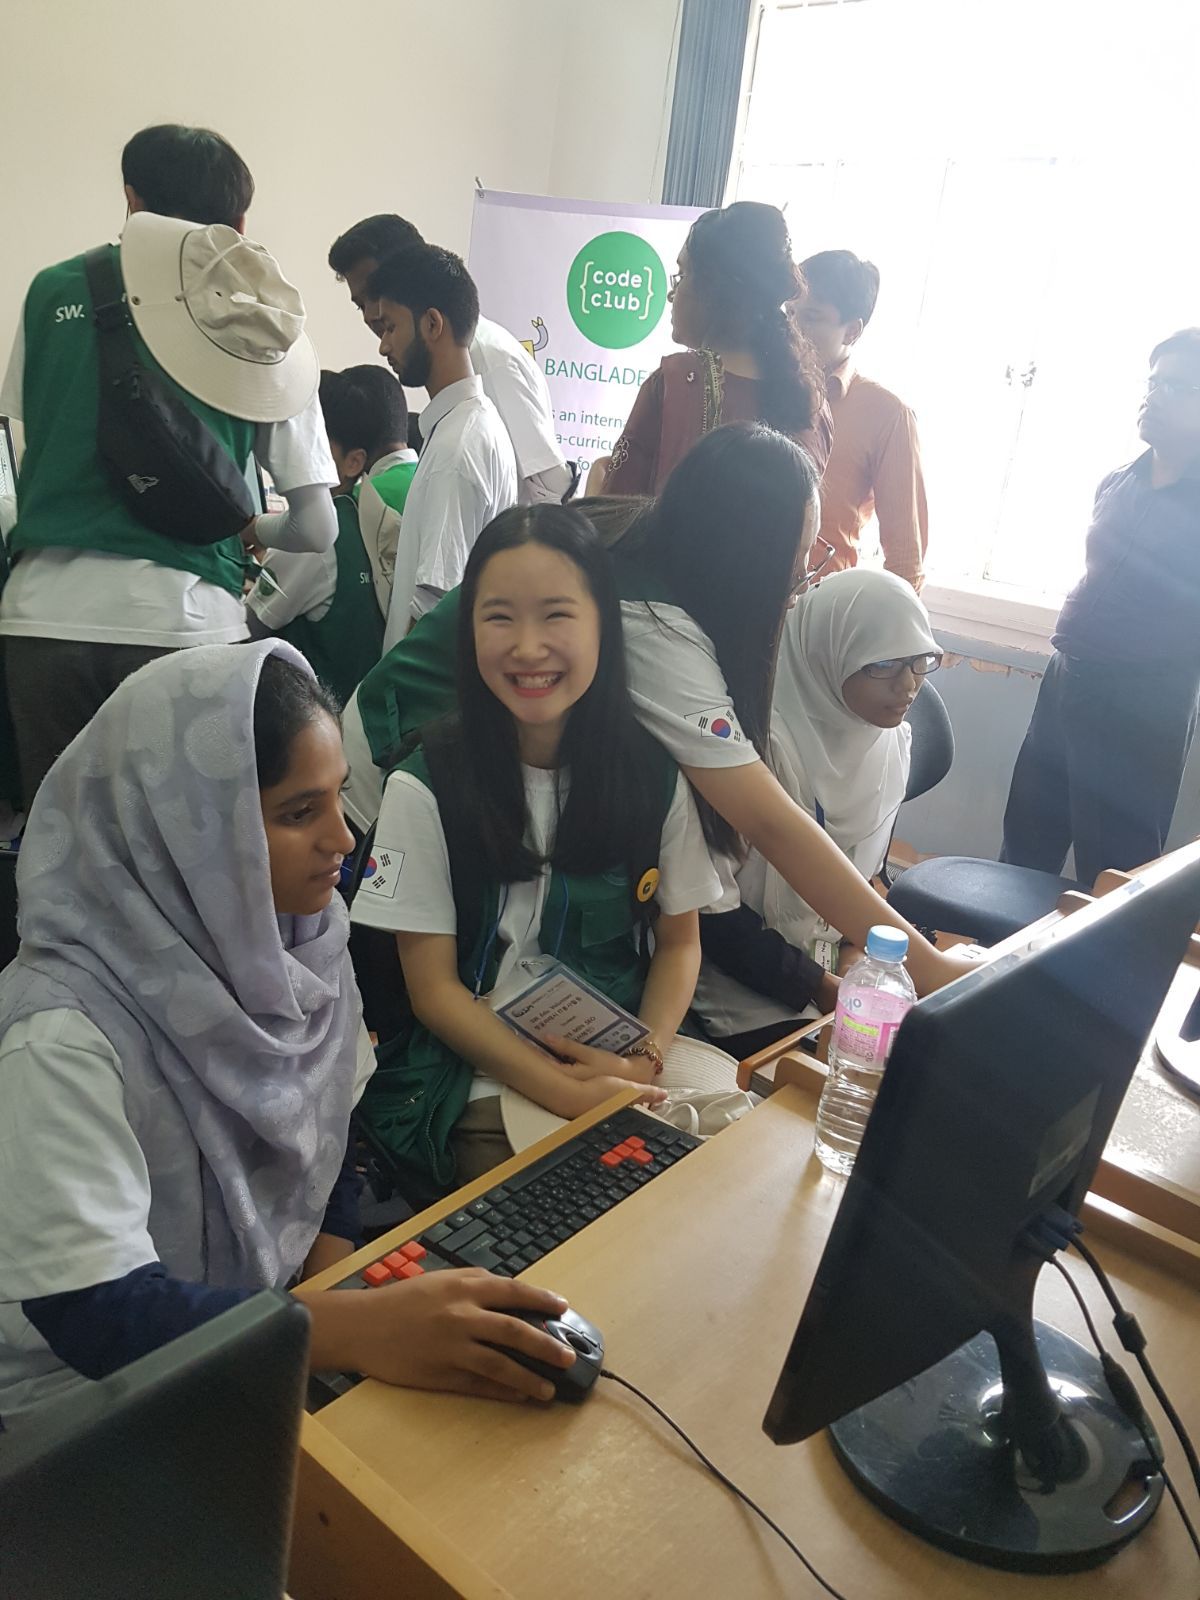
Despite these obstacles, Shajan’s efforts proved successful. Some of the creators from the 2016–2017 classes, now in their twenties, have pursued computer science and now share how Code Club helped them on their paths. He also organised an incredible exchange program, bringing creators and mentors from Code Club South Korea to Bangladesh for a seven-day visit. Despite not sharing a language, creators connected through the language of code, an experience Shajan describes as inspiring for the young people and adults alike.
A new chapter
Shajan’s focus now is to launch a Coolest Projects event in Sylhet, the place his father was born and a region he wants to focus on before taking Coolest Projects national as well.
He is actively engaging with teachers and student volunteers across the city, with strong support from Nooraiya Khan, an ICT Lecturer with a background in computer science. Nooraiya is working hard with Shajan to co-lead all Code Club activities in Bangladesh, bringing valuable expertise and shared passion to the movement.
Shajan believes the current digital landscape offers new opportunities. He is a strong advocate for the role of artificial intelligence (AI) in education, viewing it as a way to help bring opportunities to all young people. He plans to introduce AI-focused Code Club projects to Bangladesh, ensuring the next generation is prepared for a future driven by technology.
For Shajan, Code Club Bangladesh is “for everybody”. He wants to ensure that no child, especially girls and those from underserved communities, is left behind. He would welcome anyone interested in helping the young people of Bangladesh, including teachers, educators, tech professionals, and government bodies, to join Code Club Bangladesh’s journey.
If you’d like to support young people in your community to explore coding, why not start a Code Club? The team will support you every step of the way with resources, training, and a collaborative community.
Find out more on the Code Club website.
The post Dedication to digital education in Bangladesh: Meet Shajan appeared first on Raspberry Pi Foundation.
Data mesh at Grab part I: Building trust through certification
Post Syndicated from Grab Tech original https://engineering.grab.com/signals-market-place
Introduction
At Grab, our journey towards a more robust and scalable data ecosystem has been a continuous evolution.
Considering the size of our data lake and complexity of our ecosystem, with businesses spanning across ride hailing, food delivery, and financial services, we have been long past the point where a single centrally managed data warehouse could serve all these data needs. Over its first decade, Grab experienced dramatic growth. Like most growing businesses, teams in Grab prioritised delivering new features to meet the demands of their users. This meant that the task of data maintenance had to take a back seat so that development and stabilisation works can be focused to keep up with the growth. However, to prepare Grab for the next 10 years, especially for a future where AI is likely to play an important role, our leadership understood the need for high quality data foundation and gave a mandate to our data teams to uplevel our entire enterprise data ecosystem.
Acknowledging the rising need for data-driven insights and the continuous expansion of our data repository, we initiated our data mesh journey, named the Signals Marketplace, in 2024.
However, this journey was far from simple. We encountered several critical challenges that required a significant transformation in our approach to data management. Some of the challenges encountered include:
-
High volume and variety of data being generated: Grab’s diverse operations created both opportunities and complexities. Effectively harnessing this wealth of information required a scalable, streamlined and accessible approach.
-
Gaps in data ownership: As our data landscape expanded, maintaining data quality and reliability became increasingly difficult without clear lines of ownership and accountability. This often led to ad-hoc discussions and delays in resolving data related issues. Since it was difficult to trust the reliability of an existing pipeline, teams were likely to create duplicate pipelines just so they have something they can control.
-
Unscalable reliance on central Data Engineering (DE) team: Our traditional reliance on a central DE team to curate and serve all data needs was becoming a bottleneck. This centralised model struggled to keep pace with the distributed nature of data creation and consumption across various product and engineering teams.
-
Lack of communication between data consumers and producers: Data producers are unaware of downstream dependencies of their data which led to several instances of critical pipelines breaking because of upstream changes.
-
No single source of truth: While we did have a central data warehouse, it still left a lot of data gaps across Grab’s many business lines. Teams would struggle to identify the correct data definitions and reliable sources of truth.
-
Varied sophistication of data practitioners: Different teams have different levels of expertise in regards to data. Some teams had dedicated data engineers, but many didn’t.
To address these challenges, we made a strategic decision to adopt a data mesh architecture. Data mesh is a decentralised approach to data management that treats data as a product, owned and served by domain specific teams. This paradigm shift empowers teams closest to the data to take responsibility for its quality, reliability, and accessibility.
Our primary goal in adopting a data mesh was to significantly increase the reusability and reliability of our data assets across the organisation. By fostering a culture of data ownership and providing the necessary tools and processes, we aimed to unlock the full potential of our data to drive innovation and better serve our users and partners.
Certification
A cornerstone of our data mesh implementation is the concept of data certification. We believe that clearly identifying high quality, trustworthy datasets is crucial for both data producers and consumers.
Why certification?
Certification offers significant benefits to both sides of the data ecosystem. Data producers can clearly define and communicate the expectations and guarantees associated with their certified data assets, like defining Service Level Agreements (SLAs) for engineering services. This includes aspects like schema, data quality, and freshness. For data consumers, certification provides the confidence to readily discover and utilise these assets. Knowing that they come with stronger reliability guarantees and clear documentation, data consumers can confidently “shop” for certified data products, reducing the need for extensive validation and ad-hoc inquiries.
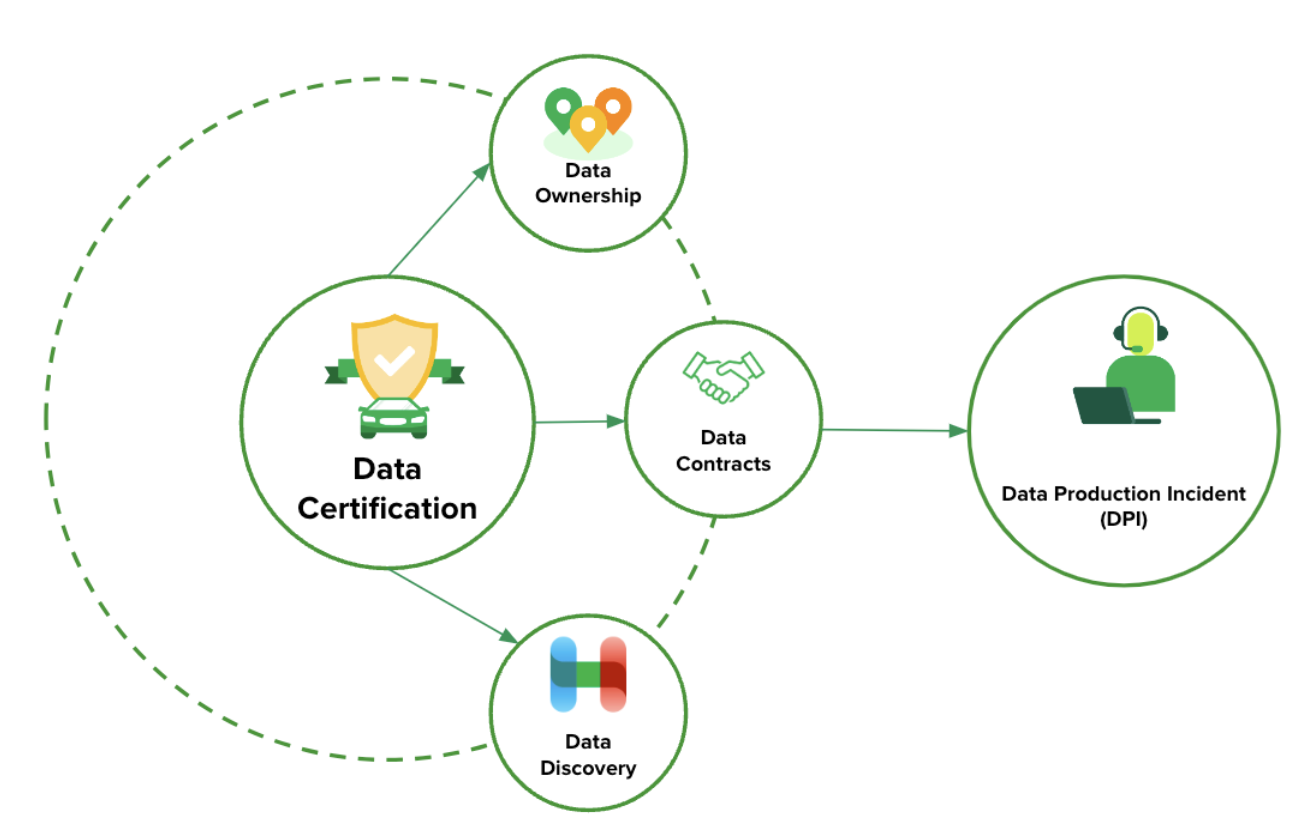
To achieve widespread data certification, we focused on several key enablers:
-
Ownership: Establishing decentralised ownership and accountability is fundamental and non-trivial. We clearly identified teams which we call Data Domains, individuals responsible as Business Data Owners (BDOs), and Technical Data Owners (TDOs) for the upkeep, usability, documentation, and associated Scheduled Large Orders (SLOs) of each data product. This step was bootstrapped by leveraging the identification of the data asset creator’s team. However, if the creator had changed teams or left the company, the initial mapping of Domain <> Data Asset needs to be reviewed by the Domain Leads.
-
Data contract: We introduced data contracts as formal agreements between data producers and consumers. These contracts define the schema, SLA guarantees (including freshness, completeness, and retention policies), notice period for changes, and communication channels for a data product. Data certification helps set clear expectations and ensures reliability across data pipelines.
Data operational excellence
To further enhance accountability and ensure adherence to data contracts, we implemented automated Data Production Incidents (DPIs) for breached contracts. When data quality tests are done on data availability, timeliness, consistency, completeness, accuracy, validity, or other reliability guarantees fail, a DPI ticket is automatically created and assigned to the TDO. This system aims to standardise and drive accountability in investigating and fixing issues related to reliability guarantees within Data Contracts. The goal is for teams to acknowledge and fix the root cause of the DPIs.
Operationalisation and outcomes
To drive the adoption of data certification and the principles of data mesh across Grab, we focused on the following north star metric: percentage of queries hitting certified assets (%). This metric serves as a direct indicator of the reusability and trust in our certified data products. It also helps teams prioritise their certification efforts towards the most frequently used tables. It essentially pushes every data team in two synergistic directions:
- To certify their most used datasets.
- To query only certified datasets as much as possible.
Operationalisation
The successful operationalisation of our data mesh and certification efforts relied on several key factors listed below:
-
Executive buy-in: Strong leadership support was crucial in driving this organisational change and emphasising the importance of data as a product.
-
Organisation-wide push with clear measurable reporting: We implemented an organisation-wide initiative with clearly defined goals and measurable targets for data certification. Progress is tracked and reported to ensure accountability and drive momentum.
-
Dashboard to guide Grabbers target most used tables: Dashboards and tooling likely within Hubble, provided visibility into data usage patterns, guiding teams to prioritise the certification of their most popular and impactful datasets.
Outcomes
As a result of these efforts, we have observed significant positive outcomes:
-
75% of Grab queries hitting certified assets: We achieved a significant milestone with 75% of Grab’s data queries now targeting certified assets. This indicates a strong adoption of certified data products and a growing trust in their reliability.
-
Active deprecation of assets: The focus on data ownership and the push for certification has also led to increased visibility into our data landscape, allowing us to identify and actively deprecate redundant and duplicated data assets. Deprecated tables increases 400% year over year (YoY). This not only improves efficiency but also reduces the complexity and cost of maintaining our data infrastructure.
-
Accelerated innovation and cross-domain reusability: Prior to data mesh, every team often resorted to building their own data sources which leads to lower quality outcomes and slower turn around time. Today, internet of things datasets (IoT) like weather data collected by one team can now be reused by another team to optimise marketplace decisions — a practical step toward a more connected data ecosystem.
Beyond these individual instances, we observe a convergence across Grab towards most used datasets, with the number of P80 datasets (the top 80% of Grab’s most used data) reducing by over 58% since the start of the campaign.
What’s next
While we have made significant strides in our data mesh journey, we recognise that this is an ongoing evolution. This progress wouldn’t be as smooth sailing without the platforms we build for data management and observability. In our next article, we will be delving into the enhancements for crucial tooling and platforms like Genchi (in-house data quality observational tool) and Hubble (metadata management platform, built on DataHub and Grab proprietary technology), which underpin our data mesh vision and enable greater data reliability and reusability.
Massive credits to Grab’s leadership, Mohan Krishnan and Nikhil Dwarakanath, as well as Data owners on driving this Grab-wide effort to build strong data foundations in Grab. Grab’s data mesh would not have been possible without the commitment of all data owners to certify and curate their data products.
Join us
Grab is a leading superapp in Southeast Asia, operating across the deliveries, mobility and digital financial services sectors. Serving over 800 cities in eight Southeast Asian countries, Grab enables millions of people everyday to order food or groceries, send packages, hail a ride or taxi, pay for online purchases or access services such as lending and insurance, all through a single app. Grab was founded in 2012 with the mission to drive Southeast Asia forward by creating economic empowerment for everyone. Grab strives to serve a triple bottom line – we aim to simultaneously deliver financial performance for our shareholders and have a positive social impact, which includes economic empowerment for millions of people in the region, while mitigating our environmental footprint.
Powered by technology and driven by heart, our mission is to drive Southeast Asia forward by creating economic empowerment for everyone. If this mission speaks to you, join our team today!
The Origin of Military Challenge Coins
Post Syndicated from The History Guy: History Deserves to Be Remembered original https://www.youtube.com/shorts/mQJNSc4xv3k
Comic for 2025.08.19 – 17th Century Comedian 2
Post Syndicated from Explosm.net original https://explosm.net/comics/17th-century-comedian-2
New Cyanide and Happiness Comic
The State of Python 2025
Post Syndicated from corbet original https://lwn.net/Articles/1034313/
The JetBrains blog presents the
results of the eighth annual Python Developers Survey, carried out in
partnership with the Python Software Foundation.
This year, 51% of all surveyed Python developers are involved in
data exploration and processing, with pandas and NumPy being the
tools most commonly used for this.Many of us in the Python pundit space have talked about Python as
being divided into thirds: One-third web development, one-third
data science and pure science, and one-third as a catch-all bin.We need to rethink that positioning now that one of those thirds is
overwhelmingly the most significant portion of Python.
Git v2.51 released
Post Syndicated from jake original https://lwn.net/Articles/1034306/
The Git distributed version-control
system has release version 2.51, with “506 non-merge commits since
“. It
v2.50.1, contributed by 91 people, 21 of which are new faces
brings multiple new features, some of which are highlighted in a post
on the GitHub blog. It includes some performance improvements for multi-pack indexes
(MIDXs), a way to import and export stash entries so they can be migrated
more easily, and smaller pack files:
Git 2.51 takes the spirit of that change and goes a step further by introducing a new way to collect objects when repacking, called “path walk”. Instead of walking objects in revision order with Git emitting objects with their corresponding path names along the way, the path walk approach emits all objects from a given path at the same time. This approach avoids the name-hash heuristic altogether and can look for deltas within groups of objects that are known to be at the same path.
As a result, Git can generate packs using the path walk approach that are often significantly smaller than even those generated with the new name hash function described above. Its timings are competitive even with generating packs using the existing revision order traversal.
Guide to adopting Amazon SageMaker Unified Studio from ATPCO’s Journey
Post Syndicated from Mitesh Patel original https://aws.amazon.com/blogs/big-data/guide-to-adopting-amazon-sagemaker-unified-studio-from-atpcos-journey/
This blog post is co-written with Raj Samineni from ATPCO.
Launched at AWS re:Invent 2024, the next generation of Amazon SageMaker is expediting innovation for organizations such as ATPCO through a unified data management and tooling experience for analytics and AI use cases. This comprehensive service provides both technical and business users with Amazon SageMaker Unified Studio, a single data and AI development environment to discover the data and put it to work using familiar AWS tools. SageMaker Unified Studio offers a single governed environment to complete end-to-end development workflows, including data analysis, data processing, model training, generative AI application building, and more. It simplifies the creation of analytics and AI applications, fast-tracking the journey from raw data to actionable insights through its integrated data and tooling environment.
ATPCO is the backbone of modern airline retailing, helping airlines and third-party channels deliver the right offers to customers at the right time. ATPCO’s vision is to be the platform driving innovation in airline retailing while remaining a trusted partner to the airline ecosystem. ATPCO aims to support data-driven decision-making by making high-quality data discoverable by every business unit, with the appropriate governance on who can access what, and required tooling to support their needs. ATPCO addressed data governance challenges using Amazon DataZone. SageMaker Unified Studio, built on the same architecture as Amazon DataZone, offers additional capabilities, so users can complete various tasks such as building data pipelines using AWS Glue and Amazon EMR, or conducting analyses using Amazon Athena and Amazon Redshift query editor across diverse datasets, all within a single, unified environment.
In this post, we walk you through the challenges ATPCO addresses for their business using SageMaker Unified Studio. We start with the admin flow, a one-time setup process that lays the foundation for non-admin users in preparation for a company-wide rollout. When onboarding users from different business units to SageMaker Unified Studio, it’s crucial to make sure they have immediate access to their data sources such as Amazon Simple Storage Service (Amazon S3), AWS Glue Data Catalog, and Redshift tables as well as tools like Amazon EMR, AWS Glue, and Amazon Redshift that they already use. This helps users become productive swiftly and use the full potential of SageMaker Unified Studio. Next, we walk you through the developer flow, detailing how non-admin users can use SageMaker Unified Studio to access their data and act on it using their choice of tools.
“SageMaker Unified Studio has transformed how our teams access and collaborate on data. It’s the first time business and technical users can work together in a single, intuitive environment—no more tool switching or fragmented workflows.”
–Rajesh Samineni, Director of Data Engineering at ATPCO
ATPCO’s challenges
The implementation of SageMaker Unified Studio at ATPCO has been instrumental in addressing several critical challenges and unlocking new use cases across various business units within the organization. By building on the foundation laid by Amazon DataZone, ATPCO is helping users self-serve insights and fostering a culture of shared understanding and reusability of data assets, leading to more informed decision-making and a robust data culture.
SageMaker Unified Studio helped address the following challenges:
- Data silos and discoverability – Analysts often struggled to locate the right data sources, verify data freshness, and maintain consistent definitions across different departments. By offering a single entry point for searching and subscribing to curated datasets, SageMaker Unified Studio minimizes these barriers. Integrated tools for data exploration, querying, and visualization, along with contextual metadata and lineage, builds trust in the data, making it straightforward for users to find and use the information they need.
- Manual data handling – Teams relied heavily on manual exports and custom reports to gather insights, leading to inefficiencies and delays in decision-making. SageMaker Unified Studio helps users across departments, including product, sales, operations, and analytics, self-serve insights without manual intervention. This accelerates the decision-making process and helps teams focus on strategic initiatives rather than data collection.
Solution overview
The following diagram illustrates ATPCO’s architecture for SageMaker Unified Studio.
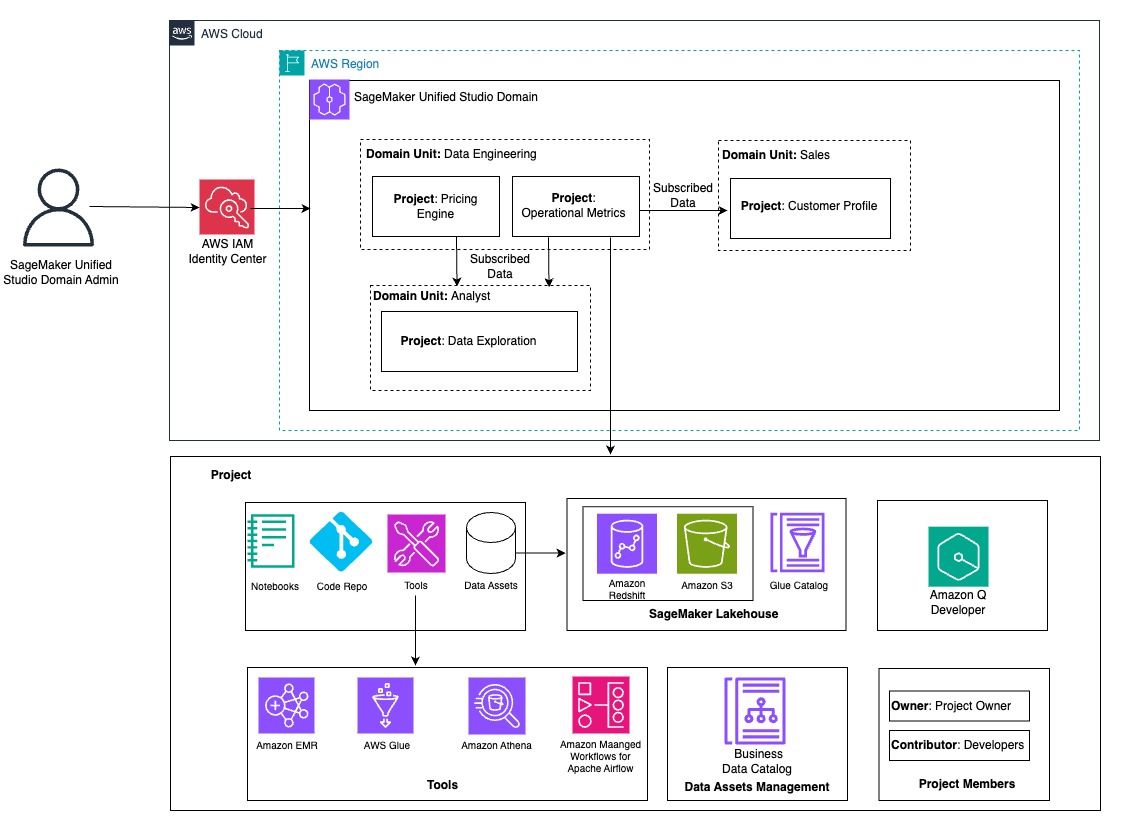
The following sections walk you through the steps that ATPCO went through to prepare the SageMaker Unified Studio environment for use by different personas in engineering and business units.
Prerequisites
If you’re new to SageMaker Unified Studio, you should first become familiar with concepts such as domains, domain units, projects, project profiles, blueprints, lakehouses, and catalogs before continuing with this post. For a company-wide rollout of SageMaker Unified Studio, it’s important to understand the foundation setup required as an admin user. For more information about the role of a SageMaker Unified Studio admin user and steps required to set up a SageMaker Unified Studio domain,refer to Foundational blocks of Amazon SageMaker Unified Studio: An admin’s guide to implement unified access to all your data, analytics, andAI. As an admin user, start with domain units and projects based on the need of different business units for the data and tooling.
Create domain units and set up projects with required tools
As an admin or root domain owner, you begin with the design of domain units and projects to organize different teams and users to their respective domain units. When non-admin users log in to the SageMaker Unified Studio portal, they should have seamless access to necessary AWS resources. These resources include the required tools and data sources to perform their job. Providing users access to these resources is critical for the successful adoption and utilization of SageMaker Unified Studio in your organization. ATPCO created separate domain units for engineering teams and non-engineering business units, as shown in the preceding architecture diagram. It only shows few examples. In reality, they have more domain units to meet their business needs, which we discuss in the following sections.
Data engineering domain
This domain unit has the Operational Metrics project, managed by the data engineering team, which supports a key backbone of visibility across the organization: understanding how ATPCO’s products perform in real time. Data engineers bring together signals from infrastructure, application logs, API monitoring, and internal systems to build aggregated, curated datasets that track latency, availability, adoption, and reliability. These operational metrics are published using SageMaker Unified Studio for consumption by other domains. Rather than fielding one-off requests or maintaining bespoke dashboards for different stakeholders, the engineering team now:
- Builds reusable data assets that can be subscribed to one time and reused by many
- Creates unified views of system health that are automatically updated and versioned
- Supports other teams such as Product, Sales, and analysts with quick access to performance indicators in a format aligned with their needs
SageMaker Unified Studio becomes the center for operational intelligence, reducing duplication and making sure data engineers can focus on scale and automation rather than ticket-based support.
Analyst domain
The Data Exploration project in this domain unit serves the entire ATPCO community. Its purpose is to make available datasets regardless of their owning domain easily discoverable and ready for analysis. Previously, analysts struggled with locating the right data source, verifying its freshness, or aligning on consistent definitions. With SageMaker Unified Studio, those barriers are removed. The project provides:
- A single entry point where users can search and subscribe to curated datasets
- Integrated tools for exploration, query, and visualization
- Contextual metadata and lineage to build trust in the data
Users in product, strategy, operations, or analytics can self-serve insights without waiting on manual exports or custom reports.
Sales domain
The Customer Profile project in this domain unit helps the Sales team understand which customers are actively engaging with ATPCO’s products, how they are using them, and where there might be opportunities to strengthen relationships. By using SageMaker Unified Studio, Sales team members can access the following:
- Customer data sourced from CRM systems, including interaction history, product adoption, and support engagement
- Operational metrics from the Data Engineering team, revealing which features are being used, how often, and whether the customer is experiencing reliability issues
With this combined insight, the Sales team can accomplish the following:
- Identify high-value accounts for follow-up based on recent usage
- Detect drop-off in engagement or technical issues before a customer raises a concern
- Tailor outreach and proposals using objective data, not assumptions
All of this happens within SageMaker Unified Studio, reducing the time spent on manual data gathering and enabling more strategic, proactive customer engagement.
Onboard data sources to domain units and projects
Now that domain units and projects are created for different business units, the next step is to onboard existing Amazon S3 data sources, Data Catalog tables, and database tables available in Amazon Redshift. After logging in, users have access to the required data and tools. This required the ATPCO team to build the inventory to see which team has access to what data sources and what level of permissions are needed. For example, the Data Engineering team needs access to raw, processed and curated S3 buckets for building data processing jobs. They must also read and write to the Data Catalog, and prepare and write curated and aggregated data to the Redshift tables. The following sections guide you through configuring these various data sources within SageMaker Unified Studio, making sure users can access the data sources to continue their work in SageMaker Unified Studio.
Configure existing Amazon S3 data sources into SageMaker Unified Studio
To use an existing S3 bucket in SageMaker Unified Studio, configure an S3 bucket policy that allows the appropriate actions for the project AWS Identity and Access Management (IAM) role.
The Data Engineering team that owns the data processing pipeline must grant access to raw, processed, and curated S3 buckets to the data engineering project role. To learn more about using existing S3 buckets, refer to Access your existing data and resources through Amazon SageMaker Unified Studio, Part 2: Amazon S3, Amazon RDS, Amazon DynamoDB, and Amazon EMR.
Configure an existing Data Catalog into SageMaker Unified Studio
The next generation of SageMaker is built on a lakehouse architecture, which streamlines cataloging and managing permissions on data from multiple sources. Built on the Data Catalog and AWS Lake Formation, it organizes data through catalogs that can be accessed through an open, Apache Iceberg REST API to help enforce secure access to data with consistent, fine-grained access controls. SageMaker Lakehouse organizes data access through two types of catalogs: federated catalogs andmanaged catalogs (shown in the following figure). A catalog is a logical container that organizes objects from a data store, such as schemas, tables, views, or materialized views from Amazon Redshift. The following diagram illustrates this architecture.
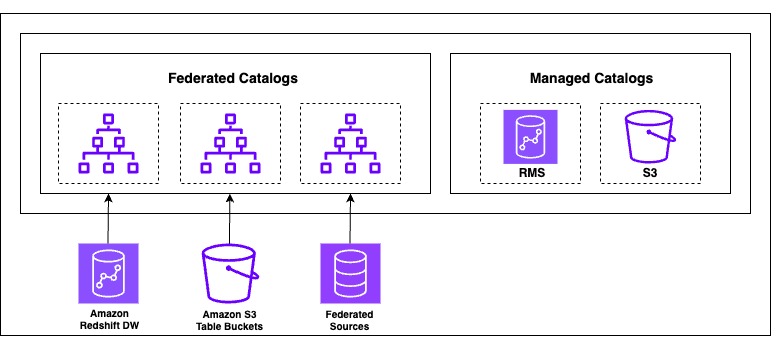
ATPCO built a data lake on Amazon S3 using the Data Catalog and implemented data governance and fine-grained access control using Lake Formation. When developer users log in to SageMaker Unified Studio, they need access to the Data Catalog tables owned by their respective team. Existing Data Catalog databases are made available in SageMaker Lakehouse as a federated catalog because they’re created outside of SageMaker Lakehouse and not managed by it.
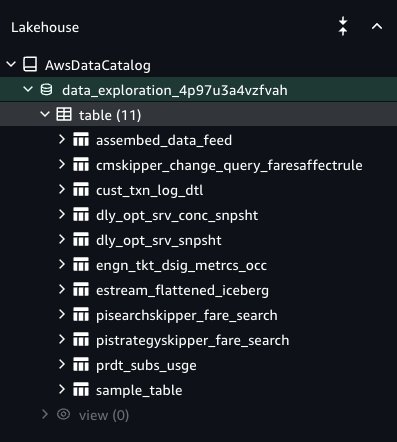
To access an existing Data Catalog, you must provide explicit permissions to SageMaker Unified Studio to be able to access the Data Catalog databases and tables. For more details, see Configure Lake Formation permissions for Amazon SageMaker Unified Studio. To onboard Data Catalog tables to SageMaker Lakehouse in SageMaker Unified Studio, the Lake Formation admin must grant access to specific Data Catalog database tables to the SageMaker Unified Studio project role. For more details, refer to Access your existing data and resources through Amazon SageMaker Unified Studio, Part 1: AWS Glue Data Catalog and Amazon Redshift. The Lake Formation permission model is the prerequisite to grant access to SageMaker Unified Studio. If Lake Formation is not the permission model for the Data Catalog, then you must register the S3 path and delegate the permission model to Lake Formation before it can be granted to the SageMaker Unified Studio project role. After you complete these steps, users of the project can access the Data Catalog database and are granted tables under the AwsDataCatalog namespace, and your tables will be visible in the Data Explorer (see the following screenshot). Your data is now ready for tagging, searching, enrichment, and data analysis.
Configure Redshift data into SageMaker Unified Studio
ATPCO relies on Amazon Redshift as their enterprise data warehouse and stores their aggregated data for insights and dashboarding. Users can combine the data from Amazon Redshift and SageMaker Lakehouse for unified data analysis in SageMaker Unified Studio without leaving SageMaker Unified Studio. For more information about how to add existing Redshift data sources, refer to Access your existing data and resources through Amazon SageMaker Unified Studio, Part 1: AWS Glue Data Catalog and Amazon Redshift.
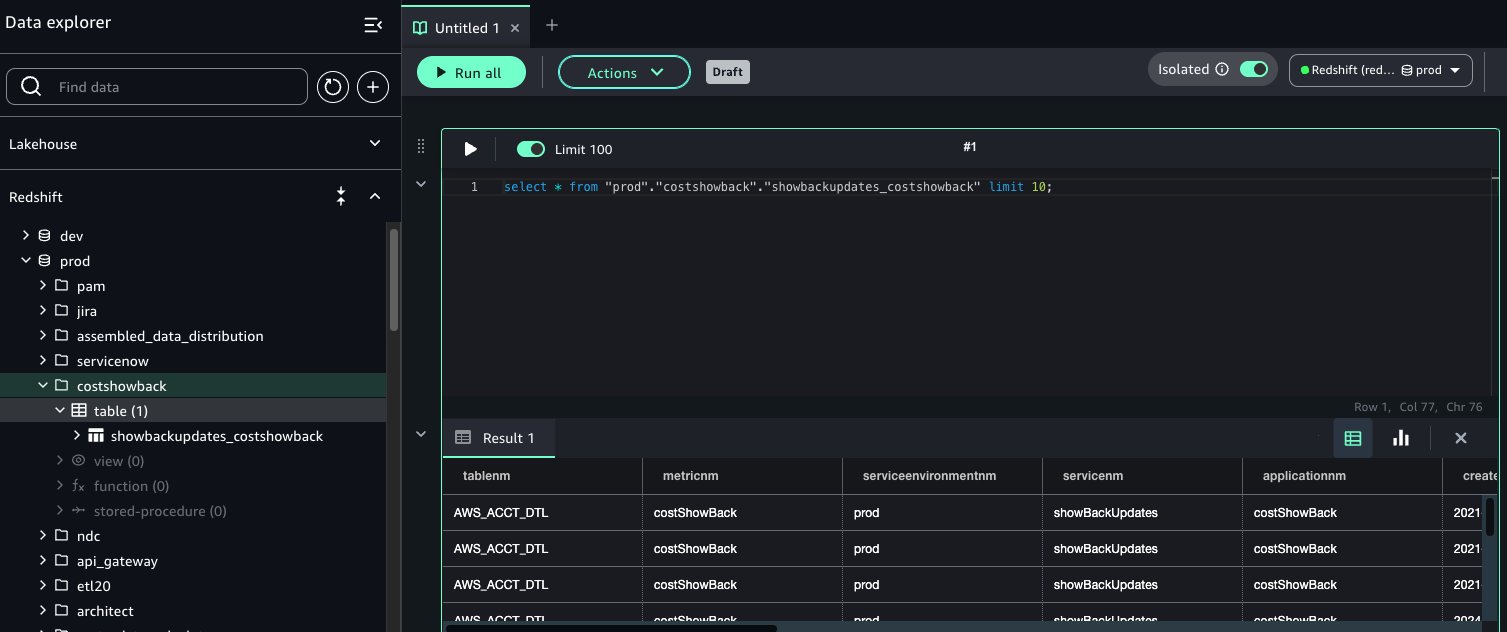
After it’s connected, the Amazon Redshift compute engine becomes visible in the Data Explorer of your project. Project users can perform the following actions:
- Write and run SQL queries directly against Amazon Redshift
- Explore Redshift schemas and tables
- Use Redshift tables to define SageMaker Unified Studio data sources
- Combine Redshift data with metadata tagging, glossary linking, and publishing
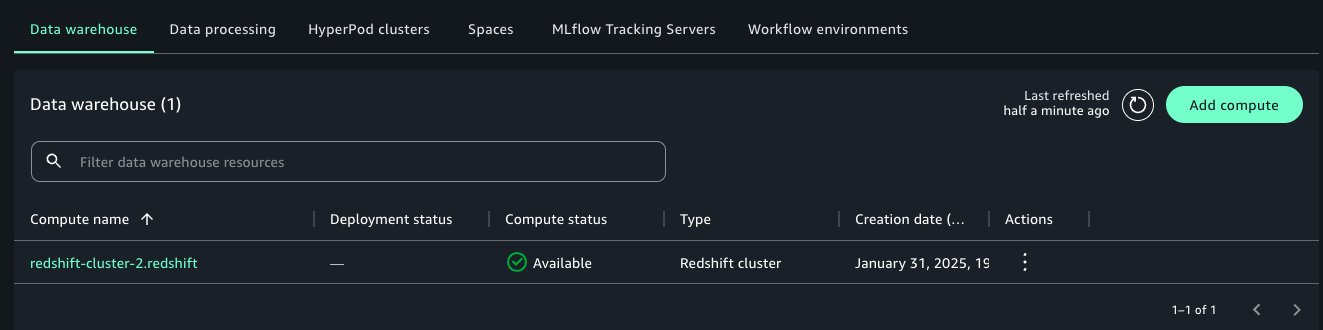
This doesn’t require copying or duplicating data. You’re using the data exactly where it lives in your Redshift cluster while benefiting from the collaborative features of SageMaker Unified Studio. Adding compute makes the data within the warehouse available to query inside the SageMaker Unified Studio query editor.
Onboard users to their respective domain units and projects
Now that as an admin you have created the environments for different business units, your next step is to add domain owner users to the respective domain units. First, you must add domain and project owners’ users for them to get access to the SageMaker Unified Studio domain portal.
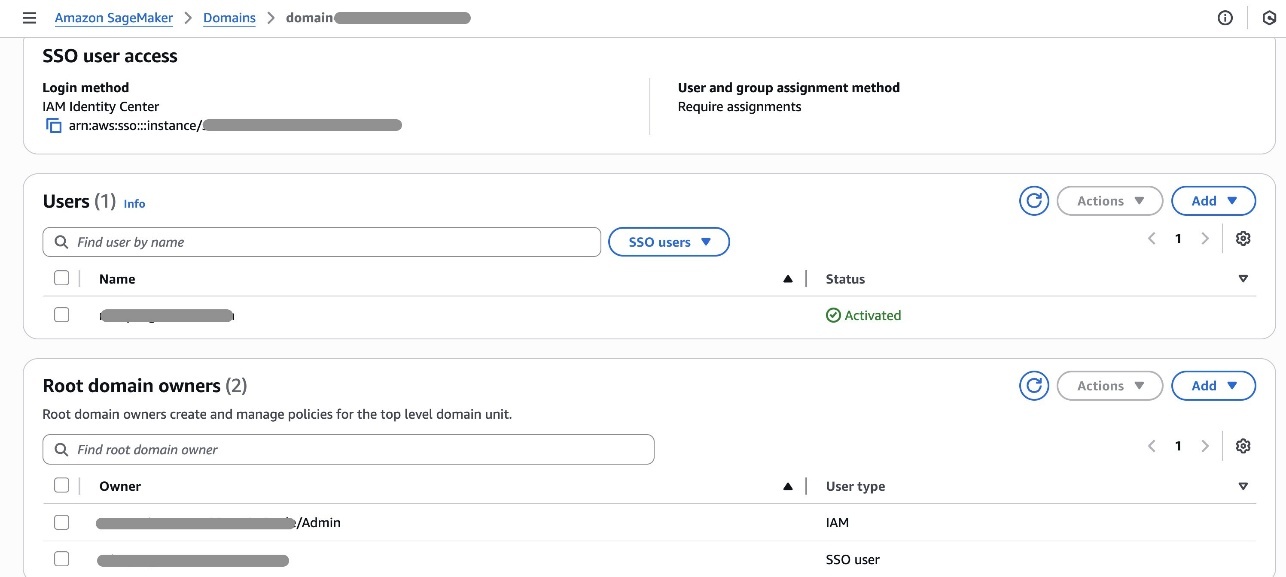
Domain units make it possible to organize your assets and other domain entities under specific business units and teams. Domain unit owners can create policies such as membership, domain, and project creation.
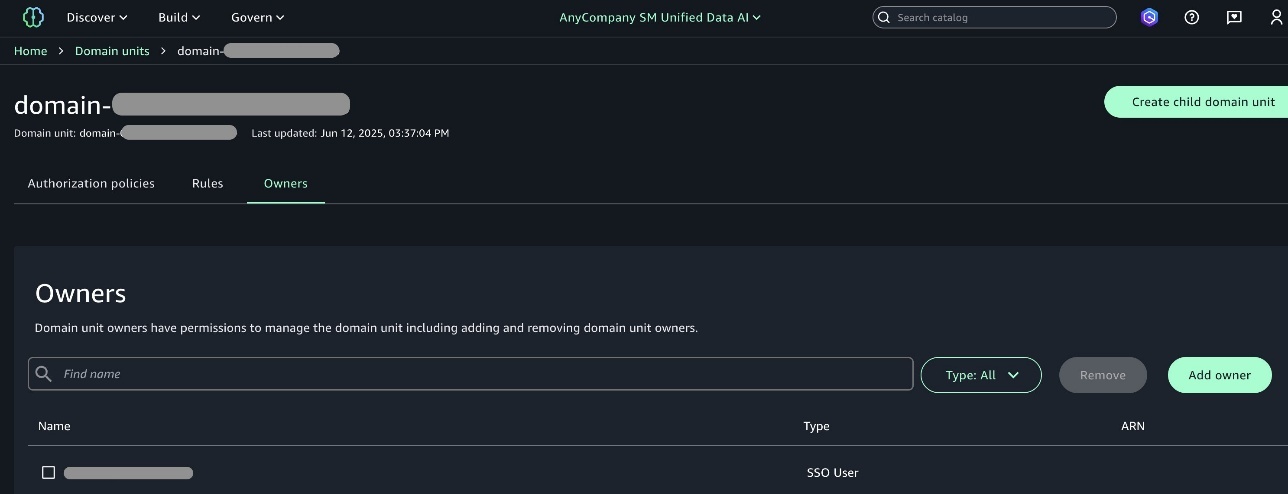
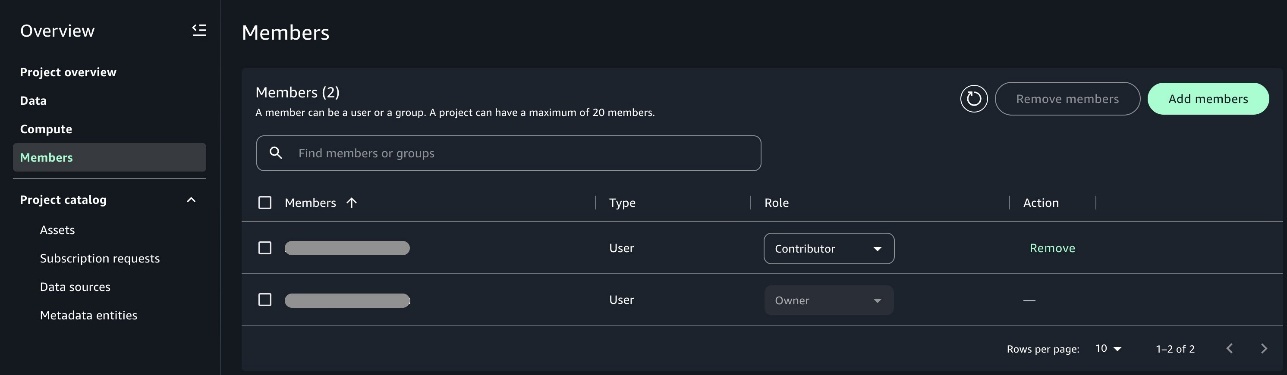
Domain unit owners can add one of the members as owner of the project so that when the owner user logs in, they can add other users of their team as an owner or contributor to the project. This helps other users get access to the projects when they login to SageMaker Unified Studio.
Use the SageMaker Unified Studio environment
After the admin completes the required setup for different business units and onboardsproject members, users can log in to the portal and start using the preconfigured SageMaker Unified Studio environment. Users have access to respective data sources and tools as shown in the following developer flow diagram.
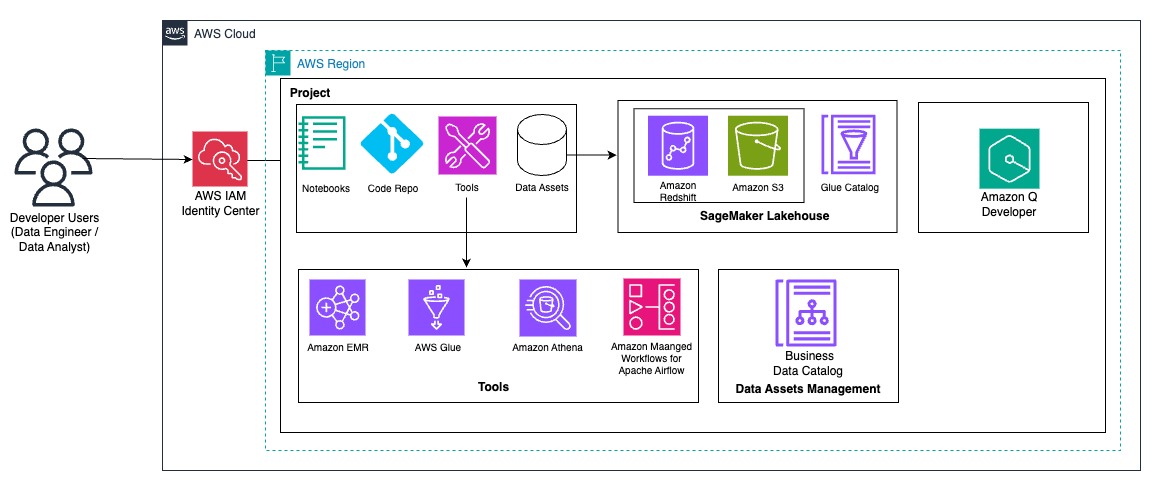
At ATPCO, developers must often combine data from various sources to perform extract, transform, and load (ETL) processes efficiently. In this section, we demonstrate how developers can benefit from the SageMaker unified lakehouse environment by seamlessly integrating data from both Amazon Redshift and the Data Catalog. Using PySpark within SageMaker Unified Studio notebooks, we read transactional data from Amazon Redshift and enrich it with metadata stored in AWS Glue backed S3 tables such as warehouse or product attributes. This integrated view supports complex transformations and aggregations across disparate sources without needing to move or duplicate data. By using native connectors and Spark’s distributed processing, users can join, filter, and analyze multi-source datasets efficiently and write the results back to Amazon Redshift for downstream analytics or dashboarding, all within a single, interactive lakehouse interface.
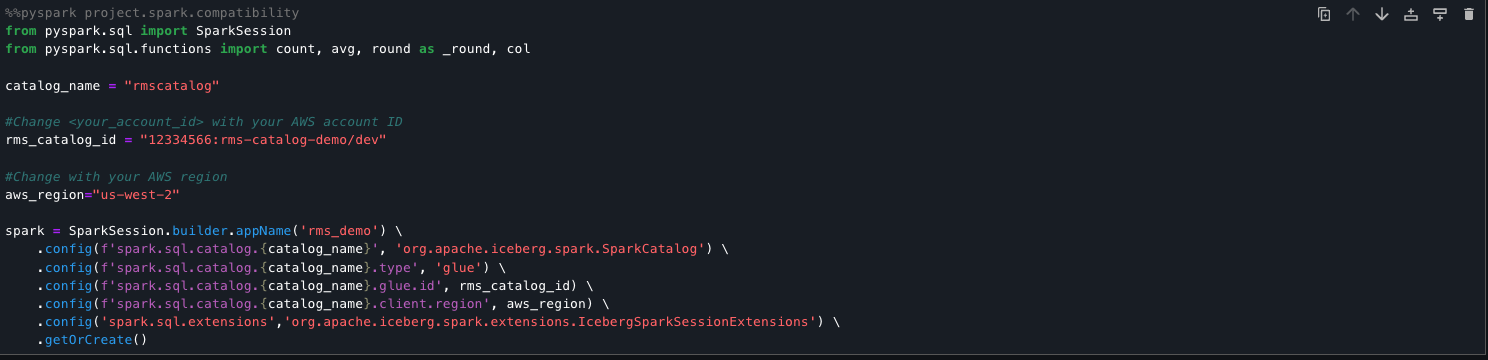
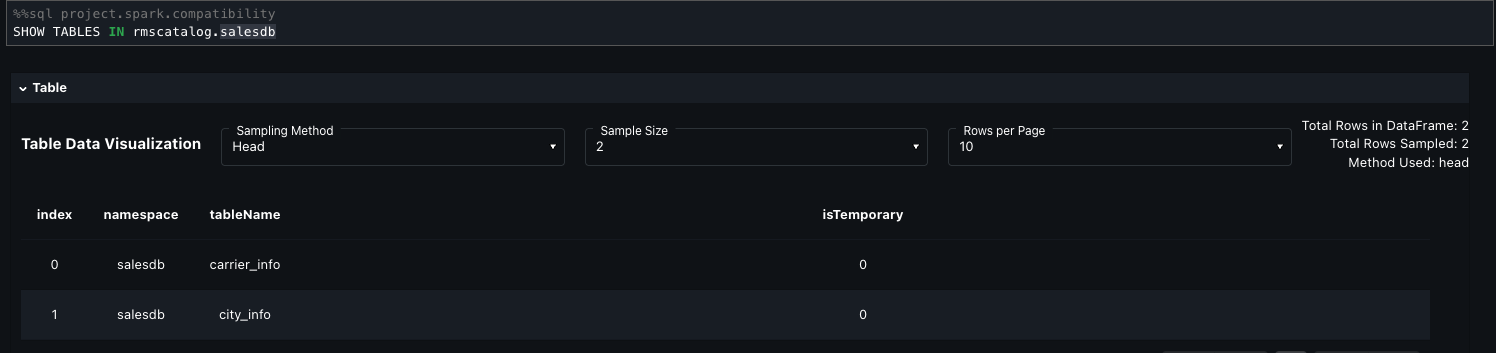
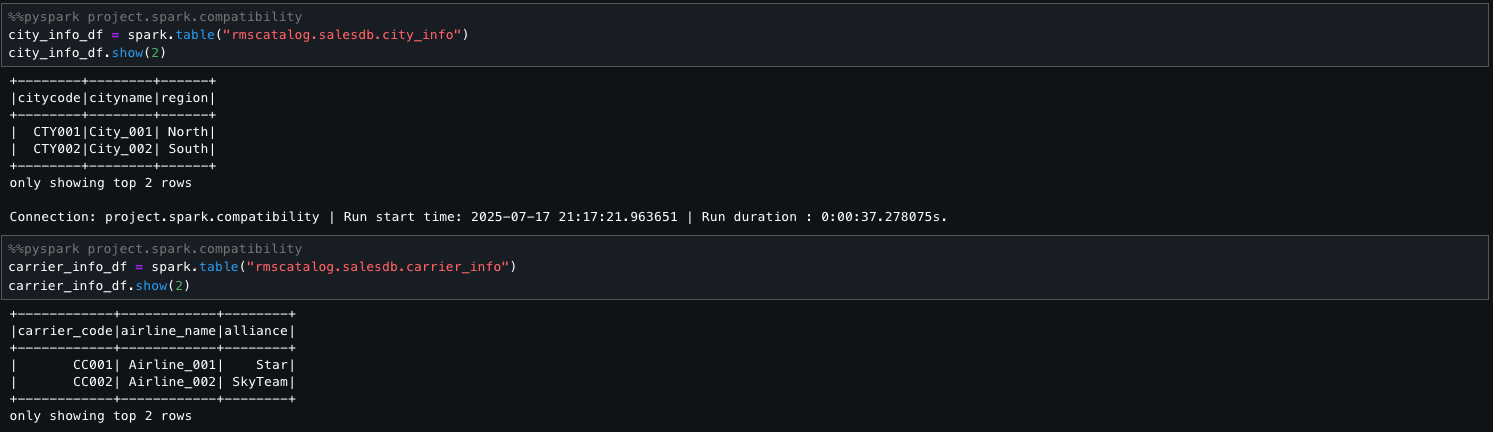
The following code snippet sets up a Spark session to directly query Amazon Redshift managed storage tables using the lakehouse architecture. It registers an AWS Glue backed Iceberg catalog (rmscatalog) that points to a specific Redshift lakehouse catalog and database, allowing Spark to read from and write to Redshift Iceberg tables. By enabling Iceberg extensions and linking the catalog to AWS Glue and Lake Formation, this setup provides seamless, scalable access to Amazon Redshift managed data using standard Spark SQL.
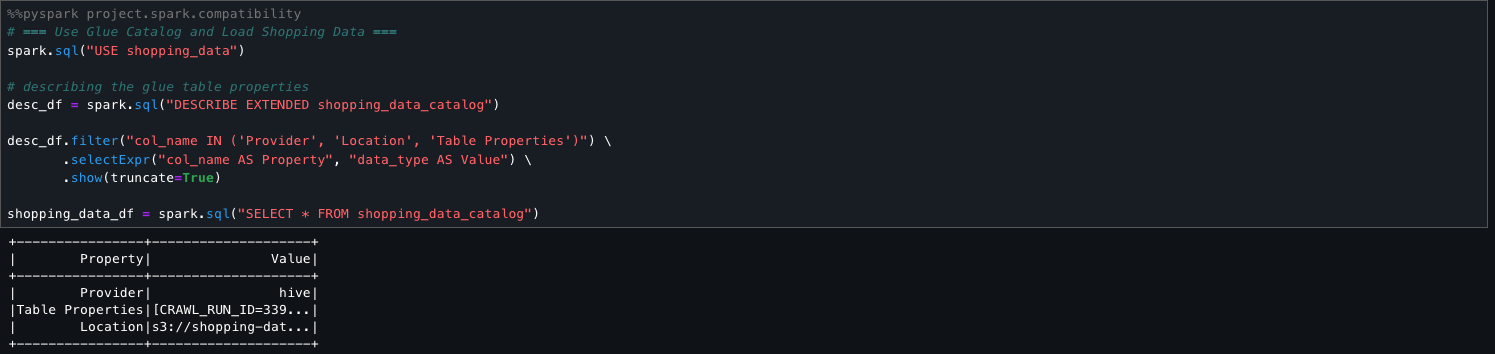
The following step sets the active AWS Glue database to shopping_data and retrieves metadata for the shopping_data_catalog table using DESCRIBE EXTENDED. It filters for key properties like Provider, Location, and Table Properties to understand the table’s storage and configuration. Finally, it loads the entire table into a Spark DataFrame (shopping_data_df) for downstream processing.
The following code shows how you can seamlessly combine and aggregate two disparate data sources, Amazon Redshift and the Data Catalog, within SageMaker Unified Studio. Using PySpark, we perform transformations and derive meaningful summaries across the unified view. This facilitates streamlined analysis and reporting without the need for complex data movement or duplication.
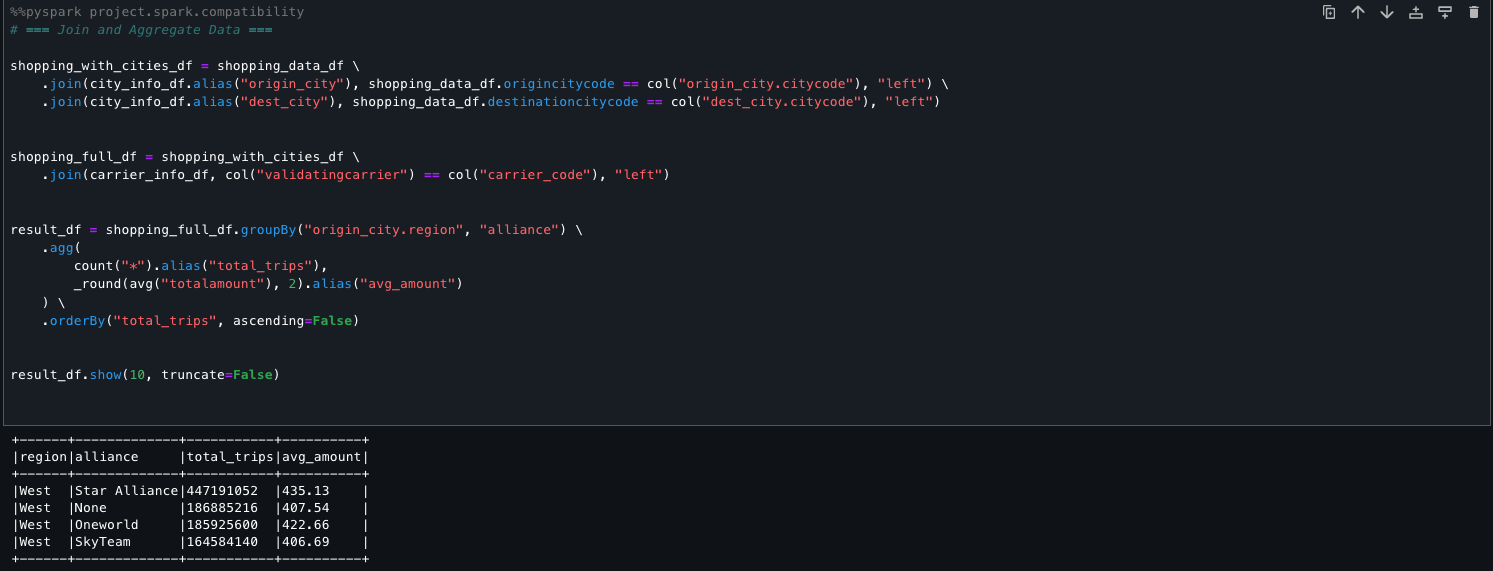
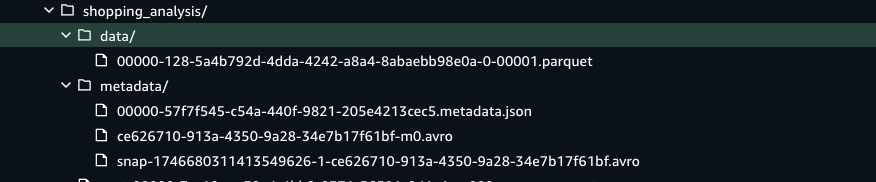
After the job runs, it writes the transformed dataset directly into a Data Catalog table that is Iceberg-compatible. This integration makes sure the data is stored in Amazon S3 with ACID transaction support, and also registered and tracked in the Data Catalog for unified governance, schema discovery, and downstream query access. The Iceberg table format organizes the data into Parquet files under a data/ directory and maintains rich versioned metadata in a metadata/ folder, supporting features like schema evolution, time travel, and partition pruning. This design facilitates scalable, reliable, and SQL-compatible analytics on modern data lakes.

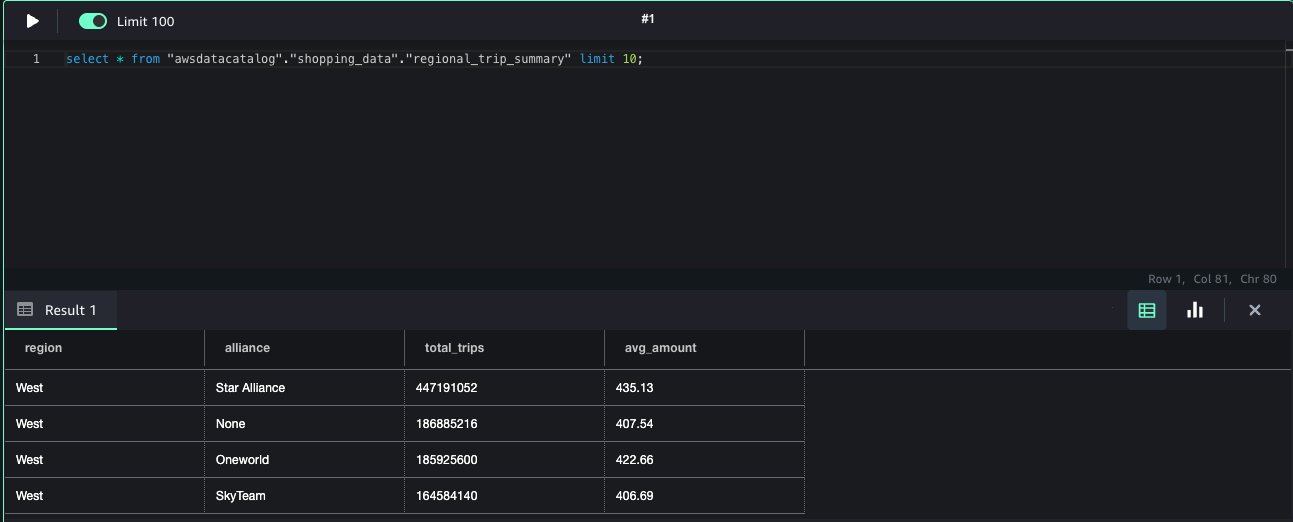
The table becomes immediately available for querying through the Athena query editor, providing interactive access to fresh, transactional data without additional ingestion steps or manual registration.This approach streamlines the end-to-end data flow, from processing in Spark to interactive querying in Athena within the modern SageMaker Lakehouse environment.
Conclusion
This post walked you through the steps to prepare a SageMaker Unified Studio environment for a company-wide rollout, using APTCO’s journey as an example. We covered the domain design and admin flow, which is a one-time setup to prepare the SageMaker Unified Studio environment for different teams in the organization who requires different levels of access to the data and tools. After the admin flow, we demonstrated the developer flow and how to use tools like a Jupyter notebook and SQL editor to use the data across different sources such as Amazon S3, the Data Catalog, and Redshift assets to perform a unified analysis.
Try out this solution and get started with SageMaker Unified Studio and modernize with the next generation of SageMaker. To learn more about SageMaker Unified Studio and how to get started, refer to the Amazon SageMaker Unified Studio Administrator Guide, and the latest AWS Big Data Blog posts.
About the authors
 Mitesh Patel is a Principal Solutions Architect at AWS. His passion is helping customers harness the power of Analytics, Machine Learning, AI & GenAI to drive business growth. He engages with customers to create innovative solutions on AWS.
 Nikki Rouda works in product marketing at AWS. He has many years experience across a wide range of IT infrastructure, storage, networking, security, IoT, analytics, and modern applications.
 Raj Samineni is the Director of Data Engineering at ATPCO, leading the creation of advanced cloud-based data platforms. His work ensures robust, scalable solutions that support the airline industry’s strategic transformational objectives. By leveraging machine learning and AI, Raj drives innovation and data culture, positioning ATPCO at the forefront of technological advancement.
 Saurabh Rawat is a Solution Architect at AWS with 13 years of experience working with enterprise data systems. He has designed and delivered large-scale, cloud-native solutions for customers across industries, with a focus on data engineering, analytics, and well-architected architectures. Over his career, he has helped organizations modernize their data platforms, optimize for performance, and cost, and adopt best practices for scalability and security. Outside of work, he is a passionate musician and enjoys playing with his band.
Achieve low-latency data processing with Amazon EMR on AWS Local Zones
Post Syndicated from Gagan Brahmi original https://aws.amazon.com/blogs/big-data/achieve-low-latency-data-processing-with-amazon-emr-on-aws-local-zones/
Enterprises today require both single-digit millisecond latency data processing and data residency compliance for their applications. By deploying Amazon EMR on AWS Local Zones, organizations can achieve single-digit millisecond latency data processing for applications while maintaining data residency compliance. This post demonstrates how to use AWS Local Zones to deploy EMR clusters closer to your users, enabling millisecond-level response times. We use a Secure Web Gateway as an example and implement Amazon EMR with Apache Flink on AWS Local Zones to process network traffic with ultra-low latency. We also go through the process of creating an EMR cluster on AWS Local Zones, highlighting performance optimizations and architecture considerations specific to edge deployments. This approach uses AWS Local Zones to bring Amazon EMR’s data processing capabilities closer to your users and data sources – ideal for security applications or any other latency-sensitive workloads.
Solution overview
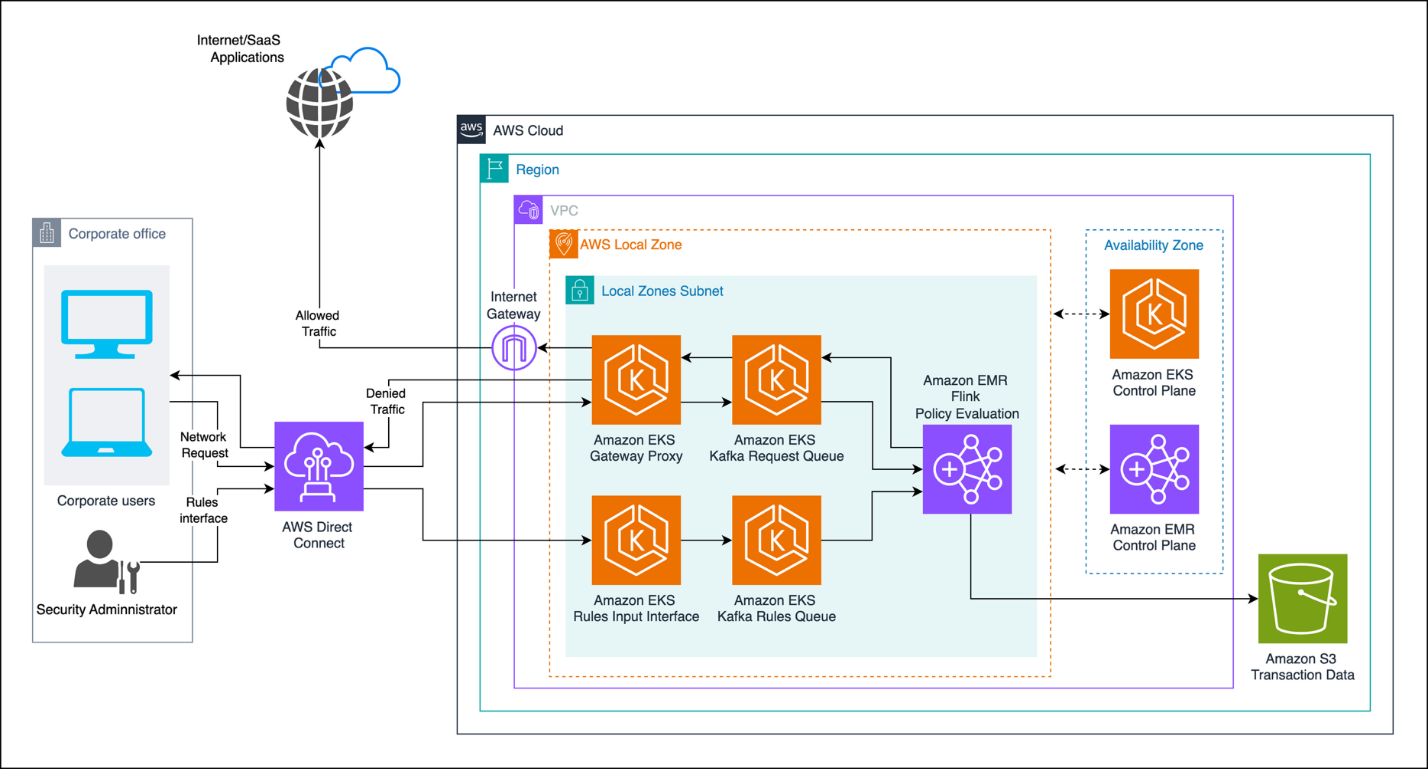
The following diagram illustrates the solution architecture.
The solution consists of several key components:
- AWS Local Zones deployment – Positioned close to corporate offices to minimize latency
- Network traffic interception – Using AWS Transit Gateway and virtual private cloud (VPC) endpoints
- Request queuing and rules streaming – Using Apache Kafka on Amazon Elastic Kubernetes Service (Amazon EKS) to queue the incoming and outgoing network requests as well as stream rules as they are updated by the security administrator
- EMR cluster – Running Flink for real-time stream processing and functions to combine rules
- Policy management system – For defining and updating security rules
- Logging – Using Amazon Simple Storage Service (Amazon S3) for visibility, compliance, and data analytics
In this scenario, the Secure Web Gateway is designed to inspect and make decisions on network traffic within single-digit milliseconds. The workflow consists of the following steps:
- The corporate office uses AWS Direct Connect to connect to AWS Local Zones.
- The security administrator defines the rules from a rules interface running on Kubernetes pods on Amazon EKS. As the rules are added or modified, they are sent to the swg_rules Kafka topic running on Amazon EKS. These rules are stored and processed by Flink running on the EMR cluster.
- A corporate user requests for a software as a service (SaaS) application from the corporate office. The request is routed through Direct Connect to the Local Zone.
- The Secure Web Gateway proxy service running on Kubernetes pods on Amazon EKS receives the access request, which is sent to the swg_requests Kafka topic.
- Flink running on EMR evaluates and consumes the messages from the swg_requests Kafka topic and determines the routing decision, which is sent back to the swg_decisions Kafka topic.
- The Secure Web Gateway proxy service consumes the swg_decisions topic and routes the traffic to the SaaS application, if the access request is allowed. If the request is denied, the proxy responds back to the users with the reason or violations details, if any.
Due to the real-time nature of the solution, the security administrator can add, modify, or remove the rules through the swg_rules topic as Flink constantly consumes and evaluates this topic.In the following sections, we discuss the key components of the solution in more detail.
AWS Local Zones: The foundation
AWS Local Zones provide low-latency extensions of AWS Regions positioned near large population and industry centers. For our Secure Web Gateway use case, deploying in a Local Zones offers several advantages:
- Proximity to corporate offices – Reducing round-trip latency for traffic inspection. AWS Local Zones is designed to provide applications with low latency aiming for single-digit millisecond performance.
- AWS-native security controls – Using AWS security features.
- Consistent connectivity – Reliable connection between corporate networks and AWS resources.
The Local Zone hosts our EMR cluster and networking components, making sure traffic inspection through the Secure Web Gateway happens with single-digit millisecond latency. For scenarios where traffic inspection doesn’t require single-digit millisecond latency, deploying hosting the solution on EMR cluster in a Region should work fine.
Amazon EMR with Apache Flink: The decision engine
The core intelligence of our Secure Web Gateway solution is powered by Amazon EMR running Flink for real-time stream processing. With Amazon EMR running on Flink, we take advantage of the optimized real-time stream processing capability offered by Flink. EMR running in AWS Local Zones helps users perform complex data processing closer to their data centers or corporate locations without worrying any potential latency introduced for moving the data to other Regions. In this particular solution, we use Flink’s stateful processing, which allows for maintaining the session context across multiple network requests/packets. The solution also provides a dynamic rules engine that is combined with the real-time stream of requests for network access.
Architectural component choice considerations
Amazon EMR offers several deployment options for different kinds of workloads and use cases, including Amazon EMR on EKS. AWS also provides Amazon Managed Service for Apache Flink, a fully managed service that simplifies the process of building and managing Flink applications. As of this writing, both the EMR on EKS deployment option and Amazon Managed Service for Apache Flink are not available in AWS Local Zones.
Prerequisites
Before proceeding with this deployment, ensure you have:
- AWS account with AWS IAM permissions for Amazon VPC, EMR, and Local Zones management
- Basic familiarity with the AWS Management Console
Deploy Amazon EMR on a Local Zone
To deploy Amazon EMR on a Local Zone, you first need to enable the Local Zone for the AWS account. For instructions, refer to Step 1 and Step 2 in Getting started with AWS Local Zones.
After you have enabled a Local Zone and created a Local Zone subnet, create your EMR cluster. For instructions, refer to Step 1: Configure data resources and launch an Amazon EMR cluster. You can follow the instructions provided for the AWS Management Console. Make sure you select the appropriate Amazon EMR release version (5.28.0 or later for Local Zone support). Select the applications you need, which in this case is Hadoop and Flink.
A crucial step to launching an EMR cluster in a Local Zone is selecting the Local Zone network configuration. Choose the VPC that contains your Local Zone subnet, and choose the subnet that you created in the Local Zone.
Review all other configurations and settings for your cluster and make any final adjustments as needed, then choose Create cluster to launch your EMR cluster in the Local Zone.
Performance and scaling considerations
The Local Zone EMR deployment can be scaled based on traffic patterns. You can manually scale the EMR cluster horizontally by adding more worker nodes during peak traffics to provide low-latency performance, after you have increased the number of users that access the Secure Web Gateway. Alternatively, you can set up a scheduled action to scale the EMR cluster at predetermined times based on known workload patterns. You can also perform vertical scaling by using Amazon Elastic Compute Cloud (Amazon EC2) instance types with more compute capacity. Consider using the manual resize option for EMR clusters to modify the cluster size based on workload requirements.
Another important performance consideration is to optimize Flink checkpointing for fault tolerance. To learn more, see Optimizing job restart times for task recovery and scaling operations.
Security considerations
Although this architecture prioritizes low-latency performance, implementing proper security controls is essential for production deployments. The solution handles sensitive corporate network traffic that requires protection through encryption, access controls, and monitoring. For comprehensive security guidance specific to EMR deployments, refer to Security in Amazon EMR. Consider the following key areas:
- Data protection – Enable encryption at rest and in transit using Amazon EMR security configurations, including Amazon S3 encryption and TLS certificates for inter-node communication
- Access control – Implement AWS Identity and Access Management (IAM) roles with least privilege for Amazon EMR service roles, EC2 instance profiles, and runtime roles to isolate job access
- Network security – Deploy EMR clusters in private subnets with security groups following least privilege, and enable the Amazon EMR block public access feature
Benefits of Amazon EMR
Using Amazon EMR on AWS Local Zones in this architecture offers several key benefits:
- Low latency – Providing the compute in AWS Local Zones close to corporate offices helps you achieve low-latency processing.
- Real-time inspection – Flink’s streaming capabilities unlocks the ability to process real-time inspection for network requests.
- Complex policy application – With Flink on Amazon EMR, you can build a complex policy application that, for instance, can detect sophisticated access patterns across multiple events and time windows that would be impossible with traditional rule-based systems.
- Scalability – Amazon EMR provides the flexibility to automatically scale the cluster with a custom policy. Moreover, Amazon EMR release 6.15.0 and higher supports Flink autoscaler, which automatically scales the individual Flink job vertexes based on the job metrics.
- Compliance – Logging all the events to a durable storage like Amazon S3 helps users improve their security and audit posture.
Clean up
To avoid incurring unnecessary charges, clean up the resources you created during this walkthrough. Follow these steps in order:
Step 1: Terminate the EMR cluster
- Open the Amazon EMR console
- Select your EMR cluster from the list
- Choose Terminate
- Confirm the termination when prompted
- Wait for the cluster status to change to “TERMINATED”
Step 2: Clean up VPC resources
- In the Amazon VPC console, delete the Local Zone subnet you created
- If you created a custom VPC specifically for this demo, delete any associated:
- Route tables
- Internet gateways
- Security groups (other than default)
- The VPC itself
Step 3: Disable the Local Zone (optional)
- In the EC2 console, go to Zones under “Settings”
- Find your enabled Local Zone
- Choose Manage and disable the zone if you no longer need it for other workloads
Step 4: Review additional resources Check for and clean up any other resources you may have created:
- S3 buckets used for logging or EMR storage
- CloudWatch log groups
- Any custom IAM roles or policies created specifically for this architecture
Conclusion
This implementation of Amazon EMR on AWS Local Zones demonstrates how enterprises can bring powerful data processing capabilities to the edge while maintaining single-digit millisecond latency. By showcasing a Secure Web Gateway application, we have illustrated just one of many possible use cases where performance-sensitive workloads can benefit from this architecture.As the edge computing landscape evolves, we anticipate organizations will increasingly use this pattern for additional use cases, including:
- Real-time fraud detection for financial transactions requiring immediate decision-making
- Connected vehicle applications where processing telemetry data with minimal latency is critical
- Internet of Things (IoT) sensor analytics that require immediate insights from operational technology environments
- Augmented reality experiences where processing must happen close to end-users
We encourage you to evaluate your latency-sensitive workloads and consider how AWS Local Zones with Amazon EMR might help you implement architectures previously perceived highly challenging. Start small with a proof of concept like the one outlined here, measure the performance gains, and expand to production use cases with confidence. Implementing a Secure Web Gateway in AWS Local Zones with Amazon EMR and Flink offers enterprises a powerful solution for securing corporate traffic. By using the proximity of Local Zones and the real-time processing capabilities of Flink, organizations can implement sophisticated security policies without the latency penalties traditionally associated with traffic inspection.
About the authors
 Gagan Brahmi is a Specialist Senior Solutions Architect at Amazon Web Services (AWS), specializing in Data Analytics and AI/ML solutions. With over 20 years in information technology, he helps customers architect scalable, high-performance analytics platforms using distributed data processing, real-time streaming technologies, and machine learning services on AWS. When not designing cloud solutions, Gagan enjoys exploring new places with his family.
 Arun Shanmugam is a Senior Analytics Solutions Architect at AWS, with a focus on building modern data architecture. He has been successfully delivering scalable data analytics solutions for customers across diverse industries. Outside of work, Arun is an avid outdoor enthusiast who actively engages in CrossFit, road biking, and cricket.
 George Oakes is a Senior Hybrid Solutions Architect at AWS, with a focus on edge, on-premise, and low latency architectures. He has been successfully delivering scalable hybrid AWS solutions for customers across diverse industries. Outside of work, George is an avid outdoor enthusiast who enjoys hiking and visiting parks and UNESCO sites around.
DC Takeover #lastweektonight
Post Syndicated from LastWeekTonight original https://www.youtube.com/shorts/kSZ9DNj5_Ts
[$] Kexec handover and the live update orchestrator
Post Syndicated from corbet original https://lwn.net/Articles/1033364/
Rebooting a computer ordinarily brings an abrupt end to any state built up
by the old system; the new kernel starts from scratch. There are, however,
people who would like to be able to reboot their systems without
disrupting the workloads running therein. Various developers are currently
partway through the project of adding this capability, in the form of
“kexec handover” and the “live update orchestrator”, to the kernel.
ML Observability: Bringing Transparency to Payments and Beyond
Post Syndicated from Netflix Technology Blog original https://netflixtechblog.com/ml-observability-bring-transparency-to-payments-and-beyond-33073e260a38
By Tanya Tang, Andrew Mehrmann
At Netflix, the importance of ML observability cannot be overstated. ML observability refers to the ability to monitor, understand, and gain insights into the performance and behavior of machine learning models in production. It involves tracking key metrics, detecting anomalies, diagnosing issues, and ensuring models are operating reliably and as intended. ML observability helps teams identify data drift, model degradation, and operational problems, enabling faster troubleshooting and continuous improvement of ML systems.
One specific area where ML observability plays a crucial role is in payment processing. At Netflix, we strive to ensure that technical or process-related payment issues never become a barrier for someone wanting to sign up or continue using our service. By leveraging ML to optimize payment processing, and using ML observability to monitor and explain these decisions, we can reduce payment friction. This ensures that new members can subscribe seamlessly and existing members can renew without hassle, allowing everyone to enjoy Netflix without interruption.
ML Observability: A Primer
ML Observability is a set of practices and tools to help ML practitioners and stakeholders alike gain a deeper, end to end understanding of their ML systems across all stages of its lifecycle, from development to deployment to ongoing operations. An effective ML Observability framework not only facilitates automatic detection and surfacing of issues but also provides detailed root cause analysis, acting as a guardrail to ensure ML systems perform reliably over time. This enables teams to iterate and improve their models rapidly, reduce time to detection for incidents, while also increasing the buy-in and trust of their stakeholders by providing rich context about the system’s’ behaviors and impact.

Some examples of these tools include long-term production performance monitoring and analysis, feature, target, and prediction drift monitoring, automated data quality checks, and model explainability. For example, a good observability system would detect aberrations in input data, the feature pipeline, predictions, and outcomes as well provide insight into the likely causes of model decisions and/or performance.
As an ML portfolio grows, ad-hoc monitoring becomes increasingly challenging. Greater complexity also raises the likelihood of interactions between different model components, making it unrealistic to treat each model as an isolated black box. At this stage, investing strategically in observability is essential — not only to support the current portfolio, but also to prepare for future growth.
Stakeholder-Facing Observability Modules
In order to reliably and responsibly evolve our payments processing system to be increasingly ML-driven, we invested heavily up-front in ML observability solutions. To provide confidence to our business stakeholders through this evolution, we looked beyond technical metrics such as precision and recall and placed greater emphasis on real-world outcomes like “how much traffic did we send down this route” and “where are the regions that ML is underperforming.”
Using this as a guidepost, we designed a collection of interconnected modules for machine learning observability: logging, monitoring, and explaining.

Logging
In order to support the monitoring and explaining we wanted to do, we first needed to log the appropriate data. This seems obvious and trivial, but as usual the devil is in the details: what fields exactly do we need to log and when? How does this work for simple models vs. more complex ones? What about models that are actually made of multiple models?
Consider the following, relatively straightforward model. It takes some input data, creates features, passes these to a model which creates some score between 0 and 1, and then that score is translated into a decision (say, whether to process a card as Debit or Credit).

There are several elements you may wish to log: a unique identifier for each record that is trained and scored, the raw data, the final features that fed the model, a unique identifier for the model, the feature importances for that model, the raw model score, the cutoffs used to map a score to a decision, timestamps for the decision as well as the model, etc.
To address this, we drafted an initial data schema that would enable our various ML observability initiatives. We identified the following logical entities to be necessary for the observability initiatives we were pursuing:

Monitoring
The goal of monitoring is twofold: 1) enable self-serve analytics and 2) provide opinionated views into key model insights. It can be helpful to think of this as “business analytics on your models,” as a lot of the key concepts (online analytical processing cubes, visualizations, metric definitions, etc) carry over. Following this analogy, we can craft key metrics that help us understand our models. There are several considerations when defining metrics, including whether your needs are understanding real-world model behavior versus offline model metrics, and whether your audience are ML practitioners or model stakeholders.
Due to our particular needs, our bias for metrics is toward online, stakeholder-focused metrics. Online metrics tell us what actually happened in the real world, rather than in an idealized counterfactual universe that might have its own biases. Additionally, our stakeholders’ focus is on business outcomes, so our metrics tend to be outcome-focused rather than abstract and technical model metrics.

We focused on simple, easy to explain metrics:

These metrics begin to suggest reasons for changing trends in the model’s behavior over time, as well as more generally how the model is performing. This gives us an overall view of model health and an intuitive approximation of what we think the model should have done. For example, if payment processor A starts receiving more traffic in a certain market compared to payment processor B, you might ask:
- Has the model seen something to make it prefer processor A?
- Have more transactions become eligible to go to processor A?
However, to truly explain specific decisions made by the model, especially which features are responsible for current trends, we need to use more advanced explainability tools, which will be discussed in the next section.
Explaining
Explainability means understanding the “why” behind ML decisions. This can mean the “why” in aggregate (e.g. why are so many of our transactions suddenly going down one particular route) or the “why” for a single instance (e.g. what factors led to this particular transaction being routed a particular way). This gives us the ability to approximate the previous status quo where we could inspect our static rules for insights about route volume.
One of the most effective tools we can leverage for ML explainability is SHAP (Shapley Additive exPlanations, Lundberg & Lee 2017). At a high level, SHAP values are derived from cooperative game theory, specifically the Shapley values concept. The core idea is to fairly distribute the “payout” (in our case, the model’s prediction) among the “players” (the input features) by considering their contribution to the prediction.
Key Benefits of SHAP:
- Model-Agnostic: SHAP can be applied to any ML model, making it a versatile tool for explainability.
- Consistent and Local Explanations: SHAP provides consistent explanations for individual predictions, helping us understand the contribution of each feature to a specific decision.
- Global Interpretability: By aggregating SHAP values across many predictions, we can gain insights into the overall behavior of the model and the importance of different features.
- Mathematical properties: SHAP satisfies important mathematical axioms such as efficiency, symmetry, dummy, and additivity. These properties allow us to compute explanations at the individual level and aggregate them for any ad-hoc groups that stakeholders are interested in, such as country, issuing bank, processor, or any combinations thereof.
Because of the above advantages, we leverage SHAP as one core algorithm to unpack a variety of models and open the black box for stakeholders. Its well-documented Python interface makes it easy to integrate into our workflows.
Explaining Complex ML Systems
For ML systems that score single events and use the output scores directly for business decisions, explainability is relatively straightforward, as the production decision is directly tied to the model’s output. However, in the case of a bandit algorithm, explainability can be more complex because the bandit policy may involve multiple layers, meaning the model’s output may not be the final decision used in production. For example, we may have a classifier model to predict the likelihood of transaction approval for each route, but we might want to penalize certain routes due to higher processing fees.
Here is an example of a plot we built to visualize these layers. The traffic that the model would have selected on its own is on the left, and different penalty or guardrail layers impact final volume as you move left to right. For example, the model originally allocated 22% traffic to processor W with Configuration A, however for cost and contractual considerations, the traffic was reduced to 19% with 3% being allocated to Processor W with Configuration B, and Processor Nc with Configuration B.

While individual event analysis is crucial, such as in fraud detection where false positives need to be scrutinized, in payment processing, stakeholders are more interested in explaining model decisions at a group level (e.g., decisions for one issuing bank from a country). This is essential for business conversations with external parties. SHAP’s mathematical properties allow for flexible aggregation at the group level while maintaining consistency and accuracy.
Additionally, due to the multi-candidate structure, when stakeholders inquire about why a particular candidate was chosen, they are often interested in the differential perspective — specifically, why another similar candidate was not selected. We leverage SHAP to segment populations into cohorts that share the same candidates and identify the features that make subtle but critical differences. For example, while Feature A might be globally important, if we compare two candidates that both have the same value for Feature A, the local differences become crucial. This facilitates stakeholders discussions and helps understand subtle differences among different routes or payment partners.
Earlier, we were alerted that our ML model consistently reduced traffic to a particular route every Tuesday. By leveraging our explanation system, we identified that two features — route and day of the week — were contributing negatively to the predictions on Tuesdays. Further analysis revealed that this route had experienced an outage on a previous Tuesday, which the model had learned and encoded into the route and day of the week features. This raises an important question: should outage data be included in model training? This discovery opens up discussions with stakeholders and provides opportunities to further enhance our ML system.
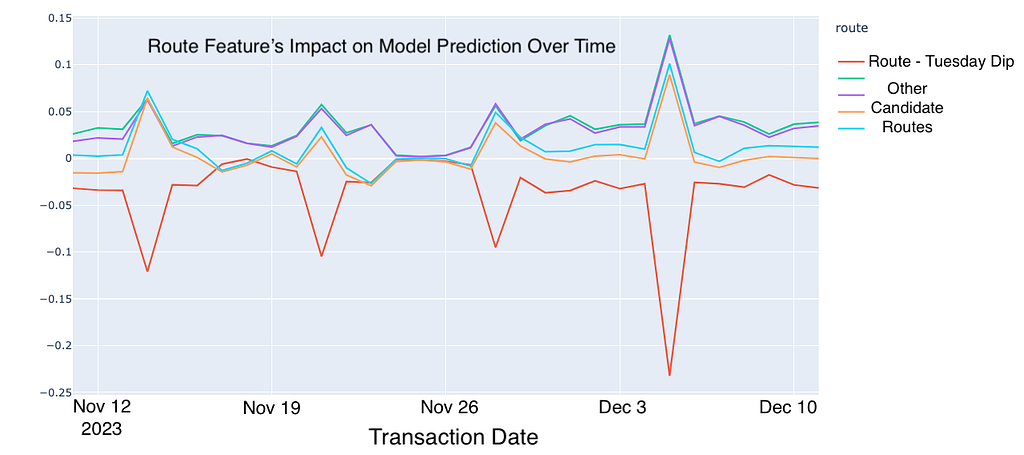
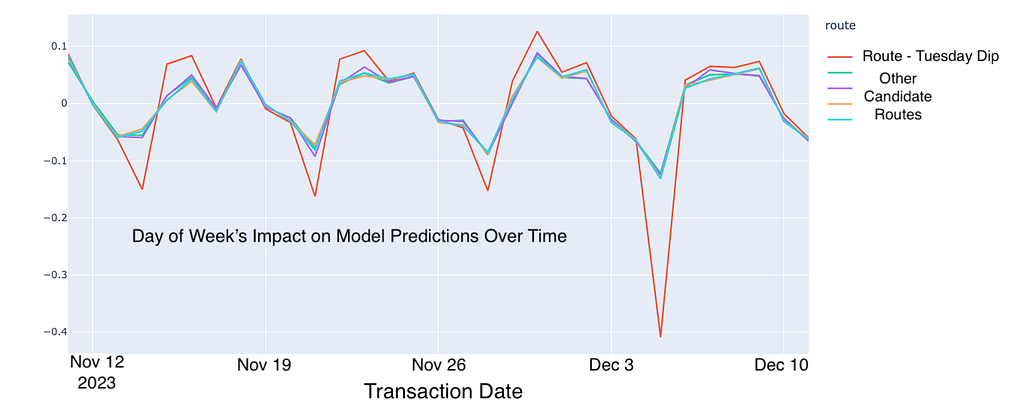
The explanation system not only demystifies our machine learning models but also fosters transparency and trust among our stakeholders, enabling more informed and confident decision-making.
Wrapping Up
At Netflix, we face the challenge of routing thousands of payment transactions per minute in our mission to entertain the world. To help meet this challenge, we introduced an observability framework and set of tools to allow us to open the ML black box and understand the intricacies of how we route billions of dollars of transactions in hundreds of countries every year. This has led to a massive operational complexity reduction in addition to improved transaction approval rate, while also allowing us to focus on innovation rather than operations.
Looking ahead, we are generalizing our solution with a standardized data schema. This will simplify applying our advanced ML observability tools to other models across various domains. By creating a versatile and scalable framework, we aim to empower ML developers to quickly deploy and improve models, bring transparency to stakeholders, and accelerate innovation.
We also thank Karthik Chandrashekar, Zainab Mahar Mir, Josh Karoly and Josh Korn for their helpful suggestions.

ML Observability: Bringing Transparency to Payments and Beyond was originally published in Netflix TechBlog on Medium, where people are continuing the conversation by highlighting and responding to this story.
New Faster AMD Alveo V80 Accelerator with HBM2e and Fast Networking
Post Syndicated from Cliff Robinson original https://www.servethehome.com/new-faster-amd-alveo-v80-accelerator-with-hbm2e-and-fast-networking/
The new, faster, AMD Alveo V80 packs 32GB of HBM2e memory, four QSFP56 200G ports, and many other features with the SoC on a pre-built card
The post New Faster AMD Alveo V80 Accelerator with HBM2e and Fast Networking appeared first on ServeTheHome.
The #1 WiFi Planning Tool You’re Not Using Yet
Post Syndicated from Crosstalk Solutions original https://www.youtube.com/shorts/5jNXeHdIFk8
AWS Weekly Roundup: Single GPU P5 instances, Advanced Go Driver, Amazon SageMaker HyperPod and more (August 18, 2025)
Post Syndicated from Prasad Rao original https://aws.amazon.com/blogs/aws/aws-weekly-roundup-single-gpu-p5-instances-advanced-go-driver-amazon-sagemaker-hyperpod-and-more-august-18-2025/
Let me start this week’s update with something I’m especially excited about – the upcoming BeSA (Become a Solutions Architect) cohort. BeSA is a free mentoring program that I host along with a few other AWS employees on a volunteer basis to help people excel in their cloud careers. Last week, the instructors’ lineup was finalized for the 6-week cohort starting September 6. The cohort will focus on migration and modernization on AWS. Visit the BeSA website to learn more.
Another highlight for me last week was the announcement of six new AWS Heroes for their technical leadership and exceptional contributions to the AWS community. Read the full announcement to learn more about these community leaders.

Last week’s launches
Here are some launches from last week that got my attention:
- Amazon EC2 Single GPU P5 instances are now generally available — You can right-size your machine learning (ML) and high performance computing (HPC) resources cost-effectively with the new Amazon Elastic Compute Cloud (Amazon EC2) P5 instance size with one NVIDIA H100 GPU.
- AWS Advanced Go Driver is generally available — You can now use the AWS Advanced Go Driver with Amazon Relational Database Service (Amazon RDS) and Amazon Aurora PostgreSQL-Compatible and MySQL-Compatible database clusters for faster switchover and failover times, Federated Authentication, and authentication with AWS Secrets Manager or AWS Identity and Access Management (IAM). You can install the PostgreSQL and MySQL packages for Windows, Mac, or Linux, by following the installation guides in GitHub.
- Expanded support for Cilium with Amazon EKS Hybrid Nodes — Cilium is a Cloud Native Computing Foundation (CNCF) graduated project that provides core networking capabilities for Kubernetes workloads. Now, you can receive support from AWS for a broader set of Cilium features when using Cilium with Amazon EKS Hybrid Nodes including application ingress, in-cluster load balancing, Kubernetes network policies, and kube-proxy replacement mode.
- Amazon SageMaker AI now supports P6e-GB200 UltraServers — You can accelerate training and deployment of foundational models (FMs) at trillion-parameter scale by using up to 72 NVIDIA Blackwell GPUs under one NVLink domain with the new P6e-GB200 UltraServer support in Amazon SageMaker HyperPod and Model Training.
- Amazon SageMaker HyperPod now supports fine-grained quota allocation of compute resources, topology-aware-scheduling of LLM tasks and custom Amazon Machine Images (AMIs) — You can allocate fine-grained compute quota for GPU, Trainium accelerator, vCPU, and vCPU memory within an instance to optimize compute resource distribution. With topology-aware scheduling, you can schedule your large language model (LLM) tasks on an optimal network topology to minimize network communication and enhance training efficiency. Using custom AMIs, you can deploy clusters with pre-configured, security-hardened environments that meet your specific organizational requirements.
Additional updates
Here are some additional news items and blog posts that I found interesting:
- Celebrating 10 years of Amazon Aurora innovation — Join the livestream event on August 21, 2025, to celebrate a decade of Aurora database innovation.
- AWS named as a Leader in 2025 Gartner Magic Quadrant for Strategic Cloud Platform Services — For the fifteenth consecutive year, Gartner has named AWS a Leader in the Gartner Magic Quadrant for Strategic Cloud Platform Services (SCPS), making AWS the longest-running Magic Quadrant Leader.
- Introducing AWS Cloud Control API (CCAPI) MCP Server — You can now use natural language to managing cloud infrastructure using CCAPI MCP Server. You can create, read, update, delete, and list resources using natural language.
- Introducing Amazon Bedrock AgentCore Identity — AgentCore Identity provides a centralized capability to manage agent identities, securing credentials, and supporting seamless integration with AWS and third-party services through Sigv4, standardized OAuth 2.0 flows, and API key.
- Introducing Amazon Bedrock AgentCore Gateway — A fully managed service to connect AI agents with tools and services. It serves as a centralized tool server, providing a unified interface where agents can discover, access, and invoke tools.
Upcoming AWS events
Check your calendars and sign up for upcoming AWS and AWS Community events:
- AWS re:Invent 2025 (December 1-5, 2025, Las Vegas) — The AWS flagship annual conference offering collaborative innovation through peer-to-peer learning, expert-led discussions, and invaluable networking opportunities.
- AWS Summits — Join free online and in-person events that bring the cloud computing community together to connect, collaborate, and learn about AWS. Coming up soon are summits in Johannesburg (August 20) and Toronto (September 4).
- AWS Community Days — Join community-led conferences that feature technical discussions, workshops, and hands-on labs led by expert AWS users and industry leaders from around the world: Adria (September 5), Baltic (September 10), Aotearoa (September 18), and South Africa (September 20).
Join the AWS Builder Center to learn, build, and connect with builders in the AWS community. Browse here for upcoming in-person and virtual developer-focused events.
That’s all for this week. Check back next Monday for another Weekly Roundup!
– Prasad
Lightmatter Passage 3D CPO Does 16-lambda BiDi DWDM Over a Single Fiber
Post Syndicated from Patrick Kennedy original https://www.servethehome.com/lightmatter-passage-3d-cpo-does-16-lambda-bidi-dwdm-over-a-single-fiber/
The new Lightmatter Passage 3D co-packaged optics solution is able to deliver 16 lambda bidirectional DWDM over a single fiber
The post Lightmatter Passage 3D CPO Does 16-lambda BiDi DWDM Over a Single Fiber appeared first on ServeTheHome.