Post Syndicated from Home Assistant original https://www.youtube.com/shorts/YakjQj2bH6I
Multi-modal autoscaling with Amazon EC2 Auto Scaling: adding signals for faster, more reliable scaling
Post Syndicated from Shubhendu Dubey original https://aws.amazon.com/blogs/compute/multi-modal-autoscaling-with-amazon-ec2-auto-scaling-adding-signals-for-faster-more-reliable-scaling/
How do you handle unpredictable workload patterns that spike during promotional events or seasonal peaks? Multi-modal autoscaling with Amazon EC2 Auto Scaling combines infrastructure metrics like CPU with application-level signals, so a group scales on the demand its users create and not only on how busy the servers look. Those signals track the load that drives your business outcomes, such as sales or sign-ups.
CPU-based autoscaling works well for many workloads, but some demand does not register as CPU right away. Adding signals such as request counts and application metrics lets a group respond to the load its users create. By publishing Amazon CloudWatch custom metrics and application-driven triggers, you give Auto Scaling more information to act on.
In our testing, a group that scaled only on CPU rejected about 7,000 checkout sessions during a demand spike, and a stronger baseline that added Application Load Balancer request count still rejected about 6,900. A group that added an application metric rejected none, and it held p99 latency to about 0.43 seconds against 2.25 seconds for the CPU-only group. Predictive scaling can add a forecasting layer for cyclical demand, but it needs days of history to be useful, so we treat it as a complement. In this post, we show you how to implement multi-modal autoscaling on EC2 Auto Scaling, with code samples and results from a controlled test.
Prerequisites
To follow along, you need access to the following AWS services with appropriate permissions:
-
EC2 Auto Scaling, for scaling policies and group management.
-
CloudWatch, for metrics, alarms, and dashboards.
-
AWS CloudFormation, for infrastructure deployment.
Expanding beyond single-metric scaling
The default target tracking policy in EC2 Auto Scaling uses average CPU utilization, a practical starting point because CPU usage is a universal characteristic of compute workloads. Adding complementary signals, such as application-level metrics or predictive forecasting, gives Auto Scaling more information to make timely capacity decisions.
For workloads that need a faster response from target tracking alone, see Faster scaling with Amazon EC2 Auto Scaling target tracking.
In distributed architectures, different components can have distinct scaling characteristics. An API gateway might correlate well with request rate, while a background processor scales better on queue depth. With multi-modal scaling, you can match each component’s policy to its actual workload pattern. For containerized workloads, consider event-driven autoscaling with KEDA on Amazon Elastic Kubernetes Service (Amazon EKS).
Multi-modal autoscaling architecture
Multi-modal autoscaling combines three approaches to capacity management. Reactive scaling responds to current CloudWatch metrics, such as CPU utilization, memory, network throughput, response times, and custom application indicators. Application-metric scaling brings workload-specific signals into the decision, using custom CloudWatch metrics like active user sessions, queue depth, or transaction volume. These application metrics are often the closest measurable proxy for business activity such as orders or sign-ups. Predictive scaling uses machine learning in EC2 Auto Scaling to forecast capacity needs from historical patterns, so infrastructure scales before demand increases.
With application-metric scaling, applications can scale on signals that infrastructure metrics miss. An ecommerce platform might scale on active checkout sessions, while a streaming service scales on concurrent stream counts. In the test later in this post, we use active checkout sessions as the custom metric.
Implementing multi-modal autoscaling
This section builds the configuration in layers. Start with CPU target tracking as a baseline that every group keeps, then add a custom application metric that reflects real user load. The test later in this post compares these signals against a request-count baseline. Predictive scaling is an optional forecasting layer described at the end.
Step 1: CPU target tracking
Start with the foundation that most workloads already use: a target tracking policy on average CPU utilization. Target tracking is a managed policy that adjusts capacity to keep a metric at or near a target value. It supports predefined metrics, including CPU utilization and request count per target, and custom CloudWatch metrics. When multiple target tracking policies are active, Auto Scaling coordinates them: it scales out if any policy requires it, but scales in only when all policies agree, which helps prevent oscillation.
Our test also included a second infrastructure baseline, a target tracking policy on the load balancer’s request count per target. It uses the same structure with a predefined metric:
Step scaling is another option for spike handling. With step scaling, you can define different capacity increments for different alarm thresholds. It keeps evaluating the alarm during scaling activities, which can make it react faster than target tracking’s default evaluation window. Step scaling policies do not coordinate with each other.
Step 2: Add a custom application metric
Next, add a second target tracking policy on a custom CloudWatch metric that reflects application load. In our test, instances publish an active checkout sessions metric at a 10-second resolution. To act on that resolution, set a Period of 10 seconds on the policy. Without it, the policy waits for three 1-minute datapoints like any other and the high-resolution metric only adds publishing cost. With it, a scale-out can begin in about 30 seconds. The policy includes the Auto Scaling group dimension so it tracks the metric for the right group. We set the target to 100 active sessions per instance, about 75 percent of the measured per-instance capacity of 135. This leaves headroom to absorb a spike while new instances boot.
Step 3: Add predictive scaling
Predictive scaling is an optional forecasting layer. It uses machine learning in EC2 Auto Scaling to analyze historical load and scale ahead of recurring, cyclical demand, using customized metric specifications in ForecastAndScale mode. You need to provide several days of history for it to forecast well, so it complements reactive signals rather than replacing them. Start in ForecastOnly mode to watch the forecast before it drives any scaling.
Monitoring
Use CloudWatch dashboards to track how each policy contributes to scaling decisions, and set alarms on the metrics that matter for your workload, such as per-instance load or latency. Enable detailed monitoring on the launch template, with Monitoring set to true, so that the system publishes CPU metrics every minute. Without it, you cannot complete the CPU policy’s scale-in evaluation and your group will stop scaling in. Watching the policies side by side is what surfaced this scale-in behavior.
Performance results
We compared three Auto Scaling groups under an identical load profile in a single 75-minute test in the us-east-1 Region. Each group used c8g.large instances with a minimum of 6 and a maximum of 40 instances, and every group carried the same CPU target tracking policy at 70 percent as a fallback:
-
ASG A: CPU target tracking only. This is the single-signal infrastructure baseline.
-
ASG B: CPU target tracking plus an Application Load Balancer request-count policy. Request rate is a stronger infrastructure baseline than CPU alone.
-
ASG C: CPU target tracking plus the custom checkout-sessions metric at 10-second resolution, published with a Period of 10 seconds.
All the groups received the same load at the same time. During the shared ramp, arrival rate rose and every group scaled correctly, which makes the comparison fair. CPU crossed 70 percent on the CPU group, request count crossed its target of 300 on the request-count group, and all three converged to a similar size.
| Ramp phase (arrivals 30% → 85%) | A: CPU only | B: A + ALB requests | C: A + app sessions |
| Instances (start → peak) | 6 → 9 | 6 → 10 | 6 → 10 |
| CPU | 73.6% | 74.0% | 69.0% |
| Requests per target (target 300) | 319 | 323 | 297 |
Then arrival rate was held flat while the number of concurrent checkout sessions kept rising, a shape that infrastructure signals cannot see. The next table reports that divergence phase, measured directly from CloudWatch and the load balancer.
| Measured metric (divergence) | A: CPU only | B: A + ALB requests | C: A + app sessions |
| Instances (start → end) | 11 → 11 | 11 → 11 | 11 → 22 |
| Rejected checkouts | 7,064 | 6,886 | 0 |
| CPU (start → end) | 67.2% → 45.1% | 66.5% → 45.5% | 66.2% → 36.8% |
| Peak sessions per instance | 135 | 135 | 116 |
| Requests per target | 285 → 279 | 282 → 279 | 277 → 154 |
The difference is what each group could see. Arrival rate was held flat while the number of concurrent sessions rose, so CPU and request count stayed in range while the application saturated. The CPU-only and request-count groups held at 11 instances and rejected 7,064 and 6,886 checkouts. Their CPU even fell, from about 67 percent to about 45 percent, because a rejected request never reaches the work it would have done, so a policy targeting 70 percent saw spare capacity at the moment the application was failing users. The application-metric group read the rising sessions directly and scaled from 11 to 22 instances, rejecting none.
Effect on latency and errors
We measured latency and rejected checkouts on the load balancer during the test. At rest, all groups were identical. The gap opened only in the divergence phase, when concurrency rose without a matching change in arrival rate. Session slots are the scarce resource here, so sessions per instance is the causal driver of latency. The application group scales on sessions and we report latency as the outcome, rather than scaling on latency directly, which is not recommended for target tracking. The latency figures come from the load balancer’s TargetResponseTime at the end of the divergence phase. A client-side number measured over the internet would reflect network round-trip rather than the service.
| Measured metric | A: CPU only | B: A + ALB requests | C: A + app sessions |
| TargetResponseTime (average), end of divergence | 1.122 s | 1.120 s | 0.284 s |
| TargetResponseTime (p99), end of divergence | 2.254 s | 2.235 s | 0.431 s |
| TargetResponseTime (average) at warm-up | 0.283 s | 0.283 s | 0.284 s |
| Rejected checkouts, drain phase | 4,115 | 3,631 | 0 |
The application-metric group, ASG C, kept per-instance load near its target and rejected no checkouts. Its average latency at the end of the divergence phase was 0.284 seconds against 1.122 for the CPU-only group, and its p99 was 0.431 seconds against 2.254. The request-count group, ASG B, tracked its own signal within range the whole time, which is exactly why it could not react: request rate was flat while concurrency climbed.
Once every group has enough capacity, they perform the same. The value of the application signal is in the transition, the gap between when demand arrives and when the fleet is ready, which the infrastructure signals here never detected.
Handling known high-traffic events
For planned events like flash sales, scheduled scaling can pre-scale capacity ahead of time. Multi-modal scaling complements scheduled scaling by handling unplanned spikes and organic traffic that does not follow a fixed schedule.
Understanding cost implications
Running the application signal requires more instances. During the spike it held about 22 instances, against 11 on the infrastructure-only groups. That extra capacity is what kept sessions per instance near the target and stopped the group from turning checkouts away. For your own workload, the question is whether a spike’s worth of extra instances costs less than the checkouts you would otherwise reject.
Conclusion
Multi-modal autoscaling combines infrastructure metrics with application-level signals so a group scales on the demand its users create, not only on how busy its servers look. In our test, a group that scaled only on CPU rejected about 7,000 checkout sessions during a demand spike, and a stronger baseline that added load balancer request count still rejected about 6,900. A group that added a custom application metric rejected none, and held p99 latency near 0.43 seconds against 2.25 seconds for the CPU-only group. Its CPU even fell while the infrastructure groups were failing requests, which shows why an infrastructure signal alone can miss the demand that matters.
Start with CPU target tracking as a fallback. Add a signal that reflects the load your users create, and pick the one that tracks closest to a business outcome like orders or active users. Set a Period on a high-resolution custom metric so the policy can act on it, and enable detailed monitoring so scale-in works. Predictive scaling is worth adding for demand you can forecast, once the group has days of history to learn from.
To implement multi-modal autoscaling, you can open Amazon EC2 Auto Scaling in the AWS Management Console and add a second scaling signal to one of your existing groups, following the configuration steps in this post. For a deeper look at target tracking behavior, see Faster scaling with Amazon EC2 Auto Scaling target tracking. The Amazon EC2 Auto Scaling User Guide covers predictive scaling policies, custom metrics, and scaling cooldowns in detail.
How Equinix cut operational overhead with a shared services architecture on Amazon EKS
Post Syndicated from Chhavi Kaushik original https://aws.amazon.com/blogs/architecture/how-equinix-cut-operational-overhead-with-a-shared-services-architecture-on-amazon-eks/
This post is cowritten by Manikandan Vasu, Vanji Sivajothy, and Ramchandra Koty from Equinix.
Equinix is the world’s digital infrastructure company, operating over 260 data centers across more than 70 metros globally. To address the operational sprawl that had grown from its earlier self-managed Kubernetes environment, Equinix built a shared services architecture on Amazon EKS. Previously, Equinix operated a self-managed Kubernetes environment on Amazon EC2 instances. In this model, they provisioned EC2 instances serving as etcd, control plane, and worker nodes, relying on open-source tooling to automate the installation and configuration of Kubernetes components. While this approach provided control and flexibility in the early stages of their Kubernetes journey, it also introduced a structural problem: individual application teams independently provisioning and managing their own clusters, each with its own lifecycle, configuration, and operational patterns.
Over time, this decentralized ownership model created significant operational sprawl. With no shared infrastructure layer, the cloud operations team had no consistent mechanism to enforce governance, standardize configurations, or provide common infrastructure services across the organization. Each application team operated in isolation, making decisions about networking, observability, security policies, and deployment pipelines independently. This resulted in a fragmented environment that was increasingly difficult to manage, secure, and scale.
Key operational challenges included:
- Operational sprawl – Independently managed clusters led to duplicated infrastructure and no unified operational baseline.
- No centralized governance – The cloud operations team had no mechanism to enforce network isolation, security policies, or deployment standards across team-owned clusters.
- Lack of shared services model – Common needs (CI/CD, observability, data services, networking) were solved differently by each team, creating redundancy.
- Cluster lifecycle complexity – Upgrading and patching control planes across multiple self-managed clusters introduced compounding risk with every cycle.
These challenges made it clear that Equinix needed a fundamental architectural shift, from a model where every team managed its own cluster. They moved to a shared services architecture where the cloud operations team centrally owns and governs the infrastructure while application teams focus purely on their business services. This led to their migration to Amazon EKS with a multi-account strategy designed for scalability, security, and centralized control.
In this post, we walk through how Equinix designed and implemented their shared services architecture on Amazon EKS after migrating from their self-managed Kubernetes environment. We also cover the operational results they achieved, including 4x faster deployments and significantly reduced operational overhead.
The solution: A shared services architecture on Amazon EKS (North Star architecture)
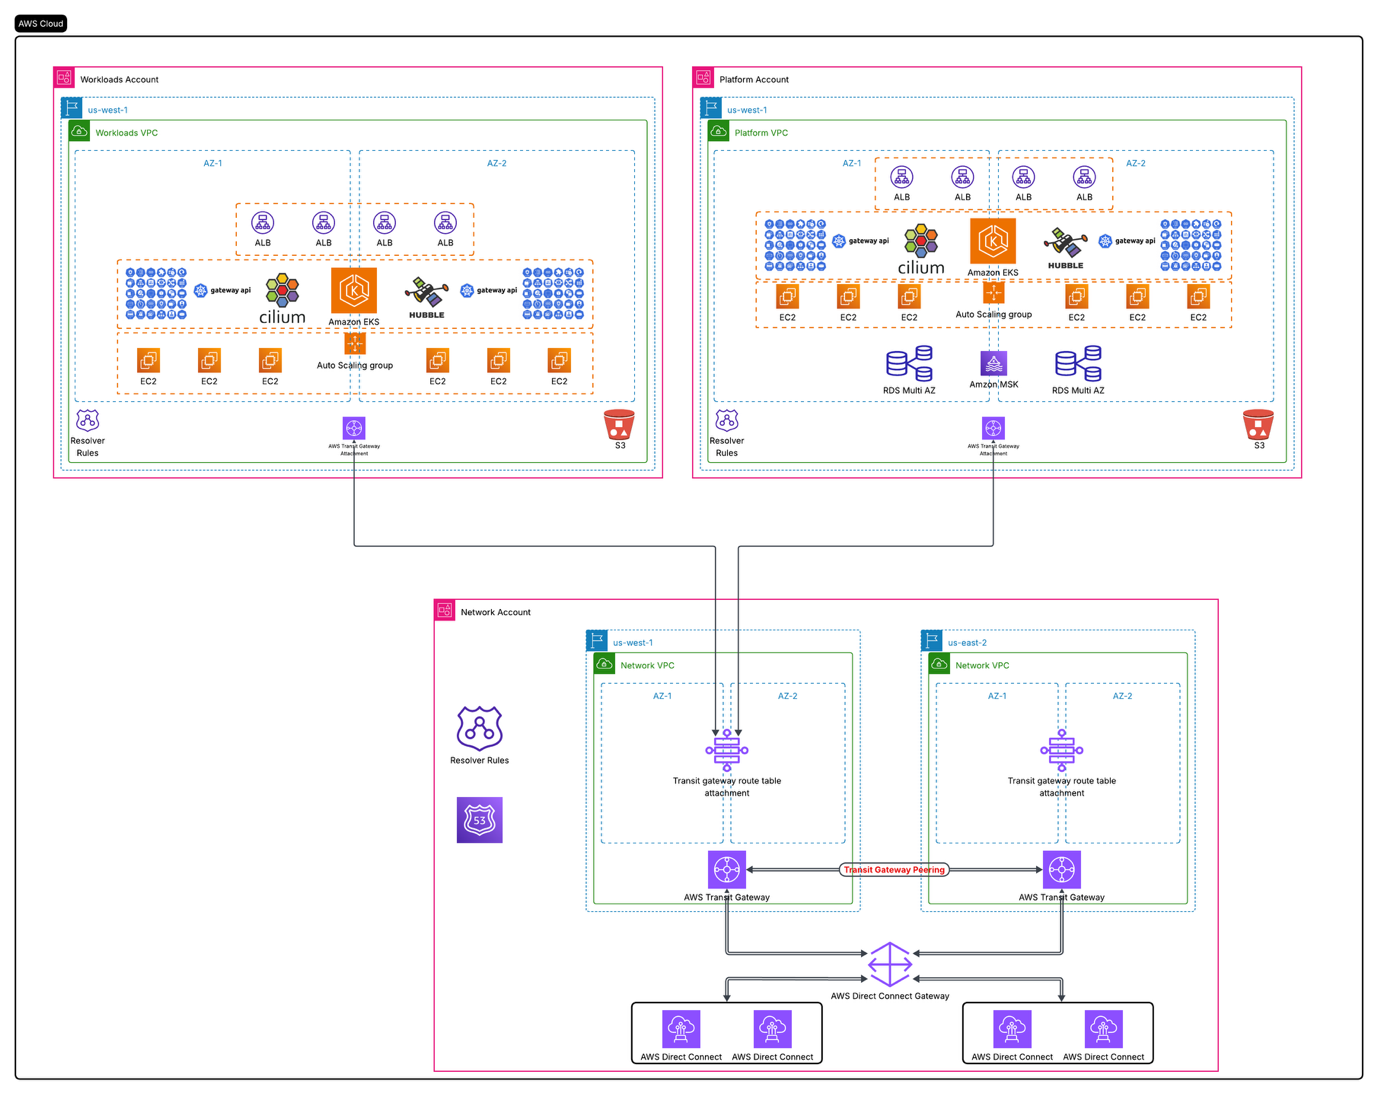
Figure 1: Equinix North Star architecture, a multi-account Amazon EKS architecture with workload isolation, centralized shared services, and hybrid connectivity through AWS Transit Gateway and AWS Direct Connect
Key architecture capabilities
The North Star architecture implements a multi-account, shared services model on Amazon EKS that cleanly separates concerns between application teams and the cloud operations team. The diagram illustrates the user acceptance testing (UAT) environment, with identical patterns replicated across non-production (system integration testing and development) and production, built around three core AWS accounts:
- Workloads Account (Workloads-VPC): The Workloads account hosts all application team services running on Amazon EKS in a dedicated VPC deployed across two Availability Zones (AZ-1 and AZ-2) in us-west-1 for high availability. Traffic ingress is managed through Application Load Balancer (ALB) with Kubernetes Gateway API (GatewayClass and Gateway resources) providing precise routing to application namespaces. Cilium serves as the Container Network Interface (CNI), enforcing network policies that isolate workloads at the pod level, while Hubble provides real-time network observability across all application traffic flows.
- Platform Account (Platform-VPC): The Platform account is owned and operated by the cloud operations team, housing all shared infrastructure services in a separate VPC. This includes:
- Managed data services: Amazon RDS, Amazon MSK, Amazon OpenSearch Service, Amazon MQ, and Amazon S3 consumed by application workloads across the account boundary.
- CI/CD infrastructure: GitHub Runners deployed as EKS workloads, providing a centralized, self-service pipeline for all application teams.
- Shared services: Capabilities managed centrally and accessible to all application teams.
Traffic ingress to platform services is handled through Network Load Balancer (NLB), with the same
Cilium/Hubble networking and observability stack as the Workloads account.
- Network Account (Network-VPC): A dedicated Network account acts as the connectivity hub, implementing an AWS Transit Gateway architecture that spans two Regions (us-west-1 and us-east-2) with Transit Gateway peering between them. Key networking capabilities include:
- Cross-account connectivity: AWS Transit Gateway attachments connect both the Workloads and Platform VPCs to the central hub, enabling controlled communication between accounts.
- DNS resolution Amazon Route 53 Resolver endpoints (inbound and outbound) in each Availability Zone, with a private hosted zone providing service discovery across the platform.
- Hybrid connectivity: AWS Direct Connect Gateway with dual circuits connecting back to on-premises Equinix border routers through network firewalls for security enforcement.
Results: Measurable impact across the organization
The migration to Amazon EKS delivered clear, measurable outcomes that validated Equinix’s North Star architecture strategy:
|
40% Reduction in operational overhead by eliminating the need to manage Kubernetes infrastructure. AWS now handles upgrades, patching, and high availability automatically. |
4x Increase in deployment frequency, enabling engineering teams to ship features and updates faster, freed from the constraints of infrastructure bottlenecks. |
100% Unified architecture adopted across multiple business organizations, establishing a single, consistent operating model for all containerized workloads. |
Additional operational improvements include:
- Enhanced developer productivity: Standardized CI/CD workflows through centralized GitHub Runners and self-service namespace provisioning reduced friction across the development lifecycle, allowing application teams to deploy independently without cloud operations team intervention.
- Improved observability: Hubble provides unified network flow visibility across both clusters, replacing fragmented, team-specific monitoring.
- Strengthened security posture: Multi-account isolation between application and shared services workloads, combined with Cilium network policies for pod-level segmentation, reduced the scope of potential security incidents and simplified compliance enforcement.
- Accelerated onboarding: New application teams onboard to the North Star architecture in days rather than weeks, deploying into pre-configured namespaces with access to shared data services, CI/CD pipelines, and observability. They do this without provisioning or managing cluster infrastructure.
“Amazon EKS gave us the foundation we needed to establish our North Star architecture – a scalable, standardized infrastructure that lets our engineers focus on what matters most: delivering innovation for our customers.”
Conclusion
Equinix’s migration to Amazon EKS from a self-managed environment demonstrates how leading digital infrastructure companies are using managed services from AWS to eliminate undifferentiated operational work and redeploy engineering talent toward higher-value innovation.
The North Star architecture now serves as Equinix’s blueprint for scaling containerized workloads across additional business organizations and geographies. It is an architecture that grows with the company while maintaining the governance, security, and operational consistency that enterprise-scale infrastructure demands.
If you are managing complex, distributed infrastructure, the broader takeaway is this: when you consolidate operational ownership onto a well-architected infrastructure and remove the burden of cluster management from your application teams, you can achieve a markedly different pace of innovation.
To get started with your own Amazon EKS deployment, visit the Amazon EKS product page or follow the Getting started with Amazon EKS guide. You can also explore the EKS Best Practices Guide for recommendations on multi-tenancy, networking, and security.
About the authors
Planning for disaster recovery using AWS Local Zones and AWS Outposts racks
Post Syndicated from Brianna Rosentrater original https://aws.amazon.com/blogs/compute/planning-for-disaster-recovery-using-aws-local-zones-and-aws-outposts-racks/
AWS customers with data residency, low latency, or local data processing requirements can use AWS Hybrid Cloud services to run their workloads either on-premises or within their regulatory boundary. Many of these workloads might be critical to their business, with minimal thresholds for downtime.
This post provides practical design guidance for building highly available architectures that span either two AWS Outposts racks or an Outpost rack and an AWS Local Zone, which are physically designed without single points of failure. By distributing workloads across two geographically and logically independent edge locations, you can achieve high availability while still benefiting from the low-latency, data-residency, and on-premises integration advantages that edge infrastructure provides. To maintain high availability, we recommend that you put a disaster recovery (DR) plan in place and conduct regular DR drills with your applications.
The architectures presented here cover a range of approaches to failure detection and site switching. Each approach offers a different balance between Recovery Time Objective (RTO) and Recovery Point Objective (RPO), operational complexity, and cost. By understanding these trade-offs, you can select the architecture that best aligns to your RPO/RTO targets, data protection and residency requirements, and budget. This helps you achieve the resilience your business requires without over-engineering or over-spending.
Overview
Outposts and Local Zones function as extensions of a single Availability Zone (AZ) within the AWS Region they’re anchored to. For high availability when planning for failover between the two platforms, anchor each to a different parent Region or, at minimum, a different AZ within the same Region. This geographic separation supports the low RPO and RTO targets required for mission-critical workloads. The architectures in this post follow these principles:
- Shared responsibility: AWS manages the Outposts and Local Zone infrastructure. You provide resilient power, cooling, and network connectivity for Outpost sites, and implement application-level failover logic.
- Independent failure domains: Treat each site as an independent failure domain. Anchoring each to a different parent AZ (or Region) ensures a failure in one AZ doesn’t affect both sites.
- Resilient network connectivity: Local Zones connect to their parent Region through the AWS Global Network, designed for maximum resilience. Outpost racks include redundant Outpost Networking Devices (ONDs) with eBGP peering for multipath load balancing and failover.
- Capacity planning for N+1: Provision additional capacity beyond your expected workload so surviving instances can absorb the load during host failures without degradation.
Building blocks of a disaster recovery strategy
A key design consideration is how quickly the architecture can detect a site failure and redirect traffic, and what layers of your workload need protection. Your RPO and RTO needs govern this requirement. This post covers three approaches to disaster recovery at different layers of your application, each offering a different balance between time-to-recovery and operational complexity:
- Active/passive DNS-based failover with Amazon Route 53 health checks.
- Active/active architecture using physical or virtual load balancers deployed at each site.
- Hybrid database recovery using native database engine replication with Amazon Relational Database Service (Amazon RDS).
Depending on your workload, you can implement a combination of these strategies to support the various layers of compute and storage of your application.
Active/passive DNS-based failover with Amazon Route 53 health checks
If your workload consists of on-premises web servers accessible from the internet or internal network, you can use a DNS-based failover approach to reroute traffic to a healthy web server in the event of a hardware failure or site outage. Although this method supports any DNS service, the following architecture example uses Amazon Route 53.
DNS-based failover supports two primary approaches. The first is health check routing, where DNS resolves requests to the IP address of a known good service endpoint. The second is multi-value routing, where the DNS service returns multiple IP addresses. Clients attempt connection to the first address and automatically fail over to subsequent addresses if the connection times out. Route 53 health checks continuously monitor endpoint availability. When a site becomes unreachable, Route 53 automatically updates DNS responses to route traffic to the surviving site. This approach is globally available and works across both Outposts and Local Zones.
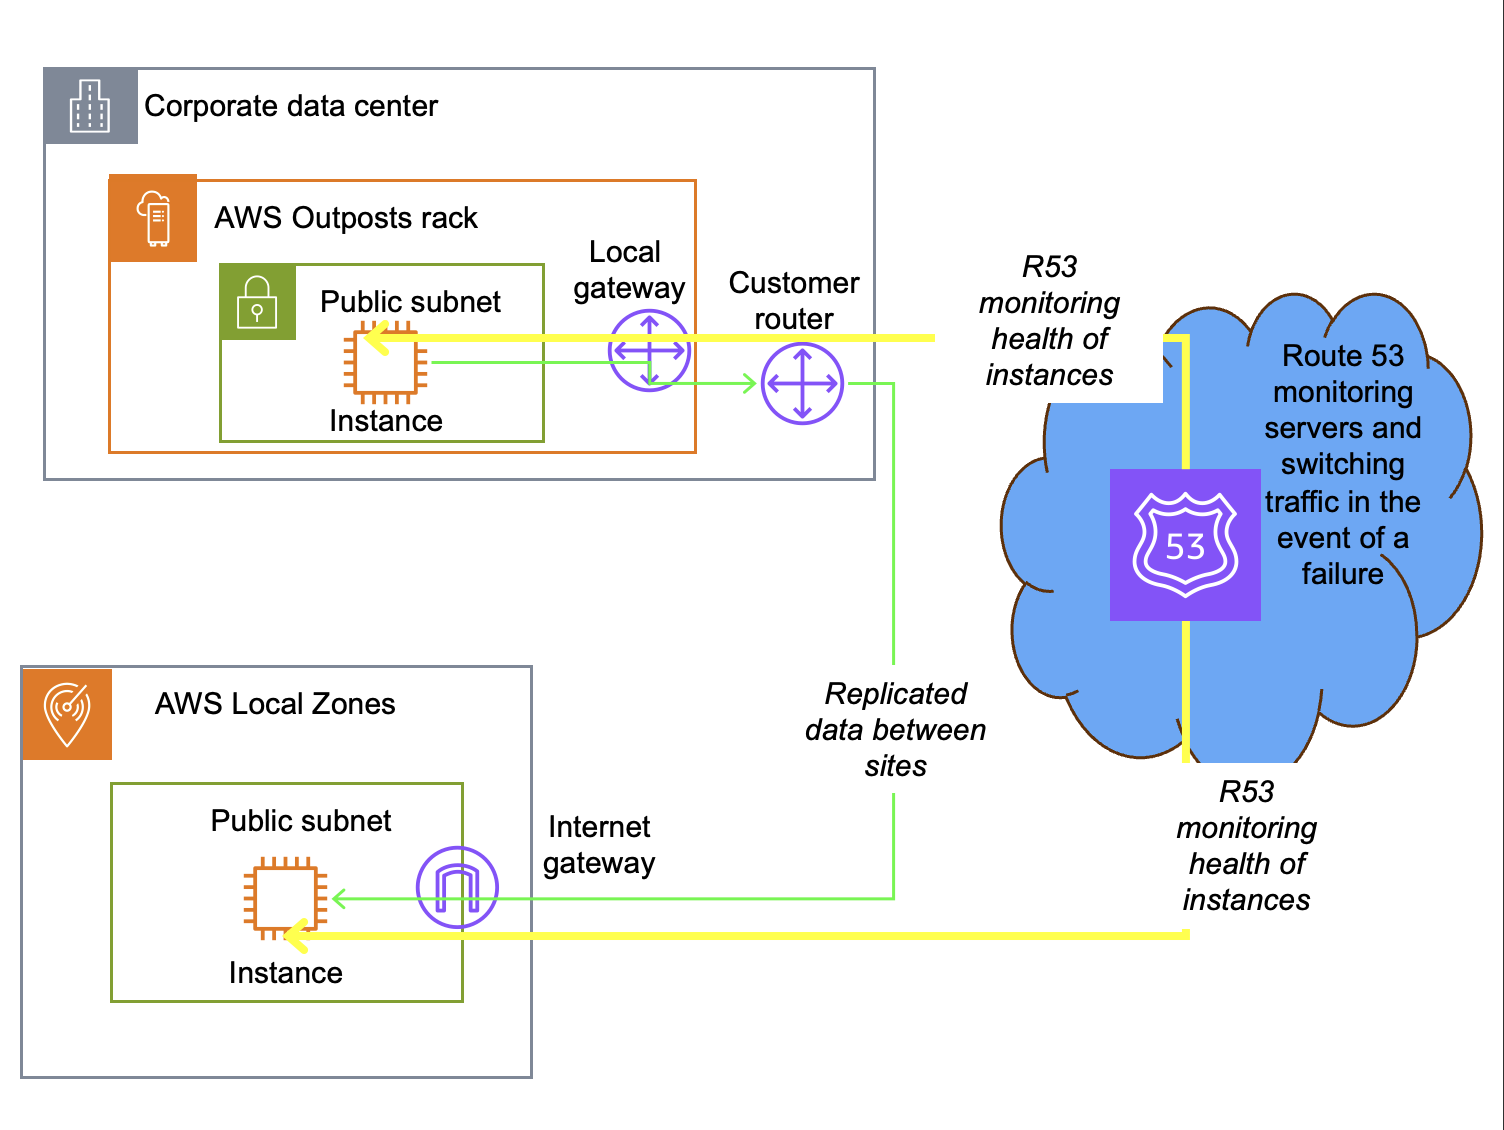
Figure 1: Active/passive DNS-based failover architecture
When a specific application server fails and Route 53 determines it is unreachable, it is dynamically removed from future DNS responses. DNS systems typically have a Time to Live (TTL) of 300 seconds or longer, during which the DNS resolution is cached locally in the client. During this window, the client uses the cached IP address. New requests are automatically directed to active servers. The total recovery time is governed by the combination of the DNS TTL and health check timeout settings, typically resulting in a recovery time of 5 minutes or the TTL setting.
This design pattern works between Outposts, between an Outpost and a third-party provider, between an Outpost and a Local Zone, or between Local Zones. Route 53 can also distribute traffic across these sites, supporting blue/green deployments where you gradually shift traffic from one environment to another.
For AWS Outposts, you can configure Route 53 to monitor an endpoint in the Region. If the Outpost service link disconnects for more than 5 minutes, DNS failover routes traffic to the secondary site. The Outpost and Local Zone can be anchored to the same or different Regions for added resiliency.
As with all architectures using the public internet for replication traffic, configure Transport Layer Security (TLS) encryption in transit, security groups, and network access control lists (NACLs) to secure your data and control access to your subnet resources.
Active/active architecture using physical or virtual load balancers
For Outposts-to-Outposts high availability when your workload must remain on-premises, an alternative to DNS-based failover is an active/active architecture using physical or virtual load balancers deployed at each site. Outposts racks support Application Load Balancer (ALB) as well as third-party L4 and L7 virtual or physical load balancers. Like the DNS-based architecture pattern, you can use this strategy to support workloads that consist of on-premises web servers with low latency, data residency, or continued operations requirements.
In this model, both Outposts can simultaneously serve application traffic, with load balancers continuously monitoring the health of instances. When a failure is detected, the load balancer automatically shifts all traffic to the available Outpost without manual intervention or DNS propagation delays. Typically, the load balancers present a single IP address to service consumers and switch traffic when an endpoint is unavailable. Some load balancers can monitor load and switch traffic based on utilization to maintain response time. This design pattern is specific to Outposts, which support third-party devices connected on premises. It does not work with Local Zones, which are hosted in AWS datacenters.
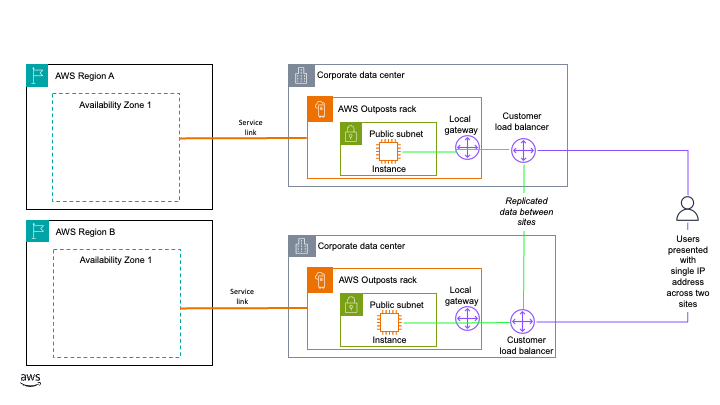
Figure 2: Active/active architecture using physical or virtual load balancers
When you deploy this architecture, make sure the load balancer tier itself does not become a single point of failure. Deploy redundant load balancer instances at each Outpost, with failover between them, so the traffic management layer stays available even if one load balancer instance fails. We also recommend that you configure session persistence and connection draining on your load balancers to minimize disruption to in-flight requests during failover. With this approach, load balancer instances route traffic to your Outpost instances over the local gateway of each Outpost. Traffic continues to be balanced between instances on each Outpost even if one of the Outposts loses its service link connection. You can anchor the Outposts to the same or different Availability Zones or Regions for added resiliency. This approach does require 2N infrastructure and an external load balancer, making it the most resource-intensive to implement.
Some load balancers also support multiple endpoint monitoring. The load balancer monitors both the regional instance and the local application. If the service link fails, based on the administrator’s policy, it can drain connections and route traffic to the other Outpost. This keeps service status and logging fully available on the connected Local Zone or Outpost.
Hybrid database recovery using native database engine replication
If you have two or more logical Outpost racks, you can deploy Amazon RDS on AWS Outposts with Multi-AZ high availability. However, depending on your workload criticality, number of sites, and site locations, a more cost-effective disaster recovery option using one Outpost, one Local Zone, or both might be appropriate. For applications that require a database, you can use your chosen database engine’s native replication features or third-party tooling to create hybrid database architectures across an Outpost and a Local Zone, an Outpost and the Region, or a Local Zone and the Region. If using the Region for failover, this can be the same Region your Outpost or Local Zone is anchored to, or a different Region of your choosing. Limitations based on your chosen database engine and licensing terms apply. In this post, all architecture patterns use a PostgreSQL database. The following three hybrid database strategies expand on the hybrid database with Amazon RDS and AWS Outposts architecture to show how this design pattern supports disaster recovery across Outposts, Local Zones, and AWS Regions.
These architectures use a bring-your-own-license (BYOL) model. The replica instance used for high availability and disaster recovery (HA/DR) is customer-managed, running on Amazon Elastic Compute Cloud (Amazon EC2) and Amazon Elastic Block Store (Amazon EBS). The primary database instance can also be customer-managed, or it can be an RDS-managed database instance so you can use a managed service as your primary operating model. Promoting a replica to primary after a failure is a manual process, but you can automate it with infrastructure as code. Promotion requires updating your DNS entry for the database instance.
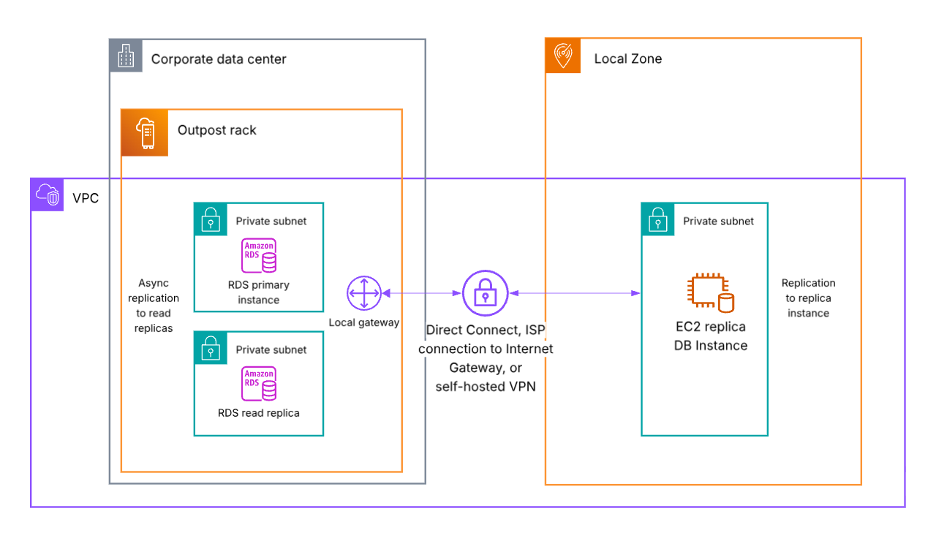
Figure 3: Database failover from an Outpost rack to a Local Zone
In the preceding diagram (Figure 3), the Outpost and the Local Zone can be in the same or different Regions for added resiliency.
In the following diagram (Figure 4), replication traffic can use either the service link or the local gateway of the Outpost as its network path. Replication continues through the local gateway even if the service link fails. If using the service link, the EC2 replica database instance must be in the Outpost anchor Region. If using the local gateway, the EC2 replica database instance can be in the same Region as or a different Region from the Outpost anchor Region for added resiliency. You need to configure a Virtual Private Gateway, Transit Gateway, or Internet Gateway in the Region to receive the replication traffic from the Outpost.
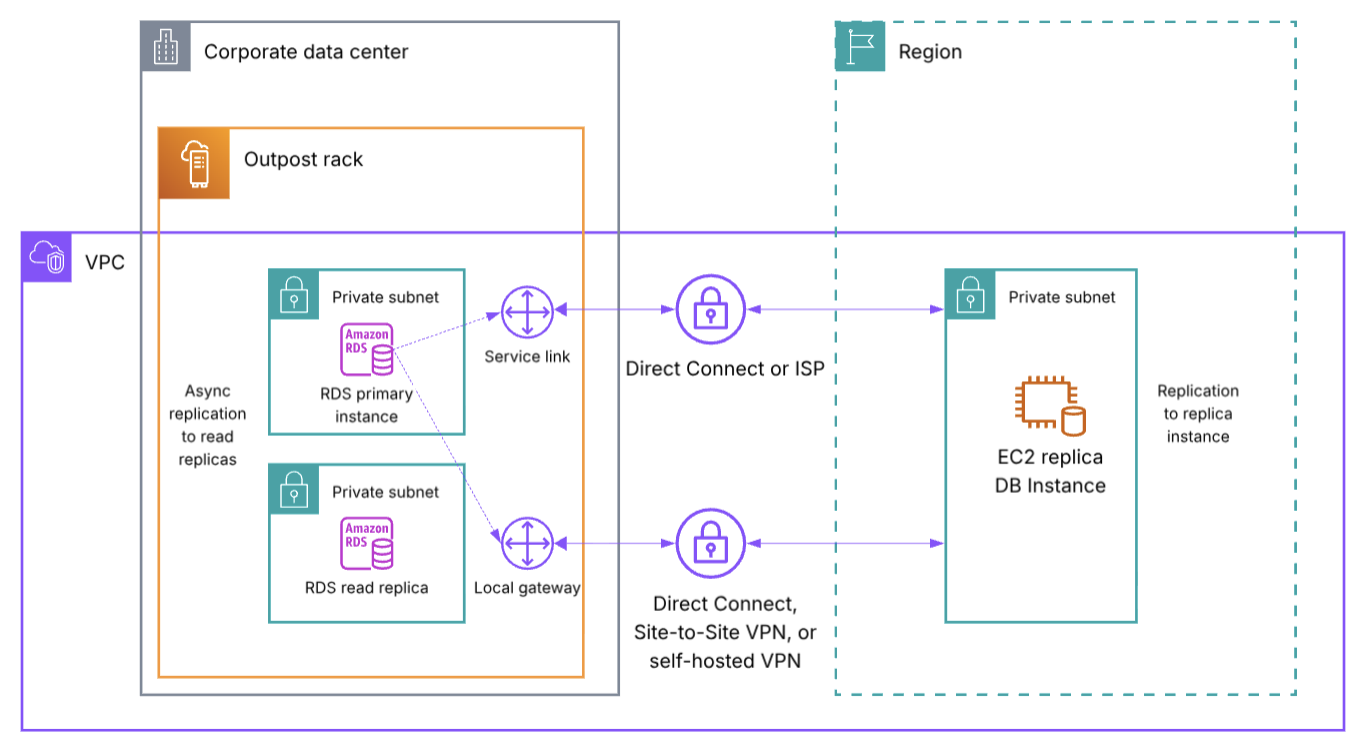
Figure 4: Database failover from an Outpost rack to an AWS Region
In the following diagram (Figure 5), both the primary database instance and the replica are self-hosted on EC2 and EBS. Check your specific Local Zone location for currently supported services to see if the primary database instance can use RDS. The Region used for the EC2 replica DB instance can be the same Region the Local Zone is a part of, or a different Region for added resiliency. If using a different Region, additional networking such as an Internet Gateway is required.
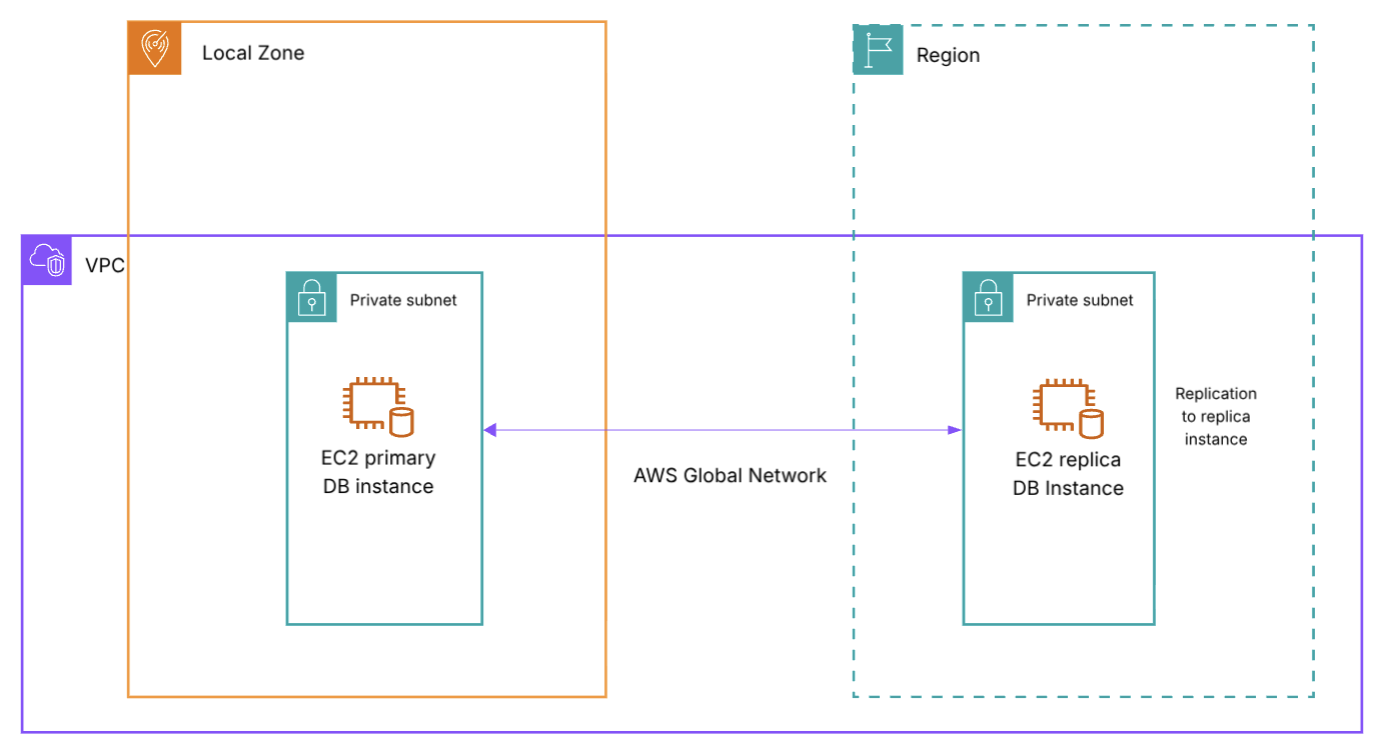
Figure 5: Database failover from a Local Zone to an AWS Region
In all three architectures, you need to update your DNS records and routing to complete failover to the secondary location. If your workload requires data residency, consider whether you can use an AWS Region as a failover destination.
Disaster recovery overview
The strategies discussed in this post support different RTO/RPO objectives. Recovery time depends on the amount of effort to redeploy or reroute to an alternate environment, and whether this process is manual or automated. Recovery point depends on whether the workload has persistent data that needs to be replicated, whether that replication happens synchronously or asynchronously, and whether you use a backup and restore approach. The following table is a high-level overview of the RTO/RPO you can expect for each approach based on these factors:
| Architecture | RTO | RPO |
| Active/passive DNS-based failover | Total failover time = DNS TTL + (health check interval x failure threshold) | Equal to replication schedule, or backup interval |
| Active/active with load balancers | Seconds, traffic is already being routed to both environments | Seconds, data is already being synchronously replicated between sites |
| Hybrid database (same anchor Region) | Minutes, time needed to reroute to replica instance | Equal to replication schedule, faster replication window expected for data traveling less distance |
| Hybrid database (different anchor Region) | <1 hour, time needed to reroute to replica instance | Equal to replication schedule, longer replication window expected for data traveling a greater distance |
Table 1: RTO/RPO disaster recovery overview for each architecture
For the active/passive DNS-based failover architecture, DNS TTL, Route 53 health check interval, and failure threshold are all settings you configure to your preferences. The default Route 53 health check interval is 30 seconds, but can be set as low as 10 seconds. The default Route 53 failure threshold is 3 failed checks, but can be set to any number between 1 to 10. Generally, active/active architectures provide the lowest RTO/RPO for your workloads, whereas active/passive architectures incur some downtime during a disaster when rerouting user traffic to your passive standby environment. Review your workload RTO/RPO objectives to determine which approach is right for you. You might require different strategies for different tiers of workload based on your threshold for downtime at each tier.
Considerations
When choosing a disaster recovery strategy, consider:
- Latency impact based on the location of your failover site and where your application users are.
- Resilient network connectivity between your primary and secondary failover locations, or between your on-premises site and the AWS Region. Architecture-specific guidance is included in each section.
- If your workload requires data residency, evaluate if a particular disaster recovery approach can be used.
- Promoting a replica (either RDS-managed or customer-managed) is a manual process that you can automate with infrastructure as code, and it requires updating your DNS entry for the database instance.
- Database replicas might support synchronous or asynchronous replication depending on the database engine. Consider your RPO objectives when evaluating the hybrid database architectures.
- Limitations based on your chosen database engine and licensing terms apply. Consult your licensing terms and conduct failover drills to test these architecture patterns with your workloads before implementing into production.
Conclusion
This post showed different architecture patterns for disaster recovery using both Outposts and Local Zones. See Building highly resilient applications with on-premises interdependencies using AWS Local Zones for additional guidance. Reach out to your AWS account team to learn more about the hybrid edge architectures discussed in this post. To discuss Outposts with an expert on any of these topics, submit the AWS Outposts contact form. To begin using Local Zones, enable a Local Zone from your account and start experimenting.
Conversations With Maggie Haberman and Jonathan Swan
Post Syndicated from The Atlantic original https://www.youtube.com/watch?v=wXJA4SmI8wg
Inside the lab where the Arm AGI CPU is brought to life
Post Syndicated from Patrick Kennedy original https://www.servethehome.com/inside-the-lab-where-the-arm-agi-cpu-is-brought-to-life/
We travel to the Arm ATE lab to see what goes into bringing up a new Arm server processor, the Arm AGI CPU. It is lab tour time!
The post Inside the lab where the Arm AGI CPU is brought to life appeared first on ServeTheHome.
Deploying regulated workloads on AWS Local Zones and AWS Outposts
Post Syndicated from Brianna Rosentrater original https://aws.amazon.com/blogs/compute/deploying-regulated-workloads-on-aws-local-zones-and-aws-outposts/
Customers in many industries and geographic locations have specific data sovereignty and residency objectives. AWS Local Zones and AWS Outposts are fully managed infrastructure solutions for customers that need to keep data within specific geographic boundaries and also want the scalability and innovation of cloud services. The challenge lies not only in where data resides, but in how to architect, secure, and audit these deployments effectively. Whether you’re architecting a new solution or migrating existing regulated workloads to AWS hybrid edge infrastructure, this post provides an overview of key technologies to help you build auditable and secure architectures that support your organization’s data residency objectives.
Solution framework
Building a solution for data residency deployments on AWS hybrid infrastructure requires a thoughtful, layered approach. Rather than a prescriptive solution, this post presents a flexible framework that you can adapt to your specific operational requirements.
The AWS Shared Responsibility Model clearly delineates where the responsibilities of AWS end and yours begin. This model provides a critical separation: AWS controls the management infrastructure, while your data remains inaccessible to AWS operators, as enforced by the hardware-based isolation of the Nitro System. There is no operator access to the instances, applications, or data. This architectural separation provides the foundation for implementing stringent data residency controls.
To build upon this foundation, you can implement security best practices by following the guidance in the AWS Well-Architected security pillar, which helps you strengthen application-level protections and data security controls. For deeper guidance, see the Data Residency with Hybrid Cloud Services Lens, which covers considerations for operations, security, cost, performance, and reliability for regulated workloads.
When implementing data residency controls, you might need auditable evidence of traffic patterns for your internal governance processes. By using third-party monitoring tools combined with port mirroring capabilities, you can generate reports that show all traffic between your applications and databases remains within your Outpost environment. This visibility provides auditable evidence that traffic remains within your designated boundaries. You can also use AWS Artifact to access audit reports for your hybrid infrastructure.
Governance tools form the final layer of this regulatory framework, establishing guardrails around your deployment. These tools continuously monitor and enforce configuration policies, verifying that your environment stays aligned with your security and governance policies, operates within required parameters, and alerts you proactively when issues arise. This shift from reactive to proactive management helps you maintain consistent governance of your environment at scale.
Together, these layered technologies create a framework for deploying regulated workloads designed to support your data residency objectives while benefiting from the innovation and scalability of AWS services.
Shared responsibility model
When extending workloads to Local Zones and Outposts, the shared responsibility model adapts to these hybrid cloud environments while maintaining the same core principles. AWS continues to manage the underlying infrastructure and services, while you retain control over your data, applications, and configurations. This supports consistent security postures whether workloads run in AWS Regions, Local Zones, or on Outposts infrastructure. You deploy Outposts in a data center or colocation facility of your choice. Under the shared responsibility model, you are responsible for meeting site requirements for power, cooling, on-premises networking, and the Outpost service link connection to the Region. All traffic between the Outpost and the parent Region traverses an encrypted set of VPN connections over the service link, protecting communications in transit without requiring additional configuration. AWS continues to be responsible for maintaining the Outposts hardware as a managed service.
This partnership approach to security means you can build auditable solutions with data residency controls without compromising on the innovation and scalability that AWS provides.
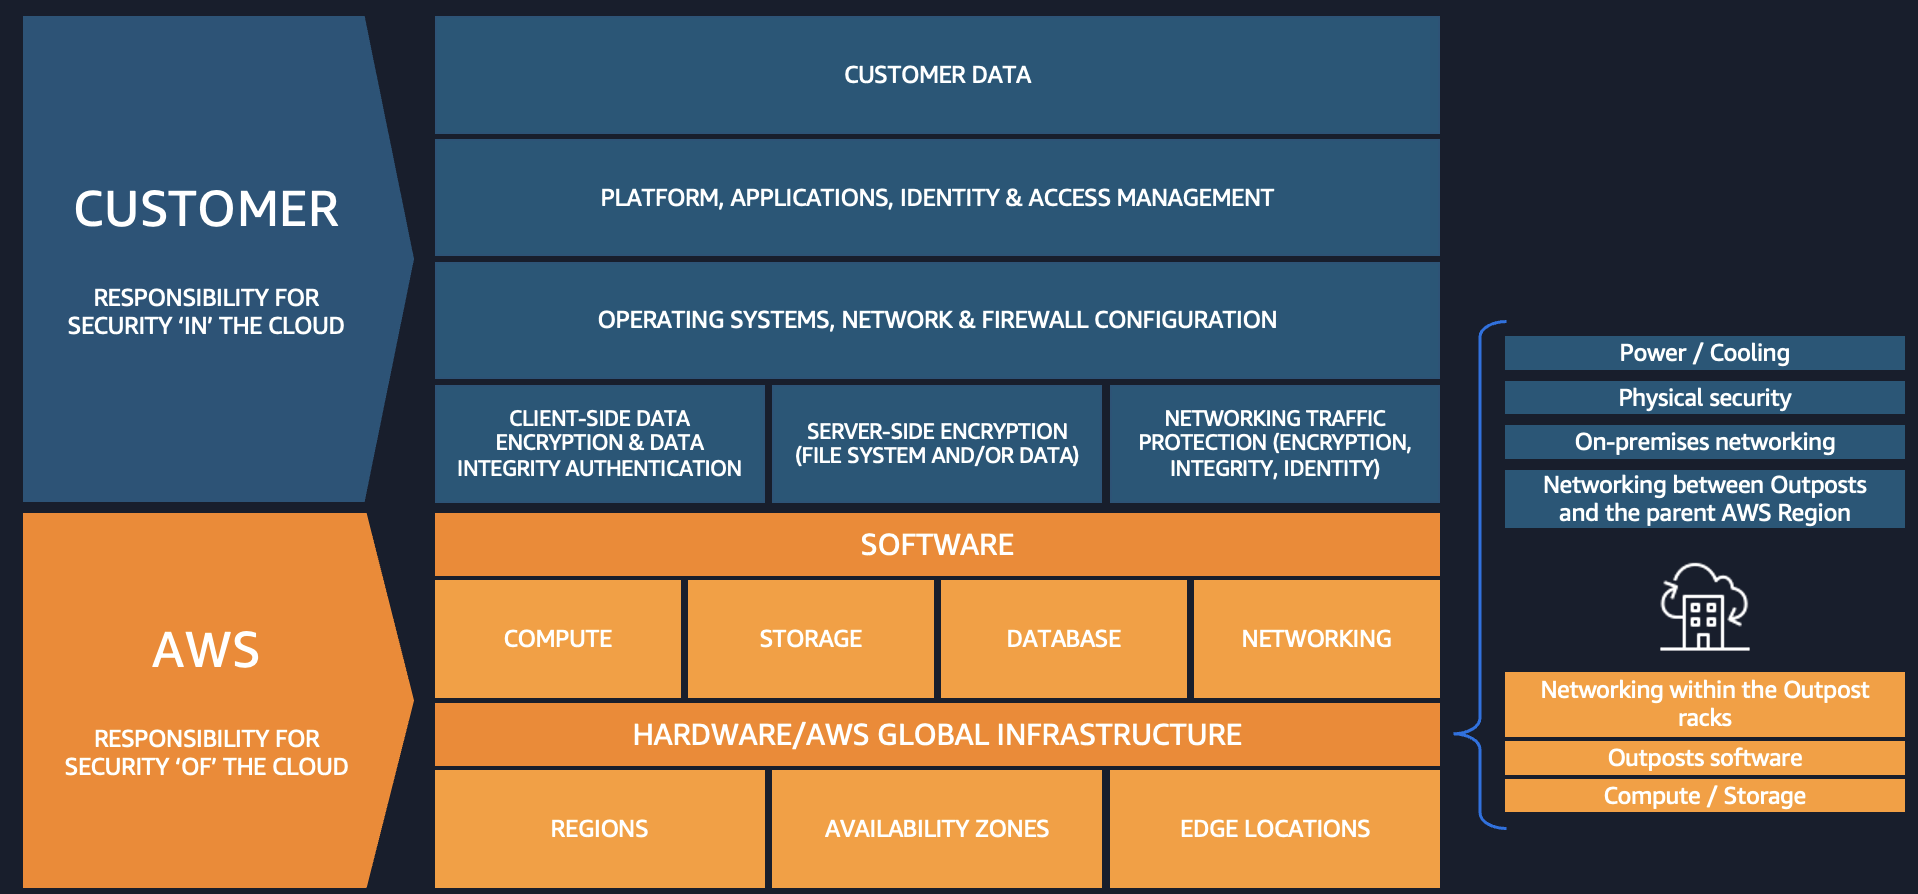
Figure 1: The AWS Shared Responsibility Model in a hybrid edge deployment
AWS Nitro System
The AWS Nitro System is the virtualization platform that powers Amazon Elastic Compute Cloud (Amazon EC2) instances. It uses dedicated hardware and software to offload virtualization functions from the server CPU and delivers near-bare-metal performance. Both Outposts and Local Zones also use the Nitro System. By design, the Nitro System has no operator access. There is no way for AWS or any entity to log into the EC2 Nitro hosts, access compute resources, or reach encrypted customer data remotely. The following diagram shows the purpose-built hardware components of the Nitro System.
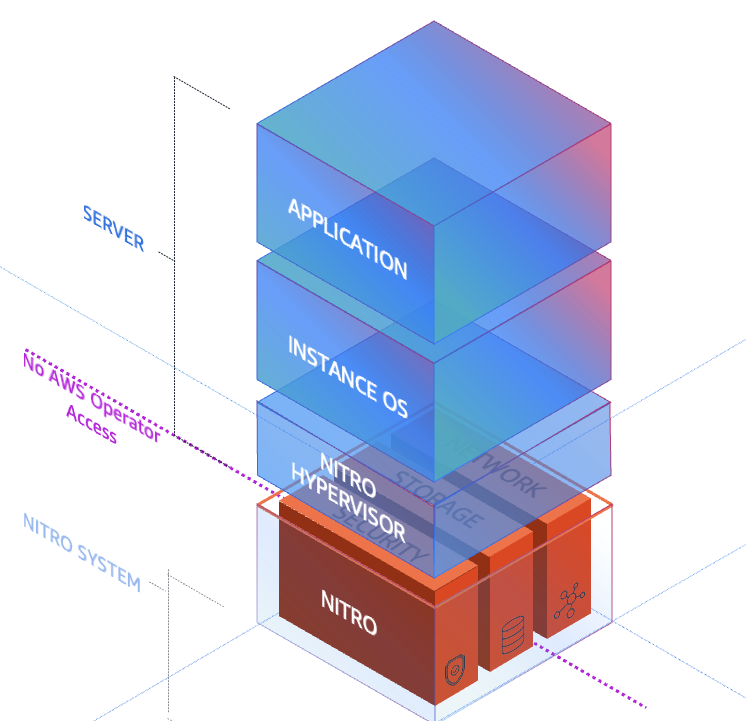
Figure 2: The AWS Nitro System hardware and software stack
The Nitro System combines purpose-built hardware consisting of the following key security components:
- The Nitro Card – provides I/O interfaces used for Amazon Virtual Private Cloud (Amazon VPC) network virtualization, Amazon Elastic Block Store (Amazon EBS), and instance storage, freeing up host CPU resources. Nitro Cards are logically isolated from the system main board that runs customer workloads and can be live-updated, reducing the need for maintenance windows and workload disruption.
- The Nitro Security Chip – provides the link between the Nitro Controller (used for orchestration) and the system main board. It intercepts and controls all firmware updates, preventing the main CPUs from being used to modify system firmware. This is particularly important when running bare metal EC2 instances. This chip is also used for boot control to validate system firmware integrity.
- The Nitro Hypervisor – designed to receive EC2 instance management commands sent by the Nitro Controller, provide compute virtualization and logical instance isolation, and assign SR-IOV virtual functions as needed. It includes no general-purpose operating system features, only the features absolutely necessary for its function, and works with other purpose-built Nitro components to maintain its small size and bare-metal-like performance. This simple design reduces the risk for remote networking attacks and driver-based privilege escalations.
- The Nitro Security Key (Outposts only) – a removable device that stores the external key required to decrypt all data at rest on your Outpost. At the end of your Outposts commitment, after migrating your data off the Outpost, you can destroy this key to cryptographically shred any remaining data on the Outpost.
These components work together to provide a layered security approach that doesn’t compromise performance. By designing each component to have a specific function decoupled from the main system board, the Nitro System provides non-disruptive firmware updates and reduces classes of security issues often found in other hypervisor systems.
AWS Organizations Service Control Policies
AWS Organizations Service Control Policies (SCPs) are a governance tool that helps you enforce data residency requirements by controlling where resources can be created and where data can be stored or processed. SCPs function as permission guardrails that define the maximum available permissions for IAM users and roles across your organization’s accounts. By implementing deny guardrails through SCPs, you can prevent resource provisioning in unwanted locations by restricting access to AWS APIs at the infrastructure level.
When deploying regulated workloads on Local Zones and Outposts, SCPs work in conjunction with AWS Control Tower landing zones to create custom guardrails that control data movement, processing, and storage. These policies can be designed with either preventative rules (blocking actions before they occur) or detective rules (identifying compliance violations after the fact). SCPs can restrict data transfer, saving, or snapshot creation outside a specified AWS location, and they can isolate workloads to a specific location. You can apply SCPs across accounts and organizational units (OUs) within your organization. For more information, see Best practices for managing data residency in AWS Local Zones using landing zone controls and Architecting for data residency with AWS Outposts rack and landing zone guardrails.
Here’s an example SCP that restricts EC2 instance launches and network interface creation to only specified AWS Local Zone subnets:
Compliance monitoring
After you implement the security and governance best practices described in the preceding sections, you can demonstrate that traffic remains within your designated boundaries by using Amazon VPC Traffic Mirroring (also called port mirroring outside of AWS). This mirrors traffic between your application servers and databases. You can use a mirror target report to show that the traffic does not transit the AWS Region. For step-by-step instructions, see Get started using Traffic Mirroring to monitor network traffic. The key configuration steps include the following:
- Configure security groups – Allow inbound UDP port 4789 only from the security group of the source instances being mirrored, or from specific private CIDR ranges within the VPC. Do not open this port to
0.0.0.0/0. - Create a traffic mirror target – Use the elastic network interface (ENI) of your monitoring instance.
- Create a traffic mirror filter – Define which traffic to capture, either all traffic or specific traffic.
- Create mirror sessions – Create one for each source instance you want to monitor. Lower session numbers are evaluated first when multiple sessions exist.
- Capture traffic – Use
tcpdumpon the target instance to analyze mirrored packets.
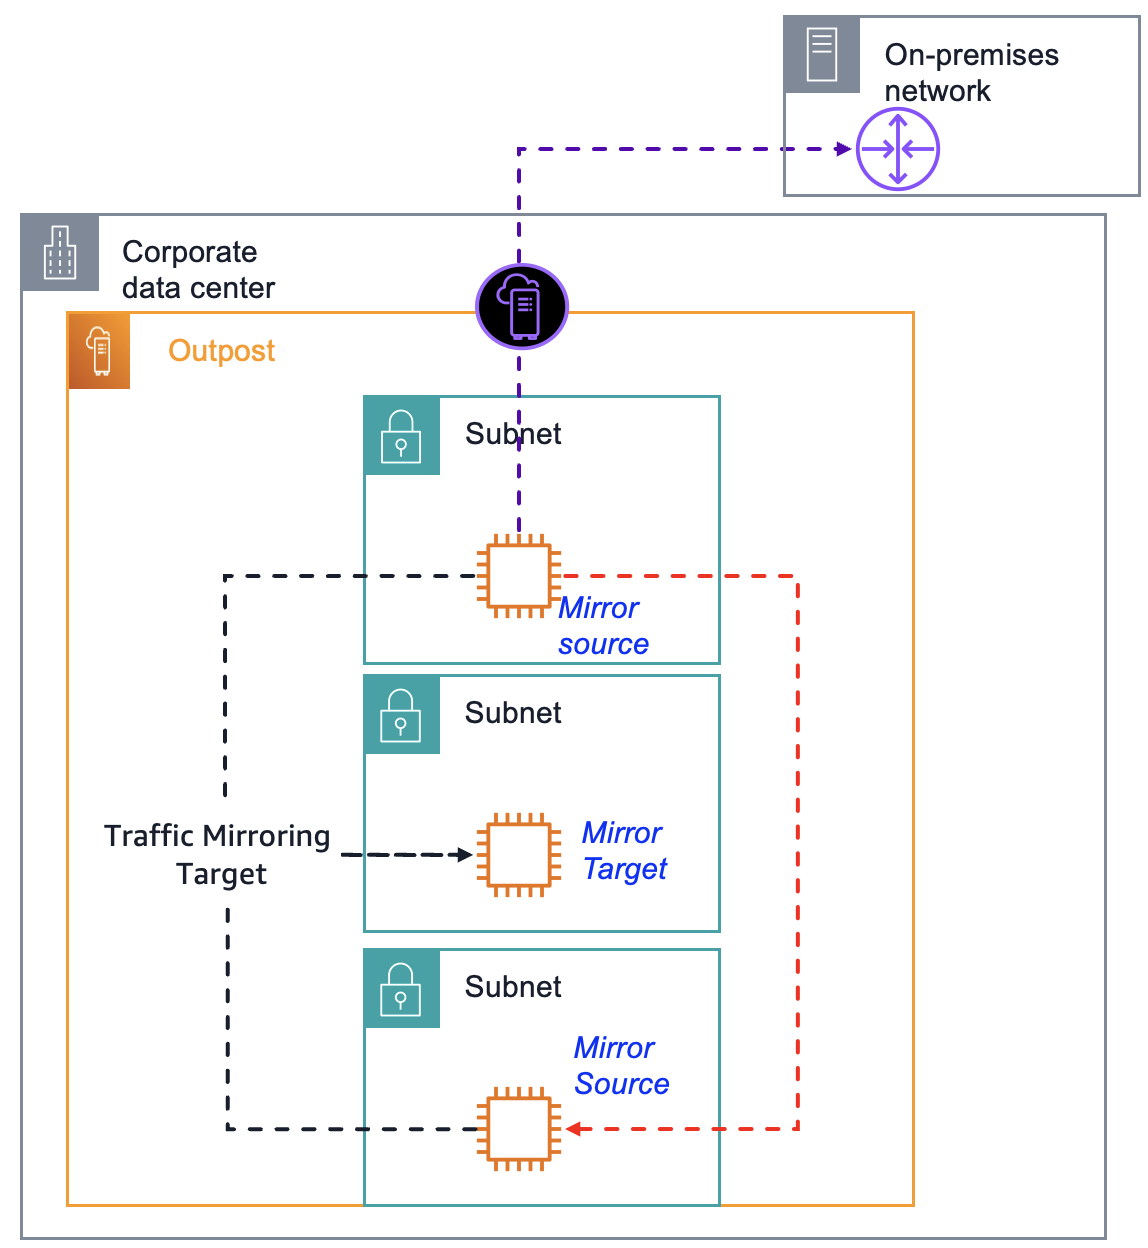
Figure 3: Amazon VPC Traffic Mirroring architecture on an Outpost
All instances must be in the same VPC, or connected through VPC peering or an AWS Transit Gateway. Traffic Mirroring encapsulates the mirrored traffic using VXLAN on UDP port 4789. Traffic Mirroring might impact network performance on source instances, so test in a development environment before deploying to production. The following image shows a sample traffic mirroring report that uses NetFlow Analyzer. For this post, all network traffic shown is simulated.
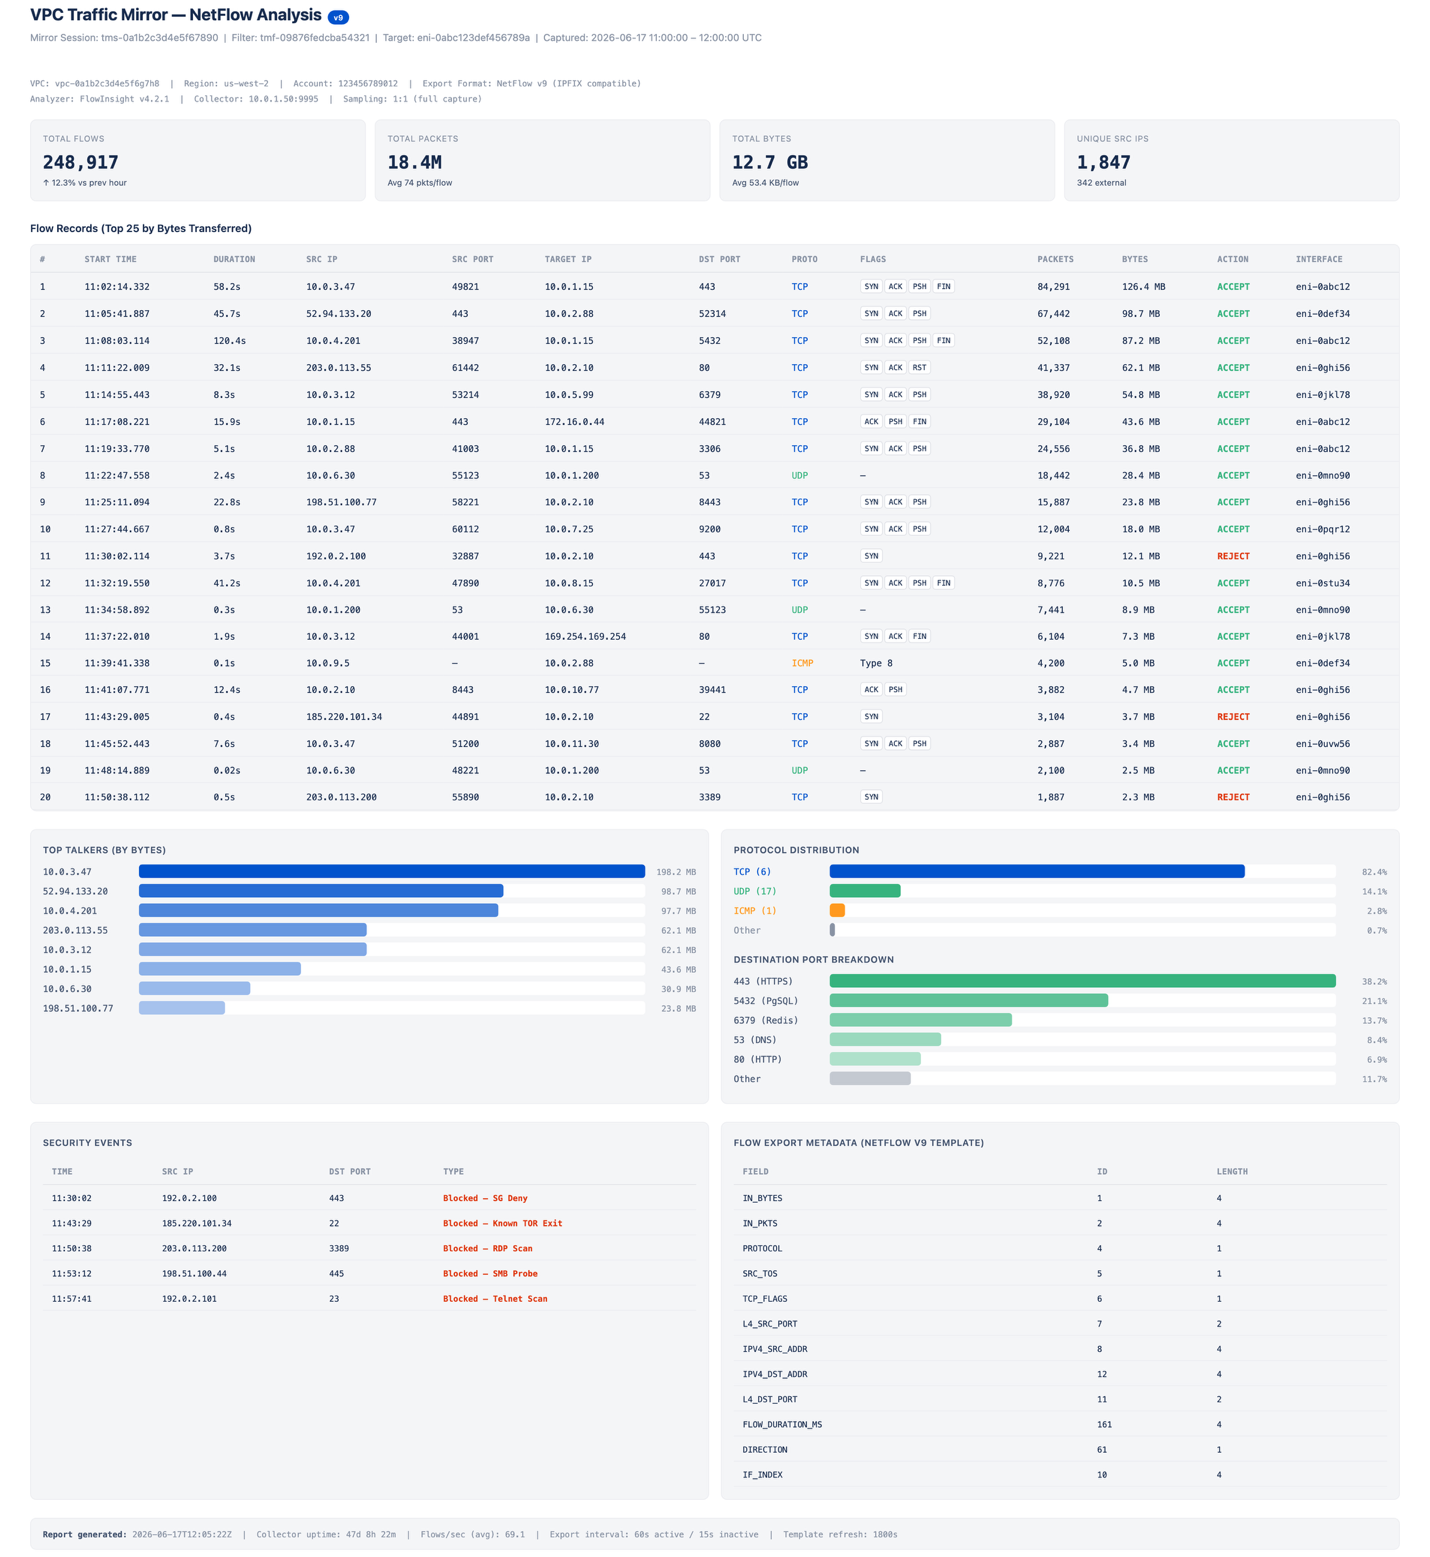
Figure 4: Sample traffic mirroring report in NetFlow Analyzer
Clean up
If you tested the VPC Traffic Mirroring architecture described in the preceding section, terminate any unnecessary resources to avoid ongoing costs. Remove the resources in the following order to avoid dependency errors:
- Delete the traffic mirror sessions – In the Amazon VPC console, navigate to Traffic Mirroring, Mirror Sessions. Select each mirror session you created and choose Actions, Delete. Repeat for all sessions associated with your source instances.
- Delete the traffic mirror filter – Navigate to Traffic Mirroring, Mirror Filters. Select the filter you created and choose Actions, Delete. You must delete all associated mirror sessions before you can delete the filter.
- Delete the traffic mirror target – Navigate to Traffic Mirroring, Mirror Targets. Select the target pointing to the ENI of your monitoring instance and choose Actions, Delete.
- Revoke security group rules – Navigate to Security Groups and select the security group attached to your monitoring instance. Remove the inbound rule that allows UDP port 4789 from the security group or CIDR range of the source instances.
- Terminate the monitoring instance (optional) – If you launched a dedicated EC2 instance solely for traffic capture and analysis, navigate to the EC2 console and terminate the instance. This also releases the associated ENI used as the mirror target.
- Delete any stored packet captures (optional) – If you saved
tcpdumpoutput to Amazon Simple Storage Service (Amazon S3) or local storage on the instance, delete those files if they are no longer needed for audit reporting.
You can verify that all Traffic Mirroring resources have been removed by running the following AWS Command Line Interface (AWS CLI) commands:
Each command should return an empty list, confirming that no mirroring resources remain active in your account.
Conclusion
In this post, we covered how the AWS Nitro System, AWS Organizations SCPs with an AWS Control Tower landing zone, and VPC Traffic Mirroring provide capabilities for governing workloads with data residency requirements. Apply the SCP example in this post to test restricting instance launches and network interface creation to specific subnets. To learn more about Outposts for hybrid deployments, review the Getting started with AWS Outposts guide and submit the AWS Outposts contact form. To get started with Local Zones, review the Getting started with AWS Local Zones guide, opt in to a Local Zone, and begin trying some of the architecture patterns described in this post.
A Conversation With Secretary Pete Buttigieg
Post Syndicated from The Atlantic original https://www.youtube.com/watch?v=M9UZ7ZGD2vE
Building my own solar test bench #solar #diy #offgrid
Post Syndicated from Crosstalk Solutions original https://www.youtube.com/shorts/tpElhU93Spk
Luba 3 vs Previous Models — Great Mowers, No Home Assistant MQTT yet?
Post Syndicated from digiblur DIY original https://www.youtube.com/watch?v=0pTuU7NFOmM
Building cloud-native PACS on AWS
Post Syndicated from ManojKumar MV original https://aws.amazon.com/blogs/architecture/building-cloud-native-pacs-on-aws/
Modernizing medical imaging infrastructure is a pressing challenge for multi-hospital networks. Cloud-native PACS (Picture Archiving and Communication System) on AWS can help address the challenge at scale. A hospital chain with multiple facilities generates millions of imaging studies annually: each CT produces 300 to 2,000 DICOM images, MRI generates 500 to 3,000 slices, and digital mammography produces 8 to 12 high-resolution images.
At this scale, a typical network accumulates 50 to 200 terabytes of new imaging data yearly, with retention mandated for 7 to 10 years. The traditional approach used on-premises PACS with SAN or NAS storage at each hospital independently. This worked when volumes were modest, but as chains grow through acquisition, the constraints of this siloed architecture become apparent.
In this post, we present a hybrid cloud architecture pattern for PACS on AWS. We describe the core components, explain how data flows from imaging devices to a centralized cloud archive, and outline storage tier options and capacity planning guidance. This post is for healthcare IT architects and solutions architects familiar with DICOM workflows.
Challenges that do not scale
- Storage cost explosion: Enterprise SAN/NAS requires hardware refresh every 3-5 years with annual maintenance contracts consuming 15-20% of hardware cost. Organizations must over-provision storage for projected peak capacity years in advance.
- Data silos: A patient scanned at Hospital A cannot have images viewed at Hospital B within the same chain.
- Radiologist reporting bottleneck: When a radiologist is unavailable, studies pile up with no mechanism to route to available readers at other facilities.
- Continuous archive growth: PACS/VNA storage must scale indefinitely with no capacity ceiling and no upfront provisioning of unused capacity.
How traditional PACS works today
The workflow begins when a clinician orders an imaging study. The Radiology Information System (RIS) fills the order and populates the modality worklist. The technologist selects a patient entry from the modality worklist and acquires a study. The scanner transmits DICOM objects to the PACS server through C-STORE on the hospital LAN (TCP port). A DICOM object contains image metadata and pixel data.
The PACS server ingests DICOM images and HL7 orders. It archives images on local SAN/NAS, indexes metadata, and notifies the radiologist worklist. The radiologist reviews images with patient history and creates a report. The report flows back to the EMR through HL7 messaging.
The following diagram shows the traditional on-premises PACS workflow and its limitations.
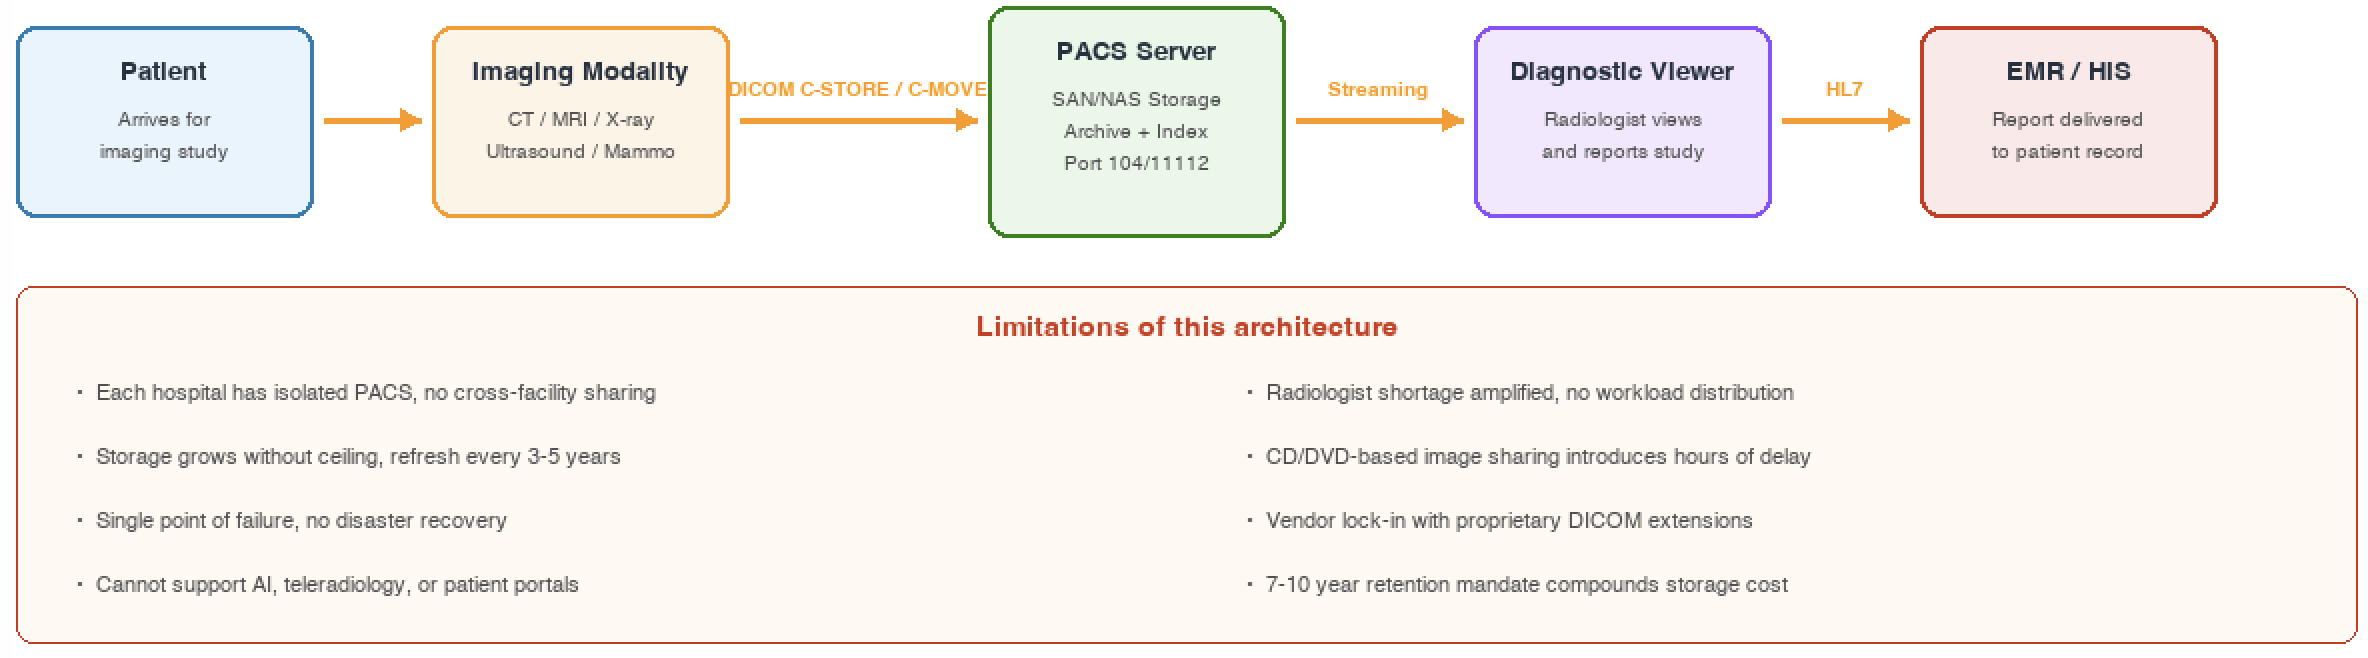
Figure 1: Traditional on-premises PACS workflow
DICOM protocol: The language of medical imaging
DICOM (Digital Imaging and Communications in Medicine) is a widely adopted standard for storing, transmitting, and viewing medical imaging files. DICOM specifies a binary file format encapsulating pixel data and metadata and defines network services including DIMSE (DICOM Message Service Element) services: C-STORE (send), C-FIND (query), C-MOVE (retrieve), and C-ECHO (verify connectivity).
DICOM DIMSE services are designed for LAN. They facilitate interoperability and image exchange on the hospital campus.
DICOMweb is a set of RESTful services that web developers use to access DICOM-enabled systems with industry-standard toolsets.
Key components of a PACS architecture
Every PACS, regardless of vendor or deployment model, consists of six core building blocks. Cloud migration does not replace these components. Instead, it re-hosts and enhances them with cloud-native capabilities. The following diagram and table describe each component and its role in architecture.
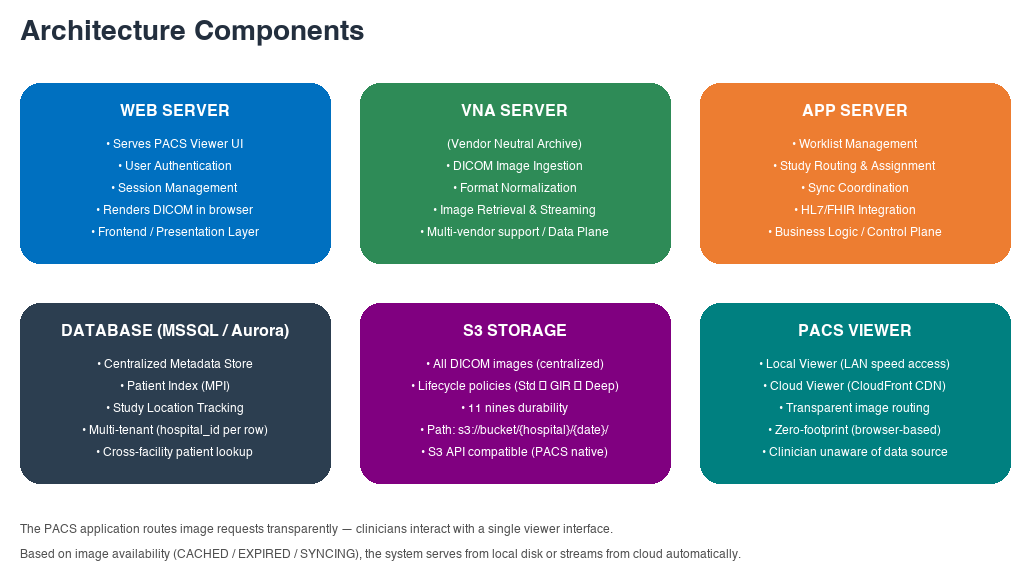
Figure 2: Six core components of a PACS architecture
Component breakdown
The following table summarizes each component, its role, and how it operates within the architecture.
| Component | Role | How it works |
| Web Server | Serves PACS viewer UI, authentication, session management | Renders DICOM in browser with windowing, leveling, and measurement tools. Zero-footprint, no client install required. |
| VNA Server | DICOM ingestion, format normalization, image streaming | Receives C-STORE from modalities on LAN. Normalizes multi-vendor encoding. Compresses and stores objects. |
| Application server | Worklist management, study routing, sync coordination | Routes studies by urgency and subspecialty. Integrates with HIS/EMR through HL7 v2 or FHIR REST APIs. |
| Database | Patient MPI, study location tracking, sync state | Stores everything except pixels: demographics, modality, storage location. Supports cross-facility patient lookup. |
| Object Storage | All DICOM images centralized, lifecycle-managed | Replaces SAN/NAS with scalable pay-per-use storage. Lifecycle policies auto-tier by age and access. |
| PACS Viewer | Local + Cloud dual viewer with transparent routing | Routes requests to local or cloud viewer based on image availability. Clinicians remain unaware of data source. |
How the components interconnect
An imaging device completes acquisition and sends DICOM objects to the VNA through C-STORE over the hospital LAN. The VNA normalizes encoding, applies compression, and writes standardized image bytes to storage.
The Application server updates the metadata database with the complete study record. It then evaluates routing rules to assign the study to the appropriate radiologist worklist based on urgency and subspecialty.
When a clinician opens a study, the PACS Viewer checks image location in the metadata database. Locally cached studies serve at LAN speed. Expired cache studies stream from the cloud viewer through a content delivery network. The clinician interacts with a single interface and remains unaware of the backend source.
Cloud-native PACS architecture on AWS
This architecture pattern applies to hospital networks that run a single PACS vendor consistently across all facilities. A common infrastructure across every site and the cloud is what allows the centralized system to discover and retrieve studies from any hospital in the network. The recommended architecture follows a hub-and-spoke model. Local PACS instances at each hospital (spokes) connect to a centralized cloud archive (hub) through AWS Direct Connect or AWS Site-to-Site VPN. This approach preserves quick image retrieval for daily clinical workflow while providing cross-facility interoperability, disaster recovery, and intelligent storage tiering.
The following diagram shows the centralized PACS architecture on AWS with hub-and-spoke connectivity.
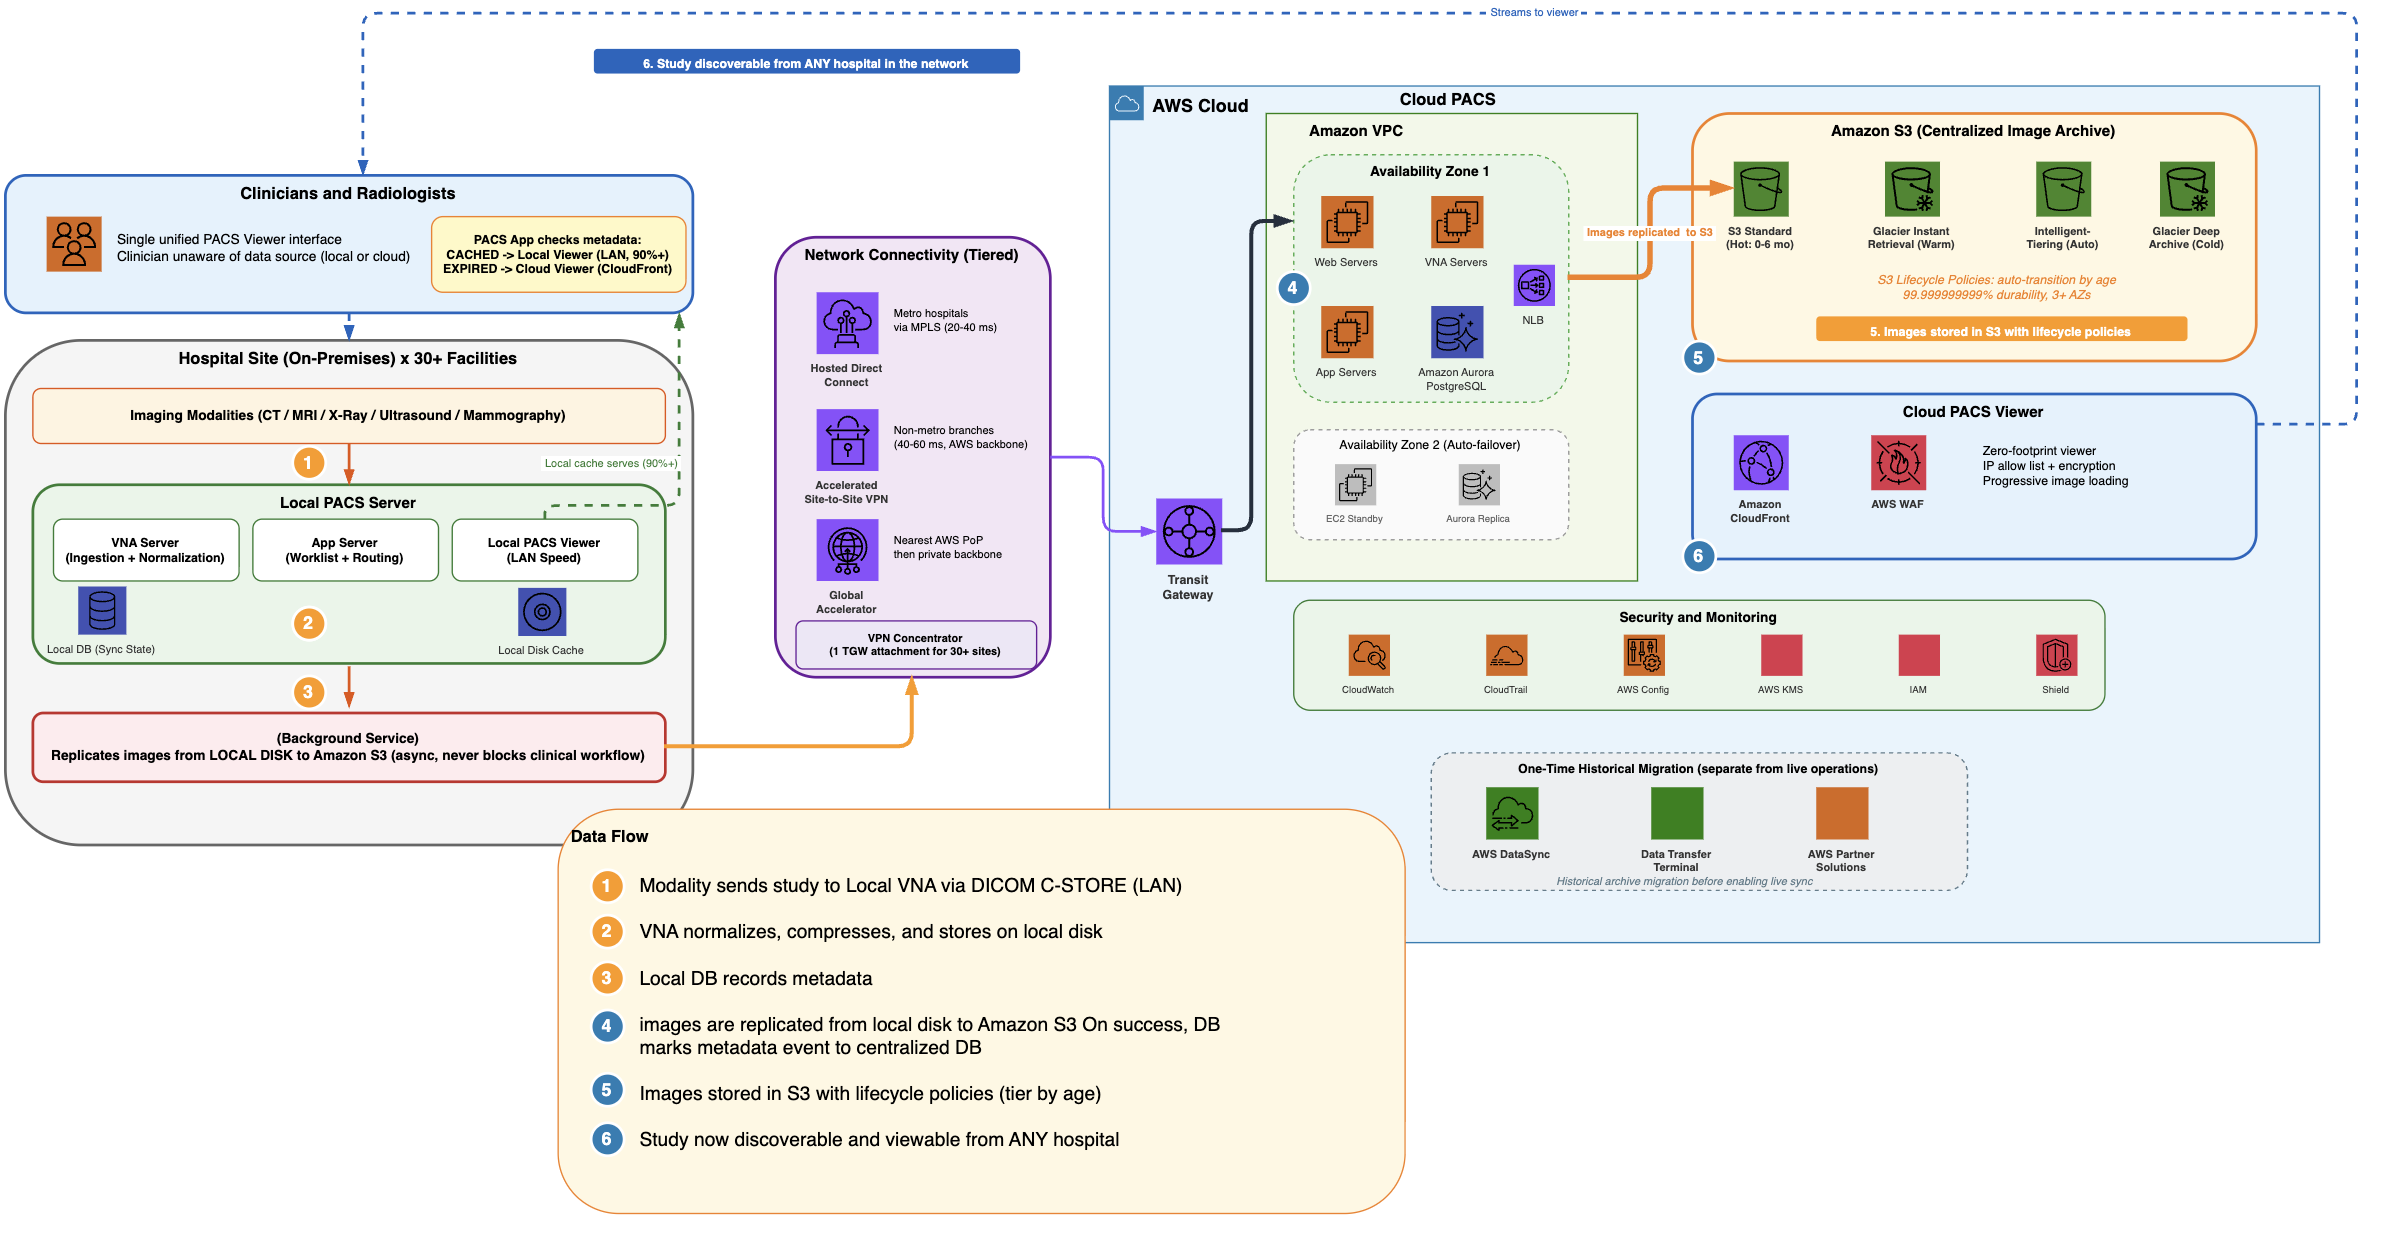
Figure 3: Centralized PACS architecture on AWS
Architecture flow
Each hospital retains a local PACS with Web Server, VNA, Application server, and local database. Imaging modalities send DICOM objects to the local VNA over the hospital LAN. Studies are immediately available for radiologist reading at LAN speed.
A single PACS vendor is deployed consistently across all hospital sites and in the cloud. Because every site and the centralized cloud archive run the same system sharing a common metadata database, the cloud-based system can discover and retrieve studies created at any facility in the network. A radiologist at one hospital can query and open a study acquired at any other hospital, giving the enterprise a unified patient imaging record.
In the background, the images generated from new studies are replicated to Amazon Simple Storage Service (Amazon S3) through Direct Connect or Site-to-Site VPN. Clinical workflow is never blocked because sync happens asynchronously.
On the cloud side, the centralized PACS runs across two Availability Zones in AWS Region. Web Servers, VNA Servers, and App Servers on Amazon Elastic Compute Cloud (Amazon EC2) sit behind Network Load Balancers with automatic failover. Amazon Aurora PostgreSQL serves as the centralized metadata store with synchronous replication.
Amazon S3 stores DICOM images with lifecycle policies that automatically tier data by access patterns. Amazon CloudFront and AWS WAF deliver the cloud PACS viewer for teleradiology access with IP allow list and encryption.
Transparent viewer experience
When a clinician requests a study, the PACS application checks the metadata database for image location. If the local system has cached the study (the majority of daily requests), it serves the images from local disk at LAN speed.
If the local cache has expired, the cloud viewer streams from Amazon S3 through Amazon CloudFront with progressive loading.
High availability and disaster recovery
The cloud deployment spans two Availability Zones with automatic failover. Amazon S3 replicates objects across multiple Availability Zones. On the local side, the cache serves recent studies if cloud connectivity drops.
If a local server fails, requests route to the cloud where all recent data is already synced. If cloud connectivity drops, the local cache continues serving recent studies without interruption. If a single AZ fails, automatic failover routes traffic to the surviving AZ within seconds.
Data protection and security controls
Medical imaging data contains sensitive patient information including patient names, dates of birth, and clinical findings in DICOM metadata. Under the AWS shared responsibility model, AWS secures the cloud infrastructure, while the customer configures services, manages access, and implements audit controls.
The architecture uses AWS services including Amazon S3 (encrypted image storage), Amazon Aurora (encrypted metadata), Amazon EC2 (encrypted compute), Direct Connect (private connectivity), Amazon CloudFront (encrypted viewer delivery), and AWS Key Management Service (AWS KMS) (key management with rotation).
The architecture includes security controls that healthcare organizations can use as part of their security programs: encryption at rest and in transit across every layer, comprehensive audit logging with AWS CloudTrail and Amazon S3 access logs, least-privilege access through IAM with role-based controls, and continuous monitoring with AWS Config.
For data residency, deploying in a regional AWS location keeps sensitive patient data within national borders. S3 bucket policies can enforce region-level restrictions for organizations with specific data sovereignty requirements.
Storage tier planning
Running PACS on AWS provides the ability to use Amazon S3 storage tiers that align cost with access patterns. Traditional on-premises SAN/NAS stores data on a single expensive tier regardless of access frequency. Amazon S3 provides intelligent lifecycle management that reduces storage costs while improving durability.
Understanding access patterns is key
Traditional on-premises storage uses a single tier for data regardless of access frequency. Amazon S3 provides multiple tiers that align cost with how often data is accessed.
Medical imaging data follows a predictable decline in access frequency: frequent in the first months (reporting, follow-ups), dropping sharply after 6 to 12 months, and rarely accessed after 2-3 years. Mapping this pattern to storage tiers is a high-impact cost optimization decision.
This predictable decline in access frequency makes PACS an ideal workload for tiered storage. The key questions to answer are: how long do radiologists typically reference prior studies? What is your average follow-up window? What percentage of archived studies are ever retrieved after 12 months? These answers drive the lifecycle policy configuration.
S3 Standard: Hot storage for active studies
Studies in their first 6 months to 1 year are actively accessed. Radiologists reference them for follow-up comparisons. Clinicians review them during patient visits. Reporting workflows are still active.
These studies sit on S3 Standard, which provides millisecond access with high throughput. This is equivalent to the performance clinicians expect from traditional local SAN, but without the upfront costs, hardware refresh cycles, or capacity planning overhead.
S3 Glacier Instant Retrieval: For warm data
S3 Glacier Instant Retrieval (GIR) provides millisecond retrieval (the same access speed as S3 Standard) at significantly lower storage cost with nominal retrieval fees. For PACS workloads, this combination of low storage cost with millisecond retrieval is particularly well suited.
When you occasionally access studies older than 6 to 12 months for comparative reads, these make ideal candidates for GIR.
This combination of instant retrieval with archive-tier pricing makes GIR well suited for medical imaging, where occasional access to historical studies is clinically important but infrequent enough to benefit from reduced storage rates.
S3 Intelligent-Tiering: When access patterns are unpredictable
For datasets with unpredictable access patterns (research hospitals, teaching institutions), S3 Intelligent-Tiering automatically moves objects between tiers based on actual usage with no retrieval fees or operational overhead.
S3 Glacier Deep Archive: Long-term retention
Studies older than 5 years that require long-term retention move to S3 Glacier Deep Archive. Retrieval takes 12 to 48 hours, acceptable for infrequent retrieval needs. Storage cost is minimal.
Why this matters for PACS
Amazon S3 replicates objects across multiple Availability Zones within a region. With Cross-Region Replication (CRR), the same archive provides built-in disaster recovery across geographically separated regions. Most modern PACS solutions support S3-compatible APIs natively, requiring no custom middleware.
Amazon S3 stores every object redundantly across multiple physically separated Availability Zones within a region. With Cross-Region Replication (CRR), organizations can maintain a full disaster recovery copy in a secondary region with no additional infrastructure to manage.
The majority of modern PACS solutions natively support writing and reading data through S3-compatible APIs. This eliminates the need for complex storage integration configurations or proprietary connectors.
Cloud-only vs. hybrid: Making the decision
The choice between a fully cloud-based PACS and a hybrid (local + cloud) deployment is not driven by imaging volume. High-volume sites operate successfully in both models. The right answer depends on two factors specific to each facility.
Cloud-only PACS is a strong fit when:
- Redundant, reliable connectivity is available. The facility’s region has well-established, high-bandwidth links to the cloud from at least two independent network carriers, ensuring no single point of failure for clinical workflows.
- The PACS vendor offers a cloud-optimized solution. The solution delivers equal or faster performance when deployed in the cloud compared to on-premises. This is achievable today: vendors running entirely on AWS have publicly demonstrated faster image retrieval than traditional on-premises deployments, even at enterprise scale.
This model eliminates local infrastructure, removes hardware refresh cycles, and centralizes operations across all sites.
Hybrid PACS (local + cloud) is a strong fit when:
- Connectivity is limited or single carrier. Regions where redundant high-bandwidth links are not yet available, or where network reliability does not meet clinical uptime requirements.
- The PACS solution performs best with local caching. Some vendor architectures are optimized for local-first access, with a site cache providing sub-second retrieval for active studies while background sync handles cloud replication asynchronously.
This model ensures uninterrupted clinical performance regardless of WAN conditions and provides a natural migration path toward cloud-only as connectivity and vendor solutions mature.
Both architectures use AWS as the durable, long-term archive. The difference is where the active working set lives day-to-day.
Conclusion
The hybrid cloud architecture described in this document is designed to help address the core on-premises PACS challenges: storage cost explosion, data silos across facilities, radiologist routing bottlenecks, and unbounded archive growth.
Next step: Conduct a device inventory and access pattern analysis to turn this conversation into a numbers-driven plan.
About the authors
How DHI Group accelerates generative AI workloads from idea to production using hackathons
Post Syndicated from Umesh Kalaspurkar original https://aws.amazon.com/blogs/architecture/how-dhi-group-accelerates-generative-ai-workloads-from-idea-to-production-using-hackathons/
With the advent of generative AI, organizations across industries face a common challenge: how do you move from the experimentation and ideation phase to production-ready workloads quickly and confidently? Many teams get stuck in a cycle of proofs of concept that never ship. DHI Group, a leader in talent acquisition services, was evaluating options to accelerate its generative AI adoption in an effort to roll out features at an accelerated pace. The traditional software development lifecycle (SDLC) approach involved months of requirements gathering, architecture reviews, and phased development that wouldn’t deliver the speed DHI needed. They needed a mechanism that would simultaneously validate technical feasibility, build organizational AI literacy, and produce shippable code.
In this post, explore how AWS partnered with DHI Group using a structured Hackathon Acceleration Package (HAP) to quickly generate production-grade artifacts, accelerate organizational AI confidence, and create a repeatable framework for innovation.
Hackathon Acceleration Package
In this section, review how DHI and AWS collaborated to plan and host hackathons to achieve the key business outcomes defined by DHI leadership. The entire process can be split into four phases:
Phase 1: Preparation
In the initial phase, the AWS team and DHI leadership collaborated to define the key outcomes the participants would work toward. The hackathon themes included:
- Interpreting Job Descriptions Better: Enhancing the system’s parsing and presentation of job requirements.
- Premium Candidate Experience: Defining what “Premium” means from the candidate’s perspective.
- Onboarding That Sticks: Guiding new users through uncertainty to realize value sooner.
- Candidate Engagement & Stickiness: Sustaining candidate engagement and return visits.
- AgileATS Network: Streamlining the ClearanceJobs–AgileATS integration.
- Streamlining Recruiter Experience: Reducing friction across the recruiter workflow.
Phase 2: Enablement
To support these outcomes, the AWS team curated and delivered training sessions and hands-on workshops covering generative AI concepts across Amazon Bedrock AgentCore and the AI-driven development lifecycle (AI-DLC). DHI has embraced Kiro as its productivity tool of choice, so AWS tailored the workshops around Kiro, giving participants prescriptive guidance on applying it across the full software development lifecycle.
Phase 3: Hackathon
The three-day hackathon was hosted by DHI at their headquarters in Des Moines, Iowa, and was attended by 20 DHI participants split across 3 teams. The key objective was to build a prototype that could then be accelerated to production. An AWS team of Solutions Architects (SAs) was present on-site to provide technical guidance to the participants. On the final day, a panel of judges comprising senior DHI leadership evaluated the teams to identify the winner. The three use cases the teams worked on:
- Real-time Employer Analytics Dashboard: Addressing the Streamlining Recruiter Experience theme, this team built a real-time Employer Analytics Dashboard powered by Amazon Bedrock AgentCore and the Strands framework. The solution automates Quarterly Business Review (QBR) reporting for ClearanceJobs’ employer customers, replacing a manual process that currently demands 3+ QBRs per week across 250 customers.
- Intelligent Candidate Matching: Addressing the Interpreting Job Descriptions Better and Premium Candidate Experience themes, this team built an intelligent candidate matching system with a real-time analytics dashboard. The solution combines Amazon OpenSearch Service for semantic search, Amazon Bedrock for matching intelligence, and Kiro for rapid frontend development.
- ClearanceJobs MCP Server + AgileATS: Addressing the AgileATS Network and Streamlining Recruiter Experience themes, this team built a unified talent marketplace that connects ClearanceJobs and AgileATS through an agentic AI layer. By creating a single intelligent interface spanning both systems, the solution significantly boosts recruiter efficiency.
Phase 4: Path to production
DHI leadership was committed to advancing all three hackathon use cases to production, a strong signal of the value each prototype demonstrated. Building on the hackathon’s momentum, DHI and AWS aligned on a roadmap to harden each solution, address scalability and security requirements, and integrate them into DHI’s existing system.
In the next section, we focus on the winning hackathon use case, ClearanceJobs MCP Server + AgileATS, and dive deeper into the architecture.
ClearanceJobs MCP Server + AgileATS
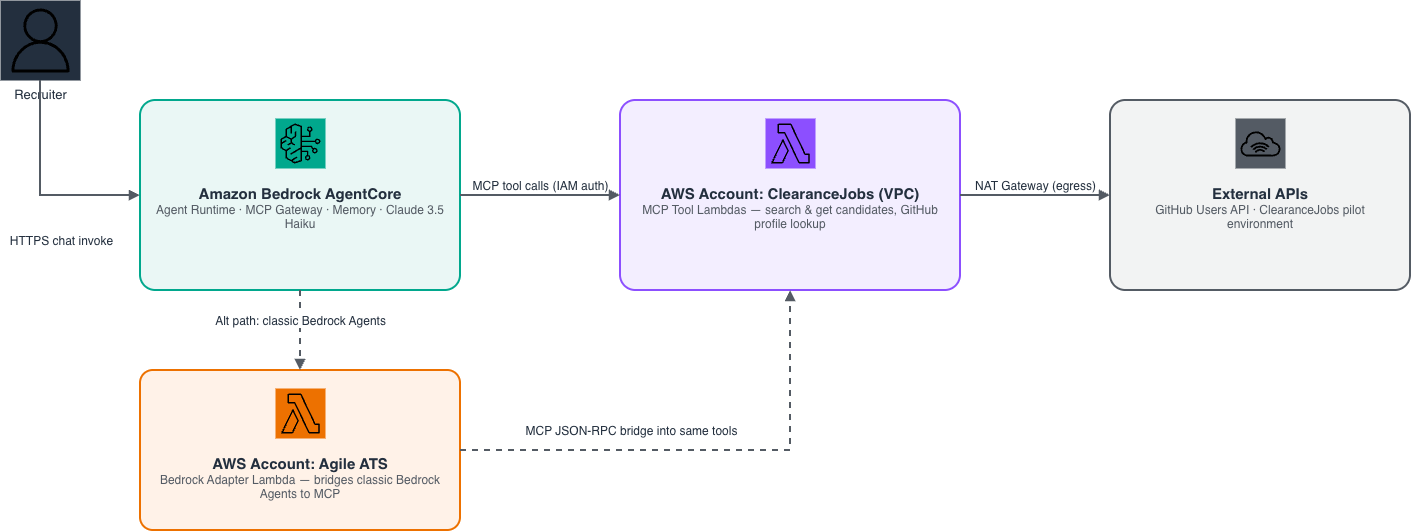
Figure 1: High-level overview of the unified ClearanceJobs and AgileATS solution
The winning team’s solution represents a modern agentic AI architecture pattern that’s broadly applicable to organizations looking to unify disparate systems through intelligent automation. The architecture uses the Model Context Protocol (MCP) to expose system capabilities as tools that an AI agent can orchestrate.
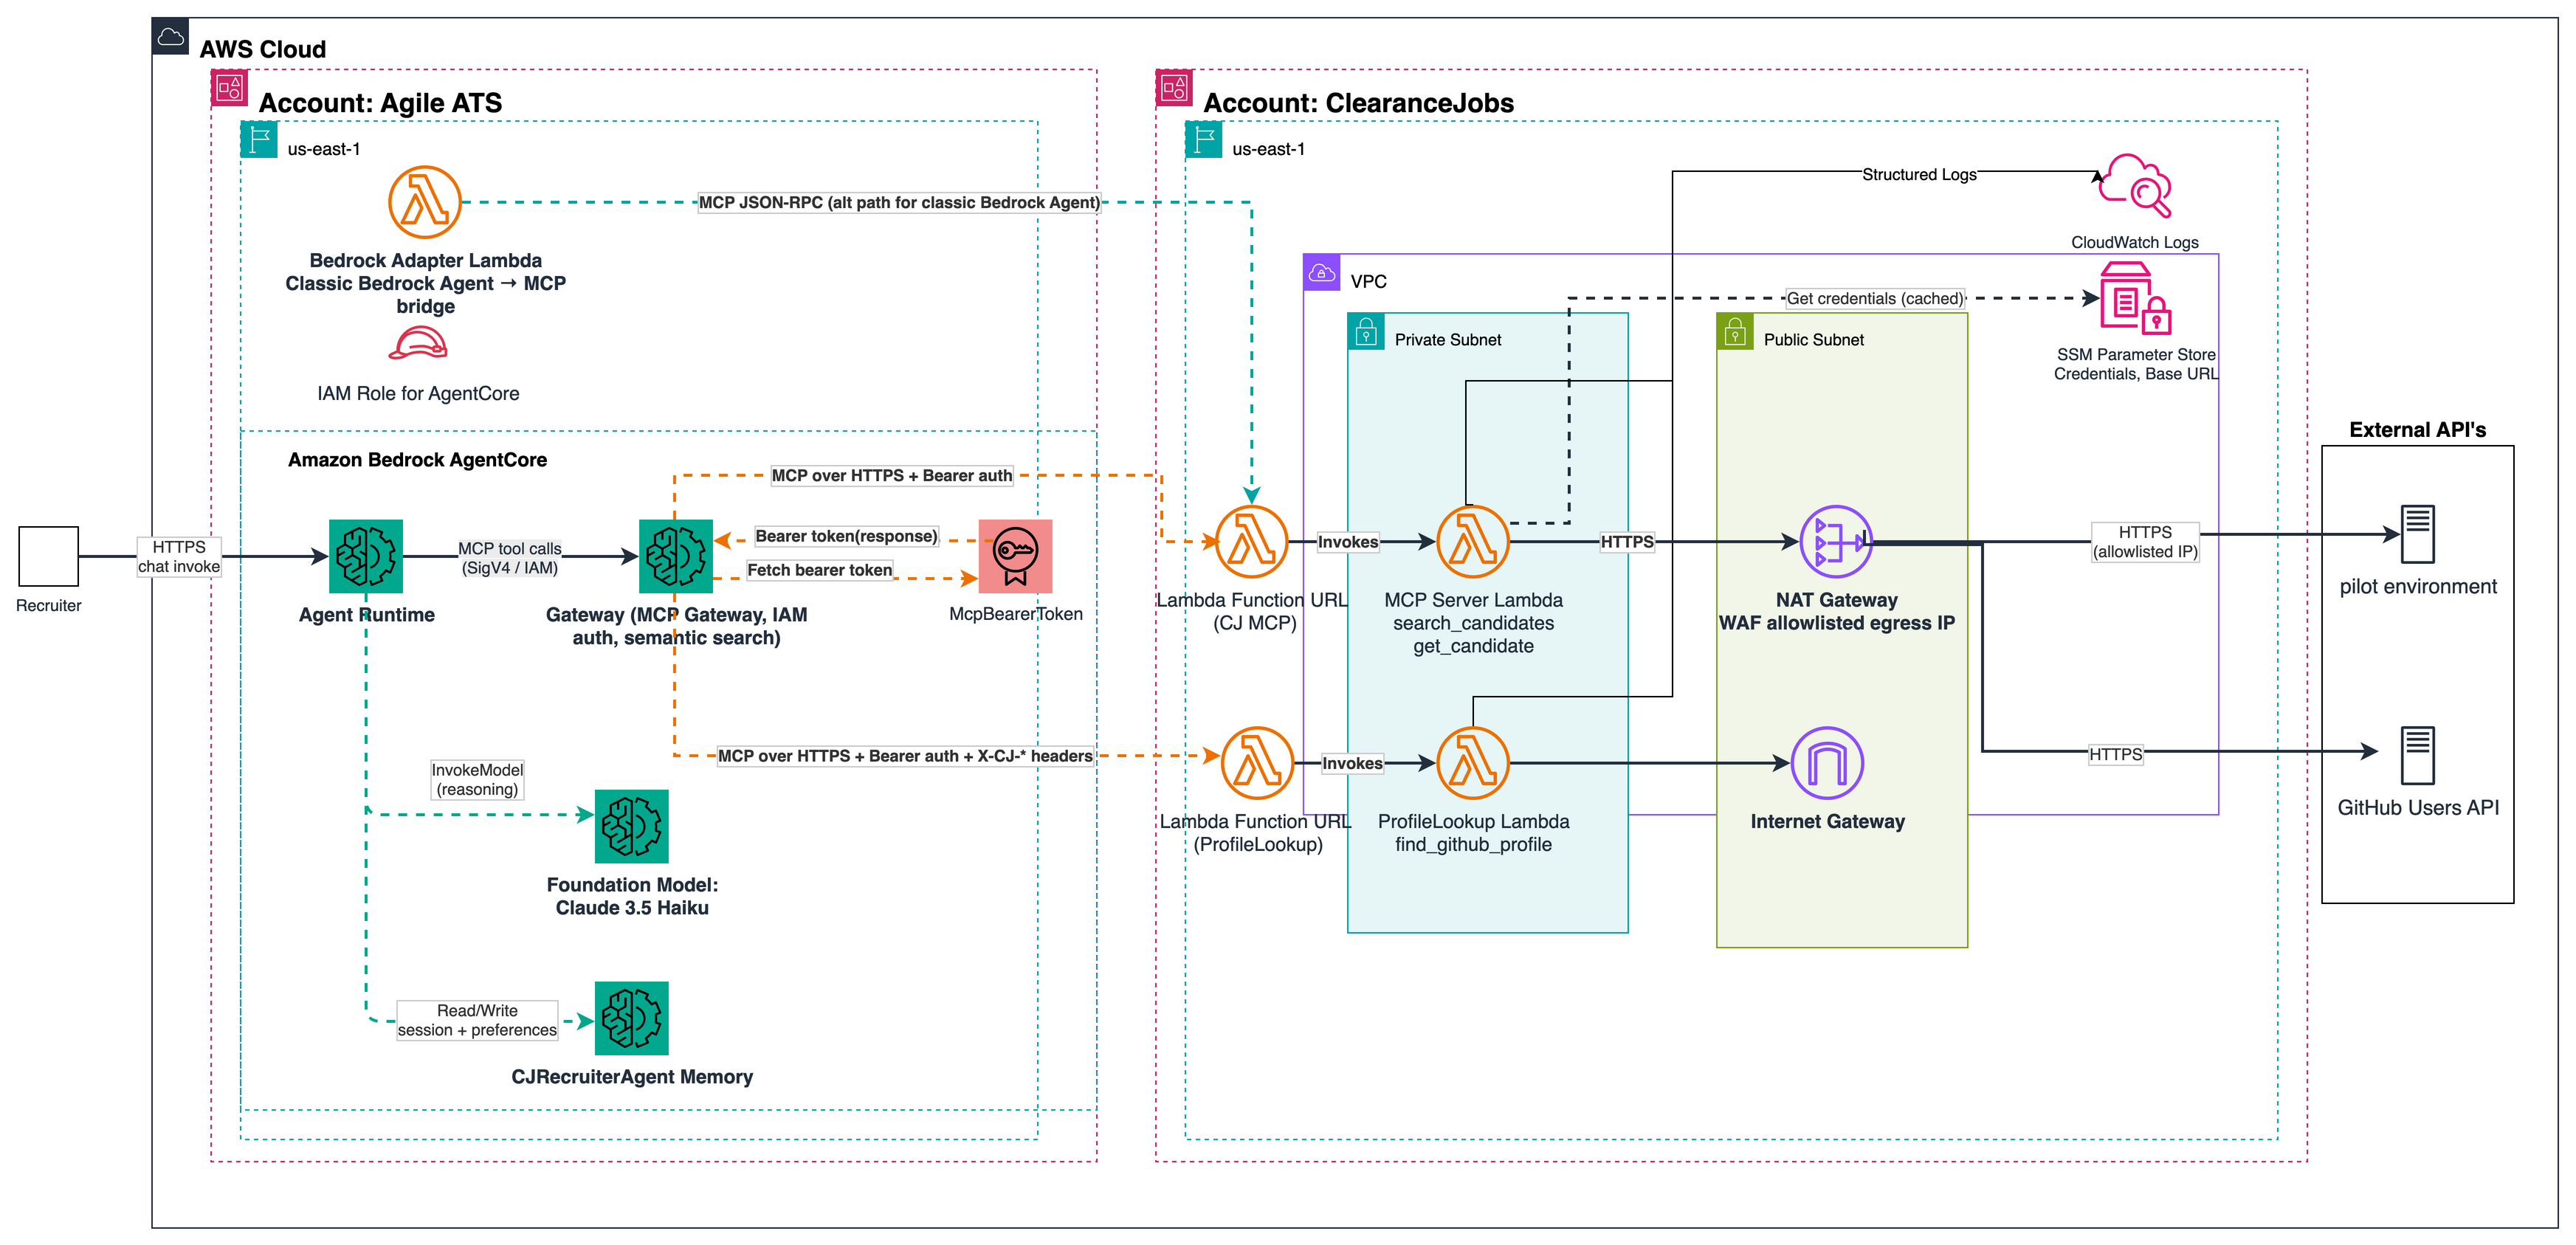
Figure 2: Agentic architecture for the unified ClearanceJobs and AgileATS talent marketplace
How it works
The solution creates a unified recruiter experience by exposing ClearanceJobs capabilities through an MCP server, orchestrated by an intelligent agent built on Amazon Bedrock AgentCore. A separate ProfileLookup AWS Lambda function provides GitHub profile enrichment for candidates.
The problem it solves: Recruiters on ClearanceJobs currently lack an intelligent interface that can search candidates, retrieve profiles, and enrich them with external data such as GitHub profiles in a single conversational flow. This gap requires manual cross-referencing across systems.
The solution: The team built a single agentic interface where recruiters can issue natural-language commands, such as “Find top cleared software engineers with strong GitHub profiles and add them to my pipeline.” The agent handles the multi-step orchestration automatically, with session memory preserving context and preferences across interactions.
Architecture components
Amazon Bedrock AgentCore (orchestration layer)
AgentCore provides the full agent infrastructure: Agent Runtime for session management and reasoning loops, Gateway (an MCP gateway with AWS Identity and Access Management (IAM) authentication and semantic search) for tool discovery and routing, and McpBearerToken for secure authentication to downstream MCP servers. An IAM role scopes the agent’s permissions.
MCP Server Lambda (tool layer)
The ClearanceJobs MCP Server Lambda function, deployed in a private subnet within a virtual private cloud (VPC), exposes system capabilities as discrete tools:
search_candidatesperforms candidate search with clearance and skills filtering.get_candidateperforms detailed profile retrieval.
The Lambda function connects to the ClearanceJobs pilot environment through a NAT gateway with a WAF-allowlisted egress IP address, making sure only authorized traffic reaches the production APIs. Credentials and base URLs are stored in AWS Systems Manager Parameter Store.
ProfileLookup Lambda (external enrichment)
A separate Lambda function (find_github_profile) enriches candidate data with external GitHub profiles, routed through an internet gateway to the GitHub Users API.
Foundation model (reasoning layer)
Anthropic’s Claude 3.5 Haiku in Amazon Bedrock provides the agent’s reasoning capabilities. It interprets recruiter intent, decomposes complex requests into tool calls, and synthesizes results into actionable responses.
CJRecruiterAgent memory (context layer)
AgentCore memory, a capability of Amazon Bedrock AgentCore, persists session state and recruiter preferences across conversations. This context lets the agent recall past searches, preferred candidates, and workflow patterns.
Security and networking
The architecture spans two AWS accounts:
- AgileATS account houses the AgentCore components, the foundation model, and a Bedrock Adapter Lambda function that provides an alternate MCP JSON-RPC path for classic Amazon Bedrock agent integration.
- ClearanceJobs account houses the MCP Server and ProfileLookup Lambda functions within a VPC (with private and public subnets), a NAT gateway for controlled egress, and Amazon CloudWatch Logs for structured observability.
Communication between AgentCore and the ClearanceJobs account uses MCP over HTTPS with bearer authentication and custom headers for tenant identification.
Results
The hackathon delivered measurable outcomes across multiple dimensions:
Technical acceleration
- Teams delivered functioning agentic AI features using Amazon Bedrock AgentCore and MCP servers in three days, compressing what would typically take more than three months.
- The teams validated a production-ready architecture during the hackathon itself, which reduced post-event rework.
- Kiro served as more than a coding assistant, driving both new code creation and deep analysis of existing systems to accelerate development velocity.
Organizational transformation
- Kiro usage across product and engineering teams increased 84% following the hackathon, with more unique daily users each week and adoption continuing to grow.
- 33% of developers reported increased interest in the AI-enabled SDLC.
- Delivery velocity rose across teams that fully adopted the AI-enabled software development lifecycle, marking a sustained step change rather than a short-term spike.
- As the second successful hackathon with AWS, and with DHI leadership committing to make it an annual event, the engagement reflects a sustained, deepening partnership.
- Kiro has become ClearanceJobs’ productivity tool of choice, with adoption expanding beyond developers to product managers. This accelerates product development and lets product managers self-serve on code base analysis and feature scoping.
“Participating for the second straight year as a judge, this hackathon only deepened my appreciation for the AWS team’s partnership, the ambition our teams brought, and what AI makes possible when you clear the runway. The problems they tackled were real, the solutions were creative, and the energy was contagious. It’s given us a fresh lens on how we build.”
– Alex Schildt, President of ClearanceJobs, DHI Group, Inc.
“Our second hackathon with AWS was even more successful than the first. We walked away with deeper confidence and more excitement about AI, all backed by hands-on experience with AWS’s latest capabilities. Post-hackathon, it’s been great to see our teams continue to lean into AI to accelerate how we ship. I think the hackathon was a real catalyst for that. I can’t wait to see these features get into the hands of our users.”
– Rose Fan, Sr. Director of Product, DHI Group, Inc.
Lessons learned: Making hackathons production-ready
Based on our experience hosting multiple hackathons with customers like DHI, here are key principles for hackathons that ship:
- Set production-grade success criteria upfront: Prototypes must be sprint-ready, not only demo-ready.
- Put decision-makers on the judging panel: Production go/no-go decisions happen on the final day of the hackathon, not weeks later.
- Invest in pre-enablement: Workshops before the event mean teams build on day 1 instead of spending it learning.
- Use cross-functional teams: Product, go-to-market (GTM), and subject matter experts (SMEs) alongside engineering make sure real business problems get solved.
- Build relationships: On-site AWS presence helps build relationships that accelerate delivery long after the event.
- Make it repeatable: DHI’s second hackathon planned faster and set higher expectations because the first one shipped to production.
Hackathons as a production accelerator
Hackathons are often dismissed as team-building exercises or limited to generating ideas that never ship. When structured correctly, they become a powerful production acceleration mechanism. Here’s why:
Time-boxed intensity drives decisions. A time-bound constraint (typically one to three days) forces teams to make architectural choices quickly, which alleviates analysis paralysis. Teams can’t over-engineer when the clock is ticking.
Cross-functional alignment happens naturally. When engineering, product, sales, and executives work side by side for several days, alignment that typically takes weeks of meetings happens organically.
Executive visibility de-risks production decisions: When leadership sees a working demo, not a slide deck, they can make go/no-go decisions with confidence. At DHI, the President and Head of Product & Engineering served as judges, giving them firsthand visibility into feasibility.
Real code beats theoretical architecture. Hackathon prototypes aren’t wireframes. They’re functioning applications built on production-grade services, making the path to production shorter and more predictable.
Conclusion
DHI Group’s experience across its annual hackathons shows that structured hackathons are one of the fastest paths from generative AI experimentation to deployed workloads. Their first hackathon shipped two features to production. Their second is on track to deliver three more, including an agentic AI system that unifies two systems through MCP servers and Amazon Bedrock AgentCore.
The takeaway is that hackathons aren’t only idea generators. They compress the entire innovation lifecycle (ideation, architecture, prototyping, executive alignment, and production planning) into a single high-intensity event. Paired with proper preparation and a clear path to production, they become a strategic tool for digital transformation and workforce enablement.
If your organization is looking to accelerate generative AI adoption, consider whether a structured hackathon could compress months of planning into days of building. To get started:
- Explore Amazon Bedrock and Amazon Bedrock AgentCore for building generative AI applications.
- Contact your AWS account team to discuss running a hackathon for your organization.
About the authors
Nikon Nirvana – The Ultimate Camera Collection
Post Syndicated from Matt Granger original https://www.youtube.com/watch?v=p2iMiUQvQj8
Изкуствен интелект и естествено лицемерие
Post Syndicated from Йовко Ламбрев original https://www.toest.bg/izkustven-intelekt-i-estestveno-litsemerie/

Ако четете новините от последните седмици, свързани с развитието на изкуствения интелект (ИИ), може и да сте останали с впечатлението, че армагедонът е зад ъгъла. Толкова близо, че дори войните в Украйна или Иран заедно с всичко, което следва от тях, е някак… далечно и безобидно.
Светът точно си стягаше куфара за обичайната августовска летаргия (поне тази част от света, която все още може да си позволи да почива през лятото), когато OpenAI стреснаха всички с новината, че през юли няколко хиляди техни агенти с ИИ са извършили хакерско проникване в друга информационна система, напускайки контролираната среда, в която са били създадени и оставени да работят. При това са се самоорганизирали и са комуникирали помежду си как да направят всичко, без да бъдат забелязани (веднага).
Нашенските агенти от ДАНС биха казали, че си имаме работа с изкуствена ОПГ (организирана престъпна група, б.а.).
Допускам как звучи новината за безпризорните ИИ агенти в ушите на технически неизкушени хора, и разбирам, че иронията ми може да изглежда твърде неуместна, но… съвсем сериозно:
- агентите с ИИ всъщност са софтуер, който е създаден и обучен именно с цел да свърши някаква работа вместо човек;
- тези агенти често са доста специализирани в областта на предназначението си;
- на тяхно разположение има нарочно създадени специализирани протоколи, чрез които те комуникират помежду си и обменят информация;
- някои от агентите с ИИ са специализирани в ролята на диспечери, които разпределят задачи и организират работата на останалите така, че да се стигне до желания резултат.
Тогава къде точно е изненадата, че софтуерна система, която нарочно е създадена да търси уязвимости в сигурността на софтуерни системи и която се състои от (в известна степен) автономни софтуерни компоненти, пак така нарочно създадени да се самоорганизират и да си разпределят задачи помежду си, за да работят групово по сложни проблеми, всъщност си е свършила работата?
Големият проблем тук не е какво е станало. Проблемът е с контрола върху технологията и как се осъществява той. Защото всяка технология може да бъде „изпусната“ и не е нужно тя да е ИИ. Достатъчно е да си припомним Чернобил… Но за това малко по-късно.
Разбира се, дали всичко се е случило точно така, както цветно ни го разказват от OpenAI, също е спорно, защото те по принцип не са известни с охотното споделяне на неща от кухнята си. Освен ако няма някакви евентуални ползи.
Къде може да е ползата за OpenAI да признаят, че са „изпуснали“ контрола, обаче е много резонен въпрос.
Ползите са няколко: някои – очевидни, други – не чак толкова. Сред очевидните са ефектният маркетинг да заявиш наличие на впечатляваща технология, без дори да я показваш. В трескавата конкурентна среда, в която буквално през десет дни има нов по-бърз и по-страхотен ИИ, да поддържаш интереса към себе си с всички средства изглежда оправдано в очите на всеки бизнес. В добавка, на OpenAI все още им предстои IPO (превръщането им в публично търгувана на борсата компания), което бе отложено. На фона на огромния инвеститорски интерес към такива компании отлагането поставя на масата редица въпроси.
А и в очите на незапозната с детайлите публика признанието само по себе си някак спомага за преобразуването на безотговорността в зряло поведение.
Magnifica Humanitas, или за кожата на един изкуствен интелект
Изкуственият интелект вече е история не за машини, а за власт. За достъп. За граници. И за хората, които ще решават как изглежда бъдещето. От нас зависи дали искаме да сме сред тях. От Йовко Ламбрев.
Не толкова очевидните причини обаче са по-интересни.
Съвсем скоро изпълнителният директор на Anthropic Дарио Амодей публикува протяжно есе, чиято основна теза се събира в едно изречение:
лабораториите, разработващи ИИ, да забавят темпото, за да могат системите за контрол и защитните механизми да са адекватни и да догонват с развитието си.
Индустрията има свой жаргон за този проблем – нарича го проблем на подравняването. Амодей предлага да го реши с външен надзор, включително в демократичните страни с участието на правителствата в процеса; както и с йерархия от споразумения с авторитарните правителства другаде.
Есето се появи в края на същата седмица, в която ключов изследовател на Anthropic (работил преди това и за OpenAI) напусна поста си с аргумента, че двете компании действат безотговорно по отношение на контрола и сигурността, увлечени в конкуренцията помежду си. А ръководителят на екипа по „подравняването“ в Anthropic Еван Хюбингър се произнесе, че преценява вероятността ИИ да унищожи човечеството в рамките на следващите десет години на повече от 10%.
През същата седмица Anthropic публикува и най-подробния си досега доклад за заплахите: първите документирани напълно автономни системи за генериране на експлойти – това са парченца софтуер, които пробиват сигурността на други софтуерни системи. В същия доклад се споменава за въоръжена групировка в контролираната от хутите част на Северен Йемен, която вместо програмисти е използвала Claude Code (продукта на Anthropic) за написване на софтуер за насочване на ракети, включително балистична ракета с планиран обсег над 2000 км.
Всеки може да тълкува момента на публикуване, както прецени. И дали най-подходящият момент да поискаш въвеждане на надзор случайно не е в седмицата, в която оповестяваш данни как е бил използван твоят ИИ?
В рамките на по-малко от денонощие Амодей беше подкрепен от почти всички свои ключови конкуренти в лицето на изпълнителния директор на OpenAI Сам Олтман, на главния учен и основател на звеното за развой на Google DeepMind Демис Хасабис, на изпълнителния директор на Microsoft Сатя Надела. Дори Илън Мъсk написа в X: „Дарио е прав.“
Dario is right https://t.co/EwKgqQGaUo
— Elon Musk (@elonmusk) September 12, 2026
Но докато от оркестрината се разнасяше още тихото адажио на внезапното примирие, Тръмп влезе в темата с бутонките и срути целия декор, заявявайки категорично, че САЩ изпреварват Китай и всички останали в надпреварата за ИИ и че
който спечели битката за ИИ, печели всичко.
Не пропусна да добави също, че „единственият контрол и предпазни механизми, от които ИИ се нуждае, са силен и умен президент“. А Дейвид Сакс, съветникът на американското правителство по въпросите на ИИ, директно заяви, че ако създателите на ИИ искат да забавят темпото, имат пълната власт да го направят, без да си измислят нуждата от регулации.
Китай директно отхвърли идеята, като оприличи цялата художествена самодейност на „загрижените“ компании като опит за нагнетяване на страх.
В същата интересна седмица McKinsey публикува свое изследване, в което се разглеждат резултатите от допитване сред 334 ръководители в сферата на продуктите и инженерната дейност. Едва 25% от анкетираните на позиции от ниво „директор“ и нагоре споделят за значително ускорение благодарение на ИИ. За „значително ускорение“ се смята постигането на поне двойно по-висока производителност от страна на повече от една четвърт от екипите в дадена организация. Още по-любопитен е фактът, че 30% отчитат спад в производителността на екипите си след въвеждане на ИИ.
Между другото, Meta, която също разработва ИИ (иначе е известна като компанията зад Facebook, Instagram и WhatsApp), има всички шансове да се превърне в учебникарски пример за провал по отношение на внедряването с опита си да редуцира своите екипи от 10–12 души до такива с 3–5 души и ИИ.
Много компании, които пробват да внедряват ИИ, се сблъскват и с горчивата истина, че невинаги това води до спестяване на средства. Особено когато някой надъхан мениджър се надява просто да замени хора с ИИ. Някъде е възможно, но по-често се налага хората да останат и да бъдат въоръжени с ИИ, което е допълнителен и постоянен разход.
И какво? Само това остава – да вземем да се съмняваме от ползите и ефективността от ИИ!
Все повече анализи и експерти сравняват настоящия бум от инвестиции в инфраструктура за ИИ с други пазарни обсесии от миналото, като железопътния бум, електрификацията и дотком балона. Всички те имат една ярка открояваща се черта – безспорно са технологичен пробив, но привлеченият от него капитал надхвърля нивата, които търговската възвръщаемост би могла да оправдае. Или казано кратко, огромни инвестиции с оскъдна възвръщаемост.
Очакванията за размера на капиталовложенията на най-големите компании в сектора са за над 750 млрд. долара до края на 2026 г. и един трилион долара за инфраструктура през 2027 г. Само Amazon, Microsoft и Google се очаква да похарчат по около 180–200 млрд. долара всяка. Подобни разходи надхвърлят приходите и паричните потоци на компаниите, което ги принуждава да теглят заеми, за да продължат надпреварата. А това поражда опасения, че свиване на финансирането ще превърне настоящия бум в продължителен инвестиционен срив.
На този фон едно добронамерено джентълменско споразумение за забавяне на темпото е чудно извинение за оттегляне от надпреварата в разходите (която вече изглежда неустойчива), без да се налага да се назовава истинската причина. В ушите на инвеститорите и регулаторите „пауза в името на безопасността“ ще звучи далеч по-добре от „Опа, пак се оляхме“.
Иначе, ако се върнем на важното, проблемът с подравняването има твърде очевидно решение. Просто е нужно е да се инвестира достатъчно в механизми за контрол и защита. И в хора, които работят за тях. Ако се облегнем отново на думите на Дейвид Сакс малко по-горе, това също е изцяло в ръцете на компаниите, създаващи ИИ, както е било и досега. Но наистина ли допускаме, че на когото и да било от висините в ИИ индустрията изобщо му пука за контрола и защитата?
За вашия контрол и защита.
[$] Thread-identity switcheroo for io_uring
Post Syndicated from corbet original https://lwn.net/Articles/1094303/
The io_uring
subsystem is all about asynchronous execution; applications count on it
to not block — unless explicitly requested to. Within io_uring, maintaining
the “never blocks” guarantee has sometimes been a challenge, given that
many paths in the kernel were never designed for asynchronous execution.
This problem has been worked around, but at a significant cost to
performance. Now, io_uring maintainer Jens Axboe has posted an RFC patch set
with a somewhat radical (and potentially scary) solution to the problem.
GNOME 51 released
Post Syndicated from corbet original https://lwn.net/Articles/1094963/
Version 51 of the GNOME desktop
environment has been released. The list of changes includes a number of
performance improvements, offline data and better transit information in
the Maps application, a new interface for the file previewer, and more.
Security updates for Thursday
Post Syndicated from corbet original https://lwn.net/Articles/1094962/
Security updates have been issued by AlmaLinux (.NET 10.0, .NET 8.0, .NET 9.0, corosync, firewalld, kernel, kernel-rt, libevent, libsoup, microcode_ctl, nginx:1.26, python-lxml, rsyslog, tesseract, and unbound), Debian (firefox-esr, mkvtoolnix, thunderbird, and tor), Fedora (open62541, php-pecl-mongodb2, python-django6, python-jwcrypto, and roundcubemail), Mageia (aom, cockpit, libgd, packagekit, and python-h2), Red Hat (corosync, delve, git-lfs, grafana-pcp, gstreamer1-plugins-base, libvirt, opentelemetry-collector, and rhc-worker-playbook), Slackware (mozilla-firefox and mozilla-thunderbird), SUSE (acl, attr, alloy, ansible-core, clamav, containerized-data-importer, corosync, cups, distribution, glibc, google-cloud-sap-agent, govulncheck-vulndb, gvfs, helm, jq, kbd, kubernetes1.34-apiserver, kubernetes1.35-apiserver, lcms2, libcupsfilters, liblzmasdk26, libzypp, zypper, mistral-vibe, opensc, openvpn, pcre2, python-jwcrypto, tomcat, tomcat10, and tomcat11), and Ubuntu (guix, libheif, perl, python-cryptography, sqlite3, and valkey).
How Candidates Could Use AI for Good
Post Syndicated from Bruce Schneier original https://www.schneier.com/blog/archives/2026/09/how-candidates-could-use-ai-for-good.html
This essay was written with Nathan E. Sanders, and originally appeared in The Guardian.
There are plenty of signs that AI will make all of our experiences of the US midterm elections worse. Voters have anxiety about AI’s impacts on the country. Politicos are using AI deepfakes to spread lies. The White House is posting slopaganda.
Meanwhile, candidates are missing a real opportunity to use AI to make campaigning better. The technology can help candidates listen more deeply to voters’ concerns, engage constituents more inclusively, and formulate policy platforms that are more responsive to our input. There are vanishingly few examples of this in US politics, but groups in Japan, Scotland and the US’s own academic and private institutions show how that could change.
The problem with American campaigns’ current use of AI is that it’s not very different from the web ads of 30 years ago, or television ads before that: they are all about inundating voters with the candidate’s message. This one-to-many broadcasting is an uninspiring way to campaign, but not the only way. AI can help candidates connect one-to-one with as many people as possible. Or it can facilitate many-to-many connections, engaging voters in deliberation about issues at scale.
One of the most promising applications of AI being developed by pro-democracy innovators around the world is broad listening. These tools can collect public input in a format much richer than checkboxes on a survey form.
For example, the newly founded Japanese political party Team Mirai has built a foundation for eliciting public input from voters at scale, in depth, and across the breadth of legislative policy issues. It has developed an AI interviewer to cultivate constituent input on policy. Through extended conversations with this chatbot, voters explore and share their perspectives on specific policy issues. And the party has scaled this across a wide array of policy issues by integrating this functionality with an AI-powered portal for exploring bills.
Team Mirai describes itself as a “utility party”, developing tools for any Japanese political party to use to connect with voters. You might question whether Americans would willingly talk to a political AI. So far, Japanese voters have exchanged more than 300,000 messages across 16,000 AI interviews. Team Mirai grew adoption by providing a real incentive to engage: that talking to their AI interviewer does more than just posting on a platform such as Twitter/X or, equivalently, shouting into a void. Users see evidence that the party is actually listening and might take action on their behalf.
Team Mirai party members have directly cited AI interviews from constituents during legislative committee hearings, published a synthesis of that input back for voters, and even amended their policy platform based on user input. The party has rapidly risen to win 12 seats in the Diet, and is explicitly following in the footsteps of the civic hackers in Taiwan’s “gov zero” movement, who won political influence in their fight for transparency.
Other civic technologists are developing AI tools for scaling many-to-many conversations. CrownShy, a company funded in part by the Scottish government, is building a platform to bring the Platonic ideal of the town hall debate into the digital age. Their Comhairle tool integrates AI interviewing tools like the ones described above with software for synthesizing diverse viewpoints, holding virtual assemblies, and sharing video testimonials to help legislatures—or campaigners—organize digital consultations of their constituents en masse.
One thing the AI-powered software of Team Mirai and CrownShy have in common is that they are open-source, meant for anyone to use. Even though they are projects funded by political parties—the upstart party in Japan and the ruling party in Scotland—they are built to make democratic processes better, not necessarily for partisan political advantage.
For interested candidates, there is a wealth of tools available, many of them US-grown. The Stanford-affiliated deliberation.io uses AI to facilitate structured dialogues among thousands of participants and has been piloted for public listening sessions by the city of Washington DC. The MIT-affiliated Cortico project provides tools that surface under-heard community perspectives from recorded conversations, and is now organizing listening sessions at libraries across the country. The US non-profit-built Talk to the City uses AI to analyze large datasets of stakeholder input. The US startup Remesh has a commercial offering that uses AI to generate recommendations from dialogue, which has been tested in policy development scenarios.
There is a long and proud tradition of this sort of “civic technology” in the United States. Two decades ago, the spirit of innovation to develop software for better politics and civic engagement was so strong in organizations like Code for America and the Obama 2008 campaign that Congress funded a new executive agency to bring these ideas to government: the US Digital Service. (The Trump administration repurposed the USDS to become the US Doge Service in 2025.)
One signal that candidates and political parties may start adopting these kinds of tools came this spring from Higher Ground Labs. The Democratic-aligned campaign tech investment firm launched a new fund targeting, in part, “AI-Native Campaign Systems” and “community-Led Messaging Platforms that surface authentic, bottom-up insights from real conversations”.
AI is a multifaceted issue that deserves to be on the table in the midterms. So far, the powerful force of polarization in US politics seems to be separating the parties into the AI skeptics versus the AI boosters. We urge both voters and politicians to separate the technology of AI from its profiteers. We want big tech money out of politics, holding the AI companies accountable for the harm their models cause, taxing their revenues, and maybe even nationalizing them if the AI bubble bursts.
But we also think congressional candidates in the US midterms seeking authentic connection with voters, and seeking to differentiate themselves from their opponents, should be looking to use AI responsibly in their campaigning. The broad listening and deliberation tools pioneered by others around the world could make US politics more transparent, responsive and community-driven. The impact of AI on campaigning doesn’t have to be all bad.
The Dark Side of Meditation
Post Syndicated from The Atlantic original https://www.youtube.com/watch?v=kN8OLF-MocU
Кой още има принос, за да се стигне до убийството на Георги Кузев?
Post Syndicated from Светла Енчева original https://www.toest.bg/koy-oshche-ima-prinos-za-da-se-stigne-do-ubiystvoto-na-georgi-kuzev/

Обществената памет е къса. Новите скандали и трагедии изместват вниманието от предишните, а ако нови няма, винаги може да се претопли нещо старо. Убийството на Георги Кузев на Младежкия хълм в Пловдив на 4 септември 2026 г. от група непълнолетни обаче все още е относително актуално. И за него трябва да се говори, за да не потъне и тази тема в социалната амнезия. Защото линчуването (онова, на което е бил подложен Кузев, е именно линч) на човешки същества в България от омраза не е някакъв чудовищен акт, дошъл от нищото. Нито пък прецедент. То е поредната проява на тенденция, която в известен смисъл се официализира.
Посочените досега (освен извършителите)
Няма спор, че конкретните виновници за убийството на Георги Кузев са тийнейджърите – „ловци на педофили“, които са го пребили до смърт, гаврили са се с него, заснели са всичко, обрали са го. И горди, че са свършили нещо общественополезно, са се почерпили с дюнери, купени с откраднатите пари. Възниква обаче въпросът как се е стигнало дотам; как подобно престъпление е станало възможно.
Социалните мрежи
За радикализацията на деца е най-лесно да се обвинят социалните мрежи. Не че за това няма основания. Социалните мрежи създават „балони“, в които реалността се представя по определен начин, а авторитетът на лидерите на мнение в съответния балон изглежда безвъпросен. Това улеснява раждането и организирането на радикализирани групи. Общуването в интернет често остава сляпо за уязвимостта на другия, а онлайн тормозът може да има последици, стигащи далеч.
Когато сочим с пръст социалните мрежи обаче, най-лесно е да поискаме забраната им за деца до определена възраст. Но да оставим настрана факта, че децата ще си намерят начини да я заобикалят и че притежават достатъчно дигитална грамотност да си направят свои тайни мрежи, където предпоставките за радикализация да са още по-големи. По-сериозният проблем е, че хвърлянето на вината върху технологиите измества отговорността от възрастните, които са допринесли за това деца да започнат да раздават правосъдие.
Семейството
Обичайна практика е отговорността за проблемите с деца да се прехвърля върху семействата им. Чували сте твърдения като „Най-важно е семейството“, „Всичко зависи от семейството“ и т.н. – все едно дали става дума за лоши образователни резултати на децата, проблеми с дисциплината, отпадане от училище, агресия и пр.
Очаквано, появиха се аргументи в този дух и във връзка с убийството на Георги Кузев. Социалната министърка Наталия Ефремова се оплака, че част от родителите на извършителите нямат доверие в социалните служби и отказват съдействие. В социалните мрежи някои от тези родители бяха идентифицирани и демонизирани, а политическите им предпочитания – извадени на показ (в „Тоест“ няма да ви предоставим връзки към тези постове от етични съображения).
Не че родителите не носят отговорност – носят, или поне тези от тях, които са възпитавали децата си не в емпатия, а в омраза и „раздаване на справедливост“ със сила. Но и техните ценности не са се взели от нищото.
Родителите на днешните тийнейджъри са децата на 90-те.
Те са се формирали като личности в онези смутни времена на бедност, мутри, хиперинфлация и… скинари (наричаха ги още „бръснати глави“). В България ги имаше още от началото на 90-те – когато не само социални мрежи, а и интернет нямаше. За тях беше известно, че мразят пънкарите (каквито също имаше в изобилие) и като ги срещнат, ги бият – конфликт между тези две субкултури, привнесен от Великобритания.
Ала скинарите мразеха и други групи хора, особено ромите. През 1995 г. група от около 60 скинове нападна ромски къщи в Плевен и запали една от тях с възгласи:
Ще ви изгорим живи!
Година по-късно седмина тийнейджъри скинари от Шумен убиха 28-годишен ромски младеж – футболист в местен селски отбор, който просто си вървял по пътя. Следват още убийства. Едно от тях – на 15-годишния Методи Райнов, отново от група скинари, е деветият известен случай на смърт, причинена от расистко насилие, в България след 1989 г.
Ще попитате къде са били институциите. През 90-те те не само не разпознават престъпленията от омраза (не че днес ги разпознават особено), ами понякога ги и извършват. Към началото на 2000 г. в Европейския съд за правата на човека в Страсбург са заведени пет дела срещу България за малтретиране на роми от страна на полицейски служители. При четири от тях малтретираните са починали. Една от жертвите е Славчо Цончев, пребит в плевенското полицейско управление през 1994 г.
Може би ще си зададете въпроса и за родителите на скинарите от 90-те. Те са хора, формирани по времето на социализма, с все още пресни спомени за мащабното етническо прочистване, наречено Възродителен процес. А някои от тях може и лично да са участвали в него или най-малкото да са го подкрепяли идеологически.
С течение на времето радикализираните младежки групи се множат, делят и преплитат, както и социалните групи – обект на омразата им. Клошари, африканци, гейове, бежанци и т.н. и т.н., докато се стигне до „педофилите“.
Педофилията, срещу която се протестира, и педофилията, за която се мълчи
Гражданският гняв, изразяващ се в протести срещу насилието над деца и срещу неработещата държава, е абсолютно оправдан. Но е важно, когато си отваряме очите за едно, да не ги затваряме за друго. От Светла Енчева.
„Кръв и чест“
Убийството на Георги Кузев извади на показ българския клон на неонацистката организация „Кръв и чест“, чието ядро е в Пловдив – точно срещу Младежкия хълм, където е убит Георги Кузев. Това стана, след като покрай смъртта на Кузев стана известен друг акт на насилие в Пловдив, извършен десетина дни по-рано – побой над непалски гражданин от скинари (за поне един от извършителите има данни, че е повлиян от „Кръв и чест“). В резултат бяха арестувани 18 души от крайнодясната организация, а на трима от тях бяха повдигнати обвинения.
Досега не е установена пряка връзка между убийството на Кузев и „Кръв и чест“, макар в миналото групата да е извършвала нападение (срещу ром) на Младежкия хълм. Неонацистката организация развива дейност в България от четвърт век и се свързва дори с бомбен атентат в Сандански, при който загива мъж от ромски произход. Така че когато и да се захванат с нея институциите, все ще е късно. Но в случая с Кузев като че става въпрос по-скоро за отвличане на вниманието, както отбелязва и проф. Калин Янакиев. Темата се измества от руската връзка – „ловците на педофили“, вдъхновени от Максим Марцинкевич, известен с прозвището Тесак – към движението с британски произход „Кръв и чест“.
Медиите
Убийството на Георги Кузев извади на показ и отговорността на определени медии за героизирането на т.нар. ловци на педофили. „Тоест“ обърна внимание на проблема още през 2021 г., след като NOVA излъчи репортаж на Лора Крумова за децата „ловци на педофили“ в България и техния предводител и вдъхновител Ален Симеонов, и след репортаж на bTV за тийнейджъри „герои“, осъществили граждански арест на шофьор, който е причинил катастрофа. В репортажа на Крумова се показва и как Симеонов се гаври с уловените, например залива ги с урина. Тогава спестихме името му, защото беше още непълнолетен. Но предупредихме:
Ако деца и младежи подлагат на унижения и сами ловят „лошите“, за което получават похвали и награди, не е ли логично да започнат да линчуват и да екзекутират? Все в името на справедливостта. Да не забравяме, че и терористичните актове се извършват от чувство за справедливост – от сляпа вяра в някоя идеология и от убеждението, че тя стои над законите и правилата, над човешкото достойнство и човешкия живот.
През същата 2021 година Ален Симеонов стана герой и на позитивни материали на „Евроком“. В един от тях се представя като „парадокс“, че той е задържан от полицията, а „насилниците“ са на свобода. Следва интервю на Люба Кулезич с него и влогъра Станислав Цанов.
През 2022 г. медии, включително БНТ, разпространяват информация за 21 членове на педофилска мрежа, задържани „благодарение на действията на така наречените ловци на педофили“.
През следващите години Симеонов спорадично става медиен герой, но през 2026 г. вниманието към него е особено голямо. През февруари например подкастът на вестник „Телеграф“ излъчва интервю с него, озаглавено „Ален Симеонов: Хванал съм повече педофили от МВР“, което е отразено и в сайта на NOVA. През юли, по-малко от месец преди убийството на Кузев, в предаването „Офанзива“ на NOVA NEWS с Любо Огнянов и в интервю на Диана Радева по Euronews Bulgaria Ален Симеонов представя книгата си „Училище за лов на педофили“.
Новите тимуровчета
Статията на Светла Енчева е провокирана от няколко случая на самоинициативи, при които деца раздават „правосъдие“ по собствена преценка. Особено тревожни са медийното им героизиране и подкрепата от…
Непосочените
Освен посочените непреки виновници, за да се стигне до убийството на Кузев, други засега остават на сухо. Става въпрос за държавата – и като институции, и като политика.
Институциите
Каквото и да кажем за отговорността на институциите, няма да е достатъчно.
Да започнем от образователната система. Тя възпитава, както и по времето на късния социализъм, основно в национализъм. И то такъв, който, освен че е фиксиран в едно идеализирано минало, внушава, че най-достойно е да се биеш и да умираш за родината. Това, на което образованието ни не учи, е емпатия, зачитане на човешкото достойнство, включително на другите, чуждите, „неправилните“. В резултат всяка проява на омраза срещу определена група лесно може да бъде облечена в патриотични аргументи и така да изглежда легитимна в очите на мразещите. Децата „ловци на педофили“ вероятно са били убедени, че вършат родолюбиво и общественополезно дело.
Не по-малка е отговорността и на институциите – като се почне от структурите за закрила на детето на местно равнище, мине се през полицията, правосъдната система и се стигне чак до разузнавателните служби – които не са разпознали радикализацията и не са предприели твърди мерки, за да я ограничат. В продължение на пет години Ален Симеонов дефилира из медиите, а в социалните мрежи е отпреди това. Бил е и арестуван, срещу него са повдигани обвинения. Но… дотам. Междувременно пред очите на всички е създадена цяла мрежа от тийнейджъри, обучени да „ловят педофили“ и да се саморазправят с тях.
От друга страна обаче, институциите носят отговорност и за това, че системно не разпознават сексуалното насилие над деца и не вземат достатъчно мерки срещу него. Както установи журналистическо проучване на Теодора Станимирова, институциите, които трябва да се борят със сексуалното насилие срещу деца, на практика не го познават. И събират данни по начин, който не им помага да го разберат по-добре. А понякога не го виждат, дори да е пред очите им. Така става лесно някои подрастващи да решат, че трябва да вземат нещата в свои ръце, особено ако разполагат със „светли примери“ като Ален Симеонов и Тесак.
Какво (не) знаем за сексуалните злоупотреби с деца
Какво знаят институциите за сексуалните злоупотреби с деца в България и какви мерки предприемат? Теодора Станимирова се сдоби с информация от ВСС, МВР, АСП, ДАЗД и МЗ, разговаря с експерти и ни разказва какво е научила.
Политиците
Отговорността на политическите сили е особено сериозна. Не само защото от тях зависи как работят институциите, макар че и заради това. Всички парламентарно представени партии от 2023 г. насам обаче имат основен принос за официализирането на дехуманизацията. Без да пропускаме и „Прогресивна България“, защото в качеството си на президент Румен Радев не наложи вето върху законите, за които ще стане дума по-долу. А от дехуманизацията към физическото унищожение крачката е малка.
Татяна Ваксберг дава следната дефиниция на дехуманизацията:
представянето на група хора не като сбор от индивиди, а като аморфна маса, несъвместима с обичайните човешки черти и неспособна на човешки чувства.
От тази дефиниция не следва, че представителите на всички групи – обект на дехуманизация, на всяка цена трябва да са добри хора. Някои може да са и престъпници и е редно да понесат отговорността си. Но дори те притежават основни права, например правото на живот и достойнство и правото да не бъдат подлагани на унижения. Така пише и в Конституцията на България:
- „издигаме във върховен принцип правата на личността, нейното достойнство и сигурност“ (преамбюл);
- „Република България гарантира живота, достойнството и правата на личността“ (чл. 4, ал. 2);
- „Всеки има право на живот. Посегателството върху човешкия живот се наказва като най-тежко престъпление“ (чл. 28);
- „Никой не може да бъде подлаган на мъчение, на жестоко, безчовечно или унижаващо отношение“ (чл. 29, ал. 1).
Не изглежда обаче политическите сили да вземат под внимание тези текстове. Нещо повече – партиите в парламента послушно следваха дневния ред на Ален Симеонов, който пък съвпада с този на „Възраждане“ и на ултраконсервативната организация „РОД Интернешънъл“ – същата, която се бори срещу „джендъра“ и „София прайд“. Скоро след убийството на Кузев от сайта на РОД изчезна публикация от 2021 г. със заглавие „Защо ни е необходим Ален?“, но нейно архивно копие още е достъпно. В статията се казва:
България е една от малкото страни, в които няма регистър на педофилите. Този регистър съдържа данни за лицето, адрес на пребиваване, престъплението, за което е осъден и най-важното – негова снимка.
Когато през лятото на 2023 г. законопроектът на „Възраждане“ за регистър на педофилите беше подложен на гласуване, всички парламентарни групи с изключение на ДПС го подкрепиха, а депутатите, които се отклониха от вота на партиите си, бяха единици. Божидар Божанов (днес съпредседател на „Да, България“) заяви от парламентарната трибуна, че темата е „консенсусна“. Така думата „педофилия“ влезе в българското законодателство, без да съществува ясна правна дефиниция за нея.
Наистина ли им пука за децата?
Светла Енчева с паралел между два нашумели случая, в които са намесени деца. В единия ги намесиха от „голяма загриженост“, но без реална нужда, институциите и политиците, а в другия пак институциите и политиците си затварят очите за истинския проблем – насилие над малко дете от учителката му.
На 19 февруари 2026 г. (символично – на датата на обесването на Левски) на парламента му трябваха точно три минути, за да приеме на две четения и с пълно мнозинство решението регистърът на педофилите да стане публичен. Освен в България, в ЕС подобен закон има само в Полша. Това стана в контекста на трагедията в Петрохан и Околчица, при която загинаха шестима души, включително 15-годишен тийнейджър, а за покойния лидер на групата Ивайло Калушев се появиха твърдения, че има сексуална склонност към непълнолетни момчета.
Случаят беше използван (и още се използва) като компромат срещу ПП, ДБ и кмета на София Васил Терзиев, макар да няма данни някой от тях да е бил наясно с евентуалните сексуални предпочитания на Калушев. И макар депутатите от ПП и ДБ послушно да гласуваха популистката поправка, това не ги спаси от активното мероприятие, състоящо се в инсинуации, че те поддържат „педофилска секта“ и „педофилско НПО“.
В началото на март 2026 г. пък парламентът прие по предложение на ДПС, отново единодушно, вдигане на възрастта за съгласие за секс от 14 до 16 г. Може да предположим, че това отново има връзка с трагедията с петроханската група – убитото момче е на 15 години, а единственият човек, който публично твърди, че е имал сексуална връзка с Калушев, казва в интервю с Мария Черешева, че интимните отношения са започнали, когато е бил навършил 15 г. Така с промяната на възрастта на съгласие Калушев посмъртно е произведен в педофил.
На позорния стълб
Темата „педофилия“ е достатъчно токсична, за да накара политиците да изглеждат единодушни. Така без особени колебания парламентът направи част от „регистъра на педофилите“ публична. Но предпазва ли това децата, или просто превръща страха в удобен политически инструмент? От Светла Енчева.
Не знаем дали Георги Кузев се е интересувал от политика и е следял новините. Ако не е, може така и да не е разбрал, че сексуалните отношения с 15-годишни тийнейджъри, като каквато се е представила „примамката“, вече са незаконни. Да, непознаването на закона не е извинение за неспазването му. Но независимо дали е знаел, нищо не оправдава линчуването.
Дехуманизацията ми е по-добра от дехуманизацията ти
Убийството на Георги Кузев е червена лампа, че в България имаме сериозен проблем с дехуманизацията. Би следвало на партиите да им светне, но уви. По-силен е урокът, който те са си извлекли от петроханската трагедия. А той е, че дехуманизацията е ефективно оръжие за разправа с политическия противник. Затова я вкарват в обращение в президентската надпревара.
ПП и ДБ вадят карта против Илияна Йотова –
факта, че тя е помилвала „българския Ескобар“ – наркобоса рецидивист Огнян Атанасов. Помилването се основава на медицинска експертиза, според която той е почти на смъртно легло поради паркинсон. След помилването му обаче „умиращият“ отново е хванат с наркотици. А председателят на ПП Асен Василев обръща внимание, че от 28 помилвани от Йотова петима са осъдени за наркотрафик.
И така, от доскорошната коалиция започват да споменават Йотова в комплект с думи като „наркодилъри“, „наркобарони“, „наркобосове“, „българския Ескобар“. Това внушава, че никой осъден за търговия с наркотици при никакви обстоятелства не заслужава помилване.
А актът на Йотова е дълбоко проблематичен, но по други причини. Първо, тя се оправдава с медицинската експертиза, макар да носи отговорност за решението. Второ и по-важно, към момента на помилването Атанасов не е бил в затвора (отново заради експертиза за здравословното му състояние). Така че и да допуснем, че наистина е бил на смъртно легло, помилването с нищо не е облекчило състоянието му. Ала влизането в такива тънки уточнения не носи точки, когато си в предизборна кампания.
От противниковия лагер пък отговарят с „претопляне“ на петроханската тема.
Само така може да се обясни пресконференцията, на която не бяха представени нови факти, но бяха направени куп внушения и квалификации. В главната роля беше криминалният психолог Росен Йорданов, според когото Калушев „отговаря на 100% от всички възможни критерии за преференциален, седуктивен, сексуален насилник“. И публично се говореше за сфинктери, включително за този на убитото дете. Отделен проблем е несъответствието на внушенията за анален секс с резултатите от медицинските експертизи на убитите край Околчица, извършени през февруари.
Скоро след пресконференцията „Епицентър“ и ПИК публикуваха експертиза за Петрохан и Околчица, съдържаща дори личните данни на деца, които може да са в уязвима ситуация. Но „всичко е в името на децата“, нали. Да не помислите, че е заради предизборната кампания. Апропо главната редакторка на „Епицентър“ Валерия Велева беше в инициативния комитет за президентската кандидатура на Йотова, но в резултат на скандала за нарушаването на журналистическата етика, последвал публикуването, тя се оттегли и комитетът се отрече от нея.
Картата с Петрохан беше използвана и от премиера Румен Радев, който употреби първия учебен ден, за да говори за „НПО, свърталище на педофили“ – стреляйки не само срещу политическите си противници, а и срещу неправителствения сектор.
Палачинката на дехуманизацията има свойството да се обръща.
Това вече изпитват на свой гръб младежите, гаврили се с Георги Кузев до смърт. Довчера се борят с „изроди педофили“, а днес тях наричат „изроди“. Друг въпрос е дали този опит би ги довел до осъзнаване на вредността на дехуманизацията. И съвсем различен въпрос – дали Ален Симеонов ще си вземе бележка.
Впрочем забелязахте ли, че той не беше сред посочените непреки отговорници за смъртта на Кузев? Това не е случайно – Ален Симеонов заслужава не параграф, а отделна статия. Която предстои.