Unlock the power of optimization in Amazon Redshift Serverless

Post Syndicated from Ricardo Serafim original https://aws.amazon.com/blogs/big-data/unlock-the-power-of-optimization-in-amazon-redshift-serverless/

Amazon Redshift Serverless automatically scales compute capacity to match workload demands, measuring this capacity in Redshift Processing Units (RPUs). Although traditional scaling primarily responds to query queue times, the new AI-driven scaling and optimization feature offers a more sophisticated approach by considering multiple factors including query complexity and data volume. Intelligent scaling addresses key data warehouse challenges by preventing both over-provisioning of resources for performance and under-provisioning to save costs, particularly for workloads that fluctuate based on daily patterns or monthly cycles.

Amazon Redshift serverless now offers enhanced flexibility in configuring workgroups through two primary methods. Users can either set a base capacity, specifying the baseline RPUs for query execution, with options ranging from 8 to 1024 RPUs and each RPU providing 16 GB of memory, or they can opt for the price-performance target. Amazon Redshift Serverless AI-driven scaling and optimization can adapt more precisely to diverse workload requirements and employs intelligent resource management, automatically adjusting resources during query execution for optimal performance. Consider using AI-driven scaling and optimization if your current workload requires 32 to 512 base RPUs. We don’t recommend using this feature for less than 32 base RPU or more than 512 base RPU workloads.

In this post, we demonstrate how Amazon Redshift Serverless AI-driven scaling and optimization impacts performance and cost across different optimization profiles.

Options in AI-driven scaling and optimization

Amazon Redshift Serverless AI-driven scaling and optimization offers an intuitive slider interface, letting you balance price and performance goals. You can select from five optimization profiles, ranging from Optimized for Cost to Optimized for Performance, as shown in the following diagram. Your slider position determines how Amazon Redshift allocates resources and implements AI-driven scaling and optimizations, to achieve your desired price-performance target.

Sliding bar

The slider offers the following options:

  1. Optimized for Cost (1)
    • Prioritizes cost savings over performance
    • Allocates minimum resources in favor of saving on costs
    • Best for workloads where performance isn’t time-critical
  2. Cost-Balanced (25)
    • Balances towards cost savings while maintaining reasonable performance
    • Allocates moderate resources
    • Suitable for mixed workloads with some flexibility in query time
  3. Balanced (50)
    • Provides equal emphasis on cost efficiency and performance
    • Allocates optimal resources for most use cases
    • Ideal for general-purpose workloads
  4. Performance-Balanced (75)
    • Favors performance while maintaining some cost control
    • Allocates additional resources when needed
    • Suitable for workloads requiring consistently fast query elapsed time
  5. Optimized for Performance (100)
    • Maximizes performance regardless of cost
    • Provides maximum available resources
    • Best for time-critical workloads requiring fastest possible query delivery

Which workloads to consider for AI-driven scaling and optimizations

The Amazon Redshift Serverless AI-driven scaling and optimization capabilities can be applied to almost every analytical workload. Amazon Redshift will assess and apply optimizations according to your price-performance target—cost, balance, or performance.

Most analytical workloads operate on millions or even billions of rows and generate aggregations and complex calculations. These workloads have high variability for query patterns and number of queries. The Amazon Redshift Serverless AI-driven scaling and optimization will improve the price, performance, or both because it learns the patterns (the repeatability of your workload) and will allocate more resources towards performance improvements if you’re performance-focused or fewer resources if you’re cost-focused.

Cost-effectiveness of AI-driven scaling and optimization

To effectively determine the effectiveness of Amazon Redshift Serverless AI-driven scaling and optimization we need to be able to measure your current state of price-performance. We encourage you to measure your current price-performance by using sys_query_history to calculate the total elapsed time of your workload and note the start time and end time. Then use sys_serverless_usage to calculate the cost. You can use the query from the Amazon Redshift documentation and add the same start and end times. This will establish your current price performance, and now you have a baseline to compare against.

If such measurement isn’t practical because your workloads are continuously running and it’s impractical for you to determine a fixed start and end time, then another way is to compare holistically, check your month over month cost, check your user sentiment towards performance, towards system stability, improvements in data delivery, or reduction in overall monthly processing times.

Benchmark conducted and results

We evaluated the optimization options using the TPCDS 3TB dataset from the AWS Labs GitHub repository (amazon-redshift-utils). We deployed this dataset across three Amazon Redshift Serverless workgroups configured as Optimized for Cost, Balanced, and Optimized for Performance. To create a realistic reporting environment, we configured three Amazon Elastic Compute Cloud (Amazon EC2) instances with JMeter (one per endpoint) and ran 15 selected TPCDS queries concurrently for approximately 1 hour, as shown in the following screenshot.

We disabled the result cache to make sure Amazon Redshift Serverless ran all queries directly, providing accurate measurements. This setup helped us capture authentic performance characteristics across each optimization profile. Also, we designed our test environment without setting the Amazon Redshift Serverless workgroup max capacity parameter—a key configuration that controls the maximum RPUs available to your data warehouse. By removing this limit, we could clearly showcase how different configurations affect scaling behavior in our test endpoints.

Jmeter

Our comprehensive test plan included running each of the 15 queries 355 times, generating 5,325 queries per test cycle. The AI-driven scaling and optimization needs multiple iterations to identify patterns and optimize RPUs, so we ran this workload 10 times. Through these repetitions, the AI learned and adapted its behavior, processing a total of 53,250 queries throughout our testing period.

The testing revealed how the AI-driven scaling and optimization system adapts and optimizes performance across three distinct configuration profiles: Optimized for Cost, Balanced, and Optimized for Performance.

Queries and elapsed time

Although we ran the same core workload repeatedly, we used variable parameters in JMeter to generate different values for the WHERE clause conditions. This approach created similar but not identical workloads, introducing natural variations that showed how the system handles real-world scenarios with varying query patterns.

Our elapsed time analysis demonstrates how each configuration achieved its performance objectives, as shown by the average consumption metrics for each endpoint, as shown in the following screenshot.

Average Elapsed Time per Endpoint

The results matched our expectations: the Optimized for Performance configuration delivered significant speed improvements, running queries approximately two times as the Balanced configuration and four times as the Optimized for Cost setup.

The following screenshots show the elapsed time breakdown for each test.

Optimized for Cost - Elapsed Time Balanced - Elapsed Time Optimized for Performance - Elapsed Time

The following screenshot shows tenth and final test iteration demonstrates distinct performance differences across configurations.

Per Configuration - Elapsed Time

To clarify more, we categorized our query elapsed times into three groups:

  • Short queries – Less than 10 seconds
  • Medium queries – From 10 seconds to 10 minutes
  • Long queries: More than 10 minutes

Considering our last test, the analysis shows:

Duration per configuration Optimized for Cost Balanced Optimized for Performance
Short queries (<10 sec) 1488 1743 3290
Medium queries (10 sec – 10 min) 3633 3579 2035
Long queries (>10 min) 204 3 0
TOTAL 5325 5325 5325

The configuration’s capacity directly impacts query elapsed time. The Optimized for Cost configuration limits resources to save money, resulting in longer query times, making it best suited for workloads that aren’t time critical, where cost savings are prioritized. The Balanced configuration provides moderate resource allocation, striking a middle ground by effectively handling medium-duration queries and maintaining reasonable performance for short queries while nearly eliminating long-running queries. In contrast, the Optimized for Performance configuration allocates more resources, which increases costs but delivers faster query results, making it best for latency-sensitive workloads where query speed is critical.

Capacity used during the tests

Our comparison of the three configurations reveals how Amazon Redshift Serverless AI-driven scaling and optimization technology adapts resource allocation to meet user expectations. The monitoring showed both Base RPU variations and distinct scaling patterns across configurations—scaling up aggressively for faster performance or maintaining lower RPUs to optimize costs.

The Optimized for Cost configuration starts at 128 RPUs and increases to 256 RPUs after three tests. To maintain cost-efficiency, this setup limits the maximum RPU allocation during scaling, even when facing query queuing.

In the following table, we can observe the costs for this Optimized for Cost configuration.

Test# Starting RPUs Scaled up to Cost incurred
1 128 1408  $254.17
2 128 1408  $258.39
3 128 1408  $261.92
4 256 1408  $245.57
5 256 1408  $247.11
6 256 1408  $257.25
7 256 1408  $254.27
8 256 1408  $254.27
9 256 1408  $254.11
10 256 1408  $256.15

The strategic RPU allocation by Amazon Redshift Serverless helps optimize costs, as demonstrated in tests 3 and 4, where we observed significant cost savings. This is shown in the following graph.

Optimized for Cost - Cost Average

Although the optimization for cost changed the base RPU, the balanced configuration didn’t change the base RPUs but scaled up to 2176, further than the 1408 RPUs that were the maximum used by the cost optimization setup. The following table shows the figures for the Balanced configuration.

Test# Starting RPUs Scaled up to Cost incurred
1 192 2176  $261.48
2 192 2112  $270.90
3 192 2112  $265.26
4 192 2112  $260.20
5 192 2112  $262.12
6 192 2112  $253.18
7 192 2112  $272.80
8 192 2112  $272.80
9 192 2112  $263.72
10 192 2112  $243.28

The Balanced configuration, averaging $262.57 per test, delivered significantly better performance while costing only 3% more than the Optimized for Cost configuration, which averaged $254.32 per test. As demonstrated in the previous section, this performance advantage is evident in the elapsed time comparisons. The following graph shows the costs for the Balanced configuration.

Balanced - Cost Average

As expected from the Optimized for Performance configuration, the usage of resources was higher to attend the high performance. In this configuration, we can also observe that after two tests, the engine adapted itself to start with a higher number of RPUs to attend the queries faster.

Test# Starting RPUs Scaled Up to Cost incurred
1 512 2753  $295.07
2 512 2327  $280.29
3 768 2560  $333.52
4 768 2991  $295.36
5 768 2479  $308.72
6 768 2816  $324.08
7 768 2413  $300.45
8 768 2413  $300.45
9 768 2107  $321.07
10 768 2304  $284.93

Despite a 19% cost increase in the third test, most subsequent tests remained below the $304.39 average cost.

Optimized for Performance - Cost Average

The Optimized for Performance configuration maximizes resource usage to achieve faster query times, prioritizing speed over cost efficiency.

The final cost-performance analysis reveals compelling results:

  • The Balanced configuration delivered twofold better performance while costing only 3.25% more than the Optimized for Cost setup
  • The Optimized for Performance configuration achieved fourfold faster elapsed time with a 19.39% cost increase compared to the Optimized for Cost option.

The following chart illustrates our cost-performance findings:

Average Billing and Elapsed Time per Endpoint

It’s important to note that these results reflect our specific test scenario. Each workload has unique characteristics, and the performance and cost differences between configurations might vary significantly in other use cases. Our findings serve as a reference point rather than a universal benchmark. Additionally, we didn’t test two intermediate configurations available in Amazon Redshift Serverless: one between Optimized for Cost and Balanced, and another between Balanced and Optimized for Performance.

Conclusion

The test results demonstrate the effectiveness of Amazon Redshift Serverless AI-driven scaling and optimization across different workload requirements. These findings highlight how Amazon Redshift Serverless AI-driven scaling and optimization can help organizations find their ideal balance between cost and performance. Although our test results serve as a reference point, each organization should evaluate their specific workload requirements and price-performance targets. The flexibility of five different optimization profiles, combined with intelligent resource allocation, enables teams to fine-tune their data warehouse operations for optimal efficiency.

To get started with Amazon Redshift Serverless AI-driven scaling and optimization, we recommend:

  1. Establishing your current price-performance baseline
  2. Identifying your workload patterns and requirements
  3. Testing different optimization profiles with your specific workloads
  4. Monitoring and adjusting based on your results

By using these capabilities, organizations can achieve better resource utilization while meeting their specific performance and cost objectives.

Ready to optimize your Amazon Redshift Serverless workloads? Visit the AWS Management Console today to create your own Amazon Redshift Serverless AI-driven scaling and optimization to start exploring the different optimization profiles. For more information, check out our documentation on Amazon Redshift Serverless AI-driven scaling and optimization, or contact your AWS account team to discuss your specific use case.


About the Authors

Ricardo Serafim Ricardo Serafim is a Senior Analytics Specialist Solutions Architect at AWS. He has been helping companies with Data Warehouse solutions since 2007.

Milind Oke Milind Oke is a Data Warehouse Specialist Solutions Architect based out of New York. He has been building data warehouse solutions for over 15 years and specializes in Amazon Redshift.

Andre HassAndre Hass is a Senior Technical Account Manager at AWS, specialized in AWS Data Analytics workloads. With more than 20 years of experience in databases and data analytics, he helps customers optimize their data solutions and navigate complex technical challenges. When not immersed in the world of data, Andre can be found pursuing his passion for outdoor adventures. He enjoys camping, hiking, and exploring new destinations with his family on weekends or whenever an opportunity arises.

DeepSeek-R1 now available as a fully managed serverless model in Amazon Bedrock

Post Syndicated from Channy Yun (윤석찬) original https://aws.amazon.com/blogs/aws/deepseek-r1-now-available-as-a-fully-managed-serverless-model-in-amazon-bedrock/

As of January 30, DeepSeek-R1 models became available in Amazon Bedrock through the Amazon Bedrock Marketplace and Amazon Bedrock Custom Model Import. Since then, thousands of customers have deployed these models in Amazon Bedrock. Customers value the robust guardrails and comprehensive tooling for safe AI deployment. Today, we’re making it even easier to use DeepSeek in Amazon Bedrock through an expanded range of options, including a new serverless solution.

The fully managed DeepSeek-R1 model is now generally available in Amazon Bedrock. Amazon Web Services (AWS) is the first cloud service provider (CSP) to deliver DeepSeek-R1 as a fully managed, generally available model. You can accelerate innovation and deliver tangible business value with DeepSeek on AWS without having to manage infrastructure complexities. You can power your generative AI applications with DeepSeek-R1’s capabilities using a single API in the Amazon Bedrock’s fully managed service and get the benefit of its extensive features and tooling.

According to DeepSeek, their model is publicly available under MIT license and offers strong capabilities in reasoning, coding, and natural language understanding. These capabilities power intelligent decision support, software development, mathematical problem-solving, scientific analysis, data insights, and comprehensive knowledge management systems.

As is the case for all AI solutions, give careful consideration to data privacy requirements when implementing in your production environments, check for bias in output, and monitor your results. When implementing publicly available models like DeepSeek-R1, consider the following:

  • Data security – You can access the enterprise-grade security, monitoring, and cost control features of Amazon Bedrock that are essential for deploying AI responsibly at scale, all while retaining complete control over your data. Users’ inputs and model outputs aren’t shared with any model providers. You can use these key security features by default, including data encryption at rest and in transit, fine-grained access controls, secure connectivity options, and download various compliance certifications while communicating with the DeepSeek-R1 model in Amazon Bedrock.
  • Responsible AI – You can implement safeguards customized to your application requirements and responsible AI policies with Amazon Bedrock Guardrails. This includes key features of content filtering, sensitive information filtering, and customizable security controls to prevent hallucinations using contextual grounding and Automated Reasoning checks. This means you can control the interaction between users and the DeepSeek-R1 model in Bedrock with your defined set of policies by filtering undesirable and harmful content in your generative AI applications.
  • Model evaluation – You can evaluate and compare models to identify the optimal model for your use case, including DeepSeek-R1, in a few steps through either automatic or human evaluations by using Amazon Bedrock model evaluation tools. You can choose automatic evaluation with predefined metrics such as accuracy, robustness, and toxicity. Alternatively, you can choose human evaluation workflows for subjective or custom metrics such as relevance, style, and alignment to brand voice. Model evaluation provides built-in curated datasets, or you can bring in your own datasets.

We strongly recommend integrating Amazon Bedrock Guardrails and using Amazon Bedrock model evaluation features with your DeepSeek-R1 model to add robust protection for your generative AI applications. To learn more, visit Protect your DeepSeek model deployments with Amazon Bedrock Guardrails and Evaluate the performance of Amazon Bedrock resources.

Get started with the DeepSeek-R1 model in Amazon Bedrock
If you’re new to using DeepSeek-R1 models, go to the Amazon Bedrock console, choose Model access under Bedrock configurations in the left navigation pane. To access the fully managed DeepSeek-R1 model, request access for DeepSeek-R1 in DeepSeek. You’ll then be granted access to the model in Amazon Bedrock.

Next, to test the DeepSeek-R1 model in Amazon Bedrock, choose Chat/Text under Playgrounds in the left menu pane. Then choose Select model in the upper left, and select DeepSeek as the category and DeepSeek-R1 as the model. Then choose Apply.

Using the selected DeepSeek-R1 model, I run the following prompt example:

A family has $5,000 to save for their vacation next year. They can place the money in a savings account earning 2% interest annually or in a certificate of deposit earning 4% interest annually but with no access to the funds until the vacation. If they need $1,000 for emergency expenses during the year, how should they divide their money between the two options to maximize their vacation fund?

This prompt requires a complex chain of thought and produces very precise reasoning results.

To learn more about usage recommendations for prompts, refer to the README of the DeepSeek-R1 model in its GitHub repository.

By choosing View API request, you can also access the model using code examples in the AWS Command Line Interface (AWS CLI) and AWS SDK. You can use us.deepseek.r1-v1:0 as the model ID.

Here is a sample of the AWS CLI command:

aws bedrock-runtime invoke-model \
     --model-id us.deepseek-r1-v1:0 \
     --body "{\"messages\":[{\"role\":\"user\",\"content\":[{\"type\":\"text\",\"text\":\"[n\"}]}],max_tokens\":2000,\"temperature\":0.6,\"top_k\":250,\"top_p\":0.9,\"stop_sequences\":[\"\\n\\nHuman:\"]}" \
     --cli-binary-format raw-in-base64-out \
     --region us-west-2 \
     invoke-model-output.txt

The model supports both the InvokeModel and Converse API. The following Python code examples show how to send a text message to the DeepSeek-R1 model using the Amazon Bedrock Converse API for text generation.

import boto3
from botocore.exceptions import ClientError

# Create a Bedrock Runtime client in the AWS Region you want to use.
client = boto3.client("bedrock-runtime", region_name="us-west-2")

# Set the model ID, e.g., Llama 3 8b Instruct.
model_id = "us.deepseek.r1-v1:0"

# Start a conversation with the user message.
user_message = "Describe the purpose of a 'hello world' program in one line."
conversation = [
    {
        "role": "user",
        "content": [{"text": user_message}],
    }
]

try:
    # Send the message to the model, using a basic inference configuration.
    response = client.converse(
        modelId=model_id,
        messages=conversation,
        inferenceConfig={"maxTokens": 2000, "temperature": 0.6, "topP": 0.9},
    )

    # Extract and print the response text.
    response_text = response["output"]["message"]["content"][0]["text"]
    print(response_text)

except (ClientError, Exception) as e:
    print(f"ERROR: Can't invoke '{model_id}'. Reason: {e}")
    exit(1)

To enable Amazon Bedrock Guardrails on the DeepSeek-R1 model, select Guardrails under Safeguards in the left navigation pane, and create a guardrail by configuring as many filters as you need. For example, if you filter for “politics” word, your guardrails will recognize this word in the prompt and show you the blocked message.

4. Apply the Bedrock Guardrails to the DeepSeek-R1 model

You can test the guardrail with different inputs to assess the guardrail’s performance. You can refine the guardrail by setting denied topics, word filters, sensitive information filters, and blocked messaging until it matches your needs.

To learn more about Amazon Bedrock Guardrails, visit Stop harmful content in models using Amazon Bedrock Guardrails in the AWS documentation or other deep dive blog posts about Amazon Bedrock Guardrails on the AWS Machine Learning Blog channel.

Here’s a demo walkthrough highlighting how you can take advantage of the fully managed DeepSeek-R1 model in Amazon Bedrock:

Now available
DeepSeek-R1 is now available fully managed in Amazon Bedrock in the US East (N. Virginia), US East (Ohio), and US West (Oregon) AWS Regions through cross-Region inference. Check the full Region list for future updates. To learn more, check out the DeepSeek in Amazon Bedrock product page and the Amazon Bedrock pricing page.

Give the DeepSeek-R1 model a try in the Amazon Bedrock console today and send feedback to AWS re:Post for Amazon Bedrock or through your usual AWS Support contacts.

— Channy

Updated on March 10, 2025 — Fixed a screenshot of model selection and model ID.

Кога кредитът е с най-ниска лихва?

Post Syndicated from VassilKendov original https://kendov.com/%D0%BA%D0%BE%D0%B3%D0%B0-%D0%BA%D1%80%D0%B5%D0%B4%D0%B8%D1%82%D1%8A%D1%82-%D0%B5-%D1%81-%D0%BD%D0%B0%D0%B9-%D0%BD%D0%B8%D1%81%D0%BA%D0%B0-%D0%BB%D0%B8%D1%85%D0%B2%D0%B0/

Лихвата е един от най-рекламираните атрибути на кредита, макар далеч да не е единствения, който формира цената. Така или иначе банките се напреварват да дават по-ниски лихви, но все пак видът на кредита е от основно значение. В това видео разглеждаме различните видове кредит и как се формира лихвата по тях

Януари 2025 официално стартирах Youtube канала Kendov.com където се заформятмного добри дискусии.
Абонирайте се за канала, ако кредитирането и застраховането са в сферата Ви на интереси.

Прилагам линка за канала в Youtube https://www.youtube.com/@vassilkendov8910

The post Кога кредитът е с най-ниска лихва? appeared first on KENDOV.COM.

AWS Weekly Roundup: Amazon Q CLI agent, AWS Step Functions, AWS Lambda, and more (March 10, 2025)

Post Syndicated from Danilo Poccia original https://aws.amazon.com/blogs/aws/aws-weekly-roundup-amazon-q-cli-agent-aws-step-functions-aws-lambda-and-more-march-10-2025/

As the weather improves in the Northern hemisphere, there are more opportunities to learn and connect. This week, I’ll be in San Francisco, and we can meet at the Nova Networking Night at the AWS GenAI Loft where we’ll dive into the world of Amazon Nova foundation models (FMs) with live demos and real-world implementations.

AWS Pi Day is now a yearly tradition. It started in 2021 as a celebration of the 15th anniversary of Amazon S3. This year, there will be in-depth discussions with AWS product teams on how to build a data foundation for a unified seamless experience, managing and using data for analytics and AI workloads. Join us online to learn about the latest innovations through hands-on demos, and ask questions during our interactive livestream.

Last week’s launches
Another busy week, here are the launches that got my attention.

Amazon Q Developer – You can now use an enhanced agent within the Amazon Q command line interface (CLI) to give you more dynamic conversations, help you read and write files locally, query AWS resources, or create code. This enhanced CLI agent is powered by Anthropic’s most intelligent model to date, Claude 3.7 Sonnet. Read more about this agenic coding experience and how to try it out. Here’s a visual demo of the new capabilities of Amazon Q CLI, by Nathan Peck.

Amazon Q Business – Now supports the ingestion of audio and video data. This capability streamlines information retrieval, enhances knowledge sharing, and improves decision-making processes, by making multimedia content as searchable and accessible as text-based documents.

Amazon Bedrock – Bedrock Data Automation is now generally available, so you can automate the generation of valuable insights from unstructured multimodal content such as documents, images, video, and audio files. Learn more and see code examples in my blog post. Amazon Bedrock Knowledge Bases support for GraphRAG is now also generally available. GraphRAG is a capability that enhances Retrieval-Augmented Generation (RAG) by incorporating graph data and delivers more comprehensive, relevant, and explainable responses by leveraging relationships within your data, improving how Generative AI applications retrieve and synthesize information.

Amazon Nova – The Amazon Nova Pro foundation model now supports latency-optimized inference in preview on Amazon Bedrock, enabling faster response times and improved responsiveness for generative AI applications.

AWS Step Functions – Workflow Studio for VS Code is now available, a visual builder you can use to compose workflows on a canvas. You can generate workflow definitions in the background to create workflows in your local development environment. Read more about this enhanced local IDE experience.

AWS Lambda – Now supports Amazon CloudWatch Logs Live Tail in VS Code. We previously introduced support for Live Tail in the Lambda console to simplify how you can view and analyze Lambda logs in real time. Now, you can also monitor Lambda function logs in real time while staying within the VS Code development environment.

AWS Amplify – Now supports HttpOnly cookies for server-rendered Next.js applications when using Amazon Cognito’s managed login. Because cookies with the HttpOnly attribute can’t be accessed by JavaScript, your applications can gain an additional layer of protection against cross-site scripting (XSS) attacks.

Amazon Cognito – You can now customize access tokens for machine-to-machine (M2M) flows, enabling you to implement fine-grained authorization in your applications, APIs, and workloads. M2M authorization is commonly used for automated processes such as scheduled data synchronization tasks, event-driven workflows, microservices communication, or real-time data streaming between systems.

AWS CodeBuild – Now supports builds on Linux x86, Arm, and Windows on-demand fleets directly on the host operating system without containerization. In this way, you can now execute build commands that require direct access to the host system resources or have specific requirements that make containerization challenging. For example, this is useful when building device drivers, running system-level tests, or working with tools that require host machine access. CodeBuild has also added support for Node 22, Python 3.13, and Go 1.23 in Linux x86, Arm, Windows, and macOS platforms.

Bottlerocket – The open source Linux-based operating system purpose-built for containers now supports NVIDIA’s Multi-Instance GPU (MIG) to help partition NVIDIA GPUs into multiple GPU instances on Kubernetes nodes and maximize GPU resource utilization. Bottlerocket now also supports AWS Neuron accelerated instance types and provides a default bootstrap container image that simplifies system setup tasks.

Amazon GameLift – Introducing Amazon GameLift Streams, a new managed capability that developers can use to stream games at up to 1080p resolution and 60 frames per second to any device with a WebRTC-enabled browser. To learn more, explore Donnie’s blog post.

Amazon FSx for NetApp ONTAP – Starting March 5, 2025, the SnapLock licensing fees for data stored in SnapLock volumes has been eliminated, making it more cost-effective.

Other AWS news
Here are some additional projects, blog posts, and news items that you might find interesting:

Accelerate AWS Well-Architected reviews with Generative AI – In this post, we explore a generative AI solution to streamline the Well-Architected Framework Reviews (WAFRs) process. We demonstrate how to build an intelligent, scalable system that analyzes architecture documents and generates insightful recommendations based on best practices.

Architectural diagram

Build a Multi-Agent System with LangGraph and Mistral on AWS – The Multi-Agent City Information System demonstrated in this post exemplifies the potential of agent-based architectures to create sophisticated, adaptable, and highly capable AI applications.

Reference architecture

Evaluate RAG responses with Amazon Bedrock, LlamaIndex and RAGAS – How to enhance your Retrieval Augmented Generation (RAG) implementations with practical techniques to evaluate and optimize your AI systems and enable more accurate, context-aware responses that align with your specific needs.

Architectural diagram

From community.aws
Here are some of my favorite posts from community.aws. Create your AWS Builder ID to start sharing your tips and connect with fellow builders. Your Builder ID is a universal login credential that gives you access, beyond the AWS Management Console, to AWS tools and resources, including over 600 free training courses, community features, and developer tools such as Amazon Q Developer.

Optimize AWS Lambda Costs with Automated Compute Optimizer Insights (Zechariah Kasina) – An automated and scalable method for optimizing AWS Lambda memory configurations to enhance cost efficiency and performance.

Optimize AWS Costs: Auto-Shutdown for EC2 Instances (Adeleke Adebowale Julius) – Using Amazon CloudWatch alarms to dynamically shut down instances based on inactivity.

The Evolution of the Developer Role in an AI-Assisted Future (Aaron Sempf) – While AI is transforming software development, the need for developing talent remains crucial.

Amazon Q Developer CLI – More coffee, less remembering commands (Cobus Bernard) – Now that you can use Amazon Q Developer directly from your terminal to interact with your files, so let’s add some convenience automations.

Upcoming AWS events
Check your calendars and sign up for these upcoming AWS events:

AWS Community Days – Join community-led conferences that feature technical discussions, workshops, and hands-on labs led by expert AWS users and industry leaders from around the world: Milan, Italy (April 2), Bay Area – Security Edition (April 4), Timișoara, Romania (April 10), and Prague, Czech Republic (April 29).

AWS Innovate: Generative AI + Data – Join a free online conference focusing on generative AI and data innovations. Available in multiple geographic regions: North America (March 13), Greater China Region (March 14), and Latin America (April 8).

AWS Summits – The AWS Summit season is coming along! Join free online and in-person events that bring the cloud computing community together to connect, collaborate, and learn about AWS. Register in your nearest city: Paris (April 9), Amsterdam (April 16), London (April 30), and Poland (May 5).

AWS re:Inforce (June 16–18) – Our annual learning event devoted to all things AWS Cloud security. This year is in Philadelphia, PA. Registration opens in March, so be ready to join more than 5,000 security builders and leaders.

AWS DevDays are free, technical events where developers can learn about some of the hottest topics in cloud computing. DevDays offer hands-on workshops, technical sessions, live demos, and networking with AWS technical experts and your peers. Register to access AWS DevDays sessions on demand.

That’s all for this week. Check back next Monday for another Weekly Roundup!

– Danilo

This post is part of our Weekly Roundup series. Check back each week for a quick roundup of interesting news and announcements from AWS!

—

How is the News Blog doing? Take this 1 minute survey!

(This survey is hosted by an external company. AWS handles your information as described in the AWS Privacy Notice. AWS will own the data gathered via this survey and will not share the information collected with survey respondents.)

Python tail-call speedup based on LLVM regression

Post Syndicated from daroc original https://lwn.net/Articles/1013581/

The Python project’s recent switch to a tail-calling interpreter may not provide as large a speed advantage as initially thought. A blog post from Nelson Elhage gives the details. In short, switching to a tail-call-based interpreter accidentally works around an unfixed regression in LLVM 19. On other compilers, the performance benefit (while still present) is more moderate.

When the tail-call interpreter was announced, I was surprised and impressed by the performance improvements, but also confused: I’m not an expert, but I’m passingly-familiar with modern CPU hardware, compilers, and interpreter design, and I couldn’t explain why this change would be so effective. I became curious – and perhaps slightly obsessed – and the reports in this post are the result of a few weeks of off-and-on compiling and benchmarking and disassembly of dozens of different Python binaries, in an attempt to understand what I was seeing.

[$] Capability analysis for the kernel

Post Syndicated from corbet original https://lwn.net/Articles/1012990/

One of the advantages of the Rust type system is its ability to encapsulate
requirements about the state of the program in the type system;
often, this state includes which locks must be held to be able to carry out
specific operations. C lacks the ability to express these
requirements, but there would be obvious benefits if that kind of feature
could be grafted onto the language. The Clang compiler has made some
strides in that direction with its thread-safety
analysis
feature; two developers have been independently working to
take advantage of that work for the kernel.

Global expansion in Generative AI: a year of growth, newcomers, and attacks

Post Syndicated from João Tomé original https://blog.cloudflare.com/global-expansion-in-generative-ai-a-year-of-growth-newcomers-and-attacks/

AI (Artificial Intelligence) is a broad concept encompassing machines that simulate or duplicate human cognitive tasks, with Machine Learning (ML) serving as its data-driven engine. Both have existed for decades but gained fresh momentum when Generative AI, AI models that can create text, images, audio, code, and video, surged in popularity following the release of OpenAI’s ChatGPT in late 2022. In this blog post, we examine the most popular Generative AI services and how they evolved throughout 2024 and early 2025. We also try to answer questions like how much traffic growth these Generative AI websites have experienced from Cloudflare’s perspective, how much of that traffic was malicious, and other insights.

To accomplish this, we use aggregated data from our 1.1.1.1 DNS resolver to measure the popularity of specific Generative AI services. We typically do this for our Year in Review and now also on the DNS domain rankings page of Cloudflare Radar, where we aggregate related domains for each service and identify sites that provide services to users. For overall traffic growth and attack trends, we rely on aggregated data from the cohort of Generative AI customers that use Cloudflare for performance (including AI inference) and security.

Key takeaways:

  • ChatGPT maintains the top spot: OpenAI’s ChatGPT remains #1 in Generative AI popularity, hovering around the top 50 Internet domains overall, up from #200 in late 2023.

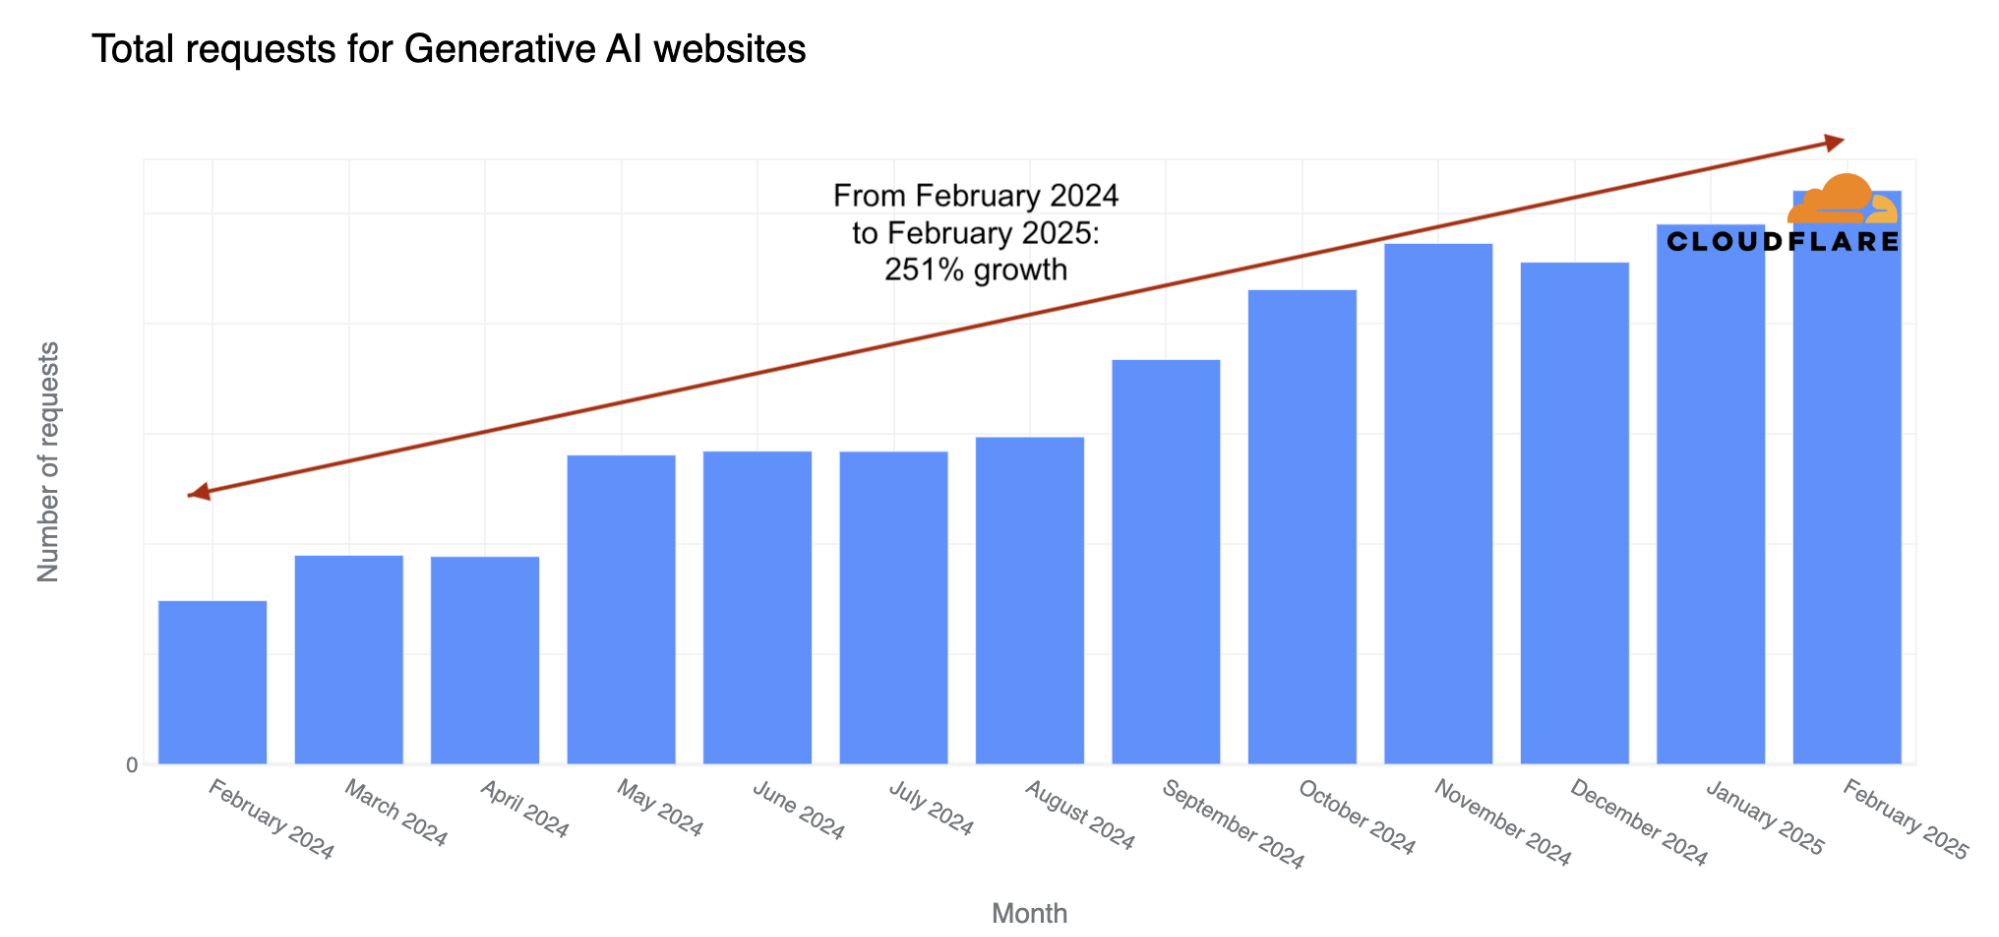
  • Rapid traffic growth: Monthly traffic to Generative AI services grew by 251% over the past year, between February 1, 2024, and March 1, 2025.

  • New entrants on the rise: Chinese chatbot DeepSeek and Grok/xAI quickly climbed the ranks, illustrating how fast newcomers can gain traction in the AI space.

  • Global reach with regional variations: The U.S. leads with 23% of Generative AI visitors, but Asia dominates certain platforms like poe.com. Brazil also shows up as a strong user of multiple AI services.

  • Targeted by cyberattacks: Over 197 billion potential attack requests were blocked by Cloudflare in the past year, with 39 billion part of DDoS attack campaigns — particularly affecting general AI chatbots and image-generation sites.

Generative AI services popularity ranking: new kids in town

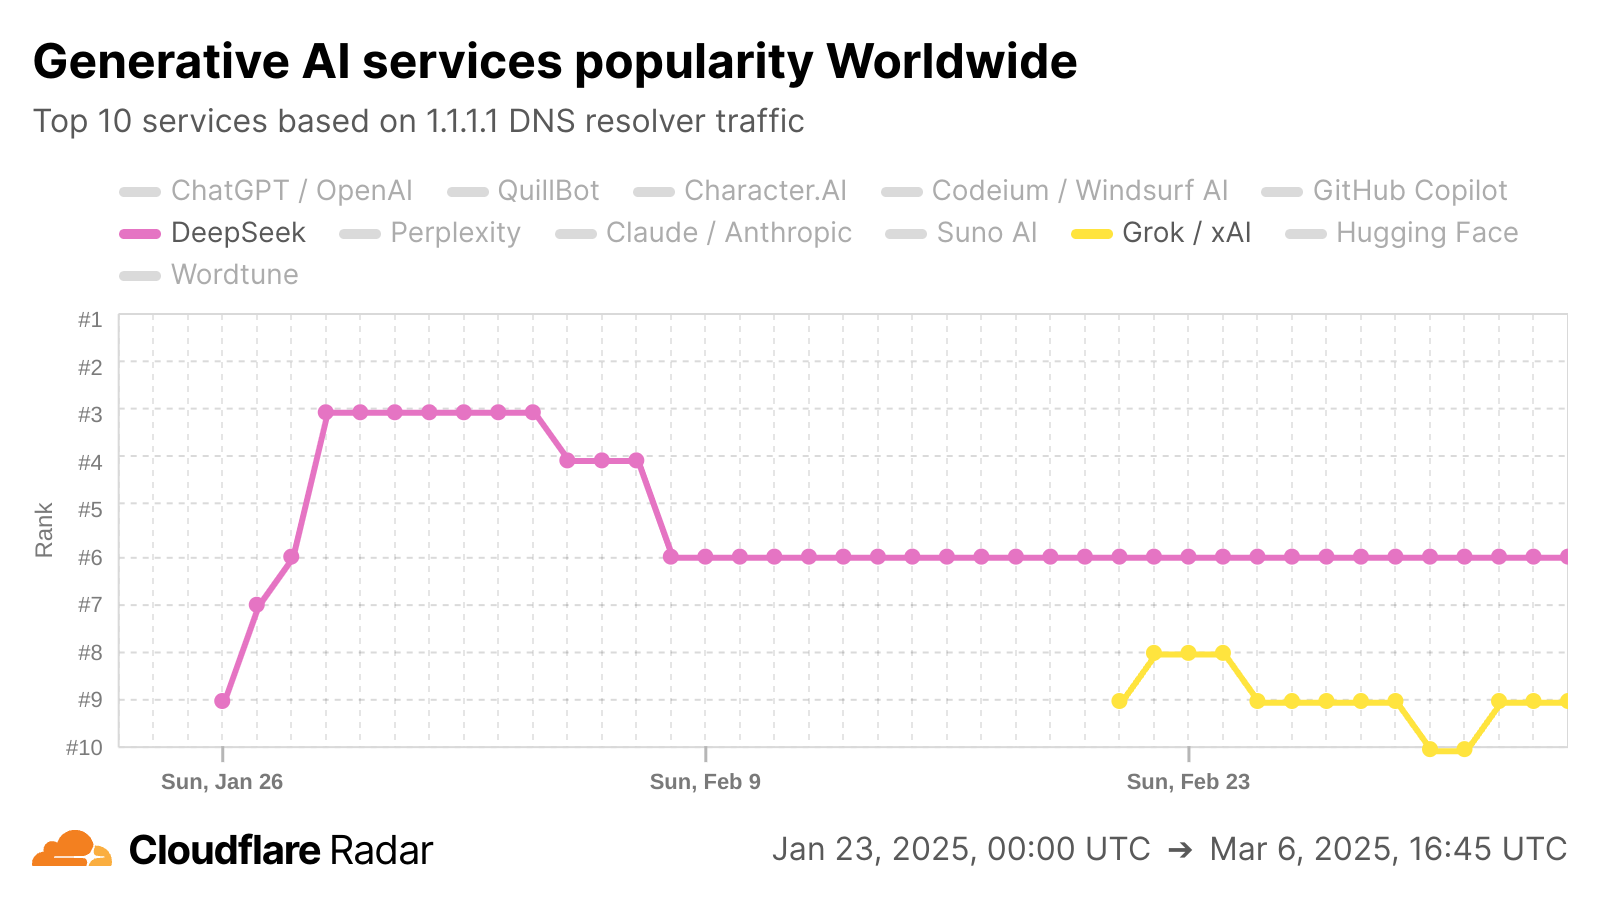
We begin by looking at Generative AI service popularity using the new AI tab on Cloudflare Radar. The newest entrant to our Top 10 is DeepSeek, a Chinese chatbot launched on January 10, 2025. It debuted at #9 on January 26, 2025, climbed to #3 on January 29 (coinciding with Lunar/Chinese New Year), and maintained that position until February 4, before settling at its current position of #6. 


Also highlighted here is another AI chatbot that has recently gained popularity — X’s Grok/xAI. This Generative AI service released its Android app in February and gained attention after February 17, 2025, when it launched the Grok-3 model. In our Generative AI ranking, it first entered the top 10 on February 21, 2025, at #9, briefly reached Claude’s typical spot at #8, and is now fluctuating between #9 and #10.

Here is the current Generative AI Top 10 from the Cloudflare Radar AI page, as of March 9, 2025, with ChatGPT/OpenAI as #1 since the start of the year (a trend also observed in previous years, as the table below shows).

To make ranking changes and trends easier to spot, the table below shows the February 1 – March 1, 2025 (monthly average) standings on the left, with color-coded comparisons to 2024’s list: services that dropped since 2024 appear in red, while new or higher-ranked ones appear in green. For reference, the second column presents the top 10 from our 2024 Year in Review (including comparisons to the previous year), and the third column displays the 2023 Top 10.

Top 10 Generative AI services 
in February 2025
ChatGPT / OpenAI (=)
Character.AI (=)
QuillBot (#4 in 2024)
Codeium (#3)
GitHub Copilot (#7)
DeepSeek (new)
Perplexity (#6)
Claude / Anthropic (#5)
Hugging Face (new)
Suno AI (new)
Top 10 Generative AI services in 2024 (Radar Year in Review)

ChatGPT / OpenAI (=)
Character.AI (=)
Codeium (new)
QuillBot (#3 in 2023)
Claude / Anthropic (new)
Perplexity (=)
GitHub Copilot (new)
Wordtune (#7)
Poe (#5)
Tabnine (new)

Top 10 Generative AI services in 2023 (Radar Year in Review)
ChatGPT / OpenAI
Character.AI
QuillBot
Hugging Face
Poe
Perplexity
Wordtune
Google Bard
ProWritingAid
Voicemod

Other than the previously mentioned DeepSeek, Grok/xAI and ChatGPT/OpenAI, the top 10 includes other chatbots like Anthropic’s Claude, as well as other types of Generative AI services. Character.AI — a specialized platform for creating and interacting with character-based personalities — is #2, then there’s Perplexity (#7) that functions as an AI search engine, while QuillBot (#3) is an AI-powered writing assistant for paraphrasing, grammar, and summarizing. Codeium (4#), which includes developer productivity services like Windsurf AI, and GitHub Copilot (#5) serve as AI coding assistants.

There’s also Hugging Face (#9), an open-source hub for AI models (we’re including it here as a Generative AI platform, just as we do for other AI model enablers like Replicate and Stability AI), and Suno AI (#10), a music generator that creates songs from text prompts.

We saw that Grok/xAI entered the top 10 during the last days of February, but since we’re using February’s monthly average, it appears at #11 here. Curious about the rest of the February 2025 Top 20? Here it is, with AI coding services having a strong presence — beyond Codeium and GitHub Copilot, Sider AI and Tabnine also make the list.

11 Grok / xAI

12 Poe

13 Sider AI

14 Civitai

15 Tabnine

16 Google Gemini

17 Voicemod

18 GliaCloud

19 Runway ml

20 Midjourney

We have published Generative AI popularity rankings in both the 2023 and 2024 Cloudflare Radar Year in Review, and in both, OpenAI’s ChatGPT has consistently held the #1 spot. In 2024, as explained in our blog post, ChatGPT also moved in our overall rankings, nearly breaking into the top 50 by the end of the year. (It was just outside the top 100 in 2023).

ChatGPT’s influence in the overall ranking 

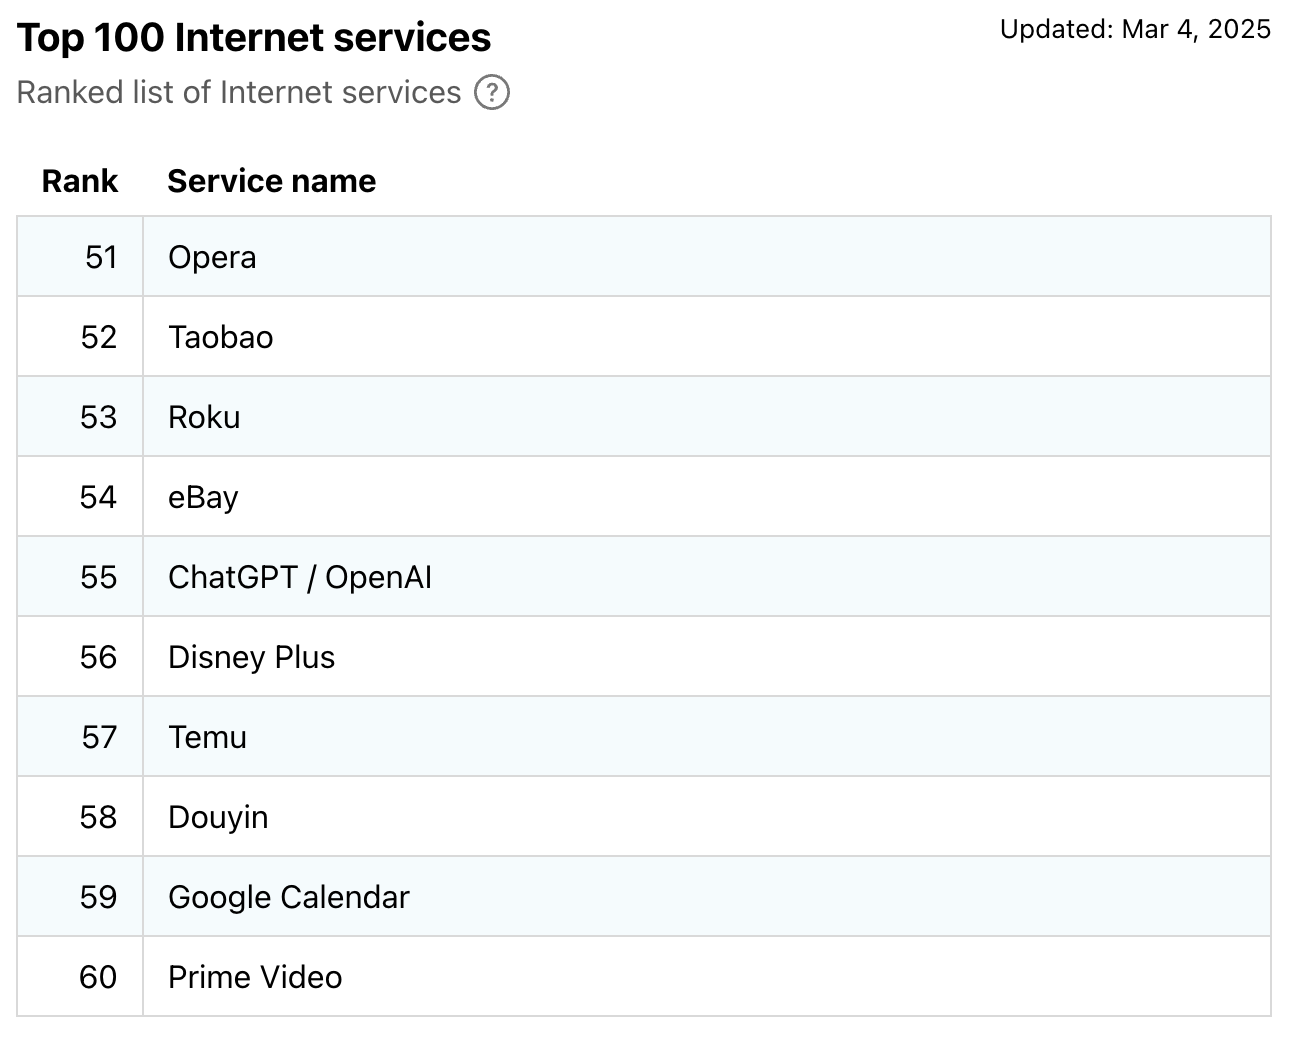
A recent addition to Cloudflare Radar is the updated domains ranking page in our DNS section, which includes a number of detailed trends. There, we now show the top 100 overall Internet services ranking next to a top 100 domains list. ChatGPT / OpenAI, the leading Generative AI service, is typically ranked in the mid-50’s on weekdays and close to #60 on weekends (based on early March 2025 insights), next to non-AI services like Temu, eBay, or Disney Plus.


Looking at previous trends, as noted in our  Year in Review blog, ChatGPT / OpenAI ranked around #200 in early 2023 and climbed to near the top 100 by the end of the year. In 2024, it started just outside the top 100, reached the top 60 in May with the release of the 4o model, and has been near the top 50 since September 2024, aligning with the return of employees and students to their routines.

Visitor location distribution: Americas, Europe and Asia

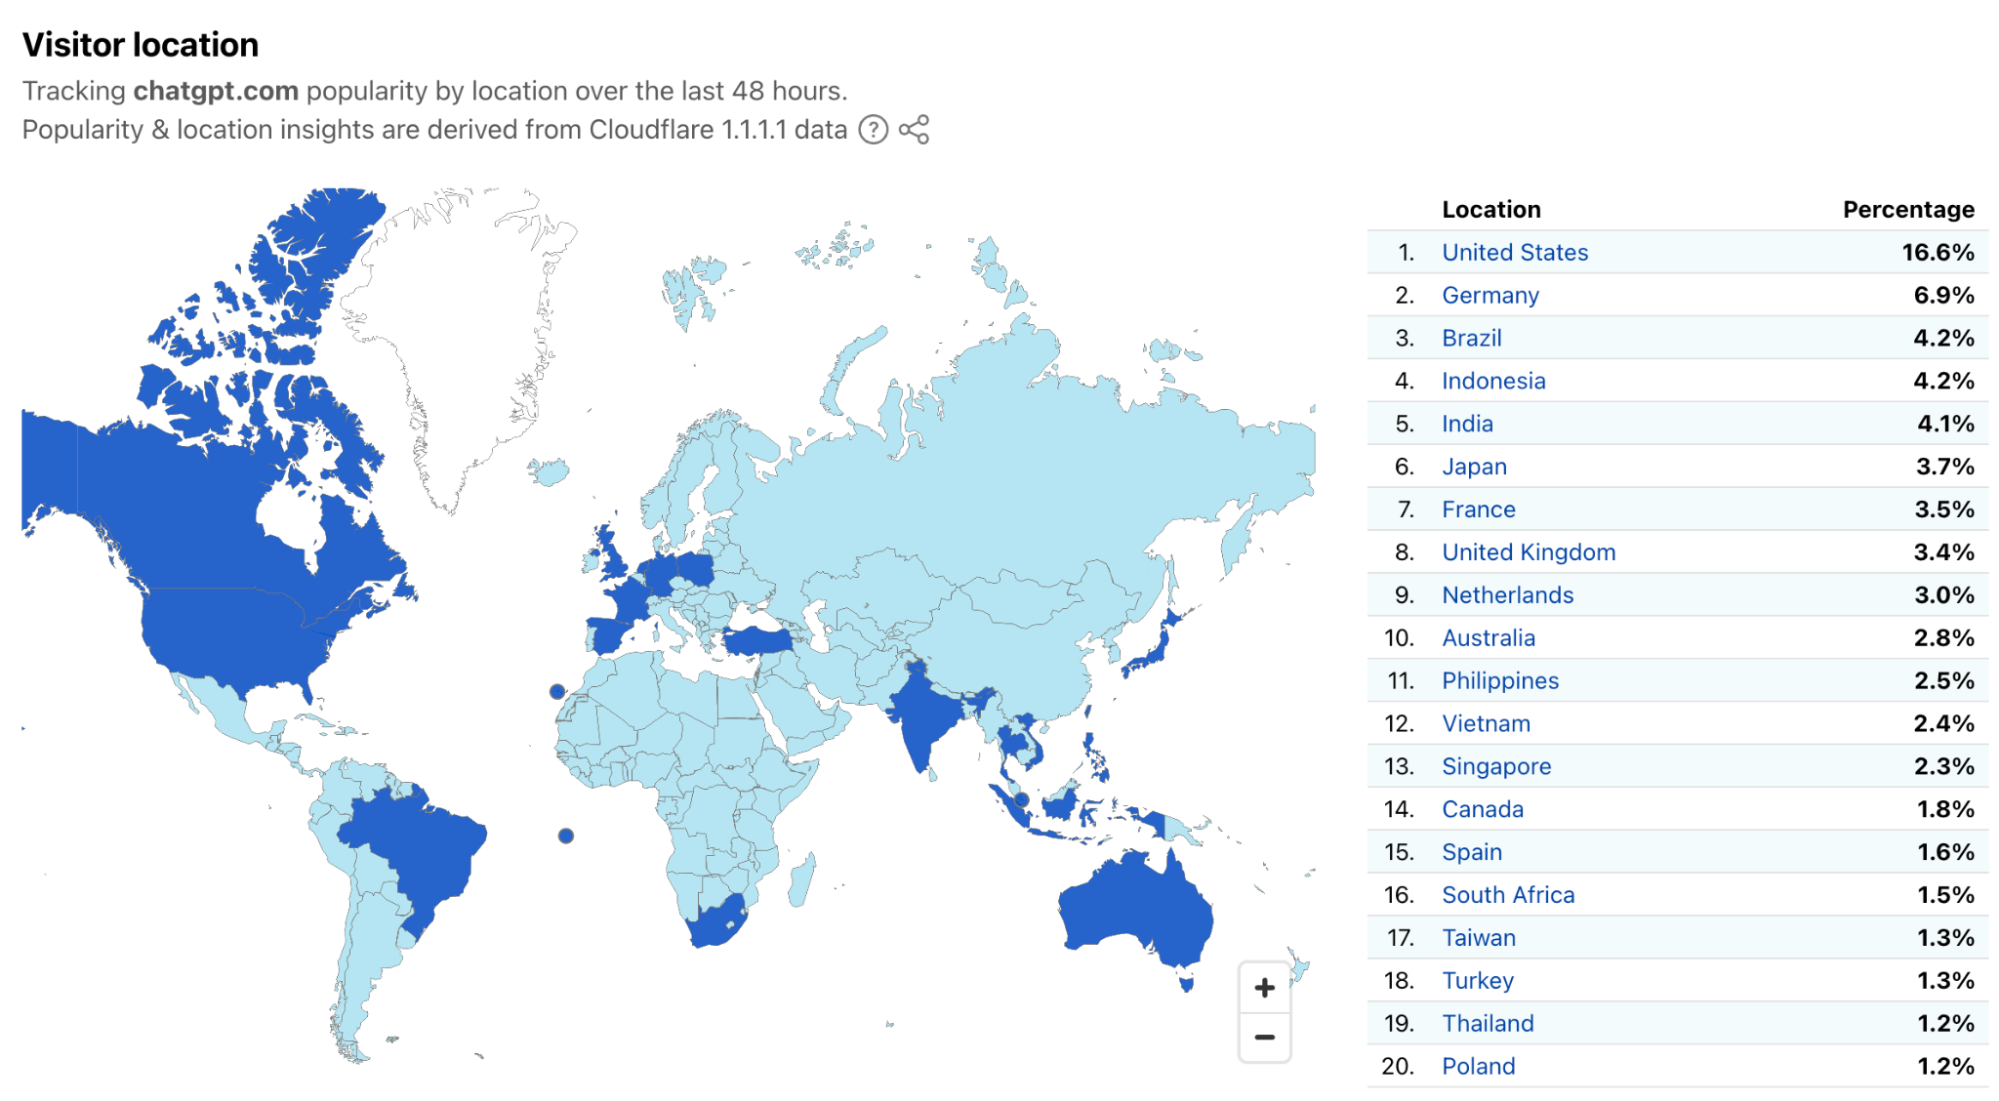
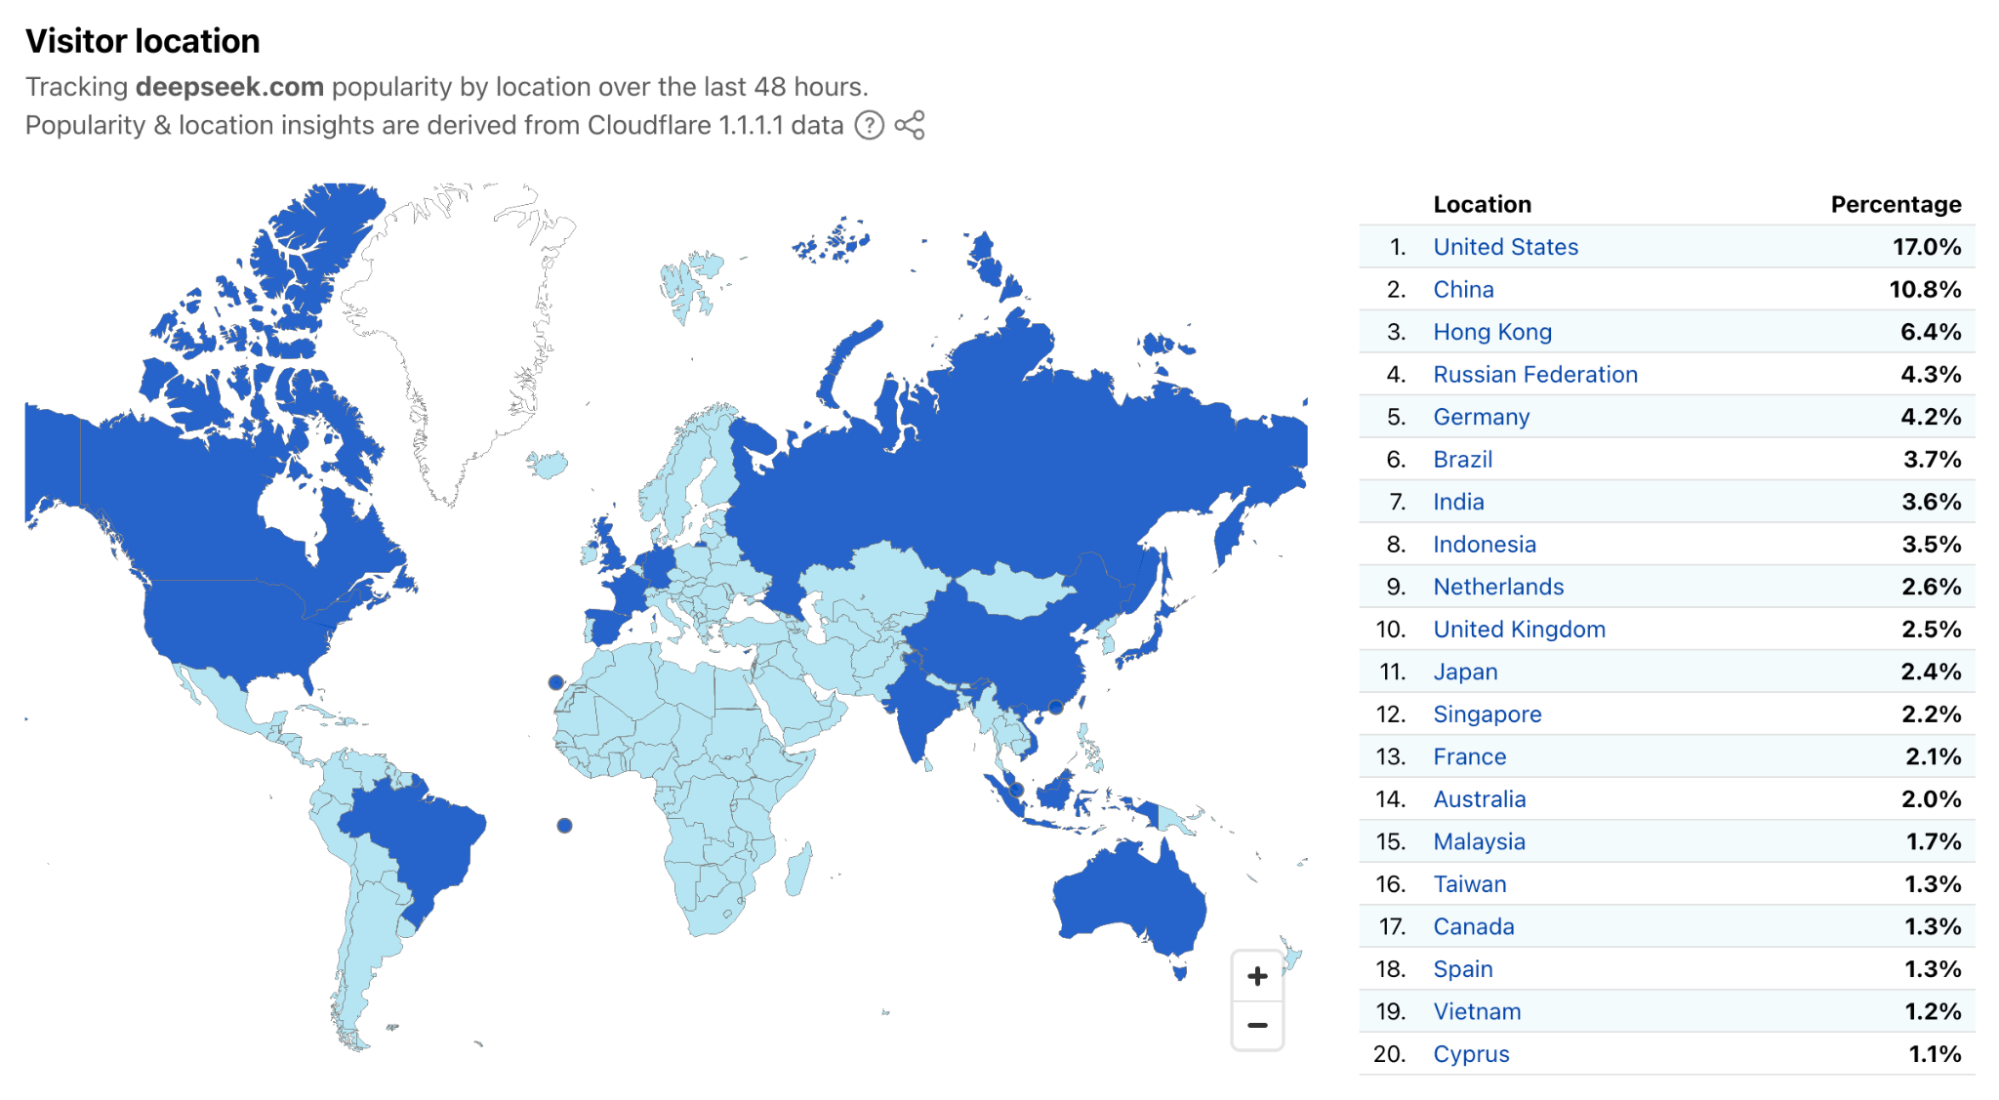
The Domain Information page on Cloudflare Radar enables users to look at the location popularity of a specific domain (from the last seven days), derived from Cloudflare 1.1.1.1 resolver traffic data in a period of 48 hours (Radar’s default) on March 3-4, 2025.

In this case, the chatgpt.com domain has most of its DNS traffic from the United States (17%), followed by Germany(7%), Brazil (4%), Indonesia (4%), and India (4%).


In the case of the new kid in town, deepseek.com, the U.S. is #1 location, with 14% of that domain’s DNS traffic, followed by China (11%), Germany (10%), Brazil (7%), and Hong Kong (5%).


Grok.com, on the other hand, has 20% of its traffic from the U.S., 8% from Hong Kong, 6% from Germany, 6% from Japan, and 6% from Vietnam, reflecting a strong presence in Asia within its top 5 locations. Asia is even more dominant for another well-known Generative AI chatbot domain, poe.com, with Hong Kong ranking #1 (29% of traffic), followed by the U.S. (13%), Japan (6%), China (6%), and Singapore (5%).

Hugging Face (huggingface.co), the Generative AI models platform, also has the U.S. as its top location (34% of traffic), but its top 5 includes four European countries: France (6%), the United Kingdom (6%), Germany (4%), and Sweden (4%).

Looking more specifically at AI-powered coding tools, DNS traffic for githubcopilot.com is primarily driven by the United States (22%), followed by Germany (6%), Hong Kong (5%), India (5%), and Japan (5%). A similar pattern appears for codeium.com, where the U.S. leads with 15%, followed by Hong Kong (8%), Japan (7%), Brazil (5%), and the Netherlands (5%). Likewise, cursor.com has 20% of its DNS traffic from the U.S., followed by Hong Kong (10%), India (6%), China (6%), and Japan (5%). Tabnine.com, another AI code completion tool, has its highest traffic from the U.S. (15%), followed by India (6%), Brazil (5%), Germany (5%), and Hong Kong (5%).

The DNS traffic data from Cloudflare Radar highlights strong U.S. usage across all major Generative AI and AI coding tools, with regional adoption varying by platform. (It is worth noting that 1.1.1.1 has a larger user base in the U.S., but these specific trends vary depending on the domains.)

  • Asia dominates poe.com and AI coding tools like Codeium and Cursor.

  • Europe plays a significant role in Hugging Face and GitHub Copilot.

  • Brazil emerges as a notable player, particularly in DeepSeek and Tabnine.

Generative AI general traffic growth 

Cloudflare, in terms of Generative AI customers, has a unique perspective on the industry. We power many Generative AI services, both large and small. From a cohort of Generative AI customers — some recently popular, others established chatbots or image AI generators, and some just starting — we’ve aggregated both HTTP request data over the past months and application-layer attack trends.

Let’s start with HTTP requests traffic growth in the past year. From February 1, 2024, through March 1, 2025 (a 13-month period to compare February 2024 with February 2025), monthly traffic grew a total of 251%, and over 2% of the requests processed by Cloudflare were mitigated as potential attacks.

Note that there was an increase over most of the entities in the cohort of Generative AI websites, and this 251% growth also includes recent Generative AI customers, although those mostly don’t influence the growth trend that much — if we exclude Generative AI customers that onboarded to Cloudflare in late 2024 and early 2025, year growth is 234%.


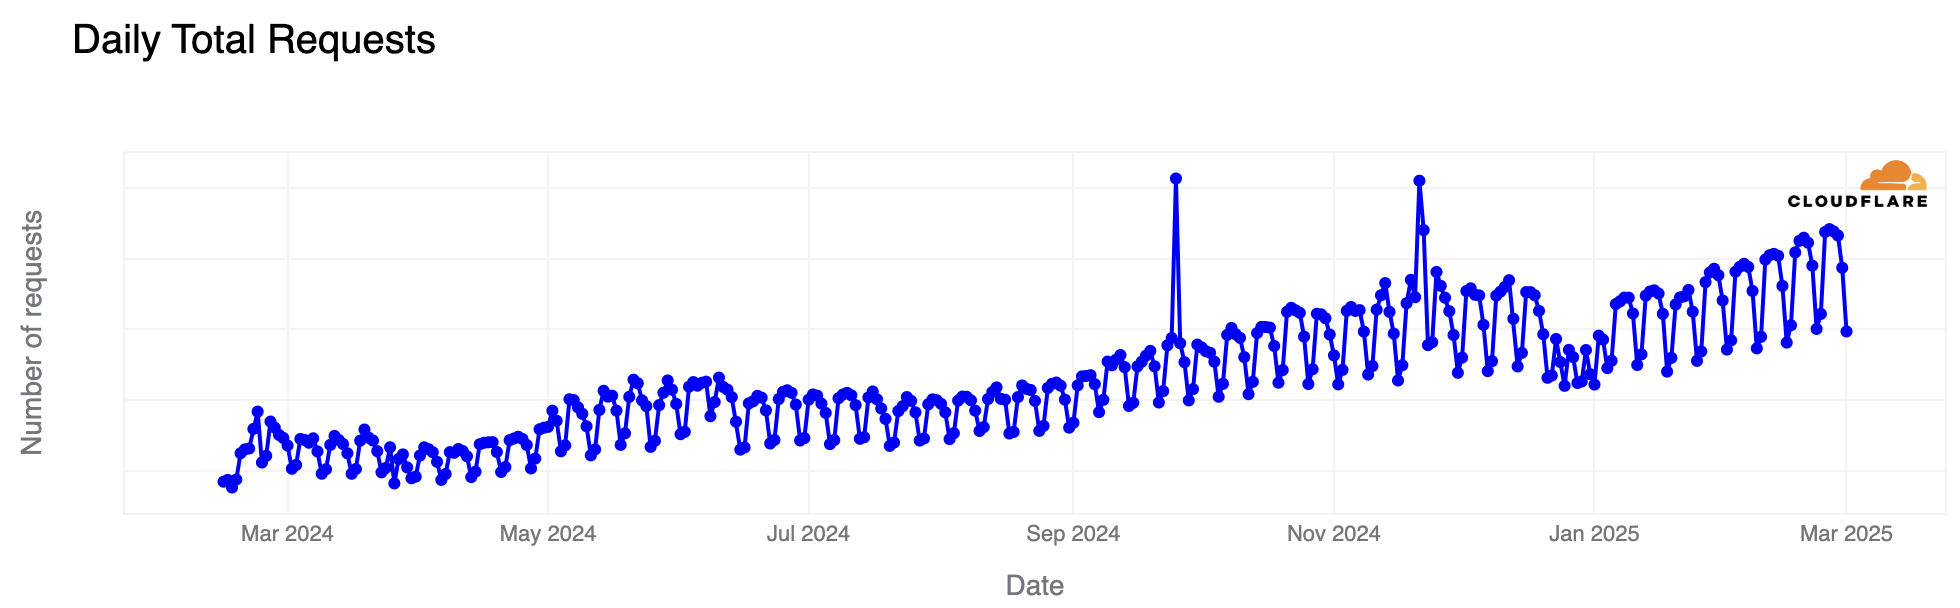
In this next perspective, shown at a daily level, the expected drop during Christmas and the end of the year holidays is quite clear. Another trend surfaces: the cohort of Cloudflare’s Generative AI customers definitely see more use during weekdays than weekends, suggesting a workplace focus. The clear drop during the holidays also includes the summer in the Northern Hemisphere — there’s a slight drop in peak traffic in July, for example (similar to what we typically see in terms of general traffic in most countries).


We also have a perspective on the top visitor locations to Generative AI websites, where the U.S. ranks #1, with 23% of all requests in this category, followed by India (8%), Brazil (5%), Indonesia (4%), and Philippines (4%) in the top 5. European countries, such as the U.K. and Germany, come next in the ranking. Below, we show the top 50 for further exploration. Note that Egypt is the first African country appearing in the ranking, at #32, with the same 0.7% as South Africa.

Top locations by share of traffic to Generative AI websites

Rank

Country

Percentage of total

Rank

Country

Percentage of total

1

United States

22.7%

26

Singapore

1.1%

2

India

8.3%

27

Ukraine

1%

3

Brazil

4.9%

28

Taiwan

0.9%

4

Indonesia

4.2%

29

Thailand

0.9%

5

Philippines

4%

30

Chile

0.8%

6

United Kingdom

3.8%

31

United Arab Emirates

0.7%

7

Germany

3.7%

32

Egypt

0.7%

8

Canada

3.2%

33

Saudi Arabia

0.7%

9

France

3%

34

South Africa

0.7%

10

Mexico

2.7%

35

Sweden

0.6%

11

Japan

2.4%

36

Belgium

0.6%

12

Russian Federation

2.2%

37

Bangladesh

0.6%

13

Spain

2%

38

Switzerland

0.6%

14

Australia

2%

39

Morocco

0.6%

15

South Korea

1.8%

40

Ecuador

0.6%

16

Vietnam

1.6%

41

Israel

0.5%

17

Italy

1.5%

42

Nigeria

0.5%

18

Malaysia

1.5%

43

Romania

0.5%

19

Turkey

1.4%

44

Portugal

0.5%

20

Poland

1.4%

45

Kazakhstan

0.5%

21

Netherlands

1.4%

46

Austria

0.4%

22

Argentina

1.2%

47

Czech Republic

0.4%

23

Colombia

1.2%

48

Hong Kong

0.4%

24

Pakistan

1.2%

49

Algeria

0.4%

25

Peru

1.1%

50

Denmark

0.4%

Attacks targeting Generative AI websites

On the security front, Generative AI websites have become key targets for DDoS attacks as they have gained attention and grown in popularity. Recently, our Cloudforce One team published a threat analysis on attacks by Anonymous Sudan targeting AI-related companies: Inside LameDuck: Analyzing Anonymous Sudan’s Threat Operations. In this report, they explained how the U.S. Department of Justice indicted two Sudanese brothers behind LameDuck, linking them to 35,000+ DDoS attacks via the Skynet Botnet. The case exposes both political and financial motives behind their operations and underscores the global effort — including Cloudflare’s — to strengthen cybersecurity.

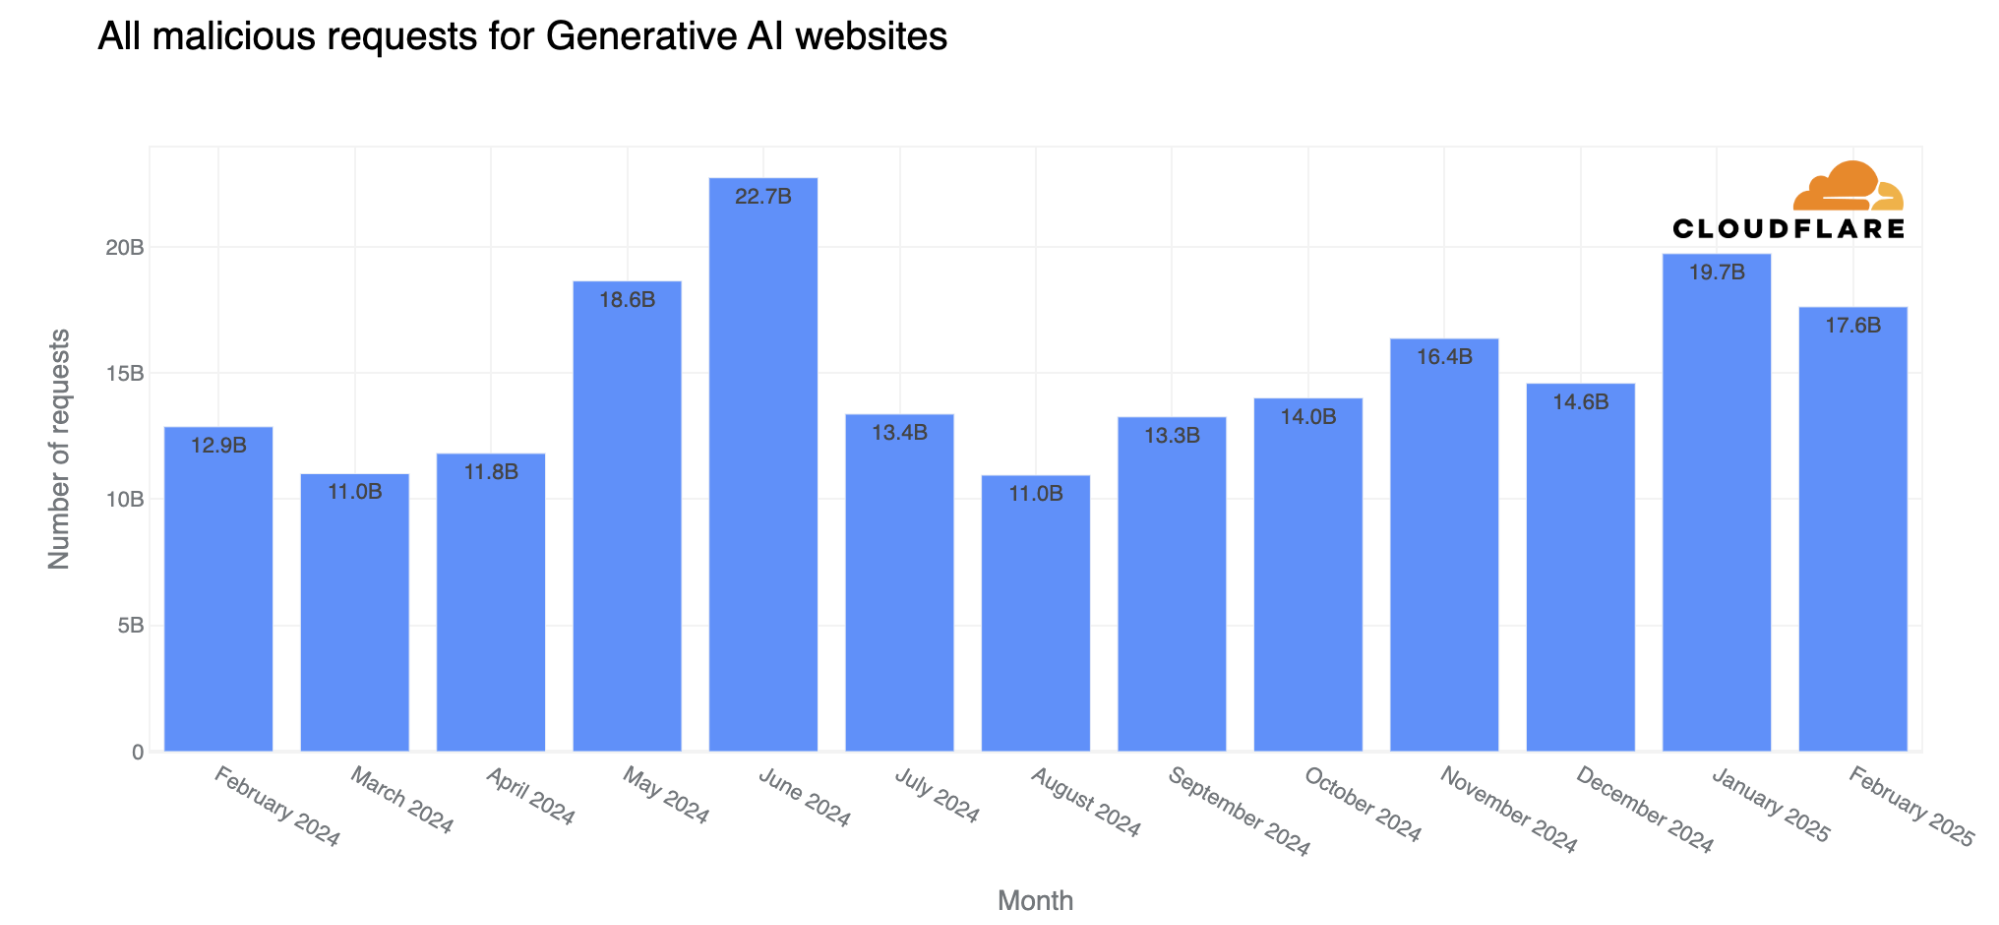
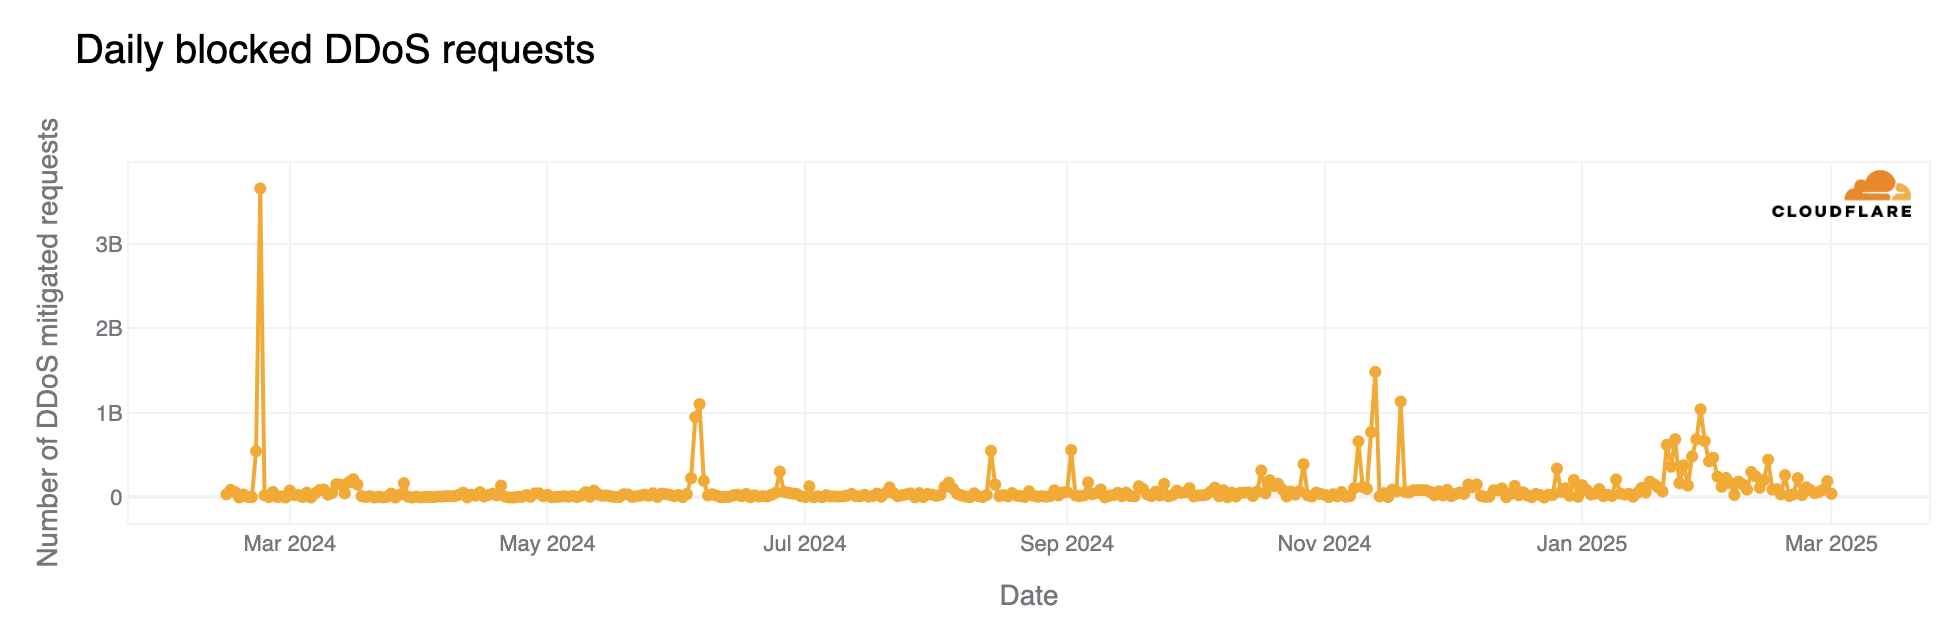
Over the last 13 months, from February 1, 2024, until March 1, 2025, Cloudflare blocked 197 billion requests as potential attacks. Of that number, 39 billion requests were part of DDoS attacks targeting Generative AI websites.


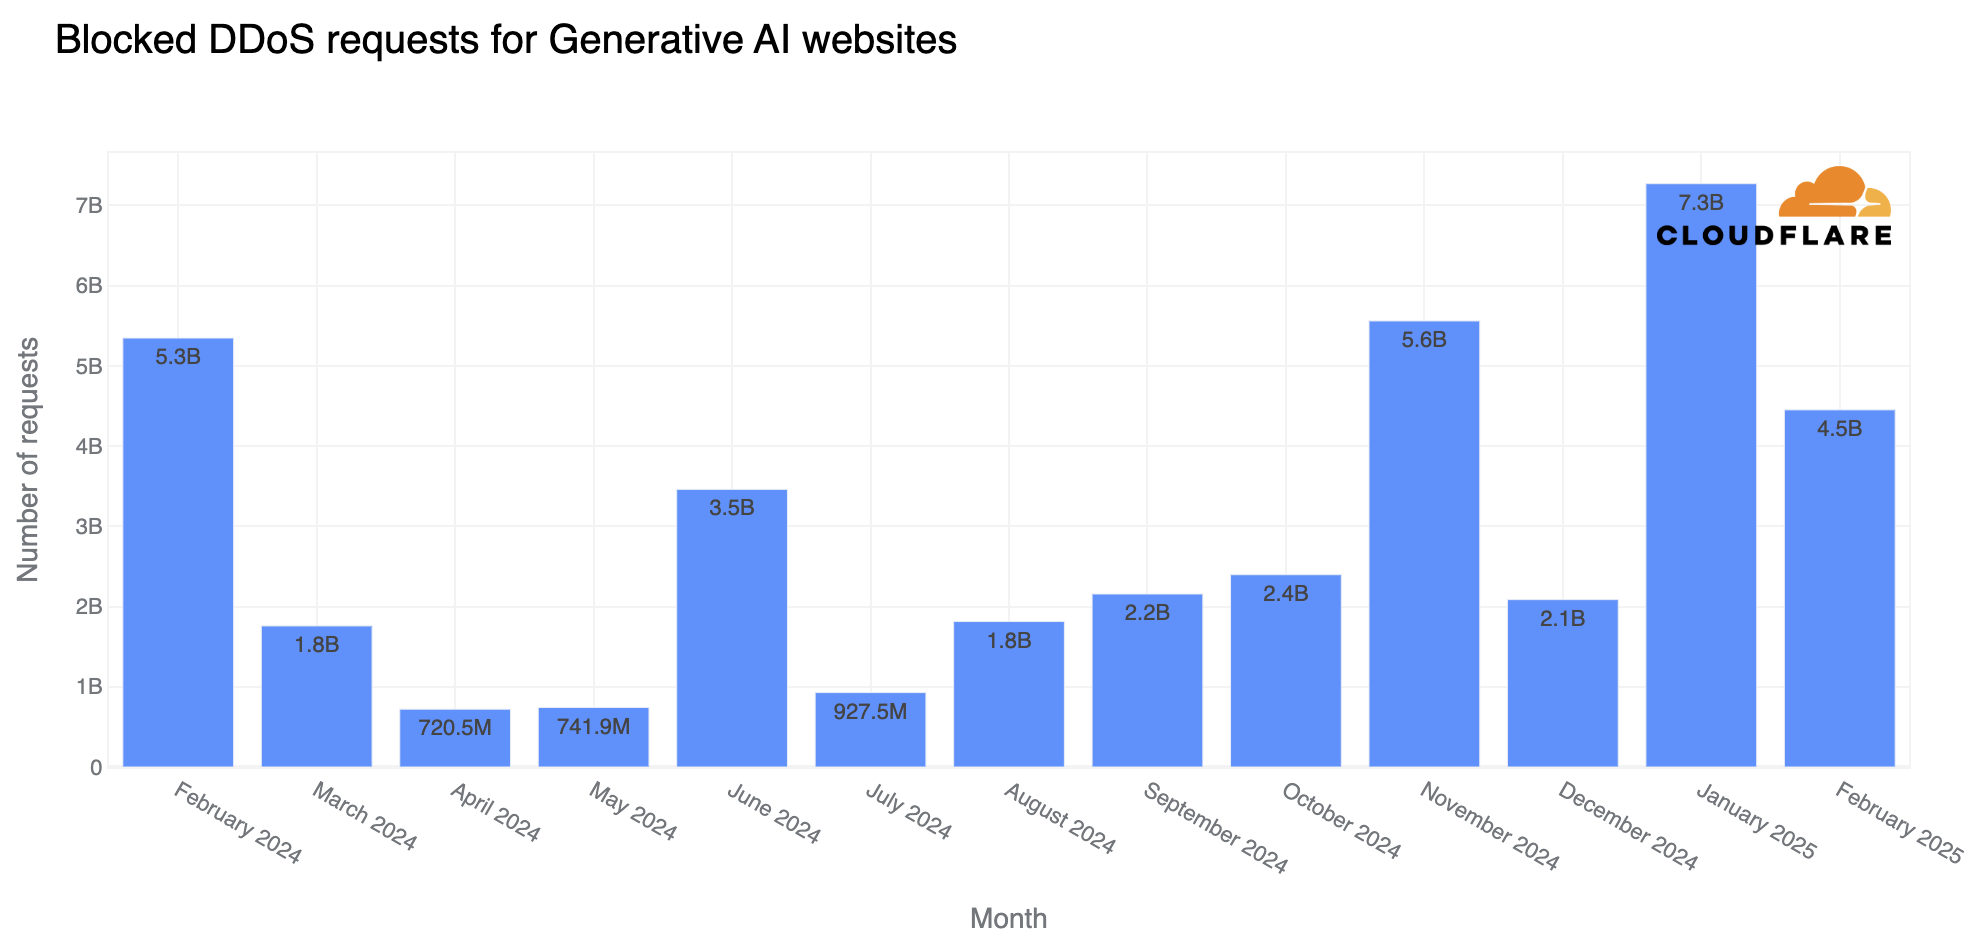
In terms of malicious requests that were blocked, June 2024 saw the highest number of potential attacks blocked by Cloudflare, followed by January 2025. For DDoS attacks, January 2025 recorded the highest activity, followed by November 2024 and February 2024.


Looking more closely at DDoS traffic at a daily level, the largest attack occurred on February 23, 2024, when 3.7 billion requests were blocked as part of a DDoS attack. The second largest was a 1.5 billion request DDoS attack on November 13, 2024. Additionally, a series of multiday DDoS attacks took place between January 20 and 31, 2025, with January 29 seeing the highest number of DDoS attack-related requests, at over one billion (7.3 billion in total for the month).


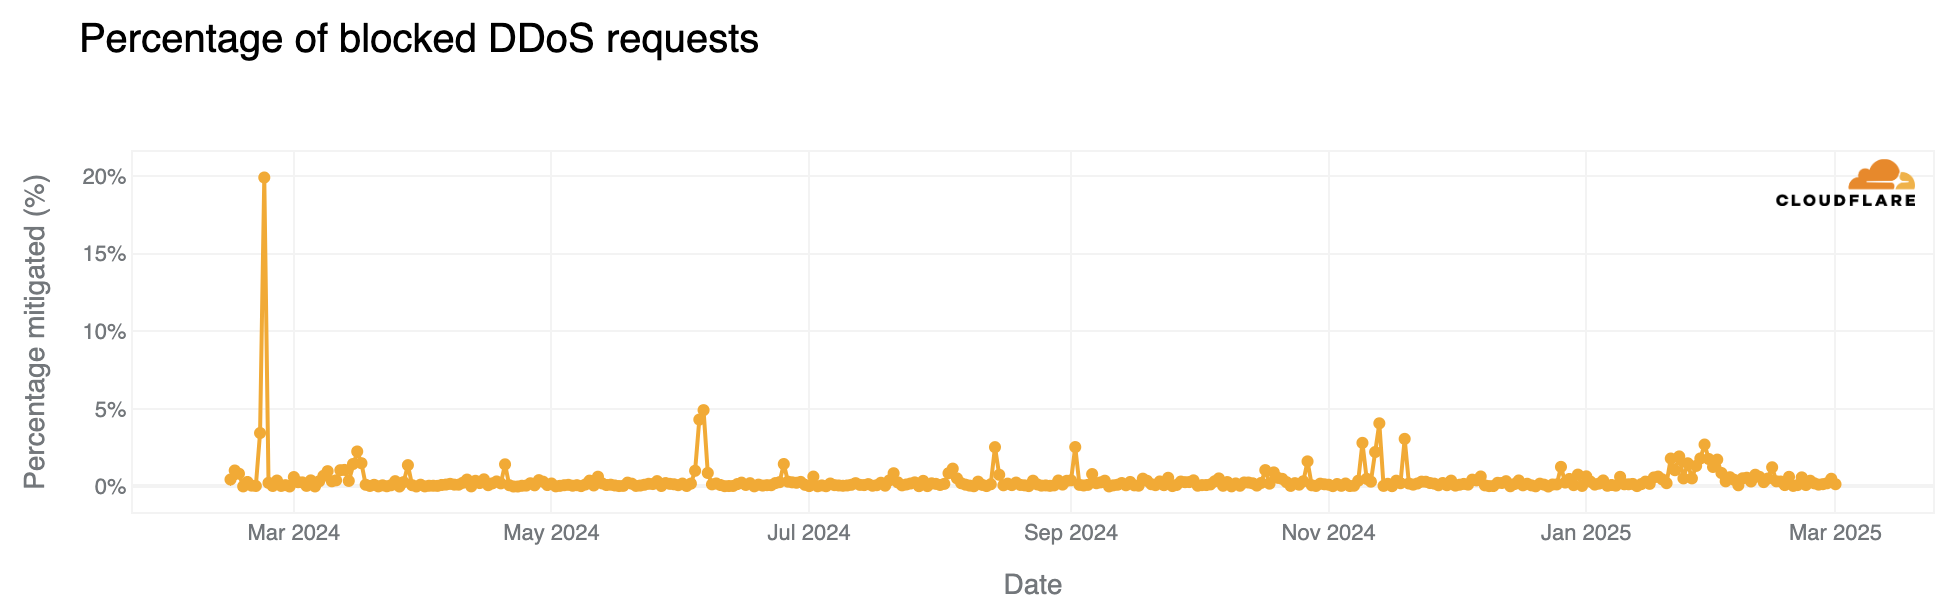
During the February 23, 2024, DDoS attack, which targeted a specific Generative AI customer, more than 20% of all requests across all Generative AI customers were blocked as part of the attack.


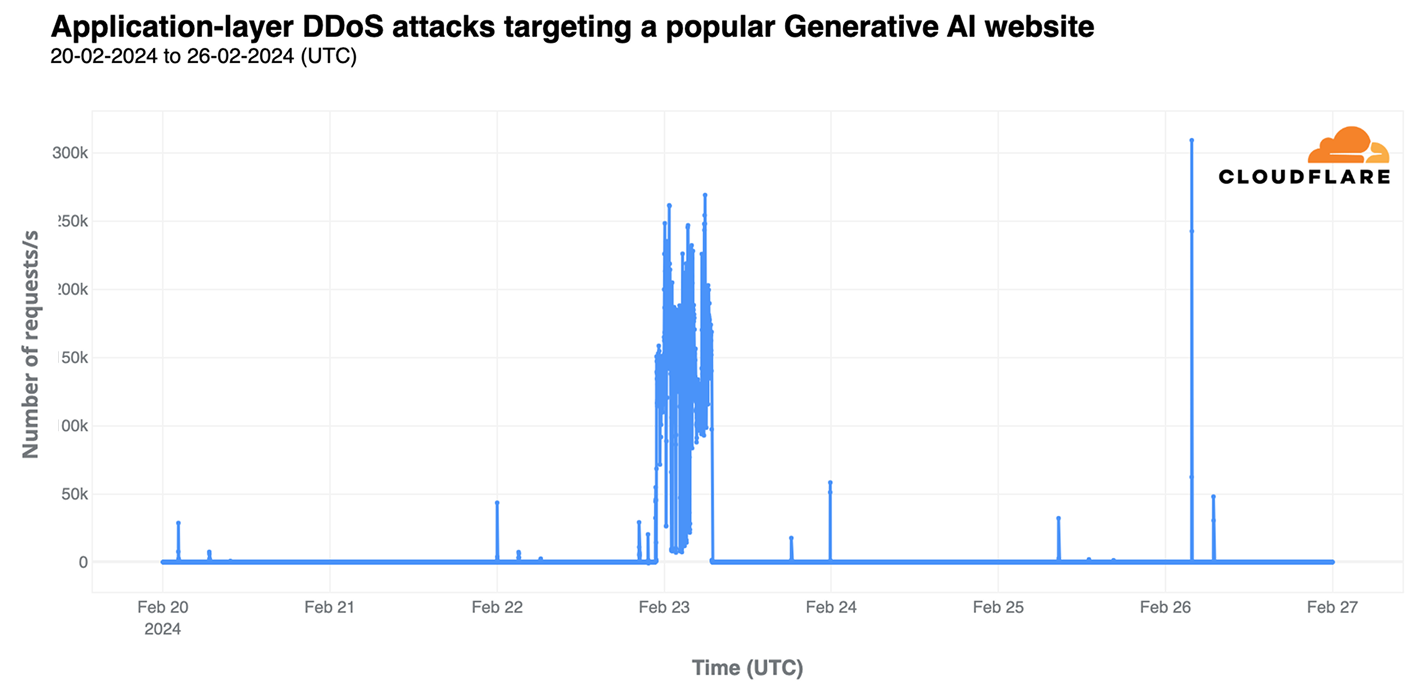
Taking a more granular view of DDoS attacks against that particular Generative AI customer, the attack began on February 22, 2024, at 22:45 UTC, lasting for over eight hours of continuous traffic spikes, peaking at 270,000 requests per second. Further attacks followed, with the most significant occurring on February 26, 2024, at 03:45 UTC, lasting three minutes and peaking at 309,000 requests per second.


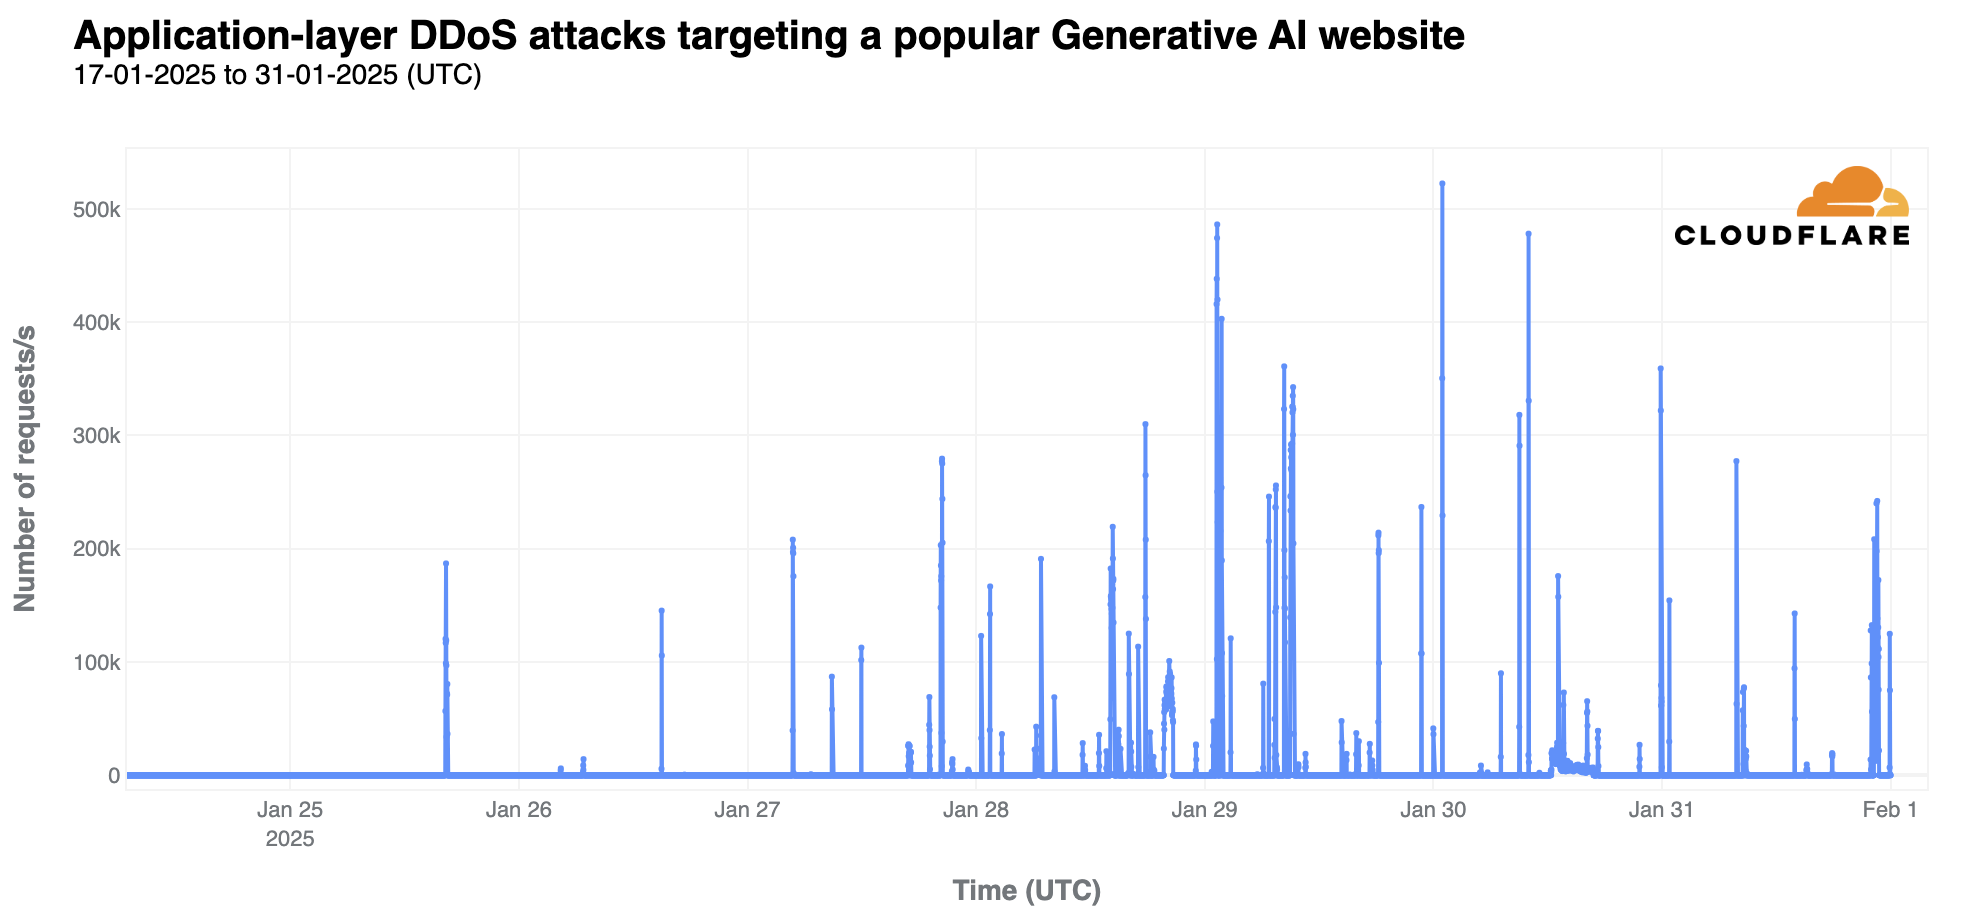
Another popular Generative AI customer was targeted in a DDoS campaign from January 25 to January 31, 2025, with traffic peaking on January 30, reaching 523,000 requests per second.


Another perspective to consider over the same February 2024 to February 2025 period is the type of Generative AI websites most targeted by DDoS attacks. General AI chatbots accounted for over 80% of all blocked requests, making them the primary targets.

DDoS attacks targets by Generative AI category

Category

Percentage

General Chatbots

82.7%

Image AI Generators

8.2%

Code Assistants

3.4%

Other

2.6%

AI Research & Infra

1.3%

AI Music Creation

1.2%

Writing & Content AI

0.4%

Voice & Video AI

0.3%

However, when looking at the percentage of total traffic blocked as DDoS attacks within each category, image AI-related websites had the highest proportion, with over 50% of their total traffic being blocked.

Websites category with the highest percentage of traffic blocked as DDoS attacks 

Category

Blocked DDoS (%)

Image AI

50.8%

AI Chatbot

31%

AI Search

9.4%

AI Code Assistant

6.8%

AI Model

5.8%

AI Music

3.6%

AI Company

2.9%

Conclusion: AI transformation

Generative AI continues to grow and transform Internet usage, driving traffic growth of over 250% for AI services over the course of the last year. ChatGPT is definitely the most popular service, and nears the top 50 of all Internet services as seen through analysis of traffic from our 1.1.1.1 DNS resolver. New entrants like DeepSeek and Grok/xAI have quickly climbed the popularity rankings, while regional adoption patterns show the U.S., India, and Brazil leading in visitor traffic.

This rapid rise has also drawn cyberattacks, with 39 billion requests identified as DDoS attacks targeting specific Generative AI websites over the past year. While most attacks focus on general AI chatbots, image-generation sites show the highest percentage of blocked requests, at over 50%. As Generative AI evolves, tracking these trends provides a historical record of growth surges, global reach, and emerging threats.

If you’re interested in more trends and insights about the Internet, check out Cloudflare Radar. Follow us on social media at @CloudflareRadar (X), noc.social/@cloudflareradar (Mastodon), and radar.cloudflare.com (Bluesky), or contact us via email.

Security updates for Monday

Post Syndicated from daroc original https://lwn.net/Articles/1013561/

Security updates have been issued by Debian (openvpn and thunderbird), Fedora (buildah, chromium, podman-tui, python-spotipy, qt6-qtwebengine, and vim), Mageia (chromium-browser-stable and gpac), Oracle (krb5), Red Hat (firefox, kernel, kernel-rt, libxml2, and pcs), SUSE (buildah, chromedriver, chromium, firefox, go1.23, go1.24, grype, python, python311-GitPython, ruby3.4-rubygem-rack, thunderbird, and xen), and Ubuntu (xorg-server, xorg-server-hwe-16.04, xorg-server-hwe-18.04).

Seeing The Whole Picture: A Better Way To Manage Your Attack Surface

Post Syndicated from Michael Chroney original https://blog.rapid7.com/2025/03/10/seeing-the-whole-picture-a-better-way-to-manage-your-attack-surface/

Do you trust your view of your organization’s risk?

Seeing The Whole Picture: A Better Way To Manage Your Attack Surface

With cloud adoption, remote work, shadow IT, and AI, security teams face an overwhelming challenge: scoping their attack surface and continuously discovering all assets and exposures before threats emerge. This aligns with the critical first steps of a Continuous Threat Exposure Management Program (CTEM), which emphasizes the importance of scoping and discovery.

This visibility gap has significant consequences. In 2024, 14% of breaches happened because attackers exploited vulnerabilities to gain initial access — that’s almost triple the amount from 2023 (Verizon DBIR 2024). This isn’t surprising when you consider that only 17% of organizations feel confident that they can find and list at least 95% of their assets, according to Gartner Innovation Insight: Attack Surface Management 2024 research. Without a clear plan for scoping and discovery, organizations can’t effectively secure their assets because they don’t know what they’re trying to protect.

If you don’t have a complete picture of your entire IT estate — inclusive of internal and external facing assets — you’re going to miss vulnerabilities and leave openings that attackers can exploit. That’s why it’s so important to continuously scan and discover your assets so that you always have an accurate, up-to-date view of your attack surface. This is where tools like external attack surface management (EASM) and cyber asset attack surface management (CAASM) come into play because they give you a single view of everything you have and can highlight what’s exposed. Gaining this visibility will help your security teams proactively detect, prioritize, and remediate threats before they are exploited.

Why you need a complete view of your attack surface

Let’s face it, as organizations grow, their potential vulnerabilities grow right along with them. This creates complexity for security teams who are already struggling to keep up. They’ve tried to solve this by adding more and more security tools, but this often backfires and creates a fragmented view that makes it harder to see the whole picture.

To truly reduce risk and strengthen your defenses, you need a unified approach that combines EASM and CAASM.

Even organizations who embrace EASM or CAASM may end up with a disjointed security toolset. Many organizations try to manage their attack surface with either an EASM, a CAASM, or other separate tools, but this often results in an incomplete view of the attack surface, creating blind spots and leading to missed vulnerabilities. This fragmented approach also fails to identify critical control gaps. For example, if an asset is not visible, it might be overlooked that it lacks an endpoint agent or is not protected by a firewall.

Why EASM or CAASM alone fall short

EASM solutions are highly effective for monitoring internet-facing assets, including web applications, cloud services, and third-party integrations. However, they cannot provide visibility into internal environments that are not publicly accessible. This includes non-internet-facing components of on-prem infrastructure, privileged systems, and certain shadow IT assets.

CAASM solutions provide internal visibility, aggregating data from security tools, asset inventories, and IT management systems. They’re great at identifying misconfigurations, vulnerabilities, and security gaps within an organization’s controlled environment. However, CAASM tools can’t account for external exposures, leaving an incomplete picture of how attackers could gain initial access. Additionally, CAASM solutions are completely reliant on 3rd party tools and integrations, meaning that you are adding yet another tool to your tech stack that you have to pay for and manage.

Disparate tools, disjointed defense

To secure growing attack surfaces, many organizations rely on a mix of vulnerability management, cloud security posture management (CSPM), and application scanners. However, these tools often operate independently, leading to fragmented visibility and inefficiencies. Without a single source of truth, security teams struggle to correlate risks, resulting in missed threats, duplicate efforts, and slower response times. Managing multiple tools also increases alert fatigue and operational overhead, while leaving critical gaps in attack surface coverage.

Are you sensing a trend here?

The power of a unified view

A truly effective risk management strategy needs more than a bunch of different tools — it needs those tools to work together seamlessly, giving you a complete picture of all your assets and potential exposures. Security teams need one single source of truth that brings together data from all of their vulnerability management solutions. This will ensure that teams can:

  • Strengthen Security Through Visibility

You have to know and trust what assets you have, where they are, and how they might be exposed. This is key to enforcing proper access controls, patching vulnerabilities, and applying the right security measures to your assets. With a full inventory, teams can be sure that no device, application, or cloud instance is left unprotected.

  • Manage Risk Across Your Entire Attack Surface

A unified approach lets security teams prioritize the most critical risks across all digital environments, greatly reducing blind spots. With a unified view, organizations can detect patterns, understand attack paths, and proactively close security gaps before attackers can exploit them.

By integrating all of your exposure management capabilities into a single, centralized system, your organization can move from reactive security measures to a proactive and holistic approach — giving you the confidence to effectively defend against modern threats.

Take command of your attack surface

The threat landscape is constantly shifting, and it’s more important than ever to have a complete and accurate view of your attack surface. It’s time for security teams to ask some tough questions: Do we really have the insight we need to protect our organization? Are there blind spots that attackers could take advantage of? These questions are at the heart of the scoping and discovery phases within a CTEM program, prompting organizations to continuously evaluate and improve their attack surface visibility.

To get ahead of threats, organizations should simplify their security approach by reducing the number of tools they’re using and find a solution that seamlessly combines EASM and CAASM. A unified view helps security teams find, prioritize, and reduce risks more effectively.

How Rapid7 can help

Rapid7 recently announced Exposure Command and Surface Command, the first two solutions launched on the new Command Platform. Surface Command provides complete visibility across internal and external environments by combining EASM and CAASM in a single solution, allowing security teams to view and prioritize high-risk assets across their entire environment. Exposure Command builds on Surface Command’s attack surface visibility, offering proactive exposure mitigation and remediation prioritization across your hybrid environment.

Thousands of WordPress Websites Infected with Malware

Post Syndicated from Bruce Schneier original https://www.schneier.com/blog/archives/2025/03/thousands-of-wordpress-websites-infected-with-malware.html

The malware includes four separate backdoors:

Creating four backdoors facilitates the attackers having multiple points of re-entry should one be detected and removed. A unique case we haven’t seen before. Which introduces another type of attack made possibly by abusing websites that don’t monitor 3rd party dependencies in the browser of their users.

The four backdoors:

The functions of the four backdoors are explained below:

  • Backdoor 1, which uploads and installs a fake plugin named “Ultra SEO Processor,” which is then used to execute attacker-issued commands
  • Backdoor 2, which injects malicious JavaScript into wp-config.php
  • Backdoor 3, which adds an attacker-controlled SSH key to the ~/.ssh/authorized_keys file so as to allow persistent remote access to the machine
  • Backdoor 4, which is designed to execute remote commands and fetches another payload from gsocket[.]io to likely open a reverse shell.

Забелязва се спад в раждаемостта след пандемията и може би не засяга България

Post Syndicated from Боян Юруков original https://yurukov.net/blog/2025/spad-rajdaemost/

Вчера, когато привършвах текста ми за картата на Евростат, се замислих над още нещо. Защо забелязваме спад в тоталния индекс на плодовитостта сред повечето европейски държави в последните две години? Поне това на пръв поглед се виждаше взирайки се в данните им. Реших да се задълбая повече и излязоха няколко интересни наблюдения. Ще се опитам да дам свое обяснение за тях, макар несъмнено за всяка държава те и други имат различна тежест.

Каква е динамиката?

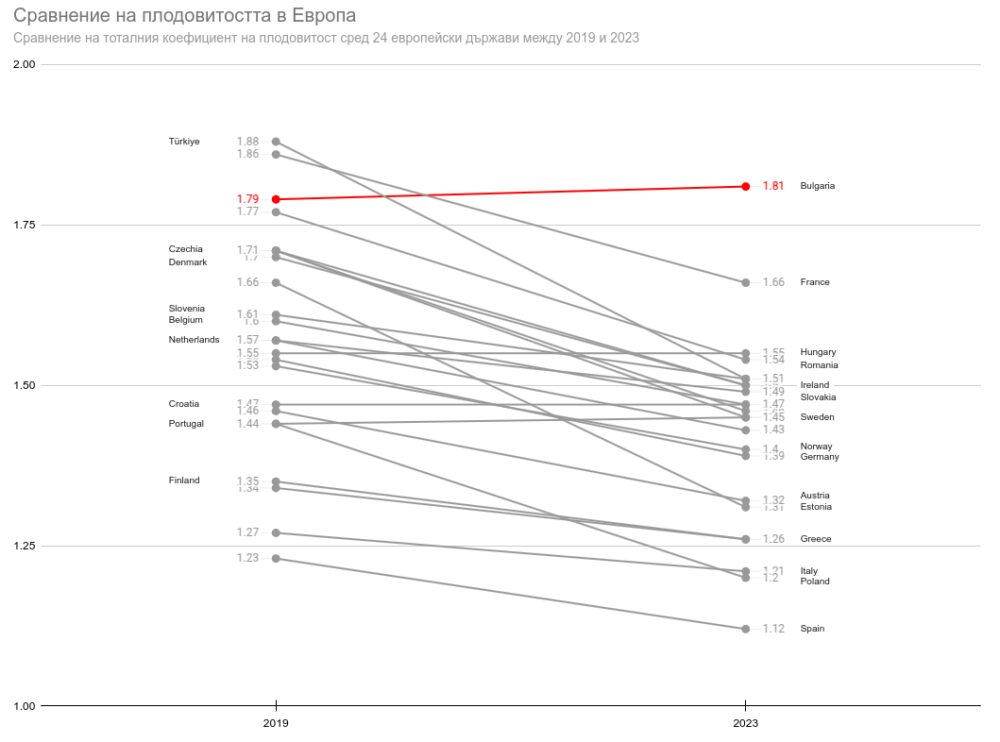
Тъй като говорим за доста числа и държави, реших да разгледам две конкретни години – 2019 и последната известна 2023-та. С други думи – преди и след пандемията. Защо избрах тях и защо не трябва да избързваме с изводите ще обясня по-нататък, но ето първо графиката. Тук сравнявам 24 държави включени в данните на Евростат. При 18 има спад от над 9% за пет години, което е сериозно. При Унгария, Хърватия и Португалия практически няма промяна, а при Сърбия и Македония има съответно увеличение от 6.6% и 18%. Тях ще разгледаме след малко. Най-голям спад има при Турция от 20%, както и при Полша, Швеция, Грузия, Естония, Латвия и Литва от между 15% и 21%.

Интересното е, че сред държавите от ЕС една от трите без намаление е България. При това е с най-голямо увеличение от 1.12%. Както коментирах в предишната статия, плодовитостта не трябва да се разглежда в изолация или дори кратък период, макар в определени случаи да е неизбежно. В случая дори да сравним 2023-та със средната стойност за същите държави между 2017 и 2019-та, картината не се променя. България дори скача с 3.82%. Тук важна бележка е, че изключвам държави като Кипър и Люксембург заради малкото население.

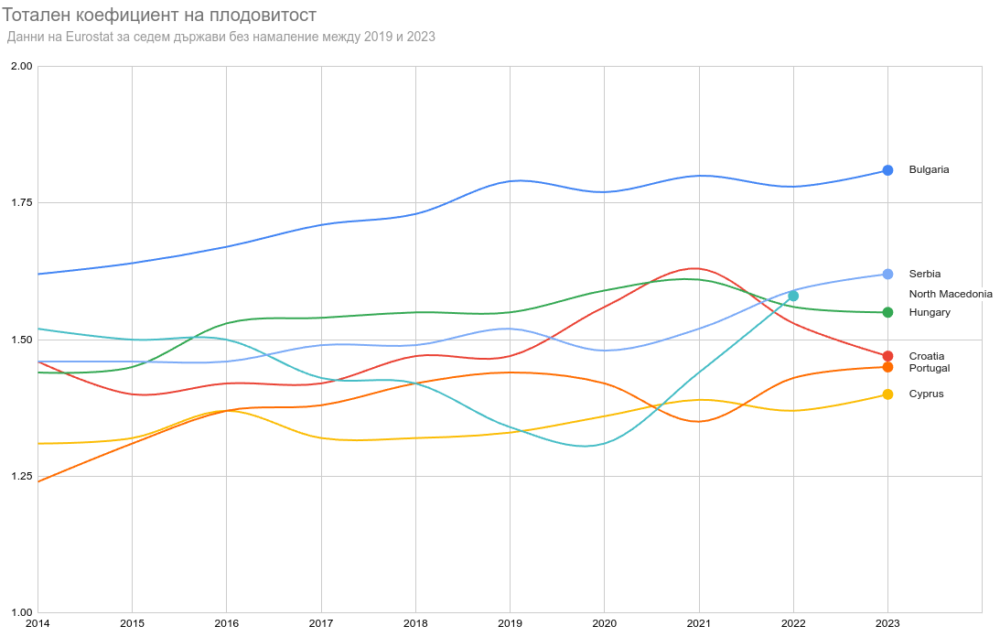
Държавите, където няма намаление за този период, са България, Сърбия, Македония, Унгария, Хърватия, Португалия и Кипър. Кривите им за последните десет години са добро начало, за да разберем условностите им, което да ни даде и идея за тези с голямо намаление.

Виждаме голяма вариация и в зависимост коя година вземем, получаваме различен ръст. При България, например, практически липсва промяна след 2018-та, след като до тогава има постоянно подобрение на плодовитостта. Въпреки това, се виждат леки пикове през 2019-там, 2021 и 2023-та, което прави сравнението горе подходящо. При Сърбия и Македония се отчита значително повишение след кризата. При Унгария и Хърватия виждаме първоначален скок от 1-2 години, след което рязък спад. При Португалия виждаме пък спад и после възстановяване, а при Кипър ситуацията в по-скоро като България. С други думи, при всички изброени с изключение на Сърбия и Македония виждаме по-скоро еднократни ефекти. Вижда се ясно обаче, че България има значително по-висока плодовитост от останалите дори с положителна тенденция и това е силен сигнал, който не трябва да се пренебрегва.

Възможни обяснения

Още в началото на пандемията, когато се разбра, че няма да свърши за няколко месеца, имаше твърдения, че тя ще доведе до сериозно увеличение на раждаемостта, а от там и плодовитостта. В това имаше някаква логика. От една страна, историята показва, че след кризи и войни има скок в раждаемостта като форма на компенсиране. От друга, много хора бяха затворени вкъщи продължително без много какво да правят.

Тези твърдения обаче се базират на повърхностно разбиране на поведението на хората, още повече в днешното общество. Голямата несигурност и смърт всъщност намалява шансовете двойки да се решат на деца. Видяхме го през 90-те в България. Това е още по-вярно във време, когато поне някаква част от населението има някаква здравна и сексуална култура и възможност да се предпазят от бременност. В тази връзка, не се забеляза увеличение на абортите нито според данните на НЗОК, нито според оценките на организации занимаващи се с темата. Има дори постоянно намаление – както в абсолютен брой, така и спрямо брой жени и брой раждания.

Както виждаме горе, забелязва се спад в раждаемостта в много държави. Средното за целия Европейски съюз (без Великобритания) е 9.8% надолу между 2019 и 2023-та. Една причина за това може да е продължаващата политическа и икономическа несигурност. Водещ фактор си остава застаряващото население, повишаващата се средна възраст на раждане и променящата се възрастова структура на жените в детеродна възраст. По време на пандемията пък навярно изолацията е имала ефект – когато не излизаш продължително време или общо страниш от групи, не срещаш нови хора, не заформяш връзки и семейства и от тях – деца. Това е феномен наблюдаван от много време в Япония и е основен проблем в демографията им, но по културни причини.

В държави крайно зависещи от имиграция за закрепване на демографското си положение като Италия, Германия и Франция пандемията доведе до намаляване на този поток. Като допълним затварянето на границите, паника подтикната от нативистични и националистически настроения, засилването на радикалните партии и общите негативни настроения срещу чужденците, разбираемо е защо притокът на деца и млади семейства, които да раждат такива би намалял, а тези вече на място биха отложили такова решение.

В България може би е имало отчасти положителен ефект от този процес. Шовинизма, расизма и сегрегацията са все още твърде сериозно заложени в обществото ни и работната среда и в комбинация с корупция и мудна бюрокрация никога не сме успявали да привлечем значително количество външни работници. Така временен спад не би се отразил толкова, но означава и че дългосрочно сами ограничаваме възможностите си като общество и икономика. От друга страна, имаше от рано сигнали подкрепени от последвали данни, че доста българи се върнаха в рамките на пандемията и останаха в България. Някои от тях навярно вече имат деца и са помогнали за наблюдаваното леко увеличение на плодовитостта. Аз съм сред тях, макар връщането ми в България да беше планирано доста преди самата пандемия.

Да не бързаме с изводите

Не трябва обаче да се взираме прекалено в тези отделни числа, защото те се влияят твърде силно от много фактори. В Унгария, например, широко тиражираните мерки за стимулиране на раждаемостта и брака сред семействата имаха еднократен и скромен успех. Причината за това е липсата на разбиране за мотивацията на хората и същността на проблемите, но и също, че бяха диктувани от религиозни, националистически и консервативни догми.

В други страни локализирани проблеми, кризи и несигурност имат голямо влияние върху числата. Пример за прибалтийските републики и заплахата от агресия от страна на Русия. Дори неща като инфлацията, която видяхме в Европа и освен всичко подпомогна изкачването на анти-системни партии, може да е фактор.

Но основен фактор според мен е вътрешната демографска динамика в самите държави, която съвсем очаквано не върви в синхрон. Често предупреждавам да не се сравнява така механично метрики между държавите, особено такива в конкретен момент във времето. Всяка метрика има своя смисъл, обяснение и приложение, но имаме склонност да ги изкарваме от контекст без особено разбиране. За тоталният коефициент на плодовитост навярно това важи в най-голяма степен.

В различните държави в детеродна възраст влизат и излизат различен брой жени. У нас в последните години влизат доста заради повишената раждаемост преди 15 години. Също така, различни социални фактори като възраст на завършване на училищата, практики за започване на университет, социална и трудова защита, достъпност до помощ и финансиране за подпомагане на репродуктивното здраве и промени в тези мерки и възможност в последните години могат да имат еднократен ефект, който за се види като сигнал в тези данни. Понякога дори продължителна липса на медикамент важен за хора с трудности в зачеването може да създаде ефект съизмерим с онези, които виждаме горе.

Не на последно място, данните за някои от изброените държави са предварителни и подлежат на корекция. Докато повечето деца родени през 2023-та са били заченати в условията на пандемията и още в началото на войната в Украйна, когато се смяташе, че ще свърши бързо, не може да знаем колко тази несигурност им се е отразила. Трябва да изчакаме окончателните данни за 2024-та и дори 2025-та, за да видим дали обсъжданото е имало по-сериозен ефект и какъв.

Затова е важно да четем с разбиране, да поставяме нещата под въпрос и в контекст, да сме запознати с методологията и ограниченията на данните и да не търсим гръмки твърдения и още по-малко – обяснения на ефект, който ни се ще да видим. Най-големият проблем на които да е данни е не в тях самите, а в презумпциите, с които подхождаме.

The post Забелязва се спад в раждаемостта след пандемията и може би не засяга България first appeared on Блогът на Юруков.

The collective thoughts of the interwebz