Post Syndicated from Тоест original https://www.toest.bg/t-e-ot-e-t-epizod-2/

Имаме Делян Пеевски, Бойко Борисов, Мая Манолова + Ивилин и всичко това е равно на ВНЛ.
Следете видеорубриката на Елена Телбис за „Тоест“ и в Instagram и TikTok.
Post Syndicated from Тоест original https://www.toest.bg/t-e-ot-e-t-epizod-2/
Имаме Делян Пеевски, Бойко Борисов, Мая Манолова + Ивилин и всичко това е равно на ВНЛ.
Следете видеорубриката на Елена Телбис за „Тоест“ и в Instagram и TikTok.
Post Syndicated from The History Guy: History Deserves to Be Remembered original https://www.youtube.com/watch?v=vU9Yhj-x0SU
Post Syndicated from Let's Encrypt original https://letsencrypt.org/2025/02/14/encryption-for-everybody.html
2025 marks ten years of Let’s Encrypt. Already this year we’ve taken steps to continue to deliver on our values of user privacy, efficiency, and innovation, all with the intent of continuing to deliver free TLS certificates to as many people as possible; to deliver encryption for everybody.
And while we’re excited about the technical progress we’ll make this year, we’re also going to celebrate this tenth anniversary by highlighting the people around the world who make our impact possible. It’s no small village.
From a community forum that has provided free technical support, to our roster of sponsors who provide vital funding, to the thousands of individual supporters who contribute financially to Let’s Encrypt each year, free TLS at Internet scale works because people have supported it year in, year out, for ten years.
Each month we’ll highlight a different set of people behind our “everybody.” Who do you want to see us highlight? What use cases of Let’s Encrypt have you seen that amazed you? What about our work do you hope we’ll continue or improve as we go forward? Let us know on LinkedIn, or drop a note to [email protected].
Encryption for Everybody is our unofficial tagline for this tenth anniversary year. What we love about it is that, yes, it captures our commitment to ensuring anyone around the world can easily get a cert for free. But more importantly, it captures the reality that technical innovation won’t work without people believing in it and supporting it. We’re grateful that, for ten years (and counting!), our community of supporters has made an impact on the lives of billions of Internet users—an impact that’s made theWeb more secure and privacy respecting for everybody, everywhere.
Internet Security Research Group (ISRG) is the parent organization of Let’s Encrypt, Prossimo, and Divvi Up. ISRG is a 501(c)(3) nonprofit. If you’d like to support our work, please consider getting involved, donating, or encouraging your company to become a sponsor.
Post Syndicated from xkcd.com original https://xkcd.com/3051/
Post Syndicated from Let's Encrypt original https://letsencrypt.org/2025/02/14/encryption-for-everybody/
2025 marks ten years of Let’s Encrypt. Already this year we’ve taken steps to continue to deliver on our values of user privacy, efficiency, and innovation, all with the intent of continuing to deliver free TLS certificates to as many people as possible; to deliver encryption for everybody.
And while we’re excited about the technical progress we’ll make this year, we’re also going to celebrate this tenth anniversary by highlighting the people around the world who make our impact possible. It’s no small village.
From a community forum that has provided free technical support, to our roster of sponsors who provide vital funding, to the thousands of individual supporters who contribute financially to Let’s Encrypt each year, free TLS at Internet scale works because people have supported it year in, year out, for ten years.
Each month we’ll highlight a different set of people behind our “everybody.” Who do you want to see us highlight? What use cases of Let’s Encrypt have you seen that amazed you? What about our work do you hope we’ll continue or improve as we go forward? Let us know on LinkedIn, or drop a note to [email protected].
Encryption for Everybody is our unofficial tagline for this tenth anniversary year. What we love about it is that, yes, it captures our commitment to ensuring anyone around the world can easily get a cert for free. But more importantly, it captures the reality that technical innovation won’t work without people believing in it and supporting it. We’re grateful that, for ten years (and counting!), our community of supporters has made an impact on the lives of billions of Internet users—an impact that’s made theWeb more secure and privacy respecting for everybody, everywhere.
Internet Security Research Group (ISRG) is the parent organization of Let’s Encrypt, Prossimo, and Divvi Up. ISRG is a 501(c)(3) nonprofit. If you’d like to support our work, please consider getting involved, donating, or encouraging your company to become a sponsor.
Post Syndicated from Eric Smith original https://www.servethehome.com/blackmagic-cloud-dock-2-a-dual-10gbe-nas-that-is-too-easy/
In our Blackmagic Cloud Dock 2 Review we see how this two SSD and dual 10GbE NAS is designed well, but it might be too simplified for many
The post Blackmagic Cloud Dock 2 A Dual 10GbE NAS That is Too Easy appeared first on ServeTheHome.
Post Syndicated from Esra Kayabali original https://aws.amazon.com/blogs/aws/aws-cloudtrail-network-activity-events-for-vpc-endpoints-now-generally-available/
Today, I’m happy to announce the general availability of network activity events for Amazon Virtual Private Cloud (Amazon VPC) endpoints in AWS CloudTrail. This feature helps you to record and monitor AWS API activity traversing your VPC endpoints, helping you strengthen your data perimeter and implement better detective controls.
Previously, it was hard to detect potential data exfiltration attempts and unauthorized access to the resources within your network through VPC endpoints. While VPC endpoint policies could be configured to prevent access from external accounts, there was no built-in mechanism to log denied actions or detect when external credentials were used at a VPC endpoint. This often required you to build custom solutions to inspect and analyze TLS traffic, which could be operationally costly and negate the benefits of encrypted communications.
With this new capability, you can now opt in to log all AWS API activity passing through your VPC endpoints. CloudTrail records these events as a new event type called network activity events, which capture both control plane and data plane actions passing through a VPC endpoint.
Network activity events in CloudTrail provide several key benefits:
Getting started with network activity events for VPC endpoint logging
To enable network activity events, I go to the AWS CloudTrail console and choose Trails in the navigation pane. I choose Create trail to create a new one. I enter a name in the Trail name field and choose an Amazon Simple Storage Service (Amazon S3) bucket to store the event logs. When I create a trail in CloudTrail, I can specify an existing Amazon S3 bucket or create a new bucket to store my trail’s event logs.
If you set Log file SSE-KMS encryption to Enabled, you have two options: Choose New to create a new AWS Key Management Service (AWS KMS) key or choose Existing to choose an existing KMS key. If you chose New, you need to type an alias in the AWS KMS alias field. CloudTrail encrypts your log files with this KMS key and adds the policy for you. The KMS key and Amazon S3 must be in the same AWS Region. For this example, I use an existing KMS key. I enter the alias in the AWS KMS alias field and leave the rest as default for this demo. I choose Next for the next step.

In the Choose log events step, I choose Network activity events under Events. I choose the event source from the list of AWS services, such as cloudtrail.amazonaws.com, ec2.amazonaws.com, kms.amazonaws.com, s3.amazonaws.com, and secretsmanager.amazonaws.com. I add two network activity event sources for this demo. For the first source, I select ec2.amazonaws.com option. For Log selector template, I can use templates for common use cases or create fine-grained filters for specific scenarios. For example, to log all API activities traversing the VPC endpoint, I can choose the Log all events template. I choose Log network activity access denied events template to log only access denied events. Optionally, I can enter a name in the Selector name field to identify the log selector template, such as Include network activity events for Amazon EC2.

As a second example, I choose Custom to create custom filters on multiple fields, such as eventName and vpcEndpointId. I can specify specific VPC endpoint IDs or filter the results to include only the VPC endpoints that match specific criteria. For Advanced event selectors, I choose vpcEndpointId from the Field dropdown, choose equals as Operator, and enter the VPC endpoint ID. When I expand the JSON view, I can see my event selectors as a JSON block. I choose Next and after reviewing the selections, I choose Create trail.

After it’s configured, CloudTrail will begin logging network activity events for my VPC endpoints, helping me analyze and act on this data. To analyze AWS CloudTrail network activity events, you can use the CloudTrail console, AWS Command Line Interface (AWS CLI), and AWS SDK to retrieve relevant logs. You can also use CloudTrail Lake to capture, store and analyze your network activity events. If you are using Trails, you can use Amazon Athena to query and filter these events based on specific criteria. Regular analysis of these events can help you maintain security, comply with regulations, and optimize your network infrastructure in AWS.
Now available
CloudTrail network activity events for VPC endpoint logging provide you with a powerful tool to enhance your security posture, detect potential threats, and gain deeper insights into your VPC network traffic. This feature addresses your critical needs for comprehensive visibility and control over your AWS environments.
Network activity events for VPC endpoints are available in all commercial AWS Regions.
For pricing information, visit AWS CloudTrail pricing.
To get started with CloudTrail network activity events, visit AWS CloudTrail. For more information on CloudTrail and its features, refer to the AWS CloudTrail documentation.
Post Syndicated from The History Guy: History Deserves to Be Remembered original https://www.youtube.com/watch?v=JBcB22LJclw
Post Syndicated from Subham Rakshit original https://aws.amazon.com/blogs/big-data/migrate-from-standard-brokers-to-express-brokers-in-amazon-msk-using-amazon-msk-replicator/
Amazon Managed Streaming for Apache Kafka (Amazon MSK) now offers a new broker type called Express brokers. It’s designed to deliver up to 3 times more throughput per broker, scale up to 20 times faster, and reduce recovery time by 90% compared to Standard brokers running Apache Kafka. Express brokers come preconfigured with Kafka best practices by default, support Kafka APIs, and provide the same low latency performance that Amazon MSK customers expect, so you can continue using existing client applications without any changes. Express brokers provide straightforward operations with hands-free storage management by offering unlimited storage without pre-provisioning, eliminating disk-related bottlenecks. To learn more about Express brokers, refer to Introducing Express brokers for Amazon MSK to deliver high throughput and faster scaling for your Kafka clusters.
Creating a new cluster with Express brokers is straightforward, as described in Amazon MSK Express brokers. However, if you have an existing MSK cluster, you need to migrate to a new Express based cluster. In this post, we discuss how you should plan and perform the migration to Express brokers for your existing MSK workloads on Standard brokers. Express brokers offer a different user experience and a different shared responsibility boundary, so using them on an existing cluster is not possible. However, you can use Amazon MSK Replicator to copy all data and metadata from your existing MSK cluster to a new cluster comprising of Express brokers.
MSK Replicator offers a built-in replication capability to seamlessly replicate data from one cluster to another. It automatically scales the underlying resources, so you can replicate data on demand without having to monitor or scale capacity. MSK Replicator also replicates Kafka metadata, including topic configurations, access control lists (ACLs), and consumer group offsets.
In the following sections, we discuss how to use MSK Replicator to replicate the data from a Standard broker MSK cluster to an Express broker MSK cluster and the steps involved in migrating the client applications from the old cluster to the new cluster.
Migrating from Standard brokers to Express brokers requires thorough planning and careful consideration of various factors. In this section, we discuss key aspects to address during the planning phase.
It’s crucial to evaluate the capacity and health of the current (source) cluster to make sure it can handle additional consumption during migration, because MSK Replicator will retrieve data from the source cluster. Key checks include:
CPU User and CPU System utilization per broker should remain below 60%.Let’s take an example where in your existing source cluster you have an average data ingress of 100 MBps and peak data ingress of 400 MBps with retention of 48 hours. Let’s assume you have one consumer of the data you produce to your Kafka cluster, which means that your egress traffic will be same compared to your ingress traffic. Based on this requirement, you can use the Amazon MSK sizing guide to calculate the broker capacity you need to safely handle this workload. In the spreadsheet, you will need to provide your average and maximum ingress/egress traffic in the cells, as shown in the following screenshot.

Because you need to replicate all the data produced in your Kafka cluster, the consumption will be higher than the regular workload. Taking this into account, your overall egress traffic will be at least twice the size of your ingress traffic.
However, when you run a replication tool, the resulting egress traffic will be higher than twice the ingress because you also need to replicate the existing data along with the new incoming data in the cluster. In the preceding example, you have an average ingress of 100 MBps and you retain data for 48 hours, which means that you have a total of approximately 18 TB of existing data in your source cluster that needs to be copied over on top of the new data that’s coming through. Let’s further assume that your goal for the replicator is to catch up in 30 hours. In this case, your replicator needs to copy data at 260 MBps (100 MBps for ingress traffic + 160 MBps (18 TB/30 hours) for existing data) to catch up in 30 hours. The following figure illustrates this process.

Therefore, in the sizing guide’s egress cells, you need to add an additional 260 MBps to your average data out and peak data out to estimate the size of the cluster you should provision to complete the replication safely and on time.

Replication tools act as a consumer to the source cluster, so there is a chance that this replication consumer can consume higher bandwidth, which can negatively impact the existing application client’s produce and consume requests. To control the replication consumer throughput, you can use a consumer-side Kafka quota in the source cluster to limit the replicator throughput. This makes sure that the replicator consumer will throttle when it goes beyond the limit, thereby safeguarding the other consumers. However, if the quota is set too low, the replication throughput will suffer and the replication might never end. Based on the preceding example, you can set a quota for the replicator to be at least 260 MBps, otherwise the replication will not finish in 30 hours.
VolumeReadBytes and VolumeWriteBytes metrics should be checked to make sure the source cluster volume throughput has additional bandwidth to handle any additional read from the disk. Depending on the cluster size and replication data volume, you should provision storage throughput in the cluster. With provisioned storage throughput, you can increase the Amazon EBS throughput up to 1000 MBps depending on the broker size. The maximum volume throughput can be specified depending on broker size and type, as mentioned in Manage storage throughput for Standard brokers in a Amazon MSK cluster. Based on the preceding example, the replicator will start reading from the disk and the volume throughput of 260 MBps will be shared across all the brokers. However, existing consumers can lag, which will cause reading from the disk, thereby increasing the storage read throughput. Also, there is storage write throughput due to incoming data from the producer. In this scenario, enabling provisioned storage throughput will increase the overall EBS volume throughput (read + write) so that existing producer and consumer performance doesn’t get impacted due to the replicator reading data from EBS volumes.Depending on the assessment, you might need to vertically scale up or horizontally scale out the source cluster before migration.
Use the same sizing tool to estimate the size of your Express broker cluster. Typically, fewer Express brokers might be needed compared to Standard brokers for the same workload because depending on the instance size, Express brokers allow up to three times more ingress throughput.
Express brokers employ opinionated and optimized Kafka configurations, so it’s important to differentiate between configurations that are read-only and those that are read/write during planning. Read/write broker-level configurations should be configured separately as a pre-migration step in the target cluster. Although MSK Replicator will replicate most topic-level configurations, certain topic-level configurations are always set to default values in an Express cluster: replication-factor, min.insync.replicas, and unclean.leader.election.enable. If the default values differ from the source cluster, these configurations will be overridden.
As part of the metadata, MSK Replicator also copies certain ACL types, as mentioned in Metadata replication. It doesn’t explicitly copy the write ACLs except the deny ones. Therefore, if you’re using SASL/SCRAM or mTLS authentication with ACLs rather than AWS Identity and Access Management (IAM) authentication, write ACLs need to be explicitly created in the target cluster.
Deployment of the target cluster can occur within the same virtual private cloud (VPC) or a different one. Consider any changes to client connectivity, including updates to security groups and IAM policies, during the planning phase.
Two migration strategies can be adopted:
Each strategy has its pros and cons. Choose the one that aligns best with your business needs. For insights, refer to Goldman Sachs’ migration strategy to move from on-premises Kafka to Amazon MSK.
Although MSK Replicator facilitates seamless data replication with minimal downtime, it’s essential to devise a clear cutover plan. This includes coordinating with stakeholders, stopping producers and consumers in the source cluster, and restarting them in the target cluster. If a failure occurs, you can roll back by redirecting the clients to use the source cluster.
When migrating from a Standard broker to an Express broker cluster, schema registry considerations remain unaffected. Clients can continue using existing schemas for both producing and consuming data with Amazon MSK.
In this setup, two Amazon MSK provisioned clusters are deployed: one with Standard brokers (source) and the other with Express brokers (target). Both clusters are located in the same AWS Region and VPC, with IAM authentication enabled. MSK Replicator is used to replicate topics, data, and configurations from the source cluster to the target cluster. The replicator is configured to maintain identical topic names across both clusters, providing seamless replication without requiring client-side changes.
During the first phase, the source MSK cluster handles client requests. Producers write to the clickstream topic in the source cluster, and a consumer group with the group ID clickstream-consumer reads from the same topic. The following diagram illustrates this architecture.

When data replication to the target MSK cluster is complete, we need to evaluate the health of the target cluster. After confirming the cluster is healthy, we need to migrate the clients in a controlled manner. First, we need to stop the producers, reconfigure them to write to the target cluster, and then restart them. Then, we need to stop the consumers after they have processed all remaining records in the source cluster, reconfigure them to read from the target cluster, and restart them. The following diagram illustrates the new architecture.

After verifying that all clients are functioning correctly with the target cluster using Express brokers, we can safely decommission the source MSK cluster with Standard brokers and the MSK Replicator.
In this section, we discuss the step-by-step process to replicate data from an MSK Standard broker cluster to an Express broker cluster using MSK Replicator and also the client migration strategy. For the purpose of the blog, “all at once” migration strategy is used.
Download the AWS CloudFormation template to provision the MSK cluster. Deploy the following in us-east-1 with stack name as migration.
This will create the VPC, subnets, and two Amazon MSK provisioned clusters: one with Standard brokers (source) and another with Express brokers (target) within the VPC configured with IAM authentication. It will also create a Kafka client Amazon Elastic Compute Cloud (Amazon EC2) instance where from we can use the Kafka command line to create and view Kafka topics and produce and consume messages to and from the topic.
On the Amazon EC2 console, connect to the EC2 instance named migration-KafkaClientInstance1 using Session Manager, a capability of AWS Systems Manager.
After you log in, you need to configure the source MSK cluster bootstrap address to create a topic and publish data to the cluster. You can get the bootstrap address for IAM authentication from the details page for the MSK cluster (migration-standard-broker-src-cluster) on the Amazon MSK console, under View Client Information. You also need to update the producer.properties and consumer.properties files to reflect the bootstrap address of the standard broker cluster.
Create a clickstream topic using the following commands:
Run the clickstream producer to generate events in the clickstream topic:
Open another Session Manager instance and from that shell, run the clickstream consumer to consume from the topic:
Post Syndicated from Lakshmi Nair original https://aws.amazon.com/blogs/big-data/foundational-blocks-of-amazon-sagemaker-unified-studio-an-admins-guide-to-implement-unified-access-to-all-your-data-analytics-and-ai/
Amazon SageMaker Unified Studio (preview) provides a unified experience for using data, analytics, and AI capabilities. You can use familiar AWS services for model development, generative AI, data processing, and analytics—all within a single, governed environment. Users can now build, deploy, and execute end-to-end workflows from a single interface. SageMaker Unified Studio is built on the foundations of Amazon DataZone, where it uses domains to categorize and structure the data assets, while offering project-based collaboration features that allow teams to securely share artifacts and work together across various compute services. This experience allows multiple personas to seamlessly collaborate, while operating under appropriate access controls and governance policies.
In this post, we focus on the admin persona and deep dive into the foundational building blocks while implementing the self-service access to all your data.
SageMaker Unified Studio offers an integrated development experience organized into three distinct planes, each serving different personas and purposes within the development lifecycle. This architecture enables seamless collaboration while maintaining clear boundaries of responsibility.
As shown in the following figure, each plane represents a distinct layer of functionality that works in harmony with the others to create a complete data and machine learning (ML) solution.

The planes are as follows:
In this post, we focus on the infrastructure plane deployment steps from an administrator’s perspective, outlining key responsibilities and actions required and how to configure and organize your assets under specific business units and teams and authorize policies during the initial setup phase.
As shown in the following figure, the infrastructure plane revolves around three pivotal operational paradigms: onboard, organize, and authorize.

The details of the three essential functions in the foundational layer are as follows:
Now that we have discussed the core functions, let’s delve into the workflow that brings these concepts together.
In the following figure, we break down the roles and responsibilities of domain owners to unit administrators through a sequence of operations, providing infrastructure deployment and management.

The workflow consists of the following steps:
Admins can also authorize project profile templates to specific users and groups, enforcing the capability to control resource deployment based on user personas. By default, all users are authorized to use default project profiles. However, this can be changed by the admin to limit the access of certain project profiles to certain users and groups.
The quick setup also establishes a default Git connection to AWS CodeCommit for users to manage their code repository. However, you also have the option to create and enable new Git connections to GitHub, GitHub Enterprise Server, GitLab, and GitLab self-managed. The Free Tier release of Amazon Q is enabled by default to all users of SageMaker Unified Studio domain. Amazon Q Developer Pro can be configured if IAM Identity Center is configured for users of the domain.
Finally, as part of the initial setup, the admin provides access to Amazon Bedrock serverless models.
In a multi-account scenario, the central admin associates AWS accounts, and the associated account admins accept the association and enable the blueprints for the project profiles that the central admin would create. Refer to the appendix at the end of this post for more details.
Steps 3 and 4 are optional as part of the quick deployment setup. Users can directly log in to SageMaker Unified Studio to build data products for their business use case if domain units are not part of immediate requirement. If no domain units are created, all users and groups fall back under the root domain level and authorization policies are applied on the root domain.
While users interact with a streamlined project creation interface in SageMaker Unified Studio, a sophisticated orchestration of components operates beneath the surface. This abstraction allows the admin to deploy infrastructure through simple selections while the system handles resource provisioning automatically. Let’s examine the underlying process behind the scenes, as illustrated in the following figure.

This workflow consists of the following steps:
In a multi-account scenario, the associated account admin enables the blueprints. However, the project profile creation happens at the root domain account. The project profile template will include the associated account details and the linked blueprints from the associated account. Refer to the appendix at the end of this post for more details.
Now that we have understood the functional building blocks of SageMaker Unified Studio, let’s proceed with the deployment walkthrough. We will create a domain using the quick setup deployment for single account. Refer to the appendix for multi-account deployment steps.
You will need to complete the following prerequisites before you can follow the instructions in the next section:
Complete the following steps to create a new SageMaker Unified Studio domain:


This will open a new tab to deploy the CloudFormation stack to create the VPC and the necessary private and public subnets.


The SSO user selected here is used as the administrator in SageMaker Unified Studio. If the account doesn’t have IAM Identity Center set up, then it will create an IAM Identity Center account instance, so long as the account is permitted to do so. An SSO or IAM user is required so that a user is able to log in to the studio after the domain is created.


On the domain detail page, the Amazon SageMaker Unified Studio URL is listed. You can authenticate with your IAM user credentials or with credentials from your IdP through IAM Identity Center or with your SAML credentials. To authorize users to log in to the URL, the administrator must onboard the users to the domain. We see this as part of the next steps.

Complete the following steps:
You can also add IAM roles for the purpose of managing the domain programmatically. However, you can’t use IAM roles to log in to the SageMaker Unified Studio URL. After you add the users, they will appear with the status Assigned. The status changes to Activated only when the user logs in to the SageMaker Unified Studio URL.

This enables domain users to publish and consume data from these AWS accounts.

For a multi-account setup, by sending an association request to another AWS account, you share the root domain with the other AWS account with AWS Resource Access Manger (AWS RAM). The associated admin domain owner accepts the invitation. To access the compute resources of the associated accounts from SageMaker Unified Studio, the associated domain owner must enable the necessary blueprints. Refer to the appendix to understand the cross-account deployment steps.
For the quick setup deployment, when you navigate to the Blueprints tab, you will notice all the blueprints are automatically enabled. Also, on the Project profiles tab, you will find default project profiles are available to the user.
Leave the rest of the tabs with the default options.
In the following example, we show the steps to create a custom project profile by bundling selected blueprints. We also show the steps to authorize only restricted users to use this project profile template. This example creates a custom project profile with selective blueprints. This enables the user to create a data lake environment with AWS Glue database and Athena workgroup to query the data. The user can also create an Amazon MWAA environment for orchestration. You can also change or override the configuration parameters of the blueprint by using the Tooling configurations option within the project profile.
Because SageMaker Unified Studio is in preview mode, the naming conventions of some visual elements might appear different in the current version.

When you create a project profile, you can add blueprint deployment settings in two modes: on create and on demand. On create mode allows you to deploy the blueprint deployment settings as soon as the project is created. On demand mode allows you to deploy the blueprint deployment settings when users need it.
In the following example, the administrator logs in to SageMaker Unified Studio and creates the retail domain unit. The admin also delegates ownership to the retail business user. The retail business user logs in to SageMaker Unified Studio and creates a project with the authorized project profile template.

With these configurations in place, you have successfully completed the initial infrastructure plane deployment from an administrative perspective.
By default, all domain users have authorization to create projects with the enabled blueprints across domain units. If you want to restrict the usage of the blueprint within a specific domain unit (in this case, the retail domain unit, as shown in the following screenshot), you need to revoke the existing permissions and authorize the specific domain units. By limiting the use of blueprints to a particular domain unit, users can only create projects using the blueprint within that domain unit. To apply authorization settings to child domain units, enable the Cascade to all child domain units option.

Make sure you remove the SageMaker Unified Studio resources to mitigate any unexpected costs. This involves a few steps:
amazon-datazone-AWSACCOUNTID-AWSREGION-DOMAINID.If you have additional resources that haven’t been deleted, you can also use tags to identify and delete specific resources.
In this post, we discussed the foundational building blocks of SageMaker Unified Studio and how, by abstracting complex technical implementations behind user-friendly interfaces, organizations can maintain standardized governance while enabling efficient resource management across business units. This approach provides consistency in infrastructure deployment while providing the flexibility needed for diverse business requirements.
To learn more, refer to the Amazon SageMaker Unified Studio Administrator Guide and the following resources:
This section illustrates the cross-account association. After the account invitation is accepted by the associated account owner, follow the instructions as shown in the following example to understand how to enable the blueprints. After the blueprints are enabled in the associate accounts, the root domain account can create project profile templates with the parameters of the associated account, including its linked blueprints. The example then demonstrates how the retail domain unit user can deploy compute resources and create data using the resources from the associated account.

 Lakshmi Nair is a Senior Analytics Specialist Solutions Architect at AWS. She specializes in designing advanced analytics systems across industries. She focuses on crafting cloud-based data platforms, enabling real-time streaming, big data processing, and robust data governance. She can be reached via LinkedIn.
 Fabrizio Napolitano is a Principal Specialist Solutions Architect for DB and Analytics. He has worked in the analytics space for the last 20 years, and has recently and quite by surprise become a Hockey Dad after moving to Canada.
Post Syndicated from Home Assistant original https://www.youtube.com/watch?v=RVNHzREEwmM
Post Syndicated from Chris Opat original https://www.backblaze.com/blog/exabyte-scale-hard-drive-investments/
Not many companies run exabyte scale data platforms, and not many companies open source their drive data—at Backblaze, we do both. From that perch, I’m sharing how I think about buying hard drives at exabyte scale, including the intentional design decisions and trade-offs I make as an expert in the field, and what you can apply to your own operations whether you’re running a couple hundred terabytes or petabytes on-premises.
You’d think, as a cloud platform managing massive amounts of data, we’d be delighted that drive density continues to grow. But it’s not as simple as that. While we do run cohorts of 20TB+ drives in our environment, there are a few reasons it doesn’t always make sense to fill our servers up with the densest drives we can buy.
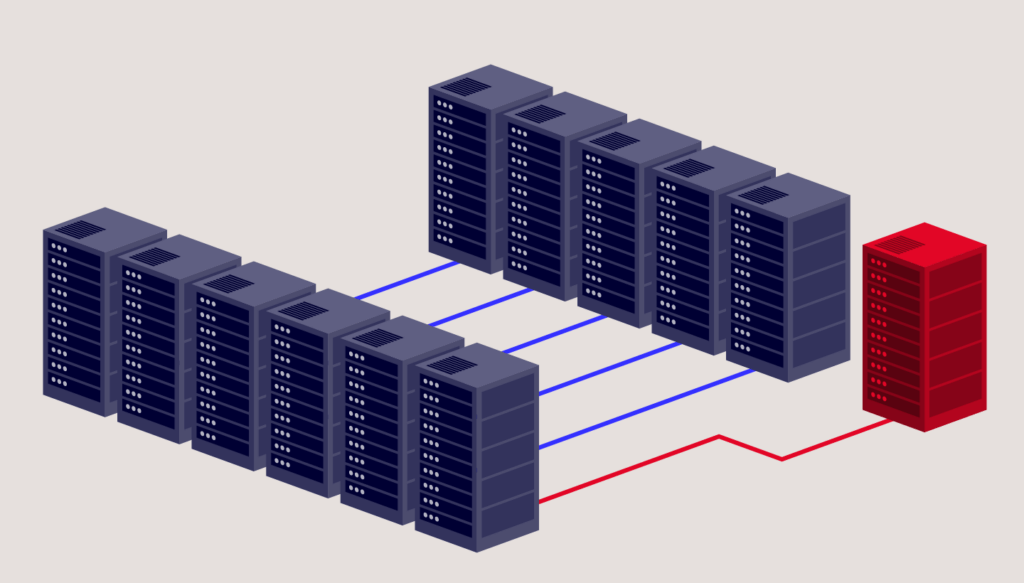
Drives have a finite amount of capacity to perform input/output operations per second (IOPS). The larger the drive, the more those IOPS become a contentious consumable—creating a triangle of tension between storage capacity, reading, and writing. You can store more data on a 20TB drive, but you can only read and write as fast as that one drive allows. Conversely, you can store the same amount of data on five 4TB drives and 5x your IOPS capacity through concurrency.
For high demand workloads with high concurrency requirements for reading and writing files—like AI inferencing, for example—you’ll want to carefully consider the balance point between the right drive size and the performance you need to get out of the system. The ability to read, write, or delete content has to peacefully coexist with the ability for your storage infrastructure to service any of those three needs. Now, you might be thinking: If that’s a constraint, what about SSDs? I’ll get to that down below.
When managing large data at scale we employ Reed-Solomon erasure coding to rebuild drives upon failure to maintain data durability. The larger the drive, the more painful and slow the rebuild when that drive eventually fails. The rebuild process can take hours or even days, depending on the size of the drive and the workload on the system. That can impact performance, especially if the storage system is already under heavy use, and increases the risk of another failure while the rebuild is in progress. While we mitigate that risk in a variety of ways, it may not be feasible for smaller shops to do so.
If you’re in a business that relies on real-time data access—financial institutions, healthcare providers, e-commerce platforms, for example—you need drives that balance capacity and rebuild speed. Higher-capacity drives may offer better storage density but smaller or enterprise-grade drives with faster rebuild times and higher endurance may be a better choice for businesses where continuous uptime and/or durability is critical.
The moral of the story is that the way you invest in drives, and how much you take things like drive size, drive type, and the failure rates we publish into consideration absolutely depends on your use case. It’s not as simple as looking at our Drive Stats and picking the drive with the lowest annualized failure rate.
In Backblaze’s early days, when we were focused on consumer backup, drive density and durability were the most important part of the equipment for us. We didn’t care about speed. As our customers increasingly bring us newer and more demanding use cases, our calculus for the kinds of drives we fill our data centers with will change with them.
The post Exabyte Scale Hard Drive Investments appeared first on Backblaze Blog | Cloud Storage & Cloud Backup
Post Syndicated from corbet original https://lwn.net/Articles/1009528/
The Asahi Linux project, which is working to support Linux on Apple
silicon, has announced the
resignation of Hector “marcan” Martin as its lead, and his replacement by a
seven-person committee. “Today’s news is bittersweet. We are grateful
“. Martin has explained his reasons
to marcan for kicking off this project and tirelessly working on it these
past years. Our community will miss him. Still, with your support, the
project has a bright future to come
for leaving at length in this
blog post.
Post Syndicated from corbet original https://lwn.net/Articles/1009522/
The openSUSE project has announced
that future installations of the Tumbleweed rolling distribution will use
SELinux for mandatory access control rather than AppArmor. Existing
installations will not be migrated, and AppArmor will continue to be
maintained for Tumbleweed. The openSUSE Leap 15 distribution is not changing.
Post Syndicated from corbet original https://lwn.net/Articles/1009039/
Huge pages can increase the performance of many programs, but they can also
have unfortunate performance impacts of their own. Over the last few
years, multi-size transparent huge pages (mTHPs) have increasingly been
seen as a happy medium that bring the benefits of huge pages at a lower cost.
The system cannot benefit from mTHPs, though, if it does not create them;
two developers have independently posted patches to enable the creation of
mTHPs in the background.
Post Syndicated from Stephen Fewer original https://blog.rapid7.com/2025/02/13/cve-2025-1094-postgresql-psql-sql-injection-fixed/

Rapid7 discovered a high-severity SQL injection vulnerability, CVE-2025-1094, affecting the PostgreSQL interactive tool psql. This discovery was made while Rapid7 was performing research into the recent exploitation of CVE-2024-12356 — an unauthenticated remote code execution (RCE) vulnerability that affects both BeyondTrust Privileged Remote Access (PRA) and BeyondTrust Remote Support (RS). Rapid7 discovered that in every scenario we tested, a successful exploit for CVE-2024-12356 had to include exploitation of CVE-2025-1094 in order to achieve remote code execution. While CVE-2024-12356 was patched by BeyondTrust in December 2024, and this patch successfully blocks exploitation of both CVE-2024-12356 and CVE-2025-1094, the patch did not address the root cause of CVE-2025-1094, which remained a zero-day until Rapid7 discovered and reported it to PostgreSQL.
All supported versions before PostgreSQL 17.3, 16.7, 15.11, 14.16, and 13.19 are affected. CVE-2025-1094 has a CVSS 3.1 base score of 8.1 (High). More information is available in the PostgreSQL advisory.
CVE-2025-1094 arises from an incorrect assumption that when attacker-controlled untrusted input has been safely escaped via PostgreSQL’s string escaping routines, it cannot be leveraged to generate a successful SQL injection attack. Rapid7 found that SQL injection is, in fact, still possible in a certain scenario when escaped untrusted input is included as part of a SQL statement executed by the interactive psql tool.
Because of how PostgreSQL string escaping routines handle invalid UTF-8 characters, in combination with how invalid byte sequences within the invalid UTF-8 characters are processed by psql, an attacker can leverage CVE-2025-1094 to generate a SQL injection.
An attacker who can generate a SQL injection via CVE-2025-1094 can then achieve arbitrary code execution (ACE) by leveraging the interactive tool’s ability to run meta-commands. Meta-commands extend the interactive tools functionality, by providing a wide variety of additional operations that the interactive tool can perform. The meta-command, identified by the exclamation mark symbol, allows for an operating system shell command to be executed. An attacker can leverage CVE-2025-1094 to perform this meta-command, thus controlling the operating system shell command that is executed.
Alternatively, an attacker who can generate a SQL injection via CVE-2025-1094 can execute arbitrary attacker-controlled SQL statements.
This vulnerability was discovered by Stephen Fewer, Principal Security Researcher at Rapid7 and is being disclosed in accordance with Rapid7’s vulnerability disclosure policy.
A technical analysis of CVE-2025-1094, as it relates to the exploitation of the BeyondTrust vulnerability CVE-2024-12356, is available in AttackerKB.
A Metasploit exploit module that exploits CVE-2025-1094 against a vulnerable BeyondTrust Privileged Remote Access (PRA) and Remote Support (RS) target is available here.
The PostgreSQL Global Development Group provides information on security vulnerability reporting, releases processes, and known vulnerability fixes at https://www.postgresql.org/support/security/.
To remediate CVE-2025-1094, PostgreSQL users should upgrade to PostgreSQL 17.3, 16.7, 15.11, 14.16, or 13.19. For additional details, please see the PostgreSQL advisory.
InsightVM and Nexpose customers will be able to assess their exposure to CVE-2025-1094 with an authenticated vulnerability check expected to be available in today’s (February 13) content release.
For CVE-2024-12356 affecting BeyondTrust Privileged Remote Access (PRA) and Remote Support (RS) products, InsightVM and Nexpose customers have been able to assess exposure with authenticated checks for Windows systems (Scan Engine only checks) as of the February 10, 2025 content release.
Post Syndicated from digiblur DIY original https://www.youtube.com/watch?v=GXVZaSN-Q-Y
Post Syndicated from Sahidya Devadoss original https://blog.cloudflare.com/introducing-automatic-audit-logs/
Audit logs are a critical tool for tracking and recording changes, actions, and resource access patterns within your Cloudflare environment. They provide visibility into who performed an action, what the action was, when it occurred, where it happened, and how it was executed. This enables security teams to identify vulnerabilities, ensure regulatory compliance, and assist in troubleshooting operational issues. Audit logs provide critical transparency and accountability. That’s why we’re making them “automatic” — eliminating the need for individual Cloudflare product teams to manually send events. Instead, audit logs are generated automatically in a standardized format when an action is performed, providing complete visibility and ensuring comprehensive coverage across all our products.
We’re excited to announce the beta release of Automatic Audit Logs — a system that unifies audit logging across Cloudflare products. This new system is designed to give you a complete and consistent view of your environment’s activity. Here’s how we’ve enhanced our audit logging capabilities:
Standardized logging: Previously, audit logs generation was dependent on separate internal teams, which could lead to gaps and inconsistencies. Now, audit logs are automatically produced in a seamless and standardized way, eliminating reliance on individual teams and ensuring consistency across all Cloudflare services.
Expanded Product Coverage: Automatic Audit Logs now extend our coverage from 62 to 111 products, boosting overall coverage from 75% to 95%. We now capture actions from key endpoints such as the /accounts, /zones, and /organizations APIs.
Granular Filtering: With uniformly formatted logs, you can quickly pinpoint specific actions, users, methods, and resources, making investigations faster and more efficient.
Enhanced Context and Transparency: Each log entry includes detailed context like the authentication method used, whether the action was performed via the API or Dashboard, and mappings to Cloudflare Ray IDs for better traceability.
Comprehensive Activity Capture: In addition to create, edit, and delete actions, the system now records GET requests and failed attempts, ensuring that no critical activity goes unnoticed.
This new system reflects Cloudflare’s commitment to building a safer, more transparent Internet. It also supports Cloudflare’s pledge to CISA’s Cybersecurity Commitment, reinforcing our dedication to increase our customers’ ability to gather evidence of cybersecurity intrusions.
Automatic Audit Logs (beta release) is available exclusively through the API.
At Cloudflare, we’ve always made audit logs available through the Audit Log API, but the experience has not been very consistent.
Why? Individual product teams were responsible for creating and maintaining their audit logs. This resulted in inconsistencies, gaps in coverage, and a fragmented user experience
Recognizing the importance of reliable audit logs, we set out to improve coverage across all Cloudflare products. Our goal was to standardize, secure, and automate the process, giving users comprehensive insights into user-initiated actions while enhancing visibility and usability. Let’s take a closer look at how an audit log is created at Cloudflare.
Audit logs are generated for all user requests made via the public API or the Cloudflare dashboard. While a few exceptions exist, such as GraphQL requests and static assets, the majority of user actions are captured.
When a user action occurs, the request is forwarded to our audit logging pipeline. This ensures logs are generated automatically for all products, close to the source of the action, and capturing the most relevant details.
For RESTful APIs that produce JSON, sanitized request bodies are logged to prevent any sensitive information from being included in the audit logs. For GET requests, which are typically read-only and may generate large responses, only the action performed and the resource accessed are logged, avoiding unnecessary overhead while still maintaining essential visibility.
Any user-initiated action on Cloudflare, whether through the API or the Dashboard, is handled by the API Gateway. The HTTP request, along with its corresponding request and response data, is then forwarded to a Worker called the Audit Log Redactor. This allows audit logging to happen automatically without relying on internal teams to send events.
To minimise the latency, the API Gateway streams these requests to the redactor Worker via RPC (Remote Procedure Calls) using service bindings. This approach ensures the requests are successfully sent without going through a publicly-accessible URL.
Once the Worker receives the HTTP request, it references the Cloudflare OpenAPI Schema to handle sensitive information. OpenAPI is a widely adopted, machine-readable, and human-friendly specification format that is used to define HTTP APIs. It relies on JSON Schema to describe the API’s underlying data.
Using the OpenAPI Schema, the redactor Worker identifies the corresponding API schema for the HTTP request. It then redacts any sensitive information, leaving only those explicitly marked as auditable in the schema. This redaction process ensures that no sensitive data progresses further down the pipeline while retaining enough information to debug and analyze how an action impacted a resource’s value.
Each Cloudflare product team defines its APIs within the OpenAPI schema and marks specific fields as auditable. This provides visibility into resource changes while safeguarding sensitive data.
Once redacted, the data moves through Cloudflare’s data pipeline. This pipeline includes several key components including Logfwdr, Logreceiver and Buftee buffers, where the sanitized data is eventually pushed, awaiting further processing.

The Ingestor service consumes messages from Buftee buffers and transforms individual requests into audit log records. Using a fixed schema, the Ingestor ensures that audit logs remain standardized across all Cloudflare products, regardless of scale.
Because API Gateway — the system from which the majority of Automatic Audit Logs are recorded, as noted above — handles tens of thousands of requests per second, the Ingestor was designed to process multiple requests concurrently.

Plot of audit requests rate. x-axis indicates the time and y-axis indicates the total number of audit requests handled per second.
From a security perspective, it is critical to capture who initiated a change and how they were authenticated. To achieve this, the audit log is enriched with user details and authentication information extracted from custom response headers.
Additional contextual details, such as the account name, are retrieved by making calls to internal services. To enhance performance, a read-through caching mechanism is used. The system checks the cache for responses first and if unavailable, it fetches the data from internal services and caches it for future use.
Once the audit logs are fully transformed and enriched, they are stored in a database in batches to prevent overwhelming the system. For the beta release, we are storing 30 days of audit logs in the database. This will be extended to 18 months for our GA (General Availability) release in the second half of 2025.
Here is a complete sample audit log generated when an alert notification policy is updated. It provides all the essential details to answer the who, what, when, where, and how of the action.
Audit logs are always associated with an account, and some actions also include user and zone information when relevant. The action section outlines what changed and when, while the actor section provides context on who made the change and how it was performed, including whether it was done via the API or through the UI.
Information about the resource is also included, so you can easily identify what was altered (in this case, the Advanced Security Events Alert was updated). Additionally, raw API request details are provided, allowing users to trace the audit log back to a specific API call.
curl -X PUT https://api.cloudflare.com/client/v4/accounts/<account_id>/alerting/v3/policies/<policy_id> --data-raw '{...'} {
"account": {
"id": "<account_id>",
"name": "Example account"
},
"action": {
"description": "Update a Notification policy",
"result": "success",
"time": "2025-01-23T18:25:14.749Z",
"type": "update"
},
"actor": {
"context": "dash",
"email": "[email protected]",
"id": "<actor-id>",
"ip_address": "127.0.0.1",
"token": {},
"type": "user"
},
"id": "<audit_log_id>",
"raw": {
"cf_ray_id": "<ray_id>",
"method": "PUT",
"status_code": 200,
"uri": "/accounts/<account_id>/alerting/v3/policies/<policy_id>",
"user_agent": "Postman"
},
"resource": {
"id": "<resource-id>",
"product": "alerting",
"request": {
"alert_type": "clickhouse_alert_fw_ent_anomaly",
"enabled": false,
"filters": {
"services": [
"securitylevel",
"ratelimit",
"firewallrules"
],
"zones": [
"<zone_id>"
]
},
"name": "Advanced Security Events Alert"
},
"response": {
"id": "<resource_id>"
},
"scope": "accounts",
"type": "policies"
}For General Availability (GA) we are focusing on developing a new user interface in the Dashboard for Automatic Audit Logs, extracting additional auditable fields for the audit logs — including system-initiated actions and user-level actions such as login events — and enabling audit log export via Logpush. In the longer term, we plan to introduce dashboards, trend analysis, and alerting features for audit logs to further enhance their utility and ease of use. By enhancing our audit log system, Cloudflare is taking another step toward empowering users to manage their environments with greater transparency, security, and efficiency.
Automatic Audit Logs are now available for testing. We encourage you to explore the new features and provide your valuable feedback.
Retrieve audit logs using the following endpoint:
/accounts/<account_id>/logs/audit?since=<date>&before=<date>
You can access detailed documentation for Automatic Audit Logs Beta API release here.
Please note that the Beta release does not include updates to the Audit Logs UI in the Cloudflare Dashboard. The existing UI and API for the current audit logs will remain available until we Automatic Audit Logs reach General Availability.
We want your feedback: Your feedback is essential to improving Automatic Audit Logs. Please consider filling out a short survey.
Post Syndicated from jake original https://lwn.net/Articles/1009450/
Security updates have been issued by AlmaLinux (doxygen and openssl), Debian (dcmtk and webkit2gtk), Fedora (chromium, clevis-pin-tpm2, envision, fido-device-onboard, gotify-desktop, keylime-agent-rust, keyring-ima-signer, libkrun, python3.10, python3.11, python3.14, rust-afterburn, rust-cargo-vendor-filterer, rust-coreos-installer, rust-eif_build, rust-gst-plugin-reqwest, rust-nu, rust-openssl, rust-openssl-sys, rust-pore, rust-rpm-sequoia, rust-sequoia-keyring-linter, rust-sequoia-octopus-librnp, rust-sequoia-policy-config, rust-sequoia-sqv, rust-sevctl, rust-snphost, rust-tealdeer, rustup, and s390utils), Mageia (ffmpeg, php-tcpdf, python-tornado, and subversion), Red Hat (openssl and python-jinja2), SUSE (crun, glibc, kernel, libngtcp2-16, libtasn1, netty, ovmf, podman, python, and python3), and Ubuntu (ansible, digikam, linux-aws, linux-aws-5.15, linux-azure-6.8, and ruby2.7).
Post Syndicated from Bruce Schneier original https://www.schneier.com/blog/archives/2025/02/doge-as-a-national.html
In the span of just weeks, the US government has experienced what may be the most consequential security breach in its history—not through a sophisticated cyberattack or an act of foreign espionage, but through official orders by a billionaire with a poorly defined government role. And the implications for national security are profound.
First, it was reported that people associated with the newly created Department of Government Efficiency (DOGE) had accessed the US Treasury computer system, giving them the ability to collect data on and potentially control the department’s roughly $5.45 trillion in annual federal payments.
Then, we learned that uncleared DOGE personnel had gained access to classified data from the US Agency for International Development, possibly copying it onto their own systems. Next, the Office of Personnel Management—which holds detailed personal data on millions of federal employees, including those with security clearances—was compromised. After that, Medicaid and Medicare records were compromised.
Meanwhile, only partially redacted names of CIA employees were sent over an unclassified email account. DOGE personnel are also reported to be feeding Education Department data into artificial intelligence software, and they have also started working at the Department of Energy.
This story is moving very fast. On Feb. 8, a federal judge blocked the DOGE team from accessing the Treasury Department systems any further. But given that DOGE workers have already copied data and possibly installed and modified software, it’s unclear how this fixes anything.
In any case, breaches of other critical government systems are likely to follow unless federal employees stand firm on the protocols protecting national security.
The systems that DOGE is accessing are not esoteric pieces of our nation’s infrastructure—they are the sinews of government.
For example, the Treasury Department systems contain the technical blueprints for how the federal government moves money, while the Office of Personnel Management (OPM) network contains information on who and what organizations the government employs and contracts with.
What makes this situation unprecedented isn’t just the scope, but also the method of attack. Foreign adversaries typically spend years attempting to penetrate government systems such as these, using stealth to avoid being seen and carefully hiding any tells or tracks. The Chinese government’s 2015 breach of OPM was a significant US security failure, and it illustrated how personnel data could be used to identify intelligence officers and compromise national security.
In this case, external operators with limited experience and minimal oversight are doing their work in plain sight and under massive public scrutiny: gaining the highest levels of administrative access and making changes to the United States’ most sensitive networks, potentially introducing new security vulnerabilities in the process.
But the most alarming aspect isn’t just the access being granted. It’s the systematic dismantling of security measures that would detect and prevent misuse—including standard incident response protocols, auditing, and change-tracking mechanisms—by removing the career officials in charge of those security measures and replacing them with inexperienced operators.
The Treasury’s computer systems have such an impact on national security that they were designed with the same principle that guides nuclear launch protocols: No single person should have unlimited power. Just as launching a nuclear missile requires two separate officers turning their keys simultaneously, making changes to critical financial systems traditionally requires multiple authorized personnel working in concert.
This approach, known as “separation of duties,” isn’t just bureaucratic red tape; it’s a fundamental security principle as old as banking itself. When your local bank processes a large transfer, it requires two different employees to verify the transaction. When a company issues a major financial report, separate teams must review and approve it. These aren’t just formalities—they’re essential safeguards against corruption and error. These measures have been bypassed or ignored. It’s as if someone found a way to rob Fort Knox by simply declaring that the new official policy is to fire all the guards and allow unescorted visits to the vault.
The implications for national security are staggering. Sen. Ron Wyden said his office had learned that the attackers gained privileges that allow them to modify core programs in Treasury Department computers that verify federal payments, access encrypted keys that secure financial transactions, and alter audit logs that record system changes. Over at OPM, reports indicate that individuals associated with DOGE connected an unauthorized server into the network. They are also reportedly training AI software on all of this sensitive data.
This is much more critical than the initial unauthorized access. These new servers have unknown capabilities and configurations, and there’s no evidence that this new code has gone through any rigorous security testing protocols. The AIs being trained are certainly not secure enough for this kind of data. All are ideal targets for any adversary, foreign or domestic, also seeking access to federal data.
There’s a reason why every modification—hardware or software—to these systems goes through a complex planning process and includes sophisticated access-control mechanisms. The national security crisis is that these systems are now much more vulnerable to dangerous attacks at the same time that the legitimate system administrators trained to protect them have been locked out.
By modifying core systems, the attackers have not only compromised current operations, but have also left behind vulnerabilities that could be exploited in future attacks—giving adversaries such as Russia and China an unprecedented opportunity. These countries have long targeted these systems. And they don’t just want to gather intelligence—they also want to understand how to disrupt these systems in a crisis.
Now, the technical details of how these systems operate, their security protocols, and their vulnerabilities are now potentially exposed to unknown parties without any of the usual safeguards. Instead of having to breach heavily fortified digital walls, these parties can simply walk through doors that are being propped open—and then erase evidence of their actions.
The security implications span three critical areas.
First, system manipulation: External operators can now modify operations while also altering audit trails that would track their changes. Second, data exposure: Beyond accessing personal information and transaction records, these operators can copy entire system architectures and security configurations—in one case, the technical blueprint of the country’s federal payment infrastructure. Third, and most critically, is the issue of system control: These operators can alter core systems and authentication mechanisms while disabling the very tools designed to detect such changes. This is more than modifying operations; it is modifying the infrastructure that those operations use.
To address these vulnerabilities, three immediate steps are essential. First, unauthorized access must be revoked and proper authentication protocols restored. Next, comprehensive system monitoring and change management must be reinstated—which, given the difficulty of cleaning a compromised system, will likely require a complete system reset. Finally, thorough audits must be conducted of all system changes made during this period.
This is beyond politics—this is a matter of national security. Foreign national intelligence organizations will be quick to take advantage of both the chaos and the new insecurities to steal US data and install backdoors to allow for future access.
Each day of continued unrestricted access makes the eventual recovery more difficult and increases the risk of irreversible damage to these critical systems. While the full impact may take time to assess, these steps represent the minimum necessary actions to begin restoring system integrity and security protocols.
Assuming that anyone in the government still cares.
This essay was written with Davi Ottenheimer, and originally appeared in Foreign Policy.