Post Syndicated from Explosm.net original https://explosm.net/comics/nature-is-beautiful
New Cyanide and Happiness Comic
Post Syndicated from Explosm.net original https://explosm.net/comics/nature-is-beautiful
New Cyanide and Happiness Comic
Post Syndicated from corbet original https://lwn.net/Articles/956765/
The 6.7 kernel was released
on January 7 after a ten-week development cycle. This was, as it
turns out, the busiest cycle ever with regard to the number of changesets
merged. The time has come for our usual look at where all those changesets
came from, with a side trip into how long kernel developers tend to stick
around.
Post Syndicated from Cliff Robinson original https://www.servethehome.com/nvidia-geforce-rtx-4080-super-at-ces-2024/
For CES 2024, we get the mid-cycle NVIDIA GeForce RTX 4000 Super refresh with cards like the new NVIDIA GeForce RTX 4080 Super
The post NVIDIA GeForce RTX 4080 Super at CES 2024 appeared first on ServeTheHome.
Post Syndicated from Crosstalk Solutions original https://www.youtube.com/watch?v=7JNXghzzaZc
Post Syndicated from Cliff Robinson original https://www.servethehome.com/amd-ryzen-8000g-processors-launched-for-the-ai-pc-era/
The new AMD Ryzen 8000G desktop CPU family has some SKUs built for the AI PC era with built-in XDNA NPU acceleration
The post AMD Ryzen 8000G Processors Launched for the AI PC Era appeared first on ServeTheHome.
Post Syndicated from jake original https://lwn.net/Articles/957148/
Greg Kroah-Hartman has announced the release of the 5.4.266, 4.19.304, and 4.14.335 stable kernels. They contain
important fixes throughout the kernel tree.
Post Syndicated from Емилия Милчева original https://www.toest.bg/dzentulmenite-s-kusmet-rotatsiyata-produlzhava/

Мюретата са част от политическата игра. Когато общественото внимание и енергия упорито биват насочвани към конкретна тема, обикновено става въпрос за договаряне далеч от камерите – и за съвсем друго. Ето че технологията на ротацията на премиера на ПП–ДБ акад. Николай Денков с настоящата вицепремиерка Мария Габриел от ГЕРБ измести темата за смените на министри и далеч по-важната – за механизма за номинации за членове на регулаторите.
След като е налице желанието на съдружниците в управлението то да продължи, значи ротацията ще се осъществи. Останалото е несъществено от гледна точка на обществения интерес.
Смяна през март ще има, правителството с премиер Мария Габриел ще е с мандата на ГЕРБ–СДС. Двама-трима министри ще бъдат сменени. Асен Василев остава министър на финансите, вероятно ще е и вицепремиер. Под въпрос е дали настоящият министър-председател акад. Николай Денков ще е вицепремиер – освен министър на образованието и науката. Наред с това ще се състои и смяната на председателя на 49-тото НС Росен Желязков от ГЕРБ с Никола Минчев от „Продължаваме промяната“.
Всичко можеше да е по-честно и обществено приемливо, ако беше подписано коалиционно споразумение, където фигурира и механизмът на ротация, както го направиха в Румъния Националнолибералната и Социалдемократическата партия, със срок до провеждането на следващите редовни парламентарни избори. (Третият партньор, подписал споразумението – Демократичният съюз на унгарците в Румъния, напусна коалицията.) Документът предвижда ротация на премиера и размяна на няколко министерства между двете партии. Но в България ПП–ДБ и ГЕРБ–СДС заложиха на джентълменска дума, упорито избягвайки да подпишат документ, легитимиращ партньорството им.
Лидерът на ГЕРБ Бойко Борисов искаше коалиционно споразумение. От ПП–ДБ упорстваха за някакъв Механизъм за гарантиране на реформаторската програма на правителството, първа точка в който отново бяха назначенията в регулаторите. Нито едното бе възприето, нито другото, но след като управленският съюз укрепва, „коалиция“ звучи далеч по-добре от обидното „сглобка“ или ироничното „не-коалиция“. А и внася известна прозрачност.
Бездруго вече няма защо да се крият.
Но пък заради ДПС „узаконяването“ на връзката става някак… комплицирано – хем за управление са се разбрали две коалиции, хем управляващото мнозинство в действителност е на три крака.
Какво имаме дотук? Декларация за национално отговорно управление на ПП–ДБ и ГЕРБ–СДС от май миналата година, в която са записани няколко принципа освен известните цели за Шенген и еврозоната. Ротация „за последователни периоди“ от по 9 месеца (с неуточнен брой). Излъчване на правителство с втория мандат. Задължението да бъдат подготвени и приети промени в Конституцията, включително в структурата на прокуратурата и ВСС. „Механизъм за предварително съгласуване между парламентарните групи на номинациите за регулаторните органи, избирани от парламента, с оглед гарантиране на най-добрия подбор на личности с високи професионални и морални качества.“
В края на първата и началото на новата „бременност“ с власт такъв механизъм още не е подготвен или поне не е обществено известен, и то в годината, в която предстои обновяването на регулаторите и на съдебните кадровици.
Налице е и управленска програма на правителството „Денков–Габриел“ от 146 страници плюс законодателни приоритети. Стоп. Законодателните приоритети, обявени през септември миналата година, са договорени обаче не само между ПП–ДБ и ГЕРБ–СДС, но и с участието на ДПС. Конституционните промени бяха приети и с гласовете на Движението, което е вкарано и при назначенията в регулаторите. Но въпреки че ДПС са част от конституционното и евроатлантическото мнозинство, изобщо от мнозинството зад правителството, джентълменската дума е само между ПП–ДБ и ГЕРБ–СДС.
Логично би било и едно (eвентуално) коалиционно споразумение да е между тях – но къде тогава остава ДПС! Партията на Доган отсъства от декларацията с принципи за управление, където фигурира механизмът за назначения. Допускайки я до квота, двете коалиции в действителност нарушават декларирани принципи, качвайки на автостоп третия партньор във властта.
В ПП–ДБ не обичат думата „квота“, убеждавайки, че ще се излъчват безспорни професионалисти с обществена подкрепа и доверие. Някак трудно е за вярване при повече от десетилетие негативна селекция в съдебната система, констатирана от експерти и анализатори и целенасочено осъществявана от ГЕРБ и ДПС къде с помощта, къде с мълчаливото съгласие на БСП. Първо, че отнякъде ще се изнамерят такива кадри, второ – че ще бъдат допуснати в системата.
Този път се очаква правителството, което ще бъде гласувано през март, да е с мандата на ГЕРБ–СДС – политическата сила, първа на парламентарните избори на 2 април. И Борисов, и премиерът Николай Денков отбелязаха, че така ротацията на премиерите ще е най-лесна. Това е и компенсация за ГЕРБ, които отказаха първия мандат след вота, за да се сглоби кабинет с втория – на ПП–ДБ. Сега, в четвъртия триместър управление, получават и своето правителство.
В крайна сметка няма значение кой е носителят на мандата, след като има зад гърба си същото мнозинство – ГЕРБ–СДС, ПП–ДБ, ДПС, и това мнозинство ще диктува какво да се приеме и какво да се отхвърли.
Включването на ДПС помогна за приемане на конституционните промени. Но се оказа най-удобно за ГЕРБ. Двете политически сили често се обединяваха, проваляйки достатъчно смислени предложения, за да защитят свои бизнес интереси. Например изобщо отхвърлиха каквито и да било промени при търговете за онколекарства и така беше запазена досегашната практика НЗОК да плаща на различните болници лекарства с до 20 пъти разлика в цените.
Отрязаха предложението и частните болници да обявяват обществени поръчки, защото настоящата ситуация води до същото – оскъпяване на едни и същи лекарства, тъй като повечето частни лечебни заведения имат свои дистрибуторски фирми, а НЗОК плаща и на едните, и на другите с обществен ресурс. А в самото начало при разпределянето на парламентарните комисии ГЕРБ отстъпиха част от своите председателски места на ДПС.
Тандемът ГЕРБ–ДПС има отработено стиковане и в тройното мнозинство представлява един друг политически сбор, на който допреди година се противопоставяха „Продължаваме промяната“ и „Демократична България“.
Технологията за ротацията е като при оставка на правителството и преди дни конституционалисти обясниха как ще се случи. Премиерът подава оставка, което означава оставка и на правителството, и започва въртележката с мандатите. Президентът връчва мандата на лице, посочено от ГЕРБ–СДС, в случая Мария Габриел, и следват номинациите на министрите. До началото на март обаче трите политически сили – да, и ДПС също – ще трябва да се разберат кои министри да бъдат сменени и кои ще са новите персони за тези овакантени позиции.
Но на първо време в дневния ред на парламента и управляващото мнозинство е изборът на двама конституционни съдии, забавен повече от две години. Според сайта Lex.bg най-спряганите имена са на проф. Екатерина Михайлова и на настоящия правосъден министър доц. Атанас Славов.
Така че коалицията ще продължи да управлява и през 2024 г. Само някакъв черен лебед би попречил на второто 9-месечие. Но понякога и черните лебеди са мюрета.
Post Syndicated from jake original https://lwn.net/Articles/957146/
Security updates have been issued by Debian (exim4), Fedora (chromium, perl-Spreadsheet-ParseExcel, python-aiohttp, python-pysqueezebox, and tinyxml), Gentoo (Apache Batik, Eclipse Mosquitto, firefox, R, Synapse, and util-linux), Mageia (libssh2 and putty), Red Hat (squid), SUSE (libxkbcommon), and Ubuntu (gnutls28).
Post Syndicated from Colin Douch http://blog.cloudflare.com/author/colin/ original https://blog.cloudflare.com/an-overview-of-cloudflares-logging-pipeline

One of the roles of Cloudflare’s Observability Platform team is managing the operation, improvement, and maintenance of our internal logging pipelines. These pipelines are used to ship debugging logs from every service across Cloudflare’s infrastructure into a centralised location, allowing our engineers to operate and debug their services in near real time. In this post, we’re going to go over what that looks like, how we achieve high availability, and how we meet our Service Level Objectives (SLOs) while shipping close to a million log lines per second.
Logging itself is a simple concept. Virtually every programmer has written a Hello, World! program at some point. Printing something to the console like that is logging, whether intentional or not.
Logging pipelines have been around since the beginning of computing itself. Starting with putting string lines in a file, or simply in memory, our industry quickly outgrew the concept of each machine in the network having its own logs. To centralise logging, and to provide scaling beyond a single machine, we invented protocols such as the BSD Syslog Protocol to provide a method for individual machines to send logs over the network to a collector, providing a single pane of glass for logs over an entire set of machines.
Our logging infrastructure at Cloudflare is a bit more complicated, but still builds on these foundational principles.
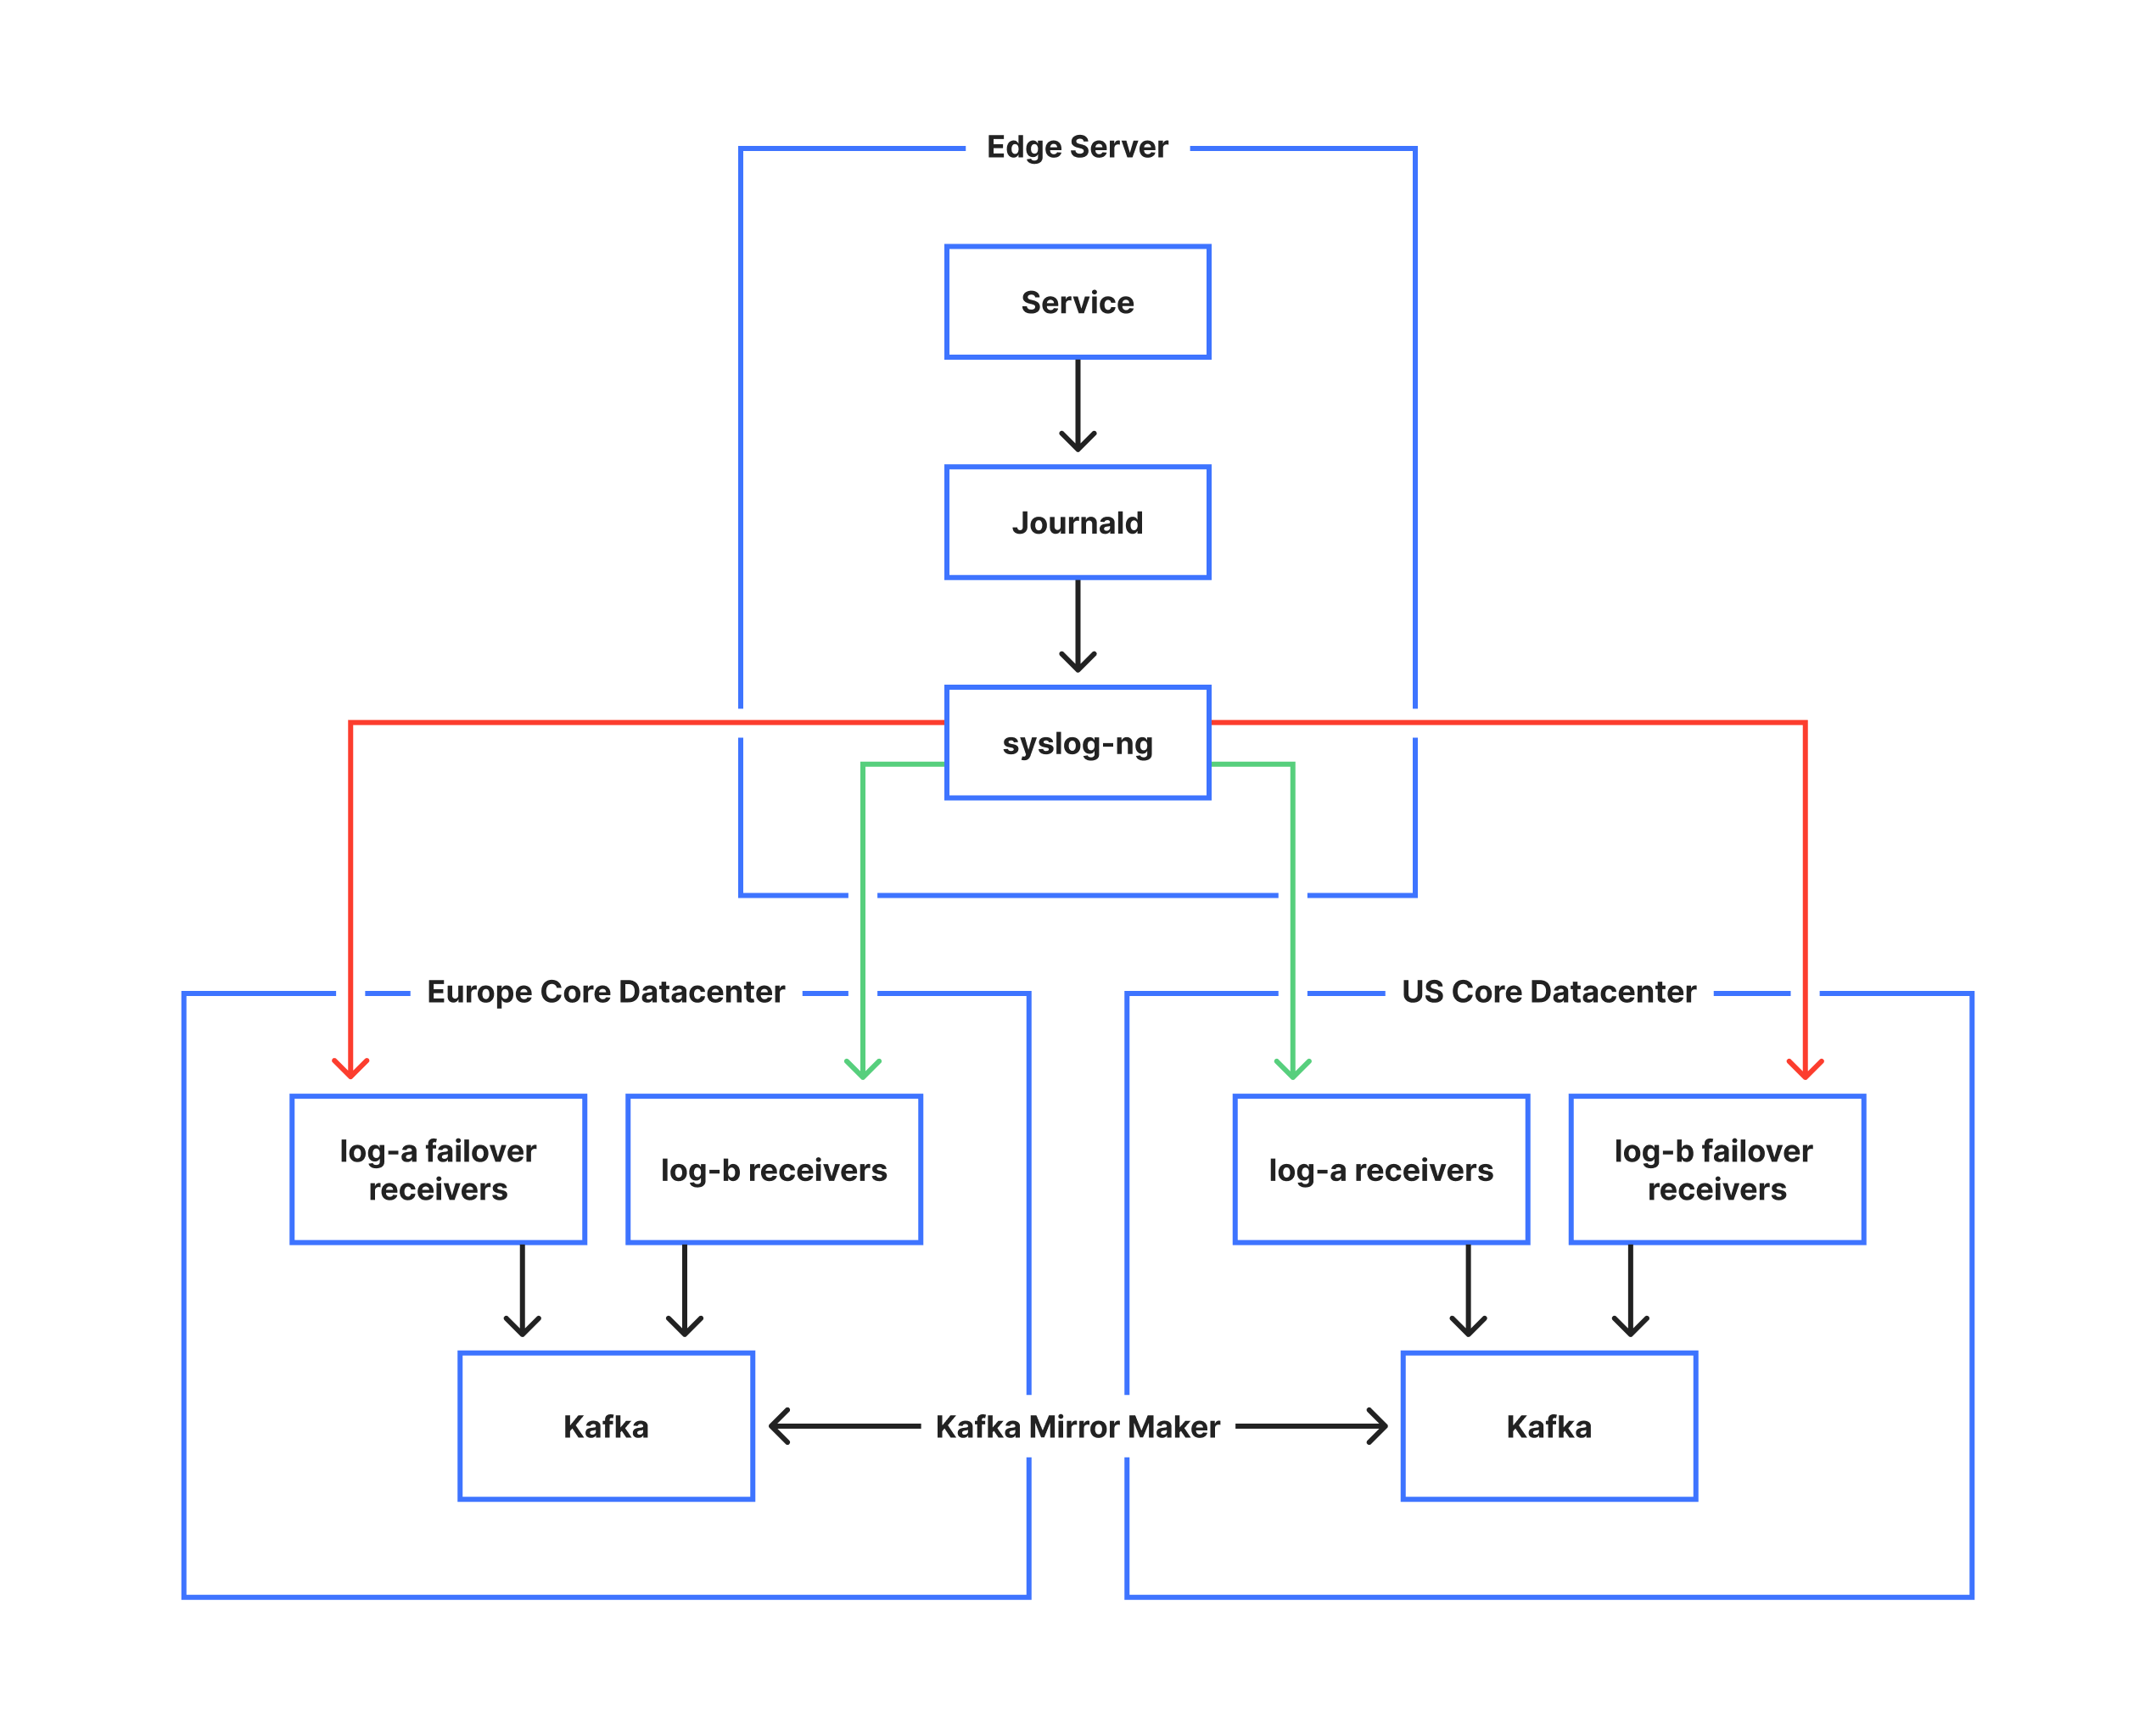
Logs at Cloudflare start the same as any other, with a println. Generally systems don’t call println directly however, they outsource that logic to a logging library. Systems at Cloudflare use various logging libraries such as Go’s zerolog, C++’s KJ_LOG, or Rusts log, however anything that is able to print lines to a program’s stdout/stderr streams is compatible with our pipeline. This offers our engineers the greatest flexibility in choosing tools that work for them and their teams.
Because we use systemd for most of our service management, these stdout/stderr streams are generally piped into systemd-journald which handles the local machine logs. With its RateLimitBurst and RateLimitInterval configurations, this gives us a simple knob to control the output of any given service on a machine. This has given our logging pipeline the colloquial name of the “journal pipeline”, however as we will see, our pipeline has expanded far beyond just journald logs.
While journald provides us a method to collect logs on every machine, logging onto each machine individually is impractical for debugging large scale services. To this end, the next step of our pipeline is syslog-ng. Syslog-ng is a daemon that implements the aforementioned BSD syslog protocol. In our case, it reads logs from journald, and applies another layer of rate limiting. It then applies rewriting rules to add common fields, such as the name of the machine that emitted the log, the name of the data center the machine is in, and the state of the data center that the machine is in. It then wraps the log in a JSON wrapper and forwards it to our Core data centers.
journald itself has an interesting feature that makes it difficult for some of our use cases – it guarantees a global ordering of every log on a machine. While this is convenient for the single node case, it imposes the limitation that journald is single-threaded. This means that for our heavier workloads, where every millisecond of delay counts, we provide a more direct path into our pipeline. In particular, we offer a Unix Domain Socket that syslog-ng listens on. This socket operates as a separate source of logs into the same pipeline that the journald logs follow, but allows greater throughput by eschewing the need for a global ordering that journald enforces. Logging in this manner is a bit more involved than outputting logs to the stdout streams, as services have to have a pipe created for them and then manually open that socket to write to. As such, this is generally reserved for services that need it, and don’t mind the management overhead it requires.
Our logging pipeline is a critical service at Cloudflare. Any potential delays or missing data can cause downstream effects that may hinder or even prevent the resolving of customer facing incidents. Because of this strict requirement, we have to offer redundancy in our pipeline. This is where the operation we call “log-x” comes into play.
We operate two main core data centers. One in the United States, and one in Europe. From each machine, we ship logs to both of these data centers. We call these endpoints log-a, and log-b. The log-a and log-b receivers will insert the logs into a Kafka topic for later consumption. By duplicating the data to two different locations, we achieve a level of redundancy that can handle the failure of either data center.
The next problem we encounter is that we have many data centers all around the world, which at any time due to changing Internet conditions may become disconnected from one, or both core data centers. If the data center is disconnected for long enough we may end up in a situation where we drop logs to either the log-a or log-b receivers. This would result in an incomplete view of logs from one data center and is unacceptable; Log-x was designed to alleviate this problem. In the event that syslog-ng fails to send logs to either log-a or log-b, it will actually send the log twice to the available receiver. This second copy will be marked as actually destined for the other log-x receiver. When a log-x receiver receives such a log, it will insert it into a different Kafka queue, known as the Dead Letter Queue (DLQ). We then use Kafka Mirror Maker to sync this DLQ across to the data center that was inaccessible. With this logic log-x allows us to maintain a full copy of all the logs in each core data center, regardless of any transient failures from any of our data centers.
When logs arrive in the core data centers, we buffer them in a Kafka queue. This provides a few benefits. Firstly, it means that any consumers of the logs can be added without any changes – they only need to register with Kafka as a consumer group on the logs topic. Secondly, it allows us to tolerate transient failures of the consumers without losing any data. Because the Kafka clusters in the core data centers are much larger than any single machine, Kafka allows us to tolerate up to eight hours of total outage for our consumers without losing any data. This has proven to be enough to recover without data loss from all but the largest of incidents.
When it comes to partitioning our Kafka data, we have an interesting dilemma. Rather arbitrarily, the syslog protocol only supports timestamps up to microseconds. For our faster log emitters, this means that the syslog protocol cannot guarantee ordering with timestamps alone. To work around this limitation, we partition our logs using a key made up of both the host, and the service name. Because Kafka guarantees ordering within a partition, this means that any logs from a service on a machine are guaranteed to be ordered between themselves. Unfortunately, because logs from a service can have vastly different rates between different machines, this can result in unbalanced Kafka partitions. We have an ongoing project to move towards Open Telemetry Logs to combat this.
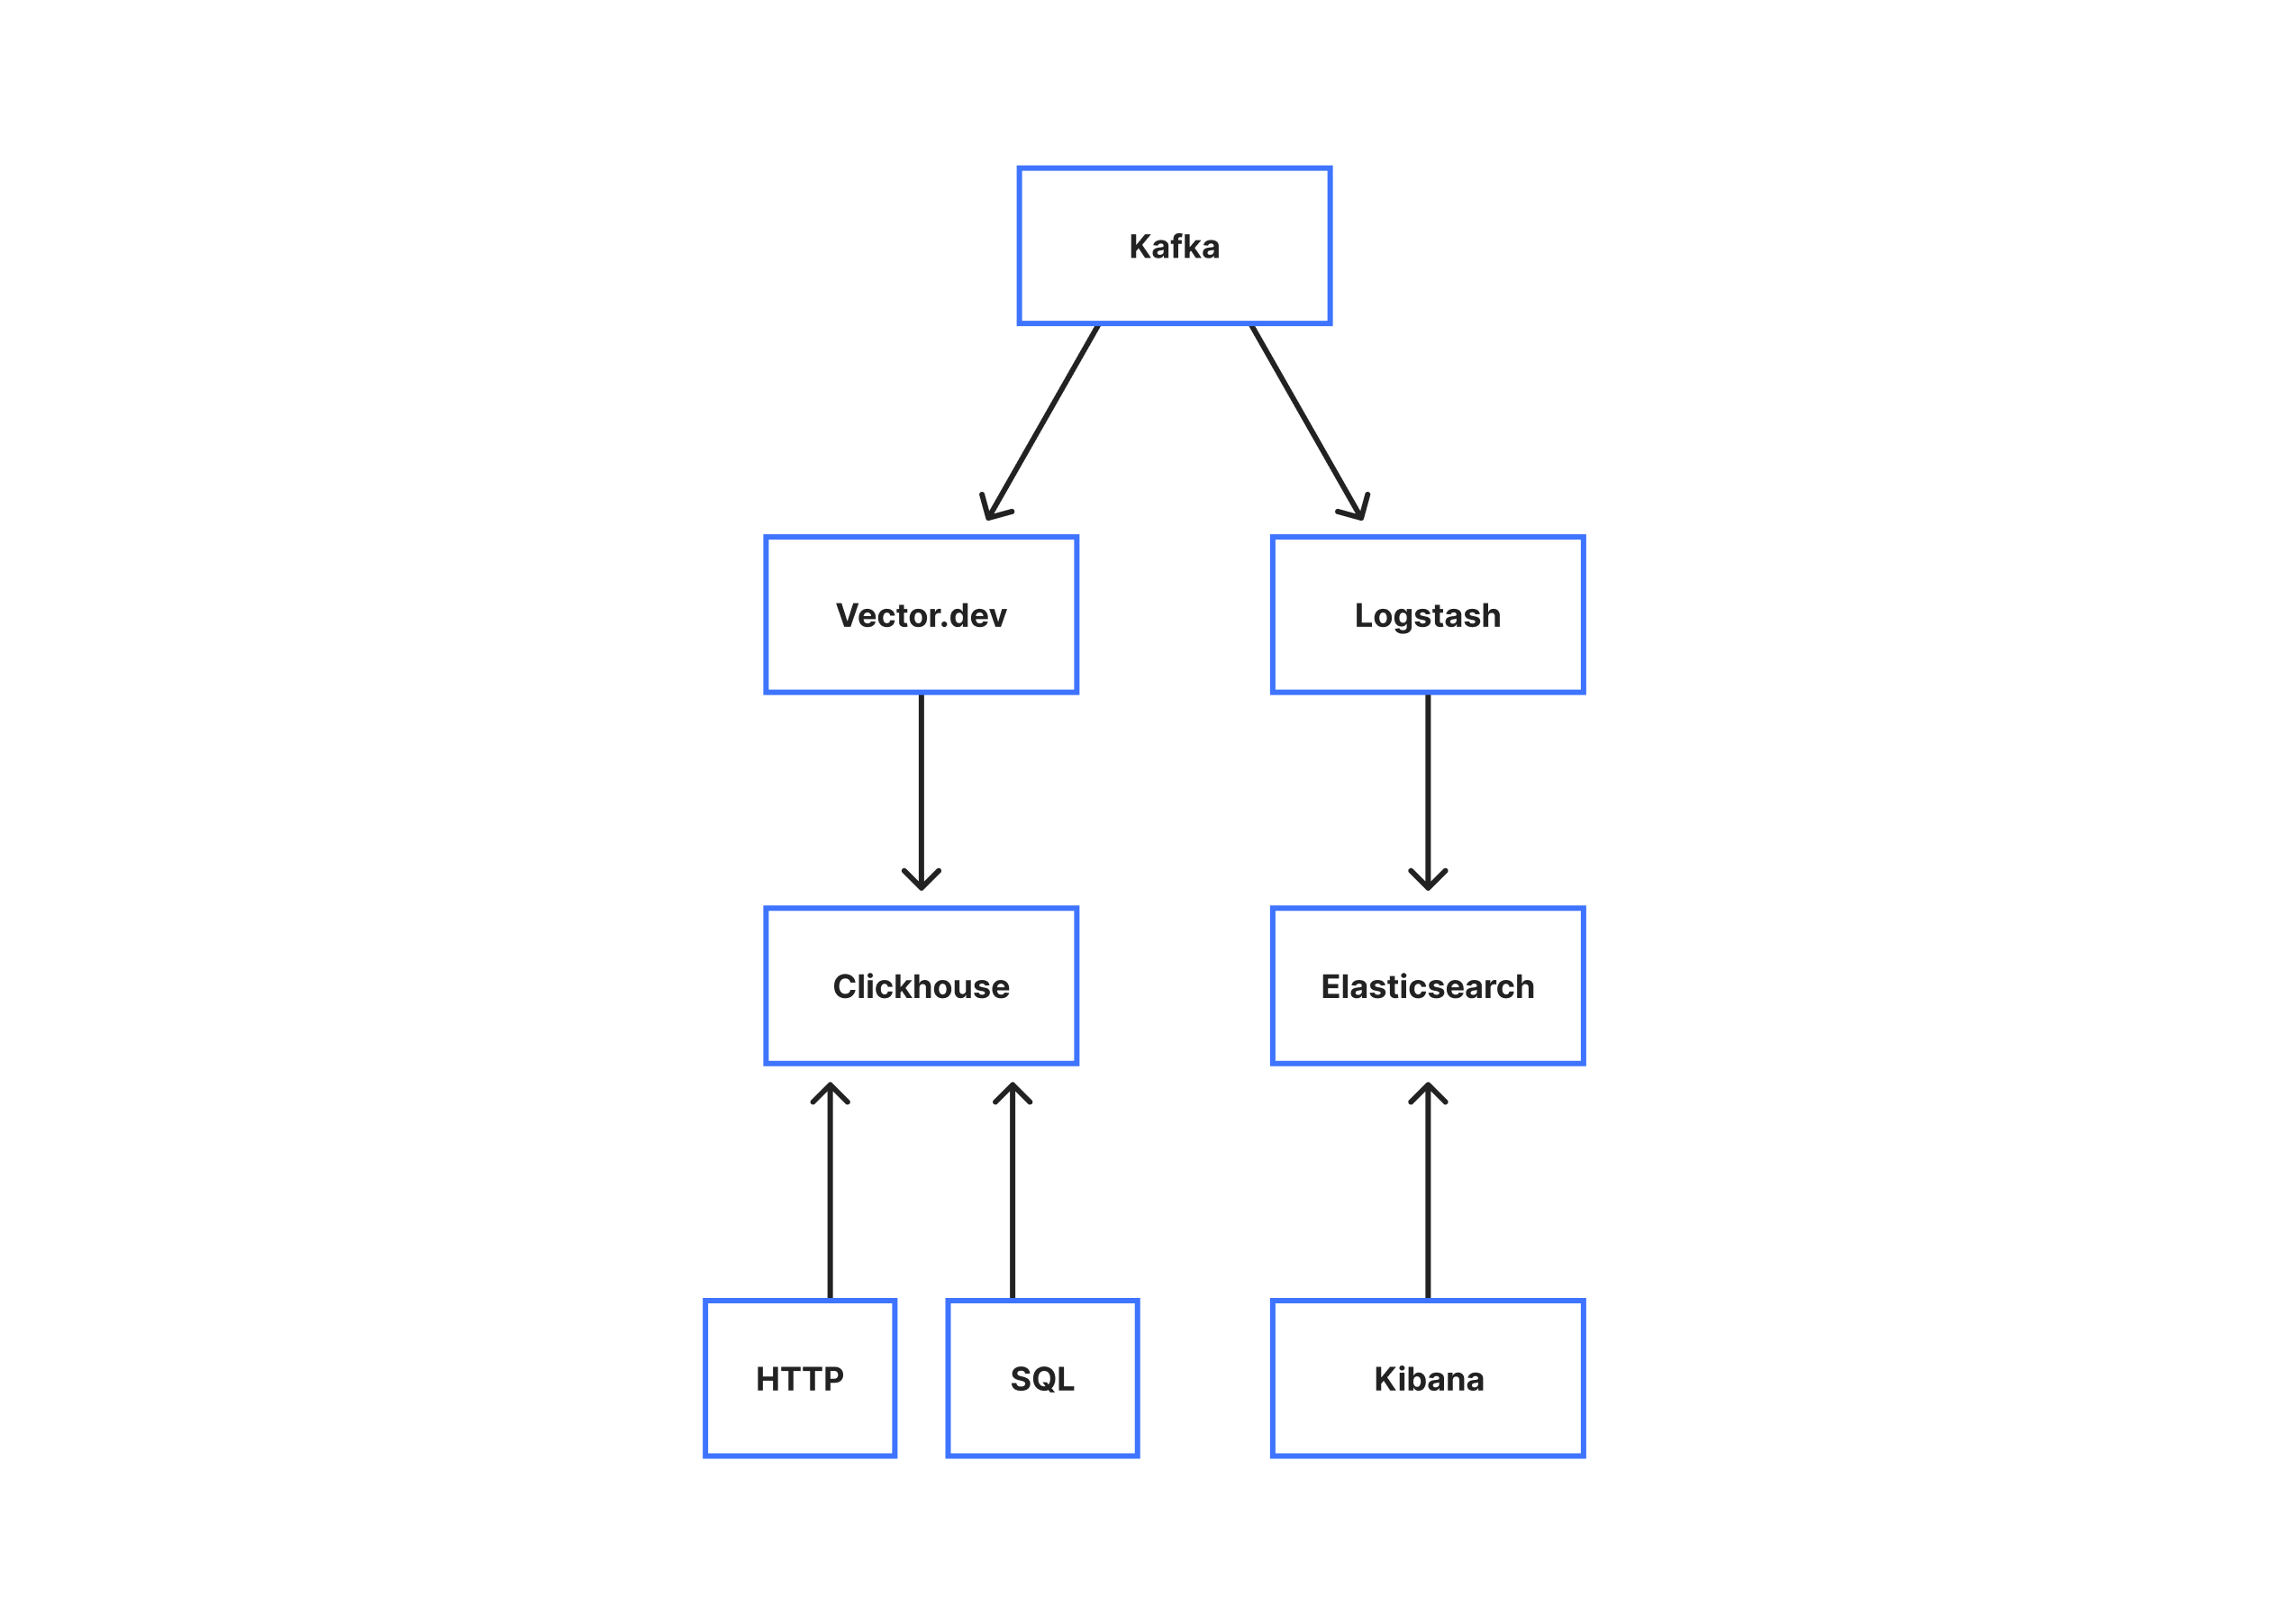
With the logs in Kafka, we can proceed to insert them into a more long term storage. For storage, we operate two backends. An ElasticSearch/Logstash/Kibana (ELK) stack, and a Clickhouse cluster.
For ElasticSearch, we split our cluster of 90 nodes into a few types. The first being “master”
nodes. These nodes act as the ElasticSearch masters, and coordinate insertions into the cluster. We then have “data” nodes that handle the actual insertion and storage. Finally, we have the “HTTP” nodes that handle HTTP queries. Traditionally in an ElasticSearch cluster, all the data nodes will also handle HTTP queries, however because of the size of our cluster and shards we have found that designating only a few nodes to handle HTTP requests greatly reduces our query times by allowing us to take advantage of aggressive caching.
On the Clickhouse side, we operate a ten node Clickhouse cluster that stores our service logs. We are in the process of migrating this to be our primary storage, but at the moment it provides an alternative interface into the same logs that ElasticSearch provides, allowing our Engineers to use either Lucene through the ELK stack, or SQL and Bash scripts through the Clickhouse interface.
As Cloudflare continues to grow, our demands on our Observability systems, and our logging pipeline in particular continue to grow with it. This means that we’re always thinking ahead to what will allow us to scale and improve the experience for our engineers. On the horizon, we have a number of projects to further that goal including:
If you’re interested in working with logging at Cloudflare, then reach out – we’re hiring!
Post Syndicated from The History Guy: History Deserves to Be Remembered original https://www.youtube.com/watch?v=Ni7vMG6J4mQ
Post Syndicated from Michael Kammer original https://blog.zabbix.com/building-a-partner-program-the-zabbix-advantage/27164/
At Zabbix, our emphasis on high performance, functionality, and reliability has led to the creation of one of the most popular monitoring solutions on the market. It’s so popular, in fact, that we get near-constant requests for Zabbix professional consulting, advice, support, and training from almost every corner of the world.
That’s why we created the Zabbix Partner Program. Our partner program was designed with one goal in mind – to get our services to the widest possible audience of qualified buyers by allowing customers to purchase them through a network of verified Zabbix partners as well as from Zabbix directly.
Our partners create high value for thousands of customers who would not otherwise enjoy access to Zabbix services by providing complete localization in terms of linguistic and cultural compatibility, availability across time zones, in-person access, and flexibility around currencies and payments.
To do that as effectively as possible, we’ve divided our partners into 3 categories:
Resellers. These are companies that promote and resell Zabbix services. Their job is to locate leads, present and promote Zabbix products and services, consult the leads regarding their ideal solutions, and arrange the contracts. At that point, Zabbix steps in and provides the services. Resellers are a great resource for customers who are limited by local regulations when it comes to buying Zabbix services in their local currency or from companies registered in their own country.
Certified Partners. Certified partners can also promote and resell Zabbix services, but they’re also officially authorized to deliver selected Zabbix services and solutions in their local languages. The ease of access and a common language allows certified partners to stay in close contact with customers. They can also sell their own value-adding services alongside Zabbix services.
Premium Partners. A premium partner has the same authorization as certified partners, but premium partner status is reserved for partners with the highest expertise and experience. Premium partners can participate in highly sophisticated Zabbix implementation, integration, and support projects.
Building a winning partner program has taught us a few things about the process, so without further ado, we’d like to share 6 best practices that we adhere to when it comes to cultivating and expanding our network of partners.
Table of Contents
Years of running a partner program have taught us that success is impossible without clearly defined goals and success metrics. Setting firm, realistic goals for a program is the only way to measure its effectiveness and ROI. After a few quarters, it should be possible to compare performance to goals and see whether changes need to be made.
Accordingly, we make sure that Zabbix executives, sales teams, and partners are aware that getting a new program up and running (or making changes to an existing program) takes time. Expecting instant results is not realistic – we’ve learned that a ramp-up period of a few months is usually reasonable.
Nothing kills momentum faster than confusion. That’s why it’s important to make sure that partners have a solid understanding of everything that’s being asked of them. We’ve learned to give partners concise goals and objectives so that everyone is on the same page. We also create annual business plans for all three partnership programs, review them quarterly, and reward success.
Having the same KPIs as partners is also important. When different metrics for success exist, we run the risk of our partners being less enthusiastic about taking actions that will increase the success of Zabbix but may do less for them. In our experience, it’s better to build partnerships around a joint success target so that when partners win, we win.
At Zabbix, supporting our partners means providing outstanding sales, marketing, and technical support, all of which shows that we’re invested in their success as much as our own. Our partnership team helps partners with all presales-related questions, organizes demo calls, manages the deal registration to protect partner deals, patriciates in joint calls with customers, and helps with all possible legal questions and certifications.
Apart from day-to-day pre-sales support, we organize and participate in joint Zabbix marketing events of different formats together with our partners. These meetups, meetings, conferences, and external events organized by other vendors around the globe are designed to spread the word about Zabbix solutions and services while helping our partners generate new leads. During these events, our partners demonstrate their recent use-cases and serve as experts for the rest of the partner network and the wider Zabbix community.
Trust is the foundation of all partnerships, and we find that our partners trust us because we deliver the support and tools they need to be successful. It’s why we work hard to keep our partners updated with product developments and industry trends, and we continuously educate them on how to sell and overcome roadblocks.
We even allow some of our partners to conduct official Zabbix trainings, provided they have a certified trainer available. When an existing partner wants to become a training partner, we discuss their needs and plan their training certification together.
Whether launching a new program or scaling up an existing one, measuring the right key performance indicators (KPIs) can mean the difference between growth and chaos. If a business doesn’t know what to measure and optimize for their partner program, they won’t know what to improve if growth stalls out, and you’ll struggle to explain how partnerships contribute value.
It’s impossible to get far on the road to success without measuring progress along the way. That’s why we review goals and metrics with our partners every quarter, assess what’s working well and what’s missing the mark, and adapt and adjust if needed. We’ve learned not to change things up too often, but we’re always open to making tweaks that will amplify success.
One of the most important ingredients of any successful partner program is communication. It’s essential to keep partners informed about new products, promotions, and other important updates. That involves knowing the audience and understanding what each partner type and their respective employees are interested in and when.
A cornerstone of the Zabbix Partner Program is our ability to actively listen to our partners’ feedback. Our experience is that getting ahead of issues and concerns strengthens relationships, maintains trust, and guarantees that our partners feel supported and valued.
Becoming a Zabbix Partner is an ideal way to get recognized by potential customers and increase the visibility of your business, while also getting a leg up on your competitors by using technical support according to a professional service-level agreement.
In addition, you can count on discounts on all Zabbix services, the ability to access pre-sale consulting services, and participation in joint marketing events.
To find out more about our partner program and sign up, visit the Zabbix Partners page.
The post Building a Partner Program: The Zabbix Advantage appeared first on Zabbix Blog.
Post Syndicated from Bruce Schneier original https://www.schneier.com/blog/archives/2024/01/second-interdisciplinary-workshop-on-reimagining-democracy.html
Last month, I convened the Second Interdisciplinary Workshop on Reimagining Democracy (IWORD 2023) at the Harvard Kennedy School Ash Center. As with IWORD 2022, the goal was to bring together a diverse set of thinkers and practitioners to talk about how democracy might be reimagined for the twenty-first century.
My thinking is very broad here. Modern democracy was invented in the mid-eighteenth century, using mid-eighteenth-century technology. Were democracy to be invented from scratch today, with today’s technologies, it would look very different. Representation would look different. Adjudication would look different. Resource allocation and reallocation would look different. Everything would look different, because we would have much more powerful technology to build on and no legacy systems to worry about.
Such speculation is not realistic, of course, but it’s still valuable. Everyone seems to be talking about ways to reform our existing systems. That’s critically important, but it’s also myopic. It represents a hill-climbing strategy of continuous improvements. We also need to think about discontinuous changes that you can’t easily get to from here; otherwise, we’ll be forever stuck at local maxima.
I wrote about the philosophy more in this essay about IWORD 2022. IWORD 2023 was equally fantastic, easily the most intellectually stimulating two days of my year. The event is like that; the format results in a firehose of interesting.
Summaries of all the talks are in the first set of comments below. (You can read a similar summary of IWORD 2022 here.) Thank you to the Ash Center and the Belfer Center at Harvard Kennedy School, and the Knight Foundation, for the funding to make this possible.
Next year, I hope to take the workshop out of Harvard and somewhere else. I would like it to live on for as long as it is valuable.
Now, I really want to explain the format in detail, because it works so well.
I used a workshop format I and others invented for another interdisciplinary workshop: Security and Human Behavior, or SHB. It’s a two-day event. Each day has four ninety-minute panels. Each panel has six speakers, each of whom presents for ten minutes. Then there are thirty minutes of questions and comments from the audience. Breaks and meals round out the day.
The workshop is limited to forty-eight attendees, which means that everyone is on a panel. This is important: every attendee is a speaker. And attendees commit to being there for the whole workshop; no giving your talk and then leaving. This makes for a very collaborative environment. The short presentations means that no one can get too deep into details or jargon. This is important for an interdisciplinary event. Everyone is interesting for ten minutes.
The final piece of the workshop is the social events. We have a night-before opening reception, a conference dinner after the first day, and a final closing reception after the second day. Good food is essential.
Honestly, it’s great but it’s also it’s exhausting. Everybody is interesting for ten minutes. There’s no down time to zone out or check email. And even though a shorter event would be easier to deal with, the numbers all fit together in a way that’s hard to change. A one-day event means only twenty-four attendees/speakers, and that’s not a critical mass. More people per panel doesn’t work. Not everyone speaking creates a speaker/audience hierarchy, which I want to avoid. And a three-day, slower-paced event is too long. I’ve thought about it long and hard; the format I’m using is optimal.
Post Syndicated from Matt Granger original https://www.youtube.com/watch?v=nHGPiNwEM8o
Post Syndicated from xkcd.com original https://xkcd.com/2878/

Post Syndicated from Eric Smith original https://www.servethehome.com/qnap-tl-d800s-review-an-8-bay-sata-jbod-das/
In our QNAP TL-D800S review, we see how this 8-bay SATA JBOD performs and see what makes it a solid DAS option
The post QNAP TL-D800S Review An 8-Bay SATA JBOD DAS appeared first on ServeTheHome.
Post Syndicated from corbet original https://lwn.net/Articles/957098/
Linus has released the 6.7 kernel.
End result: 6.7 is (in number of commits: over 17k non-merge
commits, with 1k+ merges) one of the largest kernel releases we’ve
ever had, but the extra rc8 week was purely due to timing with the
holidays, not about any difficulties with the larger release.
Some of the headline features in this release are:
the removal of support for the Itanium
architecture,
the first part of the futex2 API,
futex
support in io_uring,
the BPF exceptions mechanism,
the bcachefs filesystem,
the TCP
authentication option,
the kernel samepage merging smart
scan mode, and
networking
support for the Landlock security module.
See the LWN merge-window summaries (part 1,
part 2) and the (in-progress) KernelNewbies 6.7 page for
more information.
Post Syndicated from Explosm.net original https://explosm.net/comics/cheating-2
New Cyanide and Happiness Comic
Post Syndicated from Oglaf! -- Comics. Often dirty. original https://www.oglaf.com/moss/


Post Syndicated from Patrick Kennedy original https://www.servethehome.com/nvidia-l40s-vs-h100-vs-a100-the-video/
We have a video on the NIVIDA L40S vs NVIDIA H100 vs NVIDIA A100 and why the new L40S is a different GPU option for AI inference and more
The post NVIDIA L40S vs H100 vs A100 The Video appeared first on ServeTheHome.
Post Syndicated from Talks at Google original https://www.youtube.com/watch?v=8rmYUFT9Pcw