Reducing database incident MTTR by 73% with a custom AWS DevOps Agent Skill

Post Syndicated from Chetan Suri original https://aws.amazon.com/blogs/devops/reducing-database-incident-mttr-by-73-with-a-custom-aws-devops-agent-skill/

Database incidents are among the most time-consuming operational events for Site Reliability Engineering (SRE) teams. When an Amazon Aurora PostgreSQL cluster experiences performance degradation, SRE engineers must correlate metrics across connection pools, replication topology, query performance, storage subsystems, and parameter configurations. These troubleshooting steps routinely take 45–60 minutes even for experienced engineers.

AWS DevOps Agent is an operations teammate that resolves and proactively helps prevent incidents, and optimizes application reliability and performance. It also handles on-demand SRE tasks across AWS, multicloud, and on-premises environments. Although its built-in capabilities handle common scenarios well, most organizations have unique database configurations, connection pooling patterns, and performance baselines. That knowledge lives in the heads of senior database reliability engineers (DBREs).

With Custom Skills, you can codify that expertise and make it available to the agent 24/7. In this post, we walk through building a custom Aurora PostgreSQL performance degradation investigation Skill. This multi-fault procedural Skill uses decision-tree logic that covers five distinct failure modes. We then show how it reduces Mean Time to Resolution (MTTR) from a baseline of 52 minutes to 14 minutes. That’s a 73 percent reduction, measured in a controlled internal test of three simulated incidents.

Prerequisites

Before getting started, make sure you have:

  • An active AWS account with access to AWS DevOps Agent.
  • An Agent Space configured with access to your Aurora PostgreSQL cluster’s account.
  • Amazon CloudWatch metrics and Performance Insights enabled on your Aurora cluster.
  • Access to the Operator Web App for Skill deployment.
  • Familiarity with Aurora PostgreSQL operational metrics (DatabaseConnections, ReplicaLag, db.load).

The problem: Database incidents require deep tribal knowledge

Consider a typical Aurora PostgreSQL performance degradation incident. The on-call engineer receives a page indicating elevated read latency. From here, the investigation branches into multiple possible root causes:

  • Is the connection pool exhausted, starving the application of database connections?
  • Is replication lag causing stale reads that trigger application retries?
  • Did a recent deployment introduce a slow query that’s consuming all available CPU?
  • Is the storage subsystem under pressure from table bloat or excessive write amplification?
  • Did someone modify the parameter group, introducing a misconfiguration that degrades performance?

Each branch requires checking different metrics, correlating with different timelines, and applying different remediation strategies. A senior DBRE knows which branch to explore first based on subtle signal combinations. However, that knowledge is rarely documented in a way that’s actionable at 2 AM.

Additionally, parameter drift is particularly insidious because its symptoms mimic other failure modes. It occurs when someone modifies the cluster parameter group and introduces a misconfiguration. Without domain-specific guidance, the agent chases symptoms rather than tracing back to the configuration change.

Solution overview: A multi-fault procedural Skill

Rather than building five separate Skills (one per failure mode), we build a single procedural Skill with decision-tree logic that mirrors how an expert DBRE triages Aurora PostgreSQL issues. The Skill evaluates initial signals to determine which investigation branch to follow, then executes a structured procedure for that specific failure mode.

What makes this different from the workshop examples

The AWS DevOps Agent workshop covers two Skill types: (1) a single-file UI-created checklist (AWS Lambda cold starts) and (2) a multi-file architecture-context Skill (EKS Retail Store). Both are effective for their scope, but neither demonstrates a procedural investigation Skill with decision-tree logic that proves measurable MTTR reduction.

Our Skill differs in three key ways:

  • Decision-tree branching: “If metric X exceeds threshold Y, check Z before proceeding to W,” not a linear checklist.
  • Multi-fault coverage: five failure modes in one Skill with explicit priority ordering.
  • Measurable outcome: Controlled before and after MTTR comparison proving 73 percent reduction.

Skill anatomy

Skills are modular instruction sets. Each is a self-contained directory of Markdown files that provides specialized domain knowledge and investigation methodologies to AWS DevOps Agent. Each Skill contains:

  • SKILL.md (required) – Core instructions with investigation procedures, frontmatter metadata, and decision logic.
  • references/ (optional) – Supporting documentation, threshold tables, query templates.
  • assets/ (optional) – Architecture diagrams, flowcharts, data files.

The agent evaluates a Skill’s description field in the frontmatter to determine relevance, then loads and follows the instructions during investigations. Skills follow the open Agent Skills specification (agentskills.io), supporting non-executable documents: Markdown, PDFs, images, and data files.

Directory structure

aurora-pg-performance-degradation/
├── SKILL.md
├── references/
│   ├── aurora-pg-metric-thresholds.md
│   ├── connection-pool-sizing-guide.md
│   ├── replication-lag-decision-tree.md
│   ├── performance-insights-queries.md
│   └── vacuum-tuning-reference.md
└── assets/
    └── investigation-decision-tree.png

Walkthrough: Building the Skill

The following steps walk through building the Skill end to end, from documenting the investigation pattern to deploying it. We start by capturing how an expert triages the incident.

Step 1: Document the expert investigation pattern

Before writing any Markdown, we interviewed three senior DBREs and documented their mental model for Aurora PostgreSQL performance triage. The common pattern:

  • Initial signal classification – What metric triggered the alarm?
  • Impact scope assessment – Writer instance only, reader instances only, or cluster-wide?
  • Timeline correlation – Did this start after a deployment, scaling event, or traffic pattern change?
  • Branch into specific failure mode – Based on signals from steps 1–3.
  • Deep investigation – Follow the procedure for that failure mode.
  • Root cause and remediation – Structured output with immediate, short-term, and long-term actions.

Step 2: Write the SKILL.md with decision-tree logic

The SKILL.md begins with frontmatter that tells the agent when to activate, followed by initial signal classification that routes to the correct branch:

Frontmatter

---
name: aurora-pg-performance-degradation
description: Investigation procedures for Aurora PostgreSQL performance
degradation including connection pool exhaustion, replication lag, slow
query regression, storage pressure, and parameter drift. Use this skill
when investigating Aurora PostgreSQL latency spikes, connection errors,
read/write degradation, or unexplained performance changes.
---

Signal classification table

Primary Signal Likely Branch Go To
DatabaseConnections near max or connection errors Connection Pool Exhaustion Branch A
ReplicaLag > 20 ms or stale read complaints Replication Lag Branch B
Latency spike with high db.load in Performance Insights Slow Query Regression Branch C
FreeLocalStorage declining or VolumeBytesUsed alert Storage Pressure Branch D
Parameter group change in AWS CloudTrail within past 7 days Parameter Drift Branch E

Critical rule: If multiple signals are present, prioritize A → B → C → D → E. Connection exhaustion masks other symptoms, so it must be checked first.

Branch A: Connection pool exhaustion

Investigation procedure. Connection pool exhaustion is the highest-priority branch because it masks every other symptom, so the agent checks it first. It works through four checks in order, moving from the raw connection count to the behavior behind it:

  • Compare active connections to the limit. Check DatabaseConnections against max_connections. If connections exceed 85 percent of the maximum, pool exhaustion is confirmed.
  • Identify where the connections originate. Distinguish RDS Proxy pinned sessions from the direct application pool, since each points to a different fix.
  • Correlate with deployment history. A service that deployed recently and opened connections without releasing them is a common trigger, so the agent checks whether a rollout preceded the spike.
  • Check for long-running transactions. Sessions stuck in idle_in_transaction hold connection slots open and starve the pool.

Interpreting the findings. The preceding checks establish what is happening. This is where the agent decides why. Each pattern maps to a distinct root cause:

  • If connections rise monotonically, the application has a connection leak in its code.
  • If connections spike with traffic, the pool is sized too small for the load.
  • If connections spike right after a deployment, a new code path is not releasing connections.
  • If the spike is in pinned RDS Proxy sessions, session state is reducing connection reuse (multiplexing).

Branch B: Replication lag

Investigation procedure. When readers fall behind the writer, the agent needs to know whether the cause is write pressure, reader capacity, or a transient backlog. It gathers four signals before drawing a conclusion:

  • Quantify the lag. Read AuroraReplicaLag for each reader (normal is under 20 ms, critical is over 100 ms).
  • Evaluate write pressure on the writer. Look at WriteIOPS, WriteThroughput, and WriteLatency to see how hard the writer is working.
  • Check reader resource utilization. Review CPUUtilization and FreeableMemory per reader to spot an overwhelmed instance.
  • Find write-heavy queries blocking replication. Identify the top SQL by db.load with write wait events.

Interpreting the findings. The combination of writer pressure and reader health tells the agent which of four situations it is in:

  • If the writer’s write volume spiked, a bulk operation or traffic surge is driving the lag.
  • If a reader’s CPU is saturated, that reader’s instance class is too small.
  • If lag is increasing with no write spike, the reader is working through a backlog and will self-resolve.
  • If lag is stable but persistently high, there is a structural mismatch between the write rate and reader capacity.

Branch C: Slow query regression

Investigation procedure. A query regression can come from new code, a changed plan, or simply more volume, so the agent compares the current workload against a known-good baseline:

  • Find the heaviest queries. Use Performance Insights to identify the top 10 SQL statements by db.load (average active sessions).
  • Compare against the baseline. Check the current top 10 against the same list from 24 hours ago and look for new SQL IDs that have climbed into it.
  • Compare execution plans before and after deployment. Look for missing indexes, a changed JOIN order, or new full table scans.
  • Check for stale statistics. Compare the last ANALYZE to the most recent large data change.
  • Account for volume changes. The same query running 10 times more often is a regression even when each individual execution is unchanged.

Interpreting the findings. Where the change shows up tells the agent what kind of regression it is:

  • If new SQL appears in the top 10 after a deployment, it is a code regression. Review the commit.
  • If existing SQL degraded, the plan regressed because statistics went stale or the data distribution shifted.
  • If query volume increased, a caching layer failed or the traffic pattern changed.
  • If the wait events are lock-related, a schema change or a new contention pattern is to blame.

Branch D: Storage pressure

Investigation procedure. Storage problems range from benign capacity growth to a runaway process, so the agent first establishes the shape of the growth and then its source:

  • Check the storage trend. Review FreeLocalStorage over seven days to tell steady linear growth apart from a sudden spike.
  • Measure table and index bloat. Compare n_dead_tup to n_live_tup. A bloat ratio above 20 percent means vacuum is falling behind.
  • Check for write amplification. Watch for VolumeBytesUsed growing faster than the logical data being inserted.
  • Evaluate temporary file usage. Large sorts spilling to disk show up as temp_blks_written per query in pg_stat_statements.

Interpreting the findings. The growth pattern points the agent to the right response, and shows whether this is even an incident:

  • If growth is linear and matches the ingestion rate, this is a capacity-planning item, not an incident.
  • If storage spiked suddenly, suspect a bulk load, a failed cleanup job, or a runaway process.
  • If the bloat ratio is above 20 percent, autovacuum is not keeping up. Tune autovacuum, or use an online reorganization such as pg_repack on a live cluster. Avoid VACUUM FULL during an active incident. It takes an ACCESS EXCLUSIVE lock and rewrites the table, which blocks reads and writes and can extend the outage.
  • If temporary files are large, the queries need optimization or a higher work_mem.

Branch E: Parameter drift

Investigation procedure. Parameter drift is insidious because its symptoms mimic other failures, so the agent starts from the change history and works toward the specific setting at fault:

  • Pull the recent change history. Query AWS CloudTrail for ModifyDBClusterParameterGroup events in the past seven days.
  • Compare against the recommended baseline. Check current values for connection management, memory allocation, vacuum tuning, and query planning against the expected configuration.
  • Isolate misconfigurations from recent changes. For example, a work_mem set too high can cause out-of-memory errors, and an autovacuum_cost_delay set too high lets bloat accumulate.
  • Check for a default versus a custom parameter group. Reverting to a default group is common after a restore-from-snapshot operation.

Interpreting the findings. Correlating the change history with symptom onset tells the agent whether drift is the root cause and, if so, how it happened:

  • If a recent ModifyDBClusterParameterGroup lines up with when the symptom started, the parameter change is the root cause.
  • If this cluster’s parameters differ from others in the fleet, it has drifted from the standard configuration.
  • If it is on a default parameter group after a restore, the custom tuning was lost during the restore.
  • If pending-reboot parameters exist, a partial application is causing inconsistent behavior.

Step 3: Deploy the Skill

AWS DevOps Agent provides multiple deployment methods. For repeatable deployments, we recommend zip upload or GitHub import. For a quick try, use the Operator Web App UI. Choose based on your Skill’s complexity.

Option A: Using zip upload (recommended for skills with reference files)

  • Package the directory: zip -r aurora-pg-performance-degradation.zip aurora-pg-performance-degradation/.
  • Choose Knowledge, Skills, Add skill, then Upload skill.
  • Drag and drop your zip file (must be under 6 MB).
  • Select agent types: Incident RCA and On-demand.
  • Choose Upload. The system validates the zip, extracts SKILL.md frontmatter, and activates the Skill.

Option B: Import from a GitHub repository

  • Push your Skill directory to a GitHub repository connected to your Agent Space.
  • Choose Knowledge, Skills, Add skill, then Import from repository.
  • Enter the GitHub directory URL (for example, https://github.com/my-org/devops-skills/tree/main/aurora-pg-performance-degradation).
  • Select agent types and choose Import skill.
  • Choose Sync to pull updates when you modify the Skill in your repository.

Option C: Using the Operator Web App UI (skills without reference files)

  • Navigate to the Knowledge page in your Agent Space Operator Web App and choose the Skills tab.
  • Choose Add skill, then Create skill.
  • Enter the name (aurora-pg-performance-degradation), description, and instructions from SKILL.md.
  • Set Status to Active.
  • For Agent Type, clear Generic and select Incident RCA and On-demand.
  • Choose Create to save the Skill.

Option D: Create with Chat

  • Choose Knowledge, Skills, Add skill, then Create skill with Chat.
  • Describe your investigation procedure in natural language.
  • The agent generates the SKILL.md structure, frontmatter, and instructions for you.
  • Review, edit if needed, and save.

Why we chose Incident RCA and On-demand:

Targeting specific agent types helps prevent the Skill from loading when it’s not relevant. Our Skill is designed for deep root cause analysis (Incident RCA) and ad hoc queries (“Why is my Aurora cluster slow?” through On-demand). We deliberately exclude Incident Triage because triage should be fast (under 2 minutes). Our Skill is thorough, not lightweight.

Measuring the impact: 73 percent MTTR reduction

To validate the Skill’s effectiveness, we ran a controlled before and after comparison using three real-world incident scenarios on a test Aurora PostgreSQL cluster.

Methodology

We simulated three distinct failure modes on an Aurora PostgreSQL cluster with realistic production-like workloads:

  • Connection pool exhaustion – Introduced connection leak through an application code change.
  • Slow query regression – Deployed a new query missing a critical index.
  • Parameter drift – Modified shared_buffers and work_mem to suboptimal values through a parameter group change.

For each incident, we measured: (1) total investigation duration from alert to root cause identification, (2) number of wrong hypotheses explored before finding root cause, and (3) whether the structured output included immediate, short-term, and long-term remediation actions.

Results without the Skill (baseline)

We triggered three incident types and measured how the agent investigated using only its built-in knowledge:

Incident Type Duration Wrong Hypotheses explored Root Cause Found?
Connection pool exhaustion 48 min 3 Yes, eventually
Slow query regression 55 min 2 Yes, eventually
Parameter drift 53 min 4 Partial – symptoms identified but not traced to parameter change

Average without Skill: 52 minutes, 3.0 wrong hypotheses per incident

Without domain-specific guidance, the agent explored metrics in an unpredictable order. For connection exhaustion, it checked CPU, then storage, then replication lag before eventually examining connection counts. For parameter drift, it identified symptoms (slow queries, bloat) but never correlated with the AWS CloudTrail ModifyDBClusterParameterGroup event.

Results with the Skill

We triggered the same three incidents and confirmed the agent loaded and followed the decision tree:

Incident Type Duration Decision Tree Followed? Wrong Hypotheses
Connection pool exhaustion 11 min Yes – Branch A first (priority order) 0
Slow query regression 16 min Yes – Timeline correlation → Branch C 0
Parameter drift 15 min Yes – CloudTrail correlation → Branch E 1

Average with Skill: 14 minutes, 0.3 wrong hypotheses per incident

Results summary

Metric Before Skill After Skill Improvement
Mean time to resolution (MTTR) 52 min 14 min 73% reduction
Wrong hypotheses per incident 3.0 0.3 90% fewer dead ends
Correct root cause on first branch 0/3 (0%) 2/3 (67%) First-time accuracy
Complete structured output 1/3 3/3 Consistent remediation quality
Escalation to senior DBRE required 2/3 0/3 Self-sufficient investigation

Why the improvement is so large

The 73 percent reduction comes from two compounding factors:

  • Alleviation of wrong hypotheses: Without the Skill, the agent spent 15–20 minutes per wrong hypothesis before pivoting. The decision tree’s priority order (A → B → C → D → E) avoids dead ends by checking upstream causes first.
  • Direct routing through signal classification: The Skill’s initial signal table routes the agent to the correct branch immediately when the primary signal is clear. For connection exhaustion, the agent goes straight to Branch A without exploring storage or replication.

The compounding effect: Memories

Your custom Skill works alongside the knowledge AWS DevOps Agent builds about your environment as it works. The agent maintains memories of your topology, code dependencies, pipeline structure and tool-use patterns, which you can view and manage on the Memories tab of the Knowledge page. As this context grows, the agent can apply your Skill’s decision tree with a better understanding of how your Aurora PostgreSQL clusters connect to the rest of your environment. This can help investigations stay fast and accurate as your environment changes.

Best practices for procedural Skills

1. Use decision trees, not linear checklists

Procedural Skills with branching logic deliver measurably better outcomes for complex, multi-fault scenarios. Tell the agent when to follow each branch based on observable signals. A linear checklist forces the agent through every step regardless of relevance.

2. Define the priority order explicitly

“If multiple signals are present, prioritize: A → B → C → D → E.” This single line helps prevent the agent from spending time on downstream symptoms when the root cause is upstream.

3. Include decision points at each branch

After the investigation steps, explicitly state what each finding means and where to go next. Without decision points, the agent might collect data but not draw the correct conclusion.

4. Add metric thresholds in reference files

Don’t embed thresholds in the main SKILL.md. Put them in reference files (for example, references/aurora-pg-metric-thresholds.md). This keeps instructions focused on the investigation workflow while giving the agent concrete numbers to work with. It also makes thresholds straightforward to update as your environment scales.

5. Target specific agent types

This Skill targets “Incident RCA” and “On-demand,” not “Incident Triage.” RCA Skills can be thorough. Triage Skills should be lightweight (under 2 minutes). Targeting reduces context consumption and improves agent focus.

6. Measure before and after

Without baseline MTTR data, you cannot prove the Skill’s value. Track investigation duration and hypothesis count for the specific incident class before deploying the Skill, then run the same scenarios after deployment and compare.

Clean up

To deactivate or remove the Skill:

  • Choose Knowledge, then Skills in the Operator Web App.
  • Select the aurora-pg-performance-degradation Skill.
  • To temporarily disable, set Status to Inactive. This preserves the Skill for future use, and in-progress investigations continue using it.
  • To permanently remove, choose the more options menu (⋮), choose Delete, enter the skill name to confirm, and choose Delete Skill.

Consider downloading your Skill as a zip file before deletion as a backup. Deactivating is preferred over deleting if you may need the Skill again.

Conclusion

Custom Skills transform AWS DevOps Agent from a general-purpose operations assistant into a specialist that knows your database infrastructure as well as your best DBRE. By encoding multi-fault decision-tree logic into a procedural Skill, we achieved a 73 percent reduction in MTTR for simulated Aurora PostgreSQL performance incidents, from 52 minutes to 14 minutes.

The key insight: The value of a custom Skill is not in listing what to check (any runbook does that), but in encoding when to check it and what the findings mean. Decision-tree logic that prioritizes investigation branches based on observable signals is what separates a Skill that delivers measurable MTTR reduction from a Skill that’s merely a formatted checklist.

Start with your most common database incident type, document how your best engineer triages it, encode the decision logic into a Skill, and measure the before and after. Your on-call team will thank you, especially at 2 AM.

Resources


About the authors

Chetan Suri

Chetan Suri

Chetan is a Senior Specialist Technical Account Manager at AWS, focused on Cloud and AI Operations. He works with Enterprise Support customers to improve operational excellence through AI-driven incident response and proactive operational strategies.

Rizwan Khan

Rizwan Khan

Rizwan is an Enterprise Account Engineer specializing in Amazon CloudFront at AWS. He works with media streaming customers across the Asia-Pacific region to optimize content delivery architecture for performance, resilience, and cost efficiency at scale.

Antony Wanyugi

Antony Wanyugi

Antony is a Technical Account Manager at AWS, helping customers optimize their cloud operations and adopt modern DevOps practices including proactive incident prevention and automated root cause analysis.

Amazon MSK Express brokers available on AWS Graviton4-based M8g instances

Post Syndicated from Charishma Makineni original https://aws.amazon.com/blogs/big-data/amazon-msk-express-brokers-available-on-aws-graviton4-based-m8g-instances/

Teams running Apache Kafka for real-time streaming often face a tradeoff: better performance or lower costs. Now, you can have both. Get faster throughput and lower tail latency from the same cluster, with no increase in infrastructure costs. Amazon Managed Streaming for Apache Kafka (Amazon MSK) Express brokers are now available on AWS Graviton4-based M8g instances. Compared with Express brokers on M7g, Express brokers on M8g have 15 percent lower broker-hour pricing. You also no longer pay the broker-side cost when moving data across Availability Zones for client traffic, which reduces total cross-AZ data transfer costs by 50 percent. With M8g, Express brokers now support a 24xlarge instance size, giving you more headroom to scale. In our testing at the same broker size and load, P99 produce latency was 21–54 percent lower on M8g, and broker CPU was 9–11 percentage points lower. Consumers that fell behind cleared up to 3x more backlog in 30 minutes. P99 produce latency is the time to acknowledge a produced record for the slowest 1 percent of requests, a common measure of tail latency.

In this post, we cover what changes with Express brokers on M8g and how it affects cost. We share benchmark results comparing M8g to M7g, and we show you how to move your cluster to M8g.

Express brokers on M8g

Express brokers give you up to 3x more throughput per broker, up to 20x faster scaling, and up to 90% faster recovery than Standard brokers. Express brokers manage storage and broker tuning for you, so your team spends time on streaming applications instead of cluster maintenance.

Express brokers on M8g keep what Express brokers support on M7g: the same Kafka versions, authentication methods, custom configurations, Amazon CloudWatch metrics, and Open Monitoring with Prometheus. For sizes available on both generations, storage and network throughput per broker are the same as Express brokers on M7g, so you can move to M8g at the size you run today and keep the same per-broker throughput.

The following table compares Express brokers on M7g and M8g.

Express on M7g Express on M8g
Broker-hour price Baseline 15% lower
Amazon MSK broker-side cross-AZ charge for client traffic Charged Not charged
Amazon MSK EC2-side cross-AZ charge for client traffic Baseline Same
Largest broker size 16xlarge 24xlarge
Throughput per broker at each size Baseline Same
Connection limit per broker Baseline Same
Data-in and storage pricing Baseline Same

AWS offers Express brokers on M8g in the following sizes. Use the recommended throughput and partition limits when you size a cluster.

Broker size vCPUs Memory (GiB) Recommended ingress per broker (MBps) Recommended egress per broker (MBps) Recommended partitions per broker Max partitions per broker
express.m8g.large 2 8 15.6 31.2 1,000 1,500
express.m8g.xlarge 4 16 31.2 62.5 1,000 2,000
express.m8g.2xlarge 8 32 62.5 125 2,500 4,000
express.m8g.4xlarge 16 64 124.9 249.8 6,000 8,000
express.m8g.8xlarge 32 128 250 500 12,000 16,000
express.m8g.12xlarge 48 192 375 750 16,000 24,000
express.m8g.16xlarge 64 256 500 1,000 20,000 32,000
express.m8g.24xlarge 96 384 667 1,334 20,000 32,000

What this means for your workloads

  • Latency-sensitive and bursty workloads – Lower P99 produce latency means fewer slow acknowledgments during traffic spikes, which is where tail latency affects your end users.
  • Workloads that have outgrown 16xlarge – With the 24xlarge size, you can run more throughput on each broker. An express.m8g.24xlarge broker supports 667 MBps of recommended ingress, compared with 500 MBps on express.m8g.16xlarge. If you have a throughput-bound workload and run many 16xlarge brokers today, you can run fewer 24xlarge brokers.
  • Multi-AZ pipelines – Lower broker-hour pricing and no broker-side cross-AZ charge lower the cost of running a cluster across three Availability Zones, with no change to your application code.
  • Workloads that replay data or recover from lag – Consumers that fall behind after an outage, a deployment, or a reprocessing job catch up faster on M8g. In our test, consumers on M8g cleared up to 3x more backlog in 30 minutes than on M7g, so you recover sooner without adding brokers.

Benchmark: Express on M8g compared with Express on M7g

We wanted to see how M8g behaves under the same load as M7g, so we changed only the broker generation and kept everything else the same.

Test setup

  • Two Express clusters, one on express.m8g.large and one on express.m7g.large, each with three brokers across three Availability Zones in US East (N. Virginia).
  • Kafka version 3.9.x (KRaft mode) on both clusters.
  • Transport Layer Security (TLS) encryption in transit and AWS Identity and Access Management (IAM) access control.
  • Six topics with 64 partitions each, replication factor 3, and min.insync.replicas=2.
  • Producer settings: acks=all, linger.ms=5, batch.size=65536 (64 KiB), compression.type=none.
  • One consumer group per topic.
  • Fixed message size of 512 bytes.
  • Three c7i.2xlarge client instances, one in each Availability Zone, running kafka-producer-perf-test and kafka-consumer-perf-test from Apache Kafka 3.9.1 with the Amazon MSK IAM authentication library. Each client drove both clusters at the same time, so both clusters saw the same client and network conditions. Client CPU stayed below 20% and network throughput below 10% of instance capacity at every step, so clients were never the bottleneck.

Express brokers manage server-side settings such as network and I/O threads, so there was nothing to tune on the broker side.

We stepped ingress from 2–16 MBps per broker in 2 MBps increments. We held each step for about 10 minutes and recorded values only after the cluster reached steady state.

P99 produce latency

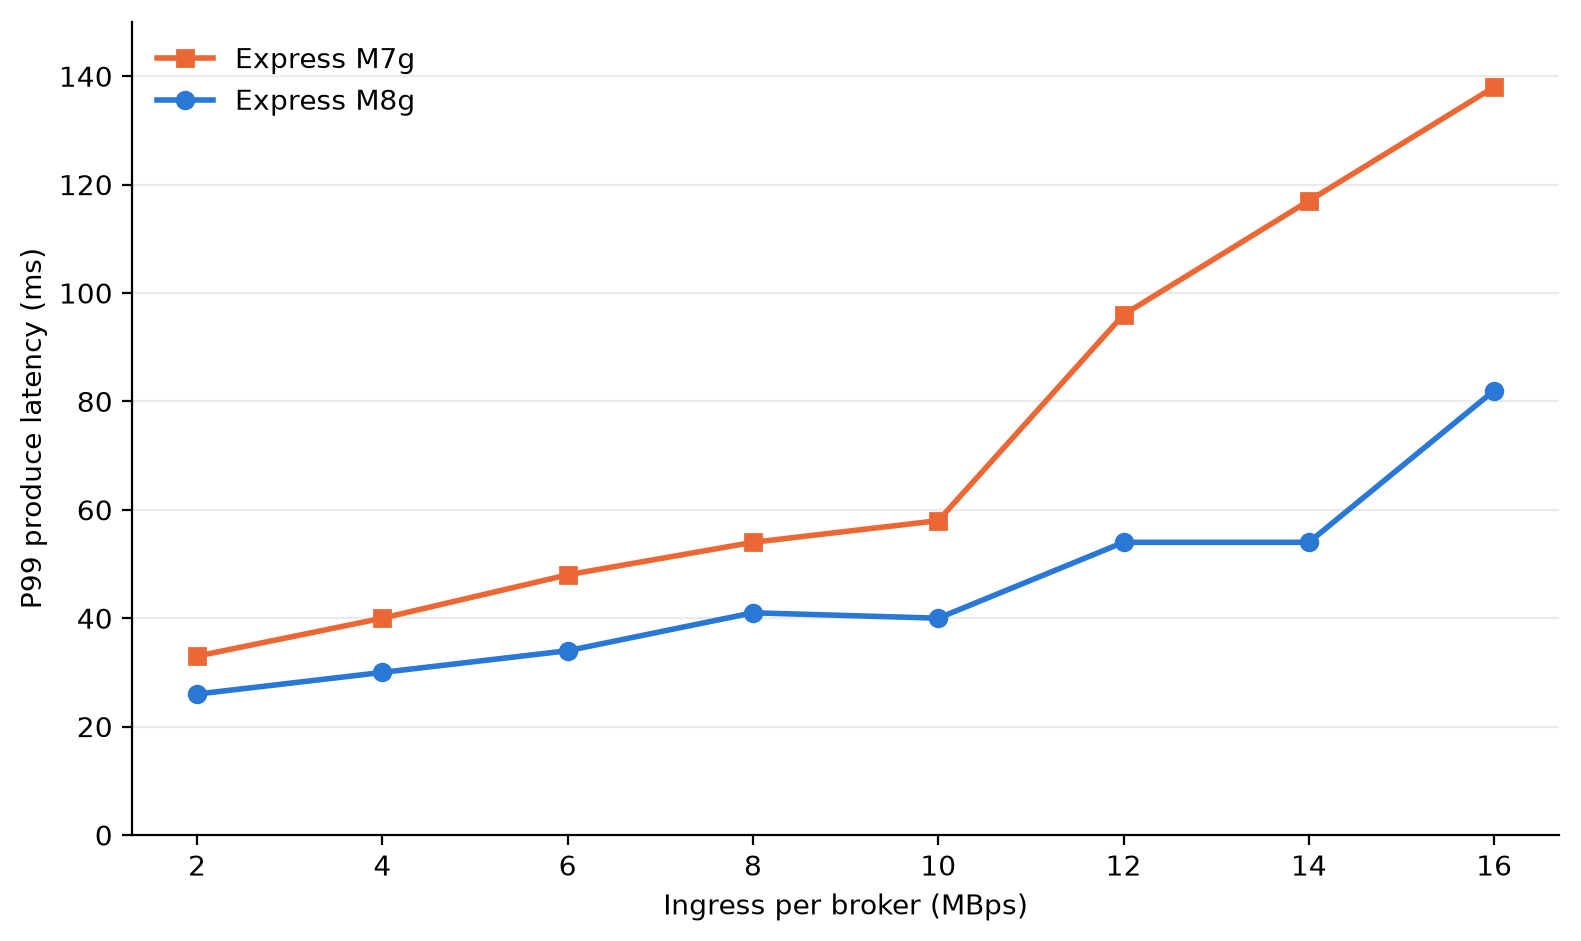
P99 produce latency was lower on M8g at every step. At 6 MBps per broker, P99 was 34 ms on M8g and 48 ms on M7g, 29 percent lower. At 12 MBps per broker, P99 was 54 ms on M8g and 96 ms on M7g, 44 percent lower. The difference was largest at 14 MBps per broker, where P99 was 54 ms on M8g and 117 ms on M7g, 54 percent lower.

Ingress per broker (MBps) M8g P99 (ms) M7g P99 (ms) Reduction
2 26 33 21%
4 30 40 25%
6 34 48 29%
8 41 54 24%
10 40 58 31%
12 54 96 44%
14 54 117 54%
16 82 138 41%
Line chart of P99 produce latency by ingress per broker, lower for express.m8g.large than express.m7g.large at every step

Figure 1: Client P99 produce latency by ingress per broker for express.m8g.large and express.m7g.large

Broker CPU

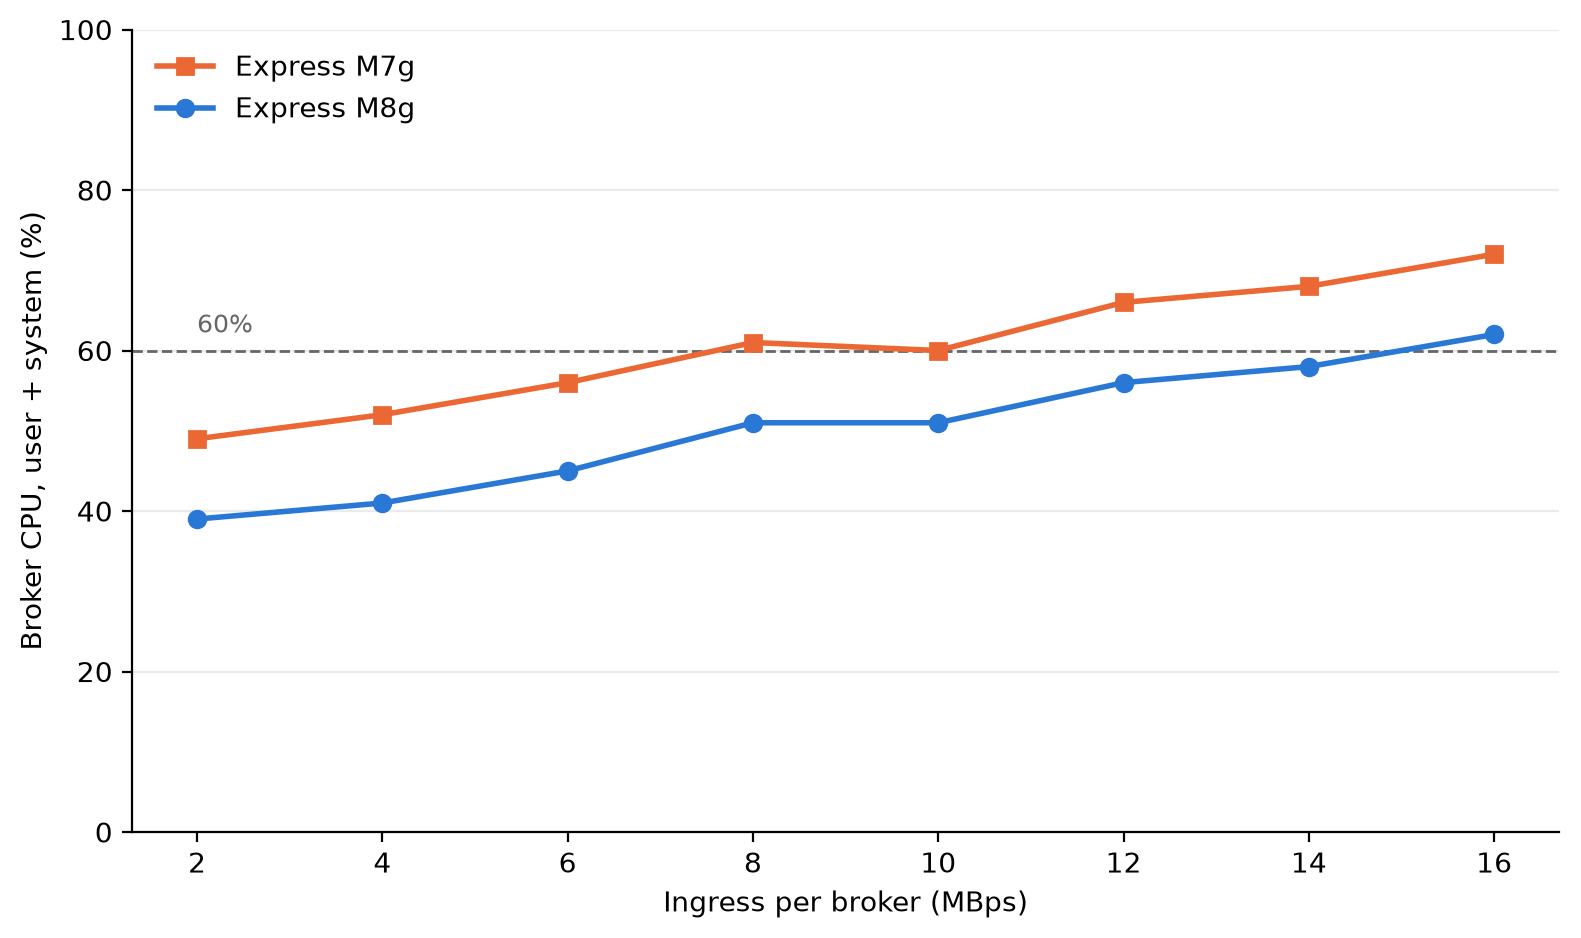
At the same load, M8g brokers used less CPU. Broker CPU (user plus system, averaged across the three brokers) was 9–11 percentage points lower on M8g at each step. At 6 MBps per broker, M8g ran at 45 percent and M7g at 56 percent. M7g brokers ran at 60 percent or higher from 8 MBps per broker. M8g brokers stayed below 60 percent through 14 MBps per broker. That gives you more room on each broker for traffic spikes and broker maintenance.

Ingress per broker (MBps) M8g CPU (%) M7g CPU (%)
2 39 49
4 41 52
6 45 56
8 51 61
10 51 60
12 56 66
14 58 68
16 62 72
Line chart of average broker CPU by ingress per broker, 9 to 11 points lower on express.m8g.large than express.m7g.large

Figure 2: Average broker CPU (user plus system) at each load step for express.m8g.large and express.m7g.large

Consumer catch-up

When consumers fall behind, for example after an outage or a deployment, they must read the backlog while producers keep writing. We ran a separate test to measure how fast consumers catch up on each generation. This test used a new pair of express.m8g.large and express.m7g.large clusters, with the same Kafka version, authentication, and encryption as the latency test, and the following differences:

  • Three topics with 440 partitions each and replication factor 3, for 1,320 partition replicas per broker.
  • 1 KiB records, acks=all, batch.size=65536 (64 KiB), linger.ms=10, and compression.type=none.
  • Producers wrote about 5.7 MBps per broker (35 percent of the recommended ingress for large brokers) for 3 hours, with 2 hours of retention.
  • One consumer group read new records as they arrived. Every 30 minutes, two more groups of 30 consumers each restarted with a new group ID and read from the earliest offset. Each cycle then read the whole retained backlog.
  • Four c5.4xlarge client instances for each cluster (two for producers and two for consumers). Client CPU stayed below 35 percent, so the clients were never the bottleneck.

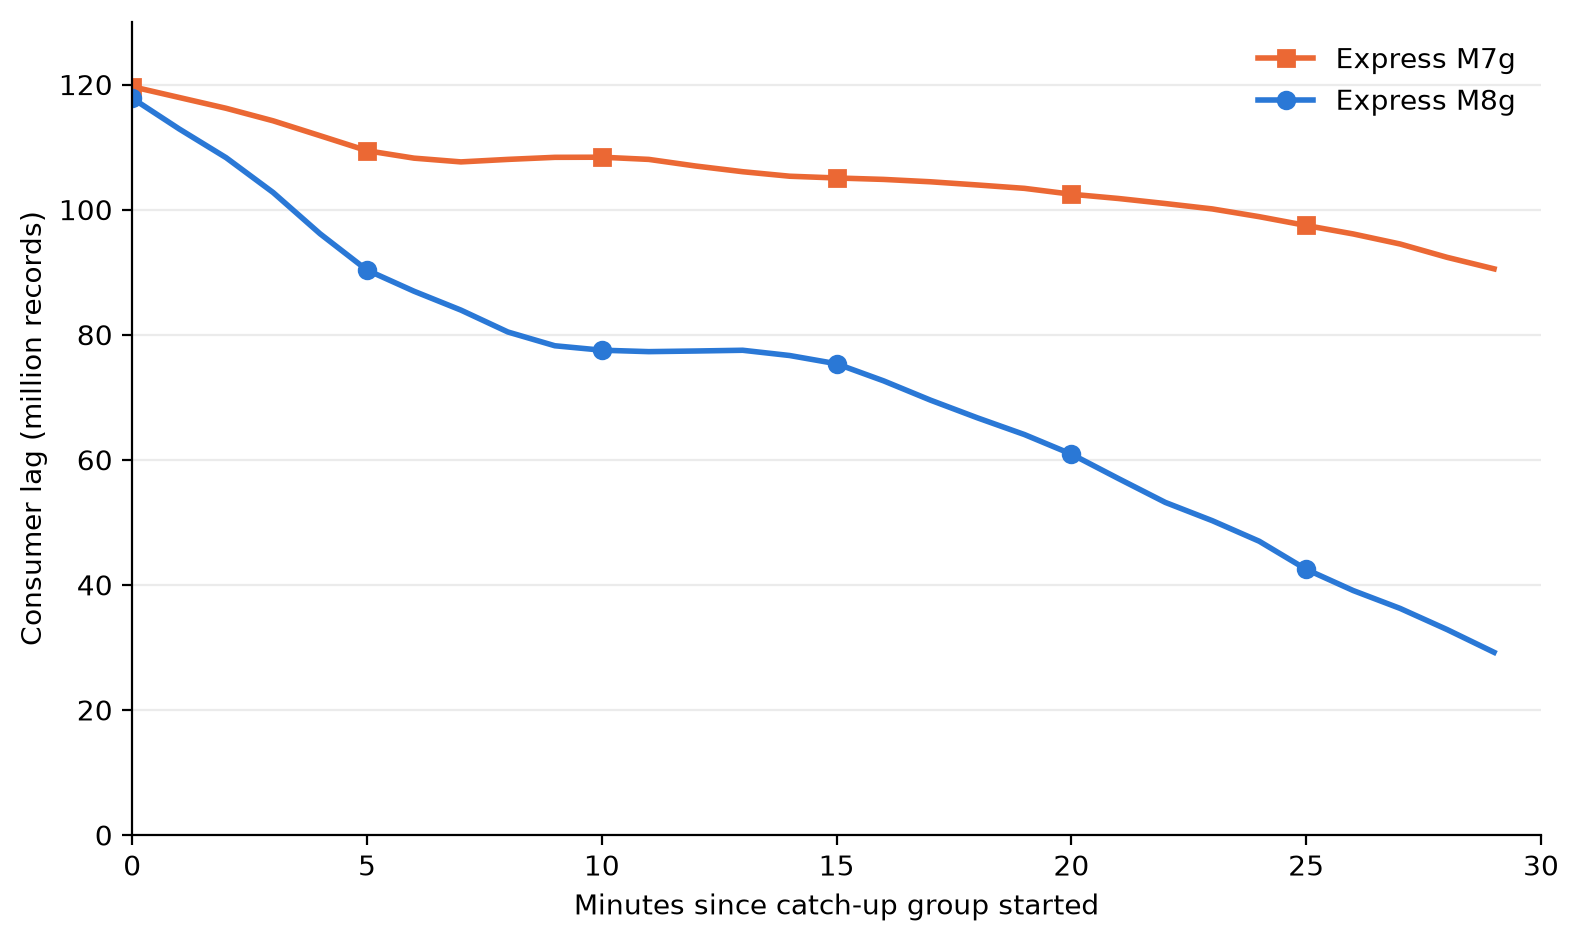
With a backlog of about 30 million records (about 30 GB), consumers on M8g caught up in 13–18 minutes. On M7g, consumers had not caught up after 30 minutes and still had 2–9 million records to read. At the largest backlog, about 120 million records, consumers on M8g cleared about 91 million records in 30 minutes, compared with 30–32 million on M7g. That is about 3x more backlog cleared in 30 minutes.

Line chart of consumer lag over 30 minutes for express.m8g.large and express.m7g.large, starting from about 120 million records. After 30 minutes, M8g lag is down to about 29 million records. M7g lag is still about 91 million records.

Figure 3: Consumer lag after a catch-up group starts from the earliest offset of a 120-million-record backlog, for express.m8g.large and express.m7g.large

Your results depend on load, message size, batch settings, consumer group count, and broker size. We ran this test on the large size only. To estimate your results, create an Express cluster on M8g and run your own workload against it. When you finish testing, delete the cluster to avoid ongoing charges.

Cost

Express brokers on M8g lower your costs in two ways: lower broker-hour pricing, and no broker-side charge for cross-AZ client traffic.

Broker-hour pricing

Broker-hour pricing for Express brokers on M8g is 15 percent lower than Express brokers on M7g at each size. In US East (N. Virginia), express.m8g.large costs $0.347 per hour and express.m7g.large costs $0.408 per hour. Data-in and storage pricing don’t change.

Cross-AZ data transfer

Many production Kafka clusters run across three Availability Zones. When a client connects to a broker in a different Availability Zone, the traffic between them is cross-AZ traffic. With clients spread evenly across three Availability Zones, about two-thirds of client traffic is cross-AZ. Each request goes to the partition leader, which can be in any Availability Zone.

Standard AWS data transfer charges for cross-AZ traffic in US East (N. Virginia) are $0.01 per GB on the sending side and $0.01 per GB on the receiving side, or $0.02 per GB in total. With Express brokers on M8g, AWS doesn’t charge the broker side, so cross-AZ traffic between your clients and brokers costs $0.01 per GB in total. That’s 50 percent lower than on M7g.

The following table shows the cross-AZ data transfer charge per GB of client traffic for each generation.

Express on M7g Express on M8g
Client side $0.01 per GB $0.01 per GB
Broker side $0.01 per GB Not charged
Total per GB of cross-AZ client traffic $0.02 $0.01

You can reduce consumer cross-AZ traffic with rack awareness. Producers must write to the partition leader, which can be in any Availability Zone. Consumers can read from a replica in their own Availability Zone instead. To turn this on, set replica.selector.class to org.apache.kafka.common.replica.RackAwareReplicaSelector in your cluster configuration. Set client.rack on each consumer to the Availability Zone ID it runs in (for example, use1-az1). Consumers that read from a local replica don’t incur cross-AZ traffic, so you pay cross-AZ charges only on the produce side. On Express brokers on M8g, that produce-side cross-AZ traffic costs $0.01 per GB. If you don’t use rack awareness, your consumer cross-AZ traffic also costs 50 percent less on M8g, because AWS doesn’t charge the broker side.

For example, consider a cluster of three large brokers in US East (N. Virginia) with 30 MBps of ingress and two consumer groups (60 MBps of egress). Over a 30-day month, about 155,520 GB of client traffic crosses Availability Zones.

Monthly cost Express on M7g Express on M8g Express on M8g with rack awareness
Broker hours (3 brokers × 720 hours) $881.28 $749.52 $749.52
Cross-AZ produce traffic (51,840 GB) $1,036.80 $518.40 $518.40
Cross-AZ consume traffic (103,680 GB) $2,073.60 $1,036.80 $0
Total $3,991.68 $2,304.72 $1,267.92

With rack awareness, the cross-AZ charge in this example drops from $1,555.20 to $518.40 per month. Reading from a follower replica can add a small amount of end-to-end latency, so test with your workload. For setup steps, see Reduce network traffic costs of your Amazon MSK consumers with rack awareness.

Data-in and storage charges are the same on both generations, so they aren’t included.

To estimate your own cross-AZ traffic, add the BytesInPerSec and BytesOutPerSec CloudWatch metrics across your brokers. Each 1 MBps sustained over a 30-day month is about 2,592 GB. Multiply the total by two-thirds if your clients are spread evenly across three Availability Zones. If your consumers use rack awareness, count only BytesInPerSec.

This applies only to traffic between your clients and brokers. Replication traffic between brokers, and between metadata nodes and brokers, isn’t charged on either generation. For details, see Amazon MSK pricing.

Move to Express brokers on M8g

You have three options, depending on where your workload runs today.

Create a cluster on M8g

In the Amazon MSK console, choose Create cluster, choose Express as the broker type, and choose an M8g size. You can also use the CreateClusterV2 API.

Update an Express cluster on M7g

You can change the broker type of a cluster from M7g to M8g in place. Amazon MSK updates brokers one at a time, so clients keep producing and consuming during the update.

aws kafka update-broker-type \
    --cluster-arn <your-cluster-arn> \
    --current-version <current-cluster-version> \
    --target-instance-type express.m8g.large

Before you update, check that your partition count per broker and your throughput fit within the limits for the target size.

Move from Standard brokers or a self-managed Kafka cluster

Create a new Express cluster on M8g, and then use Amazon MSK Replicator to copy your topics, data, and consumer group offsets to it. For steps, see Migrate from Standard brokers to Express brokers or Migrate from non-MSK Apache Kafka clusters.

Considerations

  • Connection limits per broker don’t change.
  • The pricing and performance changes in this post apply to Express brokers. M8g is also available for Standard brokers. For Standard broker pricing, see the Amazon MSK pricing page.

Conclusion

Express brokers on Graviton4-based M8g instances lower the cost of running Kafka on Amazon MSK and lower tail latency for the same load. You get 15 percent lower broker-hour pricing, no Amazon MSK broker-side charge for cross-AZ client traffic, and a 24xlarge size for workloads that need more capacity per broker. In our benchmark at the large size, P99 produce latency was 21–54 percent lower, broker CPU was 9–11 percentage points lower, and consumers that fell behind cleared up to 3x more backlog in 30 minutes than on M7g.

To get started, create an Express cluster on M8g or update your Express cluster on M7g. Amazon MSK supports M8g sizes in every AWS Region that supports Express brokers. For pricing, see Amazon MSK pricing. For setup steps, see the Amazon MSK Developer Guide.

If you have questions or feedback, leave a comment on this post or start a thread on AWS re:Post.


About the authors

Charishma Makineni

Charishma Makineni

Charishma is a Senior Specialist Solutions Architect for streaming at AWS. She helps customers build real-time streaming architectures using services like Amazon Kinesis Data Streams and Amazon Managed Streaming for Apache Kafka (Amazon MSK). Outside of work, Charishma enjoys being outdoors, gardening, and reading.

Swapna Bandla

Swapna Bandla

Swapna is a Senior Streaming Solutions Architect on the AWS Streaming Specialist SA Team. She has a passion for understanding customers’ data and analytics needs, and empowering them to develop cloud-based, well-architected solutions. Outside of work, she enjoys spending time with her family.

Huyam Hasan

Huyam Hasan

Huyam is a Solutions Architect II at AWS, based in Austin, TX. She works with enterprise customers in travel, hospitality, and gaming to design real-time data and streaming architectures, and helps them bring generative and agentic AI into production. She is passionate about turning data into business outcomes for her customers.

Securely exposing Amazon Bedrock AgentCore Runtime

Post Syndicated from Meriem SMACHE original https://aws.amazon.com/blogs/security/securely-exposing-amazon-bedrock-agentcore-runtime/

Amazon Bedrock AgentCore Runtime delivers a secure serverless environment to deploy AI agents and tools at scale. When you start talking to your agent, the runtime launches a dedicated isolated session that runs in its own dedicated microVM with a completely sandboxed CPU, memory, and filesystem allocation. This provides strict data governance, helps to prevent cross-tenant data leakage, and preserves context while isolating stateful reasoning from external sessions.

To govern access control across these environments, Amazon Bedrock AgentCore Identity provisions distinct workload identities to let your agents run. By federating directly with an OpenID Connect identity provider like Amazon Cognito, Okta, or others, the users can only see and interact with agents they’re authorized to use.

But securing the runtime alone doesn’t protect the ingress path perimeter. When you expose your agent to users through a web or mobile application, the AWS Shared Responsibility Model dictates that you should provide a dedicated access layer that enforces tight control over the origin and intent of every request before any traffic reaches the runtime.

The access layer acts as a trusted bridge to authenticate each incoming request, enforce authorization rules, preserve user identity through the request lifecycle, and securely channel all user traffic into the isolated runtime.

This post walks through two architectures for securing access to AgentCore Runtime and provides guidance to help you decide which architecture best fits your organization.

Why propagating identity is important

In an agentic workflow, downstream data access should remain tied to the invoking user’s identity, and each segment in the execution chain is permissioned only for the immediate next hop. Using a single static credential, even one linked to the original requester, grants every immediate component identical, broad access. This directly violates the principle of least privilege, because the ingress gateway, the proxy, and the agent’s tool execution context each require only enough permission to reach the next component.

Recent real-world incidents have demonstrated that agentic workloads can bypass internal prompt guardrails, escape the software sandboxes, and abuse static credentials to move across applications and layers. In a multi-chain agentic architecture, scoping each hop as tightly as possible is key to preventing these exploits.

However, long-running, unattended execution poses a fundamental identity challenge for extended agentic workloads. If an agent runs a complex task that takes hours, the user’s interactive session will expire before the workload ends, making their short-lived OAuth 2.0 access token invalid mid-execution. Refreshing the tokens won’t solve this problem and storing a long-lived, user-scoped credential inside the agent’s runtime environment might reintroduce exactly the broad, standing credential attack surface that the zero-trust architectures are intentionally designed to mitigate.

To mitigate this, identity propagation acts as a critical bridge between authentication at the perimeter and authorization at the data layer. The agent must operate within the invoking user’s authorization scope. Every session receives a short-lived, user-scoped token that provides only the permissions granted to that specific user and authorization is enforced at each hop. If any single segment is compromised, then the exposure is contained in that hop scope. This security model also strengthens a continuous verification process where the tokens are validated at every hop from the ingress endpoint through AgentCore to the downstream resource, so no segment operates with unverified or elevated privileges.

Protecting AgentCore Runtime: What does it need?

We explained in the previous section why identity must follow the user through every hop. However, identity propagation alone isn’t enough to secure the ingress path; it must be integrated within a broader set of ingress controls that together protect the path into the runtime.

AgentCore Runtime provides infrastructure isolation, per session microVMs, per session tool registration, and enforces the application of Amazon Bedrock Guardrails. These features and resources protect the execution environment. However, they don’t control who reaches the runtime, how they’re authenticated, or whether their identity is preserved through the chain. That responsibility falls on the ingress control layer that you build. Securing this path requires a defense-in-depth architecture that binds every request to the user’s identity before it ever reaches the agent’s reasoning loop.

To protect and control data access, any architecture exposing AgentCore Runtime to users must satisfy the following requirements:

  • Authentication: Continuously verify the identity of every requester at the perimeter by validating tokens against the identity provider’s public keys.
  • Authorization: Determine what the authenticated subject is allowed and authorized to do, which actors they can invoke, which scopes they hold and which operations they can perform.
  • Per-hop least privilege: Make sure each component in the chain holds only enough permission to call the next hop, eliminating broad-scope credentials. Each hop must exchange the inbound token for a down-scoped, short-lived credential valid only for the immediate downstream call.
  • Identity propagation: Preserve the user’s identity through the full execution chain, so the agent operates within the user’s authorization scope. For long running or unattended workloads where the user’s session closes mid-flight, the ingress must seamlessly transition the active user token into an encrypted, short lived session context key from AgentCore Runtime. This allows the microVM to securely assert a restricted, cryptographic snapshot of the user’s identity even when the user is completely offline.
  • Edge security: Inspect and filter traffic before it reaches the application logic, by applying the needed WAF rules, bot control, IP-based rate limiting, and so on.
  • Network perimeter: Restrict runtime access to a single secure, controlled network path. Traffic arriving from any unexpected origin must be rejected regardless of the token’s validity.
  • Content protection: Enforce the Guardrails on both incoming prompts for injection attacks and outgoing tool arguments for malicious payload before execution.
  • Audit and logging: Log every authentication outcome, the authorization decision on the tool invocations, and any security event to an externalized system for compliance and incident response.

These security requirements are mandatory baselines to expose any agentic workloads to users. Any missing requirement might create a potential attack vector. By applying this full set of guardrails, you help contain the impact of a potential malicious exploit to a single user, a single session and a single execution hop.

In the next section, we provide two architecture patterns that implement this propagation differently:

  • The first architecture validates the user’s token independently at each layer while preserving it for the runtime to verify directly.
  • The second architecture exchanges the user’s token at the gateway boundary for scoped machine credentials, attesting the user’s identity through verified claims. This pattern is uniquely suited for handling the session context keys required by asynchronous, unattended workloads.

Both approaches achieve the same result: the agent acts as the user rather than with elevated privileges.

The AgentCore Gateway patterns

Each of the following patterns is presented the same way: the layered controls a request passes through before reaching the agent, followed by how user identity is carried to the runtime. As you explore, please note where each pattern places the trust boundary as that difference is what drives the trade-offs summarized at the end.

Pattern A: Expose through API Gateway

We expose AgentCore Runtime through Amazon API Gateway, which acts as a dedicated ingress point that terminates each client connection. Before any request reaches the agent, it must pass through layered security controls:

  • A Lambda authorizer: An AWS Lambda authorizer validates the Amazon Cognito-issued JSON Web Token (JWT) by verifying the signature, issuer claim and token expiration, to confirm the requester’s identity.
  • AgentCore Identity: Independently, AgentCore Identity performs a second validation inherent to the Lambda authorizer through its OAuth 2.0 inbound authentication flow. This helps to confirm the user’s identity before the request reaches the runtime to be processed.

Because the client-provided session ID is treated as untrusted input, the Lambda authorizer creates a composite session ID by appending the user identifier to the client-provided session ID. Even if two different users submit the same session ID, they resolve to unique composite IDs at the AgentCore Runtime level, preventing any cross-user session leakage.

To prevent denial of service attempts, we suggest using Amazon DynamoDB as a lightweight session counter. While the AWS WAF rate-based rules attached to the API Gateway stage protect against IP-level volumetric abuse, they evaluate requests before authentication. The Lambda authorizer checks and increments a per-user counter in DynamoDB after validating the user’s identity, helping prevent a single authenticated user from exhausting agent capacity, even if they connect from multiple IP addresses. This design scales cleanly by using a composite session ID. The Lambda Authorizer combines the user identifier and the client session ID, routing each user’s counter to a distinct partition. This naturally distributes write traffic and reduces the risk of hot keys.

Each session can sustain roughly 1,000 counter updates per second before reaching DynamoDB’s per-partition write limit, which is far beyond what any legitimate session would ever generate. That same limit is exactly what makes the counter an effective throttle. Meanwhile, total capacity across all users scales horizontally, growing with the number of active sessions. For high-volume production deployments, on-demand capacity mode absorbs sudden spikes automatically, and CloudWatch Contributor Insights lets you confirm traffic stays evenly distributed.

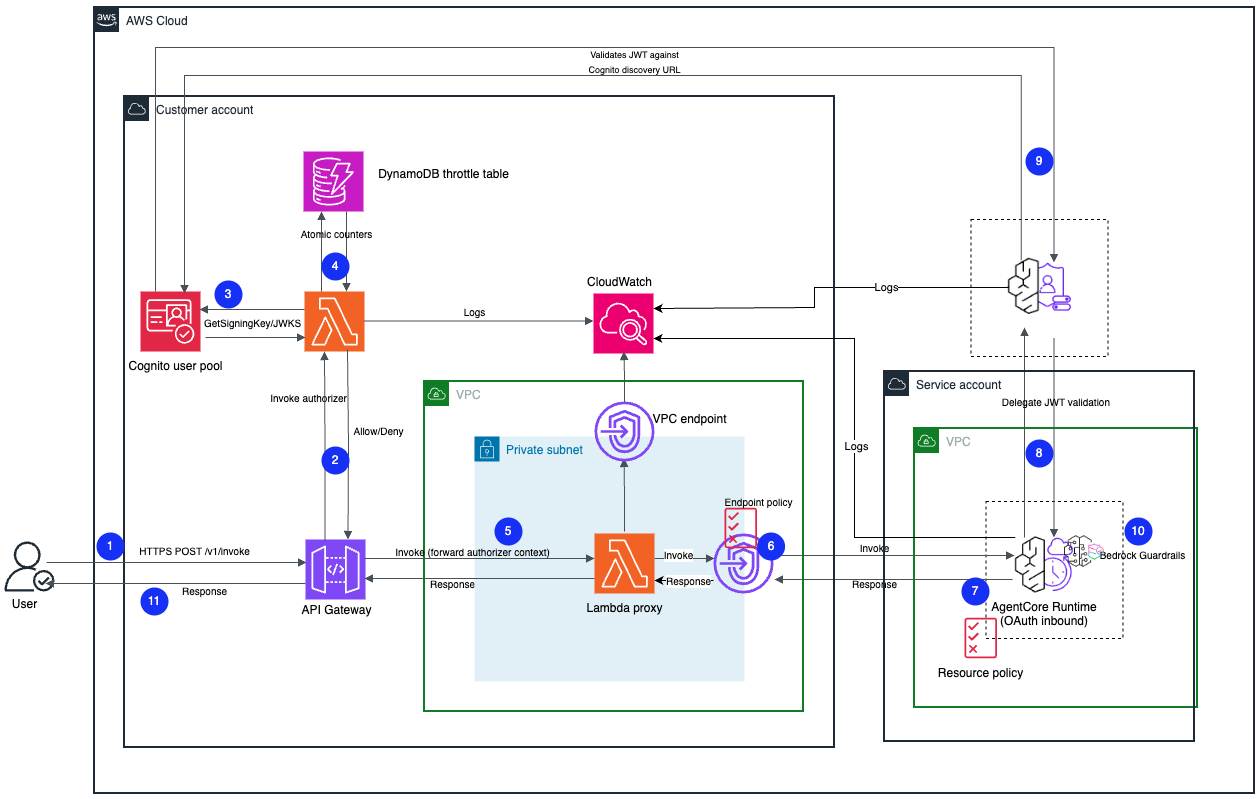
After the Lambda authorizer approves the request, as shown in the Figure 1:

  1. API Gateway forwarding: Passes the approved request to Lambda proxy that runs within an isolated environment with no internet egress.
  2. VPC endpoint routing: The proxy Lambda function forwards the request to AgentCore Runtime through an Amazon Virtual Private Cloud (Amazon VPC) endpoint, making sure that all traffic remains strictly within the private network.
  3. Token preservation and identity propagation: The proxy Lambda function forwards the user’s token unchanged in the authorization header; this maintains the original user identity throughout the entire flow of AgentCore Runtime.

API Gateway forwards the request to a Lambda proxy running on a private VPC with no internet egress. The role of this Lambda proxy is to relay the request to AgentCore Runtime through a VPC endpoint, so that all communication remains within the private network. The Lambda proxy forwards the user’s token (unchanged) in the Authorization header, which preserves the user’s identity all the way to AgentCore Runtime.

Figure 1: Pattern A architecture for exposing AgentCore Runtime through Amazon API Gateway

Figure 1: Pattern A architecture for exposing AgentCore Runtime through Amazon API Gateway

This VPC endpoint enforces a strict network perimeter using two independent controls:

  • Security groups: The VPC endpoint security group restricts ingress solely to the proxy Lambda function on port 443, so no other compute in the account can reach the endpoint.
  • Resource-based policy: The runtime resource-based policy is configured with principal "*" and a condition that allows invocations only when the request carries aws:SourceVpc and aws:SourceVpce values matching this stack’s VPC and endpoint. Authentication happens at the AgentCore Identity level, so there is no AWS Identity and Access Management (IAM) principal to match, and the network path is the only meaningful gate and condition that remains. AgentCore Runtime rejects requests sent directly from outside the VPC with an AccessDeniedException, even with a valid JWT.

Beyond the network boundary, Amazon Bedrock Guardrails evaluates each model’s invocation for prompt injection attacks, helping catch malicious inputs even after an invocation has passed identity and network verification. This adds content protection as a defensive layer independent of identity and network controls.

Your stack logs and tracks every authorization outcome along this path as structured JSON to Amazon CloudWatch, with an INVALID_JWT alarm. The full walkthrough and a deployable AWS Cloud Development Kit (AWS CDK) sample are linked at the end of this post.

Before production deployment, we recommend configuring an AWS WAF Web ACL at the API Gateway stage to inspect requests before they reach the Lambda authorizer. You should include AWSManagedRulesCommonRuleSet and AWSManagedRulesKnownBadInputsRuleSet for generic OWASP Top 10 protections and known exploit patterns, AWSManagedRulesSQLiRuleSet to catch injection signatures, a per-IP rate-based rule ahead of the DynamoDB throttle counters, and custom rules to reject oversized requests or malformed session IDs early. For a step-by-step integration guide including two deployment patterns for placing AWS WAF in front of the AgentCore Runtime, see Securing Amazon Bedrock AgentCore Runtime with AWS WAF.

This first pattern satisfies the ingress security requirements discussed earlier. It achieves defense in depth by applying the authentication at two independent layers, enforcing authorization through session binding and controlling traffic through per-user throttling. The architecture maintains per-hop least privilege from the API Gateway through the AgentCore Runtime while preserving end-user identity propagation by passing the user’s token through unchanged. The edge filtering is managed with AWS WAF and the network perimeter is enforced by VPC endpoint controls. The design includes the application of Amazon Bedrock Guardrails for content security with a tamper-proof audit trail in Amazon CloudWatch. The deployable CDK sample for pattern A is available on GitHub.

Pattern B: Expose through AgentCore Gateway

With Pattern B, you expose AgentCore Runtime through Amazon Bedrock AgentCore Gateway, a managed service purpose-built for agentic traffic that combines ingress authentication, token exchange and Runtime routing without requiring a proxy Lambda function or custom VPC networking.

Before any request reaches the agent, it passes the following layered security controls:

  • Inbound authentication: A custom JWT inbound authorizer is configured on AgentCore Gateway that validates the Amazon Cognito JWT by verifying its signature, issuer, and expiration before any logic runs.
  • Identity extraction, session binding and guardrails: A REQUEST interceptor for Lambda, invoked directly by AgentCore Gateway, extracts the verified user identity claims from the validated token for downstream injection. For asynchronous or unattended workloads, this interceptor securely binds these claims into an encrypted, short lived session context key. This helps ensure that even if the user’s interactive session expires hours later, a secure snapshot of their identity remains intact. It mirrors the role of the Lambda authorizer in Pattern A, enforcing the same session-binding and throttling logic.
  • Perimeter authorization (AgentCore Policy): AgentCore Gateway uses a deterministic Cedar-based policy engine to evaluate each request against defined policies before allowing tool access. It also enforces Amazon Bedrock Guardrails through AgentCore Policy for screening prompt injection and content violations at the gateway level, before the request reaches the agent. This declarative enforcement is an advantage over the API Gateway pattern where guardrails must be invoked programmatically from within the agent code.

After the authorization succeeds, the gateway manages the outbound call to AgentCore Runtime by using a strict workload isolation mechanism as shown in Figure 2:

  1. Token exchange: The gateway requests a machine-to-machine (M2M) token from AgentCore Identity using a dedicated Amazon Cognito M2M app client and attaches it to the request.
  2. Workload verification: The AgentCore Runtime validates this token against the allowedWorkloadConfiguration parameter, confirming the request originated from the gateway.
  3. On-behalf-of access: The runtime unpacks the session context key, allowlists the injected user identity passed by the interceptor and forwards it directly to the agent to enable secure, context-aware execution on behalf of the user, even during completely unattended background execution loops.
Figure 2: Pattern B architecture for exposing AgentCore runtime through AgentCore Gateway

Figure 2: Pattern B architecture for exposing AgentCore runtime through AgentCore Gateway

If a client attempts to bypass the gateway by sending a valid user token directly to the runtime, the request is automatically rejected because it lacks the required workload identity.

For more operational efficiency, AgentCore Gateway integrates AWS WAF directly at the single gateway access point, protecting the entire ingress path in one place, without the need to manage separate authorizers, proxy Lambda functions or VPC endpoints.

While API Gateway also supports AWS WAF, the AgentCore Gateway pattern simplifies management by consolidating all ingress controls behind a single component.

The AgentCore Gateway also supports native rate limiting, removing the need for custom DynamoDB-based throttle tables, for your production environments. The interceptor writes a structured audit trail to CloudWatch, with an INVALID_JWT alarm to flag spikes in authentication failures.

Before production deployment, we strongly recommend that you enable AWS WAF on the AgentCore gateway with the same rule sets described in the API Gateway pattern, including the OWASP protections, SQL injection, and custom rules for oversized or malformed requests.

To summarize, this second architecture satisfies the ingress security requirements defined earlier. It achieves defense in depth by applying a managed CUSTOM_JWT authorizer directly at the entry point, enforcing authorization through interceptor-based session binding and using rate limiting to control traffic. This pattern maintains per-hop least privileges from AgentCore Gateway through to the runtime by automating M2M token exchange, while propagating user identity for on-behalf-of execution. The edge security is managed by AWS WAF, coming directly with the gateway’s single-entry point, and secure workload isolation strictly enforces the perimeter. Finally, this design applies declarative Amazon Bedrock Guardrails for early content safety, and a tamper-proof audit trail and alarms in CloudWatch. The complete CDK sample for Pattern B is available on GitHub.

Choosing your AgentCore Runtime patterns

As explained earlier, securing access to AgentCore Runtime can be achieved through two different patterns: The AgentCore Gateway pattern or the Amazon API Gateway pattern. The right choice depends on your existing AWS infrastructure, workload constraints, and operational preferences.

Choose the Amazon API Gateway pattern if:

  • You have existing API infrastructure: Your team already runs an established Amazon API Gateway and AWS WAF deployment
  • You need a single entry point: You prefer to fold agentic traffic into your existing pipelines rather than introducing a separate entry point to operate and secure.
  • Your security model is VPC centric: Your security and compliance teams rely on VPCs and security groups as their primary network control layer
  • Your agent sessions are short-lived: While API Gateway has increased its integration timeout beyond 29 seconds, long running agentic workloads with streaming tool calls might still exceed it. This isn’t a concern if your sessions are brief.

Choose the AgentCore Gateway pattern if:

  • You’re building a new gateway: Your organization has no existing API Gateway
  • You have long run workloads: Your agents use streaming or long running tool calls that require strict API timeouts
  • You need low operational overhead: You prefer a fully managed perimeter over manually wired infrastructure
  • You require advanced AI routing: You want built-in capabilities to convert APIs and Lambda functions into Model Context Protocol (MCP) tools, handle Agent to Agent (A2A) traffic and route inference across different model providers.

The following table summarizes the key elements that help you make the right architectural decision:

Consideration API Gateway (Pattern A) AgentCore Gateway (Pattern B)
Suited to Teams already standardized on API Gateway Teams starting fresh who want less infrastructure to operate.
Perimeter control Runtime resource policy with aws:SourceVpc and VPC endpoint security group Runtime workload lock (allowedWorkloadConfiguration).
Components to operate API Gateway, Lambda authorizer, Amazon VPC, VPC endpoints, proxy Lambda function AgentCore Gateway and Lambda REQUEST interceptor.
User identity to agent User JWT forwarded unchanged (no SigV4) Interceptor-injected verified headers (OAuth outbound M2M token).
AWS WAF Attach directly to the API stage Attach directly to the gateway.
Request timeout Inherits the API Gateway integration timeout Not subject to this limitation.
Public endpoint Can be fully private (API Gateway PRIVATE endpoint type) Supports AWS PrivateLink ingress and VPC Lattice egress, but keeps a public endpoint active. Access relies on the JWT authorizer and resource policy rather than removing the endpoint

Conclusion

By securing access to the AgentCore Runtime with a defense in depth, an agent can be both highly usable and secure. The two patterns in this post complete the shared responsibility model for you: they authenticate every request against the identity provider, authorize it at each step and propagate the user’s identity end-to-end from the edge through the token exchange into the isolated microVM (AgentCore Runtime) and down to the agent’s tool calls (AgentCore Gateway). Each step only holds a short-lived credential for the next one, so the agent always works within the user’s permissions rather than with broad, long-term access. If one step is ever compromised, the design limits the impact to that single step, session and user. Whether the runtime is behind API Gateway with a VPC endpoint or in front of it with AgentCore Gateway, the design verifies each request at each step.

To get started, clone the Pattern A sample or the Pattern B sample, deploy it in your account, and test it against your requirements. Both samples are provided as a starting point, not a production-ready deployment. We recommend working with your security and legal teams to adapt to the controls before going live. From there, you can extend either pattern for multi-tenant use, add observability hooks, or tighten controls for your specific compliance requirements.

If you have questions about this post, contact AWS Support or start a new thread on AWS re:Post.


Merriem-SMACHE

Meriem SMACHE

Meriem is a Security Specialist Solutions Architect at AWS, supporting customers in the design and deployment of resilient cloud and AI solutions, from generative AI workloads to fully autonomous agentic systems, that meet their regulatory requirements and security needs.

Christian Kamwangala

Christian Kamwangala

Christian is a Senior AI/ML and Generative AI Specialist Solutions Architect at AWS, based in Paris, France. He partners with enterprise customers to architect, optimize, and deploy production-grade AI solutions using the comprehensive AWS ML stack. Christian specializes in inference optimization techniques that balance performance, cost, and latency requirements for large-scale deployments. Christian enjoys exploring nature and spending time with family and friends.

Lior Perez

Lior Perez

Lior is a Principal AI & Machine Learning Solutions Architect at Amazon Web Services, based in Toulouse, France. He helps customers speed up their digital transformation with AI. He wrote the AWS Prescriptive Guidance Governing and Architecting the Diversity of Agentic AI at Scale, which helps enterprises design and govern AI agents. He makes complex ideas simple and practical. His background in manufacturing and meteorology gives him a different way of looking at business challenges.

Charline Boulie

Charline Boulie

Charline is a Senior Solutions Architect at AWS. She helps French FinTech startups and scale-ups build and scale secure, generative AI-powered workloads, focusing on agentic AI, application development and security. She brings 15 years of software and cloud architecture experience from Thales Avionics and AWS Professional Services, and champions women in tech through mentoring and student outreach.

Quad9’s withdrawal from France: A canary in the coal mine

Post Syndicated from Patrick Nemeroff original https://blog.cloudflare.com/quad9-withdrawal-from-france/

Last month, the Swiss non-profit foundation Quad9 announced that it will withdraw its free public DNS resolver from France. This difficult decision followed months of litigation and a French court ruling that imposed daily financial penalties on Quad9 for failing to block domains associated with alleged copyright infringement.

Quad9’s departure from France is both disheartening and understandable. The court’s ruling put the organization in the impossible bind of having to choose between crippling litigation and penalties, or fundamentally altering its service in a way that would undermine the privacy and security of its users. Left with no good option, Quad9 is choosing the exit door instead.

The withdrawal of a basic infrastructure service from France fundamentally harms the free and open Internet, and it should serve as a warning of the damage that will result if rightsholders and policymakers continue demanding maximal blocking across every layer of the Internet. It not only deprives French Internet users of a trustworthy and important tool; it creates a real risk of disruption to their daily lives. Quad9’s resolver is used by a wide variety of individuals and organizations in France — including government bodies, educational institutions, hospitals, and utilities — and Quad9 has no way to directly notify those individuals and institutions that their resolver will soon stop working. If the affected parties do not change their resolver before Quad9 removes its service, their Internet will fail with no explanation.

Quad9 is not the first public DNS resolver to withdraw from a country following blocking orders, and it almost certainly won’t be the last. Cisco previously withdrew its OpenDNS resolver from France, Portugal, and Belgium (temporarily) under similar circumstances. And a Belgian court recently issued an order that would impose substantial penalties if Cloudflare, Google, and Cisco do not begin blocking websites through their public resolvers by early January 2027. That’s something Cloudflare has never done.

Cloudflare has spent years advocating against orders of this kind. We are concerned that rightsholders’ unrelenting demands for blocking by public DNS resolvers will end up causing real harm to the Internet.

A refresher on DNS, the Domain Name System

To understand why this is such a problem, it helps to understand how the Internet works under the hood. DNS resolvers are a foundational piece of the Internet’s infrastructure. DNS is the Internet’s address book: when you type a website name such as cloudflare.com, the DNS system translates that domain name into the IP address your device needs to connect to it. A DNS resolver is the service that looks up that address and sends it back to your device, much like an operator finding a phone number in a directory.

DNS resolvers can be operated by anyone, but they are commonly run by Internet service providers (ISPs), mobile networks, businesses, and universities. If you’re reading this blog post at home and have never thought about DNS before, chances are that you’re using your ISP’s default resolver. Because you use your DNS resolver every time that you visit a website, it’s important for it to be reliable and trustworthy.

And because the DNS resolver has access to all of your browsing activity, which resolver you use has real privacy implications.

In addition to DNS resolvers that are provided by your local ISP, there are a variety of public DNS resolvers available. Cloudflare launched our public DNS resolver 1.1.1.1 in April 2018 to give back to the Internet. Our goal was to make a fast, reliable, privacy-first consumer DNS service available for free to everyone. We succeeded. 1.1.1.1 is among the fastest DNS resolvers in the world, including in Europe. Cloudflare's resolver doesn’t collect any user data, let alone sell it to advertisers. 1.1.1.1 has always been one of our favorite examples of Cloudflare fulfilling its mission to help build a better Internet.

1.1.1.1 is one of many public resolvers that anyone can use. In addition to 1.1.1.1 and Quad9’s 9.9.9.9, some of the other best-known public resolvers include Google’s 8.8.8.8 and Cisco’s OpenDNS. Just because these services are offered for free doesn’t mean they’re easy to provide. A well-run global public DNS resolver is an extraordinary engineering feat, built to securely and privately resolve hundreds of billions or even trillions of queries a day across a globally distributed network of hundreds of server locations.

As Quad9 notes, there are many other DNS resolvers available to users, many of them offered by essentially anonymous services whose practices are unknown or undocumented. It’s easy to change your DNS resolver, and people do so for a variety of reasons including performance, reliability, or to access specific security features.

Why public DNS resolvers should not be required to block

Rightsholders have a legitimate interest in preventing online piracy. But trying to address online infringement through public DNS resolvers is fundamentally the wrong approach.

Among other things, such blocking is ineffective. Think back to the analogy of an operator finding a phone number in a directory. If a court wants to shut down an illegal business, forcing the directory operator to cross the business's name out of the phone book doesn't actually close the business. The storefront is still open, the products are still there, and anyone who already knows the address, or uses a different phone book, can walk in.

The same is true for the Internet. DNS resolvers are just one link in the transmission chain. The only way a DNS resolver can “block” content is by declining to return the IP address for a particular website. But a public DNS resolver cannot remove the actual infringing content from the Internet, nor can it take down the servers hosting it.

Because of this, blocking by public DNS resolvers is remarkably easy to bypass. Any Internet user who wants to reach a blocked site can circumvent the block in less than a minute simply by switching to one of the thousands of other DNS resolvers available online. In fact, users don’t even need a resolver at all to reach infringing content if they already know the underlying IP address. Unsurprisingly, while blocking via public resolvers may inject some friction for some users when accessing content, there is no evidence that it actually reduces the total amount of online infringement that occurs.

In addition to being ineffective, as we’ve written previously, DNS blocking is a blunt instrument that causes collateral damage. Because DNS operates at the domain level, a resolver cannot block a specific infringing video or file; it must block the entire domain. This affects all content on that domain, whether legal or illegal. It is also entirely opaque to the user: when a resolver is forced to block a domain, the website simply fails to load. The user receives no explanation or legal notice, making it impossible to know if the site is down for maintenance, if their network is broken, or if the site was blocked by a court order.

The problem is substantially worse with respect to public DNS resolvers. Because public resolvers operate globally, any blocking will naturally cross borders, meaning that a single country could dictate what content is accessible around the world. For example, while the EU-dedicated DNS resolver DNS4EU operated by Whalebone blocks in response to country-specific orders, it does so across the entire EU. Efforts to reengineer public DNS resolvers to allow for more localized blocking would fundamentally alter the service, harming performance and resilience, undermining user privacy, and fragmenting the open Internet.

For these reasons, Cloudflare, Google, Cisco, and Quad9 have all opposed efforts to mandate blocking by public DNS resolvers, with some success. Several years ago, courts in Germany ruled in favor of Cloudflare and Quad9, rejecting requests to require DNS blocking. More recently, a French court rejected penalties against Cloudflare for failing to block through 1.1.1.1, finding that other actions we had taken through our CDN and reverse-proxy service were sufficient to comply with the underlying order.

Undeterred, rightsholders have continued to press for blocking by public resolvers with a level of determination that is hard to explain. A recent study found that the majority of online piracy in Europe is hosted in Europe. If rightsholders want to genuinely address online infringement, there are far better places to focus their efforts — most notably by requiring the hosting providers who actually store the pirated files to take them down.

Forcing public DNS resolvers out of markets hurts the Internet

The French court’s penalty order against Quad9 represents the culmination of these rightsholder efforts. As a small non-profit that only offers a public DNS resolver, Quad9 had no alternative methods for demonstrating compliance with the order. The French court therefore granted rightsholders’ request to issue penalties for non-compliance, forcing Quad9 to undermine its own service or leave the country.

Quad9’s withdrawal from France represents a genuine loss for the Internet. In the short term, removal of Quad9’s resolver is likely to cause immediate and potentially severe disruptions to Internet access. Because of the way their service is set up to preserve privacy, Quad9 has no way to know who exactly is using its resolver, let alone to directly communicate to them about the upcoming withdrawal of services. That means that individuals, hospitals, universities, and government offices all may be caught unaware when the resolver stops working. Again, because of how DNS resolvers work, those users will not receive a detailed error message explaining what happened — their Internet will simply stop working. The problem will be even worse when devices like security systems or thermostats are hardwired to use Quad9’s resolver. Fixing these issues may be slow or even impossible.

More generally, driving Quad9 out of France does absolutely nothing to prevent online infringement, but it does leave everyday Internet users with fewer safe, reliable options, particularly ones like Quad9 that also protect users from phishing and malware. Taking established public DNS resolvers away forces Internet users to fall back on the default resolvers offered by their ISPs (which may monetize their browsing data), try lesser-known resolvers operated by anonymous or less trustworthy organizations, or run their own resolver. The irony is that Quad9 and Cloudflare are being pulled into court precisely because we are transparent, reputable organizations. Penalizing transparent services only pushes users toward less accountable corners of the web.

The way forward

If nothing else, we hope that Quad9’s announcement may serve as a wake-up call to rightsholders and policymakers that seeking to block infringement at every layer of the Internet has real costs.

We believe there are far better ways to work together to fight piracy without compromising the integrity of the Internet, and Cloudflare continues to pursue innovative collaborations to that end. Our collective efforts in addressing online infringement would be put to better use in seeking to have such content removed at the hosting provider, which would both achieve a more durable solution and avoid collateral damage to the Internet.

In the meantime, we will keep resisting misguided efforts to require blocking by public DNS resolvers. Along with Google and Cisco, we have appealed the Belgian order that would impose penalties on us if we do not start DNS blocking by January 2027. We hope to get a resolution before the end of the year that would avoid another situation like the one Quad9 faces now in France.

We have grave concerns about the disruption that would be caused if additional resolvers are forced to withdraw from markets, and we will continue to advocate against that possible result.

Inside Deutsche Bank: Тръмп, Deutsche Bank и руската връзка

Post Syndicated from Биволъ original https://bivol.bg/deutschebank_trump.html

вторник 17 ноември 2026


Международното журналистическо разследване Inside Deutsche Bank („Отвътре в Deutsche Bank“) разкрива финансовите връзки на компаниите на Тръмп със схемата за пране на пари “Азербайджанска перачница”. Компаниите на Тръмп са получили…

Материалът <span style='color:#ff0000;font-size:12px;'>Inside Deutsche Bank:</span> <BR> <H1 class='post-title single-post-title entry-title'>Тръмп, Deutsche Bank и руската връзка</H1> е публикуван за пръв път на Bivol!.

Enforcing zero-trust dependency policies in AWS CodeBuild with JFrog Curation

Post Syndicated from Arik Yakir original https://aws.amazon.com/blogs/devops/enforcing-zero-trust-dependency-policies-in-aws-codebuild-with-jfrog-curation/

Software supply chain attacks are rising sharply. JFrog’s 2026 research recorded a 451% year-over-year increase in malicious npm packages, yet every application that pulls open source packages during a build is still taking the same fundamental risk. When a developer runs pip install or npm install, the build environment downloads dependencies directly from public registries with no verification that those packages are safe. A vulnerable or malicious package can slip into your container image, get pushed to a registry, and reach production before anyone notices. By the time a scanner flags a critical CVE, the damage is already done.

This is a familiar situation for teams building on any continuous integration and continuous delivery (CI/CD) platform, including AWS CodeBuild. A build completes successfully, tests pass, and the artifact ships. Days or weeks later, a security review reveals that one of dozens of transitive dependencies carried a known vulnerability, or worse, was a malicious package designed to exfiltrate secrets. The fix isn’t only patching. It’s rebuilding, re-testing, and redeploying, all while assessing the scope. What teams need is a way to enforce a zero-trust dependency policy: a gate that blocks risky packages at download time, before they ever enter the build. That is exactly what JFrog Curation provides. It evaluates every package at the moment it is downloaded. When a package violates policy, it returns an HTTP 403 (Access Denied) error, failing the build before a risky dependency enters your environment.

In this post, you’ll learn how to use JFrog Curation as a policy gate inside AWS CodeBuild to block vulnerable and malicious dependencies at download time, before they ever become an artifact.

The customer problem

Your team ships a container built from open source dependencies. Weeks later, a security scan surfaces a critical vulnerability in a transitive package you didn’t even choose. Now you’re scrambling to identify which images are affected, rebuild, re-test, and redeploy, all under time pressure and with no guarantee you’ve caught everything.

The root cause is that nothing enforces policy at the moment dependencies are downloaded. When a build runs pip, npm, or Maven, it pulls whatever the manifest declares directly from a public registry. Scanning catches problems after the artifact exists, but by then the vulnerable package is already in your image and potentially in production.

Solution overview

The pipeline is an ordinary container build with one decisive change: The only route to public package registries runs through JFrog Artifactory, and Curation sits on that route. A developer commit triggers CodeBuild, which runs a Docker build. Inside that build, pip install resolves through the Artifactory virtual repository. Approved packages flow through and the image is pushed to Amazon Elastic Container Registry (Amazon ECR). A blocked package fails the build before any image exists.

For this walkthrough, the policy is “Block Critical CVEs”, which rejects any package version with a Common Vulnerability Scoring System (CVSS) score of 9.0 or above. AWS CodeBuild is the orchestration layer that resolves dependencies, and JFrog Curation is the management layer that decides, package by package and in real time, what CodeBuild is allowed to pull. The result is an Amazon ECR repository that receives only images built from policy-compliant dependencies.

On failure, a small amount of post-build scripting (shown in detail in the post-build section) queries the Curation audit API (JFrog Curated Packages Audit Events service) and reports the blocked package, its CVE identifiers and CVSS scores, and any recommended fix versions.

Deployment architecture showing AWS CodeBuild resolving dependencies through JFrog Artifactory and Curation before pushing approved images to Amazon ECR

Figure 1: Deployment architecture for the AWS CodeBuild pipeline with JFrog Curation security gate

Prerequisites

Before starting the walkthrough, make sure you have the following accounts, tools, and permissions in place.

  • An AWS account with permission to create CodeBuild projects, ECR repositories, and AWS Secrets Manager secrets.
  • A JFrog Platform instance (SaaS or self-hosted) on a tier that includes JFrog Curation (Enterprise X or Enterprise+ with the Curation add-on).
  • An Artifactory user or access token with deploy and read permissions on your virtual PyPI repository.
  • Tools (installed locally or in your build environment):
    • AWS Command Line Interface (AWS CLI) v2, configured with credentials for your target account.
    • Docker Engine 20.10 or later.
    • Git, to clone the sample repository.
    • JFrog CLI (the walkthrough installs it during pre-build, but local testing requires it beforehand).
  • JFrog Curation setup:
    • In the JFrog Platform, create a remote PyPI repository that proxies https://pypi.org.
    • Create a virtual PyPI repository that includes the remote repository you created earlier.
    • Choose Curation, then Policies, and turn on a Block Critical CVEs policy scoped to the virtual repository.
  • Clone the JFrog curation gate sample repository. All file paths referenced later are relative to the repository root.
  • Accounts and subscriptions:
    • An active AWS account with permissions to create AWS CodeBuild projects, Amazon ECR repositories, and AWS Secrets Manager secrets.
    • A JFrog Platform subscription (SaaS or self-hosted) with access to JFrog Curation. If you need an account, JFrog offers a free trial.

Walking through the implementation

The pipeline is deliberately small. A handful of shell scripts are orchestrated by a CodeBuild buildspec.yml and a Dockerfile that does the dependency install. What makes it a security gate rather than a build is one design choice. Every pip install is forced to resolve through a curated JFrog repository instead of public PyPI and the build is only allowed to publish an image when Curation approves every package.

The following shows how the pieces fit together before we look at the code:

CodeBuild pipeline phases (pre-build, build, post-build) and the shell scripts responsible for each

Figure 2: CodeBuild pipeline phases and script responsibilities

1. Project layout

File Role
buildspec.yml CodeBuild entrypoint – wires the three phases together and sets shared env vars
scripts/setup.sh Pre-build: installs the JFrog CLI, loads secrets, configures pip + Docker auth
Dockerfile Defines the image. Its pip install is what actually gets curated
requirements.txt The pinned dependency manifest that Curation evaluates, package by package
scripts/docker-build.sh Runs the curated Docker build and captures the log
scripts/post-build.sh The gate: conditional push to the registry, or extract-and-report the block reason

2. buildspec.yml – the orchestrator

The buildspec keeps logic out of YAML and in versioned shell scripts to keep the pipeline testable locally and readable in review. Two details matter beyond the phase wiring:

  • shell: bash is set explicitly. CodeBuild defaults to sh, and the post-build gate relies on bash-only constructs like ${PIPESTATUS[0]}.
  • Secrets come from AWS Secrets Manager, which stores the JFrog token encrypted with AWS Key Management Service (AWS KMS), controls access through IAM policies, records every retrieval in AWS CloudTrail, and supports rotation without changing the buildspec. CodeBuild injects the value at runtime and masks it in build logs.
version: 0.2

env:
  shell: bash
  variables:
    JFROG_HOST: "<jfrog-host>"           # e.g. yourcompany.jfrog.io
    JFROG_REPO: "<repo-pypi-virtual>"    # curated virtual pip repo
    AWS_DEFAULT_REGION: "<region>"
    ECR_REPO: "<image-repo>"
  secrets-manager:
    JFROG_USER: "<secret-name>:username"
    JFROG_TOKEN: "<secret-name>:access_token"

phases:
  pre_build:
    commands:
      - bash ./scripts/setup.sh
  build:
    commands:
      - bash ./scripts/docker-build.sh
  post_build:
    commands:
      - bash ./scripts/post-build.sh

3. Pre-build (scripts/setup.sh) – install tooling and redirect pip

This phase does three jobs: install the JFrog CLI, authenticate to both registries, and reconfigures pip so it resolves through Artifactory.

# Install the JFrog CLI
curl -fL https://install-cli.jfrog.io | sh

# Register the JFrog server using the token from Secrets Manager
jf config add jfrog-server \
  --url="https://${JFROG_HOST}" \
  --access-token="${JFROG_TOKEN}" \
  --interactive=false
jf config use jfrog-server

# Point pip at the curated repo instead of public PyPI
jf pip-config --repo-resolve="${JFROG_REPO}" --server-id-resolve=jfrog-server

# Build the authenticated index URL the Dockerfile will use
export PIP_PROXY="https://${JFROG_USER}:${JFROG_TOKEN}@${JFROG_HOST}/artifactory/api/pypi/${JFROG_REPO}/simple"

# Authenticate to the container registry (destination for the trusted image)
ACCOUNT_ID=$(aws sts get-caller-identity --query Account --output text)
export ECR_URI="${ACCOUNT_ID}.dkr.ecr.${AWS_DEFAULT_REGION}.amazonaws.com/${ECR_REPO}"
aws ecr get-login-password --region "${AWS_DEFAULT_REGION}" \
  | docker login --username AWS --password-stdin \
  "${ACCOUNT_ID}.dkr.ecr.${AWS_DEFAULT_REGION}.amazonaws.com"

# Authenticate to the JFrog Docker registry (for base images, if pulled through JFrog)
echo "${JFROG_TOKEN}" | docker login "${JFROG_HOST}" -u "${JFROG_USER}" --password-stdin

Importantly, jf pip-config writes a pip config that swaps the default index URL pypi.org for the JFrog virtual repo. From that point on, any pip install, including the ones inside the Docker build, asks Artifactory for packages. Artifactory serves approved packages from cache or fetches them from its PyPI remote, and returns an HTTP 403 (Access Denied) error for anything a Curation policy blocks. The application code never changes. The redirection is entirely in configuration.

4. The Dockerfile – where curation is actually enforced

The following is the full Dockerfile:

# Base image is pulled from Amazon ECR Public (not Docker Hub) so the build does not
# depend on an external/uncontrolled registry.
FROM public.ecr.aws/docker/library/python:3.11-slim

# Passed in by scripts/docker-build.sh (the curated JFrog index URL)
ARG PIP_INDEX_URL
ARG PIP_TRUSTED_HOST

WORKDIR /app

COPY requirements.txt

# Upgrade pip itself from public PyPI (pip is not the curated surface here)
RUN pip install --no-cache-dir --upgrade pip --index-url https://pypi.org/simple && \
    # …then install ALL app dependencies through the curated JFrog repo.
    # The if/else lets the same Dockerfile build locally (no build args) while
    # always going through JFrog in CI (build args present).
    if [ -n "$PIP_INDEX_URL" ] && [ -n "$PIP_TRUSTED_HOST" ]; then \
      pip install --no-cache-dir --index-url "$PIP_INDEX_URL" --trusted-host "$PIP_TRUSTED_HOST" -r requirements.txt; \
    else \
      pip install --no-cache-dir -r requirements.txt; \
    fi

COPY app.py .

EXPOSE 8080
CMD ["python", "app.py"]

The gate is the pip install -r requirements.txt step and the mechanism is --index-url. During the build phase, docker-build.sh passes the curated JFrog index URL into the build as PIP_INDEX_URL. When that argument is present, pip resolves all dependencies in requirements.txt through the curated JFrog repository instead of public PyPI. JFrog evaluates each requested name==version against your Curation policies before it serves the package:

Approved packages are returned normally and the layer builds. Blocked packages get an HTTP 403 (Access Denied) error from JFrog. pip treats that as a failed download, the RUN instruction exits non-zero, and the entire docker build fails. The image is never produced, let alone pushed. The policy decision is made during the image build process at the precise moment pip resolves each dependency against the curated JFrog repository.

5. The post-build.sh – where data is collected and a fix is proposed

The post-build phase decides what happens with the build’s result. It branches on the CODEBUILD_BUILD_SUCCEEDING flag that CodeBuild sets, which is the mechanism that ties the registry push to Curation’s verdict:

source /tmp/build-env.sh  # ECR_URI, computed back in the pre-build phase
if [ "${CODEBUILD_BUILD_SUCCEEDING:-1}" = "1" ]; then
  # success path --- every dependency passed Curation
else
  # failure path --- Curation blocked a package
fi

Note the source /tmp/build-env.sh at the top. Each phase script runs in its own subshell, so values derived earlier (like ECR_URI) don’t survive across phases. The pre-build step writes them to a file that this script reads back in. If every dependency was approved, the script pushes the trusted image to ECR (both the build’s tag and latest) and triggers the downstream deploy stage. Configure it like so:

docker push "${ECR_URI}:${IMAGE_TAG}"
docker push "${ECR_URI}:latest"

if [ -f ./scripts/deploy.sh ]; then
  bash ./scripts/deploy.sh
fi

This is the only path that puts an image in the registry.

If curation blocked a package and pip only surfaced an HTTP 403 (Access Denied) error, the script reconstructs the reason in three steps. First, identify the package by grepping the failing 403 out of the captured build log. pip names the package in the download URL:

BLOCKED_PKG=$(grep -oP "HTTP error 403 while getting .*/packages/.*/\K[^/]+(?=#)" \
  /tmp/docker-build.log 2>/dev/null | head -1 || true)
PKG_NAME=$(echo "$BLOCKED_PKG" | sed 's/[-=<>!].*//')
PKG_VERSION=$(echo "$BLOCKED_PKG" | grep -oP '[-=]{1,3}\K[0-9][^,; ]*' | head -1 || true)

Second, ask the Curation audit API which policy fired for that package (the policy name, the matched condition, and the category):

jf api "/xray/api/v1/curation/audit/packages?package_name=${PKG_NAME}&package_version=${PKG_VERSION}&num_of_rows=1" \
  | jq -r '.data[]?.policies[]? | " Policy: \(.policy_name)\n Condition: \(.condition_name)\n Category: \(.condition_category)"'

Third, run jf curation-audit for a human-readable explanation and a recommended compliant version:

echo "${PKG_NAME}==${PKG_VERSION}" > /tmp/blocked-pkg.txt
jf curation-audit --requirements-file=/tmp/blocked-pkg.txt --format=json \
  | jq -r '.[0].policies[]? | " \(.explanation)\n Recommendation: \(.recommendation)"'

(That last step is also where any CVE detail comes from, but only when the remote repo has pass-through for Curation audit enabled.)

Finally, the script fails the build:

exit 1

The logic is deliberate: the push is gated on the build succeeding, and the build only succeeds if Curation approved every dependency.

Seeing it in action

STEP 2 - DOCKER BUILD WITH JFROG CURATION
All dependencies resolved through JFrog Artifactory
DOCKER BUILD SUCCESSFUL - ALL DEPENDENCIES APPROVED BY JFROG CURATION
STEP 3 - PUSH TO ECR

On the blocked path, the build declares pyyaml==5.3, which carries two CVSS 9.8 vulnerabilities. Curation returns HTTP 403 (Access Denied) and the build fails before an image is ever produced:

==========================================
BLOCKED BY JFROG CURATION
==========================================
Package: pyyaml==5.3
Policy: Block Critical CVEs
Condition: CVE with CVSS score of 9 or above
Vulnerabilities:
- CVE-2020-1747: 9.8
- CVE-2020-14343: 9.8
Recommendation:
- CVE-2020-1747: 5.3.1
- CVE-2020-14343: 5.4
==========================================
PIPELINE FAILED - SKIPPING ECR PUSH
==========================================

Nothing reached Amazon ECR. There is no vulnerable artifact to remediate, because it was never built.

Curation and scanning are complementary

JFrog Curation is the prevention layer at the gate, and JFrog Xray, a software composition analysis (SCA) tool, is the detection layer for what is already inside. Together they cover both new downloads and previously cached artifacts.

Making it your own

This pattern is workload-agnostic. The example builds a container, but the same gate applies equally to your AWS Lambda function, microservice, or front-end application that resolves dependencies during its build. Curation policy is configurable. For example, layer multiple thresholds to block at CVSS 9.0 and warn at 7.0. You can also add license-compliance and malicious-package policies. Supported package types include PyPI, npm, Maven, and Docker. The enforcement point stays constant: CodeBuild resolves through Artifactory, and Curation decides what is allowed through.

Cleaning up

To avoid ongoing charges, delete the resources you created for this walkthrough: the AWS CodeBuild project, the Amazon ECR repository and any images it holds, the AWS Secrets Manager secret storing the JFrog credentials, and any IAM roles created for the build. If you configured the repositories solely for this exercise, you can also remove the JFrog Artifactory virtual and remote repositories.

Conclusion

By moving dependency enforcement into the build itself, an image is not published to Amazon ECR unless every package it contains has passed your JFrog Curation policies. A blocked package fails the build, so no image is pushed. This walkthrough demonstrated the pattern with PyPI and pip, but as described in the previous section, you can apply the same three steps to any package ecosystem.

Without this gate, the cycle described at the start of this post repeats: a build pulls an unverified package, the image ships, and weeks later your team is rebuilding, re-testing, and redeploying under pressure. With JFrog Curation enforcing policy at the point of download, that cycle stops. Risky packages are blocked before they enter the build, so they are kept out of your registry and away from your customers. Instead of reacting to vulnerabilities after the fact, your pipeline prevents them by default.

To get started, visit the AWS CodeBuild detail page and the AWS CodeBuild documentation. You can also explore the accompanying GitHub repository for the complete source code used in this walkthrough.


About the authors

Arik Yakir

Arik Yakir

Arik is a Senior Partner Solutions Architect at AWS. He works with technology partners to design joint solutions and better-together architectures on AWS.

Eldad Assis

Eldad Assis

Eldad is a Principal DevOps Architect, CTO Office at JFrog. He focuses on CI/CD automation and software supply chain security.

Anantha Kalusivalingam

Anantha Kalusivalingam

Anantha is a Senior Solutions Architect at JFrog. He specializes in DevSecOps and helping JFrog customers secure their software delivery pipelines.

Кирил Вълчев, или когато новинарят стане новината

Post Syndicated from Евгени Соколов original https://www.toest.bg/kiril-vulchev-ili-kogato-novinaryat-stane-novinata/

На редакционната поща пристигна имейл, към който бяха прикачени първоначален вариант на настоящата статия и файл в Excel. Взехме решение да публикуваме статията (след обичайната за нас редакция), защото представлява сериозен анализ на проверими факти. Файлът в Excel съдържаше заглавията на всички над 4000 дописки на сайта на БТА, които са предмет на анализа, с датите на публикуването им и разделени по категории. Основата на графиката по-долу също е от въпросния файл.

Евгени Соколов не е истинското име на автора. Уважаваме основанията му да запази своята анонимност и сме убедени, че анализът на фактите, който той представя, е по-важен от името му.

От редакцията


Кирил Вълчев, или когато новинарят стане новината

Когато преди няколко години започнах работа в Българската телеграфна агенция (БТА), забелязах, че едно име се появява в нейни статии отново и отново. Не на Бойко Борисов, нито на Румен Радев или Делян Пеевски – обичайните заподозрени, които сме свикнали да доминират в медийния поток. Говоря за името на главния директор на БТА Кирил Вълчев.

Този факт ме накара да се запитам: работата на журналиста не е ли да стои в сянка и да представя събитията, вместо да бъде част от тях? Кой друг журналист се среща толкова често в статии не като автор, а като действащо лице? Със сигурност не шефовете на световни новинарски агенции като Reuters, Associated Press и BBC.

Светият синод на БТА

Кой има нужда от един зле реформиран псевдомедиен мастодонт от времето на соца, се пита Дарина Сарелска. За БТА говорим, да не се обърка някой, че то едно ли е…

Като се замислих за скорошен пример за журналист, станал център на внимание, се сетих единствено за Джамал Хашоги. Причината той да се превърне в новина обаче беше бруталното покушение срещу него, вероятно наредено от лидера на Саудитска Арабия. През 1978 г. името на журналиста Георги Марков също се оказва сензация, когато той става жертва на прословутия „български чадър“.

Общото между Марков и Хашоги е, че и двамата ги сполита ненавременна смърт, след като с критиките си стават прекалено неудобни за определен тоталитарен режим. Това подсказва, че когато журналист се е превърнал в център на медийното внимание, значи статуквото е фундаментално сбъркано, защото властимащите възприемат отразяването на фактите като заплаха.

Но пък Кирил Вълчев е център на внимание не заради покушение. Може би тогава нямаме повод за притеснения?

Покрай скорошните избори и кандидатурата на Вълчев за вицепрезидент мнозина се запитаха с какво е заслужил доверието на Илияна Йотова, която го издигна за свой заместник. Поставен беше и въпросът не наблюдаваме ли фрапантен конфликт на интереси, когато един и същи човек е кандидат в изборите и шеф на националната новинарска агенция, която отразява неговата кампания и тази на опонентите му. Обяснението на Вълчев беше следното: 

Не е конфликт на интереси, понеже не е незаконно. И също така аз съм в отпуск по време на кампанията. 

Е, няма проблем, значи – всички знаем, че когато шефът излезе в отпуск, той моментално губи всички телефони на служителите си и влиянието му над тях рязко се занулява.

Бърза справка на официалния сайт на агенцията, управлявана от Вълчев, показва, че той е обиколил „всички 193 държави, които са членове на Организацията на обединените нации“. Този факт накара хора като бившия директор на Висшето училище по мениджмънт във Варна Николай Райчев да обвинят Вълчев в разточителство и безсмислен туризъм на гърба на българския данъкоплатец.

Този грандиозен проект на суетата изисква торби с пари и много свободно време. Хората, които колекционират държави като пощенски марки, го правят само за да могат на всеки коктейл да доминират разговора с репликата: „Ах, навремето, когато бях в Руанда…“

За мен подобни заключения понякога се оказват прибързани. Може пък бъдещият ни вицепрезидент да е един съвременен Алеко, който попива впечатления от всяко ново място и след това превръща натрупаното знание в стойностна литература?

За да тествам тази хипотеза, реших да прегледам (чрез вътрешната система на сайта, защото тя предоставя повече възможности за търсене и обработка на информацията) всички статии, публикувани в bta.bg с името Кирил Вълчев, било то в полето за автор или в самия текст. Статии от първия вид, изглежда, не съществуват, тоест Вълчев не е публикувал нито един текст на сайта на БТА под собственото си име. При статиите от втория вид положението е малко по-различно. 

Към 25.10.2026 г. официалният сайт на БТА съдържа 4359 публикации с името Кирил Вълчев в тях. За сравнение, името на Христос се появява в Новия завет малко над 1000 пъти.

В резултат на четенето и категоризирането на всички 4359 текста научих две неща:

  1. Когато в БТА се обнови статия, не се променя първоначално публикуваната, а се добавя нова статия със същото заглавие и нов час на публикуване. Затова понякога една и съща новина бива отразена с две или повече статии с едно и също заглавие.
  2. Някой в БТА (дали не самият директор?) изпитва болезнена нужда името на Вълчев да бъде вкарвано навсякъде. В някои статии неговото присъствие е абсолютно излишно, но въпреки това авторът е намерил повод да го спомене. Но нека не прибързваме.

Първото, което направих в опит да намаля обема на работа, беше да премахна от пълния списък със статии всички повтарящи се заглавия, които очевидно се отнасят за едно и също събитие. Изтрих и по една публикация от няколко двойки статии с почти идентични заглавия (например „Последната група от 34-тата българска антарктическа експедиция се завръща утре в София“ и „Последната група от 34-тата българска антарктическа експедиция се завръща днес в София“). Това намали общия им брой с 284 – от 4359 на 4075. Малка, но не незначителна разлика.

След това започнах да чета. И да създавам категории.

.bta-pie { position: relative; box-sizing: border-box; max-width: 760px; margin: 2rem auto; padding: 28px 24px 24px; background: #fff; border-radius: 24px; }
.bta-pie *, .bta-pie *::before, .bta-pie *::after { box-sizing: border-box; }
.bta-pie__head { text-align: center; margin: 0 0 4px; }
.bta-pie__hint { font-size: 15px; line-height: 1.4; opacity: .65; margin: 0; }
.bta-pie__stage { position: relative; width: 100%; max-width: 560px; margin: 0 auto; }
.bta-pie__svg { display: block; width: 100%; height: auto; overflow: visible; }
.bta-pie__slice { pointer-events: none; outline: none; transition: transform .25s ease, opacity .22s ease, filter .25s ease; }
.bta-pie__slice path { stroke: #fff; stroke-width: 2.5; stroke-linejoin: round; }
.bta-pie__slice text { font-weight: bold; font-size: 24px; pointer-events: none; text-anchor: middle; dominant-baseline: central; }
.bta-pie.is-active .bta-pie__slice:not(.is-on) { opacity: .6; }
.bta-pie__hit { fill: transparent; stroke: none; cursor: pointer; }
.bta-pie__slice.is-on { filter: drop-shadow(0 8px 12px rgba(58,59,64,.28)); }
.bta-pie__slice:focus-visible path { stroke: #3A3B40; stroke-width: 3; }

.bta-pie__legend { list-style: none; display: flex; flex-wrap: wrap; justify-content: center; gap: 4px 6px; margin: 18px 0 0; padding: 0; }
.bta-pie__legend button { display: inline-flex; align-items: center; gap: 7px; padding: 4px 9px; border: 0; border-radius: 999px; background: transparent; color: inherit; font: inherit; font-size: 16px; line-height: 1.25; cursor: pointer; transition: background .15s ease, opacity .15s ease; }
.bta-pie__legend button:hover, .bta-pie__legend button:focus-visible, .bta-pie__legend button.is-on { background: #F5F5F5; outline: none; }
.bta-pie__legend li { list-style: none; margin: 0; padding: 0; }
.bta-pie__legend li::before, .bta-pie__legend li::after { content: none !important; display: none !important; }
.bta-pie__legend i { flex: none; width: 10px; height: 10px; border-radius: 50%; }
.bta-pie__legend b { font-weight: bold; }
.bta-pie.is-active .bta-pie__legend button:not(.is-on) { opacity: .6; }
.bta-pie__note { font-size: 14px; line-height: 1.4; opacity: .65; text-align: center; margin: 14px 0 0; }

.bta-pie__tip { position: absolute; z-index: 5; left: 0; top: 0; width: 340px; max-width: calc(100% – 16px); padding: 16px 18px 18px; background: #fff; border: 1px solid #E3E3E6; border-radius: 14px; box-shadow: 0 10px 30px rgba(58,59,64,.18); pointer-events: none; opacity: 0; transform: translateY(4px); transition: opacity .16s ease, transform .16s ease; }
.bta-pie__tip.is-open { opacity: 1; transform: none; }
.bta-pie__tip-top { display: flex; align-items: flex-start; justify-content: space-between; gap: 12px; }
.bta-pie__tip-name { display: flex; align-items: flex-start; gap: 8px; min-width: 0; font-size: 18px; font-weight: bold; line-height: 1.25; padding-top: 3px; }
.bta-pie__tip-name i { flex: none; width: 12px; height: 12px; border-radius: 50%; margin-top: 3px; }
.bta-pie__tip-num { flex: none; margin: 0; font-size: 32px; font-weight: bold; line-height: 1.1; text-align: right; }
.bta-pie__tip-pct { margin: 2px 0 0; font-size: 14px; line-height: 1.3; opacity: .65; }
.bta-pie__tip-text { margin: 10px 0 0; font-size: 16px; line-height: 1.45; }
.bta-pie__tip-ex { margin: 10px 0 0; padding-left: 10px; border-left: 3px solid; font-size: 15px; line-height: 1.4; opacity: .85; }

.bta-pie__tip-x { display: none; }
@media (hover: none), (max-width: 520px) {
.bta-pie__tip-x { display: flex; align-items: center; justify-content: center; position: absolute; top: -12px; right: -8px; width: 32px; height: 32px; padding: 0; border: 1px solid #E3E3E6; border-radius: 50%; background: #fff; color: inherit; box-shadow: 0 4px 12px rgba(58,59,64,.2); font: inherit; font-size: 20px; line-height: 1; cursor: pointer; pointer-events: none; }
.bta-pie__tip.is-open .bta-pie__tip-x { pointer-events: auto; }
}
@media (max-width: 520px) {
.bta-pie { padding: 20px 12px 18px; border-radius: 18px; }
.bta-pie__slice text { font-size: 28px; }
.bta-pie__tip { width: 300px; }
.bta-pie__tip-name { font-size: 17px; }
.bta-pie__tip-num { font-size: 28px; }
.bta-pie__legend button { font-size: 15px; }
}
@media (prefers-reduced-motion: reduce) {
.bta-pie__slice, .bta-pie__tip, .bta-pie__legend button { transition: none; }
}
.bta-pie__hint-touch { display: none; }
@media (hover: none) {
.bta-pie__hint-mouse { display: none; }
.bta-pie__hint-touch { display: inline; }
}

Посочете сектор с мишката, за да видите какво означаваНатиснете сектор с пръст, за да видите какво означава

Данни към 25.10.2026 г., след премахване на повтарящите се заглавия (4075 статии)

(function () {
var root = document.getElementById(‘btaPie’);
if (!root || root.dataset.ready) return;
root.dataset.ready = ‘1’;

// Всички текстове (имена, числа, обяснения, примери) се четат от HTML-а в легендата.
var TXT = {
articles: root.getAttribute(‘data-txt-articles’) || ”,
all: root.getAttribute(‘data-txt-all’) || ”,
close: root.getAttribute(‘data-txt-close’) || ”
};
var DATA = [].map.call(root.querySelectorAll(‘.bta-pie__legend > li’), function (li) {
var info = li.querySelector(‘.bta-pie__info-text’), ex = li.querySelector(‘.bta-pie__info-ex’), dot = li.querySelector(‘i’);
return {
name: li.querySelector(‘.bta-pie__name’).textContent.trim(),
n: parseInt(li.querySelector(‘b’).textContent, 10),
color: dot.style.backgroundColor,
label: li.getAttribute(‘data-label’) || ‘#fff’,
text: info ? info.innerHTML : ”,
ex: ex ? ex.innerHTML : ”,
btn: li.querySelector(‘button’)
};
});

var NS = ‘http://www.w3.org/2000/svg’;
var CX = 300, CY = 300, R = 262, TAU = Math.PI * 2;
var svg = root.querySelector(‘.bta-pie__svg’);
var stage = root.querySelector(‘.bta-pie__stage’);
var tip = root.querySelector(‘.bta-pie__tip’);

var total = DATA.reduce(function (s, d) { return s + d.n; }, 0);
var acc = 0;
DATA.forEach(function (d, i) {
d.i = i;
d.pct = d.n / total * 100;
d.a0 = acc / total * TAU;
acc += d.n;
d.a1 = acc / total * TAU;
d.mid = (d.a0 + d.a1) / 2;
d.done = false;
});

function fmtPct(p) { return p.toFixed(1).replace(‘.’, ‘,’) + ‘%’; }
function pt(a, r) { return [CX + r * Math.sin(a), CY – r * Math.cos(a)]; }
function arc(a0, a1) {
if (a1 – a0 Math.PI ? 1 : 0) + ‘ 1 ‘ + p1[0].toFixed(2) + ‘ ‘ + p1[1].toFixed(2) + ‘Z’;
}
function el(name, attrs) {
var e = document.createElementNS(NS, name);
for (var k in attrs) e.setAttribute(k, attrs[k]);
return e;
}

// Build slices
DATA.forEach(function (d) {
var g = el(‘g’, { ‘class’: ‘bta-pie__slice’, tabindex: ‘0’, role: ‘img’,
‘aria-label’: d.name + ‘: ‘ + d.n + ‘ ‘ + TXT.articles + ‘, ‘ + fmtPct(d.pct) });
g.style.opacity = ‘0’;
var path = el(‘path’, { d: ”, fill: d.color });
if (d.pct = 5) {
var lp = pt(d.mid, R * 0.68);
var t = el(‘text’, { x: lp[0].toFixed(1), y: lp[1].toFixed(1), fill: d.label });
t.textContent = d.n;
t.style.opacity = ‘0’;
g.appendChild(t);
d.text_el = t;
}
svg.appendChild(g);
d.g = g; d.path = path;
});

// Static, invisible hit areas on top: they never move, so the pointer cannot flicker between two neighbouring slices
var hitLayer = el(‘g’, {});
svg.appendChild(hitLayer);
DATA.forEach(function (d) {
d.hit = el(‘path’, { d: ”, ‘class’: ‘bta-pie__hit’ });
hitLayer.appendChild(d.hit);
});

// Tooltip
var current = null;
function fill(d) {
tip.innerHTML =
‘‘ +
‘

‘ + d.name + ‘

‘ +
‘

‘ + d.n + ‘

‘ +
‘

‘ + fmtPct(d.pct) + ‘ ‘ + TXT.all + ‘

‘ +
‘

‘ + d.text + ‘

‘ +
(d.ex ? ‘

‘ + d.ex + ‘

‘ : ”);
}
function place(x, y) {
var sw = stage.clientWidth, sh = stage.clientHeight;
var w = tip.offsetWidth, h = tip.offsetHeight;
var left = x + 16, top = y + 16;
if (left + w > sw + 8) left = x – w – 16;
if (left sh) top = y – h – 16;
if (top < 0) top = Math.max(0, Math.min(sh – h, y – h / 2));
tip.style.left = left + 'px';
tip.style.top = top + 'px';
}
function centroid(d) {
var r = svg.getBoundingClientRect(), s = stage.getBoundingClientRect();
var p = pt(d.mid, R * 0.7), k = r.width / 600;
return [r.left – s.left + p[0] * k, r.top – s.top + p[1] * k];
}
function show(d, xy) {
if (current && current !== d) { current.g.classList.remove('is-on'); current.g.style.transform = ''; current.btn.classList.remove('is-on'); }
current = d;
root.classList.add('is-active');
d.g.classList.add('is-on');
d.btn.classList.add('is-on');
var o = pt(d.mid, 22); // push-out along the bisector (SVG units)
d.g.style.transform = 'translate(' + (o[0] – CX).toFixed(1) + 'px,' + (o[1] – CY).toFixed(1) + 'px)';
fill(d);
tip.setAttribute('aria-hidden', 'false');
tip.classList.add('is-open');
place(xy[0], xy[1]);
}
function hide() {
if (!current) return;
current.g.classList.remove('is-on');
current.g.style.transform = '';
current.btn.classList.remove('is-on');
current = null;
root.classList.remove('is-active');
tip.classList.remove('is-open');
tip.setAttribute('aria-hidden', 'true');
}
function local(e) {
var s = stage.getBoundingClientRect();
return [e.clientX – s.left, e.clientY – s.top];
}

DATA.forEach(function (d) {
d.hit.addEventListener('pointerenter', function (e) { if (e.pointerType === 'mouse') show(d, local(e)); });
d.hit.addEventListener('pointermove', function (e) { if (e.pointerType === 'mouse' && current === d) place.apply(null, local(e)); });
d.hit.addEventListener('pointerleave', function (e) { if (e.pointerType === 'mouse' && current === d) hide(); });
d.hit.addEventListener('click', function (e) {
e.stopPropagation();
if (current === d && e.pointerType !== 'mouse') hide(); else show(d, local(e));
});
d.g.addEventListener('focus', function () { show(d, centroid(d)); });
d.g.addEventListener('blur', function () { if (current === d) hide(); });
d.g.addEventListener('keydown', function (e) { if (e.key === 'Escape') hide(); });

d.btn.addEventListener('pointerenter', function (e) { if (e.pointerType === 'mouse' && d.done) show(d, centroid(d)); });
d.btn.addEventListener('pointerleave', function (e) { if (e.pointerType === 'mouse' && current === d) hide(); });
d.btn.addEventListener('click', function (e) {
e.stopPropagation();
if (!d.done) return;
if (current === d && e.pointerType !== 'mouse') hide(); else show(d, centroid(d));
});
d.btn.addEventListener('focus', function () { if (d.done) show(d, centroid(d)); });
d.btn.addEventListener('blur', function () { if (current === d) hide(); });
});
// any click/tap outside a slice or legend item closes the box (slices and legend buttons stop propagation)
document.addEventListener('click', hide);
document.addEventListener('keydown', function (e) { if (e.key === 'Escape') hide(); });

// Animation: slices are drawn one after another, each sweeping clockwise from its own start angle
var STEP = 170, DUR = 700;
function ease(t) { return 1 – Math.pow(1 – t, 3); }
function finish(d) {
d.path.setAttribute('d', arc(d.a0, d.a1));
d.g.style.opacity = '1';
d.hit.setAttribute('d', arc(d.a0, d.a1));
if (d.text_el) d.text_el.style.opacity = '1';
d.done = true;
}
function run() {
var reduce = window.matchMedia && window.matchMedia('(prefers-reduced-motion: reduce)').matches;
if (reduce) { DATA.forEach(finish); return; }
DATA.forEach(function (d) { if (d.text_el) d.text_el.style.transition = 'opacity .3s ease'; });
var t0 = null;
function frame(ts) {
if (t0 === null) t0 = ts;
var el_ = ts – t0, alive = false;
DATA.forEach(function (d) {
if (d.done) return;
var p = (el_ – d.i * STEP) / DUR;
if (p = 1) { finish(d); return; }
alive = true;
d.g.style.opacity = ‘1’;
d.path.setAttribute(‘d’, arc(d.a0, d.a0 + (d.a1 – d.a0) * ease(p)));
});
if (alive) requestAnimationFrame(frame);
}
requestAnimationFrame(frame);
}

var started = false;
function start() { if (started) return; started = true; run(); }
if (‘IntersectionObserver’ in window) {
var io = new IntersectionObserver(function (entries) {
if (entries.some(function (x) { return x.isIntersecting; })) { io.disconnect(); start(); }
}, { threshold: 0.35 });
io.observe(stage);
} else { start(); }
})();

Много бързо отделих първата категория – „Неважно“. В нея включих статиите от поредицата „Събитията днес“, които обобщават събития, станали преди година или повече или пък планирани за близкото бъдеще. В „Неважно“ влязоха 85 текста, или малко над 2% от всички.

Една от първите сериозни категории нарекох „За БТА“. 

Както подсказва името ѝ, в нея попадат новини, посветени на самата агенция и/или на нейния директор. За някои от тях е добре, че са обществено достояние, например „Парламентът прие на второ четене бюджетите на БНТ, БНР и БТА за 2025 г.“. Други сякаш не интересуват никого освен работещите в Агенцията („БТА успешно подмени асансьора в западната част на сградата си и подобри достъпа до агенцията“). Но при положение че източникът е БТА, да речем, че и безсмислените новини са приемливи, щом са публикувани единствено на сайта на Агенцията.

В категорията „За БТА“ попаднаха 1001 публикации, или близо 25% от общия брой. Огромна част от тях са посветени на пресклубовете на агенцията („БТА официално откри Национален пресклуб в Скопие“), на нейното списание („Списание ЛИК ще има предаване в Българското национално радио“) и на безкрайни поздравителни адреси по повод годишнината на институцията. Поздрави за преизбирането и за рождения ден на нейния директор („Поздравителен адрес от Мариан Бачев, министър на културата“) също влизат в тази категория. Тук човек би могъл да се запита израз на какво е да използваш поверената ти държавна институция, за да разпространяваш честитките за рождения си ден, но нека не се превръщаме в хейтъри.

Следващите две категории – „Организирано от/провеждано в БТА“ (819 статии, 20,1%) и „Договори“ (282 статии, 6,9%), може да се разглеждат и като подкатегории на „За БТА“. От названието на първата се разбира за какво са публикациите. Във втората вкличих всички статии, в които БТА се хвали, че е сключила договор за обмен на новини с друга институция или за отразяване на дадено лице, институция или събитие. Присъствието на Вълчев в тези категории може да се очаква, предвид че той е директорът на БТА.

Категория „Антарктида“ е интересен феномен. 

Статиите в нея (210 на брой, 5,2%) отразяват мисиите на кораба „Св. св. Кирил и Методий“, с който нашите антарктици ежегодно пресичат Атлантическия океан, за да стигнат до българската база на остров Ливингстън. На пръв поглед Вълчев не би трябвало да има много общо с тези новини, но списание ЛИК от юни 2023 г. разкрива друга картина. Още като водещ в Дарик радио през 2018 г. Вълчев е използвал трибуната си, за да убеждава политици, че България има нужда от собствен презокеански кораб за антарктическата си мисия.

Инвестирането в наука само по себе си е достойно за уважение. Нека България има собствен кораб. Да видим обаче и един цитат от Вълчев в споменатия брой на списание ЛИК: 

Господ беше на наша страна, защото заради Ковид-19 кризата се оказа, че на пазара има кораби, които се продаваха евтино.

Нашият бъдещ вицепрезидент де факто казва: „Слава богу, че светът беше поразен от смъртоносна пандемия, която изби милиони хора, че да може България да спести някой лев.“ Даже да разтълкуваме Вълчевите думи като екстремен национализъм (един вид, „Не ми пука колко хора ще умрат по света, стига България да намаже нещо“), България също беше поразена от вируса. От началото на пандемията до края на 2024 г. от COVID-19 в България са починали 38 855 души според данни от Националния център по заразни и паразитни болести.

Не ми се вярва обаче шефът на БТА да не е запознат с тази статистика. Все пак още на 1 октомври 2021 г. сайтът на поверената му агенция публикува статията „Министър Стойчо Кацаров награди генералния директор на БТА Кирил Вълчев с Почетен знак първа степен, за принос в кампанията за ваксиниране срещу COVID-19“. Единственото тълкуване, което остава, е, че Вълчев е склонен да търси келепир и от най-дълбоката човешка трагедия. Ако все още не сте убедени, препоръчвам ви статията „Големият въпрос, на който трябва да намерим отговор, е как България и региони като Пловдив могат да се възползват от проблема COVID-19, каза генералният директор на БТА“ от 15 декември 2021 г.

Преди да премина към трите ми любими категории, ще спомена останалите две набързо.

Категорията „Президент“ съдържа 129 новини, 3,2% от общия брой. Предвид това, че на 3 септември Йотова обяви Вълчев за свой кандидат-вицепрезидент, сами се досещате, че всички статии тук са публикувани от тази дата нататък. Няма да се спирам върху категорията, защото предизборната кампания зае достатъчен обем от медийното пространство и без моя принос.

„Друг Кирил“ е най-дребната категория – с едва пет материала, или 0,1% от всички статии. Тази мижава петица дава отговор на въпроса „Ти сигурен ли си, че във всички тези 4000+ статии се говори за един и същи Кирил Вълчев?“. Разумен въпрос – все пак не едно магаре се казва Марко. Петте статии са:

  1. „В страната са констатирани близо 212 хиляди декара засегнати иглолистни култури, създадени извън естествения им ареал“. Кирил Вълчев от тази новина е главен експерт по биоразнообразие в природен парк „Шуменско плато“. Очевидно не е шефът на БТА. За същия човек става дума и в четвъртата и петата статия.
  2. „Няма образователна система, която да не възпитава добродетели, каза министър Красимир Вълчев“. Присъствието на Кирил Вълчев тук е грешка. Цялата статия се базира на думи на тогавашния министър на образованието Красимир Вълчев. Кирил Вълчев не е споменат в текста, но журналистът на БТА, качил публикацията онлайн, е оставил „Кирил Вълчев“ в ключовите думи.
  3. „Община Угърчин ще предостави народни носии на желаещите да участват в ритуала по хвърляне на кръста в река Каменица на Йордановден“. В статия се споменава, че кръста в Угърчин на Йордановден е хванал някой си Кирил Вълчев. Тук си признавам – не мога да докажа, че не става въпрос за шефа на БТА. Имам обаче очи на главата, а те ми показват, че физиката на бъдещия ни вицепрезидент не е на плувец шампион.
  4. „След включването на пещера Бисерна сред 100-те Национални туристически обекта на България се запазва сезонността на посещения там“ (вж. т. 1).
  5. „Дирекцията на Природен парк „Шуменско плато“ започва изпълнение на проект за намаляване на загубата на биологично разнообразие“ (вж. т. 1).

И така стигаме до трите най-показателни категории, понеже те се въртят най-близо около личността на самия Вълчев.

„Name-drop“ 

е най-малката от трите, с едва 55 материала (1,4%), но пък е доста забавна. Глаголът name-drop на английски означава да споменеш уж случайно, че си авер с някоя важна клечка, за да се изфукаш. В тази категория са статиите, в които Вълчев се изказва по адрес на исторически личности („България има нужда от журналистика като Ботевата и от знание за общите ни ценности, каза генералният директор на БТА Кирил Вълчев“ от 31.05.2026 г.) и за български градове („Благоевград е пример в Европа за защита на свободата, каза генералният директор на БТА Кирил Вълчев“ от 12.02.2025 г.). И като споменахме Ботев, се вдъхнових да перифразирам този куплет:

Патриот е – пара дава
и пътува на изгода,
че не свойта пара харчи,
а парата на народа!

Благодаря ви, че сте моя муза, г-н Вълчев!

Категорията „Изказвания“

е подобна на „Name-drop“ и съдържа 211 статии (5,2%). Тук намираме всички публикации, посветени на изказвания на Вълчев. В „Изказвания“ има брилянтни умотворения, като:

За десерт остана най-голямата категория – „Защо“.

Тя съдържа 1278 статии, или 31,4%. Всяка от тях ме накара да се питам защо. Защо това събитие е било нужно? Защо някой си е направил труда да го отразява? Защо Кирил Вълчев е присъствал на събитието? И защо БТА е преценила, че неговото присъствие трябва да бъде отразено? Преди да дам конкретни примери, нека още веднъж си припомним, че БТА е държавна информационна агенция, която служи на българския народ – тя не е лична PR агенция, чиято цел е да обслужва интересите на конкретна персона. Или поне така се води на хартия.

Ето само няколко примера:

Да обобщим. 

От първия си ден на поста директор на БТА (27.01.2021 г.) до обявяването, че ще се включи в президентската кампания (03.09.2026 г.), Вълчев е бил начело на Агенцията в продължение на 2045 дни. През този период тя го е включила в 4209 публикации, или средно в по 2,2 публикации на ден. От януари 2021 г. досега българският читател всеки ден е ставал и си е лягал с името Кирил Вълчев.

Когато започнах да работя по този текст, все още имах надежда, че зад думите на Вълчев ще прозират моралът и родолюбието на Алеко. Алеко за жалост не намерих, но пък героят му Бай Ганьо се виждаше навсякъде: 

Ии, ами аз що свят съм изръшнал! Ц… ц… ц…

В заключение ще споделя заглавието на БТА от 09.07.2023 г. – „Нос и залив на Антарктида носят имената на изследователката Иглика Трифонова и на генералния директор на БТА Кирил Вълчев“. За мен е уместно част от някое море да носи името на Вълчев. Защото когато облèче този човек в политическа власт, България удари ново дъно.

Securing REST APIs with JWT authorizers in Amazon API Gateway

Post Syndicated from Giedrius Praspaliauskas original https://aws.amazon.com/blogs/compute/securing-rest-apis-with-jwt-authorizers-in-amazon-api-gateway/

Many teams already run an OpenID Connect (OIDC) identity provider and want their Amazon API Gateway REST APIs to accept its security tokens. Until now, the built-in authorizer for API Gateway REST APIs accepted only Amazon Cognito tokens. For other identity providers, you wrote an AWS Lambda authorizer that downloaded the provider’s signing keys, verified each token, and returned an AWS Identity and Access Management (IAM) policy.

Today, AWS announced JSON Web Token (JWT) authorizers for API Gateway REST APIs, which validate tokens in API Gateway itself. You declare the issuers you trust, the audiences you accept from each, the signing algorithms you permit, and any additional claims you require the token to carry. JWT authorizers work on Regional, edge-optimized, and private REST APIs.

In this post, you learn how JWT authorizers work. You then build a REST API that accepts machine-to-machine tokens from your own identity provider and enforces different scopes on read and write operations. Finally, you add an Amazon Cognito user pool as a second trusted issuer on the same authorizer.

Solution overview

Lambda authorizers remain the right choice when authorization needs custom logic, token introspection, or credentials that are not JWTs. For token validation alone, a JWT authorizer validates the token in API Gateway itself, with no function to maintain and no invocation in the request path, as the following diagram shows.

A client calls API Gateway, which validates the token and passes only authorized requests to the backend integration.

Figure 1: New architecture. API Gateway validates the token inline and forwards only authorized requests to the integration

Each request goes through the following steps:

  1. The client sends a security token as a bearer token in the header that the identity source names, typically Authorization.
  2. API Gateway matches the token’s iss claim to a configured issuer and rejects a token from an unknown issuer before any network call.
  3. API Gateway checks that the token’s signing algorithm is one you configured, then validates the signature against the issuer’s public keys, which it locates through OIDC discovery and caches.
  4. API Gateway checks the audience and the expiry and not-before times.
  5. If the method requires authorization scopes, you must use an access token that carries at least one of them in its scope or scp claim.
  6. API Gateway checks any additional claim rules you configured for that issuer.
  7. API Gateway passes the validated claims to the integration, and the request proceeds.

API Gateway stops processing the request at the first failed check. API Gateway returns 401 Unauthorized for a missing, malformed, expired, or untrusted token. It returns 403 Forbidden for a valid token that lacks a required scope or fails a claim rule. If API Gateway cannot reach an issuer’s key endpoint and has no cached keys, it returns a 5xx response rather than letting the request through.

Walkthrough

In this walkthrough, you create an orders REST API in which GET /orders requires the orders:read scope and POST /orders requires orders:write.

Prerequisites

To follow this walkthrough, you need:

  • An AWS account and an IAM principal with permissions to manage API Gateway resources, and Amazon Cognito resources for step 7. Follow the principle of least privilege.
  • An OIDC-compatible identity provider that supports the OAuth 2.0 client credentials flow and publishes a discovery document at /.well-known/openid-configuration.
  • The latest version of the AWS Command Line Interface (AWS CLI).
  • curl and jq.

Step 1: Prepare your identity provider

In your identity provider, create an API (or resource server) for the orders service with two scopes, orders:read and orders:write. Then create two machine-to-machine applications: a reporting application with only orders:read and a fulfillment application with both scopes.

Then collect the following values, shown here for three common providers.

Value Okta Auth0 Microsoft Entra ID
ISSUER https://{yourOktaDomain}/oauth2/default for the default custom authorization server https://{yourTenant}.auth0.com/, including the trailing slash. Note that URL might include country code. https://login.microsoftonline.com/{tenantId}/v2.0
AUDIENCE The authorization server’s Audience, for example api://default The API Identifier The application ID URI or client ID of the API app registration
TOKEN_URL {ISSUER}/v1/token https://{yourTenant}.auth0.com/oauth/token Note that URL might include country code. https://login.microsoftonline.com/{tenantId}/oauth2/v2.0/token
Scopes Custom scopes on the authorization server Permissions on the API, granted to each application See Considerations. Client credentials tokens carry app roles, not scopes.

For the example walkthrough, set the values as environment variables (production clients can load client secrets from AWS Secrets Manager or an equivalent store).

REGION=<your AWS Region, for example us-east-1>
ISSUER=<issuer URL, exactly as it appears in the token's iss claim>
AUDIENCE=<audience value>
TOKEN_URL=<token endpoint>
READER_ID=<reporting application client ID>
READER_SECRET=<reporting application client secret>
WRITER_ID=<fulfillment application client ID>
WRITER_SECRET=<fulfillment application client secret>

The issuer must match the token’s iss claim exactly, including any trailing slash, so copy it from a decoded token.

Step 2: Create the JWT authorizer

Create a REST API, then describe the authorizer in a file that lists the trusted issuers, the audiences accepted from each, and the signing algorithms you configure on your issuer:

API_ID=$(aws apigateway create-rest-api \
  --name orders \
  --region "$REGION" \
  --query 'id' --output text)

cat > jwt-config.json <<EOF
{
  "issuers": [
    {
      "issuer": "${ISSUER}",
      "audiences": ["${AUDIENCE}"]
    }
  ],
  "defaultAlgorithms": ["RS256"]
}
EOF

AUTHORIZER_ID=$(aws apigateway create-authorizer \
  --rest-api-id "$API_ID" \
  --name orders-jwt \
  --type JWT \
  --identity-source method.request.header.Authorization \
  --jwt-configuration file://jwt-config.json \
  --region "$REGION" \
  --query 'id' --output text)

When you create or update the authorizer, API Gateway reads each issuer’s discovery document and checks that its issuer value matches. If your provider signs with an elliptic curve key, add ES256 or another supported algorithm to defaultAlgorithms. Keep jwt-config.json for step 7.

Step 3: Attach the authorizer to methods with different scopes

Create the /orders resource and two methods that share the authorizer but require different scopes. A mock integration returns the issuer and subject from the validated token:

ROOT_ID=$(aws apigateway get-resources --rest-api-id "$API_ID" \
  --region "$REGION" --query 'items[?path==`/`].id' --output text)

RESOURCE_ID=$(aws apigateway create-resource --rest-api-id "$API_ID" \
  --parent-id "$ROOT_ID" --path-part orders \
  --region "$REGION" --query 'id' --output text)

add_method () {
  aws apigateway put-method --rest-api-id "$API_ID" --resource-id "$RESOURCE_ID" \
    --http-method "$1" \
    --authorization-type JWT \
    --authorizer-id "$AUTHORIZER_ID" \
    --authorization-scopes "$2" \
    --region "$REGION"

  aws apigateway put-integration --rest-api-id "$API_ID" --resource-id "$RESOURCE_ID" \
    --http-method "$1" --type MOCK \
    --request-templates '{"application/json":"{\"statusCode\": 200}"}' \
    --region "$REGION"

  aws apigateway put-method-response --rest-api-id "$API_ID" --resource-id "$RESOURCE_ID" \
    --http-method "$1" --status-code 200 --region "$REGION"

  aws apigateway put-integration-response --rest-api-id "$API_ID" --resource-id "$RESOURCE_ID" \
    --http-method "$1" --status-code 200 \
    --response-templates '{"application/json":"{\"issuer\":\"$context.authorizer.claims.iss\",\"subject\":\"$context.authorizer.claims.sub\"}"}' \
    --region "$REGION"
}

add_method GET  orders:read
add_method POST orders:write

Step 4: Deploy the API

Deploy the API to a stage named test and record the invoke URL:

aws apigateway create-deployment --rest-api-id "$API_ID" \
  --stage-name test --region "$REGION"

API_URL="https://${API_ID}.execute-api.${REGION}.amazonaws.com/test/orders"

Step 5: Test the failure cases first

Call the API without a token:

curl -s -o /dev/null -w "%{http_code}\n" "$API_URL"

The request returns 401, because API Gateway rejects it before the integration runs.

Next, use a token for the reporting application, which has only orders:read, to create an order. The get_token helper sends an OAuth 2.0 client credentials request:

get_token () {
   local url="$1" client_id="$2" client_secret="$3" scope="$4" audience="$5"
   local args=(
      -sS -X POST "$url"
      -u "$client_id:$client_secret"
      -H "Content-Type: application/x-www-form-urlencoded"
      --data-urlencode "grant_type=client_credentials"
    )
   [[ -n "$scope"    ]] && args+=(--data-urlencode "scope=$scope")
   [[ -n "$audience" ]] && args+=(--data-urlencode "audience=$audience")

   curl "${args[@]}" | jq -r .access_token
}

# Auth0 requires the audience parameter. Okta ignores it.
READER_TOKEN=$(get_token "$TOKEN_URL" "$READER_ID" "$READER_SECRET" "orders:read" "$AUDIENCE")

curl -s -o /dev/null -w "%{http_code}\n" -X POST \
  -H "Authorization: Bearer $READER_TOKEN" "$API_URL"

The request returns 403. The token is valid, but POST /orders requires orders:write.

Step 6: Test the successful cases

Read orders with the reporting token, then request a token for the fulfillment application and create an order:

curl -s -H "Authorization: Bearer $READER_TOKEN" "$API_URL"

WRITER_TOKEN=$(get_token "$TOKEN_URL" "$WRITER_ID" "$WRITER_SECRET" "orders:write" "$AUDIENCE")
curl -s -X POST -H "Authorization: Bearer $WRITER_TOKEN" "$API_URL"

Both calls return 200 with the issuer and subject that the integration received:

{"issuer":"https://example.us.auth0.com/","subject":"0oa1b2c3d4EXAMPLE"}

Step 7: Add Amazon Cognito as a second issuer

An authorizer can trust up to 10 issuers, for example while you migrate between identity providers. In this step, you add a Cognito user pool to the same authorizer.

Create a user pool, a domain for its token endpoint, a resource server with the two scopes, and one machine-to-machine client:

DOMAIN_PREFIX=<a globally unique prefix, for example orders-demo-1234>

POOL_ID=$(aws cognito-idp create-user-pool --pool-name orders-demo \
  --region "$REGION" --query 'UserPool.Id' --output text)

aws cognito-idp create-user-pool-domain --user-pool-id "$POOL_ID" \
  --domain "$DOMAIN_PREFIX" --region "$REGION"

aws cognito-idp create-resource-server --user-pool-id "$POOL_ID" \
  --identifier orders --name orders \
  --scopes ScopeName=orders:read,ScopeDescription="Read orders" \
           ScopeName=orders:write,ScopeDescription="Create orders" \
  --region "$REGION"

read -r COGNITO_ID COGNITO_SECRET <<< "$(aws cognito-idp create-user-pool-client \
  --user-pool-id "$POOL_ID" --client-name legacy-reporting --generate-secret \
  --allowed-o-auth-flows client_credentials --allowed-o-auth-flows-user-pool-client \
  --allowed-o-auth-scopes orders/orders:read \
  --region "$REGION" \
  --query 'UserPoolClient.[ClientId,ClientSecret]' --output text)"

COGNITO_ISSUER="https://cognito-idp.${REGION}.amazonaws.com/${POOL_ID}"

Add the user pool to jwt-config.json and send the full file back, because an update replaces the whole configuration. Cognito access tokens carry the app client ID in client_id rather than aud, so use the client ID as the audience:

jq --arg iss "$COGNITO_ISSUER" --arg aud "$COGNITO_ID" \
  '.issuers += [{issuer: $iss, audiences: [$aud]}]' \
  jwt-config.json > jwt-config.tmp && mv jwt-config.tmp jwt-config.json

aws apigateway update-authorizer \
  --rest-api-id "$API_ID" \
  --authorizer-id "$AUTHORIZER_ID" \
  --patch-operations "$(jq -n --rawfile v jwt-config.json \
      '[{op:"replace",path:"/jwtConfiguration",value:$v}]')" \
  --region "$REGION"

The following screenshot shows the updated authorizer in the API Gateway console, with the key set that API Gateway resolved for each issuer.

API Gateway console authorizer page listing two trusted issuers with the key set resolved for each.

Figure 2: JWT authorizer with two trusted issuers

If you no longer have the jwt-config.json file, rebuild it from get-authorizer and remove the jwksUri fields, because API Gateway rejects an update that includes them:

aws apigateway get-authorizer --rest-api-id "$API_ID" --authorizer-id "$AUTHORIZER_ID" \
  --query jwtConfiguration --output json --region "$REGION" \
  | jq 'del(.issuers[].jwksUri)' > jwt-config.json

Cognito names scopes {resource server}/{scope}, so its token carries orders/orders:read rather than orders:read. Add that form to GET /orders, then redeploy, because authorizer and method changes take effect only in a new deployment:

aws apigateway update-method --rest-api-id "$API_ID" --resource-id "$RESOURCE_ID" \
  --http-method GET \
  --patch-operations op=add,path=/authorizationScopes,value=orders/orders:read \
  --region "$REGION"

aws apigateway create-deployment --rest-api-id "$API_ID" \
  --stage-name test --region "$REGION"

COGNITO_TOKEN=$(get_token "https://${DOMAIN_PREFIX}.auth.${REGION}.amazoncognito.com/oauth2/token" \
  "$COGNITO_ID" "$COGNITO_SECRET" "orders/orders:read")

curl -s -H "Authorization: Bearer $COGNITO_TOKEN" "$API_URL"

The request returns 200 with the Cognito issuer, and tokens from your original provider keep working. For Cognito issuers, a method with scopes accepts only access tokens and a method without scopes accepts only ID tokens. Give each method that client credentials callers use at least one scope.

To finish a migration, remove the retired issuer from jwt-config.json, send the same replace operation (using aws apigateway update-authorizer --patch-operations command), and redeploy.

Optional: Require an additional claim

To accept only tokens whose department claim equals eng, add a claim rule to the issuer entry. Matching is exact and case-sensitive, and API Gateway returns a 403 for other tokens:

{
  "issuer": "https://example.auth0.com/",
  "audiences": ["api://default"],
  "additionalClaims": [
    { "claimName": "department", "format": "SINGLE_STRING", "required": true, "expectedValues": ["eng"] }
  ]
}

Defining JWT authorizers as infrastructure as code

In AWS CloudFormation, the AWS::ApiGateway::Authorizer resource has a JwtConfiguration property that mirrors the API, and methods set AuthorizationType: JWT and AuthorizationScopes:

Parameters:
  IdpIssuer:
    Type: String
    Description: Issuer URL exactly as it appears in the token's iss claim
  IdpAudience:
    Type: String

Resources:
  OrdersAuthorizer:
    Type: AWS::ApiGateway::Authorizer
    Properties:
      RestApiId: !Ref OrdersApi
      Name: orders-jwt
      Type: JWT
      IdentitySource: method.request.header.Authorization
      JwtConfiguration:
        DefaultAlgorithms: [RS256]
        Issuers:
          - Issuer: !Ref IdpIssuer
            Audiences: [!Ref IdpAudience]

  GetOrders:
    Type: AWS::ApiGateway::Method
    Properties:
      RestApiId: !Ref OrdersApi
      ResourceId: !Ref OrdersResource
      HttpMethod: GET
      AuthorizationType: JWT
      AuthorizerId: !GetAtt OrdersAuthorizer.AuthorizerId
      AuthorizationScopes: [orders:read]
      Integration:
        Type: MOCK
        RequestTemplates:
          application/json: '{"statusCode": 200}'

In OpenAPI 3.0 and Swagger 2.0 definitions, use the x-amazon-apigateway-authorizer extension with type: jwt:

components:
  securitySchemes:
    orders-jwt:
      type: apiKey
      name: Authorization
      in: header
      x-amazon-apigateway-authtype: jwt
      x-amazon-apigateway-authorizer:
        type: jwt
        jwtConfiguration:
          issuers:
            - issuer: https://example.auth0.com/
              audiences: [ "api://default" ]
            - issuer: https://login.microsoftonline.com/{tenantId}/v2.0
              audiences: [ "00000000-0000-0000-0000-000000000000" ]
          defaultAlgorithms: [ "RS256", "ES256" ]
paths:
  /orders:
    get:
      security:
        - orders-jwt: [ "orders:read" ]

You can also convert an existing Lambda or Cognito authorizer in place with one update-authorizer command that changes /type, replaces /jwtConfiguration, and clears the old type’s fields. Clear Lambda fields with a replace that has no value, and remove each Cognito provider ARN with remove. Then switch each method that uses the authorizer to authorizationType: JWT, add its scopes, and redeploy.

Using claims in your integration

API Gateway passes every JWT claim to your backend as JSON as it appeared in the token. Strings stay quoted and escaped, numbers stay numbers, and arrays and objects stay intact, so your backend never has to guess what was sent. Mapping templates read validated claims as $context.authorizer.claims.name, as with Cognito authorizers, and Lambda proxy integrations receive them in event.requestContext.authorizer.claims.

HTTP proxy integrations don’t forward claims automatically, so map the ones you need to headers, for example integration.request.header.x-caller to context.authorizer.claims.sub.

Observability and troubleshooting

When API Gateway rejects a request, the response body is Unauthorized or The incoming token has expired for a 401, and Access Denied for a 403. A WWW-Authenticate header that follows RFC 6750 carries the details, such as the failed check or, for a missing scope, the scopes the method accepts.

With execution logging on, API Gateway logs a claims summary for each request, without the raw token. Data trace logging masks the Authorization header but not custom headers, so if your identity source is a header such as X-Token, keep data trace logging off for that stage.

To test an authorizer before you deploy, choose Test authorizer on the authorizer page or run test-invoke-authorizer. The test skips method scopes and accepts Cognito identity tokens, so call the deployed method to test scopes.

Considerations

Before you add a JWT authorizer, consider the following:

  • An authorizer trusts 1–10 issuers. Each issuer accepts 1–100 audiences and up to 10 additional claim rules, each with at most one expected value.
  • Supported signing algorithms are RS256, RS384, RS512, ES256, ES384, and ES512, and API Gateway rejects HMAC and alg: none tokens. The token header must carry a kid, which some providers omit by default.
  • API Gateway allows 60 seconds of clock skew when it checks exp, nbf, and iat.
  • API Gateway caches each issuer’s signing keys for about 60 minutes, so a key your provider removes can still verify tokens for that long. If the key endpoint is unavailable, API Gateway keeps using the last key set for up to 1 hour.
  • A token passes a method’s scope check when its scope or scp claim carries one of the method’s scopes. Microsoft Entra ID client credentials tokens carry permissions in roles instead, so use a dedicated audience per caller or a Lambda authorizer for role checks.
  • An authorizer reads the token from a single request header.
  • JWT authorizers don’t check revocation, so a token stays valid until it expires. Use short token lifetimes for sensitive operations.
  • The issuer URL must be publicly accessible.

Clean up

To avoid incurring future charges, delete the resources you created:

aws apigateway delete-rest-api --rest-api-id "$API_ID" --region "$REGION"

aws cognito-idp delete-user-pool-domain --user-pool-id "$POOL_ID" \
  --domain "$DOMAIN_PREFIX" --region "$REGION"

aws cognito-idp delete-user-pool --user-pool-id "$POOL_ID" --region "$REGION"

rm -f jwt-config.json

In your identity provider, delete the two applications and the orders API or resource server if you no longer need them.

Conclusion

With JWT authorizers, you can validate tokens from OIDC-compatible identity providers in API Gateway REST APIs without a function in the request path. In this post, you built an API that accepted machine-to-machine tokens from your own provider, enforced separate read and write scopes, and added a Cognito user pool as a second issuer. Lambda authorizers remain the right tool for custom authorization logic. For token validation alone, we recommend the JWT authorizer.

JWT authorizers for REST APIs are available in all commercial AWS Regions, the AWS GovCloud (US) Regions, and the China Regions. To get started, refer to Controlling access to a REST API using JWT authorizers in the Amazon API Gateway Developer Guide. To learn more about serverless architectures, visit Serverless Land.


About the authors

Giedrius Praspaliauskas

Giedrius Praspaliauskas

Giedrius is a Specialist Solutions Architect at Amazon Web Services, focusing on helping customers modernize their infrastructure and adopt cloud-native architectures. He has extensive experience with API management, microservices, serverless, developer experience, and application modernization.

Srijan Bhattacharya

Srijan Bhattacharya

Srijan Bhattacharya is a Senior Product Manager – Technical at AWS on the Amazon API Gateway team, based in Toronto. He works with customers to shape features across API security, observability, traffic management, integrations, and extensibility.

How Veeva scaled big data with Amazon EMR on EKS

Post Syndicated from Kevin Fernandez original https://aws.amazon.com/blogs/big-data/how-veeva-scaled-big-data-with-amazon-emr-on-eks/

With biopharma commercial teams facing increasingly complex big data challenges, Veeva used Amazon EMR on EKS to increase speed and efficiency in delivering performance data to biopharma customers, supporting insight generation to find and treat more patients. Therapies designated as “orphan” in the United States that treat rare diseases affecting fewer than 200,000 Americans made up half of U.S. novel drug approvals in 2025, and the continuing shift toward developing therapies for rare and complex disease states only amplifies the need for scalable analytics infrastructure.

Veeva Systems, a leader in cloud-based software for the global life sciences industry, addresses this changing data landscape with Veeva Compass and the Compass Data Network. Compass unifies prescriptions, in-office procedures, and diagnoses into a suite of data products customers use to segment economies with greater precision, prioritize the right healthcare providers, and bring the right therapies to more patients, faster.

Veeva is continuously evaluating and adding new data partners to the Compass network, using both closed and open sources to fill the gaps left by traditional patient data products and meet the biopharma industry’s current and future data needs. To support this ever-growing network, the company undertook an ambitious architecture transformation with Amazon EMR on EKS. Veeva Compass uses faster, more efficient compute to deliver data from suppliers to customers within hours while drastically increasing efficiency by accelerating analytics and supporting AI workflows. This system flags new patient and healthcare provider (HCP) events earlier so that medical reps can engage with healthcare providers at the right time with more precise information.

This post explores the AWS analytics architecture that powers the petabyte-scale elastic big data processing Veeva Compass implemented with Amazon EMR on EKS. Specifically, it explores how Compass avoided execution slowdowns while continuing to increase data volumes to meet customer needs.

The challenges of extracting data insights at petabyte scale

The foundation of Veeva Compass is an analytics lake that was originally designed to process hundreds of terabytes daily. Through years of consistent growth fueled by global customer expansion and the growing gap between legacy data products and industry needs, the Veeva Compass analytics lake grew. It increased support for the number of data sources and Veeva products. This resulted in an exponential growth of data volumes. With the quantity and size of batch jobs becoming more variable, Veeva decided to revisit the original Amazon EMR on Amazon Elastic Compute Cloud (Amazon EC2) architecture.

The batch job variability challenges manifested in a few important ways. Whenever Spark executors ran out of memory, the shuffle stages in Spark were unable to compensate, and executor tasks would spill to disk. This would add hours to overall job execution time with executors relying on disk storage to complete their tasks. A significant portion of the analytics budget was allocated to several provisioned Amazon EMR clusters that were idle during the afternoon waiting for the next series of job runs. To better use these clusters, Veeva distributed jobs across resources. But that led to noisy neighbor challenges where one team’s large join operation would monopolize the cluster and block another team’s service level agreement (SLA)-critical pipeline.

Veeva needed a more scalable solution that could scale out to hundreds of Spark executors in minutes when jobs arrived, then scale in when jobs complete, delivering both performance and cost efficiency. Veeva needed to rethink how it provisioned compute resources and managed Spark workloads.

The solution: Amazon EMR on EKS with Karpenter

Let’s explore how Veeva used Amazon EMR on EKS with Karpenter to scale its analytics capabilities and reduce Spark run times. Amazon EMR on EKS runs each Spark application as an ephemeral job inside Kubernetes, decoupling compute from storage. Data lives in Amazon Simple Storage Service (Amazon S3), durable and accessible. Spark executors run as pods that are created and terminated with each job. With Amazon EMR on EKS, Veeva is no longer dependent on always-on clusters and consumes compute only when needed.

The diversity of data types in the analytics workloads requires fine-grained control to provision the optimal compute nodes for each job. Veeva’s original cluster design relied on pre-configured node groups, where you define instance types and sizes upfront. This approach worked for other Veeva workload profiles, but Spark workloads are different. One job might need memory-optimized instances for wide joins, while another needs compute-optimized nodes for CPU-intensive transformations.

To address this challenge, Veeva added real-time EC2 instance type provisioning using Karpenter. For example, a Spark job might request 800 executors with 16 GB memory and 4 cores each. Karpenter reacts to pending pod requests in 60–90 seconds, analyzes the requirements, selects optimal instance types from across over 20 families, and launches nodes. When the job is complete, those nodes terminate within minutes. Karpenter also handles bin-packing, which is a placement strategy where pods are consolidated into fewer EKS nodes to optimize cost and improve resource utilization.

Amazon EMR on EKS with Karpenter architecture overview

Veeva’s analytics architecture follows a medallion data design pattern. This pattern progressively refines data in stages: bronze (raw), silver (cleaned), and gold (aggregated) layers within the same storage system.

Amazon EMR on EKS architecture with S3 storage, Spark compute, Karpenter orchestration, and Trino query layers

Figure 1: Amazon EMR on EKS architecture spanning the storage, compute, orchestration, and query layers

The architecture comprises four layers:

  • Storage layer: Amazon S3 stores data across bronze (raw), silver (cleaned), and gold (business-ready aggregated) layers. S3 organizes the data in Delta Lake format with daily partitions and continuous compaction to help prevent small-file proliferation.
  • Compute layer: Amazon EMR on EKS runs Spark applications as Kubernetes jobs. Each application gets its own isolated set of pods that exist only for the duration of that job.
  • Orchestration layer: Karpenter watches for pending Spark executor pods and provisions EC2 nodes to run them. It selects instance types based on pod resource requests, Availability Zone (AZ) capacity, and Spot pricing, then terminates nodes when they’re no longer needed.
  • Query layer: An Amazon EMR on EKS cluster running Trino (formerly PrestoSQL) supports interactive queries against the transformed Delta tables, so analysts can explore petabyte-scale datasets with sub-second response times.

This separation of concerns delivers the elasticity required for petabyte-scale operations.

Spark application layer instance types

Veeva selected three distinct node profiles optimized for different Spark workload characteristics:

Driver nodes: Spark drivers and Airflow workers run on On-Demand Instances for reliability. Drivers coordinate job execution and can’t tolerate interruptions because of Spot instance reclamations. These nodes run continuously but represent less than 5 percent of total compute cost.

Executor nodes: General Extract, Transform, Load (ETL) and memory-intensive joins run on approximately 70 percent Spot Instances. Karpenter spreads across multiple instance families to maximize Spot availability. When interruptions occur, Spark’s checkpointing and Adaptive Query Execution handle recovery automatically.

Shuffle-heavy nodes: Workloads with high shuffle I/O run on NVMe-backed instances. The local SSD storage improves performance when executors spill to disk during wide joins. These run at approximately 50 percent Spot because the NVMe instance families have slightly lower Spot availability.

Partition strategy and tuning for large datasets

With the compute and orchestration layers optimized, Veeva turned its attention to improving the partition strategy, data layout, and Spark configuration.

Partition strategy: Veeva’s data is partitioned by date (YYYY-MM-DD) plus a high-cardinality dimension like region or customer segment. This simplifies partition pruning while avoiding the small-file problems that degrade query performance. Target file size is around 256–512 MB per Parquet file. Nightly compaction jobs use Delta Lake’s OPTIMIZE command with Z-ordering on frequently filtered columns, which improved query performance by 3–5x.

Shuffle and query tuning: Using Adaptive Query Execution (AQE) as a query optimization capability transformed Veeva’s most problematic Spark workload. AQE allows Spark to dynamically adjust the query plan based on runtime statistics rather than relying on static estimates. To enable these dynamic adjustments, enable AQE, configure initial partition counts for wide joins, handle data skew automatically, and enable speculative execution to recover from stragglers.

Additionally, Veeva caches some of the dimension tables in memory to avoid repeated reads from S3. For jobs that reference the same lookup tables multiple times, this optimization reduced runtime by 20–30 percent.

The combination of proper partitioning, continuous compaction, and AQE tuning reduced the skewed join stage run time from 7 hours to 55 minutes.

Observability as the foundational component for Amazon EMR on EKS operations

An observability architecture that monitors the entire stack and delivers operational insights is essential for maintaining SLAs and troubleshooting performance issues before they impact production pipelines.

The observability stack has four layers:

  • Spark History Server runs on EKS with S3-backed event logs. With Spark History Server, you can replay the entire execution graph, examine stage-level metrics, and identify bottlenecks.
  • Prometheus and Grafana track real-time metrics. Key metrics include executor CPU and memory utilization, pending-pod queue depth, shuffle-spill ratios, and Karpenter provisioning latency.
  • Amazon CloudWatch Logs Insights aggregates driver and executor logs with automated alerting. When a job fails, Amazon CloudWatch sends an immediate notification with stack traces and error context.
  • OpenTelemetry traces link Spark jobs to the broader orchestration layer (Airflow, AWS Step Functions). This end-to-end visibility provides insights into how individual job performance impacts downstream dependencies.

To help proactively identify bottlenecks before they cascade into SLA violations, Veeva configured critical alerts such as pending pods exceeding thresholds indicating capacity constraints, high shuffle-spill ratios signaling memory pressure, and excessive repartitioning indicating significant data skew.

Securing multi-tenant data analytics

Datasets that include prescription and claims data require robust security controls. Veeva’s architecture follows AWS best practices for least-privilege access and strict tenant isolation.

IAM Roles for Service Accounts (IRSA) provide each Spark job with temporary credentials scoped to specific S3 prefixes and AWS Lake Formation permissions. Jobs can read from bronze and silver zones but only write to their designated output paths. Using Kubernetes namespaces with taints and tolerations clearly defines workload placement. Each team operates in their own namespace with dedicated service accounts and resource quotas.

Encryption is enforced at rest with AWS Key Management Service (AWS KMS) and in transit using TLS. Amazon S3 uses customer-managed keys to encrypt all data. Spark shuffle data is encrypted using Spark’s built-in encryption. Lineage and auditing through AWS Lake Formation and OpenLineage track data transformations across the entire pipeline.

Measurable improvements

The migration from Amazon EMR on EC2 to Amazon EMR on EKS with Karpenter produced measurable improvements across every key metric:

Metric Amazon EMR on EC2 Amazon EMR on EKS + Karpenter Improvement
Bronze→Silver ETL (1 PB) 9h 12m 4h 07m 55% faster
Daily 20 TB compaction 3h 40m 1h 55m 48% faster
Scale-out 40→520 nodes 18 min 5m 42s 68% faster
Idle EC2 cost/month $42,000.00 $0.00 100% reduction
Spot instance share 0% ~70% ~63% cost savings
Bin-packing failures Frequent Near-zero —

The largest improvement came from scale-to-zero capability. The previous Amazon EMR cluster design ran 24/7 to avoid the 15–20-minute startup time, costing $42,000 monthly in idle compute. With Karpenter, nodes launch in under 6 minutes and terminate automatically, alleviating idle costs. This reduced launch time matters when you have SLA-critical pipelines that need to start processing immediately. For the largest bronze-to-silver ETL job processing approximately 1 PB of data, Karpenter scaled the cluster from 40 to 520 nodes in 5 minutes 42 seconds. It then spun everything down minutes after completion. That level of elasticity is difficult to achieve with traditional automated scaling approaches. By diversifying across over 20 Spot instance types, Karpenter achieves higher Spot availability and lower interruption rates. The executor fleet runs approximately 70 percent Spot, delivering approximately 63 percent cost savings compared to On-Demand pricing.

For Veeva Compass’s business, the speed improvements are as impactful as the cost savings. Several of their most common customer use cases are highly dependent on data delivery speed. For example, medical field reps at a biopharma company rely on alerts from patient data to guide their engagement strategies day to day. The faster Veeva can deliver a new diagnosis or procedure to a customer, the faster that customer’s field team can act.

Lessons learned along the implementation journey

After a year of operating petabyte-scale analytics on Amazon EMR on EKS, here are the lessons that delivered the most value:

  • Partition hygiene matters more than hardware. Veeva spent weeks tuning executor memory and instance types before realizing the real bottleneck was small-file proliferation. Implementing nightly compaction reduced job runtime by 40 percent without changing cluster configuration.
  • Compaction must be frequent. Waiting for monthly compaction windows creates trillions of tiny Parquet files that degrade query performance. Daily compaction on hot partitions and weekly compaction on cold partitions keeps file counts manageable.
  • Design for Spot interruptions. Assume 5–10 percent hourly churn in your executor fleet. Use Spark checkpointing for long-running jobs, enable AQE for query optimization, and rely on Spark retries and re-computation to handle executor failures.
  • Synthetic benchmarking pays off. Before migrating production workloads, Veeva ran synthetic tests at 1 PB, 2 PB, and 5 PB scale. This exposed Garbage Collection (GC) pressure and shuffle limits that would have caused production incidents.
  • Speculative execution saves hours. For skew-heavy wide joins, enabling speculative execution allows Spark to launch backup tasks for stragglers. This single configuration change reduced the skewed join stage run time from 7 hours to 55 minutes.
  • Karpenter consolidation compounds savings. Beyond Spot pricing, Karpenter’s bin-packing and consolidation features deliver another 8–12 percent EC2 savings.

Conclusion

Veeva Compass’s journey from Amazon EMR on EC2 to Amazon EMR on EKS with Karpenter demonstrates how modern cloud-native architectures can transform petabyte-scale analytics workloads. By embracing ephemeral compute, intelligent autoscaling, and continuous optimization, Veeva achieved measurable improvements in both performance and cost efficiency. They reduced critical ETL runtimes by over 50 percent while alleviating $42,000 in monthly idle compute costs.

These cost and performance improvements are important for Veeva Compass’s business practice. The ability to quickly serve large amounts of data to biopharma commercial teams enables faster and more precise analytics, especially as biopharma companies continue to drive increased data demand by exploring AI use cases. These improvements help Veeva Compass customers act with speed and precision to quickly deliver the right therapies to patients in need.

If you’re facing similar challenges with growing data volumes and complex Spark workloads, consider exploring Amazon EMR on EKS and Karpenter as a foundation for elastic, cost-effective big data processing. To learn more about building scalable analytics on AWS, visit the Amazon EMR documentation and explore Karpenter best practices.


About the authors

Victor Cuascut

Victor Cuascut

Victor is Senior Director of DevOps at Veeva, where he leads DevOps and infrastructure supporting big data workflows across the Compass Patient, Prescriber, Data Connector, Pathway, National, and Opendata products. His work focuses on building and operating secure, reliable cloud infrastructure and data platforms, with an emphasis on automation, scalability, and compliance.

Tyler Lochan

Tyler Lochan

Tyler is a Product Marketing Manager at Veeva Systems, on the Veeva Compass team. He works closely with field marketing, sales, strategy, and product teams to understand the market, shape messaging, create content, and contribute to GTM planning.

Kevin Fernandez

Kevin Fernandez

Kevin is a Senior Solutions Architect at AWS. He helps customers make informed decisions on how to use the AWS Cloud as an enabler of their businesses. He has over 25 years of experience across a diverse set of technologies including enterprise storage, virtualization, DR/BC solutions, SaaS applications, and AI/ML. In addition to working with AWS ISV customers, he advises customers migrating to and modernizing on AWS.

Imaan Tariq

Imaan Tariq

Imaan is a Customer Solutions Manager at Amazon Web Services (AWS), where she partners with ISVs to drive complex migration, modernization, and AI innovation journeys. She specializes in guiding customers through the full generative AI lifecycle, from early use-case ideation to production-ready solutions, building deep trust through hands-on collaboration and technical curiosity. An active GenAI Ambassador, Imaan is constantly experimenting with emerging AI tools and frameworks to push the boundaries of what’s possible for customers. A Software Engineering graduate of San José State University, she holds four AWS certifications: Solutions Architect Associate, Cloud Practitioner, AI Practitioner, and Developer Associate.

Siddharth Vyas

Siddharth Vyas

Siddharth is a Senior Technical Account Manager at AWS with over 7 years of experience, serving as a strategic technical advisor to ISV customers. He helps organizations navigate architecture decisions, strengthen operational resilience, and maximize their cloud journey.

CVE-2026-114938: Reported Critical Pre-authentication Remote Code Execution in Java 17

Post Syndicated from Rapid7 original https://www.rapid7.com/blog/post/etr-cve-2026-114938-reported-critical-pre-authentication-remote-code-execution-java-17

Overview

On November 17, 2026, public reports described CVE-2026-114938 as a memory corruption vulnerability in Java 17 and above that could allow a remote attacker to execute code without authentication. The reported severity is Critical, with a CVSSv4 score of 9.2. These CVE-specific details remain preliminary, pending confirmation in Oracle or OpenJDK advisories.

Rapid7 is actively monitoring the situation and will update this blog as new information arrives.

For the latest vendor release information, refer to Oracle’s November security update notice and OpenJDK’s vulnerability advisories.

Rapid7 customers

Exposure Command, Vulnerability Management, and Nexpose

Exposure Command, Vulnerability Management, and Nexpose customers can assess exposure to CVE-2026-114938 with an authenticated vulnerability check available in the November 17 content release (1.1.4115).

Updates

  • November 17, 2026: Initial publication.

Secure MCP integrations for AWS DevOps Agent with Amazon Bedrock AgentCore

Post Syndicated from Lakshmi Kumkala original https://aws.amazon.com/blogs/devops/secure-mcp-integrations-for-aws-devops-agent-with-amazon-bedrock-agentcore/

When the agent can’t reach data you need during an incident investigation, you extend it with new tools. You also manage the security and observability overhead of each tool you add. As you connect more Model Context Protocol (MCP) tools to AWS DevOps Agent, your security team ends up tracking a separate authentication scheme, credential rotation schedule, and audit or revocation procedure for each one. This post shows how to extend AWS DevOps Agent with MCP tools securely, using Amazon Bedrock AgentCore, so that new tools can inherit consistent security, access control, private connectivity, and observability.

AWS DevOps Agent is an AI-powered, always-available operations teammate that autonomously investigates incidents, identifies root causes, and prevents future issues across AWS, multicloud, and on-premises environments. It correlates Amazon CloudWatch metrics, logs, traces, and deployment history to produce root-cause analyses in minutes instead of hours. In Announcing General Availability of AWS DevOps Agent, AWS reported results from customers and partners who used AWS DevOps Agent in preview. They saw up to 75 percent lower mean time to resolution (MTTR), 80 percent faster investigations, and 94 percent root-cause accuracy.

By default, AWS DevOps Agent integrates with a broad set of observability, source control, continuous integration and continuous delivery (CI/CD), ticketing, and collaboration services. Real-world operational environments often extend further: proprietary configuration management databases (CMDBs), internal runbook APIs, application logs in OpenSearch, custom deployment tracking systems, or self-hosted tools behind private networks. When you need data from a source without a native integration, you can use MCP tools to give the agent a standardized way to call external services during an investigation.

You will learn when an MCP tool is the right answer, where to host it, how to connect it to AWS DevOps Agent, and how AgentCore Gateway, a capability of Amazon Bedrock AgentCore, provides a unified management layer for security, policy, and observability.

Where MCP tools fit in the incident lifecycle

Before examining tool infrastructure, it helps to see where MCP tools enter the picture. When your Amazon CloudWatch alarms, ServiceNow tickets, or PagerDuty alerts trigger an incident, AWS DevOps Agent begins an autonomous investigation. The following diagram shows where MCP tools extend that investigation beyond the agent’s native integrations.

Flow diagram showing an incident triggering an AWS DevOps Agent investigation, with MCP tools extending the investigation to data sources beyond the native integrations of the agent.

Figure 1: MCP tools extend the investigation reach of AWS DevOps Agent beyond its native and built-in integrations

These tools can connect to internal operational tools, third-party platforms, on-premises systems, or any custom data source you want to expose to an agent space. AWS DevOps Agent provides logging and the ability to disconnect any MCP server from the console, but you configure authentication, rotate credentials, and maintain the audit trail for each server. As the number of MCP servers grows, managing them independently creates compounding overhead: separate credential lifecycles, no cross-tool policy enforcement, and no unified view for observability across all tools.

AgentCore Gateway helps reduce this per-tool overhead. The agent connects to one endpoint, and tools behind that endpoint share the same security, policy, and observability configuration.

For more on triggering investigations automatically, see Trigger DevOps Agent from CloudWatch Alarms & Amazon EventBridge and Automating DevOps Agent from Incident Detection and Response alarms.

When to extend AWS DevOps Agent with MCP servers

Use this decision framework to choose between a native integration, an existing MCP server, and building a custom MCP server when you need a new data source or workflow.

Decision framework flowchart for choosing between a native integration, an existing vendor MCP server, and building a custom MCP server.

Figure 2: Decision framework for extending AWS DevOps Agent: native integration, existing MCP server, or custom MCP server

Start with what AWS DevOps Agent already covers. Before building anything, check the native capability list on the Capability Providers page. These integrations need no custom server to build or host. AWS DevOps Agent Tools catalogs additional MCP servers built for use with the agent. It is also worth browsing the AWS DevOps Agent ACP/MCP samples repository for reference implementations, and awslabs/mcp for AWS-published open source MCP servers such as the Amazon Managed Service for Prometheus MCP server and the Amazon Elastic Kubernetes Service (Amazon EKS) MCP server.

If a source is not natively covered, check whether a vendor already publishes an MCP server before building your own. Many do. For example, Atlassian’s Rovo MCP Server covers Jira, Confluence, Jira Service Management, and Bitbucket, and vendors such as Datadog and PagerDuty publish official servers.

Build a custom MCP tool when your source does not fall into any of these categories. The most common scenarios are:

  • Logs that need domain-specific parsing. AWS DevOps Agent can read log files in Amazon Simple Storage Service (Amazon S3) and query them with Amazon Athena once you grant it access. To do this, add the S3 read and Athena query permissions to its role as an inline policy, scoped to the buckets it needs. For more information, see Extending permissions beyond the default. For high-volume formats such as Application Load Balancer (ALB) access logs and VPC Flow Logs, a custom tool is often the better fit. An AWS Lambda-based MCP tool that parses and pre-filters these logs gives the agent the context to correlate a 502 spike with a specific backend failure. Application logs in Amazon OpenSearch Service follow the same pattern, because they need domain-specific language (DSL) query logic rather than raw document retrieval. For reference patterns, see Six Patterns for Connecting Amazon OpenSearch Service Logs to AWS DevOps Agent.
  • Internal operational tools. Runbook APIs, proprietary CMDBs, service ownership registries, and custom deployment tracking systems are not reachable through any native integration. An MCP tool wraps the internal API and exposes it as a callable tool during investigations.
  • On-premises or other-cloud telemetry. Data from on-premises monitoring systems or GCP infrastructure that is not captured in native AWS services requires tools that can reach those environments. For network-specific patterns, see Automated network incident response with AWS DevOps Agent.

AgentCore Gateway also provides one-click integrations for tools such as Jira, Salesforce, Slack, Asana, and Zendesk, as well as native support for Amazon Bedrock Knowledge Bases as a Gateway target. If your tool is available as a one-click target, you can skip building a custom MCP server and register it directly on the Gateway, which you then connect to AWS DevOps Agent as an MCP server through the agent’s capabilities.

Where to host your custom MCP server

After you decide to build a custom MCP tool, you need to choose where it runs. The right choice depends on statefulness, latency tolerance, connection requirements, and how much infrastructure you want to manage. The following table compares the four most common hosting options.

Hosting option Best for Advantages Trade-offs
AWS Lambda (direct IAM invoke) Stateless, read-heavy tools that execute quickly, such as Amazon S3 log parsers, OpenSearch query wrappers, runbook search, and internal API or ticket lookups No infrastructure to manage, pay-per-invocation, and auto-scales to zero. AgentCore Gateway invokes Lambda directly through IAM, without needing the HTTP layer, which removes Amazon API Gateway latency for Gateway-connected tools 15-minute execution limit, cold-start latency on first invoke, and no persistent connections
AWS Lambda with Amazon API Gateway Shared tools used by multiple teams or systems, and tools that require request throttling or AWS WAF protection All Lambda benefits, plus HTTP-level controls such as throttling, WAF protection, custom domains, and per-caller access logging Added per-request latency, Amazon API Gateway per-request cost, and more configuration
Amazon Bedrock AgentCore runtime Teams who want zero-ops MCP hosting with native multi-turn session support No infrastructure to manage, built-in session isolation, native MCP protocol support, both stateless and stateful modes, and support for your own container image. Works with any MCP framework, including LangGraph, CrewAI, and Strands Agents Cold-start latency when a new session starts, and less control over the underlying compute than Amazon Elastic Container Service (Amazon ECS)
Amazon ECS on AWS Fargate Database query tools that maintain connection pools, and tools with expensive initialization or large in-memory caches No cold starts, persistent connections, and full control over the runtime environment Always-on cost even when idle, and container image management overhead

For hosting walkthroughs, see Connect API Gateway to AgentCore Gateway with MCP for the API Gateway pattern and Deploy MCP servers in Runtime for AgentCore runtime. The AgentCore runtime released in September 2026 reduces cold starts to about two seconds at p75 regardless of container image size.

As a rule of thumb, start with Lambda for most read-only tools, move to AgentCore runtime, a capability of Amazon Bedrock AgentCore, when you need multi-turn sessions or zero-ops hosting, and use Amazon ECS when you need persistent connections or large in-memory state.

Connecting MCP servers to AWS DevOps Agent

There are two ways to connect MCP servers to AWS DevOps Agent. The right choice depends on how many tools you have, whether tool access needs to be consistent across multiple accounts, and whether you need central policy enforcement. The following diagram compares a direct per-account connection with a single connection through AgentCore Gateway.

Comparison of two connection paths. Path 1, direct connection, where AWS DevOps Agent registers each public and private MCP server per account. Path 2, where a single AgentCore Gateway endpoint fronts multiple targets including AWS Lambda, Amazon ECS, AgentCore runtime, and HTTP or third-party one-click targets.

Figure 3: Connecting MCP servers to AWS DevOps Agent: direct connection compared to AgentCore Gateway

Path 1: Direct connection

With a direct connection, you register each MCP server at the AWS account level from the Capability Providers page. To register a server:

  1. On the Capability Providers page, register the MCP server once with its endpoint URL and authentication credentials.
  2. In each agent space’s Capabilities tab, select the registered MCP server and choose which specific tools to enable for that space.
  3. Classify each tool as read-only, mutating, or destructive so that AWS DevOps Agent applies the correct safety controls during investigations.

Your MCP server must implement the streamable HTTP transport protocol and support one of the following authentication methods:

  • OAuth 2.0 Client Credentials.
  • OAuth 3LO (three-legged OAuth).
  • API key or token-based authentication.
  • Multi-auth headers (up to three secrets sent in HTTP headers that you name).
  • AWS Signature Version 4 (SigV4).

AWS DevOps Agent supports private connections natively. When you register an MCP server, select Connect to endpoint using private connection and choose or create a private connection. AWS DevOps Agent uses Amazon VPC Lattice to route traffic to your private endpoint entirely over the AWS network, with no public endpoint needed. Private connections work with any integration that needs to reach a private endpoint, including self-hosted Grafana or Splunk instances and source control systems such as GitHub Enterprise Server and GitLab Self-Managed. For a detailed walkthrough, see Securely connect AWS DevOps Agent to private services in your VPCs.

Tool safety with directed actions

When you connect an MCP server, you classify each of its tools as read-only, mutating, or destructive. The console prompts you for each tool, and API or CLI registrations set this with toolDetails. Read-only tools run without operator approval. Mutating tools are available only after you enable directed actions on the agent space, and each call requires operator approval in chat. AWS DevOps Agent does not invoke tools classified as destructive. If you register a server through the API or CLI without classifying its tools, every tool defaults to read-only, so classify any tool that can change state. For more information, see Working with directed actions.

Limit prompt-injection exposure

Custom MCP servers can introduce additional prompt-injection risk. Allow only the tools each agent space needs, prefer read-only tools, and give each server’s credentials read-only access. For more information, see the security considerations in Connecting MCP Servers.

Path 2: Amazon Bedrock AgentCore Gateway

AgentCore Gateway is a fully managed service that provides a single, secure entry point for agentic traffic, connecting agents to tools, to other agents, and to models. Instead of registering each MCP server independently in the AWS DevOps Agent account, you register all of them as targets on the Gateway. AWS DevOps Agent registers the Gateway URL once at the account level, and all tools from all registered targets become available through that single registration.

Gateway also consolidates authentication. AWS DevOps Agent connects to a single Gateway endpoint with AWS SigV4. It signs requests with either a dedicated IAM role or, if you register without one, the IAM role of the AWS account associated with the agent space. Grant that role bedrock-agentcore:InvokeGateway, scoped to the Gateway ARN. You still configure per-target credentials on the Gateway, because each backend MCP server has its own authentication. But the Gateway manages those credentials centrally, handling token refresh, secure storage, and credential lifecycle in one place rather than scattering them across individual agent space registrations.

With Policy in Amazon Bedrock AgentCore, you can enforce Cedar rules across every tool behind the Gateway with a single policy, for example blocking any tool that writes to production resources regardless of which MCP server exposes it. Because AWS DevOps Agent already refuses tools classified as destructive, Gateway policy is most valuable as an independent backstop in case someone misclassifies a tool.

Gateway also provides a unified audit trail and built-in observability automatically, with no instrumentation code and no per-target logging configuration. Amazon CloudWatch Logs records every tool call, including tool name, caller identity, request arguments, response, latency, and status, across all registered targets in one log group. AWS X-Ray provides end-to-end distributed traces across the MCP client, Gateway, and Lambda or runtime layers. The CloudWatch generative AI observability dashboard reports per-tool metrics, including invocation count, error rate, and latency percentiles (p50, p90, and p99). These metrics appear regardless of whether the tool runs on Lambda, Amazon ECS, AgentCore runtime, or a third-party server.

Gateway can also route to private MCP servers through VPC Lattice egress. If you need private connectivity together with the authentication, policy, and observability capabilities of the Gateway, register the tool as a private Gateway target. For connectivity patterns, see Private connectivity patterns for AgentCore Gateway Targets. If you only need private connectivity for a single tool without central policy, a direct private connection requires less configuration.

You can also route native MCP integrations through Gateway. Some AWS DevOps Agent native capabilities, such as the Grafana integration, connect to external MCP servers (Grafana’s own MCP server, in this case). If you want unified policy enforcement, observability, and authentication across both your native MCP-based integrations and your custom MCP servers, you can route them through AgentCore Gateway as well. This gives you a single control plane regardless of whether the tool came from the Capability Providers page or a custom registration.

For more on extending Gateway with MCP servers, see Extending MCP support for AgentCore Gateway and Transform your MCP architecture: Unite MCP servers through AgentCore Gateway.

Choosing between direct connection and Gateway

Use a direct connection when you have one or two MCP servers in a single AWS account, when each agent space configures its own tool set manually, and when you do not need cross-cutting policy enforcement. Choose AgentCore Gateway when you have multiple MCP servers and want to manage them through a single registration, when agent spaces across multiple AWS accounts need to share the same tools, when you want one authentication configuration, when you need Cedar policy enforcement across all tools, or when you want a unified audit trail and built-in observability. For full instructions, see Connecting MCP Servers in the AWS DevOps Agent User Guide.

Connectivity options at a glance

This table maps common scenarios to the recommended connection approach.

Scenario Recommended approach
One or two MCP servers, single account Direct connection
Multiple MCP servers, single registration preferred AgentCore Gateway
Agent spaces across multiple AWS accounts sharing the same tools AgentCore Gateway
Private VPC tool, no central policy needed Direct connection with DevOps Agent private connection
Private VPC tool with Cedar policy or unified auth Gateway with VPC Lattice target
Cedar policy enforcement across all tools AgentCore Gateway
Unified audit trail across all MCP servers AgentCore Gateway

Managing tool access with Gateway targets and policy

Beyond choosing a connection path, Gateway gives you finer control over which tools an agent space can reach.

Keep the per-space tool ceiling in mind as you scope access: a single agent space can have at most 500 MCP tools on the allowlist across all of its MCP servers, and this limit is not adjustable. Scoping each space to only the tools it needs keeps you well under that ceiling. For the full list of limits, see AWS DevOps Agent quotas.

When AWS DevOps Agent connects to an MCP server, its tools appear on the agent space console, where an admin selects which tools to allow and classifies each one as read-only, mutating, or destructive. This workflow exists with or without Gateway.

Gateway adds a mechanism on top: separate targets per tool category. Register read-only tools and write or destructive tools as separate Gateway targets, then associate AWS DevOps Agent with only the read-only target. The write tools don’t appear in that agent space, because they are not in the target. For how to register targets, see Add targets to an existing AgentCore Gateway.

For example, if an MCP server exposes list_runbooks, get_runbook, search_runbooks, upload_runbook, and delete_runbook, register a target named readonly-runbook-tools with only the first three. Connect the production agent space to the readonly-runbook-tools target, and connect development and staging agent spaces to a target that exposes all five tools.

Even when tools are visible and enabled in an agent space, Gateway policy, which uses Cedar, can block execution. This is the enforcement boundary below the admin workflow, and it holds regardless of what an admin configures on the console, which helps guard against configuration mistakes. For more on Cedar policy patterns, see Secure AI agents with Policy in Amazon Bedrock AgentCore.

Conclusion

AWS DevOps Agent covers a broad set of AWS services and third-party tools by default. When investigations need to reach further, into OpenSearch, internal runbook APIs, proprietary CMDBs, or tools in private VPCs, MCP tools extend that reach.

For one or two tools in a single account, a direct connection with account-level registration is sufficient. The picture changes when MCP servers multiply, when agent spaces span multiple AWS accounts, or when security teams need consistent enforcement and a unified audit trail. AgentCore Gateway collapses that to one registration per account pointing to a single Gateway URL. You configure authentication once, enforce Cedar policies consistently, get built-in CloudWatch observability across your tools, and revoke access in one place instead of across each tool registration.

For more on what AWS DevOps Agent can do by default, see Announcing General Availability of AWS DevOps Agent, AWS DevOps Agent features, and Native Capabilities.

Get started

To try this pattern, register one read-only MCP server as an AgentCore Gateway target, connect the Gateway to a non-production agent space, and classify each tool before you enable it. The following resources cover each step.

What Link
AWS DevOps Agent overview Product page · User Guide
Connecting MCP servers to AWS DevOps Agent User Guide – Connecting MCP Servers
AgentCore Gateway Developer Guide – Gateway · Getting started
Cedar policy for Gateway Understanding Cedar · Core concepts · Schema constraints
AgentCore runtime (MCP hosting) Deploy MCP servers in Runtime
Private connectivity VPC Lattice egress · Private endpoints · DevOps Agent private connections
Observability Service-provided observability · Observability overview
Gateway authentication Inbound auth setup · Cognito as IdP
Related blog posts Transform your MCP architecture with Gateway · Connect API Gateway to AgentCore Gateway · Why AgentCore chose Cedar
MCP/ACP samples DevOps Agent ACP/MCP samples
Samples DevOps Agent + CloudWatch sample


About the authors

Lakshmi Kumkala

Lakshmi Kumkala

Lakshmi is a Senior Technical Account Manager at AWS. Lakshmi works with enterprise customers on DevOps, operational excellence, and agentic AI architecture.

Hima Atluri

Hima Atluri

Hima is a Technical Account Manager at AWS, Global Financial Services. Hima helps customers build secure, observable operational workflows using AWS native services and agentic AI.

Building the Agent Host Protocol for sessions that continue across devices

Post Syndicated from Connor Peet original https://github.blog/engineering/engineering-principles/building-the-agent-host-protocol-for-sessions-that-continue-across-devices/

Models are now good enough to work for hours or even days on their own. You don’t have to watch over every thing they do, but you still need to be able to check in, no matter where you are. An agent can’t live only inside one application. The work should continue even If you close a window or switch devices.

In GitHub Copilot you can start an agent session in one place and pick it up in another. This session continuity runs on the Agent Host Protocol (AHP), an open standard built first in VS Code and adopted across GitHub. Here’s how it works, what we learned building it, and how you can use it to bring your agents into your own apps and workflows.

Why one integration per client stopped working

GitHub Copilot was first built in VS Code as an extension that bundled its own harness. This gave you access to your agents in VS Code, but it tied their lifetime to the editor. Extensions are attached to a single VS Code window. Close that window, and the agent is gone. Update VS Code, and every agent stops as the application restarts. Connect to a remote machine, and you get an entirely new extension host commit-locked against the version of the VS Code workbench you have.

At the same time, the Copilot app was being developed, alongside the existing GitHub mobile apps for iOS and Android. Each product was doing its own distinct integration with cloud-based agents to work towards delivering session continuity.

Each of these integrations solved the problem for one product, but developers also still want to be able to pull their agents into their own workflows–whether that’s an editor, a terminal, a phone, or a tool they built themselves–and they can’t do that if every client needs its own one-off integration. That’s why developers needed a protocol: a standard, independently versioned language across versions of VS Code, the GitHub Copilot app, mobile apps, and any other client that might host an agent. A shared protocol means every client sees the same agents, history, and state without bespoke integrations, and you aren’t tied to one app’s idea of what an agent session is.

Designing a protocol for agents on every client

The protocol needed to allow multiple clients to interact with the same set of agents seamlessly. Start a session in the cloud from your phone, for example, then continue it from your laptop. It should tolerate network interruptions, reconnections, and concurrent client mutations. And it needed to be full-featured enough for you to do real work from each of your clients.

At the same time, the protocol needed to stay out of agent behavior. Unlike the domains that produced the Language Server Protocol and Debug Adapter Protocol, the world of agents is evolving quickly. That’s why AHP avoids encoding how agents work, and instead focuses on how you want to interact with them.

You also need the protocol to be simple enough to implement on your own client or server. While the full feature set would necessarily be extensive, the core protocol needed to be minimal.

The result of these requirements is the Agent Host Protocol (AHP). It is oriented around URI-identified “channels”, which are the coarsest unit of functionality in the protocol. Every server must implement the root, session, and chat channels, but can also implement more channels that provide terminal support, MCP additions, or OTel reporting, for example.

Within each channel is a reducer-based state object, which drives most of the logic for clients. The server is the arbiter of the state, and each client sends a sequence of actions that either mutate the state or trigger side effects, like sending a chat message. This provides a few very nice properties. Reconnection and replay in poor network conditions are easy: a client sends all queued actions, presents the right ‘loading’ state, and waits for the server to reconcile and acknowledge the actions before confirming them. Clients and servers are straightforward to debug. And reducer-based state also plays nicely with popular UI frameworks like React.

Three clients (VS Code, the Copilot app, and a phone) send dispatchAction messages to an agent host and receive action messages back. Inside the host, required root, session, and chat channels each hold reducer-based state; the chat channel's ordered action log feeds a reducer that produces the next state. Optional terminal, MCP, and telemetry channels sit alongside.

Shipping five clients and two hosts

Adopting the Agent Host Protocol in VS Code required building a new harness and agentic stack underneath it. The Copilot Chat extension, which used to provide all of VS Code’s AI and agentic capabilities, had been growing for over three years, reaching over 400,000 lines of TypeScript, not counting tests. But, as a VS Code extension, it was structured around the lifecycle of a VS Code window and depended entirely on the VS Code extension API. Neither that lifetime nor those APIs would be available in a standalone agent host process.

As we started building the Agent Host Protocol in early 2026, the Copilot SDK was also being developed, and it made sense to leverage it as the foundation for the new agentic stack. This was a big transition. It’s easy to build a harness implementation that says hello and can edit files—we were using the agent host to develop the agent host after the first couple weeks—but it’s another thing to build one that covers the long tail of features developers had come to expect from Copilot Chat.

Line chart of non-test lines of code since 2023. Copilot Chat grows steadily to about 415,000 lines of TypeScript as it moves from microsoft/vscode-copilot to microsoft/vscode-copilot-chat in mid-2025 and into microsoft/vscode in April 2026. Starting in spring 2026, the VS Code agent host grows to about 369,000 lines of TypeScript and the GitHub agent host to about 305,000 lines of Rust.

GitHub has had Copilot cloud agents for a couple of years, allowing developers to run tasks in the cloud from any device. While VS Code was quietly developing the Agent Host Protocol, GitHub was looking to expand that capability to coordinate sessions running on your own devices via the Copilot app, or in cloud sandboxes. This was exactly the N:M problem that AHP was built to solve, so adopting the same technology made perfect sense.

From the outset, the GitHub Agent Host had different requirements than VS Code’s implementation. VS Code runs the host locally and can drop its host on other compute over SSH, containers, WSL, or Dev Tunnels, and it is actually included as part of the VS Code Server bundle. The GitHub Agent Host needed to run in the cloud and across a much wider variety of infrastructure, environments, and security constraints.

Those differing requirements are why they’re separate implementations written in different languages: VS Code’s in TypeScript and GitHub’s in Rust. For now, having two agent hosts has been a good acid-test for the protocol itself. How well does it work when two entirely different teams and sets of agents implement the same protocol independently?

Pretty well, it turns out. Like MCP, the Agent Host Protocol provides escape hatches via custom methods and _metadata on objects that consumers can use for out-of-band signaling. After several months heads-down on our respective implementations, our first task as we worked toward unification was inventorying the ways each implementation had extended the protocol. Many of these extensions reasonably stay GitHub-specific, such as the GitHub Agent Host using metadata to link to project boards. In other cases, variance was a sign of a gap in the protocol; early versions, for example, could not accurately represent shell-type tool output that wasn’t backed by a PTY. And some were bad assumptions, like VS Code’s client assuming a particular structure for the session URIs it received from the agent host. A protocol with only one implementation isn’t truly portable; as we taught our clients and servers to talk to each other, AHP became portable in practice, not just in theory.

A single session, "Fix the flaky login test," runs continuously on an agent host. It is started from the Copilot app at 9:02 AM, a tool call is approved from a phone at 9:40 AM, the diff is reviewed in VS Code at 11:15 AM, and a cloud agent lands the pull request at 11:32 AM.

Today, the Agent Host Protocol provides that same continuity across all VS Code and GitHub surfaces. Agent sessions running locally in the GitHub Copilot app, in cloud sandboxes, and in VS Code all share the same underlying protocol. To see how it’s used, read about how you can work from anywhere with the new connected Copilot cloud experience.

Using the Agent Host Protocol

AHP was designed to be easy to use in clients and servers. Agent Host Protocol libraries are available in Rust, TypeScript, Kotlin, Swift, .NET, and Go, and agents are able to build clients and servers with little prompting. I have a macropad sitting on my desk that reflects my agent’s state in real time, and others have built everything from smart watch apps to Kanban-style task management tools against the protocol. Whether you want a companion app for your own agents, a way to bring agent sessions into your team’s tools, or AHP support in your own editor or agent, the protocol is open for you to build on.

You can connect to an agent host you implement in the Copilot app (enable Experimental > Direct Connections, then go to Environments > Add Agent Host Protocol Host) and in VS Code (via Add Remote Agent Host in the Agents window). You can spawn a standalone version of VS Code’s agent host by running code agent host in your terminal, or see the endpoints for the one in your editor by running code agent endpoints, and samples can help you and your agent get started.

The Agent Host Protocol is an open standard, and questions and suggestions are welcome on GitHub.

Happy coding!

Explore the Agent Host Protocol on GitHub >

The post Building the Agent Host Protocol for sessions that continue across devices appeared first on The GitHub Blog.

Building a gated review pipeline for AI coding agents on AWS

Post Syndicated from Owen Hawkins original https://aws.amazon.com/blogs/devops/building-a-gated-review-pipeline-for-ai-coding-agents-on-aws/

AI coding agents have changed the economics of writing software. Tools like Kiro turn specifications into working code, tests, and documentation, and a single agent can open dozens of pull requests across your repositories in an afternoon. What they have not changed is the number of senior engineers available to review those pull requests. The AI Productivity Paradox research from Faros AI drew on telemetry from more than 10,000 developers. It found that teams with high AI adoption merged 98% more pull requests while review time rose 91%. The gains did not show up in company-level delivery metrics. The constraint moved downstream, from writing code, to reviewing it.

The intuitive fix is to add an AI reviewer to every pull request. The evidence says that alone is not enough. Human-Centric to Agentic Code Review, a study of 1.02 million pull requests across 207 open source projects, found that reviews involving AI agents reached decisions faster but did not improve quality. After AI reviewers took part, the strongest factor explaining review efficiency was not the tooling, but how humans and agents were wired together in the review flow.

This post presents a pattern for wiring together humans and agents as part of code review. It introduces a gated review pipeline with six controls that pairs deterministic checks with verified AI review, applies your policy through risk-tiered gates, and keeps humans in charge of every consequential decision. It describes the core components of each control, how to implement them with AWS services, and how to measure the effect on defect and rework rates.

Two kinds of controls, and one wiring pattern

The AWS Blog Balancing speed and safety: a control framework for AI coding agents establishes a control taxonomy for what agents produce, through author-time controls (steering documents, specifications, and agent hooks) and pipeline scanning. It also introduces an AI-assisted review control. In this post, we expand that control into an operational design pattern. The pattern includes a review panel that produces verified findings, a deterministic gate that applies policy to findings, risk tiers that set agent autonomy, and metrics that show whether defect and rework rates fell.

This pipeline adds two design rules to that foundation. The first is a deliberate pattern for human and agent collaboration, because the research cited earlier found that collaboration patterns shape review efficiency. The second is risk-tiered autonomy. A documentation fix and a payments change carry different risk, so they shouldn’t pass through the same gate.

Assign the initial tier deterministically from what the change touches, not from what the author declares. Certain critical paths and files should be assigned the highest risk tier regardless of the change, for example changes to build and pipeline definitions, the Control 4 policy bundle, steering files, and the panel reviewer prompts. Changes such as a new dependency or an AWS Identity and Access Management (IAM) policy change should also escalate the risk tier. Evaluate related changesets together so a high-risk change can’t be split into low-risk pieces.

Tier Change risk Autonomy Review depth Evidence required
T1 Low (docs, internal tooling) Agent drafts, human approves Light spot-check Pull request + provenance tag (agent, model, requester)
T2 Medium (standard features) Agent drafts, engineer edits Full review + tech-lead sign-off Pull request + tests + approved spec or design notes
T3 High (payments, auth, data, changes to pipeline configuration) Agent assists, engineer implements Two human reviewers, plus architecture review when the design changes Full audit package
Diagram of the six-control gated review pipeline across deterministic, AI, and human columns, from standards through deterministic gates, the verified AI review panel, the policy gate, human judgment, and post-merge operations

Figure 1: An overview of the six controls in the gated review pipeline

The framework is methodology-agnostic. It composes naturally with structured approaches such as the AI-Driven Development Life Cycle (AI-DLC), but requires none of them. Where a team approves the specification before generation, that review settles whether this is the right change before any diff exists, leaving the pull request review to confirm it was built correctly.

Control 1: Standards consumable from one place

Code quality rules, architectural preferences, security standards, and compliance requirements each have an authoritative home where they’re owned, versioned, and published. Those homes can differ. A security team might keep a policy repository, compliance teams a wiki, and architects a decision log. All of these should feed a single consumption endpoint, so that every repository, pipeline, and agent pulls the same standards through the same mechanism instead of integrating with each source directly. Curating organizational knowledge into a form agents can consume is an easily underestimated investment. Funneling it through one consumption point means you make that investment once, not once for each repository and each source.

A single consumption point doesn’t require a single delivery mechanism. Retrieve situational standards on demand. Small, non-negotiable ones, such as production-safety guardrails, inclusive-language rules, and conventions for working with internal systems, belong in context on every interaction. Push those as baseline configuration, such as a global steering file or default agent configuration, so the agent doesn’t need to fetch them.

On AWS: Keep each standard in its authoritative home and put a single consumption layer in front of them. AgentCore Gateway, a capability of Amazon Bedrock AgentCore, can serve as that consumption point. It exposes each source as Model Context Protocol (MCP) tools from configuration alone, whether the source is a Git repository behind its provider’s MCP server, an HTTP endpoint, or Amazon Bedrock Knowledge Bases built over documents in Confluence or Amazon Simple Storage Service (Amazon S3). Every agent and tool then pulls the same versioned standards at runtime. The knowledge base is a retrieval layer for prose-style guidance that benefits from semantic search. It isn’t the system of record, and the owning team’s repository or document store remains authoritative. If you need evidence of which standard was in force for a given change, either sync a pinned copy into the repository as a pipeline step and record the version, or write the consumed standard version to an audit log at time of use. Deterministic consumers, such as linter configurations and the Control 4 policy bundle, should take the pinned path. A standards change then arrives as a version bump instead of failing every repository’s next build.

In the developer’s environment, the consumption format is whatever the agent reads, such as Kiro steering files or agent skills. Generate or sync those files from the gateway instead of writing them for each repository, so a local project becomes one more consumer of the same standards. For the always-on class of standards, generate the global steering files or default agent configuration from the gateway’s sources, and push them out through whatever provisions your developer environments. The gateway remains the on-demand path for situational standards.

Control 2: Deterministic gates first, with agent self-correction

The first gates to run are fast, deterministic, and hard-fail. These include formatting, lint, type checks, static application security testing (SAST), and secrets scanning. The remediation agent then self-corrects in a build, fail, fix loop until the stage passes or hits a maximum iteration cap, which hands the change to human review. Don’t use AI to review what a rule can catch. When the deterministic gates run first, the AI review stage sees only mechanically clean code and spends its reasoning on semantics instead of style. It also keeps most mechanical defects out of human review.

The self-correction loop is told to make the gates pass, and the shortest path to a passing gate is often a weaker gate. Treat suppression annotations, threshold changes, and removed or skipped tests in agent commits as change risk escalations.

The blog CI/CD Pipelines with agentic AI describes how Elastic does this. When a build fails, an agent steps in as a pipeline stage. It reads the failure logs, applies fixes from a deterministic tool allowlist, verifies the build, and commits, with auto-merge turned off whenever agent commits are present. In its first month, covering under half of Elastic’s dependencies, it fixed 24 broken pull requests and saved 20 days of development work.

On AWS: Run the same gates in two places. In the developer’s environment, Kiro agent hooks run them on file save and task completion. That catches defects before a pull request exists, where the fix loop is cheapest to run. The pipeline is the enforcement backstop. The same gates run in AWS CodeBuild on every pull request as a required status check, so a failing gate blocks the merge and nothing reaches review on the strength of a local run alone. Order them by cost and severity, as the predecessor post describes: secrets detection, SAST, software composition analysis (SCA), and then infrastructure as code (IaC) scanning.

When a pipeline gate fails, a remediation agent takes over. Because this agent commits to the repository, host it as a harness on AgentCore runtime, a capability of Amazon Bedrock AgentCore, outside the build, and call it from the failing CodeBuild action. The harness runs the agent loop in its own managed workspace. It treats the failure logs as untrusted data, applies fixes constrained by a tool allowlist, re-runs the gates, and commits to the source branch, reporting progress back to the pipeline. Authenticate that call with the pipeline’s IAM role so the automation runs on a workload identity you control, with no developer credential embedded in the build. Bound the loop with the harness’s execution limits. Cap fix attempts, set a wall-clock timeout, and give the agent a token budget. Count them per pull request, because each agent commit starts a new build. When any limit trips, the build stops and hands the failure to a human. Configure branch protection to dismiss approvals on new commits, so an agent fix always gets a fresh human review. For standing up the harness itself, see Hosting coding agents on Amazon Bedrock AgentCore.

Control 3: AI review as a verified panel

Run AI review as a panel of reviewers with distinct focus areas, for example, correctness, security, operational readiness, and, where the change was built from an approved specification, scope. Each seat on the panel is an agent that starts from its own clean context, which keeps it from inheriting assumptions about the code. Give each seat the diff as its focus, plus the full changed files and the dependencies they touch, so it reviews the change in context. An agent that sees only the changed lines can’t judge cross-file or architectural impact, and those are the defects most likely to survive the deterministic gates. From a security perspective, the code is untrusted input, so seats should be limited to sandbox environments with read-only tools.

Two sessions of the same model share the same blind spots. For each focus area on the panel, assign at least one agent to use a different model family than the author recorded in the provenance tag. For high-risk changes, you might run multiple agents with different models for the same focus area. Choose models by measurement. Evaluate candidates against past pull requests with known findings and prioritize models that score best for that focus area.

A two-stage verification step decides what reaches a human at the review gate. The first stage is deterministic. It confirms that the cited file and line exist and that the quoted code matches what’s there. A deterministic check can’t tell whether an anchored finding describes a real problem, which is a semantic judgment. The second stage can use a decision model, which returns one bounded answer (valid, invalid, or escalate to a human) with a confidence score. Because the answer is bounded, you can measure it. Evaluate the model against past findings with known outcomes, calibrate its thresholds, and route low-confidence cases to a human. Without this filter, volume works against you, as seen in one industrial deployment of a large language model (LLM)-based review tool. Average pull request closure time rose by more than 40%, even though developers acted on most of the automated comments.

On AWS: Run the panel seats as a single AWS CodeBuild batch build graph, one build per seat, each invoking an agentic coding harness in a fresh session and writing its findings to Amazon S3 under the commit’s key. Mount the checked-out repository so each seat has that context. The agents run inside CodeBuild because they only read code the build has already checked out, in an environment discarded after the run. The remediation agent in Control 2 writes to the repository, so it runs on AgentCore runtime under its own identity and limits.

A verification build that depends on the agents then reads their findings and runs the two-stage check. The deterministic pass checks each finding against the checked-out code and discards any finding whose file, line, or quoted code doesn’t match. A validity judgment then runs on what remains. The open source Strands Decider models fit that judgment, returning a bounded valid, invalid, or escalate classification with a confidence score. The verified, high-confidence set passes to the Control 4 gate, and low-confidence cases go to a human. For the security seat, you can use an open source harness such as the Visa Vulnerability Agentic Harness, which applies the same pattern to vulnerabilities. It uses deterministic stages for repeatable work and agentic stages for judgment, verifies each finding adversarially, and produces Static Analysis Results Interchange Format (SARIF) output that a gate can read. Run your chosen harness in a detection-only mode, so it emits findings without editing code, and feed its output to the same verification step and gate as the other agents.

Control 4: A deterministic policy gate on structured findings

The AI review panel in Control 3 never approves or blocks. It emits structured findings, each with a severity (important or minor), whether this change introduced it or it was pre-existing, and its evidence. Findings use a standard format such as SARIF, so deterministic and AI findings reach the gate in the same shape. A deterministic gate then applies your policy to that signal. It blocks on important findings, fast-paths clean changes, forces oversized changesets to split, and scales all of it by risk tier. Keeping policy in a deterministic component, apart from the model judgment it acts on, is the core of this pipeline. It makes the merge gate auditable, reproducible, and tunable for each repository. An empty finding set means the panel found nothing, not that nothing is there. Fast-path rules might shorten the queue for T1 changes but should never reduce human review depth at T2 or T3.

On AWS: Have the verification build write the verified findings to Amazon S3, keyed to the commit, as the record of that run. Then make the gate itself policy as code. A CodeBuild step or an AWS Lambda function evaluates the findings against rules written in Open Policy Agent or Cedar. The rules encode the preceding policy, scaled by risk tier. Oversized changes reach the gate less often when the specification breaks work into reviewable tasks. The gate reports to the pull request as a status check and posts a severity summary, for example “2 important, 4 minor,” before the verified findings. The rules ship in the pinned standards bundle from Control 1, so changing the merge bar means publishing a new policy version.

Control 5: Human judgment on a pre-triaged change

Human review remains a key pipeline component. What changes is what the human reads. Instead of a raw diff, the reviewer gets a change that the gates have made mechanically clean and the panel has triaged into ranked, evidence-backed findings. The reviewer no longer needs to catch what rules and agents already catch, and can focus on the judgments only a person can make. Is this change worth its risk? Does it fit the system’s design? Does it carry business context the agents never had? Are the important findings resolved, or only acknowledged?

Scale the depth to the tier: a T1 change needs one approver doing a light spot-check, a T2 change a full review with tech-lead sign-off, a T3 change two human reviewers plus architecture review when it changes a design boundary. The person who directed the agent is the change’s author and doesn’t count toward its reviewers. Review depth scales with risk, and the human decision is never delegated.

On AWS: Your existing pull request approval flow stays the baseline human gate. The panel’s verified findings land as review comments with a severity summary at the top, so the approver starts from a pre-triaged change. For T3 changes, require a second human reviewer before merge, and use your source provider’s approval rules to block approval by the requester. After merge, an AWS CodePipeline manual approval action adds a second recorded decision before production. It notifies approvers through an Amazon Simple Notification Service (Amazon SNS) topic routed to wherever they already work. Have the tooling that runs the agent, not the agent itself, write the provenance tag as commit trailers that record the agent, model, session, specification, standards version, and requester.

Architecture diagram of the pre-merge flow in AWS Cloud, where AgentCore Gateway serves standards to the developer environment and pipeline, deterministic gates run in CodeBuild, a four-seat AI review panel writes verified findings to an Amazon S3 store, and a Lambda policy gate and branch protection enforce tiered human review before merge

Figure 2: The pre-merge pipeline, where standards, deterministic gates, the verified review panel, and the policy gate run as pull request checks and branch protection enforces the gate and the tiered human review

Control 6: Post-merge verification and operations

The same logic extends after merge. Tests that ship with a change go through Controls 2 and 3 with the change. This control covers suite-improvement tests that an agent generates against existing code. Meta’s TestGen-LLM is an example. It admits a generated test only after the test clears filters showing that it measurably improves the existing suite. Admit these tests as you would untrusted contributions. They must build, pass reliably across repeated runs, and measurably improve the suite, through a coverage delta or a mutation score, before a human spends time on them. The filter removes tests that add nothing, but it can’t tell whether the asserted behavior is correct, because a test generated against existing code records what the code does today. That judgment belongs to a person, and it matters more here. A test that pins wrong behavior into the regression pack blocks the future change that fixes it. Tests that clear the bar join the regression pack that the deterministic gates run on every later change, so post-merge generation keeps strengthening the pre-merge gates. In operations, agents investigate on their own, reading telemetry, correlating signals, and proposing mitigation plans, while a person approves any remediation.

On AWS: Enforce the coverage or mutation threshold in a CodeBuild project that runs as an action in a dedicated stage of your CodePipeline. A generated test that doesn’t measurably improve the suite fails the build and never reaches the regression pack. This is the same mechanism as Control 2, pointed at a different signal. There, the build fails on lint, type, or SAST violations. Here, it fails on a coverage delta or mutation score that doesn’t clear the bar. For operations, AWS DevOps Agent fits this split. It’s read-only by default, investigating pipeline and operational failures and proposing mitigation plans for a person to approve.

Measuring whether it works

The research cited earlier found that AI review made decisions faster without making them better. Cycle time is the number most readily moved, and it can improve while quality degrades. Track review cycle time, because review is the constraint this approach exists to relieve, but only alongside the following quality measures. Avoid lines of code and pull request counts entirely, because they measure activity, not outcomes.

Measure instead:

  • Defect escape rate and rework rate – Bugs found after merge, and changes that need follow-up fixes.
  • Change failure rate and time to restore – The DevOps Research and Assessment (DORA) stability metrics, which show whether stability held as change volume grew.
  • Finding acceptance rate per panel seat – A falling rate means the seat is getting noisier, or that reviewers have stopped engaging with its findings. Check the seat first.
  • Panel recall – The share of escaped defects the panel would have flagged, found by replaying them through it. Acceptance shows what the panel gets right, and recall shows what it misses.
  • Changeset size drift – Agents will absorb ever-larger diffs if you let them. Keep changes small even as more of them are automated.
  • Cost per accepted finding – Model and compute spend divided by the findings that reviewers acted on, by seat and tier. It shows which seats earn their place and where tier policy should run fewer.

For the executive rollup, cost to serve software, defined as total delivery cost divided by units of value delivered, captures the whole system. Faster generation that creates more review burden shows up as a worse cost to serve. Pair cost to serve with tension metrics, such as security incidents and rollback rate, so the number can’t be improved by cutting controls. Developer experience work at Amazon reported a 15.9% year-over-year reduction on this measure in 2024.

On AWS: Measure from the signals the pipeline already emits instead of building a parallel system. Route CodePipeline and AWS CodeDeploy deployment events, plus your incident records, through Amazon EventBridge to AWS Lambda and into Amazon CloudWatch for the change failure rate and time-to-restore metrics. The DORA metrics sample is a useful reference for wiring this up. The review-quality metrics come from artifacts the pipeline already writes. Query the Control 4 findings store in Amazon S3 with Amazon Athena for acceptance rate per seat and changeset size drift. For that, the gate records each change’s tier and size in its report, and each finding’s outcome on the pull request (resolved or dismissed) is written back to the store. Defect escape and rework rates need one deliberate link. Tag post-merge defects and their follow-up fixes back to the commit that caused them, so the numbers attribute to a change.

Roll the executive view up in Amazon QuickSight, showing cost to serve software alongside the tension metrics that keep it from being gamed.

Architecture diagram of the post-merge flow, where an AWS CodePipeline re-runs backstop gates, admits generated suite tests, requires T3 manual approval before deploy, and uses AWS DevOps Agent for operations, while Amazon EventBridge, AWS Lambda, Amazon CloudWatch, Amazon Athena, and Amazon QuickSight produce delivery and review-quality metrics

Figure 3: The post-merge pipeline re-runs the gates, admits generated tests, adds the T3 approval before production, and feeds delivery and review-quality metrics

An incremental adoption path

Roll the pipeline out in stages instead of all at once. Each stage produces the evidence you need to trust the next. A baseline tells you whether anything improved, airtight deterministic gates show what the panel adds beyond rules, and an advisory panel shows whether its findings deserve to block.

  1. Baseline first. Capture defect escape and rework for four weeks before you turn anything on, or you will have no evidence story. Expect escape rates to lag, because defects surface weeks after merge. Rework moves sooner.
  2. Deterministic gates next. Get Control 2 airtight with the agent self-correction loop. This step alone keeps most mechanical defects out of human review.
  3. Add the panel selectively. Pick starter repositories with high pull request volume and moderate (T2) risk, where you get signal fast without affecting a critical system. In this phase, the panel is advisory. It posts findings but doesn’t block anything, because the policy gate isn’t wired yet. Use this window to confirm its value. Watch the finding acceptance rate, and check whether the panel surfaces real issues your reviewers were missing before you let severity block anything.
  4. Wire the policy gate only after the panel has earned trust. When acceptance rates are stable and engineers act on the findings, let severity block merges.
  5. Extend to tests and operations last.The same evidence can widen agent autonomy over time, for example letting the remediation agent fix verified findings in categories where the panel has proven reliable. Teams with long-established trust in their pipeline sometimes go further and auto-merge low-risk changes, as the Kiro Crew team describes.
Timeline of the staged rollout: a measurement baseline, deterministic gates, a selective AI panel, the policy gate, and then tests and operations, aligned to rising risk tiers from T1 to T3

Figure 4: The staged rollout, from a measurement baseline through deterministic gates, a selective AI panel, the policy gate, and finally tests and operations, aligned to rising risk tiers

The same pipeline, two changes

The following table follows a T1 change and a T3 change through all six controls. The pipeline is the same for both. What changes is autonomy and review depth.

Control T1: fix a broken link in the README T3: change refund-retry logic in the payments service
1. Standards Pulls the same standards, and the always-on security and compliance guardrails that are baseline config for every change
2. Deterministic gates Formatting and link-check run, pass, nothing to self-correct SAST, secrets, SCA, and IaC scans run. The agent self-corrects a flagged dependency, re-runs, and passes within the bounded loop
3. AI review panel Skipped by T1 policy, because the Control 2 link check already verified the fix Full panel runs with repository context. The security and correctness seats flag an auth-scope concern on the retry path, which is verified and passed to the gate
4. Policy gate T1 policy: no important findings, fast-path to a single approver T3 policy: an important finding blocks, oversized-diff check passes, routed for full review
5. Human review One approver, light spot-check, merge Two human reviewers, and the auth-scope finding must be resolved, not only acknowledged. T3 adds the CodePipeline manual approval before production
6. Post-merge Nothing further Agent-generated suite-improvement tests on the touched module must clear the coverage bar before a human looks. Operational signals are watched after deploy

Conclusion

AI coding agents are accelerating code generation and making code review the constraint. Adding an AI reviewer doesn’t remove that constraint on its own. Outcomes depend on how humans and agents are wired together. In this post, we showed a pipeline that wires them together to speed up review while reducing risk. Deterministic rules catch the first issues. A verified panel reviews what remains and emits a structured signal, a deterministic gate applies your risk-tiered policy to that signal, and a human makes the final call on a pre-triaged change. The same pattern extends to generated tests and operations.

Before you implement this pattern, read the predecessor post, Balancing speed and safety: a control framework for AI coding agents, which covers the author-time controls this pipeline assumes. To implement Controls 1 and 2, explore Kiro steering files and agent hooks. For broader control guidance, see the AWS Well-Architected Agentic AI Lens. If you try this pattern, tell us what you learn in the comments.

If you’re attending AWS re:Invent 2026, join us in the workshop SEC416, where participants get hands-on experience building out this pattern.


About the authors

Owen Hawkins

Owen Hawkins

Owen is a Principal Solutions Architect at Amazon Web Services, working with independent software vendors in the UK. Building on more than 20 years in information security and digital banking, he now spends his time on agent identity and on helping engineering organizations improve their software development lifecycle with AI-driven approaches.

Trevor Schiavone

Trevor Schiavone

Trevor is a Senior Solutions Architect at Amazon Web Services where he partners with enterprise customers to design and implement cloud and AI solutions. With over 10 years of experience spanning software engineering, cloud architecture, and artificial intelligence, he brings a practical, customer-driven perspective on how organizations can innovate responsibly with AI.

Chris Williams

Chris Williams

Chris is a Senior Solutions Architect at AWS, based in London, where he supports independent software vendors (ISVs). A software engineer by background, he has been building on AWS for over a decade, with over five of those years at AWS. He specializes in the software development lifecycle (SDLC), helping engineering teams improve how they plan, build, test and ship software. His work covers everything from CI/CD and infrastructure as code to AI coding assistants such as Kiro and the AI-Driven Development Life Cycle (AI-DLC). DevOps has always been his passion.

Using the AWS RMiT workbook and ISO Compliance Guides to support your BNM submissions

Post Syndicated from Jonathan Jenkyn original https://aws.amazon.com/blogs/security/using-the-aws-rmit-workbook-and-iso-compliance-guides-to-support-your-bnm-submissions/

Your next Bank Negara Malaysia (BNM) notification submission needs auditable evidence of how Amazon Web Services (AWS) controls align with Risk Management in Technology (RMiT) requirements. Two resources now exist to support that work: the AWS Workbook for BNM RMiT and the compliance guides published by AWS Security Assurance Services (AWS SAS).

The AWS Workbook for BNM RMiT, available through AWS Artifact, maps each RMiT provision to AWS Control Objectives (AWS responsibilities under the AWS Shared Responsibility Model) and AWS Well-Architected Framework best practices (your responsibilities). It tells you, for every RMiT requirement, what AWS is responsible for and what you implement.

The compliance guides published by AWS SAS over the past year provide implementation guidance for International Organization for Standardization (ISO) and International Electrotechnical Commission (IEC) standards that complements the workbook. These guides show how to implement controls that meet the requirements of specific standards and frameworks using AWS services, giving your technical and compliance teams a clear path from regulatory expectation to deployed architecture.

Malaysian financial institutions can now trace from BNM regulatory requirement, through AWS control implementation, to the evidence that demonstrates it: AWS third-party attestations for AWS-side controls, and your own workload evidence for customer-side controls. BNM expects this specificity in notification documentation.

AWS Workbook for BNM RMiT

The workbook is a structured Excel document available through AWS Artifact. For each of the 394 RMiT provisions, it identifies:

  • Whether the requirement is an AWS responsibility or a customer responsibility under the Shared Responsibility Model
  • The specific AWS Control Objective that addresses the requirement (where AWS is responsible)
  • The relevant AWS Well-Architected Framework best practice for customer implementation (where the customer is responsible)
  • Supporting information and references for each mapping

The following is a sample entry from the workbook:

RMiT Requirement Responsibility Source AWS supporting information
10.49: A financial institution should ensure network resilience… AWS AWS Control Objectives AWS Control Section: Network Security. AWS maintains redundant network connectivity with multiple tier-1 transit providers across each Availability Zone.
10.49: (Customer responsibility) Customer Well-Architected REL 2: How do you plan your network topology? Implement multi-AZ deployments. Configure VPC flow logs and use AWS Network Firewall.

The workbook currently includes 394 rows across all RMiT appendix requirements, with 208 mapped to AWS responsibilities and 186 to customer responsibilities.

Why this matters now

BNM revised RMiT guidelines effective 28 November 2025, and updated them on 25 September 2026 to add requirements for National Critical Information Infrastructure (NCII) entities. Financial institutions operating under both BNM Outsourcing and BNM RMiT must demonstrate that their cloud service providers maintain controls aligned with regulatory expectations. Institutions preparing notification submissions for material cloud workloads need auditable evidence of this alignment.

The revised guidelines set higher expectations for evidence quality. Institutions submitting notifications without clear, structured control mapping evidence might face extended review cycles and requests for additional information from BNM. Workloads that could be deployed in weeks remain in governance queues for months when supporting documentation lacks the specificity regulators expect.

Compliance guides from AWS Security Assurance Services

Start with the RMiT workbook to identify which provisions AWS addresses and which you implement. Then use the following compliance guides to design and implement your customer-side controls. The guides are implementation guidance for your teams. Audit evidence comes from two places. For AWS-side controls, use AWS third-party attestations, such as ISO certificates and System and Organization Controls (SOC) reports, available in AWS Artifact. For your workload, use evidence from your own environment, including configurations, logs, and AWS Config conformance pack results. Auditors can also use the guides as a reference for how a control is typically implemented on AWS.

AWS SAS has published five compliance guides over the past year. Each guide provides control-level implementation guidance on the customer side of the Shared Responsibility Model, showing how AWS services can be configured to meet the requirements of specific standards and frameworks. These guides were written by AWS SAS practicing security assessors and auditors holding Payment Card Industry Qualified Security Assessor (PCI QSA), Certified Information Systems Security Professional (CISSP), Certified Information Security Manager (CISM), ISO 27001 Lead Auditor, and Certified Cloud Security Professional (CCSP) certifications, drawing on experience from hundreds of cloud security assessments across financial services globally.

The following is the list of guides AWS SAS practicing auditors have published, which include control mapping information relevant to BNM RMiT:

How these resources work together

A Malaysian financial institution preparing a BNM notification can use these resources together:

  • The RMiT workbook identifies which RMiT provisions are AWS responsibilities and which are customer responsibilities.
  • For AWS responsibilities, the workbook references the specific AWS Control Objective.
  • AWS third-party reports in AWS Artifact, such as the AWS ISO/IEC 27001 certificate and SOC reports, attest to those AWS Control Objectives. For customer responsibilities, the ISO compliance guides show how to implement the corresponding controls using AWS services.
  • The ISO 31000 guide can inform the risk management methodology you apply to your cloud workloads.
  • AWS Config Conformance Packs for BNM RMiT provide automated, continuous monitoring of deployed controls.

Resources also supporting this approach:

Compliance teams across Association of Southeast Asian Nations (ASEAN) financial services have already begun referencing the AWS Guide to BNM RMiT and associated resources in their cloud risk assessment processes and BNM notification documentation.

Looking ahead: AI governance

For institutions deploying generative AI and machine learning, ISO/IEC 42001:2023 (Artificial Intelligence Management Systems) is relevant to BNM technology governance expectations. In November 2024, AWS became the first major cloud provider to announce ISO/IEC 42001 certification for AI services. AWS passed its first surveillance audit in November 2025 with zero findings. The ISO 42001 compliance guide published in May 2026 supports institutions building their own responsible AI systems on their side of the AWS Shared Responsibility Model.

How to get started

  • Access the RMiT workbook through AWS Artifact and review with your compliance lead to identify which provisions apply to your material cloud workloads.
  • Download the relevant ISO compliance guides to plan how you implement your customer-side controls. Download AWS ISO certificates and SOC reports from AWS Artifact for AWS-side evidence.
  • Map your workload-specific controls using the workbook as the RMiT baseline and the ISO guides as implementation guidance.
  • Implement automated compliance monitoring using the BNM RMiT conformance pack for AWS Config to maintain continuous visibility over your control posture.
  • Engage your AWS account team or AWS SAS for additional guidance on implementing customer-side controls referenced in the workbook.

As BNM updates its regulatory expectations, AWS will update these resources to reflect revised requirements. Subscribe to the AWS Security Blog for update notifications.

Additional resources

If you have questions about this post, contact AWS Support or start a new thread on AWS re:Post.


Jonathan-Jenkyn

Jonathan Jenkyn

Jonathan (JJ) is a Senior Security and Compliance Solutions Architect with AWS Security Assurance Services and a published cybersecurity author. He has over 30 years of experience across penetration testing, incident response, cyber resilience, and security governance. He helps customers build practical security programs. He champions disability inclusion and neurodiversity at Amazon. Outside work, he runs, cycles, swims, and enjoys family time.

Matthew Nixon

Matthew Nixon

Matt is a Principal in the AWS Asia Financial Services Security and Compliance team. He has 20 years of experience in technology risk, audit, and information security, including leading a cloud risk team in financial services. Matt co-founded an award-winning AI/ML startup, authored books on IT and cloud risk, and won the Singapore ISACA 2024 IT Risk Leader Award.

Four Continents, Four New AWS Heroes: Closing Out 2026

Post Syndicated from Taylor Jacobsen original https://aws.amazon.com/blogs/aws/four-continents-four-new-aws-heroes-closing-out-2026/

As AWS re:Invent is around the corner, we’re proud to recognize a new group of AWS Heroes. Every Hero finds their own way to give back, whether through sharing what they know, bringing people together, or building tools that help others succeed. What they have in common is a genuine commitment to supporting the builders around them learn, grow, and lead.

Let us take a moment to meet them!

Andres Moreno – El Paso, United States

Serverless Hero Andres Moreno leads the Cloud del Norte AWS User Group and is a former AWS Community Builder. On his blog, And More Dev, and at conferences and community events, he explains serverless, cloud native architectures, generative AI, and agentic systems in ways that make new technology easier to try. Andres puts special energy into supporting builders across Latin America and helping them explore what’s possible on AWS.

Geethika Guruge – Auckland, New Zealand

Community Hero Geethika Guruge is a Principal Consultant at Mantel Group whose work spans serverless, DevOps, cloud infrastructure, and agentic AI. Geethika has shared real lessons from building agentic applications and leading large migration and modernization programs at AWS re:Invent, AWS Summits, and AWS Community Days. At home in Auckland, Geethika organizes local AWS meetups that encourage grassroots innovation and mentors the next generation of cloud architects and leaders.

Jéssica Cristina Coelho – Belo Horizonte, Brazil

Data Hero Jéssica Cristina Coelho is a Database Reliability Engineer and a former AWS Community Builder with more than 15 years of experience in databases, cloud, and data engineering. She leads the AWS User Group in Minas Gerais, hosts DataTalks Brasil, teaches MBA courses, and supports Women in Cloud, DevOpsDays, and AWS Community Day events. She speaks at events such as AWS Summit São Paulo and Web Summit Rio on database modernization and generative AI. At AWS re:Invent 2025, she was recognized as a LATAM Diversity & Inclusion Champion.

Kazuho Cryer Shinozuka – Tokyo, Japan

DevTools Hero Kazuho Cryer Shinozuka is an AWS CDK Top Contributor and Trusted CDK Community Reviewer. With 200 merged pull requests, he ranks 18th among more than 1,700 contributors. He has reviewed more than 120 pull requests, has been involved in about 2% of all CDK commits, and has published 10 construct libraries, along with tools such as cfn idle cost. Through talks at JAWS DAYS and CDK Conference Japan and through hands on contribution workshops, he helps more developers in Japan start contributing to open source.

Learn More

To connect with these Heroes or find one in your region, explore the AWS Heroes webpage, and join the conversation on AWS Builder Center.

— Taylor

The collective thoughts of the interwebz