How Zillow runs 100 million daily notifications on AWS Step Functions

Post Syndicated from Nishita Kheur original https://aws.amazon.com/blogs/architecture/how-zillow-runs-100-million-daily-notifications-on-aws-step-functions/

Every day, Zillow sends home shoppers more than 100 million personalized email and push notifications: saved search alerts, home recommendations, property updates, seller reports, and reminders. These messages are one of Zillow’s core ways to engage home shoppers, and Zillow delivers them on time with consistent behavior across every campaign. Today, each of those notifications runs as its own short-lived workflow execution on AWS Step Functions Express Workflows.

The underlying shape of this work isn’t unique to real estate. Many systems run the same kind of workflow at high volume: take an event, enrich it from several services, apply rules, assemble an output, and send it. This post shows how Zillow built one configuration-driven orchestration system to run that pattern at scale, and what teams across many domains can reuse from it.

Historically at Zillow a separate generator service produced each of these campaigns, and each service carried its own workflow, data models, and business rules. As the number of notification campaigns grew, so did duplicated engineering work, inconsistent behavior, and operational cost. Product teams needed to launch campaigns faster, reuse shared capabilities, and run consistent experiments without system-specific work.

To meet that need, the Zillow Comms Experience team, working with AWS, built two things. The first is the Campaign Orchestrator, which is a configuration-driven orchestration layer that runs each notification as a short-lived workflow execution on Step Functions Express Workflows. The second is the Universal Content Generator (UCG), a library of reusable, schema-driven content modules that those workflows call. Together they make campaign creation faster and more consistent, and they give AI-assisted tooling a declarative format to work with.

The challenge: why the original system needed replacing

The previous content generation model slowed product delivery. Zillow’s Comms Experience supported more than 20 email and push campaigns generated by more than 10 microservices. Each microservice owned its own workflow, models, business rules, and assembly logic.

Most campaigns followed the same pattern: receive a trigger, hydrate data, apply rules, assemble content, and send the message. Each campaign service implemented that pattern separately, creating duplicate engineering work and inconsistent behavior. It also added operational overhead across releases, monitoring, logs, dashboards, and on-call support.

Each campaign was built as its own service because, when these systems were first built, scale was the main challenge. As Zillow added more products, the tradeoff changed. Similar features ended up implemented differently across campaigns, so every new capability had to be rebuilt and retested in each service. That made it hard to roll out features across products and slowed development. The push to centralize came from that cost: we needed to move faster and stay consistent across every customer experience. With one shared implementation, a feature could be built once and reused everywhere, while each campaign kept the flexibility to tailor its experience. Before evaluating workflow engines, we first had to extract shared logic into reusable modules and move campaign decisions into configuration.

The following diagram shows the original architecture, where each campaign generator carries its own copy of the workflow, data models, and business rules.
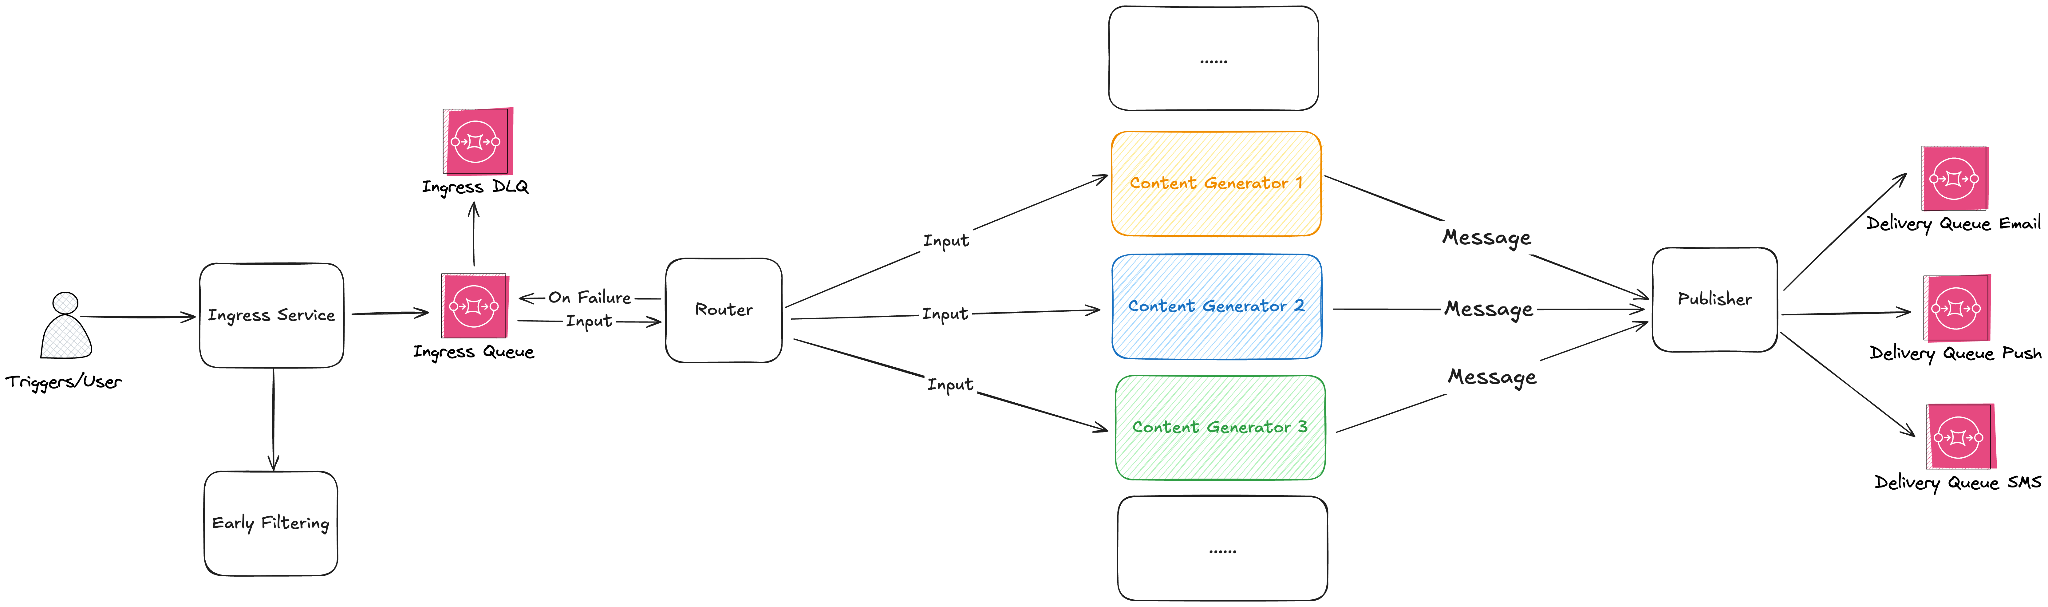
Original architecture: each campaign generator carries its own copy of the workflow, data models, and business rules

Figure 1: Original system

Competitive evaluation

We evaluated Temporal, Flowable, an in-house engine, and Step Functions Standard and Express Workflows against four criteria. Those criteria were reliability, total cost of ownership, development speed, and how well the service would scale across teams. The engine had to be managed, configuration-driven, and able to orchestrate both newer and older services. Pricing also had to fit our volume.

Temporal and Flowable would have added another infrastructure component to operate. That worked against two of our core goals: cutting the release, monitoring, and on-call overhead that the original system created, and getting pilot projects running quickly. Neither is available as a managed AWS service, so we would have had to run and scale them ourselves. Step Functions is serverless, so we had no servers or worker fleets to run, and a team could start a pilot without first setting up infrastructure. An in-house engine offered control but required custom lifecycle management, worker pools, queue integration, and monitoring. Step Functions met the core orchestration needs at roughly a quarter of the estimated build effort and a quarter of the ongoing maintenance effort. It was the clear choice for the minimum viable product (MVP).

Express mode compared with Standard mode

Our planning model assumed high-throughput, low-latency workflows. The MVP plan ramped from 14 million workflows per day to more than 100 million across all campaigns. At full scale that means several thousand executions per second at peak. Each workflow runs for only a few seconds, and a notification has to arrive while it’s still relevant. We evaluated both Step Functions execution modes, and for our use case Express Workflows were the better fit.

The following table shows how Standard and Express Workflows compared against our requirements for each key characteristic:

Zillow need Standard Workflows Express Workflows
High workflow volume Lower default start quota. Higher default start quota.
Low latency Optimized for durable, long-running workflows. Optimized for short-running workflows.
Execution guarantees Exactly once, which is stronger than needed. At least once, sufficient with idempotent modules.

Our workflows are high volume, short-lived, finish well within the five-minute Express limit, and are designed around idempotent module calls. We validated quota, latency, and operational behavior during the traffic ramp-up.

The architecture

Campaign Orchestrator is a configuration-driven workflow platform. Each message is input data combined with persisted campaign configuration. The configuration is relatively static for each workflow, while the input data stays flexible based on how the configured steps are assembled.

A shared orchestration layer reads queued campaign events, groups work where appropriate, and invokes the corresponding Step Functions Express Workflow for each campaign. Campaign metadata describes product constants, ownership, and Zillow environment features. Workflow configuration describes step topology, step-level configuration, mappings, branching, delay behavior, and send behavior.

The following JSON shows a simplified workflow input, combining the message payload with the platform, campaign, and configuration metadata that drive the workflow:

{
  "payload": {
    "trackingId123": {
      "recipientId": "user123",
      "homeIds": ["home1", "home2"]
    }
  },
  "platformMetadata": {
    "messageType": "email",
    "source": "savedSearch"
  },
  "campaignMetadata": {
    "campaignName": "saved_search_alert",
    "owner": "comms_experience"
  },
  "config": {
    "modules": ["user_profile", "property_data", "email_transformation"],
    "experiment": "cta_test"
  }
}

The following diagram shows the new architecture, where a single shared orchestration layer and one library of reusable modules serve every campaign. A message moves through the diagram from left to right. The ingress service queues it, and the router applies campaign controls and starts the workflow. Campaign Orchestrator runs the Step Functions steps, each step calls a UCG module, and the delivery service sends the result.
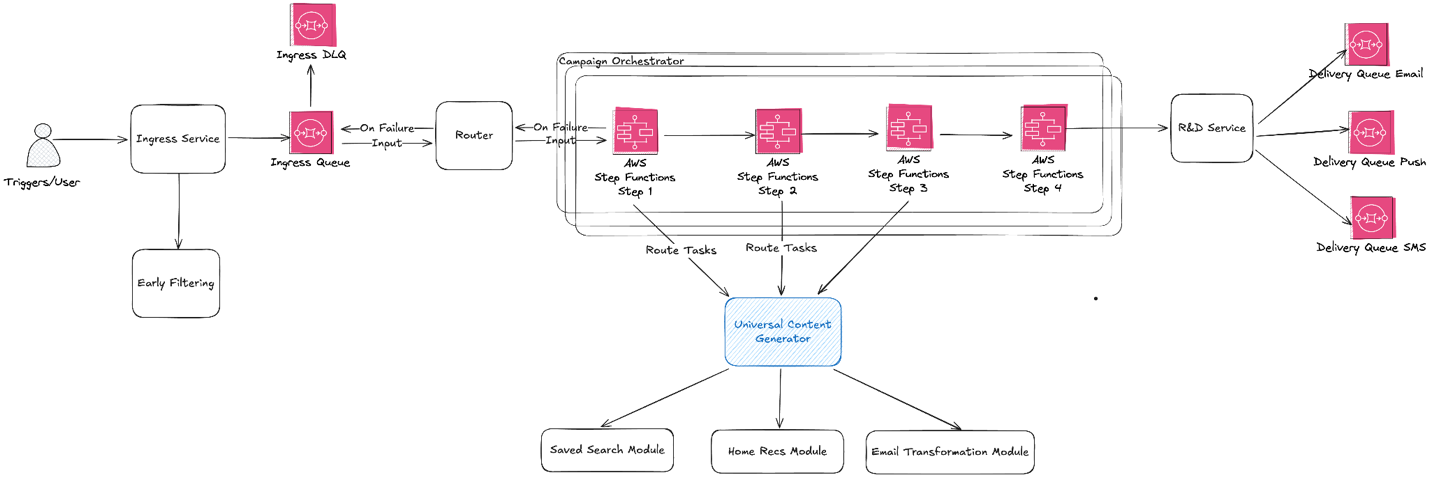
New architecture: a shared orchestration layer and one UCG module library serve every campaign from ingress to delivery

Figure 2: The new system

Router

Our campaigns need a set of controls applied before a workflow starts: queue polling, batching, idempotency checks, pause and resume behavior, replay coordination, speed control, and campaign routing decisions. Some of these controls are specific to how we order and throttle campaign sends, so they live outside Step Functions.

We centralized these controls in an in-house router service that reads from Amazon Simple Queue Service (Amazon SQS) and starts the right Step Functions workflow. Keeping them in one place gives us a single point to pause a campaign, replay a batch, or adjust send speed without changing any workflow definition.

Shared modules (UCG)

The Universal Content Generator is the modular content generation layer behind Campaign Orchestrator. Instead of each campaign owning a separate generator, UCG organizes shared capabilities into reusable modules. Before UCG, this logic was spread across more than 10 separate generators. Centralizing it in one service also smoothed its traffic. Some daily campaigns used to run for about four hours and leave their generator idle for the other 20. Now all campaigns share one fleet, so the load spreads across the day.

Modules handle capabilities such as property hydration (loading listing details such as price, photos, and address for each home in a message), hidden homes (listings a user has chosen to hide, which we filter out of notifications), common data (the subscriptions, saved homes, eligibility flags, and propensity scores every campaign loads for a recipient), recommendations, A/B testing, and content assembly. They are stateless and schema-driven.

Direct service invocation with HTTP Invoke

A key design choice was to call UCG directly through Step Functions HTTP Invoke. This fits the workload for two reasons. First, our content generation logic already ran as long-lived containerized services inside our private service environment, with network access, service discovery, and authentication established. Second, routing workflow steps to UCG added no new compute cost.

With Step Functions HTTP Invoke, we call UCG modules for data hydration, rule checks, and content assembly as they already run. Authentication runs through an Amazon EventBridge connection. Each HTTP Invoke task points to the connection with a ConnectionArn. The connection holds an API key, and UCG checks that key on every request. Amazon EventBridge keeps the key in AWS Secrets Manager and adds it to the request at call time. The workflow definition never contains the key, and neither does our application code. When the key rotates, we rotate it once in the connection and every workflow picks it up.

To avoid repeating the same HTTP Invoke settings in every workflow, we introduced component inheritance. Components are written in a slightly modified version of the Step Functions task definition we deploy through AWS CloudFormation. A base component holds the settings that many steps share, and other components extend it. The following base component, content_module_call, defines how every workflow step calls UCG services directly through HTTP Invoke: the resource, method, headers, and the ConnectionArn for the connection described earlier.

{
  "Type": "Task",
  "Resource": "arn:aws:states:::http:invoke",
  "Arguments": {
    "ApiEndpoint": "{% '${contentServiceEndpoint}' & '/modules/' & $moduleId %}",
    "Method": "POST",
    "Headers": {
      "Content-Type": "application/json"
    },
    "InvocationConfig": {
      "ConnectionArn": "${connectionArn}"
    }
  }
}

Business modules extend the shared HTTP component and supply only the module endpoint. Before deployment, our build script replaces each component with a standard Task state: it loads the component named in Extends, merges the step’s own fields on top, and writes the result into the Terraform we deploy. Workflow definitions stay focused on product intent rather than network plumbing:

{
  "Type": "Component",
  "Extends": "content_module_call",
  "Arguments": {
    "ApiEndpoint": "{% '${contentServiceEndpoint}/modules/profile_module' %}"
  }
}

Configuration abstraction layer

Step Functions state machine definitions, JSONata expressions, and infrastructure definitions are powerful, but they are not the right interface for every campaign owner. We added a higher-level configuration layer so campaign owners can define their own workflows without having to understand Step Functions CloudFormation configuration. Each campaign config describes a workflow: which modules run, in what order, and how data moves between them. The system translates that config into the Step Functions definition and CloudFormation template that gets deployed. Campaigns don’t share one generic workflow that picks modules at runtime. Each campaign gets its own workflow, built from the same shared modules and components. As a next step, we are considering a generic workflow that assembles modules in real time from config. Each campaign would still run its own copy of that workflow, so ownership stays isolated per campaign.

Campaign owners specify the modules needed for an email template or push notification. Each module exposes input, output, and configuration schemas. Campaign owners define module outputs to satisfy the template input schema. Module inputs define what triggers need to provide.

With this structure, campaign owners onboard through a declarative process. They work with configuration instead of raw workflow code or JSONata expressions. They can also run controlled experiments and give AI tools a format they can inspect, generate, and modify with appropriate validation.

The following simplified A/B test config is adapted from a real Campaign Orchestrator config. It injects an A/B test module before email transformation and maps the experiment result into the next step without directly touching Step Functions or CloudFormation definition.

{
  "steps": [
    { "module": "profile" },
    { "module": "property_data" },
    { "module": "experiment", "experiment": "cta_variant_test", "before": "assemble_email" },
    { "module": "assemble_email", "inputs": { "variant": "experiment.result" } }
  ]
}

Because a campaign is declared as schema-validated configuration, the same contracts that protect human changes also apply to AI-assisted tooling. Our internal assistants already draft module selections and mappings from a product brief, and the output must pass the same schema checks, JSONata tests, and Step Functions validation before it can be deployed.

Batch mode optimization

Campaign Orchestrator supports batching, which improves overall throughput while reducing cost. Instead of launching one workflow per message, the router can group messages and invoke one workflow for the batch.

For example, processing 100 messages individually could produce 100 workflow executions and 400 HTTP requests to UCG services. With batching, the same messages can be processed in one workflow with four HTTP requests, assuming each step supports bulk input and output. That matters at our volume for two reasons. Express Workflows charge for each request and for run time. Batching cuts the number of requests, but each batch runs longer. A rule of thumb: a batch of 10 messages costs less than 10 separate runs as long as it takes no more than 10 times as long as one run. In the preceding four-step example, one message takes about 1.2 seconds, so a batch of 10 saves money if it finishes within 12 seconds. In practice, a batch runs only 10 to 20 percent longer than a single message, about 1.4 seconds instead of 12. That makes a batch of 10 about 90 percent cheaper than 10 separate runs. The batched payload stays under the 256 KiB limit, so memory is still billed at the 64 MB minimum. Fewer executions and HTTP requests also use less of the StartExecution rate, HTTP Invoke concurrency, and logging throughput we size for. That leaves headroom to send more notifications on the same quotas.

The batching model appears in the Step Functions definition and JSONata expressions. This simplified example shapes a batched payload into a bulk UCG request while preserving each tracking ID:

{
  "campaignName": $campaignMetadata.campaignName,
  "messages": $map($keys($states.input.payload), function($trackingId) { (
    $message := $lookup($states.input.payload, $trackingId);
    {
      "trackingId": $trackingId,
      "recipientId": $message.recipientId,
      "homeIds": $message.homeIds,
      "config": $config.propertyHydration
    }
  ) })
}

Batching works only if every step in the workflow can handle a batch rather than a single message. For UCG, that requirement is built into the module API. Each module’s schemas define its input, output, and config models, and the module API accepts those models as a batch keyed by tracking ID. A module that doesn’t follow that API won’t build. Our JSONata mappings and upstream and downstream service contracts already accepted bulk input internally, so adding batching didn’t require reworking them.

Batching also can’t cost us visibility into individual messages. Because each batch is keyed by tracking ID, as the preceding example shows, UCG returns a result from each module for each tracking ID. The router uses those per-message results to deliver, retry, or drop each message individually, so one failed message doesn’t fail the whole batch.

The following diagram shows how the router groups messages into a single batched workflow execution.
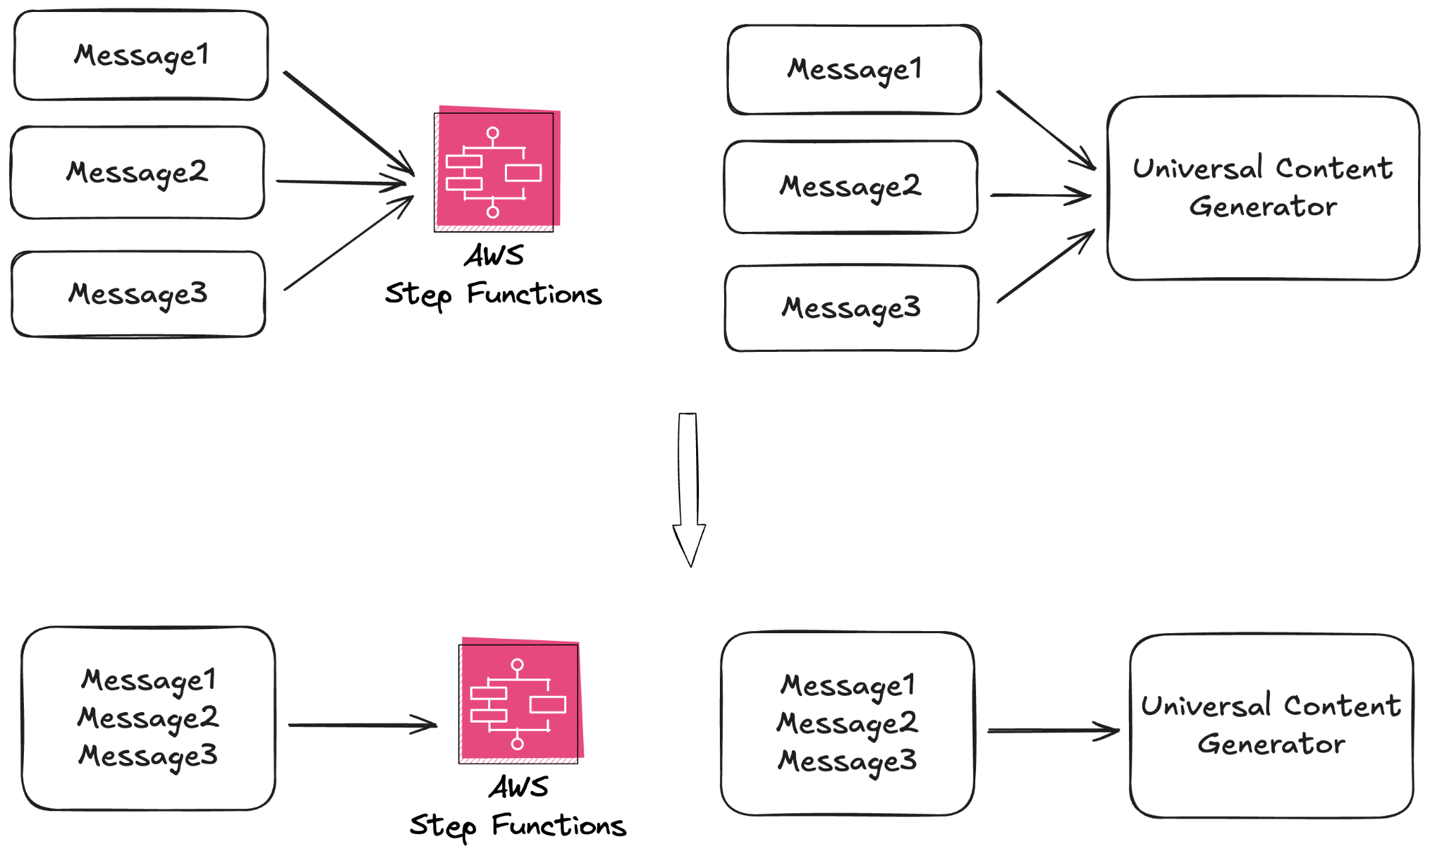
Router grouping multiple messages into a single batched Step Functions workflow execution

Figure 3: Batching mode

Scaling: Performance and organizational

At our target throughput, service quotas are part of the architecture. We reviewed Step Functions StartExecution rate limits, HTTP Invoke concurrency, and Amazon CloudWatch logging throughput before traffic ramped. HTTP Invoke concurrency needed attention first, because its default quota is lower than the rate at which Express Workflows can start. We sized the required concurrency from our capacity model and worked with AWS to raise the quota before each rollout phase, so throughput limits never gated the traffic ramp.

We planned the rollout in phases, from early traffic to more than 100 million daily executions. With this approach, we could validate cost, quotas, latency, and operations before full scale.

The architecture also supports organizational scaling. Product teams own campaign modules, steps, configuration, and the Step Functions cost tied to their traffic, so they can launch and change campaigns without waiting on the central team. Central teams own shared infrastructure such as the router service, Step Functions patterns, Amazon SQS integration, and deployment tooling, so one improvement reaches every campaign.

Shared code doesn’t mean shared failure. Every campaign’s Express state machine is generated from the same templates and modules, so isolation adds no duplicate code. Each campaign still runs its own state machine and its own Amazon SQS queue, and the router gives each queue its own polling threads, worker pool, and circuit breakers. When one campaign fails or backs up, only its own breaker trips, and we can pause its queue without touching the others. A traffic spike or downstream failure in one campaign doesn’t become a noisy neighbor for the rest.

Testing

Configuration-driven workflows require strong validation because much of the behavior lives in JSONata expressions and campaign configuration. We keep shared JSONata expressions in dedicated files and require unit tests for them. These tests are not offline string evaluations. The test runner builds a small Step Functions state and executes it through the Step Functions TestState API, validating expressions against the same runtime used by Step Functions.

For example, this shared user profile expression converts a batch of campaign messages into UCG module requests:

$merge(
  $map(
    $keys($filteredInputPayload),
    function($trackingId) { (
      $message := $lookup($filteredInputPayload, $trackingId);
      {
        $trackingId: {
          "input": {
            "userIdentifier": {
              "id": $string($message.userId),
              "idType": "USER_ID"
            }
          },
          "config": $config.userProfileConfig,
          "metadata": {
            "campaignName": $campaignMetadata.campaignName,
            "environment": $config.environment
          }
        }
      } )
    }
  )
)

The workflow references the tested expression through our custom JSONata reference:

{
  "UserProfileModule": {
    "Type": "Component",
    "Extends": "user_profile_ucg_module",
    "Arguments": {
      "RequestBody": "{% @jsonata:mappings/profile_request %}"
    },
    "Assign": {
      "userProfileOutput": "{% $states.result.ResponseBody.outputs %}"
    }
  }
}

Every test case for the expressions we reference through @jsonata runs through the TestState API in continuous integration (CI), and a failing case blocks the deploy. With this approach, teams get reusable mappings and can reduce the risk of malformed payloads, runtime expression errors, or configuration changes that fail inside Step Functions.

Conclusion: Measured impact

The largest impact of the new architecture is product velocity. By replacing repeated custom engineering with reusable modules and configuration-driven workflows, Zillow shortened development cycles for new products and features, opened up greater self-service, and reduced cross-team dependencies. Teams now iterate through configuration, shared modules, and validated JSONata mappings instead of building or modifying a dedicated generator for each idea.

In the original system, testing a new variant or launching a campaign meant changing a dedicated generator service, and often several. Now a team edits a config, reuses modules other teams have already built, and validates the workflow before it reaches production.

The orchestration service also reduced workflow engine build and maintenance cost. Zillow’s internal engineering estimates put the build at 9 development weeks, down from 32 for a comparable in-house engine. Ongoing maintenance fell along the same lines, from roughly 8 hours per week to 2. We sized the system to scale from early traffic phases to more than 100 million workflows per day.

Most of what made this work can be reused by teams with high-volume, short-lived workflows: describe each message as input data plus configuration, keep modules stateless and tested, make every step accept batches, and plan service quotas before traffic ramps. Step Functions Express made those practices practical to run at Zillow’s scale.

To try this pattern yourself, start with the AWS Step Functions Developer Guide and the guidance on choosing between Standard and Express Workflows. You can also install the Agent Toolkit for your coding agent. For the direct service invocation described in this post, see calling third-party APIs with HTTP Task. To validate JSONata expressions the way we describe here, see the TestState API reference. Review Step Functions service quotas before you plan a traffic ramp.
About the authors

Nishita Kheur

Nishita Kheur

Nishita Kheur is a Senior Technical Account Manager at AWS based in Seattle. She works with enterprise customers to build scalable, cost-efficient cloud architectures and adopt generative AI, with a focus on operational excellence. She enjoys digging into complex technical problems and turning them into practical solutions that help customers innovate faster in the cloud.

Yuzhong Li

Yuzhong Li

Yuzhong is a founding member and tech lead of Zillow Group’s Product Comms System, where he guides the technical strategy and architecture for Zillow’s next-generation, AI-ready communications platform. He specializes in large-scale distributed systems, serverless workflow orchestration, and configuration-driven architectures that both engineers and AI agents can build on. He is passionate about simplifying complex systems so teams can quickly and safely deliver AI-powered customer experiences, from model-driven recommendations to LLM-generated content.

Optimizing Apache HBase availability on Amazon EMR, Part 2: Diagnose and tune compaction

Post Syndicated from Reekunj Parmar original https://aws.amazon.com/blogs/big-data/optimizing-apache-hbase-availability-on-amazon-emr-part-2-diagnose-and-tune-compaction/

This post shows you how to diagnose and tune compaction in Apache HBase on Amazon EMR. Compaction is the background process that merges store files. When it competes with your workload during peak hours, you can see higher read and write latency, write stalls, and RegionTooBusyException errors. Amazon EMR on Amazon Simple Storage Service (Amazon S3), you can also see more 503 Slow Down responses when you increase your cluster’s request rate.

This is the second post in a two-part series on operating Apache HBase on Amazon EMR:

  • Part 1 covers the three-level troubleshooting model and three availability issues: an HBase coordinator that doesn’t finish initializing, a RegionServer that stops unexpectedly, and HBase regions that stay in transition (RIT).
  • Part 2 (this post) covers performance: how to confirm that compaction is the cause, which parameters to tune first, and when to contact AWS Support.

This post covers the following:

  • How compaction affects performance.
  • How to confirm whether compaction is causing the latency.
  • The compaction parameters to tune, their defaults, and what each one does.
  • Practices that reduce compaction work.
  • When to stop and contact AWS Support, and what to bring to a support case.

This post doesn’t cover the following:

  • Coordinator startup, RegionServers that stop unexpectedly, and regions in transition, which are covered in Part 1 of this series.
  • Compaction algorithm internals or writing custom compaction policies.
  • Schema design and row key distribution (the Practices that reduce compaction work section covers how they affect compaction).

This post is for operations teams, data engineers, HBase administrators, and site reliability engineers (SREs) who see recurring latency spikes, write stalls, RegionTooBusyException errors, or high Amazon S3 request rates during compaction on HBase on Amazon EMR.

Terminology

Apache HBase names the process that coordinates the cluster HMaster, and Amazon EMR runs it on the primary node. This post refers to it as the HBase coordinator. Names that contain master, such as the hbase-master service and the hbase-hbase-master-*.log log files, appear only in commands and log output, where you need the exact name.

In HBase, a region is a range of rows in a table, and a RegionServer is the process that serves regions. Neither is related to an AWS Region.

Prerequisites

  • Read Part 1 of this series, in particular the Three levels of troubleshooting and Quick reference sections.
  • Confirm that you have access to the HBase web UI (coordinator on port 16010, RegionServer on port 16030).
  • Confirm that you have SSH access to the primary and core nodes.
  • Know whether your cluster uses Hadoop Distributed File System (HDFS) or Amazon S3 as its storage mode, and how to apply configuration changes through the hbase-site classification in Amazon EMR. For storage-mode specifics, see HBase on Amazon S3.
  • Be familiar with minor and major compaction in HBase.

How compaction affects performance

By default, HBase runs a major compaction roughly every seven days and uses a jitter factor of 0.5 to spread the start times so that HBase regions don’t all compact at once. For guidance specific to Amazon EMR, see the HBase best practices in the Amazon EMR best practices guide.

Major compaction reads and rewrites all store files in a region. It improves read performance and removes deleted and expired cells, but when it runs during peak hours it competes with client requests and can increase latency. Tuning compaction means controlling when major compaction runs and how much I/O it uses.

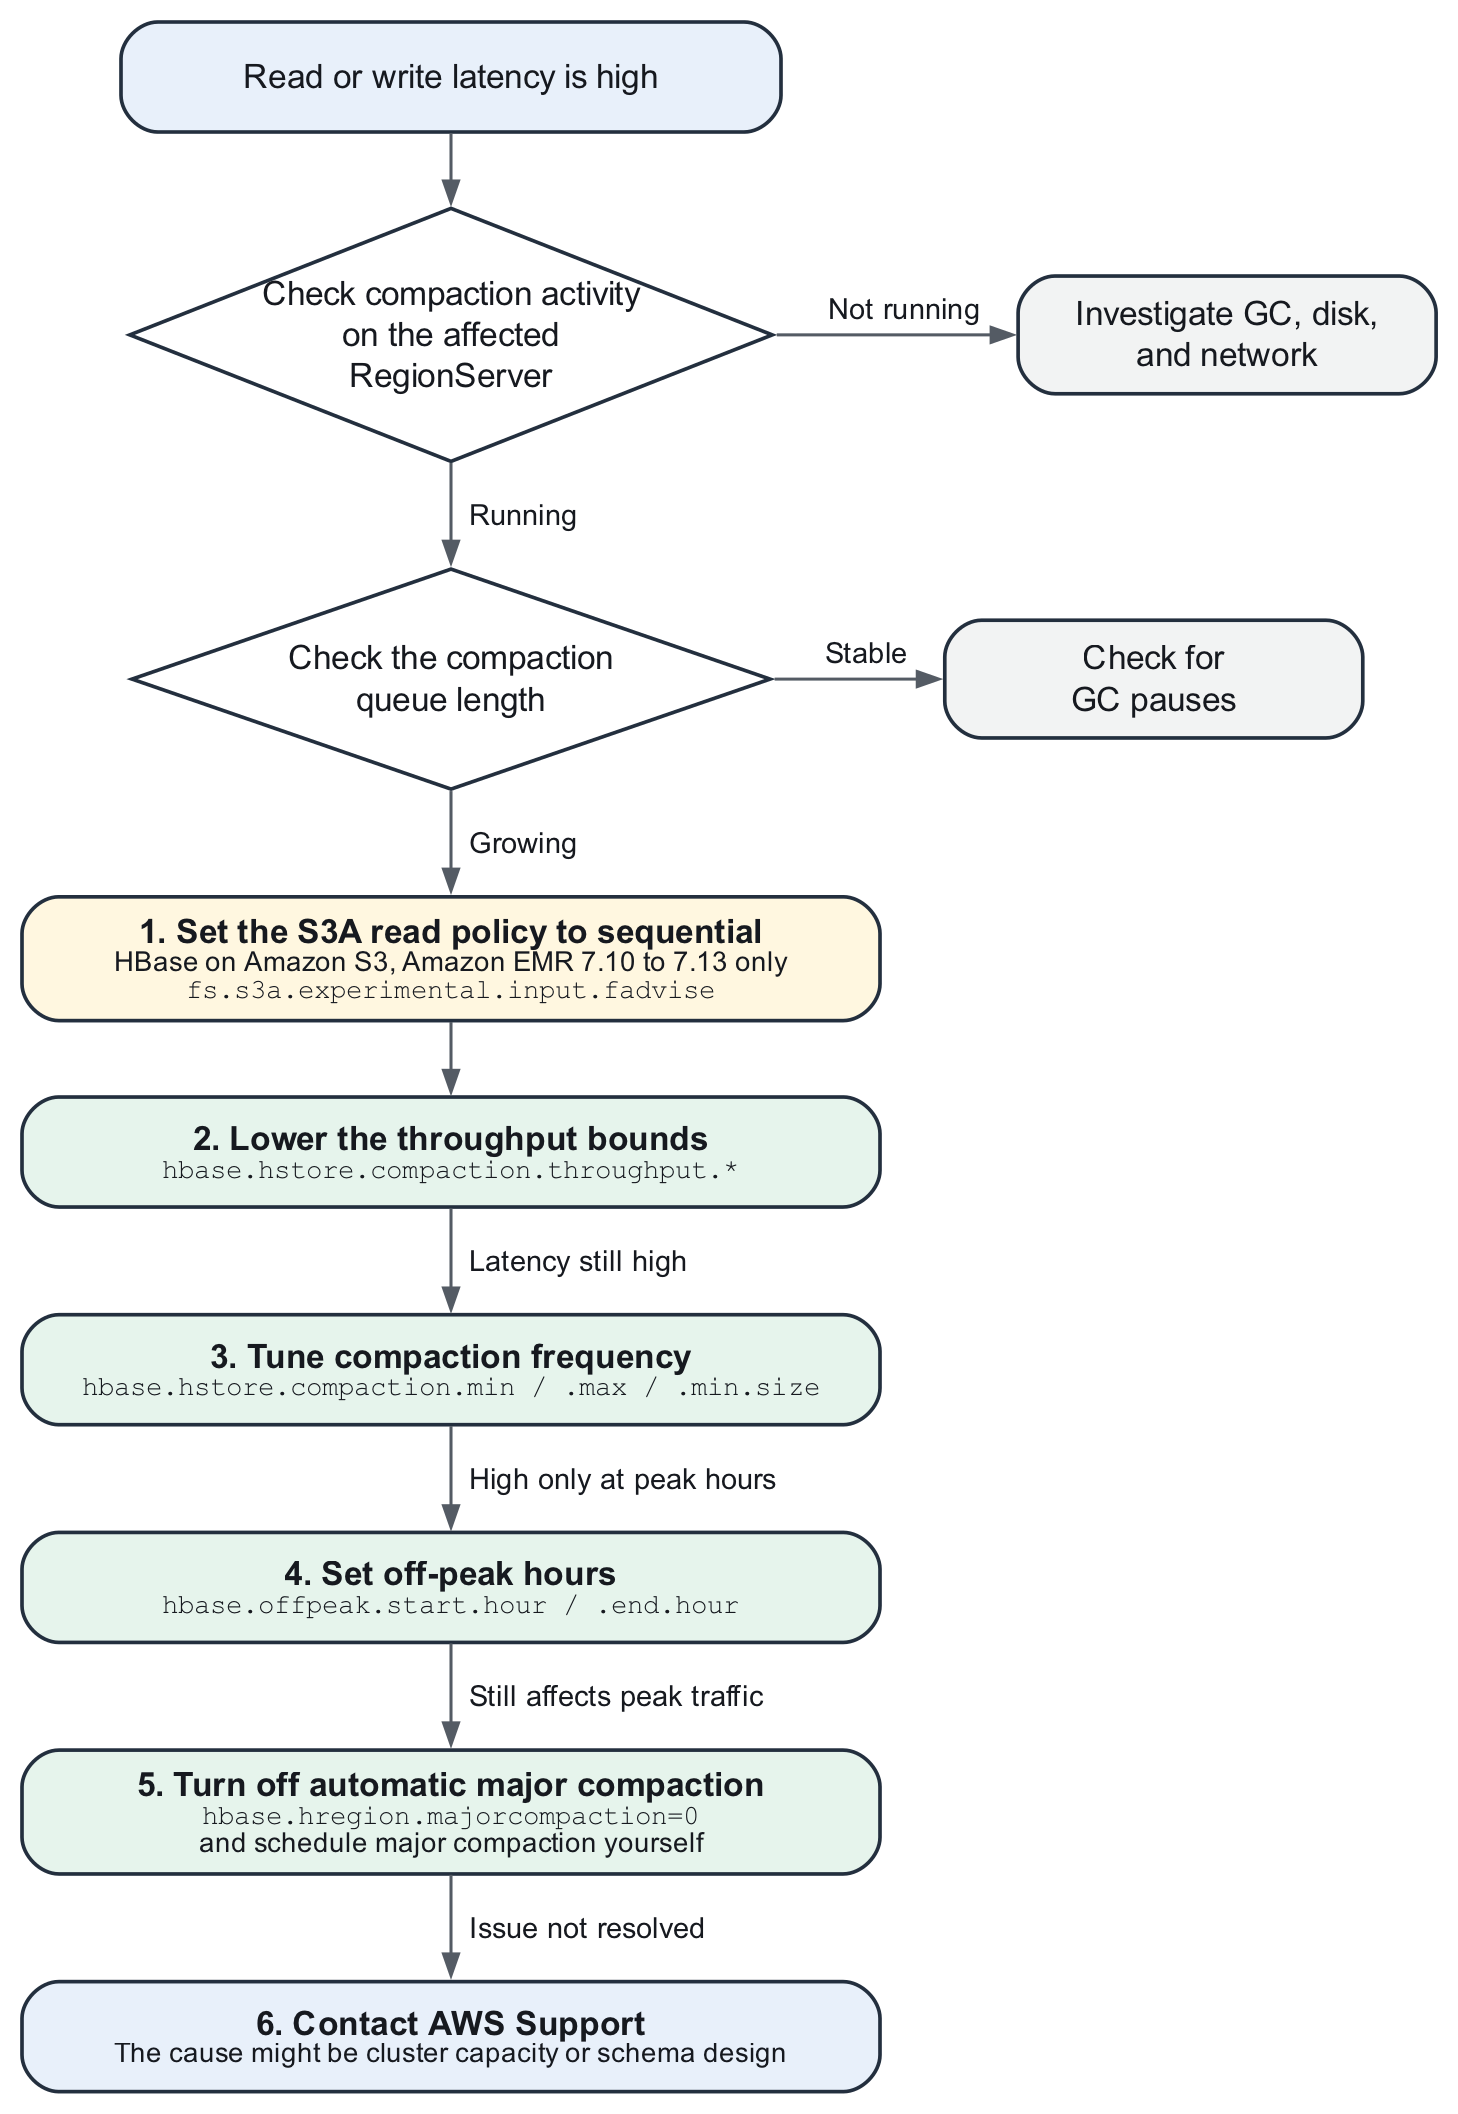
Compaction decision flow

Before you change any parameters, use the following decision flow to identify the cause.

Compaction decision flow diagram showing how to confirm compaction pressure and the six tuning steps to work through in order

Figure 1: Compaction decision flow

The flow has the following steps:

  • If latency is high, check whether compaction is running on the affected RegionServer. If it isn’t, investigate garbage collection (GC), disk, and network instead.
  • If compaction is running, check whether the compaction queue is growing. If it isn’t, check for GC pauses.
  • If compaction is running and the queue is growing, work through the following steps in order:
    1. On HBase on Amazon S3 with Amazon EMR 7.10 to 7.13, set the S3A read policy to sequential before you change any compaction parameter. See Step 3 in Diagnose compaction pressure.
    2. Lower the throughput bounds (hbase.hstore.compaction.throughput.*) to reduce the I/O that compaction takes from client requests. The queue can grow while the limit is lower. HBase removes the limit when any store reaches hbase.hstore.blockingStoreFiles, so the limit doesn’t keep a store at the blocking threshold.
    3. If latency is still high, tune compaction frequency (hbase.hstore.compaction.min, hbase.hstore.compaction.max, and hbase.hstore.compaction.min.size).
    4. If latency is high only during peak hours, set off-peak hours (hbase.offpeak.start.hour and hbase.offpeak.end.hour) so that more compaction work runs outside them.
    5. If compaction still affects peak traffic, turn off automatic major compaction (hbase.hregion.majorcompaction=0) and schedule it yourself.
    6. If none of these steps resolves the issue, contact AWS Support. The cause might be cluster capacity or schema design.

Note: Changing the previous configuration requires EMR HBase Restart. For reconfiguration behavior, refer to Reconfiguration behaviors in the Amazon EMR Management Guide.

Signs of compaction pressure

The following symptoms indicate compaction pressure. They don’t all appear at once. Start with the first two, because you can confirm them in the HBase web UI:

  • Read and write latency rises on some RegionServers but not others. The affected set changes over time as different regions reach their compaction window.
  • The compaction queue length on the affected RegionServer keeps increasing.
  • Long-running reads (report generation, Apache Spark table scans) pause and then resume.
  • Clients receive RegionTooBusyException, call timeouts, or retries. The RegionServer log shows Region is too busy due to exceeding memstore size limit warnings for the same regions.
  • Writes stall periodically. When a store reaches hbase.hstore.blockingStoreFiles store files, HBase delays MemStore flushes until compaction reduces the count, for up to hbase.hstore.blockingWaitTime (90 seconds by default). If the MemStore exceeds hbase.hregion.memstore.flush.size multiplied by hbase.hregion.memstore.block.multiplier in the meantime, HBase blocks updates to the region.
  • On HBase on Amazon S3, more requests return 503 Slow Down when the request rate from your cluster to an Amazon S3 prefix is high. These responses ask your cluster to reduce its request rate. Compaction reads and rewrites store files in Amazon S3, so it adds to that rate.
  • On Amazon EMR 7.10 to 7.13 with HBase on Amazon S3, compactions, scans, and bulk loads run slower than expected and the number of HFiles keeps increasing. See Step 3 in Diagnose compaction pressure.
  • The pattern recurs on a weekly rhythm, which matches the default seven-day major compaction interval.

Diagnose compaction pressure

Work through the following steps in order. Step 1 uses the HBase web UI (Level 1). Steps 2 and 3 use logs, operating system tools, and configuration files (Level 2). None of these checks change the cluster.

Step 1 (Level 1): Check the HBase web UI

  • In the HBase web UI, sort RegionServers by request count and by store file count to find the outliers. A server with a much higher store file count might be running, or waiting for, a compaction.
  • On the RegionServer web UI of an affected server, check the compaction queue length and store file count per region. A queue that keeps growing means compaction can’t keep up with your write volume, so add capacity or tune your configuration.
  • Check the BlockCache hit rate. A lower hit rate also increases latency. On HBase on Amazon S3, RegionServers cache reads in the BlockCache (memory) and the BucketCache (local disk). A cache miss reads the store file from Amazon S3, which has higher latency than a local read. If the hit rate dropped when compaction started, compaction might be replacing frequently read data in the cache.

Step 2 (Level 2): Check the logs and the operating system

Confirm that compaction is running, and on which HBase regions:

grep -E "Starting compaction|Completed (major )?compaction|too many store files" \
/var/log/hbase/hbase-hbase-regionserver-*.log | tail -40

Rule out GC as the cause, because heavy compaction and heap pressure look the same to clients:

grep -E "JvmPauseMonitor|Detected pause in JVM" \
/var/log/hbase/hbase-hbase-regionserver-*.log | tail -20

Check CPU, memory, and disk usage on the host:

free -m                  # check free memory
top -b -n1 | head -20    # CPU
df -h                    # disk capacity

Use the canary tool to measure read latency per HBase region. The tool writes its results to the console and to /var/log/hbase/hbase.log. Save the output as a baseline to compare against after each change:

sudo -u hbase hbase canary my_table

Check the store file layout of the table to see whether it has many small files (from frequent flushes) or a few large ones. Store files are under the HBase root directory, which is in HDFS or Amazon S3, depending on your storage mode. On HBase on Amazon S3 with Amazon EMR 7.4 and later, HBase tracks the store files it reads in a meta file in each store directory instead of relying on directory listings, so use the store file count in the RegionServer web UI as the count of active files:

grep -A1 hbase.rootdir /etc/hbase/conf/hbase-site.xml   # find the HBase root directory
sudo -u hbase hbase hfile -f <hbase.rootdir>/data/default/my_table/<region>/<cf>/<hfile> -m -s

Step 3 (Level 2): Check the S3A read policy (Amazon EMR 7.10 to 7.13)

Starting with Amazon EMR 7.10, HBase on Amazon S3 uses the S3A file system client, and fs.s3a.experimental.input.fadvise defaults to normal. In this mode, S3A can switch to a random read policy even when HBase continues to read sequentially, which slows compactions, scans, and bulk loads. Use the recommended setting for Amazon EMR 7.10, 7.11, 7.12, and 7.13. The symptoms are similar to compaction pressure: slow compactions, an increasing number of HFiles, and blocked flushes that return RegionTooBusyException.

Check the release label and the current setting:

aws emr describe-cluster --cluster-id <cluster-id> --query 'Cluster.ReleaseLabel'
grep -A1 fs.s3a.experimental.input.fadvise /etc/hbase/conf/hbase-site.xml

If the release is 7.10 to 7.13 and the property isn’t set, or is set to normal, set it to sequential in the hbase-site classification before you tune compaction. Changing the setting requires a restart, so it’s a Level 3 action:

[
    {
        "Classification": "hbase-site",
        "Properties": {
            "fs.s3a.experimental.input.fadvise": "sequential"
        }
    }
]

Apply the setting to hbase-site.xml on all nodes, then restart the HBase coordinator and RegionServer processes. Setting the property on individual commands instead doesn’t improve compaction and scan performance. For more information, see HBase on Amazon S3 in the Amazon EMR Release Guide.

Compaction tuning parameters

The following table lists the compaction parameters that this post covers. Apply changes through the hbase-site configuration classification in Amazon EMR. Changing these parameters is a Level 3 action. Change one parameter at a time and compare the results with the canary baseline from Step 2, because several of these parameters interact.

Note: The Amazon EMR column lists defaults from the HBase on Amazon S3 documentation. Where a default isn’t listed there, check the effective value in /etc/hbase/conf/hbase-site.xml on your cluster, and verify component versions on the Amazon EMR release components page. For example, hbase.hstore.blockingStoreFiles is 16 in Apache HBase 2.x, but Amazon EMR sets it to 10 for HBase on Amazon S3.

Parameter What it does Apache HBase 2.x default Amazon EMR default (HBase on Amazon S3)
hbase.hstore.compaction.throughput.higher.bound Upper limit on compaction throughput per RegionServer when store file pressure is high. 104857600 (100 MB/s) Not listed
hbase.hstore.compaction.throughput.lower.bound Lower limit on compaction throughput per RegionServer when store file pressure is low. 52428800 (50 MB/s) Not listed
hbase.hstore.compaction.min Minimum number of eligible store files before a minor compaction runs. If it isn’t set, HBase uses hbase.hstore.compactionThreshold. 3 Not listed
hbase.hstore.compaction.max Maximum number of store files included in a single minor compaction. 10 Not listed
hbase.hstore.compaction.min.size HBase always considers store files smaller than this size eligible for minor compaction. 134217728 (128 MB) Not listed
hbase.hstore.compaction.ratio Size ratio that decides which larger files are included in a minor compaction. 1.2 Not listed
hbase.hstore.blockingStoreFiles Number of store files in a store at which HBase delays MemStore flushes, for up to hbase.hstore.blockingWaitTime (90 seconds), until compaction reduces the count. 16 10
hbase.hregion.memstore.flush.size MemStore size, in bytes, at which HBase flushes to a new store file. 134217728 (128 MB) 134217728 (128 MB)
hbase.hregion.memstore.block.multiplier HBase blocks updates when a MemStore exceeds the product of hbase.hregion.memstore.flush.size and this value. 4 4
hbase.hregion.max.filesize Region size at which HBase splits the region. 10737418240 (10 GB) 10737418240 (10 GB)
hbase.offpeak.start.hour hbase.offpeak.end.hour Off-peak window (hours 0–23). During this window, the larger hbase.hstore.compaction.ratio.offpeak (default 5.0) applies, and compaction throughput isn’t limited unless you set hbase.hstore.compaction.throughput.offpeak. -1 (no off-peak window) Not listed
hbase.hregion.majorcompaction Time between automatic major compactions, in milliseconds. 0 turns off automatic major compaction. 604800000 (7 days) Not listed
hbase.hregion.majorcompaction.jitter HBase uses this value to spread major compaction start times so that Regions do n’t all compact at once. 0.5 Not listed
hbase.bucketcache.size Local disk space, in MB, on each RegionServer for the BucketCache (instance store and Amazon Elastic Block Store (Amazon EBS) volumes). Not set 8,192 MB
fs.s3a.experimental.input.fadvise S3A read policy for HBase on Amazon S3. See Step 3 in Diagnose compaction pressure. Not applicable normal (7.10 and later)

Warning: If you turn off automatic major compaction (hbase.hregion.majorcompaction=0), you are responsible for scheduling it. Minor compactions still merge store files, but delete markers and deleted cells stay in store files until a major compaction runs. This slows reads and delays reclaiming storage. If you turn it off:

  • Schedule major_compact yourself, per table, in a maintenance window. Run it on the primary cluster only, because read-replica clusters must not run manual compactions. On Amazon EMR releases earlier than 7.4.0, also turn off compaction on the read-replica cluster (hbase.regionserver.compaction.enabled=false). From 7.4.0, store file tracking makes this unnecessary.
  • Alarm when the store file count of any store approaches hbase.hstore.blockingStoreFiles (for example, at 80 percent of that value), so that you notice if the schedule slips before writes are delayed.

Use the following HBase shell commands to run a major compaction and check its progress:

hbase> major_compact 'my_table'
hbase> major_compact 'my_table', 'cf1'   # a single column family
hbase> compaction_state 'my_table'       # check progress

Practices that reduce compaction work

Tuning limits the effect of compaction on your workload. The following practices reduce how much compaction work the cluster has to do:

  • Limit region size and the number of regions per RegionServer. Large regions make major compaction expensive, because major compaction rewrites every store file in the region. HBase splits a region when it reaches hbase.hregion.max.filesize (10737418240 bytes, or 10 GB, by default on HBase on Amazon S3). Pre-split tables where you can predict the key distribution, using the SPLITS option of the HBase shell create command or the RegionSplitter tool.
  • Fix hotspotting at the row key. A row key that concentrates writes on one region (sequential timestamps, monotonically increasing IDs) produces frequent flushes and repeated compaction on a single RegionServer. To spread writes across HBase regions, salt, hash, or reverse the key.
  • Reduce small flushes. Many small MemStore flushes create many small store files, which increases compaction work. Compare the MemStore flush size (hbase.hregion.memstore.flush.size) with your write pattern. If regions flush every few seconds, the flush size might be too small, or the RegionServer might be under memory pressure. On HBase on Amazon S3, consider increasing hbase.hregion.memstore.flush.size and hbase.hregion.memstore.block.multiplier. This increases the time between compactions, but it also increases replication lag if you use a read-replica cluster. Make sure that the RegionServer heap can hold the larger MemStores.
  • Size the BucketCache on HBase on Amazon S3. The BucketCache stores reads on the local instance store and Amazon EBS volumes of each RegionServer. The more of your dataset it holds, the fewer reads go to Amazon S3, so compaction competes less with client reads. Increase hbase.bucketcache.size (default 8,192 MB) and choose an instance type with enough instance storage. See HBase on Amazon S3 and the Amazon S3 best practices in the Amazon EMR best practices guide.
  • Use multiple primary nodes. On an Amazon EMR cluster with multiple primary nodes, the HBase coordinator keeps running if one primary node in your cluster stops, so region assignment and split procedures continue. See Plan and configure primary nodes.
  • Alarm on compaction metrics. Set alarms on compaction queue length and store file count per region, which increase as compaction falls behind. Also alarm on Java virtual machine (JVM) pause frequency and the number of stopped RegionServers. For the metrics that are available, see the observability guidance in the Amazon EMR best practices guide.

When to stop and contact AWS Support

Some repair actions change cluster metadata and are difficult to reverse. Stop and open a case with AWS Support when any of the following is true:

  • HBCK2 bypass or setRegionState is your next step. Both can leave procedures or regions in an inconsistent state that you then must correct, and bypass might require a coordinator restart to release locks. AWS Support can validate your diagnosis and confirm the command before you run it.
  • Your next step is to delete znodes. Removing /hbase children discards state that HBase keeps in ZooKeeper, such as the location of hbase:meta, RegionServer registrations, and, on Amazon EMR, store file tracking data. This makes the problem harder to resolve. Don’t delete znodes as a first step.
  • A procedure is stuck and you cannot identify why from the logs. If three thread dumps and the coordinator log have not explained what is holding the procedure, AWS Support can help identify the cause.
  • Several RegionServers stop at the same time. Look for a cause on your cluster that the RegionServers share, such as the network configuration between cluster nodes, the ZooKeeper ensemble, or HDFS.
  • You have tuned compaction parameters twice and latency has not improved. The cause might be schema design, row key distribution, or cluster capacity, and further tuning can hide it without resolving it.
  • The stack trace contains exceptions that you don’t recognize. If the error doesn’t appear in this post or the Apache HBase Reference Guide, it might be an Apache HBase issue that is fixed in a later release. Check the Amazon EMR Release Guide and the Apache HBase JIRA before debugging further.

What to bring to the support case

Collect the following information before you open the case:

Artifact How to get it
Coordinator log extract (first ERROR plus 100 lines of context) Run grep -n -m1 "ERROR" /var/log/hbase/hbase-hbase-master-*.log, then sed -n 'X,+100p' from that line number
RegionServer log extract from the affected server Run the same commands on the affected core node against /var/log/hbase/hbase-hbase-regionserver-*.log
Thread dumps (3, taken 30 seconds apart) from the affected JVM Find the process ID with sudo jps -l, then run sudo -u hbase jstack -l <PID> three times, 30 seconds apart
Stuck procedure identifiers list_procedures in the HBase shell, or the Procedures and Locks page in the HBase web UI
Encoded region names involved From the HBCK Report tab or the Regions in Transition list
Amazon EMR release and HBase version aws emr describe-cluster --cluster-id <cluster-id> --query 'Cluster.ReleaseLabel' for the release, and sudo -u hbase hbase version for the HBase version
Storage mode and S3A read policy grep -A1 -E "hbase.rootdir\|fs.s3a.experimental.input.fadvise" /etc/hbase/conf/hbase-site.xml
Timeline: when it started, what changed Amazon CloudWatch metrics, cluster events in the Amazon EMR console, and any configuration changes or scaling actions
Compaction metrics: queue length, store file count, duration of recent compactions The RegionServer web UI, or the Completed compaction and Completed major compaction log lines, which include how long each compaction took
Any configuration changes you have already made List the parameters you changed and their before and after values

Providing this information up front reduces the number of follow-up requests from AWS Support.

Quick reference: Compaction log signatures

Search for the first occurrence of each signature in the following table, which shows when the condition started. Unless the table says otherwise, the signatures appear in the RegionServer log. For example:

grep -m1 -n "too many store files" /var/log/hbase/hbase-hbase-regionserver-*.log
Signature Meaning
too many store files A store reached the blocking threshold. HBase is delaying MemStore flushes until compaction reduces the number of store files.
RegionTooBusyException A MemStore exceeded hbase.hregion.memstore.flush.size multiplied by hbase.hregion.memstore.block.multiplier, for example because flushes are delayed by too many store files. The RegionServer logs Region is too busy due to exceeding memstore size limit, and clients receive the exception.
Completed major compaction A major compaction finished on that store. A major compaction that rewrote every file also shows (all).
Completed compaction A minor compaction finished. The line includes the number of files, the resulting store size, and how long the compaction took. Use it to establish a baseline.
Detected pause in JVM / JvmPauseMonitor A GC pause. Compare its timestamp with the compaction start time to see which came first.
SlowDown Amazon S3 returned HTTP 503 with the error code SlowDown, which asks your cluster to reduce its request rate to a prefix. Compaction adds to the request rate on HBase on Amazon S3.
ServerCrashProcedure Appears in the coordinator log (hbase-hbase-master-*.log). HBase is reassigning the regions of a RegionServer that stopped. Check whether a GC pause during heavy compaction caused it to stop.
Finished flush of A MemStore flush completed and wrote a new store file. Many of these lines in a short period mean frequent small flushes, which increase compaction work.

Conclusion and next steps

In this post, you learned how to confirm whether compaction is causing latency on HBase on Amazon EMR, and how to tune it, starting with the least invasive change.

For coordinator startup, RegionServers that stop unexpectedly, and regions in transition, see Part 1 of this series.

Next steps

  • Add the triage flow from both posts to your team’s runbook, with your own alarm names, dashboards, and on-call procedures.
  • Set up the alarms described in Practices that reduce compaction work.
  • Stage the HBCK2 jar for your HBase version on the cluster now, so that it’s ready before you need it.
  • Record a compaction baseline. Run grep -E "Completed (major )?compaction" across a week of RegionServer logs to learn the normal duration and frequency for your tables, so that you can recognize unusual behavior.
  • Review the guidance in the HBase best practices and troubleshooting sections of the Amazon EMR best practices guide.

About the authors

Reekunj Parmar

Reekunj Parmar

Reekunj is a Senior Technical Account Manager at Amazon Web Services, focused on Data Analytics. He works with customers to design and architect solutions based on Analytics services in their enterprise cloud environments. With more than 10 years of experience in Analytics, Reekunj helps organizations build secure, resilient architectures.

Ishan Sharma

Ishan Sharma

Ishan is a Cloud Support Engineer at Amazon Web Services and an Amazon EMR subject matter expert. He specializes in helping enterprise customers troubleshoot, optimize, and architect solutions across Amazon EMR and big data technologies. Ishan works closely with organizations to design and operate reliable, high-performance data processing workloads in the cloud.

Ram Nethi

Ram Nethi

Ram is a Senior Solutions Architect at Amazon Web Services, specializing in generative AI, agentic AI architectures, big data, cloud migrations, and application modernization. He guides enterprise and strategic customers across industry domains from legacy environments to production-ready AI workloads on AWS, designing scalable solutions that span infrastructure, DevOps automation, cybersecurity, and end-to-end cloud-native architectures.

Navigating messaging requirements in betting and gaming technology applications (Part 2: Executing the registration and maintaining compliance)

Post Syndicated from Meghana Dasigi original https://aws.amazon.com/blogs/messaging-and-targeting/navigating-messaging-requirements-in-betting-and-gaming-technology-applications-part-2-executing-the-registration-and-maintaining-compliance/

This is Part 2 of a two-part series for developers and technical teams at betting and gaming operators registering SMS messaging for multi-factor authentication (MFA) and account verification through AWS End User Messaging. Part 1 covered why betting and gaming operators face heightened carrier scrutiny, how the AWS and carrier registration roles work, and how to prepare before you apply.

Here in Part 2, we move from preparation to execution: what to include in your application to maximize approval odds, how to maintain compliance and deliverability after approval, and what to do if your registration is denied.

Prerequisites: This guidance applies exclusively to transactional and MFA messaging (for example, one-time passcodes, account verification, and security alerts). AWS End User Messaging does not support marketing or promotional messages for the betting and gaming industry. If you have not read Part 1, we recommend starting there.

The registration process: Best practices for approval

The following sections cover what to include in your application to maximize your chances of registration approval.

Provide detailed use cases

Don’t submit vague use-case descriptions. “We send notifications to users” is not sufficient. For each message type, explain:

  • The specific trigger (for example, “sent when a user logs in from an unrecognized device”).
  • The audience (for example, “verified players who have completed account registration and opted in to MFA”).
  • The content, including your actual one-time password (OTP) template.
  • The basis (for example, “account security notification, MFA only, not promotional”).
  • The expected volume (for example, “approximately 5,000 to 15,000 messages monthly based on current active user count”).

Document your opt-in workflow

Opt-in documentation is one of the most scrutinized components of a betting and gaming technology company’s registration. Include the following:

Implement double opt-in – A double opt-in process (where a user provides their number, receives a confirmation message, and replies to confirm) creates a clear consent record and reduces complaint rates.

Make opt-out instructions explicit in every message – Every message you send should include clear opt-out instructions (for example, “Reply STOP to unsubscribe”).

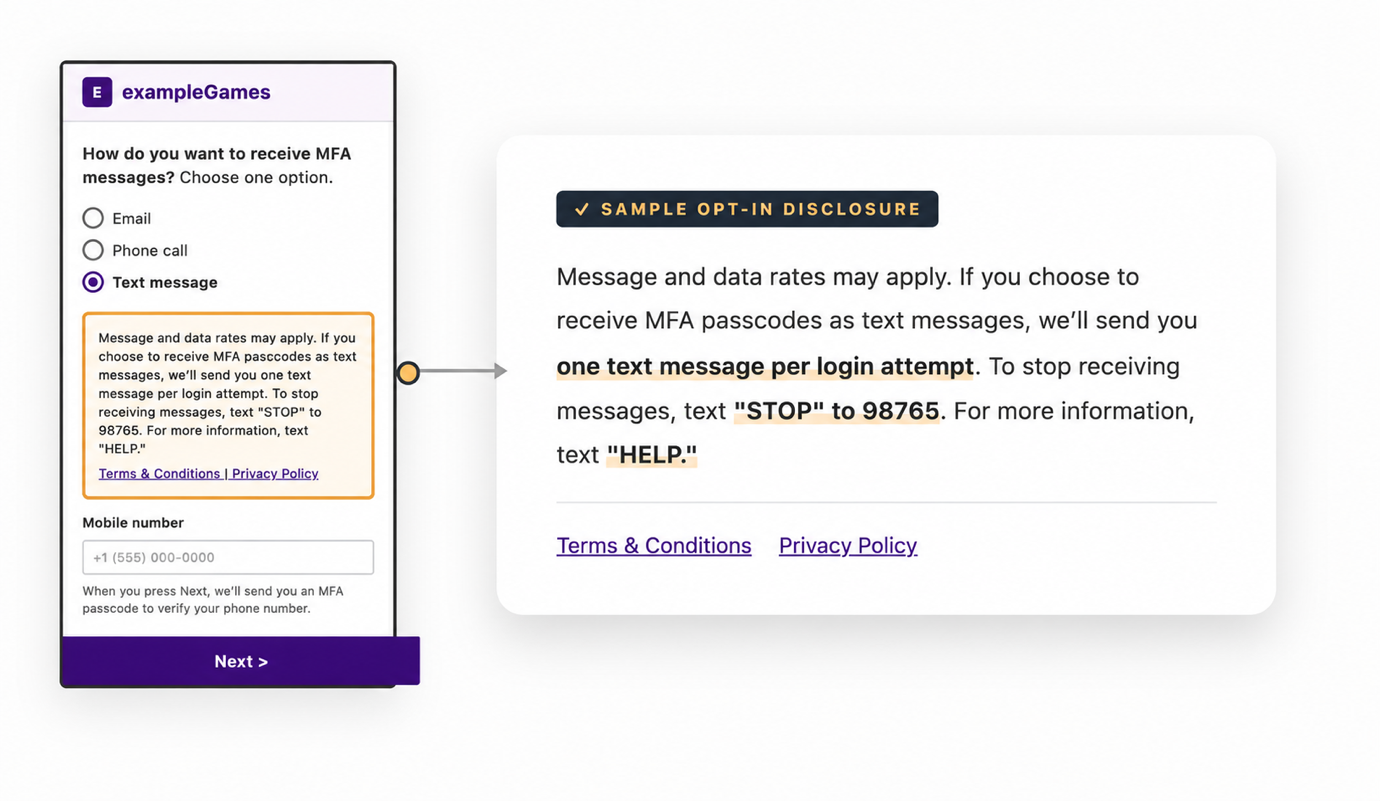
Document the consent flow with screenshots or flow diagrams – Show exactly where and how users provide consent on your application. Include the exact language of your consent disclosure.

Sample MFA opt-in screen for exampleGames showing the text-message consent disclosure, STOP and HELP instructions, and Terms & Conditions and Privacy Policy links

Figure 1: A sample double opt-in consent flow showing the SMS consent disclosure, STOP and HELP instructions, and links to terms and conditions and the privacy policy

Include relevant operating documentation

Don’t wait to be asked. Include your betting and gaming technology licenses, regulatory approvals, and messaging compliance documentation with your initial application. Providing this detail helps reduce back-and-forth with reviewers and increases your chances of approval.

Post-registration: Maintaining compliance and deliverability

Approval by the carrier is the beginning, not the end. Betting and gaming technology operators that treat registration as a one-time hurdle often find their messaging programs throttled or suspended months later. Long-term deliverability requires ongoing discipline, including the following best practices:

Manage message volume carefully

Declare your expected message volume during registration. Expressly state how many messages you plan to send monthly in the registration.

Maintain consistent sending patterns. Irregular volume (quiet for weeks, then a massive burst) looks like spam or suspicious activity to carriers, aggregators, and AWS monitoring systems. Sudden spikes can result in throttling or suspension, even if the traffic is legitimate. If you expect a temporary increase (major sporting events or new market launches, for example), open an AWS Support case in advance so the team can note the expected volume change and help prevent automated throttling during the spike.

Monitor and optimize your content

Regularly review message content. Regulations change, carrier policies evolve, and language that was acceptable last year might be filtered today.

Avoid language that could trigger gambling-related filters. Work with AWS Support to understand which terms are most likely to cause issues in your specific use cases.

Focus on account security messaging only. Keeping your active message templates strictly within that scope is both a compliance requirement and an effective way to maintain deliverability.

Manage feedback proactively

Set up alerts for spam complaint spikes. Investigate immediately. Carriers, aggregators, and AWS can suspend your messaging if complaint rates stay elevated.

Track delivery rates by template. If your password reset messages drop while OTP delivery stays stable, that’s a signal worth investigating. It is a sign of content-based carrier filtering, origination identity blocking, or malicious account takeover attempts targeting your application.

Maintain open communication with AWS Support. Do not hesitate to reach out to AWS Support if you have any questions.

If your registration is denied

Denial is a common outcome for gaming and betting registrations. If your application is rejected, here is how to move forward.

Understand the rejection

Review the rejection reason against official documentation. AWS publishes the full list of rejection reasons with remediation steps at Understanding rejection reasons. When your registration is rejected, the console displays a specific reason. Match it to the documentation to understand exactly what needs to be changed.

Rejection reasons most relevant to gaming registrations:

Category Rejection Reason (exact text) What It Means Action
Brand Brand associated with or website references gambling which is prohibited by mobile operators The carrier flagged your brand based on your website content or industry classification, regardless of your messaging use case. Make sure your website clearly separates gaming operations from your MFA/security messaging program. Consider whether a dedicated subdomain for account security communications would reduce this signal.
Campaign Use case is considered restricted or disallowed by mobile operators: Gambling Your campaign use case was categorized as gambling-related by the carrier, even if scoped to MFA. Rewrite your use case description to emphasize transactional/security messaging exclusively. Remove any language that references gaming operations beyond identifying your industry.
Campaign Campaign description does not match sample messages or use case The reviewer found a mismatch between your stated use case and the sample messages you provided. Align your campaign description, use case selection, and sample messages, so they all describe the same MFA-only program consistently.
Opt-in workflow Opt-in workflow indicates that use case is considered restricted or disallowed by mobile operators: Gambling Your opt-in screenshots or workflow revealed gambling-related content, causing the reviewer to flag it as a restricted use case. Remove gambling-related branding, imagery, or language from the screens shown in your opt-in flow. The opt-in should present a clean, security-focused experience.
Opt-in workflow Opt-in workflow does not obtain sufficient consent Your opt-in screenshots did not demonstrate explicit, affirmative user consent for SMS messaging (express written consent is required). Update your opt-in flow to show a clear, unchecked checkbox or button that the user must actively select. Provide new screenshots showing the revised flow.
Opt-in workflow Opt-in workflow URL or image is missing or inaccessible and could not be verified No opt-in workflow screenshot or URL was provided, or the URL you submitted was inaccessible to the reviewer. Provide a working URL to your live opt-in page or upload a screenshot/mockup showing your complete opt-in flow. Verify that the URL is publicly accessible before resubmitting.
Opt-in workflow Opt-in workflow not compliant or is missing required terms and conditions language Your opt-in page does not include complete terms and conditions language or a link to your full T&C. Add a visible link to your complete messaging terms and conditions at the point of consent or include the full T&C language inline. Resubmit with updated screenshots.
Opt-in workflow Opt-in workflow not compliant or is missing statement that data will not be shared with third parties or link to privacy policy disclosure Your opt-in page does not include a privacy policy link or a statement that mobile opt-in data will not be shared with third parties. Add a visible link to your privacy policy and a statement that phone numbers/opt-in data will not be shared with third parties at the point of consent.
Sample messages Sample message(s) indicates that message content is related to gambling and is not permitted by US carriers Your message templates contain language or keywords that trigger gambling content filters. Revise message templates to remove any gambling-related terms (brand names containing “bet” or “casino,” for example). Use neutral phrasing for OTP delivery (for example, “Your verification code is 123456”).

Revise and resubmit

If the rejection includes actionable feedback:

  1. Address every point raised in the denial specifically.
  2. Strengthen areas the reviewer questioned (additional documentation, revised message samples, clearer use case scoping).
  3. Consider narrowing your initial scope further (for example, registering for a single message type such as login OTP before expanding).
  4. Resubmit with a cover note explaining what you changed and why.

If the rejection is generic or provides no actionable detail, a resubmission with the same information is unlikely to produce a different result.

Conclusion

Messaging registration for betting and gaming technology operators is complex, and approval is never guaranteed. Carrier and registry decisions are ultimately outside an applicant’s control. However, companies that position themselves well approach registration as a thoughtful compliance exercise, not a technical checkbox. They invest time in documentation before they apply, lead with their MFA use cases, and treat post-approval compliance as an ongoing operational responsibility. Even when initial applications are denied, a well-prepared submission strengthens the foundation for appeals and future attempts.

Betting and gaming technology operators that follow this approach (thorough pre-registration documentation, a clearly scoped MFA-only program, and consistent post-approval hygiene) are better positioned for carrier approval and sustained message deliverability. That translates directly to fewer failed logins, lower account lockout rates, and a smoother onboarding experience for new players.

With AWS End User Messaging, you have the infrastructure to help you deliver MFA more reliably at scale. The suggested best practices described in this post give you the framework to support carrier approval and keep your messaging program running reliably.

Missed Part 1?

If you have not yet read Part 1, start there for the landscape and preparation steps. Together, the two parts give you an end-to-end playbook for getting your MFA messaging approved and keeping it deliverable.


About the authors

Meghana Dasigi

Meghana Dasigi

Meghana is a Sr. Technical Account Manager at AWS Enterprise Support, specializing in messaging, generative AI, and serverless architectures for Media, Entertainment, and Ticketing customers.

Sirinda Glasgow

Sirinda Glasgow

Sirinda is a Sr. Technical Account Manager at AWS Enterprise Support, specializing in security and compliance and hybrid edge infrastructure for Betting and Gaming customers operating regulated workloads.

Navigating messaging requirements in betting and gaming technology applications (Part 1: Understanding the landscape and preparing your application)

Post Syndicated from Meghana Dasigi original https://aws.amazon.com/blogs/messaging-and-targeting/navigating-messaging-requirements-in-betting-and-gaming-technology-applications-part-1-understanding-the-landscape-and-preparing-your-application/

Global betting and gaming technology operators face a distinct challenge. Despite operating as fully licensed and regulated businesses in their respective jurisdictions, they consistently encounter messaging service registration challenges when registering their phone numbers for SMS messaging with telecommunication carriers.

Carriers and messaging providers classify betting and gaming technology operators as “high-risk” or gambling. This classification subjects their applications to heightened scrutiny, stricter content filtering, and rejection rates that far exceed those seen in other industries. A betting and gaming operator that follows the same registration steps that might work for a retail or software as a service (SaaS) company will often find that their application requires additional documentation or revision. These revisions can span multiple review cycles, often without clear guidance on what to change.

This post is written for developers and technical teams at betting and gaming operators who need to submit an SMS messaging registration for multi-factor authentication (MFA) and account verification use cases through AWS End User Messaging. The guidance below represents suggested best practices that can help betting and gaming operators give their application a stronger foundation when seeking SMS messaging approval from carriers. We cover the specific challenges such operators may face, how to prepare before submitting a registration application, what to do during the registration process, what happens if the application is denied by the telecommunications carrier, and the ongoing practices that help keep operator MFA messaging active and deliverable after approval.

Important note: This guidance applies exclusively to transactional and MFA messaging (for example, one-time passcodes, account verification, and security alerts). AWS End User Messaging does not support marketing or promotional messages for the betting and gaming industry.

How registration works: AWS and telecommunication carrier roles

Understanding the registration flow helps set expectations. Your application is submitted through AWS, but the carrier or aggregator decides whether to approve it.

Registration through AWS End User Messaging includes the following steps:

  1. You submit a registration request through the AWS End User Messaging console that includes your business details, use case descriptions, and relevant compliance documentation.
  2. AWS forwards your registration to the downstream carrier or aggregator (based on the origination identity type you selected, such as 10DLC, toll-free, or short code).
  3. The carrier or aggregator reviews your application and makes an approval or denial decision. An aggregator is the application-to-person (A2P) messaging provider that routes traffic to carriers such as T-Mobile and AT&T. AWS does not control this decision.
  4. AWS communicates the approval or denial to you through the AWS End User Messaging console. You can also configure event notifications to be alerted automatically.

The key takeaway: AWS facilitates the submission and relays the outcome, but the aggregator or carrier holds the approval authority.

The challenges: Why betting and gaming technology is different

Betting and gaming technology operators face two primary obstacles that generic messaging registration guides may not address. First, messages from this industry historically generate higher complaint rates. For that reason, The Campaign Registry (TCR) classifies gambling as a Special Use Case that requires enhanced vetting, which makes carriers more cautious about approving new betting and gaming registrations. Second, certain words or phrases can trigger content filters at the carriers, which can cause service disruption and increased scrutiny for future applications. Even legitimate one-time password (OTP) messages can get blocked if your company name contains gambling-related keywords. For example, a message such as “exampleGames: here is your OTP 1234 to start betting” may be filtered because “betting” triggers automated content rules, even though the message is a valid security code. This contributes to higher rejection rates by carriers during number registration. To reduce registration approval delays, provide as detailed and accurate a description of your use case as possible in your application.

Pre-registration preparation

Carriers and aggregators want to see that you’re a legitimate business operating legally before they approve your registration. To help do so, you should:

Establish a clear business identity

  1. Use a legitimate business domain email – Registration applications submitted with Gmail or other personal email addresses signal a lack of organizational legitimacy. Use a duly registered email address on your company’s registered domain.
  2. Make your website transparent – Your website should clearly describe your services, the jurisdictions where you’re licensed to operate, and links to your active gaming licenses or regulatory approvals. Carriers will review it. Include links to your applicable licenses, terms of service, and privacy policy in accessible locations.

Plan your messaging content strategically

  1. Develop message templates before you apply – Your registration application will ask for sample messages. Your samples should focus exclusively on:
    • One-time passcodes for account login.
    • Multi-factor authentication (MFA) verification codes.
    • Account security alerts (new device login, password changes, and suspicious activity).
  2. Avoid promotional gambling language in your samples – Use clear language, accurately describe your use case, and provide all the necessary details.
  3. Prepare examples of your message types – For each template, document who receives it, what triggers it, what the message contains, and how the recipient opted in. The more specific and operational your use case descriptions, the more confidence you give reviewers that this is a well-governed program.
  4. Assemble your applicable compliance documentation

Before submitting any registration through AWS End User Messaging, gather:

  • Your business registration and tax identification documents.
  • Your opt-in consent process documentation.
  • Your Telephone Consumer Protection Act (TCPA) compliance policy or equivalent.
  • Your data retention and privacy policy.
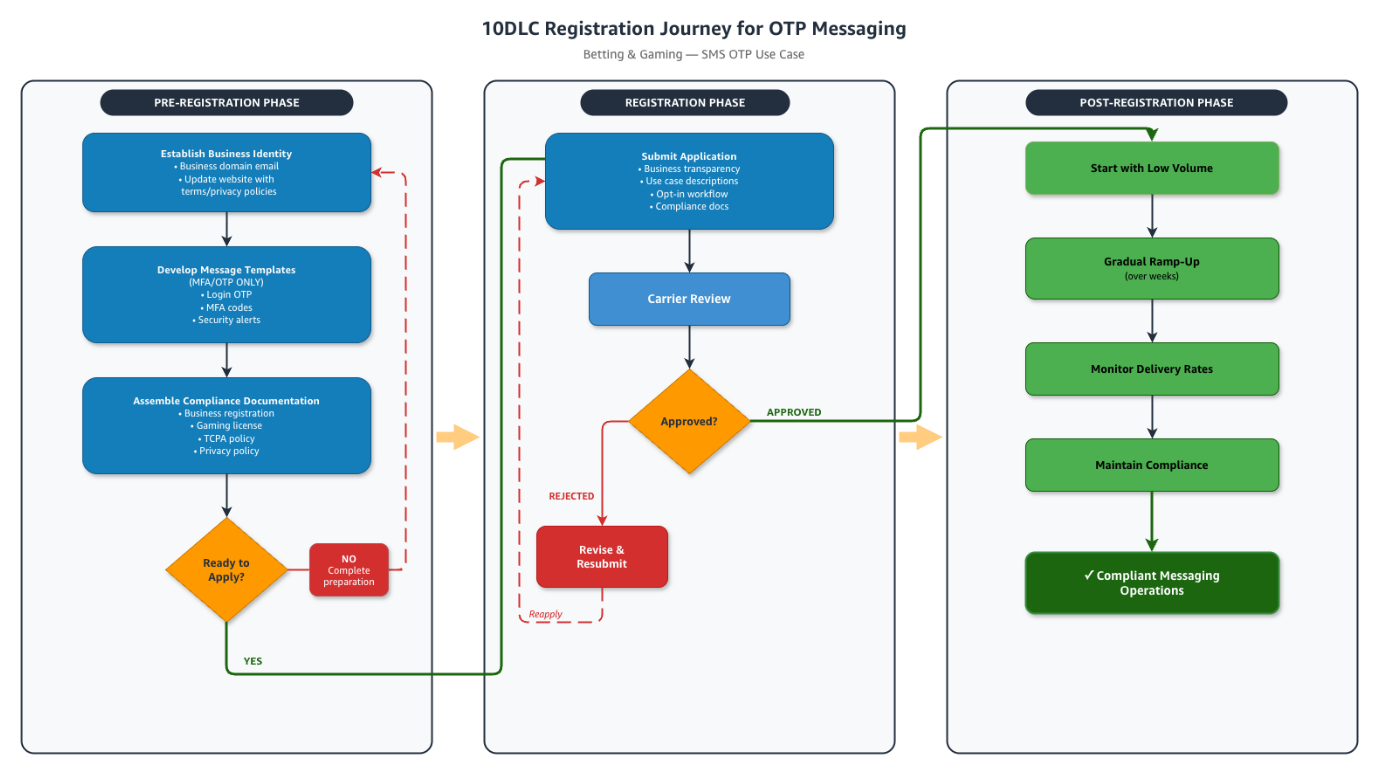
Flowchart of the 10DLC registration journey for OTP messaging across pre-registration, registration, and post-registration phases

Figure 1: The 10DLC registration journey for OTP messaging, from pre-registration preparation through carrier review to post-registration compliance

Coming up in Part 2

You now understand why betting and gaming operators face heightened scrutiny, how the AWS and carrier registration roles work, and how to prepare a strong application before you submit. In Part 2, we cover the registration process itself: how to write use-case descriptions and opt-in documentation that get approved, how to maintain compliance and deliverability after approval, and what to do if your registration is denied.

Read Part 2: Navigating messaging requirements in betting and gaming technology applications (Part 2: Executing the registration and maintaining compliance).


About the authors

Meghana Dasigi

Meghana Dasigi

Meghana is a Sr. Technical Account Manager at AWS Enterprise Support, specializing in messaging, generative AI, and serverless architectures for Media, Entertainment, and Ticketing customers.

Sirinda Glasgow

Sirinda Glasgow

Sirinda is a Sr. Technical Account Manager at AWS Enterprise Support, specializing in security and compliance and hybrid edge infrastructure for Betting and Gaming customers operating regulated workloads.

Build a data foundation for agentic AI on AWS: From lakehouse to MCP

Post Syndicated from Adrien Lebret original https://aws.amazon.com/blogs/big-data/build-a-data-foundation-for-agentic-ai-on-aws-from-lakehouse-to-mcp/

Building a data foundation ready for agentic AI is becoming a priority for organizations deploying AWS. This foundation relies on a unified lakehouse and interoperability protocols like Model Context Protocol (MCP). You can move from prototype to production. Yet many teams struggle to know where to start.

According to Gartner, more than 40 percent of agentic AI projects will be canceled by 2027 for failing to deliver the expected value. While Gartner points to several contributing factors, we believe the root cause comes down to two things: a lack of governance and inconsistent data.

If you’re building a data platform for AI agents, you probably recognize four barriers. Your data is fragmented across silos. Your unstructured data is available but hard to use. Your agents and your systems lack a common way to communicate. Gaps in quality and governance weaken trust and create hallucinations.

Each barrier holds back agentic AI. Closing them requires rethinking your data foundation as a whole, rather than fixing pipelines one at a time.

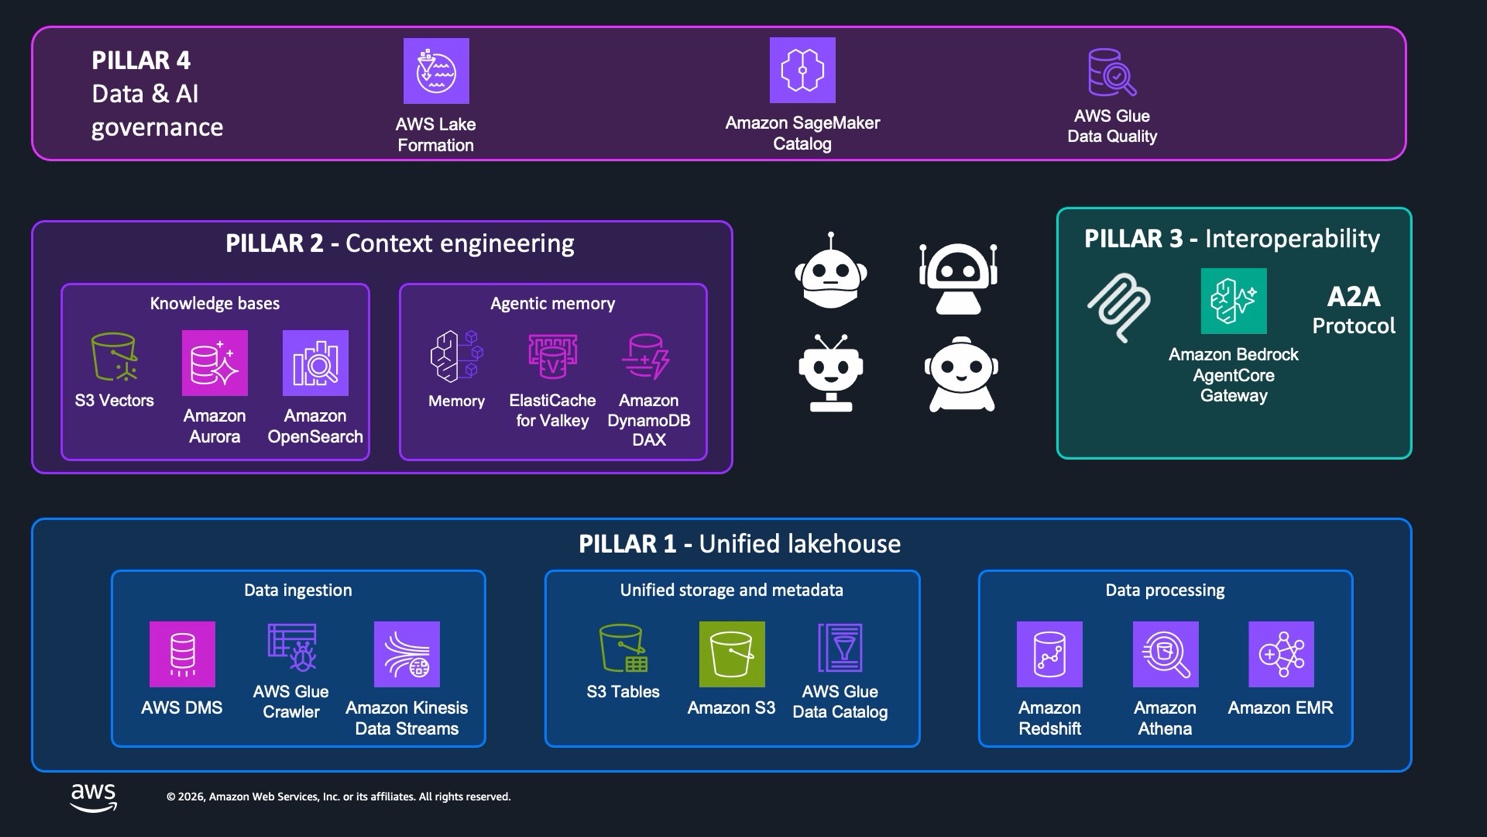
In this post, we walk you through four pillars for building a data foundation on AWS that is ready for agentic AI.

Pillar 1: Building a unified lakehouse with zero-ETL

The foundation starts with where your data lives and how you query it.

Beyond the data lake and the data warehouse: The lakehouse as your foundation

Every data platform sits between two approaches. Data lakes offer flexible storage, open formats, and raw data preserved on Amazon Simple Storage Service (Amazon S3) at low cost, which suits data science and AI workloads. However, this flexibility often comes with weak governance. Data warehouses provide native ACID transactions, high-performance SQL, and strong governance, but they become rigid when handling growing volumes or unstructured data.

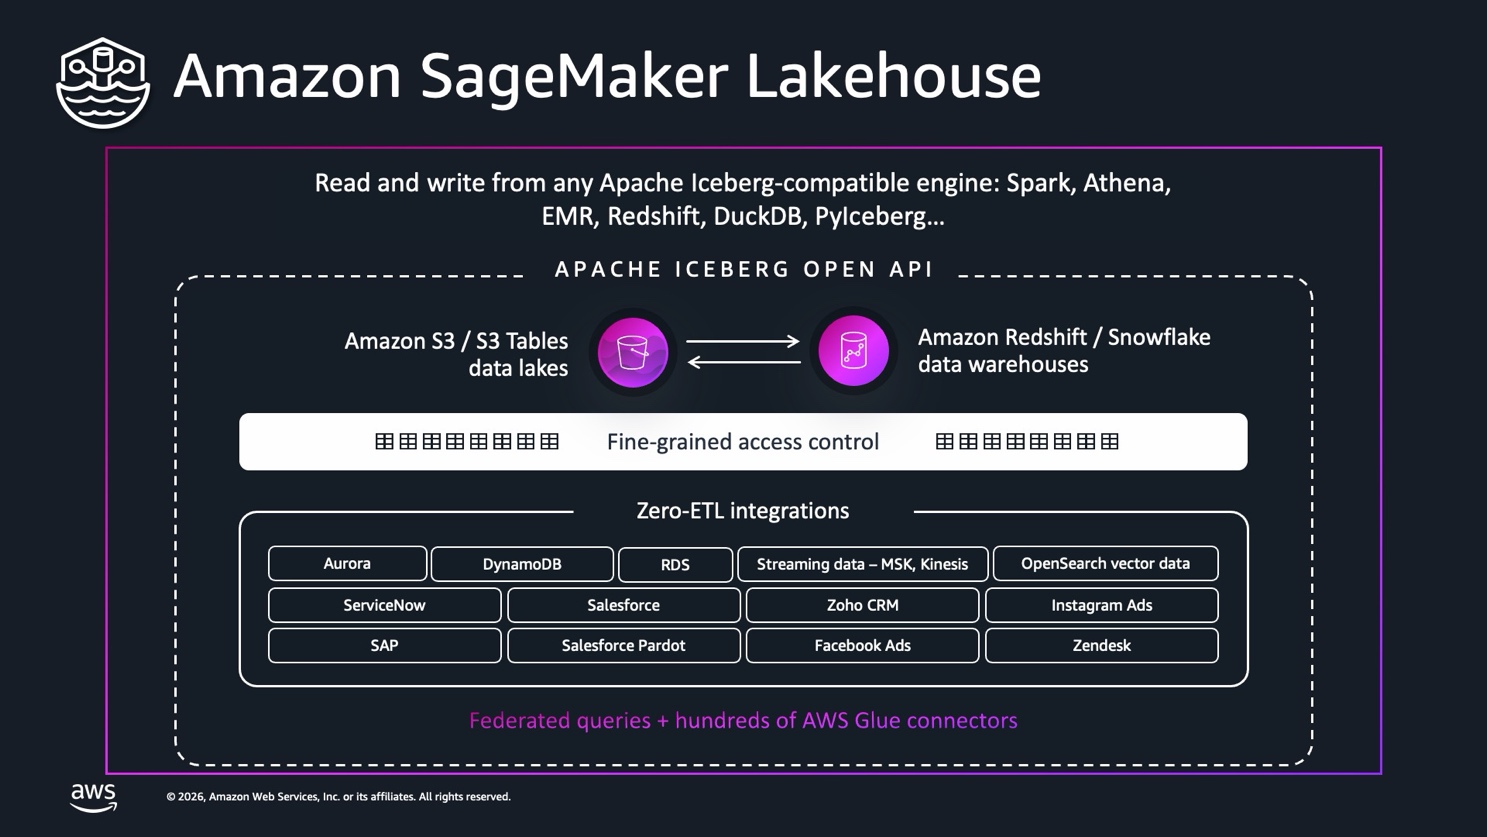
Amazon SageMaker Lakehouse combines both approaches without requiring a full migration. Your operational, analytical, and AI data live in one place. Amazon S3 Tables, a capability of Amazon S3, provides native, open-source Apache Iceberg support. You can read and write from Spark, Amazon Athena, Amazon EMR, or Amazon Redshift.

Three essential lakehouse capabilities for agentic AI

A lakehouse built for agents needs three capabilities. Zero-ETL ingestion removes the need to manage pipelines. A federated catalog gives you a unified view of tables across S3, Amazon Redshift, Snowflake, or Databricks. With query federation, you can interrogate multiple sources without duplicating data.

SELECT customer_id, sentiment_score FROM s3tables.sales_db.orders WHERE order_date > '2024-01-01';

Native zero-ETL integrations to feed the lakehouse

AWS Glue connectors bring in operational sources like Amazon Aurora, Amazon DynamoDB, and Amazon Relational Database Service (Amazon RDS). They also support SaaS sources including Salesforce, ServiceNow, and SAP. Streaming sources include Amazon Managed Streaming for Apache Kafka (Amazon MSK) and Amazon Kinesis. Raw data and vector embeddings land in the same governed foundation, ready for the next pillar: context engineering.

Amazon SageMaker Lakehouse architecture connecting operational, analytical, and AI data stores

Figure 1: Amazon SageMaker Lakehouse unifying data through zero-ETL ingestion and a federated catalog

Pillar 2: Context engineering for high-performing AI agents

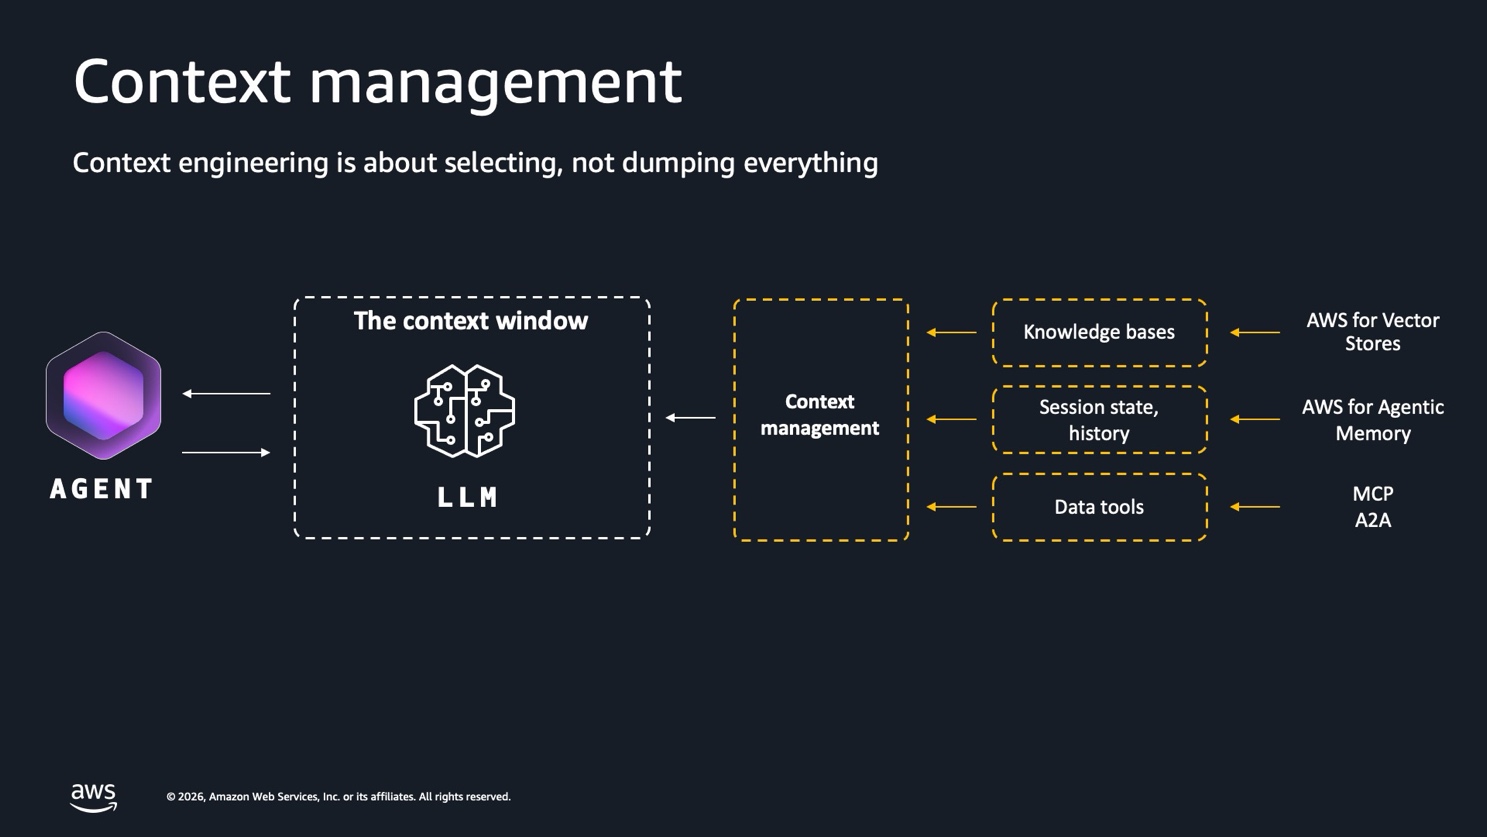
A lakehouse makes data accessible, but agents also need curated, relevant context to act on it effectively. Large language models (LLMs) remain stateless, with a finite context window. Feeding an agent excessive data often backfires. Research on long-context models identifies a lost in the middle effect, where information placed away from the prompt’s start or end gets effectively ignored (Liu et al., 2023). Context engineering addresses this challenge through a context manager built on three components: knowledge bases, session state and history, and data tools.

Context manager coordinating knowledge bases, session state and history, and data tools

Figure 2: The context manager built on knowledge bases, session state and history, and data tools

For knowledge bases, AWS offers several vector store options, including Amazon OpenSearch, Amazon Aurora PostgreSQL, and Amazon Neptune. Amazon S3 Vectors, a capability of Amazon S3, stands out because raw data and indexed embeddings reside in the same governed lakehouse foundation. This means agents and business intelligence tools consume the same source of truth without duplicating data or managing a separate system.

The following snippet is illustrative pseudocode that shows the flow. Check the Amazon Bedrock Knowledge Bases API reference for the exact parameter names and model identifiers.

# Illustrative pseudocode: parameter names are simplified
bedrock_agent.create_knowledge_base(
    name="customer-context-kb",
    vector_store_configuration={
        "s3VectorsConfiguration": {
            "vectorBucketArn": "arn:aws:s3vectors:::my-vector-bucket"
        }
    },
    embedding_model_arn="arn:aws:bedrock:::foundation-model/amazon.titan-embed-text-v2"
)

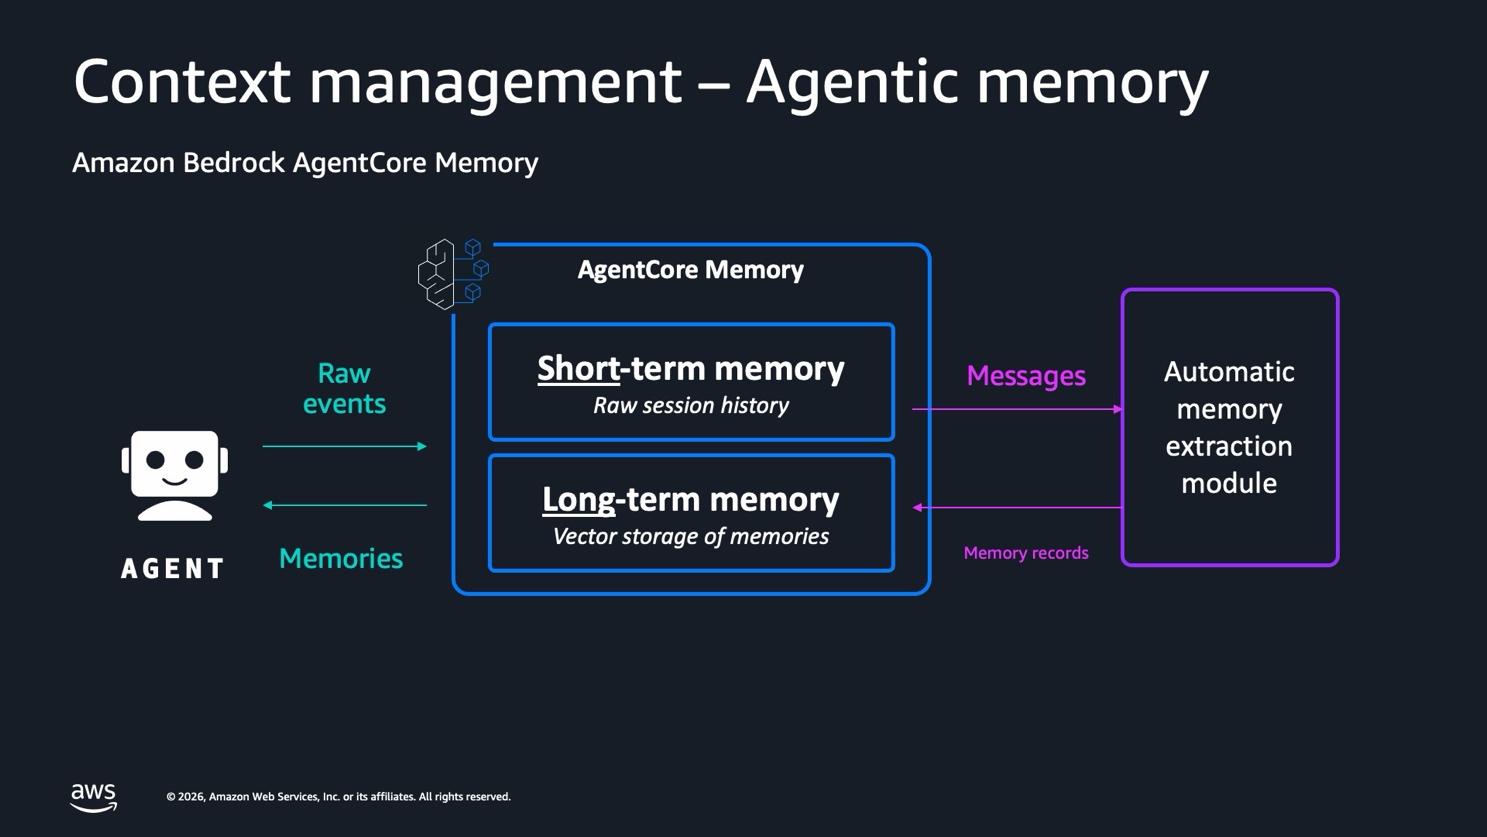
Static knowledge covers only half the problem. Agentic memory preserves dynamic context across sessions through two tiers. Short-term memory holds raw session history. Long-term memory stores vectorized records.

Amazon Bedrock AgentCore memory, a capability of Amazon Bedrock AgentCore, automates this process with an extraction module. This module identifies key terms, such as a client name or project, in raw events. It writes them into long-term storage for reuse. The result includes personalization, conversation continuity, and fewer hallucinations.

Data tools complete the context manager. Rather than receiving everything in the prompt, an agent calls a tool to fetch only the curated data it needs, such as the result of a SQL query. These capabilities prepare agents before they start communicating with each other and with your systems. MCP, the topic of our next pillar, standardizes that tool access.

Amazon Bedrock AgentCore memory with short-term and long-term memory and an automatic extraction module

Figure 3: Amazon Bedrock AgentCore memory extracting key terms from raw events into short-term and long-term memory

Pillar 3: Multi-agent interoperability with MCP and open protocols

After agents can retrieve the right context, the next challenge is collaboration, both between agents and with existing systems. Multi-agent debate techniques, where models review and correct each other’s outputs, can help improve reliability compared to a single model (Du et al., 2023). Two open protocols address this need. Agent2Agent (A2A) handles agent-to-agent communication. Model Context Protocol (MCP) connects agents to your systems.

Agent-to-agent communication with open protocols

With A2A, agents collaborate over standard HTTP and JSON, without sharing memory or a direct connection. It supports long-running tasks. An agent handling a lengthy video processing job can report progress while an orchestrator decides whether to wait or reassign the task. Each agent publishes an agent card describing its capabilities, inputs, and outputs. Popular open-source agent orchestration frameworks can query this card before delegating work.

Connecting the agentic world to your systems with MCP

MCP standardizes how agents access your data and tools through three components. Resources expose read-only data. Tools run actions like SQL queries. Prompts provide reusable instructions.

Amazon Bedrock AgentCore Gateway, a capability of Amazon Bedrock AgentCore, centralizes this access. It connects to an AWS Lambda function, an API, or a SaaS integration like Salesforce. It also enforces authentication and audit logging in one place.

Semantic search and tool discovery

As your gateway grows, agents risk being overwhelmed by available tools. AgentCore Gateway addresses this with semantic search: agents query in natural language, and the gateway returns only the relevant, permission-scoped tools based on AWS Identity and Access Management (IAM) policies.

Pillar 4: Data and AI governance for trust and compliance

Agents now communicate and act through MCP, so the data they rely on must be trustworthy. Governance has become your true differentiator. Foundation models (FMs) are widely accessible, so your data and how you manage it are what set your agents apart. Amazon SageMaker Data Catalog addresses this need through three capabilities: discovery, governance, and collaboration.

Most enterprise data remains unstructured, with incomplete metadata. The catalog automatically generates summaries, glossaries, data lineage, and quality indicators for each dataset. This gives users confidence in the data before they connect an agent to it.

Governance follows a publish-and-subscribe model. Producers publish datasets, and consumers subscribe with access scoped to their needs, through full access, row-level filtering, or column-level filtering.

These workflows run through IAM and expose APIs, so teams can automate approval flows instead of managing access requests manually.

Amazon SageMaker Unified Studio brings producers, analysts, and data scientists into a shared environment. A built-in generative AI assistant translates natural language requests into SQL, Python, or visualization cells that teammates can run immediately. This turns data exploration into a shared, auditable notebook instead of disconnected scripts.

Together, these four pillars (lakehouse, context engineering, interoperability, and governance) form a foundation you can build at enterprise scale. You can find a full technical walkthrough in the recorded session video from AWS Summit Paris.

The four pillars of an agentic AI data foundation

Figure 4: Lakehouse, context engineering, interoperability, and governance as the four pillars of an agentic AI data foundation

Conclusion

In this post, we outlined a four-pillar framework for an AI-ready data foundation on AWS, designed around connected capabilities rather than patched individual pipelines. Amazon SageMaker Lakehouse addresses the fragmentation and silo barrier. It brings operational, analytical, and AI data into one governed foundation with S3 Tables and native Apache Iceberg support. Context engineering with Amazon S3 Vectors and Amazon Bedrock AgentCore memory tackles the second barrier: unstructured data that is technically accessible but not usable. It turns your unified data into knowledge and persistent memory that agents can act on, instead of overloading a context window.

After your agents have the right context, MCP and Amazon Bedrock AgentCore Gateway address the interoperability barrier. They give agents a secure, centralized way to reach your tools and systems. Semantic search keeps tool discovery manageable as your gateway grows. Finally, Amazon SageMaker Data Catalog closes the governance gap that erodes trust and can introduce hallucinations. Its discovery, publish-and-subscribe access, and lineage capabilities give you the traceability that agentic AI needs to run in production.

If you’re starting this journey, sequence matters. Get your lakehouse and zero-ETL ingestion right first, because every downstream pillar depends on having a single, governed source of truth. Then invest in context engineering before you scale to multi-agent orchestration. Agents that hallucinate or lose session context will only compound errors after they start communicating with each other through A2A or MCP.

Treat governance as a parallel track from day one, not a final checkpoint. Column- and row-level access controls are far easier to build in early than to retrofit later.

These pillars also apply to workloads such as media personalization, customer service automation, and fraud detection pipelines. In each, multiple agents need to share a consistent, trustworthy view of enterprise data.

To go deeper, watch the recorded session video from AWS Summit Paris for the full technical walkthrough. You can also explore the Amazon SageMaker Lakehouse documentation and the Amazon Bedrock AgentCore documentation for implementation details.


About the authors

Adrien Lebret

Adrien Lebret

Adrien is a Solutions Architect at Amazon Web Services since 2022, having started through the Tech U program. Specializing in the Media, Entertainment and Sports sectors, he works daily with French companies on their AI and cloud architecture projects.

Guillaume Marchand

Guillaume Marchand

Guillaume is a Principal Solutions Architect based in Paris, France. He joined Amazon in 2016 after working for a television broadcaster, where he managed the architecture of their OTT platform. In his current role, Guillaume supports major French media groups in their cloud initiatives.

Build a multi-team AI and analytics environment on Amazon SageMaker Unified Studio with Terraform

Post Syndicated from Harshi Surampalli original https://aws.amazon.com/blogs/big-data/build-a-multi-team-ai-and-analytics-environment-on-amazon-sagemaker-unified-studio-with-terraform/

Platform engineers who support data and AI teams face a recurring challenge: analytics, machine learning (ML), and AI developer teams each need different tools. When each team operates its own tools and infrastructure, governance becomes fragmented. Organizations face duplicated effort and limited collaboration. Data engineers, data scientists, and AI developers might all work with the same underlying data. Yet they navigate separate consoles, manage distinct AWS Identity and Access Management (IAM) configurations, and lack a shared view of each other’s work.

Amazon SageMaker Unified Studio brings these capabilities together in one governed workspace. Every practitioner gets access to the tools they need: SQL editors, JupyterLab notebooks, and the Amazon Bedrock IDE. At the same time, they share a common business data catalog, security model, and project structure, all governed centrally within Amazon SageMaker Unified Studio. Teams collaborate within projects, while access to data, compute, and development artifacts is managed centrally.

Setting up this kind of multi-team environment means coordinating IAM roles, blueprints, project profiles, and user onboarding on top of the initial domain configuration. New user roles and use cases might require enabling new blueprints and combining them into new project profiles to extend the functionality supported by the domain. To keep this repeatable and consistent, we use the Amazon SageMaker Unified Studio Terraform module to codify the entire setup. The module creates three purpose-built project profiles, one for each team, on a shared domain, plus an initial project to get you started. Creating the remaining per-team projects is a single additional sub-module block.

Consider a mid-size technology company with three teams that need cloud-based data and AI capabilities:

Team What they need Key AWS services
Data Analytics Query and transform data across Amazon Simple Storage Service (Amazon S3), Apache Spark jobs, and Amazon Redshift, build and orchestrate data pipelines, manage a data catalog Amazon SageMaker Lakehouse, Amazon Redshift Serverless, AWS Glue, Amazon Managed Workflows for Apache Airflow (MWAA)
Machine Learning Run experiments, train models, deploy endpoints Amazon SageMaker AI, MLflow, Amazon EMR Serverless
Generative AI Build chat agents, knowledge bases, prompt flows, and guardrails Amazon Bedrock

A common issue today is that customers don’t have a unified strategy to deploy and manage their infrastructure. The analytics team has a standalone Amazon Redshift cluster, the ML team provisions SageMaker notebooks ad hoc, and the generative AI team experiments with Bedrock through the console. Each team runs its own infrastructure. Because these environments are separate, there’s no shared data catalog, no consistent access control, and no central visibility into what’s running or what it costs.

The goal: a single unified environment where each team gets exactly the capabilities they need, with shared data access, consistent security, and infrastructure you define entirely as code.

Solution overview

We use the Amazon SageMaker Unified Studio Terraform module to create a single domain with three project profiles, one per team. A project profile is a collection of blueprints which are configurations used to create projects, while the domain provides shared governance, IAM roles, and networking.

Key module capabilities:

  • Dual provider: Uses both the AWS provider and AWS Cloud Control (AWSCC) provider for full Amazon SageMaker Unified Studio resource coverage.
  • Service role flexibility: All IAM roles are auto-created with least-privilege policies, or you can supply existing roles to be used by Amazon SageMaker Unified Studio.
  • Domain and project level access using AWS Identity and Access Management (IAM), single sign-on (SSO) with AWS IAM Identity Center or both.
  • KMS encryption: Optionally encrypt domain metadata with a customer-managed AWS Key Management Service (AWS KMS) key using kms_key_identifier.
  • Model governance: The domain module automatically provisions a model governance project for Generative AI administrators to be added to. Members of the project can enable or disable specific models accessible in the domain.
Single SageMaker Unified Studio domain with three project profiles sharing common IAM roles, VPC, and S3 storage

Figure 1: Multi-team Amazon SageMaker Unified Studio architecture

The Terraform module follows a layered architecture with four composable modules:

Layer 1: Domain module. Creates the domain, Tooling blueprint, IAM roles, and S3 bucket:

module "domain" {
  source     = "aws-ia/sagemaker-unified-studio/aws"
  domain_name = var.domain_name
  vpc_id      = vpc-xxx
  subnet_ids  =  ["subnet-xxx", "subnet-yyy", "subnet-zzz"]
  enable_sso  = var.enable_sso
}

Layer 2: Blueprint module. Enables individual blueprints on the domain using for_each:

module "blueprints" {
  source   = "aws-ia/sagemaker-unified-studio/aws//modules/blueprint"
  for_each = local.blueprint_configs

  domain_id      = module.domain.domain_id
  blueprint_name = each.value.blueprint_name
  regional_parameters = local.regional_parameters
  manage_access_role_arn = module.domain.manage_access_role_arn
  provisioning_role_arn  = module.domain.provisioning_role_arn
}

Layer 3: Project profile module. Composes blueprints into team-specific profiles:

module "sql_analytics_project_profile" {
  source    = "aws-ia/sagemaker-unified-studio/aws//modules/project-profile"
  domain_id = module.domain.domain_id
  name      = "SQL analytics"
  blueprints = local.sql_analytics_blueprint_config
  blueprint_dependencies = [for k, bp in module.blueprints : bp.entity_id]
  depends_on = [module.blueprints]
}

Layer 4: Project and Project membership module. Creates a project and assigns members:

module "project" {
  source             = "aws-ia/sagemaker-unified-studio/aws//modules/project"
  domain_id          = module.domain.domain_id
  project_name       = local.project_name
  project_profile_id =  concat(module.all_capabilities_project_profile, module.sql_analytics_project_profile, module.generative_ai_project_profile)[0].project_profile_id 
  depends_on = [module.create_project_from_project_profile_grant]
}
module "project_membership" {
  source = " aws-ia/sagemaker-unified-studio/aws//modules/project-membership"

  domain_id            = module.domain.domain_id
  project_id           = module.project[0].project_id
  project_owners       = var.project_owners
  project_contributors = var.project_contributors

  depends_on = [
    aws_datazone_user_profile.sso_users,
    aws_datazone_user_profile.iam_users,
    awscc_datazone_group_profile.sso_groups,
  ]
}

At a high level, the deployment mentioned in this post performs the following:

  1. Terraform creates the Amazon SageMaker Unified Studio domain with shared IAM roles and networking.
  2. Terraform enables all required blueprints on the domain (DataLake, RedshiftServerless, Bedrock services, EMR, and so on).
  3. Terraform composes three project profiles (one per team), selecting the appropriate blueprints and parameters.
  4. Terraform creates a project from the first available profile (All Capabilities profile).
  5. Project members (SSO users, SSO groups, IAM users, or IAM roles) are assigned as owners or contributors to the created project.

What each team gets

After deployment and teams are assigned to their respective projects, each team can:

  • Data Analytics team (SQL Analytics profile):
    • Query data across Amazon S3 and Amazon Redshift using SageMaker Lakehouse.
    • Manage a shared data catalog with AWS Glue.
    • Create and share SQL notebooks and dashboards.
  • Machine Learning team (All Capabilities profile):
    • Run ML experiments with MLflow integration.
    • Process data at scale with Amazon EMR Serverless.
    • Access all SQL analytics and generative AI capabilities.
    • Build end-to-end ML pipelines with Workflows.
  • Generative AI team (Generative AI profile):
    • Build chat agents and knowledge bases with Amazon Bedrock.
    • Create and test prompt flows and guardrails.
    • Evaluate model performance with Bedrock Evaluation.
    • Deploy serverless AI functions.

All three teams share the same governed domain, data catalog, IAM policies, and networking. This eliminates the silos that existed before. Team isolation is achieved by assigning users or groups to projects created from the appropriate project profile.

Prerequisites

Before you begin, verify the following:

  • An AWS account with permissions to create and manage Amazon DataZone, AWS Identity and Access Management (IAM), Amazon Simple Storage Service (Amazon S3), Amazon Elastic Compute Cloud (Amazon EC2), and Amazon Virtual Private Cloud (Amazon VPC) resources. See Changing permissions for an IAM user for guidance.
  • Terraform version >= 1.7.
  • AWS Command Line Interface (AWS CLI) configured with credentials that have access to the target account and AWS Region.
  • Amazon SageMaker Unified Studio available in your target Region.
  • AWS IAM Identity Center configured (required only if using SSO-based project membership). If using IAM-only membership, Identity Center isn’t required.

Solution walkthrough

We complete the setup in four steps:

  1. Clone the module repository.
  2. Configure the Terraform variables for each team.
  3. Apply the Terraform configuration.
  4. Verify the platform and onboard teams.

Step 1: Clone the repository

Clone the Amazon SageMaker Unified Studio Terraform module and navigate to the quick-setup example:

git clone https://github.com/aws-ia/terraform-aws-sagemaker-unified-studio.git
cd terraform-aws-sagemaker-unified-studio

The module directory structure:

Directory tree of the terraform-aws-sagemaker-unified-studio module repository

Figure 2: Directory structure of the Amazon SageMaker Unified Studio Terraform module

Change into the quick-setup example directory:

cd examples/quick-setup

Step 2: Configure the Terraform variables

Copy the example variables file and edit it:

cp terraform.tfvars.example terraform.tfvars

For our multi-team scenario, we enable all three project profiles:

# Domain configuration
domain_name        = "acme-ai-platform"
domain_description = "Multi-team AI and analytics domain"
aws_region         = "us-east-1"
environment        = "prod"

# Project configuration
project_name        = "analytics-pilot"
project_description = "Initial pilot project for the analytics team"

# Enable all three team profiles
enable_sql_analytics    = true   # Data Analytics team
enable_generative_ai    = true   # Generative AI team
enable_all_capabilities = true   # ML team (includes SQL + AI + ML + EMR)

# SSO user access
enable_sso = true
sso_users  = [
  "[email protected]"
]

# Project membership
project_owners = {
  sso_users = ["a1b2c3d4-5678-90ab-cdef-EXAMPLE11111"]
}

project_contributors = {
  sso_groups = ["a1b2c3d4-5678-90ab-cdef-EXAMPLE22222"]
  iam_roles  = ["arn:aws:iam::123456789012:role/CI-CD-DeployRole"]
}

# Note: If your organization doesn't use Identity Center, set enable_sso = false and use iam_users and iam_roles instead. See "Adding IAM principals to projects" below. This is a one way door decision. If you change this later on the domain and all dependent resources need to be destroyed and recreated

# Optional: Use a specific VPC instead of the default
# vpc_id     = "vpc-0abc123def456"
# subnet_ids = ["subnet-0abc123", "subnet-0def456"]

Here’s what each profile creates:

Variable Team Blueprints enabled
enable_sql_analytics Data Analytics DataLake, LakehouseCatalog, RedshiftServerless
enable_generative_ai Generative AI BedrockChatAgent, BedrockEvaluation, BedrockFlow, BedrockFunction, BedrockGuardrail, BedrockKnowledgeBase, BedrockPrompt
enable_all_capabilities ML (full access) All of the preceding + EMR Serverless, EMR on EC2, MLExperiments, Workflows

Internally, the toggles build a dynamic map of blueprints that gets passed to the blueprint module’s for_each:

locals {
  blueprint_configs = merge(
    var.enable_generative_ai  ? { /* Bedrock blueprints */ } : {},
    var.enable_sql_analytics  ? { /* DataLake, Redshift, Lakehouse */ } : {},
    var.enable_all_capabilities ? { /* EMR, ML, Workflows + all above */ } : {},
  )
}

Network auto-discovery: If you don’t specify vpc_id and subnet_ids, the module automatically discovers and uses your default VPC and its subnets.

Customizing blueprint parameters: The quick-setup example uses recommended defaults. For production, you can customize Amazon Redshift capacity, Glue database names, or deployment modes in the sql_analytics_blueprint_config and generative_ai_blueprint_config locals in main.tf. For example, to increase Redshift Serverless max capacity:

"RedshiftServerless" = {
  deployment_mode = "ON_CREATE"
  parameter_overrides = {
    "redshiftMaxCapacity" = {
      value       = "1024"    # Increased from default 512
      is_editable = false
    }
  }
}

Step 3: Apply the Terraform configuration

Configure your AWS CLI credentials for the target account and Region, then:

  1. Run terraform init to download the modules and providers.
  2. Run terraform plan and review the output to verify:
    • An Amazon SageMaker Unified Studio domain will be created.
    • Three IAM roles will be created (domain execution, manage access, provisioning).
    • An S3 bucket for tooling storage will be created.
    • All selected blueprints will be enabled on the domain.
    • Three project profiles will be created (SQL Analytics, Generative AI, All Capabilities).
    • A project will be created from the first available profile.
    • Project memberships will be configured for SSO identities, IAM principals or both.
  3. Run terraform apply and allow the apply to complete.

Figure 3: Successful terraform apply output showing the domain URL, project ID, and project profile IDs

View the key outputs:

# Domain portal URL — share this with your teams
terraform output domain_url

# Project URL — direct link to the created project
terraform output project_url

# All enabled blueprints
terraform output blueprint_ids

# Project profile IDs (one per team)
terraform output project_profile_ids

# IAM role ARNs for auditing
terraform output domain_execution_role_arn
terraform output manage_access_role_arn
terraform output provisioning_role_arn

Step 4: Verify the platform and onboard teams

Verify the deployment. Confirm the environment is healthy before onboarding teams:

  1. Open the domain_url from the Terraform output and confirm the Amazon SageMaker Unified Studio portal loads, and you can sign in using a principal that was added to the project.
  2. In the portal, confirm the three project profiles (SQL Analytics, Generative AI, All Capabilities) appear under the domain.
  3. Confirm the initial project created by terraform apply is listed and project members can access the project interface.
  4. Cross-check the Terraform outputs (terraform output blueprint_ids, terraform output project_profile_ids) against the blueprints and profiles you expected.

Access the portal: Open the domain_url from the Terraform output. Any user added as an owner or member of the project can sign in immediately and access their project.

Create team-specific projects: The initial terraform apply creates one project. To create additional projects for each team, add more "project" sub-moduleblocks referencing different profiles:

module "genai_project" {
  source             = "aws-ia/sagemaker-unified-studio/aws//modules/project"
  domain_id          = module.domain.domain_id
  project_name       = "genai-team"
  project_profile_id = module.generative_ai_project_profile.project_profile_id
}

You can also create projects from the Amazon SageMaker Unified Studio portal using the available profiles.

Onboard additional users: To isolate teams, create separate projects using the appropriate project profiles as shown earlier, then add members (SSO users, SSO groups, IAM users, or IAM roles) to each project using the project_membership module. Each principal type can be used independently or in combination. This restricts each team to the capabilities defined by their project profile. For details on adding IAM principals, see the next section.

Adding IAM principals to projects

Amazon SageMaker Unified Studio uses project membership to control who can access a project’s resources (data, environments, and development artifacts). The Terraform module supports four principal types for project membership:

  • SSO users: Individual IAM Identity Center users.
  • SSO groups: IAM Identity Center groups (all members inherit access).
  • IAM users: Native IAM user ARNs.
  • IAM roles: IAM role ARNs (assumed by humans, services, or automation).

Project membership defines which principals are authorized to access a project. It also sets what actions they are allowed to perform as either project owners or contributors. When a principal is added to a project through project membership, they are automatically added to the domain membership list and are authorized to access the interface.

Why add IAM principals to projects?

While Identity Center users and groups cover most human access patterns, IAM principals unlock additional use cases:

Use Case Principal Type Example
Continuous integration and continuous delivery (CI/CD) pipeline deploys environments in a project IAM Role arn:aws:iam::123456789012:role/GitHubActionsDeployRole
Service account runs automated data pipelines IAM Role arn:aws:iam::123456789012:user/etl-service-account
Organization without Identity Center needs project access IAM User/Role Any IAM principal in the account

Configuration

The project_owners and project_contributors variables accept any combination of principal types:

project_owners = {
  sso_users  = ["[email protected]"]
  sso_groups = []
  iam_users  = ["arn:aws:iam::123456789012:user/platform-admin"]
  iam_roles  = ["arn:aws:iam::123456789012:role/DataPlatformLead"]
}

project_contributors = {
  sso_users  = []
  sso_groups = ["a1b2c3d4-5678-90ab-cdef-EXAMPLE22222"]
  iam_users  = ["arn:aws:iam::123456789012:user/data-engineer-1"]
  iam_roles  = ["arn:aws:iam::123456789012:role/CI-CD-DeploymentRole"]
}

Project members can be defined as owners or contributors. The AWS caller identity that runs this Terraform code is added as a project owner so that it has permission to manage project resources and update team membership. To know what permissions each of these roles have please refer to the full documentation here.

How the module registers principals

The module automatically creates the required domain-level profile for each principal before assigning membership. No manual pre-registration is needed. The module handles the full lifecycle.

IAM identity prerequisite: IAM roles and users must have the AWS managed SageMakerStudioUserIAMConsolePolicy (or equivalent) attached to access the Amazon SageMaker Unified Studio interface. This policy provides permissions for domain listing, project creation, and other portal operations. The module doesn’t automatically attach this policy to IAM roles.

Example: Granting a CI/CD pipeline access to a project

project_contributors = {
  iam_roles = ["arn:aws:iam::123456789012:role/GitHubActionsDeployRole"]
}

The pipeline role can now create and manage environments within the project scope, without domain-wide access.

Example: IAM-only project membership

Organizations that don’t use Identity Center can manage project membership entirely through IAM principals by setting enable_sso = false in the domain module.

enable_sso = false

project_owners = {
  iam_roles = ["arn:aws:iam::123456789012:role/PlatformAdmin"]
}

project_contributors = {
  iam_users = [
    "arn:aws:iam::123456789012:user/analyst-1",
    "arn:aws:iam::123456789012:user/analyst-2"
  ]
  iam_roles = [
    "arn:aws:iam::123456789012:role/DataScientistRole"
  ]
}

Note: Currently, only IAM principals within the same AWS account as the domain can access the Amazon SageMaker Unified Studio portal. Cross-account IAM role access might be limited. Verify cross-account support in your Region before relying on it for production access patterns.

Additional considerations

As you move this setup toward production, consider the following areas.

Scaling to multiple environments

For production readiness, deploy separate domains for development, staging, and production using Terraform workspaces or separate state files:

# Development
terraform workspace new dev
terraform apply -var="domain_name=acme-ai-dev" -var="environment=dev"

# Production
terraform workspace new prod
terraform apply -var="domain_name=acme-ai-prod" -var="environment=prod"

Cost management

The base infrastructure (domain, IAM roles, S3 bucket) has minimal ongoing costs. Primary charges occur when teams create and use environments:

  • Redshift Serverless: Pay per RPU-hour when queries are running.
  • EMR Serverless: Pay per vCPU and memory per second.
  • Bedrock: Pay per input and output token.
  • S3: Standard storage pricing.

Use the parameter_overrides in blueprint configurations to set capacity limits (for example, redshiftMaxCapacity) and control costs.

Security and governance

The module creates least-privilege service roles by default. For additional permissions, attach custom policies to the user role:

user_role_policy_arns = [
  "arn:aws:iam::aws:policy/AmazonS3ReadOnlyAccess",
  "arn:aws:iam::123456789012:policy/CustomBedrockPolicy"
]

You can also configure VPC endpoints for private connectivity and enable AWS CloudTrail for audit logging of all Amazon DataZone API calls.

DevOps best practices

  1. Version control: Store configurations in a code repository with automated CI/CD pipelines.
  2. Module registry: Publish organization-specific module compositions to a private Terraform registry.

Cleanup

To destroy all resources:

# Empty the S3 bucket first
terraform output s3_bucket_name
aws s3 rm s3://BUCKET_NAME --recursive

# Destroy all resources
terraform destroy

Warning: This deletes all resources including the domain, projects, and any data stored in the S3 bucket. Additionally, extra resources created manually within the console won’t be affected by this terraform destroy.

Conclusion

In this post, we walked through a real-world scenario: building a multi-team AI and analytics unified environment where data analysts, ML engineers, and generative AI developers each get tailored capabilities on a shared, governed domain. Terraform provisions and manages the full set of Amazon SageMaker Unified Studio resources, including the domain, blueprints, project profiles, and an initial project. As your needs grow, you can extend the configuration by adding projects per team through the project sub-module.

Key benefits of this approach:

  • Team-specific profiles: Each team gets exactly the blueprints they need, nothing more.
  • Shared governance: One domain, one set of IAM roles, one data catalog, consistent policies.
  • Infrastructure as Code: Repeatable, auditable, version-controlled deployments.
  • Auto-discovery: Minimal configuration required; VPC, subnets, and instance details are discovered automatically.
  • Scalable: Add teams, environments, or accounts by extending the same Terraform configuration.
  • Flexible membership: Add SSO users, IAM users, IAM roles, or any combination as project members.

The Terraform module and examples are available in the Amazon SageMaker Unified Studio Terraform module repository.

Have questions or feedback? Leave us a comment or open an issue in the GitHub repository.

Additional resources


About the authors

Harshi Surampalli

Harshi Surampalli

Harshi is a Senior Technical Account Manager at AWS supporting Financial Services customers, with deep expertise in hybrid cloud architectures and infrastructure modernization. She helps enterprises optimize their AWS environments, strengthen operational resilience, and navigate complex migrations. Outside work, she enjoys reading, gardening, and spending time with family.

Samuel Ouvrard

Samuel Ouvrard

Samuel is a Solutions Architect at AWS Canada who works with enterprise and ISV customers across the financial services and adtech sectors. He has built deep expertise in Terraform by creating and maintaining open-source Terraform modules that help customers deploy AWS services through Infrastructure as Code, simplifying what were previously complex, manual setups into repeatable, version-controlled deployments.

Nathan Yee

Nathan Yee

Nathan is a Specialist Solutions Architect at Amazon Web Services (AWS) with a focus on Agentic Data & Analytics services. He helps customers architect scalable data platforms and optimize their data processing workloads.

Ease of use and secure defaults in the new AWS experience

Post Syndicated from Keshav Narsipur original https://aws.amazon.com/blogs/security/ease-of-use-and-secure-defaults-in-the-new-aws-experience/

Starting on Amazon Web Services (AWS) is now more straightforward and more secure by default than it’s ever been. Over the past several months, we rolled out a new AWS experience that changes how you start building. It brings together a set of sensible, secure defaults, and taken one at a time, it’s easy to miss the bigger picture of what we’re building and why.

When we first built how you get started on AWS, cloud was a new concept. It was a world where RSS and APIs were the exciting new thing. Twenty years later, we’ve come a long way and learned a lot about how people start, build, and grow on AWS.

So, before I get into the recent launches, let me state the vision plainly: Make AWS straightforward to start on without giving up the depth, the pricing, or the security that make it the right place to grow. You shouldn’t have to choose between getting started quickly and staying secure. The rest of this post builds out this idea and highlights the defaults that make it real.

What developers told us

For years, developers have told us a version of the same thing. They knew AWS was where they wanted to grow, but they wanted to start fast, not plan for scale on day one. The same depth that lets AWS grow with you also meant more to set up on day one. There’s a payment method to enter before you can start, a console built for experienced administrators to get oriented in, and permissions to configure before your app can run. That feedback is fair, and it’s a big part of why we keep building a better AWS. The new experience is our answer to that, and most of it comes down to sensible, secure defaults.

The secure defaults behind the new experience

The new AWS experience sets secure defaults for you, so your setup starts secure instead of something you harden later. The defaults are sensible ones, drawn from what we’ve learned about how people start on AWS. Here are a few and what they do:

Builder ID sign-in, with two-factor protection built in. In the early days of AWS, you signed in as the account’s root user. You could set up separate identities for everyone, but that took real effort, so sharing one login was often the path of least resistance. We’ve learned a lot since then. AWS Builder ID is a personal identity that represents you as an individual, and you use it to sign in with email and password or through a social login like Google or Apple. When you start working with others, each person signs in with their own Builder ID rather than sharing one set of credentials, so access is tied to a person, not passed around. It’s the straightforward path rather than the hard one. In addition to that, you can register multi-factor authentication (MFA, an authenticator app or security key) that applies to whichever sign-in method you choose. This used to require deliberate setup. Now it’s there from the start.

A managed organization with AWS Organizations doing the heavy lifting behind the scenes. The starting flow is straightforward: you sign up and land in a project where you can start building right away. What I find interesting is what’s happening underneath. A project is more than an account. It pairs an account with its own spend limit and its own set of collaborators, so each project is a self-contained boundary with access scoped to just the people you invite. Rather than dropping you into a bare account, AWS creates and manages an organization for you, with your project as a member account inside it, and sensible guardrails already in place. As you grow, you add more projects—each its own member account—when you have work that needs its own budget or collaboration boundary, like a personal experiment kept separate from the beta you’re putting in front of your first users. This is the structure experienced teams land on eventually, usually after learning the hard way that putting resources with different budget or collaboration boundaries in the same account is tough to unwind later. The difference is we create the organization that enables this best practice for you from the start, so you’re set up for success well beyond day one without having to design or operate any of it yourself. When you’re ready for full control, you can activate advanced features in a single step and take over the organization directly, with no migration or downtime.

A data perimeter that grows with you. This is another default that I really want people to notice. You start with a foundational data perimeter already in place, restricting access to your resources from principals outside your organization. It’s a secure starting point rather than the complete, multi-dimensional data perimeter a larger organization would eventually build out. But the direction is that your security boundary should grow with you as you succeed on AWS, and here a brand-new developer gets that baseline automatically, without knowing the term or writing a line of policy.

A single AWS Region by default. Your resources run in one home Region to start, assigned when you sign up (aside from the handful of AWS services that are global by nature). That keeps your footprint simple and predictable: a smaller surface to secure and reason about, and a clear answer to where your data lives. When you need to operate more broadly, you can activate advanced features.

Spend limits that put you in control. You can set a hard spend limit on a project, starting at $20 a month, with notifications as you approach it. If a project reaches its limit, AWS pauses it rather than letting charges keep climbing, and you decide whether to raise the limit and resume. For an individual developer or a small team, that means no surprise bills: you set the ceiling, and no charges accrue past it without your say-so. You stay in control, and you can think big knowing the guardrails are already in place. A spend limit can also serve as an early signal. Unexpected spend is a classic indicator of inappropriate access or a runaway process, and because the project pauses at the ceiling you set, it also caps how far a cost surprise can go.

Roles set up for you, so IAM isn’t step one. As a new developer, you want to spend your early days building and experimenting, not wiring up IAM permissions. IAM Role Manager is on by default in the new AWS experience, so it creates and attaches the IAM roles your app needs as you build. Those roles start with the permissions an app typically needs to call other AWS services, enough to get you moving, not meant to last forever. As your app matures and tightening permissions matters, you take those roles over and right-size them, and by then you’ll know exactly what it needs. You focus on your app, AWS handles the plumbing.

Why the foundation matters

Starting from a secure base changes things in two ways. For you, it means the environment you start in is the one you keep. When you’re ready to scale, you grow it rather than building a new one. For us, it means secure by default is something we can keep extending, because a structured, secure starting point gives us a place to add to. We’re able to turn on additional governance controls as a natural part of the experience. One example we’re already working on is setting account-level Amazon S3 Block Public Access protections for newly created environments. I’m not going to put a timeline here, but I want to be clear about the trajectory.

Building for security and ease of use

Ease of use and strong security are too often framed as opposites. Everything we’ve shipped here is an argument that they don’t have to be. You can give someone the fastest possible path to building something real and have that path be secure and cost-safe by default. The same experience makes the easy things easy, like connecting your coding agent in a single step or inviting a collaborator by email, without extra setup. Each of these is useful on its own, but they were all designed around the same idea, that the easy path and the secure path should be the same path.

If you’ve tried the new experience, I’d genuinely like to hear what resonated and what you’d want next, including how we can make activating advanced features feel more managed over time. If you haven’t yet, the fastest way to see these defaults in action is to create an account and start your first project. We’re listening.


Keshav Narsipur

Keshav Narsipur

Keshav is Vice President of Identity, Cloud Governance, and Certificate Trust Services at Amazon Web Services. Keshav leads a global organization of engineers, product managers, and security professionals operating hyper-scale services that handle over 2 billion requests per second. His teams bridge the gap between developer velocity and enterprise security. Keshav’s organization is currently focused on pioneering new identity and governance capabilities to secure the generative AI era.

How Samsung Ads federated Snowflake Iceberg tables using Amazon Cognito

Post Syndicated from Balaji Selva Rajan original https://aws.amazon.com/blogs/big-data/how-samsung-ads-federated-snowflake-iceberg-tables-using-amazon-cognito/

This post is co-written with Ajay Gunasekaran, ML Platform Engineer at Samsung Ads.

Samsung Ads, the advertising division of Samsung Electronics, keeps its feature data in Snowflake as Apache Iceberg tables. Its machine learning (ML) team trains large-scale models on Amazon SageMaker AI, serving programmatic buyers who reach Samsung Smart TV and connected TV audiences. Connecting the two usually means copying the data into Amazon Simple Storage Service (Amazon S3) on a schedule. That adds a second pipeline to operate, a second copy to store, and two sets of permissions to keep in agreement.

Instead of copying the data, a team can write the final pipeline stage as Snowflake-managed Iceberg tables in Amazon S3 and federate them into AWS Lake Formation. Amazon Cognito supplies the OAuth2 tokens that Snowflake trusts. Both applications then read one copy of the data in Amazon S3, with Snowflake managing the tables and the team using Lake Formation to control which principals can read them. Model engineers can choose the query engine that fits each training job, without duplicating data or maintaining a second pipeline.

In this post, we show you how to build the pattern Samsung Ads used. You federate Snowflake Iceberg tables into AWS Lake Formation with Amazon Cognito, then query them from Amazon Athena.

Solution overview

This solution federates the Snowflake Horizon Catalog into AWS Lake Formation, using Amazon Cognito to issue OAuth2 tokens for machine-to-machine authentication. AWS Glue connection runs inside an Amazon Virtual Private Cloud (Amazon VPC), reaching Snowflake through AWS PrivateLink and the Cognito token endpoint through a NAT gateway. AWS analytics engines then query Snowflake-managed Iceberg tables under Lake Formation governance, with no second copy of the tables to maintain. The following diagram shows the query path, from Amazon Athena through AWS Lake Formation and the AWS Glue connection to Snowflake and Amazon S3.

Query path from Amazon Athena through AWS Lake Formation and an AWS Glue connection to Snowflake and Amazon S3

Figure 1: Architecture for Snowflake Horizon Catalog federation to AWS Lake Formation using Amazon Cognito

Here’s how the workflow runs:

  1. A user or application submits a SQL query in Amazon Athena that references a federated table in the Snowflake catalog.
  2. Athena delegates catalog resolution and permission checks to Lake Formation, which evaluates fine-grained access controls on the federated catalog entry.
  3. Lake Formation resolves the table reference through the AWS Glue Data Catalog, which holds the connection configuration for Snowflake and invokes the AWS Glue connection.
  4. AWS Glue connection runs in a private subnet. It sends a client_credentials request to the Amazon Cognito token endpoint with the client ID, client secret, and scope. The request leaves through the NAT gateway and internet gateway because the machine-to-machine token endpoint is public.
  5. Amazon Cognito invokes the Pre Token Generation Lambda trigger (V3_0), which adds the aud claim that Snowflake External OAuth validation requires. Amazon Cognito returns the access token to the connection.
  6. Using that token, AWS Glue connection calls the Snowflake Horizon Catalog Iceberg REST endpoint for table metadata. The response includes the schema and the location of the data files in Amazon S3. An Amazon Route 53 private hosted zone resolves the hostname, because the Snowflake endpoint service doesn’t provide private DNS. The request travels through the VPC endpoint over AWS PrivateLink.
  7. The connection returns the metadata to Lake Formation, which generates temporary, scoped Amazon S3 credentials and passes them to Athena.
  8. Athena uses those credentials to read the Iceberg metadata and Parquet data files from the registered Amazon S3 location, runs the query, and returns results.

Why Amazon Cognito

AWS Glue connection authenticates with the OAuth2 client_credentials grant, so providers Snowflake trusts that support that grant can issue the token. Samsung Ads chose Amazon Cognito for three reasons:

  • Each table lookup against Snowflake depends on a token from the provider, so the team wanted to own it alongside the rest of the solution.
  • An enterprise identity provider is typically administered by a central security team, so each new machine-to-machine client is a cross-team request. Owning the user pool makes it self-service.
  • Each app client is a distinct machine identity, and the security integration trusts the user pool rather than an individual client. You can therefore serve several workloads from one integration, each with its own read-only Snowflake role.

Prerequisites

Before you begin, verify that you have the following:

  • Snowflake account hosted on AWS in the same AWS Region where you create the AWS resources in this post, on the Business-Critical edition or higher, which AWS PrivateLink requires. Confirm the Region with SELECT CURRENT_REGION();. You need ACCOUNTADMIN to create the security integration and to authorize PrivateLink.
    • Snowflake-managed Iceberg tables created in Snowflake Horizon Catalog using CATALOG = 'SNOWFLAKE' with an external volume pointing to the S3 bucket. If you don’t have one, see Configure an external volume for Amazon S3 in the Snowflake documentation.
  • AWS account with an AWS Identity and Access Management (IAM) principal that has data lake administrator permissions in AWS Lake Formation. The principal also needs permissions to create IAM roles and policies, Amazon Cognito user pools, AWS Lambda functions, VPC resources, and AWS CloudShell. We use AWS Command Line Interface (AWS CLI) commands throughout this post.
  • Amazon S3 bucket that holds your Snowflake-managed Iceberg data files.
  • An AWS user with long-term access keys that you delete immediately after Step 4:
    • SYSTEM$AUTHORIZE_PRIVATELINK needs a federation token from the long-term keys of an IAM user, because sts:GetFederationToken rejects role-session credentials. Snowflake persists the authorization, so you can delete the key and the user afterwards and the federation keeps working.

Walkthrough

Two AWS CloudFormation stacks cover the setup that is identical in every deployment. The Snowflake and Lake Formation steps stay as explicit SQL and AWS CLI commands, so you can adapt them to your existing Snowflake account and VPC.

Step What you configure How you run it
1 & 2 Cognito user pool, machine-to-machine app client, and the Lambda function that adds the aud claim Launch Stack, snowflake-federation-oauth
3 Snowflake security integration, read-only role, service user, and table grants Snowflake SQL worksheet
4 PrivateLink authorization for your AWS account AWS CLI and Snowflake SQL worksheet
5 VPC, PrivateLink endpoint, Route 53 private hosted zone, and the Lake Formation data access role Launch Stack, snowflake-federation-network
6 S3 location registration, AWS Glue connection, federated catalog, and Lake Formation permissions AWS CLI
7 Query validation Athena console

Step 1: Deploy the Cognito user pool and token customization Lambda function

Snowflake External OAuth validation requires an aud claim in each access token. The OAuth2 client_credentials grant doesn’t define that claim, so the Pre Token Generation trigger adds it. This stack creates the user pool, the machine-to-machine app client, and a Pre Token Generation Lambda function that adds the claim. The stack also writes the app client secret to AWS Secrets Manager in the format the AWS Glue connection expects. It then generates the Snowflake SQL statements you run in Step 3.

  1. Choose Launch Stack.

Launch Stack

  1. In the Region selector, confirm the Region matches your Snowflake account Region, then choose Next.
  2. For Stack name, keep snowflake-federation-oauth. Leave all parameters at their default values, then choose Next.
  3. On Configure stack options, keep the defaults and choose Next.
  4. On Review and create, select I acknowledge that AWS CloudFormation might create IAM resources with custom names, then choose Submit.
  5. When the stack status is CREATE_COMPLETE, choose the Outputs tab.

You use six of the outputs in later steps.

Output Used in
VerifyAudClaimCommand Step 2
SnowflakeSecurityIntegrationSQL Step 3
OAuthClientSecretArn Step 5 and Step 6
CognitoTokenEndpoint, CognitoClientId and CognitoScope Step 3 and Step 6
CloudFormation Outputs tab listing the six stack outputs used in later steps

Figure 2: CloudFormation Outputs tab showing the values used in later steps

Note: After the connection validates in Step 6, AWS Glue caches the token it mints by writing it back into this secret. Treat read access to the secret as read access to the federated tables.

Step 2: Verify the access token

Confirm that the Lambda function is adding the claim before you configure Snowflake. A missing claim doesn’t fail here. It surfaces several steps later as an AWS Glue connection that can’t authenticate, which is harder to attribute.

  1. On the Outputs tab, copy the value of VerifyAudClaimCommand.
  2. Choose the AWS CloudShell icon on the console navigation bar, as shown in the following screenshot.
  3. Paste the command and run it. Confirm two values in the output. The aud claim matches your Cognito client ID, and scope is snowflake/catalog.read.
Decoded access token payload showing the injected aud claim and the snowflake/catalog.read scope

Figure 3: Decoded access token payload showing the injected aud claim and the catalog.read scope

Step 3: Configure Snowflake

In this step you configure Snowflake to trust Cognito tokens, create the service user that Lake Formation authenticates as, and grant it read access to your tables.

  1. Run the following statement in a Snowflake worksheet, replacing the three placeholders with the CognitoIssuerUri, CognitoJwksUrl, and CognitoClientId outputs from Step 1. The SnowflakeSecurityIntegrationSQL output contains the same statement with your values filled in. CREATE omits OR REPLACE, so it fails rather than overwriting an existing integration.
USE ROLE ACCOUNTADMIN;

-- Return a row if the integration exists. If so, use ALTER SECURITY INTEGRATION instead of CREATE
SHOW INTEGRATIONS LIKE 'lakeformation_cognito_oauth';

CREATE SECURITY INTEGRATION lakeformation_cognito_oauth
  TYPE = EXTERNAL_OAUTH
  ENABLED = TRUE
  EXTERNAL_OAUTH_TYPE = CUSTOM
  EXTERNAL_OAUTH_ISSUER = '<CognitoIssuerUri>'
  EXTERNAL_OAUTH_JWS_KEYS_URL = '<CognitoJwksUrl>'
  EXTERNAL_OAUTH_TOKEN_USER_MAPPING_CLAIM = 'sub'
  EXTERNAL_OAUTH_SNOWFLAKE_USER_MAPPING_ATTRIBUTE = 'login_name'
  EXTERNAL_OAUTH_AUDIENCE_LIST = ('<CognitoClientId>')
  EXTERNAL_OAUTH_ANY_ROLE_MODE = 'ENABLE'
  EXTERNAL_OAUTH_BLOCKED_ROLES_LIST = ('ACCOUNTADMIN', 'SECURITYADMIN', 'USERADMIN', 'SYSADMIN');

Snowflake normally takes the role from a session:role:<ROLE> scope, which Amazon Cognito custom scopes can’t carry because they use the form resourceServer/scope. The statement therefore sets EXTERNAL_OAUTH_ANY_ROLE_MODE to ENABLE, which lets the session use any role granted to the service user, so keep that user to a single role. The blocked roles list also covers SYSADMIN and USERADMIN, which the Snowflake default list doesn’t.

  1. Create the read-only role and the service user. Set LOGIN_NAME to the CognitoClientId output, because the token’s sub claim carries the client ID and the integration maps sub to login_name.
CREATE ROLE lakeformation_catalog_reader
  COMMENT = 'Read-only access for AWS Lake Formation catalog federation';

CREATE USER lakeformation_service_user_cognito
  LOGIN_NAME = '<CognitoClientId from Step 1>'
  DEFAULT_ROLE = lakeformation_catalog_reader
  TYPE = SERVICE;

GRANT ROLE lakeformation_catalog_reader TO USER lakeformation_service_user_cognito;
  1. Grant the role read access to the tables you want to federate. For the privileges the Iceberg REST Catalog API requires, see Configure access control in the Snowflake documentation.
GRANT USAGE ON DATABASE <database>
  TO ROLE lakeformation_catalog_reader;

GRANT USAGE ON SCHEMA <database>.<schema>
  TO ROLE lakeformation_catalog_reader;

GRANT SELECT ON ALL ICEBERG TABLES IN SCHEMA <database>.<schema>
  TO ROLE lakeformation_catalog_reader;

GRANT SELECT ON FUTURE ICEBERG TABLES IN SCHEMA <database>.<schema>
  TO ROLE lakeformation_catalog_reader;

Note: Federate a schema that contains only Snowflake-managed Iceberg tables. An externally managed table can fail the entire table listing. Converted tables, tables loaded from Iceberg-compatible Parquet files and clones whose source table the role can’t access aren’t supported. Tables with mixed-case quoted names aren’t federated, because the connection you create in Step 6 sets CATALOG_CASING_FILTER to UPPERCASE_ONLY.

Snowflake masking and row access policies don’t apply when Athena reads a federated table, because Lake Formation vends the Amazon S3 credentials and Athena reads the Parquet files directly. Keep tables that rely on them out of the federated schema or recreate the controls in Lake Formation and test them.

  1. Next, find the Amazon S3 bucket and prefix your external volume writes to. You need both in Step 5.
DESC EXTERNAL VOLUME <your_external_volume>;

STORAGE_BASE_URL holds the bucket and an optional prefix. For s3://my-bucket/iceberg/, the bucket is my-bucket and the prefix is iceberg. If nothing follows the bucket name, leave the prefix blank in Step 5. A prefix is better, because it limits the data access role to that path. If ENCRYPTION_TYPE is AWS_SSE_KMS, note the key in ENCRYPTION_KMS_KEY_ID for Step 5. If it is NONE, check the bucket’s default encryption in the Amazon S3 console. The Snowflake role that owns the Iceberg tables must keep the USAGE privilege on the external volume, or operations that request vended credentials fail.

If the bucket uses a customer managed KMS key, set KMS_KEY_ID on the external volume to the full key ARN. Then add the following statement to the key policy, so the session Snowflake uses for the role in STORAGE_AWS_ROLE_ARN can read the encrypted files. Without it, the AWS Glue connection fails with an error that says no session policy allows kms:Decrypt.

{
  "Sid": "AllowSnowflakeVolumeSession",
  "Effect": "Allow",
  "Principal": {
    "AWS": "arn:aws:sts::<account-id>:assumed-role/<external-volume-role>/snowflake"
  },
  "Action": [
    "kms:Decrypt",
    "kms:DescribeKey",
    "kms:GenerateDataKey"
  ],
  "Resource": "*"
}

Snowflake requires proof that you own the AWS account before it accepts a PrivateLink connection. You provide that proof as an AWS Security Token Service (AWS STS) federation token. You must call get-federation-token with the long-term credentials of an IAM user, because AWS STS doesn’t support calling it with temporary credentials from an assumed role.

  1. Using an IAM user with long-term access keys, generate a federation token:
aws sts get-federation-token --name snowflake-privatelink --duration-seconds 900 --profile <iam-user-profile>

The token appears in the SQL statement, so Snowflake keeps it in query history. The 15-minute duration limits how long it stays valid.

  1. In your Snowflake worksheet, pass your AWS account ID and the full JSON output from the previous command:
USE ROLE ACCOUNTADMIN;
SELECT SYSTEM$AUTHORIZE_PRIVATELINK('<aws-account-id>', '<full-federation-token-json>');

The output confirms that Snowflake authorized PrivateLink for your account.

Snowflake worksheet output confirming PrivateLink authorization for the AWS account

Figure 4: Snowflake output confirming PrivateLink authorization

  1. Retrieve the two values you need for the stack in Step 5:
WITH cfg AS (SELECT PARSE_JSON(SYSTEM$GET_PRIVATELINK_CONFIG()) AS j)
SELECT j:"regionless-privatelink-account-url"::string AS privatelink_hostname,
       j:"privatelink-vpce-id"::string AS vpce_service_name
FROM cfg;

Record both values. privatelink_hostname is the Snowflake PrivateLink hostname, and vpce_service_name is the endpoint service name.

After authorization succeeds, delete the temporary IAM user and its access key. Revoking PrivateLink access later requires a new federation token, so recreate a similar user at that point. For more information, see How to retrieve a Federation Token from AWS for PrivateLink Self-Service.

This stack creates the interface VPC endpoint to the Snowflake PrivateLink service and the Amazon Route 53 private hosted zone that resolves your Snowflake hostname to it. It also creates the security group that the endpoint shares with the AWS Glue connection. Keep Existing VPC ID blank and it also builds a VPC with public and private subnets and a NAT gateway.

To use an existing VPC, supply Existing VPC ID and two or more private subnet IDs in different Availability Zones. The stack then creates no subnets and no NAT gateway, so confirm three things first:

  • You have enabled DNS resolution and DNS hostnames on the VPC.
  • The private subnets have a 0.0.0.0/0 route to a NAT gateway, which the AWS Glue connection uses to reach the Amazon Cognito token endpoint. Amazon Cognito doesn’t support AWS PrivateLink, but the traffic stays on the AWS network because both sit in the same Region. Without this route, the stack still succeeds and the connection fails in Step 6.
  • No Amazon Route 53 private hosted zone for privatelink.snowflakecomputing.com is already associated with the VPC. A second zone for the same domain makes name resolution unpredictable.

To deploy the stack, complete the following steps:

  1. Choose Launch Stack.

Launch Stack

  1. Confirm the Region selector matches your Snowflake account Region, then choose Next.
  2. For Stack name, keep snowflake-federation-network, then enter the following parameters.
Parameter Value
Snowflake PrivateLink hostname privatelink_hostname from Step 4
Snowflake PrivateLink service name vpce_service_name from Step 4
Iceberg S3 bucket name The bucket in the STORAGE_BASE_URL output from Step 3
Iceberg data key prefix The prefix in the STORAGE_BASE_URL output from Step 3. Leave blank if you have none
Iceberg bucket KMS key ARN KMS key ARN. Leave blank if the bucket does’t use KMS
OAuth client secret ARN OAuthClientSecretArn from Step 1

If the bucket uses SSE-KMS, the stack grants the data access role kms:Decrypt on the key you enter. The default key policy already allows this. If your key policy doesn’t delegate access to IAM, add the role as a key user.

  1. Choose Next, keep the defaults on Configure stack options, and choose Next.
  2. On Review and create, select I acknowledge that AWS CloudFormation might create IAM resources with custom names, then choose Submit.
  3. When the stack status is CREATE_COMPLETE, which takes about 5 minutes, choose the Outputs tab and record PrivateSubnetIds, GlueConnectionSecurityGroupId, LakeFormationDataRoleArn, and RegisteredS3Location. You use all four values in Step 6.

NAT gateway and the interface VPC endpoint carry hourly and data processing charges. For more information, see Amazon VPC pricing.

Step 6: Register with Lake Formation and create the federated catalog

The remaining setup is a sequence of AWS CLI commands. Run them in AWS CloudShell in the same Region as both stacks.

  1. Set the values used by the commands that follow. Fill in the Region, and the stack outputs from Step 1 and Step 5.
REGION='<your Region>'
ACCT=$(aws sts get-caller-identity --query Account --output text)
PREFIX=snowflake-federation
CONN=$PREFIX-iceberg-connection
CATALOG=$PREFIX-catalog
S3_LOCATION='<RegisteredS3Location from Step 5>'
LFROLE='<LakeFormationDataRoleArn from Step 5>'
SECRET_ARN='<OAuthClientSecretArn from Step 1>'
TOKEN_URL='<CognitoTokenEndpoint from Step 1>'
CLIENT_ID='<CognitoClientId from Step 1>'
SCOPE='<CognitoScope from Step 1>'
SUBNET='<one subnet ID from PrivateSubnetIds in Step 5>'
SG='<GlueConnectionSecurityGroupId from Step 5>'
WORKSPACE_URL='https://<privatelink_hostname from Step 4>/polaris/api/catalog'
REMOTE_DB='<Snowflake database name, uppercase>'
SCHEMA='<Snowflake schema name, lowercase>'
QUERY_PRINCIPAL='<IAM role or user ARN that will run Athena queries>'
  1. Register the Amazon S3 location that holds your Iceberg data. This is what lets Lake Formation vend scoped credentials to Athena for the underlying data files.
aws lakeformation register-resource \
  --resource-arn "$S3_LOCATION" \
  --role-arn "$LFROLE" --with-federation
  1. Create the AWS Glue connection. This writes the definition to a file, then creates it.
cat > conn.json <<JSON
{
  "Name": "$CONN",
  "Description": "Snowflake Iceberg REST catalog through AWS Cognito.",
  "ConnectionType": "ICEBERGRESTCATALOG",
  "ConnectionProperties": {
    "INSTANCE_URL": "$WORKSPACE_URL",
    "ROLE_ARN": "$LFROLE",
    "CATALOG_CASING_FILTER": "UPPERCASE_ONLY"
  },
  "AuthenticationConfiguration": {
    "AuthenticationType": "OAUTH2",
    "SecretArn": "$SECRET_ARN",
    "OAuth2Properties": {
      "OAuth2GrantType": "CLIENT_CREDENTIALS",
      "TokenUrl": "$TOKEN_URL",
      "OAuth2ClientApplication": { "UserManagedClientApplicationClientId": "$CLIENT_ID" },
      "TokenUrlParametersMap": { "scope": "$SCOPE" }
    }
  },
  "PhysicalConnectionRequirements": {
    "SubnetId": "$SUBNET",
    "SecurityGroupIdList": ["$SG"]
  }
}
JSON

aws glue create-connection --connection-input file://conn.json
  1. Check the connection status. AWS Glue validates asynchronously. It creates the network interface, completes the OAuth2 exchange with Amazon Cognito, and calls the Snowflake Iceberg REST API over AWS PrivateLink. Repeat this command until it returns READY, which takes approximately 5–10 minutes.
aws glue get-connection --name $CONN --query Connection.Status --output text

If it returns FAILED, read the reason and correct the Snowflake configuration from Step 3. A missing security integration, service user, or grant is the usual cause.

aws glue get-connection --name $CONN --query Connection.StatusReason --output text

Then delete the connection before you retry, because the name stays in use.

aws glue delete-connection --connection-name $CONN
  1. Register the connection with Lake Formation using privileged access. A federated catalog can only use a connection registered this way.
aws lakeformation register-resource \
  --resource-arn arn:aws:glue:$REGION:$ACCT:connection/$CONN \
  --role-arn "$LFROLE" --with-federation --with-privileged-access
  1. Create the federated catalog, then confirm the tables surface through it.
aws glue create-catalog --name $CATALOG --catalog-input '{
  "FederatedCatalog": {"Identifier": "'"$REMOTE_DB"'", "ConnectionName": "'"$CONN"'"},
  "CreateDatabaseDefaultPermissions": [],
  "CreateTableDefaultPermissions": []
}'

aws glue get-tables --catalog-id $ACCT:$CATALOG --database-name $SCHEMA --query 'TableList[].Name'
  1. Grant Lake Formation permissions to the data teams that will query the tables. The principal that created the catalog can already query it. Every other principal needs an explicit grant, including other Lake Formation administrators.
aws lakeformation grant-permissions \
  --principal DataLakePrincipalIdentifier="$QUERY_PRINCIPAL" \
  --resource '{"Database":{"CatalogId":"'"$ACCT:$CATALOG"'","Name":"'"$SCHEMA"'"}}' \
  --permissions DESCRIBE

aws lakeformation grant-permissions \
  --principal DataLakePrincipalIdentifier="$QUERY_PRINCIPAL" \
  --resource '{"Table":{"CatalogId":"'"$ACCT:$CATALOG"'","DatabaseName":"'"$SCHEMA"'","TableWildcard":{}}}' \
  --permissions SELECT DESCRIBE

Note: The catalog ID for a federated catalog is :, not the bare account ID. Using the bare account ID grants permissions on the local AWS Glue Data Catalog instead, which succeeds and then leaves Athena returning an access denied error.

Step 7: Query the federated tables from Amazon Athena

  1. Open the Amazon Athena console and choose Query editor. If this is the first time you use Athena in this Region, choose Settings, then Manage, and set an Amazon S3 location for query results.
  2. In the left panel, select the following.
Field Value
Data source AwsDataCatalog
Catalog Your federated catalog, for example snowflake-federation-catalog
Database Your Snowflake schema name, in lowercase
  1. Run the following query:
SELECT * FROM "<snowflake_schema>"."<snowflake_tablename>" LIMIT 10;

Rows in the results pane confirm the federation works end to end, as shown in the following screenshot.

Amazon Athena query results returning 10 rows from a Snowflake-managed Iceberg table

Figure 5: Query results in Amazon Athena from a Snowflake-managed Iceberg table

To confirm that Athena reads current Snowflake data rather than a copy, insert a row in Snowflake and run the query again. The new row appears with no additional data movement into your AWS account.

Dropping a table in Snowflake doesn’t revoke the Lake Formation permissions granted on it. Revoke those permissions explicitly when you remove a federated table.

Clean up

To avoid incurring future charges, delete the resources you created while following this post. Complete the following steps in both your AWS account and your Snowflake account.

AWS account

  1. On the AWS Lake Formation console, choose Catalogs, select your federated catalog, then choose Actions and Delete catalog.
  2. Record the network interfaces the AWS Glue connection created, while the connection still exists. Filtering on the Step 5 security group and the ICEBERGRESTCATALOG description keeps the list to this deployment.
SG='<GlueConnectionSecurityGroupId from Step 5>'
aws ec2 describe-network-interfaces \
  --filters "Name=group-id,Values=$SG" "Name=description,Values=*ICEBERGRESTCATALOG" \
  --query 'NetworkInterfaces[].NetworkInterfaceId' --output text | tr '\t' '\n' > glue-enis.txt

cat glue-enis.txt
  1. Deregister and delete the AWS Glue connection. Do this before you delete the stacks, because the stack deletion fails while the connection’s network interfaces still hold the security group. Run the following in AWS CloudShell, replacing the Region, account ID, and connection name with your values.
aws lakeformation deregister-resource --resource-arn arn:aws:glue:<region>:<account-id>:connection/<glue-connection-name>
aws glue delete-connection --connection-name <glue-connection-name>
  1. Deleting the connection releases its network interfaces, but they stay in the in-use state for several minutes and AWS Glue doesn’t remove them. Wait for each one to reach available, because the Amazon Elastic Compute Cloud (Amazon EC2) console Detach action fails even with Force detachment selected. The following script checks each interface you recorded and deletes it when ready.
#!/bin/bash
while read -r eni; do
  [ -z "$eni" ] && continue
  for attempt in $(seq 1 20); do
    status=$(aws ec2 describe-network-interfaces \
      --network-interface-ids "$eni" \
      --query 'NetworkInterfaces[0].Status' \
      --output text 2>/dev/null || echo deleted)
    if [ "$status" = "available" ]; then
      aws ec2 delete-network-interface --network-interface-id "$eni"
      echo "$eni deleted"
      break
    fi
    if [ "$status" = "deleted" ]; then
      echo "$eni no longer exists"
      break
    fi
    echo "$eni is $status, checking again in 30 seconds"
    sleep 30
  done
done < glue-enis.txt
  1. On the Lake Formation console, under Administration, choose Data lake locations, select the registered Amazon S3 location, then choose Actions and Remove.
  1. On the AWS CloudFormation console, delete snowflake-federation-network first, then snowflake-federation-oauth. This removes the VPC endpoint, the Amazon Route 53 private hosted zone, the security group, and the IAM role. It also removes the Amazon Cognito user pool, the AWS Lambda function, and the client secret. If the stack created the VPC, subnets, and NAT gateway, it removes those too.

Snowflake account

  1. Open a SQL worksheet and run the following:
USE ROLE ACCOUNTADMIN;
DROP SECURITY INTEGRATION lakeformation_cognito_oauth;

USE ROLE USERADMIN;
DROP USER lakeformation_service_user_cognito;
DROP ROLE lakeformation_catalog_reader;
  1. Revoke the PrivateLink authorization for your AWS account. This requires a fresh federation token, generated the same way as during setup, from an IAM user with long-term access keys:
aws sts get-federation-token --name snowflake-privatelink --duration-seconds 900 --profile <iam-user-profile>
USE ROLE ACCOUNTADMIN;
SELECT SYSTEM$REVOKE_PRIVATELINK('<aws-account-id>', '<full-federation-token-json>');
  1. Confirm the account is no longer authorized:
SELECT SYSTEM$GET_PRIVATELINK_AUTHORIZED_ENDPOINTS();

Deleting the federated catalog and connection doesn’t delete data in Snowflake or Amazon S3. It only removes the federation configuration in your AWS account.

Conclusion

In this post, you learned how to federate Snowflake Horizon Catalog Iceberg tables into AWS Lake Formation and query them from Amazon Athena. Amazon Cognito handled the OAuth2 tokens for machine-to-machine authentication. To extend this pattern to additional workloads, create a new app client in your Cognito user pool and a corresponding read-only Snowflake role.

To get started, see Catalog federation to remote Iceberg catalogs and Federate to Snowflake Iceberg Catalog in the AWS Lake Formation Developer Guide, and External OAuth overview in the Snowflake documentation. If you have feedback about this post, submit comments in the Comments section.


About the authors

Ajay Gunasekaran

Ajay Gunasekaran

Ajay is an ML Platform Engineer at Samsung Ads. He has been instrumental in building the ML platform across the Snowflake and AWS ecosystems and is passionate about making complex infrastructure simple, reliable, and easy to use. Curious by nature, he enjoys learning, sharing ideas, and solving challenging problems.

Balaji Selva Rajan

Balaji Selva Rajan

Balaji is a Technical Account Manager at AWS, specializing in Cloud Operations, Storage, and Data Analytics. He helps customers to run their workloads efficiently on AWS and is particularly interested in turning recurring customer problems into repeatable, reusable patterns.

David Zhang

David Zhang

David is a Senior Specialist Solutions Architect specializing in Data & AI at AWS, where he focuses on designing and implementing open lakehouse architectures and agentic AI solutions. He is an active speaker at AWS events and contributes to technical publications and open-source initiatives. He is also the co-author of Apache Iceberg on AWS book. Outside of work, David enjoys staying active through volleyball, tennis, and basketball.

Steven Alyekhin

Steven Alyekhin

Steven is a Senior Solutions Architect on the AWS Canada ISV team, where he helps software companies build generative AI, machine learning, and data solutions on AWS.

Allocate shared Amazon MSK costs to Kafka topics for cost visibility

Post Syndicated from Durai Krishnan original https://aws.amazon.com/blogs/big-data/allocate-shared-amazon-msk-costs-to-kafka-topics-for-cost-visibility/

Your AWS bill shows Amazon Managed Streaming for Apache Kafka (Amazon MSK) charges at the cluster level, with one cost line item for each cluster. If your organization runs one cluster for several teams, and each team owns its own Kafka topics, you need a way to show each team its share of the spend. This post shows how you can produce that per-topic cost view by combining cluster-level billing data with per-topic usage metrics. The result gives each team a usage-based picture of what it consumes.

Bringing cost and usage together

You can use Amazon MSK to run Apache Kafka at scale while AWS manages the underlying infrastructure, so you can focus on configuring and operating your applications. Many organizations consolidate multiple workloads onto a single cluster, where each team or application owns a set of Kafka topics. Consolidation can help you improve operational efficiency. When you implement per-topic cost visibility, you can show each team its share of the cluster spend.

Producing that view draws on two sources of data, and the solution brings them together.

Cost: cluster-level billing in the CUR

You can locate MSK charges in your AWS Cost and Usage Report (CUR) by cluster ARN and see operations such as RunBroker, RunVolume, and Bandwidth. You use this cluster-level cost as the starting point when you allocate costs to your topics.

Usage: per-topic metrics without cost context

Amazon MSK surfaces per-topic throughput metrics, which provide the usage signal you use to distribute cluster cost across topics. You can use the cluster name that Amazon MSK provides with these metrics. Map that name to the cluster ARN to join usage with billing and produce per-topic cost.

Solution overview

Option A – Enhanced Monitoring: Uses per-topic Amazon CloudWatch metrics published by Amazon MSK.

Option B – Open Monitoring with Amazon Managed Service for Prometheus: A cost-optimized alternative. This option uses the MSK Open Monitoring endpoint at no additional charge and keeps metric cost growth low as topic count grows.

Both options use the same allocation logic and output. Switch between them with one configuration value.

The pipeline runs in five steps:

  1. Read cluster cost from CUR – A daily AWS Lambda function reads MSK line items by cluster ARN and day.
  2. Bridge identifiers – The function calls ListClustersV2 to map cluster name to ARN.
  3. Read per-topic usage – The function retrieves each topic’s daily throughput. This step differs between Option A and Option B.
  4. Allocate proportionally – For each day, the function distributes that day’s cluster cost across topics based on each topic’s share of throughput.
  5. Publish results – The function writes allocation data as Apache Parquet to Amazon Simple Storage Service (Amazon S3) and refreshes an Amazon Athena table. You visualize the results in AWS Quick Sight.

The following diagram shows the pipeline.

Serverless pipeline allocating MSK cluster cost to Kafka topics from CUR and per-topic metrics, output to Amazon S3 and Quick Sight

Figure 1: Solution architecture. A single serverless pipeline supports both per-topic metric sources, selected with the METRIC_SOURCE environment variable

How the allocation works

For each cluster and day, the function computes each topic’s share of ingress bytes and applies that share to the cost:

topic_run_cost = day_broker_cost × (topic_bytes / total_cluster_bytes)
topic_storage_cost = day_storage_cost × (topic_bytes / total_cluster_bytes)
topic_total_cost = topic_run_cost + topic_storage_cost

The function assigns 30 percent of the cost to a topic that carries 30 percent of ingress. Allocations always sum to the day’s total. During a partial outage, the function distributes costs only among topics for which you have configured metrics.

Two behaviors to know:

  • Idle topics get no row. If only 3 of 20 report traffic, those 3 absorb the full cost. The allocation_method column catches this.
  • If no topic reports traffic for a cluster-day, the function falls back to an even split across all topics you have configured.

Why bytes-in as the allocation weight

Bytes-in is available from both metric sources and correlates well with broker compute and network cost.

However, bytes-in is a proxy. Its limitations:

  • It can’t see retention. Two topics with identical throughput but different retention periods use different storage.
  • It can’t see replication factor or compression, which change actual bytes on disk.
  • It can’t see consumer fan-out. A topic read by ten consumer groups looks the same as one read by one.

Other factors can drive your costs, such as egress (consumer read volume), partition count, or storage retention. In that case, you can adapt the same pipeline to use a different allocation weight or a blended model.

Report unallocated charges (data transfer, tiered storage, MSK Connect) explicitly so finance has a more complete picture.

Prerequisites

Before you begin, make sure you have:

  • An active Amazon MSK Provisioned cluster with topics carrying traffic. (Amazon MSK Serverless is out of scope. It bills differently and does not expose per-topic BytesInPerSec.)
  • AWS CUR (or AWS Data Exports for CUR 2.0) delivering Parquet to Amazon S3 with resource IDs enabled. Uses CUR 2.0 snake_case column names.
  • An AWS Glue catalog table over the CUR data with correct partition configuration.
  • Permissions to create AWS Lambda functions, IAM roles, Athena tables, and Quick Sight resources.
  • Quick Sight Enterprise edition (for SPICE datasets and row-level security in the reporting layer).
  • For Option B only: a private subnet in the MSK virtual private cloud (VPC) for the scraper, and an Amazon Managed Service for Prometheus workspace.

Timing: CUR lags up to 24 hours. Per-topic metrics exist only from the moment you enable them.

Sourcing per-topic usage: Two options

How you collect per-topic usage is the main design decision in this solution, because it determines your monitoring cost and setup effort. The pipeline supports both options, and you select one with the METRIC_SOURCE environment variable.

When you set Enhanced Monitoring to PER_TOPIC_PER_BROKER, MSK publishes per-topic throughput metrics to CloudWatch. The Lambda function aggregates each topic’s daily usage with GetMetricStatistics calls.

Option A path: Amazon MSK publishes per-topic metrics to CloudWatch, which the allocation Lambda function reads directly

Figure 2: Option A collection path. Amazon MSK publishes per-topic metrics to CloudWatch, and the allocation function reads them directly

Code sample — reading per-topic metrics from CloudWatch:

result = cloudwatch.get_metric_statistics(
    Namespace='AWS/Kafka', MetricName='BytesInPerSec',
    Dimensions=[
        {'Name': 'Cluster Name', 'Value': cluster_name},
        {'Name': 'Broker ID', 'Value': str(broker_id)},
        {'Name': 'Topic', 'Value': topic},
    ],
    StartTime=day_start, EndTime=day_end,
    Period=86400, Statistics=['Sum'],
)

Note: BytesInPerSec is a rate. Period=86400 with Statistics=[Sum] returns a valid relative weight for proportional allocation, not total bytes.

Why start here: Nothing to deploy. Change one cluster setting and metrics appear in CloudWatch.

The trade-off: CloudWatch bills per metric. PER_TOPIC_PER_BROKER publishes a metric set for every topic-broker pair, so cost grows with both.

Scaling tip: At scale (over 50 clusters, over 200 topics), switch to GetMetricData (up to 500 metrics per call) instead of iterating GetMetricStatistics.

Option B (cost-optimized): Open Monitoring with Amazon Managed Service for Prometheus

Kafka brokers expose operational metrics through Java Management Extensions (JMX). Amazon MSK Open Monitoring makes these infrastructure metrics available in Prometheus format on port 11001 at no cost.

You run a scraper (AWS Fargate with an AWS Distro for OpenTelemetry (ADOT) Collector) that forwards metrics to a Prometheus workspace through SigV4 remote write. The task role needs the aps:RemoteWrite permission.

Option B path: a VPC scraper collects JMX metrics and remote-writes them to Amazon Managed Service for Prometheus

Figure 3: Option B collection path. A VPC scraper collects JMX metrics at no additional charge and forwards them to Prometheus

Scraper configuration (Prometheus agent):

global:
  scrape_interval: 60s
  external_labels:
    cluster_name: "<your-cluster-name>"  # allocation query filters on this

scrape_configs:
  - job_name: msk-jmx
    metrics_path: /metrics
    static_configs:
      - targets:
          - "b-1.<cluster>.<id>.kafka.<region>.amazonaws.com:11001"
          - "b-2.<cluster>.<id>.kafka.<region>.amazonaws.com:11001"

remote_write:
  - url: https://aps-workspaces.<region>.amazonaws.com/workspaces/<workspace-id>/api/v1/remote_write
    sigv4:
      region: <region>
      role_arn: arn:aws:iam::<central-account-id>:role/MskPromRemoteWriteRole
    queue_config:
      capacity: 2500
      max_samples_per_send: 1000

Get broker hostnames from GetBootstrapBrokers. For dynamic lists, use Prometheus file_sd_configs.

PromQL query for per-topic usage:

sum by (topic) (
  avg_over_time(
    kafka_server_BrokerTopicMetrics_OneMinuteRate_BytesInPerSec{cluster_name="<cluster>"}[1d]
  )
) * 86400

This averages broker rates over 24 hours into one value per topic, producing a comparable weight.

Open Monitoring is available at no additional charge and the Prometheus workspace bills on samples ingested, so metric cost grows slowly. This suits large fleets.

How the function discovers topics

The function resolves topic lists through a tiered lookup:

  1. Static topic map – An environment variable holding JSON keyed by cluster name. No API calls needed. Works well when you already track topic ownership in config or infrastructure code.
  2. Amazon MSK ListTopics API – Control-plane call, no VPC connectivity needed.
  3. CloudWatch ListMetrics – Reads topics from metric dimensions (Enhanced Monitoring only).
  4. Previous allocation output – Falls back to yesterday’s topic list from S3.

The tiered lookup keeps the function working whether or not Enhanced Monitoring is enabled:

def discover_topics(cluster_name, kafka_client=None, cluster_arn=None):
    """Resolve the topic list without requiring Enhanced Monitoring.
    Tiers are tried in order; the first that returns topics wins."""
    # Tier 1: static map from an env var (no API calls). Set TOPIC_LIST_JSON
    # to a JSON object keyed by cluster name, e.g. {"<cluster>": ["<topic>", ...]}
    if TOPIC_LIST_JSON:
        mapping = json.loads(TOPIC_LIST_JSON)
        if cluster_name in mapping:
            return set(mapping[cluster_name])
    # Tier 2: MSK ListTopics API - works at DEFAULT monitoring, no extra cost
    if kafka_client and cluster_arn:
        topics = _discover_topics_via_msk_api(kafka_client, cluster_arn)
        if topics:
            return topics
    # Tier 3: CloudWatch ListMetrics - only returns topics when Enhanced
    # Monitoring (PER_TOPIC_PER_BROKER) is enabled
    topics = _discover_topics_via_cloudwatch(cluster_name)
    if topics:
        return topics
    # Tier 4: fall back to the topic list from yesterday's allocation output in S3
    return _topics_from_previous_allocations()

Choosing between the options

For steady topics, both options typically produce comparable results. The choice is cost and operating model:

Option A: Enhanced Monitoring Option B: Open Monitoring + Prometheus
Per-topic metric cost ~$90/cluster/month None (Open Monitoring is at no additional charge)
Additional infra cost None ~$11/cluster/month (scraper + workspace)
Setup effort Change one cluster setting Deploy scraper, workspace, and VPC networking
Ongoing operations None Maintain one scraper per VPC
Scaling behavior Grows with topics × brokers Grows slowly from a much lower base
Time to first allocation Next day Next day (after a few days of setup)

Note: Figures are illustrative, not AWS list prices. Recalculate using the CloudWatch, Prometheus, and Fargate pricing pages.

Guideline: if monitoring cost is below 5 percent of MSK spend, take Option A. Above 10 percent, Option B repays the setup quickly.

You can enable Enhanced Monitoring only on clusters where chargeback accuracy matters, and switch to Option B later with one environment variable change.

Deploying the allocation pipeline

Deploy with AWS Cloud Development Kit (AWS CDK). The core Lambda function (Python 3.11, 1 GB, 10-min timeout) uses the AWS SDK for pandas layer for Parquet processing. Two triggers invoke the function, for resilience:

  • An Amazon S3 event notification fires when a new CUR Parquet file arrives, so allocation runs as soon as fresh cost data lands.
  • An Amazon EventBridge rule runs daily at 06:00 UTC as a fallback, in case the S3 event doesn’t arrive or CUR delivery lags.

Set METRIC_SOURCE to cloudwatch for Option A or prometheus for Option B. For Option B, you also supply the workspace query endpoint and label names.

The handler at a glance

The following handler function orchestrates the five-step pipeline. Each step delegates to a dedicated function, described in the sections that follow.

def handler(event, context):
    """Lambda entry point --- runs the five-step pipeline once per invocation."""
    # Step 1: read cluster cost from CUR (MSK rows only)
    daily_cur = read_cur_costs_via_athena()
    if not daily_cur:
        return _resp(200, 'No MSK costs found in CUR data')
    # Step 2: bridge identifiers - group cluster ARNs by account
    clusters_by_account = _group_clusters_by_account(daily_cur)
    # Steps 3-4: read per-topic usage and allocate cost proportionally, per cluster
    all_rows, errors = [], []
    for account_id, cluster_arns in clusters_by_account.items():
        try:
            all_rows.extend(process_account(account_id, cluster_arns, daily_cur))
        except Exception as e:
            errors.append({'account': account_id, 'error': str(e)})
    # Step 5: publish results - write Parquet to S3, refresh the Athena table
    write_allocations(all_rows)
    refresh_allocation_table()
    return _resp(200, {'rows_written': len(all_rows), 'errors': len(errors)})

CDK stack – Lambda function definition:

allocation_fn = lambda_.Function(
    self, "AllocationProcessor",
    runtime=lambda_.Runtime.PYTHON_3_11,
    handler="handler.handler",
    code=lambda_.Code.from_asset("src/lambda/allocation_processor"),
    timeout=Duration.minutes(10),
    memory_size=1024,
    dead_letter_queue=dlq,
    environment={
        "OUTPUT_BUCKET": allocation_bucket.bucket_name,
        "ATHENA_DATABASE": cur_database_name,
        "CUR_TABLE_NAME": cur_table_name,
        "ATHENA_OUTPUT": f"s3://{allocation_bucket.bucket_name}/athena-results/",
        # Option A. Switch to "prometheus" for Option B.
        "METRIC_SOURCE": "cloudwatch",
        # Option B only:
        # "AMP_QUERY_URL": "https://aps-workspaces.<region>.amazonaws.com/"
        # "workspaces/<workspace-id>/api/v1",
        # "AMP_CLUSTER_LABEL": "cluster_name",
        # "AMP_TOPIC_LABEL": "topic",
    },
    layers=[pandas_layer],
)

Triggers:

# Trigger 1: process when new CUR data arrives
cur_bucket.add_event_notification(
    s3.EventType.OBJECT_CREATED,
    s3n.LambdaDestination(allocation_fn),
    s3.NotificationKeyFilter(prefix="cur-clean/", suffix=".parquet"),
)

# Trigger 2: daily schedule as fallback
daily_rule = events.Rule(
    self, "DailyAllocationRule",
    schedule=events.Schedule.cron(hour="6", minute="0"),
)
daily_rule.add_target(targets.LambdaFunction(allocation_fn))

The stack provisions an Amazon Simple Queue Service (Amazon SQS) dead-letter queue with 14-day retention for failed invocations, Amazon Simple Notification Service (Amazon SNS) alerts, and CloudWatch alarms. To subscribe your team, add sns.Topic.add_subscription(subscriptions.EmailSubscription("[email protected]")) in CDK, or subscribe manually through the Amazon SNS console.

The stack creates the AWS Glue table over the allocation output, so you don’t need to write DDL by hand. Deploy it with:

cdk bootstrap  # once per account and Region
cdk deploy

Invoke the function once manually to produce a first allocation.

Reading CUR efficiently at scale

The function queries CUR through Amazon Athena to get only MSK rows. Filter on partition columns so Athena prunes whole partitions:

SELECT line_item_resource_id, line_item_usage_start_date,
       line_item_unblended_cost, line_item_operation
FROM "<cur_database>"."<cur_table>"
WHERE billing_period IN ('<current_month>', '<previous_month>')
  AND line_item_product_code = 'AmazonMSK'
  AND line_item_resource_id LIKE 'arn:aws:kafka:%'
  AND line_item_usage_start_date >= TIMESTAMP '<start_of_prev_month>'
  AND line_item_unblended_cost != 0

The query reads two months because AWS can update CUR line items after the first delivery. Adjust arn:aws:kafka: for GovCloud or the China Regions.

Publishing and querying the results

The function writes allocation results to Amazon S3 as Snappy-compressed Parquet, partitioned by billing period. Each row covers one topic on one day with cluster identity, usage weight, and allocated cost.

Each run overwrites the file for its billing period. This helps prevent double-counting on CUR redeliveries.

Output schema:

Field Description
account_id AWS account that owns the cluster
cluster_name, cluster_arn MSK cluster identity and join key back to the CUR
topic_name Kafka topic
client_id Owning team or client (from a configurable mapping)
allocation_date, year, month The day this row covers, plus year and month for convenient filtering
bytes_in Topic ingress used as the allocation weight
run_cost, storage_cost, total_cost Allocated cost components
**cluster_*_cost_day** Cluster totals for that day (for reconciliation against the bill)
allocation_method “proportional” or “equal_split” – explains anomalies without re-running
generated_at Timestamp of the run that produced this row

Verifying the numbers

Run this reconciliation query before publishing a dashboard. Schedule it as a Lambda post-step with an AllocationVariance CloudWatch alarm:

SELECT allocation_date,
       cluster_name,
       SUM(total_cost) AS allocated,
       MAX(cluster_run_cost_day + cluster_storage_cost_day) AS billed,
       SUM(total_cost) - MAX(cluster_run_cost_day + cluster_storage_cost_day) AS variance,
       MAX(allocation_method) AS method,
       COUNT(*) AS topics_charged
FROM topic_cost_allocation
WHERE billing_period = '<YYYY-MM>'
GROUP BY allocation_date, cluster_name
HAVING ABS(SUM(total_cost)
    - MAX(cluster_run_cost_day + cluster_storage_cost_day)) > 0.01
ORDER BY allocation_date;

An empty result means allocations reconcile. Rows indicate days where topic discovery and cost data disagreed.

Mapping topics to teams

The function derives owners from topic naming conventions. Pass an explicit topic-to-team map where conventions fail. Unmapped topics appear as unfamiliar owners.

Visualizing cost by topic in Quick Sight

Create an Athena data source in Quick Sight, import into SPICE, and schedule daily refreshes.

A useful dashboard typically includes:

  • A detail table of cost by team, topic, and month.
  • A bar chart of total cost by topic.
  • Filter controls for cluster, topic, and time period.

Apply Quick Sight row-level security against client_id so teams see only their own numbers. Row-level security requires Enterprise edition.

Extending to multiple accounts

The pipeline extends to multi-account setups:

  • The central account reads the consolidated CUR.
  • The Lambda function assumes a read-only role in each member account (by using AWS Security Token Service (AWS STS)) to list clusters and read usage, writing one consolidated dataset.
  • For Option B, a single central Prometheus workspace receives remote-writes from every member account’s scraper, each stamping its own cluster_name label.

One dataset and one dashboard across all accounts.

Multi-account setup: a central tooling account runs the pipeline and assumes read-only roles in member accounts

Figure 4: Multi-account extension. The central tooling account owns the pipeline and reaches into member accounts through a scoped, read-only role

Security considerations

This pipeline reads billing data and crosses account boundaries.

Grant the central execution role only the permissions it needs to: read the CUR and Glue catalog, run Athena queries, write to the allocation S3 bucket, and assume member-account roles.

Member-account role is read-only. Require a shared external ID on every AssumeRole call to help mitigate the confused-deputy problem.

For Option B, restrict port 11001 to the scraper’s security group. Consider AWS PrivateLink for remote write.

Encrypt CUR, allocation output, and Athena results at rest using SSE-KMS (recommended for financial data). Use TLS to encrypt data in transit, including the scraper’s remote write and Athena connections.

The output reveals what every team spends. Treat the output bucket and Quick Sight dataset as financial reports.

Cost of running the solution

The pipeline itself is inexpensive (Lambda, Athena, S3, Amazon EventBridge are negligible). Two items dominate:

  • The metric source: ~$90 (Option A) compared to ~$11 (Option B) per month on the example cluster.
  • Quick Sight user licenses: frequently the largest cost, scaling with how many people get access.

Clean up

To avoid ongoing charges, remove the resources you created. Delete Athena query result files and the CUR delivery configuration if created solely for this solution.

cdk destroy

If you enabled Enhanced Monitoring solely for this solution, return to the previous level. For Option B, remove the scraper and Prometheus workspace.

Conclusion

This pipeline bridges cluster-level CUR cost to topic-level usage, giving each team visibility into its share of the spend. Switch between monitoring options with one environment variable. Pick a cluster and run the allocation to get started.

Learn more:


About the authors

Durai Krishnan

Durai Krishnan

Durai is a Senior Customer Solution Manager at Amazon Web Services (AWS) with rich background in consulting and leadership. Durai specializes in guiding customers through their cloud journey, focusing on migration, modernization, and cost optimization strategies.

Ganesh Thiyagarajan

Ganesh Thiyagarajan

Ganesh is a Senior Solutions Architect at Amazon Web Services (AWS) with over 20 years of experience in software architecture, IT consulting, and solution delivery. He helps ISVs transform and modernize their applications on AWS. He is also part of the AI/ML Technical field community, helping customers build and scale Gen AI solutions.

Test your applications against AWS locally with AWS Emulator

Post Syndicated from Daniel Abib original https://aws.amazon.com/blogs/aws/test-your-applications-against-aws-locally-with-aws-emulator/

Today we’re announcing AWS Emulator, a local emulator for Amazon Web Services (AWS) that you run on your machine. The AWS Command Line Interface (AWS CLI), the AWS SDKs, and your coding agents speak to it over a local HTTPS endpoint using the same AWS APIs they would use in the cloud, from your laptop. AWS Emulator has no additional service fee. You pay only for AWS resources when you deploy on AWS. Its source is on GitHub. You install it from an RPM or Debian package on Linux, and on macOS and Windows you run it in Docker.

How it works
You install the emulator, start it, and point your tools at the local endpoint. When AWS Emulator starts, it generates its own credentials, a config file, and a certificate, and writes them to ~/.aws/emulator/9297/. You set environment variables so the AWS SDK talks to your laptop instead of AWS, and your application code stays unchanged.

From there, your existing tests, CLI scripts, and coding agents keep working the way they already do. A unit test that creates an Amazon DynamoDB table, writes an item, and reads it back is the same test, and it runs on your machine without a deployment. A coding agent can create resources, check the result, and iterate again without waiting on a deployment in a Region.

The emulator is implemented in Rust so that it stays light on CPU and memory on a laptop. It supports the APIs of AWS services that have an API model in the AWS API models repository on GitHub, and because it’s built from those models, the same ones the AWS SDKs use, your requests and the errors you get back have the same shape as on AWS.

If you are a developer, especially one working with coding agents such as Kiro or Claude Code, you can use that loop to test AWS interactions of real complexity locally.

Let’s try it out
To get started, I installed the package on Amazon Linux 2023. The package adds the aws-emulator command to /usr/bin/, so it’s on the path.

PKG=https://downloads.aws.com/aws-emulator/packages/aws-emulator/LTS/latest
sudo dnf install -y $PKG/aws-emulator-x86_64.rpm

aws-emulator -v

On macOS and Windows, you build a Docker image from the short Dockerfile in the documentation and run the emulator in a container. We don’t publish a ready-made image.

I started the emulator with aws-emulator. It serves HTTPS on 127.0.0.1:9297, so only my own computer can reach it, and it writes its log as JSON lines that show the address, the config file, and the certificate file.

aws-emulator

In another terminal, I set the environment variables that point the AWS CLI at the emulator, and unset any variables that could supply real AWS credentials.

export AWS_ENDPOINT_URL=https://127.0.0.1:9297
export AWS_SHARED_CREDENTIALS_FILE=~/.aws/emulator/9297/emulator_credentials
export AWS_CONFIG_FILE=~/.aws/emulator/9297/config
export AWS_EC2_METADATA_DISABLED=true
export AWS_DISABLE_HOST_PREFIX_INJECTION=true
export AWS_REGION=us-east-1
export AWS_DEFAULT_REGION=us-east-1
unset AWS_ACCESS_KEY_ID AWS_SECRET_ACCESS_KEY AWS_SESSION_TOKEN AWS_PROFILE

The emulator generates new keys each time it starts. Its access key IDs start with EMULATOR, so you can’t mistake them for real AWS keys, and it rejects requests signed with any other keys. To confirm that my shell was talking to the emulator, I checked the health endpoint and the caller identity. The emulator uses a single account, 000000000000.

curl --cacert ~/.aws/emulator/9297/ca.pem https://127.0.0.1:9297/__admin/health

aws sts get-caller-identity

Then I created a bucket, copied in a small object, and listed it.

$ aws s3 mb s3://local-getting-started
make_bucket: local-getting-started

$ echo "hello from the emulator" > hello.txt

$ aws s3 cp hello.txt s3://local-getting-started/
upload: ./hello.txt to s3://local-getting-started/hello.txt

$ aws s3 ls s3://local-getting-started/

With the AWS CLI pointed at my laptop, I had the same commands I already use and a local endpoint that answered them.

Next I wanted to see it the way I actually work now, so with the emulator still running I opened Kiro and asked it to create an Amazon DynamoDB table, write an item, and read it back, all against AWS Emulator rather than my AWS account.

kiro> Using the local AWS Emulator (the environment variables
      are already set in this shell), create a DynamoDB table
      "kiro-demo" with a string key "id", put an item
      {id: "item-1", msg: "hello from kiro"}, then read it
      back with get-item.

$ aws dynamodb create-table --table-name kiro-demo \
    --attribute-definitions AttributeName=id,AttributeType=S \
    --key-schema AttributeName=id,KeyType=HASH \
    --billing-mode PAY_PER_REQUEST

$ aws dynamodb put-item --table-name kiro-demo \
    --item '{"id": {"S": "item-1"}, "msg": {"S": "hello from kiro"}}'

$ aws dynamodb get-item --table-name kiro-demo --key '{"id": {"S": "item-1"}}'

To use the same setup with an existing test suite, I would start the emulator, set the same environment variables in the script that runs the tests, and run them as usual.

Using the emulator in process
Running the emulator as a local process gives you an HTTPS endpoint that works with the AWS CLI and the AWS SDKs through environment variables. Some SDKs need an extra setting to trust the emulator certificate, for example a trust store for the AWS SDK for Java. For tests, there is a second option. AWS Emulator ships an embedded mode that you instantiate directly inside your test process and wire into the SDK through its HTTP client, rather than talking to a separate server over the network. Each embedded instance keeps its own state, so tests do not share buckets, tables, or queues, and you can run many of them in parallel. Embedded mode is available for the AWS SDK for Rust. You add the aws-emulator-embedded crate from GitHub to the [dev-dependencies] section of your Cargo.toml file. The following example creates an Amazon DynamoDB table, writes an item, and reads it back, entirely in process.

use aws_emulator_embedded::{AwsEmulatorEmbedded, EmbeddedOptions};
use aws_sdk_dynamodb::types::{
    AttributeDefinition, AttributeValue, BillingMode, KeySchemaElement, KeyType,
    ScalarAttributeType,
};

#[tokio::test]
async fn put_then_get_returns_the_item() {
    let emulator = AwsEmulatorEmbedded::new(EmbeddedOptions::default());
    let config = aws_config::defaults(aws_config::BehaviorVersion::latest())
        .http_client(emulator.http_client())
        .region(aws_config::Region::new("us-east-1"))
        .credentials_provider(emulator.aws_credentials_provider())
        .load()
        .await;
    let ddb = aws_sdk_dynamodb::Client::new(&config);

    ddb.create_table()
        .table_name("emulator-demo-table")
        .attribute_definitions(
            AttributeDefinition::builder()
                .attribute_name("id").attribute_type(ScalarAttributeType::S)
                .build().unwrap())
        .key_schema(
            KeySchemaElement::builder()
                .attribute_name("id").key_type(KeyType::Hash)
                .build().unwrap())
        .billing_mode(BillingMode::PayPerRequest)
        .send().await.unwrap();

    ddb.put_item()
        .table_name("emulator-demo-table")
        .item("id", AttributeValue::S("item-1".into()))
        .item("msg", AttributeValue::S("hi".into()))
        .send().await.unwrap();

    let got = ddb.get_item()
        .table_name("emulator-demo-table")
        .key("id", AttributeValue::S("item-1".into()))
        .send().await.unwrap();
    assert_eq!(got.item().unwrap().get("msg").unwrap().as_s().unwrap(), "hi");
}

When it runs as a local process, the emulator requires every request to be signed with Signature Version 4 (SigV4), the same way AWS does, and it exposes a /__admin/health endpoint on the same port so a script or a container can wait until it is ready before running tests. By default it also sends anonymous usage and error data, and you can turn it off.

How we measure fidelity
An emulator is only useful if a test that passes against it would also pass against AWS, so we measure that directly with fidelity tests. A fidelity test is a short program that uses an AWS SDK to run a workflow, such as storing an object and then reading and deleting it, and asserts how AWS behaves. We verify each fidelity test against real AWS. A fidelity test passes only if the emulator matches AWS on the response to every call, including the status code, the body, and the exact error code and message, and on the resources and data that the workflow creates.

With each release, we publish how many fidelity tests pass for each service, as k of n. For example, 40 of 50 means that 40 of the service’s 50 fidelity tests pass. The set of fidelity tests is public in the aws-emulator-evaluation-suite repository on GitHub, including the ones that don’t pass yet, so you can see what we verified and run the fidelity tests yourself. Read a score as a snapshot of a product that’s improving. When we add fidelity tests, a score can go down even while the emulator gets better.

If the emulator doesn’t implement an operation yet, it returns HTTP 501 (Not Implemented), so your tests fail right away. If the emulator acts differently from AWS, you can tell us by opening an issue in the AWS Emulator repository on GitHub.

How the emulator is built
AWS Emulator is built and maintained by agents from the AWS API models using Amazon Bedrock AgentCore Runtime Instances, AWS CodePipeline, and AWS CodeCommit, so it stays current with AWS as those models change.

One group of agents looks for gaps, both by comparing emulator responses against real AWS and by statically comparing the emulator’s code against the published Smithy models, and files an issue for each gap it finds. Another group picks up an issue, writes tests, implements the behavior, and reviews the change for correctness, performance, and security. When the change is ready, it is pushed to a source repository, and that push triggers an AWS CodePipeline run that runs the fidelity tests before the change is published to the public GitHub repository.

How we keep it secure
Because the code is written by agents, an independent security agent reviews changes adversarially, both while the fix is being made and again in the release pipeline as a final check before anything ships.

Security of your own use remains a shared responsibility. We build the emulator to run safely on your machine: it listens only on your own computer by default and rejects requests that aren’t signed with its own keys. You decide where it runs, what data you put in it, and how you test before production. Don’t use the emulator to test whether your application is secure. It doesn’t evaluate AWS Identity and Access Management (IAM) policies and resource-based policies the way AWS does, so a request that AWS denies might succeed in the emulator. Keep real credentials out of the environment of your test jobs, and test your security settings and your whole application on AWS before you go to production.

Now available
AWS Emulator is generally available today. It has no additional service fee. You pay only for AWS resources when you deploy on AWS. You can install it from RPM or Debian packages on Linux, run it in Docker on macOS and Windows, or build from source, and it works with the AWS SDKs and the AWS CLI once you set environment variables. At launch, it has some limits. It doesn’t evaluate IAM policies the way AWS does, and each emulator acts as a single account, with no cross-account or cross-Region behavior. How closely it matches AWS varies by service and feature. To see how well the emulator covers the services that you use, check the fidelity scores in the AWS Emulator documentation.

If you want to check regional availability, visit the AWS Capabilities by Region page in AWS Builder Center. If you want to call APIs, search documentation, find regional availability, and check troubleshooting about this new feature, try using the AWS MCP Server and plugins with your preferred AI tool.

To get started, see the AWS Emulator documentation.

Part 4 – Cybersecurity journeys: What I’d tell my younger self

Post Syndicated from Shannon Brazil original https://aws.amazon.com/blogs/security/part-4-cybersecurity-journeys-what-id-tell-my-younger-self/

Over the past few weeks, I’ve introduced you to people who fell into security from the most unexpected places, who work in domains you’ve probably never heard of, and who were honest about what the job is like after the excitement fades and the real work begins. This is the final post in a four-part series following 11 Amazon Web Services (AWS) security professionals through the real stories of how they got here and what the work actually looks like. For this last one, I wanted to end where almost every one of my conversations ended up on its own: the things people wish they’d known sooner.

This one is about hard-won perspective, the kind you only get from doing the uncomfortable thing and coming out the other side. It’s about growth that doesn’t always feel like growth while it’s happening, and the advice these folks would hand to the earlier versions of themselves. If you’ve been with me since Part 1: I didn’t plan this, thank you for sticking around. I hope this last set of stories gives you something to carry into your own path.

Choosing the harder room

Justin Mills, Security Engineer

Justin Mills, Security Engineer

When I asked Justin Mills where someone should start, I expected a certification or a favorite course. His answer started with two words, “seek discomfort,” and his own career shows he means it. Justin is a security engineer with more than a decade in the field, and today he consults on how AI can strengthen security detections. Detections are the rules and models that watch a system’s activity and flag the signs of an attack, and both they and AI are changing faster than most of us can keep up with. What stuck with me was how much faster everything moved after he committed to doing the hard things: he earned two promotions in roughly 2 years.

So I asked him how, and his answer came back to the people around him. What surprised me was that he never went looking for them. Some came through luck, starting with the manager who hired him, and others arrived the way most good working relationships do: he got involved in projects, met the people on them, and the conversations just started flowing. He didn’t push or force any of it.

“Those who are meant to be part of your career story will be part of it, no shoehorning needed.” —Justin Mills

The other half of the equation was trust. Today, Justin works on hard problems, and his manager gives him room to work through them his own way, because he’s shown he can be trusted with that room. His manager even told him so directly: “I trust you to do the right thing and speak for us.” Earning that kind of trust changed how he approached the work. “That forced me to ask the right questions instead of defaulting to what I already knew,” he told me. There’s something important in that framing, because asking good questions isn’t a sign that you don’t belong; it might be the clearest sign that you do.

The lesson he had to learn later was almost the opposite of the one that got him started. Early on, growth meant taking on everything hard himself. As he moved up, it meant the reverse: learning to let go, treating delegation as a skill in its own right, and trusting the people on his team to carry work he could have gripped tightly. When I asked what he’d tell someone who feels stuck, he kept it short.

“Surround yourself with people who push you, not people who make you comfortable. Ask the right questions. Do the hard things. That’s the whole playbook.” —Justin Mills

Pandora’s box and a pile of dust

Tyler Gabor, Technician

Tyler Gabor, Technician

Tyler Gabor has always been the person who takes things apart. He started out selling and fixing cell phones, learning what made them tick, before moving into help desk work. From there he made his way into data center operations, where the hardware went from handheld to industrial and the stakes scaled up with it. “If it lights up or makes noise, I’m messing with it,” he told me, and he meant it.

The jump from help desk to the data center came from preparation. While he was working help desk from home, Tyler studied for a few foundational certifications, and when he could show he knew what he was talking about, he started putting his name in for roles. One of those led to AWS, though not directly: a staffing agency he partnered with placed him on a temporary assignment there, and from that point he had to prove himself all over again to earn a full-time offer. He admits it wasn’t easy and was sometimes scary, and he compares the whole stretch to the Olympics, trying out for a spot on Team Amazon alongside some of the most talented people in the field. “It was the audition of a lifetime,” he told me.

When Tyler explains his work to people outside tech, he reaches for mythology. “It’s kind of like fixing Pandora’s box,” he said, “while also making sure that Pandora doesn’t get outside of the box.” It’s a vivid image for a job that involves testing, repairing, and sanitizing server hardware so the data a machine once held can’t resurface. That can mean wiping a drive, degaussing it (using a powerful magnetic field to scramble the stored data), or physically destroying it. This is security you can physically touch, and as he put it, “It’s a little hard to get intellectual property out of a pile of dust.”

What pulled him in wasn’t a degree program or a bootcamp. It was watching high-profile leaks and breaches dominate the news as a student, which made it clear that security wasn’t an abstract discipline but something shaping real events in the real world. That curiosity never faded; it’s the same impulse that has him tinkering with hardware side projects to this day, like programmable NFC chips (the same short-range wireless technology behind tap-to-pay cards) that he brings to hacker conferences as business cards. That same urge to see what a piece of hardware is really capable of shows up in his day job, too.

One project crystallized the stakes for him. A piece of hardware came through that most people would have assumed was safe to discard, and on closer inspection it was still holding information that should never have left the building. The lesson stuck with him, and he put it the way only Tyler would.

“It doesn’t matter if the front door is locked if all the windows are open.” —Tyler Gabor

What surprised me most, though, was how much he talked about leadership, not in the org-chart sense, but the quiet kind that shows up when your team trusts you to make the right call on your own. He didn’t expect to be trusted with hardware of this caliber, and you could hear how seriously he takes that responsibility. His advice for anyone early in their career, or thinking about the switch, sounds simple but clearly took time to earn: just ask for help, because when you do, people usually give it. And if you’re already in and feeling stuck, prepare for the role you want so you’re ready when it’s time to step up to the plate.

“We are going to witness the greatest leap in human intelligence during our lifetime. As technology grows at an exponential speed, we’re going to need people to keep it in line.” —Tyler Gabor

A short word from Zlata

You might remember Zlata Pavlova from Part 1, where she shared her path from political science to open source investigations and into protective security. I wanted to bring her back for a moment, because something she said has echoed through nearly every conversation in this series: the thing that holds people back is rarely a lack of skill, it’s the quiet suspicion that they don’t belong. Her answer to impostor syndrome is to remind yourself that you do and to build connections early. She spent years assuming her teammates already knew what she knew, and it turned out they often didn’t, because their focus was elsewhere. She also told me the biggest surprise of her current role was how much of it is writing, and especially how much of that writing means translating technical findings for readers who aren’t technical. As you move up in security, the reports, advisories, and briefs you write become one of the clearest signals of your judgment, so practicing that skill early, whether through a blog post, a conference talk, or simply explaining your work to a friend outside the field, pays off for years.

“Don’t feel embarrassed sharing something you think people already know. They might not, and you might help somebody who’s just starting out.” —Zlata Pavlova

The thread

Something I didn’t expect when I started this series was how often people’s earlier jobs turned out to be an advantage rather than a detour. Zlata told me that people who come into security from non-technical careers often explain things better, because they remember what it was like to need the explanation. Tyler’s years in telecommunications, where customers handed him phones that held their whole lives, are what first got him thinking seriously about protecting people’s information. And in Part 3, Brandon’s time administering systems and shipping software gave him the empathy for builders that his application security work depends on. The backgrounds people bring with them are part of why they’re good at this work.

If you’re early in your career and wondering whether you belong here, the people in this series would tell you that you do. If you’re mid-career and feeling stuck, pay attention to whichever story felt familiar, because that’s usually a clue about where to look next. And if this series showed you a corner of security you didn’t know existed, that corner might be a good place to start.

If you want to start, here are a few places to begin:

I’m grateful to everyone who sat down with me and shared their story. Hearing them changed how I think about what this field looks like, and I hope reading them does the same for you as you work out your own path.

What would you tell your younger self about getting into security? Share it on LinkedIn!

This concludes the Cybersecurity Journeys series. Read the full series: Part 1: I didn’t plan this, Part 2: What even is this job?, Part 3: The work behind the work, and Part 4: What I’d tell my younger self.


Shannon Brazil

Shannon is a senior security engineer, managing a team on the AWS Customer Incident Response Team (CIRT), specializing in digital forensics and cloud security investigations. Known in the community as AWSlady, she is passionate about security education and mentoring the next generation of defenders.

Zellij 0.46 released

Post Syndicated from jzb original https://lwn.net/Articles/1106903/

Version
0.46
of the Zellij terminal workspace has
been released.

This release includes a major addition in Zellij: Zellij is now also a
desktop terminal. To run it: zellij terminal. It works on linux, mac and
windows.

Nothing changes for the normal multiplexer – Zellij can still run inside
another terminal. Both sessions are the same and can be shared.

Additional features in this release include a
GUI settings screen, session previews, and right-click menu. See this walkthrough
for more on the 0.46 release.

In Memoriam: Tim Peters 1952–2026

Post Syndicated from corbet original https://lwn.net/Articles/1106901/

Guido van Rossum conveys
the sad (and somewhat delayed) news
of the passing of Tim Peters.

It’s hard to overestimate Tim’s influence on Python. He’s probably
best known for writing the Zen of Python (PEP 20), but to me he
was a mentor and language co-designer long before that.

Tim found Python not long after its initial release. His first deed
was to convince me that Python should support mixed arithmetic
between int and float, because most users would expect them to work
that way. And he never stopped contributing.

Governance compliance beyond the catalog in Amazon SageMaker Unified Studio

Post Syndicated from Amom Luiz original https://aws.amazon.com/blogs/big-data/governance-compliance-beyond-the-catalog-in-amazon-sagemaker-unified-studio/

As your data catalog grows, how do you know which assets meet your organization’s governance standards? Amazon SageMaker Unified Studio provides the building blocks for governance such as metadata form definitions, data quality scores, glossary associations, subscription data, and a daily catalog export queryable through SQL.

A data catalog typically answers what exists as asset names, schemas, and ownership. SageMaker Unified Studio goes further, surfacing governance signals like metadata completeness, data quality scores, and glossary associations for each asset. This pattern brings them together into a single view you can query across all your assets, projects, and data products.

This post walks through how to build that enrichment pipeline and provide an asset scorecard example with an extensible set of dimensions and weights. However, the key takeaway is the pattern itself: after the signals are in one place, your team can define what “compliant” means for your context and manage assets and data products at scale. The pipeline is the foundation, and the business/compliance logic is yours to adapt and evolve.

The governance questions this pattern can answer include:

  • Data Owner: Which of my assets are missing a required metadata form?
  • Data Steward: Which assets have no glossary terms associated?
  • Data Platform team/Managers: Is compliance improving since the team published the new governance rules, within and between projects?
  • Chief Data Officer: Which departments need to work to provide more reliable data products to the organization?

This solution extends Analyzing your data catalog: Query SageMaker Catalog metadata with SQL, which introduced the asset metadata export feature. This post focuses on enriching the metadata export to support an enhanced and data-driven governance compliance strategy.

Solution overview

Architecture diagram showing the daily enrichment pipeline within an AWS account. Five enrichment data sources on the left (Amazon SageMaker Asset Export, Custom Policy Config, Search and GetListings API, GetAssetType API, and ListSubscriptions API) feed an Enrichment Lambda function triggered by an Amazon EventBridge Scheduler. The Lambda writes daily snapshot partitions to the governance_metadata.asset_compliance S3 Table, governed by AWS Lake Formation. Downstream consumers on the right include Amazon Athena for SQL queries, Amazon Quick Sight for the compliance dashboard used by data stewards, data owners, and CDOs, and Amazon EventBridge with SNS and SES for threshold alerts.

Figure 1: Daily governance enrichment pipeline, from the five data sources through the enrichment Lambda function to the Amazon Athena, AWS Quick Sight, and Amazon EventBridge consumers

The enriched compliance table is itself an Amazon Simple Storage Service (Amazon S3) Table asset in the SageMaker catalog queryable inside SageMaker Unified Studio alongside all domain assets.

The enrichment pipeline runs daily and consists of five data sources joined by an enrichment Lambda function:

  1. Amazon SageMaker Asset Metadata Export: the base inventory of all published assets, stored as an S3 Table.
  2. Form Policy Config: an S3 JSON file that defines custom organization-level required forms per project and asset type.
  3. Search / GetListing API: returns glossary terms, attached metadata forms, and a data quality summary per asset.
  4. GetAssetType API: returns the complete data quality rules count per asset.
  5. ListSubscriptions API: returns the number of active consumer subscriptions per published asset.

The pipeline reads from all five sources, computes a weighted compliance score per asset, and writes the result as a new daily snapshot partition to the governance_metadata.asset_compliance S3 Table. Downstream consumers such as Amazon Athena, AWS Quick Sight compliance dashboard, and Amazon EventBridge compliance alerts, read from that enriched table.

The following figure shows the end data product you will build: a compliance dashboard scoring every asset across your projects.

Amazon Quick Sight compliance dashboard showing four KPI cards at the top: Avg Compliance Score (36.59), Assets Without Glossary (27), Assets Without Business Description (28), and Assets Without Resource Description (13). Below, a donut chart titled Assets by Compliance Band shows 28 total assets distributed across Critical (majority), At Risk, and Compliant bands. To the right, a horizontal bar chart titled Assets by Compliance Score ranks assets from lowest to highest, with daily_revenue_report at the top.

Figure 2: Compliance dashboard scoring every asset across your projects, the end product you build

Prerequisites

Before you begin, verify that you have the following in place:

  • Python 3.12 and AWS Cloud Development Kit (AWS CDK) for deployment of the enrichment pipeline from the sample GitHub repository.
  • An Amazon SageMaker Unified Studio domain. This post demonstrates the solution using an AWS IAM Identity Center (IDC)-based domain. You need permission to enable the asset metadata export on the domain (activating the export is covered in Part 1).
  • Published assets in the SageMaker Unified Studio domain: the solution enriches information based on assets already published in the domain.
  • An AWS account with permissions to work with the services used in this solution: AWS Lambda, Amazon Athena, Amazon S3 including Amazon S3 Tables, AWS Glue Data Catalog, AWS Lake Formation, AWS Quick Sight, and Amazon EventBridge.
  • AWS Lake Formation access: The asset metadata export and the enriched table are governed by AWS Lake Formation, so you need to grant the Lambda execution role and the Amazon service role the appropriate DESCRIBE/SELECT permissions (detailed in the aws-samples repository).
  • The AWS Command Line Interface (AWS CLI): configured for your account and target AWS Region.
  • An AWS Quick Sight account in the same Region, required for the dashboard in Part 6.

Estimated time to complete is approximately 2 hours. Estimated cost is less than $5 per month for a small test domain (AWS Lambda invocations, Athena queries, and S3 storage). Costs scale with the number of assets and query volume.

Deploy the solution

The complete source code for this solution is available in the sample-smus-asset-scorecard repository on GitHub. The AWS Cloud Development Kit (AWS CDK) stack provisions all required infrastructure, including the enrichment Lambda function, Amazon S3 policy configuration bucket, Amazon EventBridge Scheduler rule, AWS Identity and Access Management (IAM) roles, and the S3 Table namespace. Follow the walkthrough available in the repository to deploy the solution.

Part 1: The asset metadata export

The asset metadata export serves as the primary data source for the enriched scorecard dataset. To activate the export once per domain, use the following AWS CLI command:

aws datazone put-data-export-configuration \
  --domain-identifier <domain-id> \
  --region <region> \
  --enable-export

Within 24 hours you can read the asset metadata export as an S3 Table in SageMaker Unified Studio query editor (table asset_metadata.asset). You can check the Exporting Asset Metadata official documentation to get more details about the Asset Metadata export. Three fields from the export are used by the enrichment pipeline:

  • asset_id: the identity of each asset in the catalog, and the join key the enrichment uses to map each row to its published listing (Part 3).
  • extended_metadata[‘owningEntityId’]: this single key from the metadata map identifies which project owns the asset, driving the per-project compliance policy lookup in Part 2.
  • business_description and resource_description: the documentation signals that contribute to the description dimension of the compliance score.

The following figure shows an example of the Asset Metadata Export:

Amazon SageMaker query editor showing a SELECT query result for the asset_metadata.asset table with 47 rows. Columns displayed are snapshot_time, asset_id, asset_name, extended_metadata, resource_type_enum, resource_id, and account_id. Sample rows include asset names such as churn, user_sessions_silver, ad_hoc_export_2025, raw_clickstream_events, daily_revenue_report, and monthly_active_users, all of type GlueTable. The account_id column is masked.

Figure 3: Example of the asset metadata export queried in the SageMaker query editor

Part 2: The policy layer: Defining mandatory metadata forms

The export tells you what metadata form fields are filled. But required is a two-level concept in this solution:

Level 1: Amazon SageMaker Unified Studio metadata enforcement rules. You can configure mandatory metadata forms for publishing and subscription flows. These enforcement rules are defined at the asset-type level. You can call the GetAssetType API and inspect the required boolean in formsOutput.

Level 2: Custom organization-defined requirements. This solution also accounts for required metadata forms that lack enforcement rules, but your organization still considers mandatory. For example, a project might require a DataClassificationForm on every Glue table, even though SageMaker Unified Studio itself doesn’t enforce it at the asset-type level. These project-specific rules don’t exist as a native API endpoint, they can be stored externally in an S3 configuration file.

The enrichment pipeline reads both layers and takes their union. The SageMaker Unified Studio enforcement rules come from GetAssetType API per asset type and the custom organization-specific overrides come from a policy file stored in Amazon S3. Change the following sample file with the project IDs and required forms for your use case and put it in the S3 bucket created with CDK (see the Walkthrough section in the Readme of sample repository):

{
  "default": {
    "required_forms": ["DataClassification"]
  },
  "projects": {
    "<project-id-1>": {
      "required_forms": ["DataClassification", "CriticalityForm"]
    },
    "<project-id-2>": {
      "required_forms": ["DataClassification", "CriticalityForm", "OwnershipForm"]
    }
  }
}

The S3 configuration file is updated whenever your governance policy evolves. The GetAssetType call ensures the pipeline always respects whatever enforcement rules are defined in SageMaker Unified Studio, including any new rules created in future revisions.

Part 3: The enrichment pipeline

The enrichment pipeline reads the latest export snapshot and joins it with governance facets from the published catalog through GetListing. It then merges the compliance policy from both enforcement rules (GetAssetType) and the custom organization-defined policy file. The complete implementation with annotated code is available in the aws-samples repository.

The enrichment Lambda reads the latest asset metadata export, calls the APIs for the dimensions not present in the export (data quality scores and glossary associations), and writes one enriched compliance record per asset.

3.1 The compliance score

The compliance score combines five independent dimensions, each contributing a weighted percentage as the following table shows:

Dimension Weight Signal
Form coverage 50% % of required forms present compared to policy
Data quality score 20% Data quality pass/fail percentage
Data quality rule coverage 10% Actual rules compared to minimum expected
Glossary presence 10% Has at least 1 glossary term
Description 10% Has a business or resource description

Weights and the minimum data quality rules threshold are configurable. Adjust them to reflect your organization’s governance priorities.

3.2 Run the enrichment pipeline

To run the pipeline, invoke the Lambda function as shown in the following example:

aws lambda invoke \
  --function-name gov-obs-enrichment \
  --region <region> \
  --cli-binary-format raw-in-base64-out \
  --payload '{}' /tmp/response.json

Part 4: The governance answers

With the enriched table available, the governance questions listed at the beginning of the post can be answered using SQL queries against the enriched table.

4.1 Assets missing required forms

The following query returns the list of assets missing required forms:

SELECT
    asset_name,
    project_name,
    missing_required_forms,
    dq_score,
    dq_rules_count,
    overall_compliance_score
FROM "s3tablescatalog/gov-obs-data"."governance_metadata"."asset_compliance"
WHERE snapshot_date = CAST(CURRENT_DATE AS VARCHAR)
AND json_array_length(missing_required_forms) > 0
ORDER BY overall_compliance_score ASC;
Amazon SageMaker query editor showing the enriched asset_compliance table result with 27 rows. Columns are asset_name, project_name, missing_required_forms, dq_score, dq_rules_count, and overall_compliance_score. Sample rows show fact_orders in the data-engineering project with a score of 16.67, raw_email_events in marketing-analytics with 25.0, and raw_clickstream_events in admin-project with 25.0. The project name containing the account ID is masked.

Figure 4: Query result listing the assets that are missing required metadata forms

4.2 Compliance scorecard per project

To explore the scorecard grouped by project, run the following query:

SELECT
    project_name,
    COUNT(*) AS total_assets,
    ROUND(AVG(overall_compliance_score), 1) AS avg_compliance_score,
    COUNT(CASE WHEN json_array_length(missing_required_forms) > 0 THEN 1 END) AS assets_with_form_gaps,
    COUNT(CASE WHEN dq_score >= 80 THEN 1 END) AS assets_passing_dq
FROM "s3tablescatalog/gov-obs-data"."governance_metadata"."asset_compliance"
WHERE snapshot_date = CAST(CURRENT_DATE AS VARCHAR)
GROUP BY project_name
ORDER BY avg_compliance_score ASC;
Amazon SageMaker query editor showing a project-level aggregation result with 3 rows. Columns are project_name, total_assets, avg_compliance_score, assets_with_form_gaps, and assets_passing_dq. Results show admin-project (22 assets, avg score 16.0, 20 form gaps, 2 passing data quality), data-engineering (4 assets, score 31.1, 4 form gaps, 0 passing data quality), and marketing-analytics (3 assets, score 40.0, 3 form gaps, 0 passing data quality). The project name containing the account ID is masked.

Figure 5: Per-project compliance scorecard aggregation

4.3 Compliance trend since rule publication

To answer how your assets are evolving since you published new rules you can run the following query:

SELECT
    snapshot_date,
    ROUND(AVG(overall_compliance_score), 1) AS avg_compliance_score,
    COUNT(*) AS total_assets,
    COUNT(CASE WHEN json_array_length(missing_required_forms) = 0 THEN 1 END)
    AS fully_compliant_assets
FROM "s3tablescatalog/gov-obs-data"."governance_metadata"."asset_compliance"
WHERE snapshot_date >= '2026-05-01' -- replace with your governance policy publish date
GROUP BY snapshot_date
ORDER BY snapshot_date;
Amazon SageMaker query editor showing a time-series compliance trend result with 3 rows. Columns are snapshot_date, avg_compliance_score, total_assets, and fully_compliant_assets. Rows show 2026-06-27 (score 36.6, 28 assets, 2 compliant), 2026-06-28 (score 36.6, 28 assets, 2 compliant), and 2026-06-29 (score 36.2, 29 assets, 2 compliant).

Figure 6: Compliance trend across daily snapshots since the governance policy was published

Part 5: Alerting on non-compliant assets

You can go further and use Amazon EventBridge Scheduler combined with AWS Lambda to send weekly reports and alert your team when compliance drops below a defined threshold:

def handler(event, context):
    # Query compliance for today
    df = wr.athena.read_sql_query(
        sql="""
        SELECT project_name,
        COUNT(*) FILTER (WHERE json_array_length(missing_required_forms) > 0) AS non_compliant
        FROM "s3tablescatalog/gov-obs-data"."governance_metadata"."asset_compliance"
        WHERE snapshot_date = CAST(CURRENT_DATE AS VARCHAR)
        GROUP BY project_name
        HAVING COUNT(*) FILTER (WHERE json_array_length(missing_required_forms) > 0) > 0
        """,
        database="governance_metadata"
    )
    if not df.empty:
        # Send alert using Amazon SNS, a Slack webhook, Amazon SES, and so on.
        send_governance_alert(df)

You can configure the Amazon EventBridge Scheduler rule to fire on a weekly schedule or daily if your organization requires tighter compliance monitoring. The send_governance_alert function is illustrative and can be routed to any channel your team prefers: Amazon Simple Notification Service (Amazon SNS) topics, Amazon Simple Email Service (Amazon SES), or a Slack webhook through an HTTP call.

Part 6: Building a governance dashboard with AWS Quick Sight

With the enriched governance table producing daily compliance scores, the final step is making these insights visible to stakeholders through an actionable and interactive dashboard. AWS Quick Sight connects directly to Amazon Athena, so you can visualize the compliance table directly.

6.1 Connecting and configuring AWS Quick Sight with the enriched table

Grant the AWS Quick Sight service role (aws-quicksight-service-role-v0) Lake Formation DESCRIBE and SELECT permissions on governance_metadata.asset_compliance. You can see details of grants needed in the aws-samples repository. In the repository you also can see a Python script which creates AWS Quick Sight data source, datasets and a complete dashboard with the compliance data, as the following figure shows:

Amazon Quick Sight compliance dashboard showing four KPI cards at the top: Avg Compliance Score (36.59), Assets Without Glossary (27), Assets Without Business Description (28), and Assets Without Resource Description (13). Below, a donut chart titled Assets by Compliance Band shows 28 total assets distributed across Critical (majority), At Risk, and Compliant bands. To the right, a horizontal bar chart titled Assets by Compliance Score ranks assets from lowest to highest, with daily_revenue_report at the top.

Figure 7: Compliance dashboard connected to the enriched table in AWS Quick Sight

Amazon Quick Sight Governance Dashboard showing four horizontal bar charts comparing three projects (marketing-analytics, admin-project, and data-engineering). Top left: Avg Score by Project: marketing-analytics leads at 40, followed by admin-project around 37, and data-engineering at 31. Top right: Avg data quality Score by Project: data-engineering leads at approximately 26. Bottom left: Avg data quality Rules by Project: admin-project and marketing-analytics near 1.8, data-engineering at 1.2. Bottom right: Assets With Form Gaps by Project: admin-project has the most at approximately 19.

Figure 8: Per-project comparison charts in the governance dashboard

6.2 Create visualization using natural language

Use the natural language Build feature in AWS Quick Sight to create each visualization with a plain-language prompt:

Visualization Natural language prompt Purpose
Compliance scorecard “Show average overall_compliance_score by project_name as a bar chart” Per-project accountability
Compliance band distribution “Show count of asset_name by compliance_band as a pie chart” Executive summary
Score trend over time “Show average overall_compliance_score by snapshot_date as a line chart” Is governance improving?
Form gap breakdown “Show count of asset_name where missing_required_forms is not empty by project_name as a stacked bar” Which teams have metadata form gaps?
Glossary coverage “Show count of asset_name where glossary_terms_count equals 0 as a KPI” How many assets have no terms?
Data Quality coverage “Show average dq_rules_count by project_name as a bar chart” Which projects lack data quality rules?
Amazon Quick Sight analysis editor showing the AutoGraph builder. On the left, the Asset Compliance dataset field list includes asset_name, compliance_band, dq_rules_count, dq_score, glossary_terms_count, missing_required_forms, overall_compliance_score, project_name, and snapshot_date. On the right, the Build a visual panel shows a natural language query typed as: Show average overall_compliance_score by project name, with a BUILD button and example prompts visible.

Figure 9: Building a visualization with a natural language prompt in the AWS Quick Sight analysis editor

Amazon Quick Sight: Build a visual panel showing the query interpreted as: Average of Overall Compliance Score by Project Name. The resulting horizontal bar chart displays three projects: marketing-analytics (40), admin-project-29 (37.15), and data-engineering (31.09), with an ADD TO ANALYSIS button at the bottom.

Figure 10: Natural language prompt interpreted as average compliance score by project

This produces an AWS Quick Sight dashboard built on top of the enriched table that delivers actionable governance, not raw metadata counts. Stakeholders see compliance scores, form gaps, and improvement trends without needing to understand the underlying API model.

Amazon Quick Sight horizontal bar chart titled Average of Overall Compliance Score by Project Name, part of the SageMaker Unified Studio Scorecard dashboard. Three bars are shown: marketing-analytics at 40, admin-project at approximately 37, and data-engineering at 31.09, on a scale from 0 to 40.

Figure 11: Average overall compliance score by project rendered as a bar chart

For a deeper walkthrough of the natural language Build approach applied to the raw export table, see Build governance dashboards for Amazon SageMaker Catalog with AWS Quick Sight. The same technique applies to your enriched compliance table with the richer signals added by this pipeline.

Part 7: Seeing the pipeline in action

To illustrate how to apply these concepts, consider a domain with 20 published AWS Glue table assets across three projects, each at a different governance maturity level. After the daily enrichment runs, querying the compliance table immediately surfaces the differences.

7.1 Per-project scorecard

Briefly, you can see which teams are investing in governance and which ones need attention. The marketing-analytics leads because its assets have metadata forms, glossary terms, and data quality rules configured, while the other two projects have only basic data quality checks in place.

Amazon Quick Sight: Amazon SageMaker Scorecard dashboard showing three visuals. Top left KPI card displays 16 unique assets. Bottom left horizontal bar chart titled Average of Overall Compliance Score by Project Name shows marketing-analytics at 40, admin-project at 37.15, and data-engineering at 31.09. Right side pie chart titled Unique number of Asset Name by Compliance Band shows Critical at 75% (15 assets), At Risk at 20% (4 assets), and Compliant at 5% (1 asset).

Figure 12: Per-project scorecard with compliance score and compliance band distribution

7.2 Drilling into individual assets

Based on compliance score defined previously as example, you can see the governance maturity into clear bands:

Score Band Typical profile
80–100 Fully governed All required forms present, glossary terms linked, data quality passing, description provided
60–79 Mostly governed Required forms present, but missing either glossary terms or data quality coverage
40–59 Partially governed Some required forms missing, or forms present but no glossary or data quality
20–39 Data quality only Data quality rules configured and running, but no governance forms, glossary, or description
1–19 Minimally documented Only a description present, but no forms, no data quality rules, no glossary
0 Ungoverned No forms, no glossary, no data quality rules, no description

The pipeline produces this output automatically on every scheduled run without manual intervention required. The Amazon EventBridge Scheduler fires daily, enriches the latest snapshot, and writes the compliance scorecard to the Iceberg table. A single Athena query then produces the per-project, per-asset view shown here.

Scalability note: in our test scenario with a domain of 29 published Glue Table assets across three projects, the enrichment Lambda completed in approximately 30 seconds. For organizations with larger domains and production environment, consider parallelizing asset enrichment calls and increasing Lambda memory allocation. For very large catalogs, a fan-out pattern using AWS Step Functions can distribute the workload across multiple Lambda invocations.

7.3 Consumption-weighted risk: who is using ungoverned data?

Compliance scores tell you what is below the required threshold. But not all compliance findings carry equal urgency. An asset with a score of 10 that five projects depend on might require immediate attention. The enrichment pipeline adds a subscription count per asset which represents the number of projects that have an approved subscription to consume it. This comes from the ListSubscriptions API, filtered by subscribedListingId (every published asset has a listing). Combined with the compliance score, it produces a risk matrix, as the following example shows:

Quadrant Compliance Subscriptions Recommended Action
Gold standard >= 80 High No action: well governed and well adopted
Over-invested >= 80 Zero Review: strong governance on unused assets
Backlog < 50 Zero Plan: low risk, improve over time
Critical < 50 >= 2 Act now: many consumers depend on ungoverned data

The risk-view query joins both columns:

SELECT
    asset_name,
    project_name,
    subscription_count,
    overall_compliance_score,
    CASE
        WHEN subscription_count >= 2 AND overall_compliance_score < 50 THEN 'CRITICAL'
        WHEN subscription_count >= 1 AND overall_compliance_score < 50 THEN 'MEDIUM_RISK'
        ELSE 'OK'
    END AS risk_level
FROM "s3tablescatalog/gov-obs-data"."governance_metadata"."asset_compliance"
WHERE snapshot_date = CAST(CURRENT_DATE AS VARCHAR)
AND subscription_count > 0
ORDER BY subscription_count DESC, overall_compliance_score ASC;
Amazon SageMaker query editor showing a subscribed asset risk query result with 4 rows. Columns are asset_name, project_name, subscription_count, overall_compliance_score, and risk_level. Results show daily_revenue_report (2 subscriptions, score 99.6, OK), user_sessions_silver (1 subscription, score 35.0, MEDIUM_RISK), churn (1 subscription, score 52.0, OK), and monthly_active_users (1 subscription, score 60.0, OK). The project name containing the account ID is masked.

Figure 13: Risk query joining compliance score and subscription count to prioritize ungoverned assets

This turns your governance dashboard from a passive scorecard into a prioritization engine and asset teams know exactly where to focus based on both compliance gaps and downstream impact.

7.4 Extending to data products

With SageMaker Unified Studio, data producers can group related assets into data products, which are versioned, self-contained packages aligned to a business use case. Data consumers subscribe to a data product in a single request and receive access to all its member assets at once.

With this structure, you can aggregate compliance at the data product level. Build an asset_id -> data_product_name mapping by iterating over all projects. The data product scorecard query then rolls up compliance metrics across all assets in each product:

SELECT
    COALESCE(NULLIF(data_product_name, ''), '(unassigned)') AS data_product,
    project_name,
    COUNT(*) AS total_assets,
    ROUND(AVG(overall_compliance_score), 1) AS product_compliance_score,
    SUM(subscription_count) AS total_subscriptions,
    COUNT(CASE WHEN JSON_ARRAY_LENGTH(missing_required_forms) > 0 THEN 1 END) AS assets_with_form_gaps
FROM "s3tablescatalog/gov-obs-data"."governance_metadata"."asset_compliance"
WHERE snapshot_date = date_format(current_date, '%Y-%m-%d')
GROUP BY
    COALESCE(NULLIF(data_product_name, ''), '(unassigned)'),
    project_name
ORDER BY product_compliance_score ASC;
Amazon SageMaker query editor showing a data product compliance query result with 5 rows. Columns are data_product, project_name, total_assets, product_compliance_score, total_subscriptions, and assets_with_form_gaps. Rows include entries across data-engineering (score 31.1), admin-project (score 31.3), and marketing-analytics (score 40.0), plus User Behavior (score 43.5, 6 form gaps) and Finance Analytics (score 79.8, 9 subscriptions, 0 form gaps). The project name containing the account ID is masked.

Figure 14: Data product compliance rollup across projects

This produces a compliance view at the level data consumers need: the products they subscribe to. A data product with a compliance score of 15 out of 100 and three subscriber projects is a potential governance incident, not a backlog item.

Cleaning up

If you deployed this pipeline in a test environment, delete the following resources to avoid incurring ongoing charges:

  • The enrichment Lambda function and its associated IAM role.
  • The Amazon EventBridge Scheduler rule.
  • The governance_metadata AWS Glue database and the asset_compliance S3 Table.
  • The S3 policy configuration file and any associated S3 bucket.
  • The AWS Quick Sight dataset and analysis (if created).
  • The Lake Formation permissions granted to the AWS Quick Sight service role.

The aws-samples repository has the commands needed to run the cleanup.

Conclusion

This post showed how to build a governance observability pipeline using Amazon SageMaker Unified Studio metadata exports and APIs, computes weighted compliance scores, and surfaces actionable governance insights through SageMaker Unified Studio queries and an AWS Quick Sight dashboard.

Amazon SageMaker Unified Studio provides the building blocks for governance such as asset type definitions, metadata form fields, data quality scores, glossary associations, subscription data, and a daily catalog export. This post demonstrates how to join those signals within Amazon SageMaker Unified Studio into a single enriched dataset to enhance data governance at scale.

The specific scoring model implemented here considering the five dimensions, their weights, and the risk classification by consumption is not prescriptive, but a starting point. Your organization’s governance policy might weight data product coverage more heavily, treat regulated project assets differently, or define “compliant” with a different threshold. The pipeline itself is the reusable part: after the signals are together, the scoring logic is yours to define and evolve.

Have questions about implementing this governance pipeline in your environment? Share your thoughts in the comments below or visit the aws-samples repository to contribute.


About the authors

Amom Luiz

Amom Luiz

Amom is a Senior Specialist Solutions Architect, Data & AI, at AWS. He is focused on helping customers to define and implement their Data & AI strategy at scale.

Brenda Medeiros

Brenda Medeiros de Florenco

Brenda is a DevOps Delivery Consultant in AWS Professional Services. She helps customers automate and operate cloud infrastructure and is expanding her focus toward data platforms and governance.

Guilherme Monte

Guilherme Monte

Guilherme is a Data Architect (Delivery Consultant) in AWS Professional Services. He specializes in data platforms and helps organizations build scalable, well-governed data ecosystems.

The collective thoughts of the interwebz