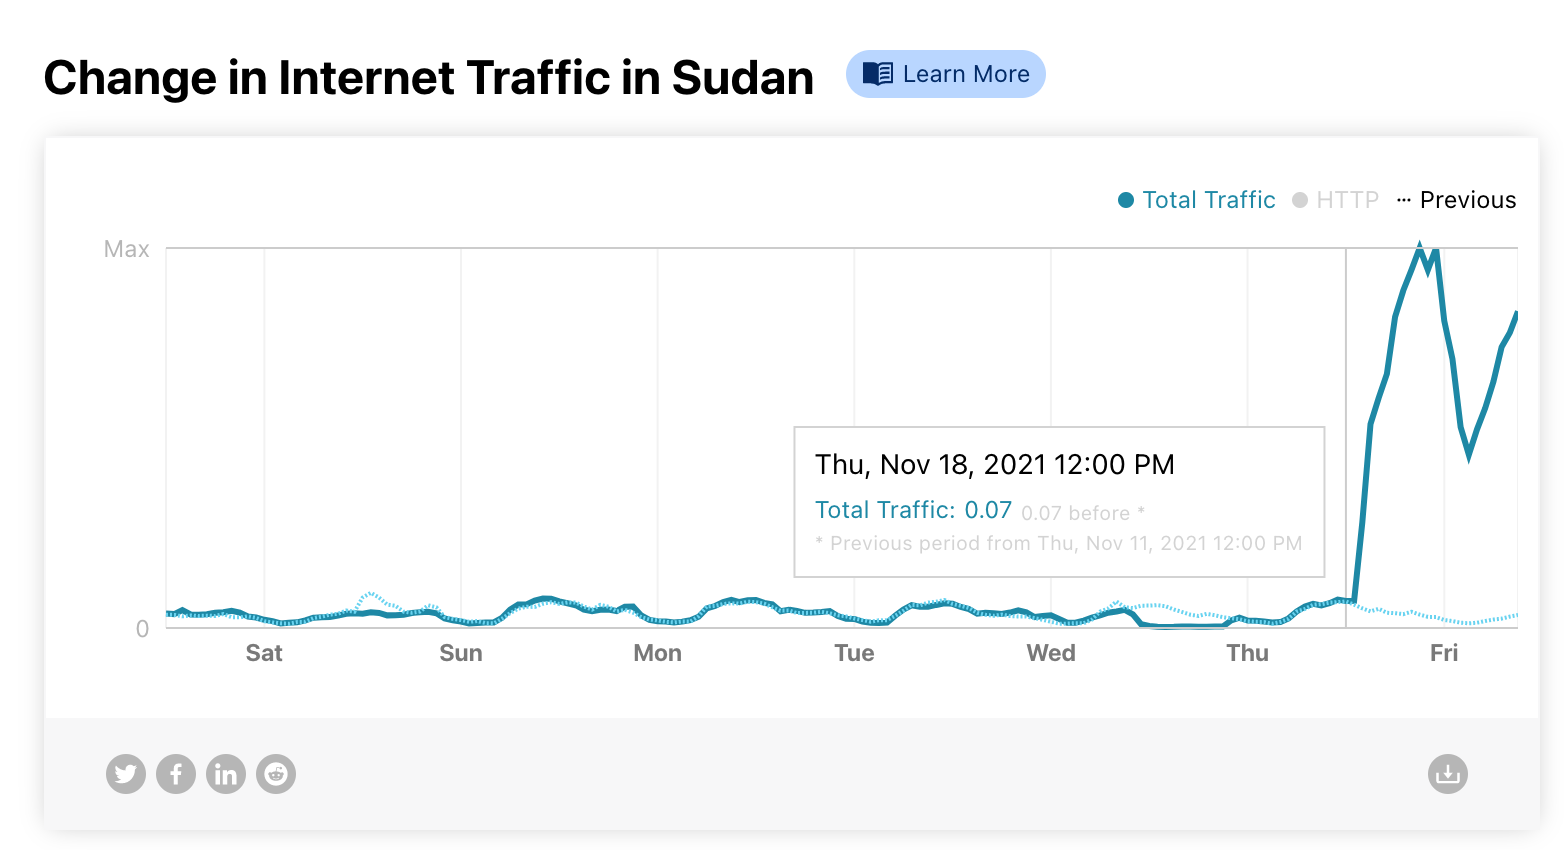
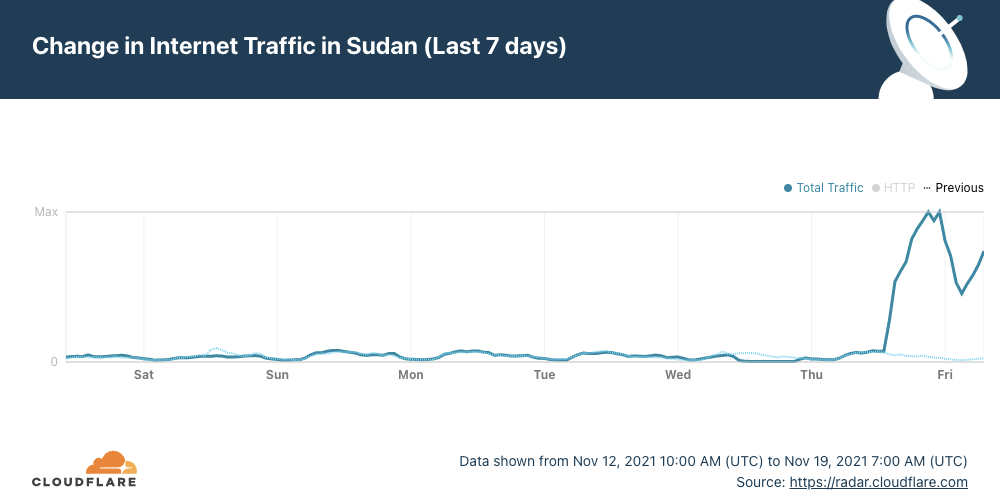
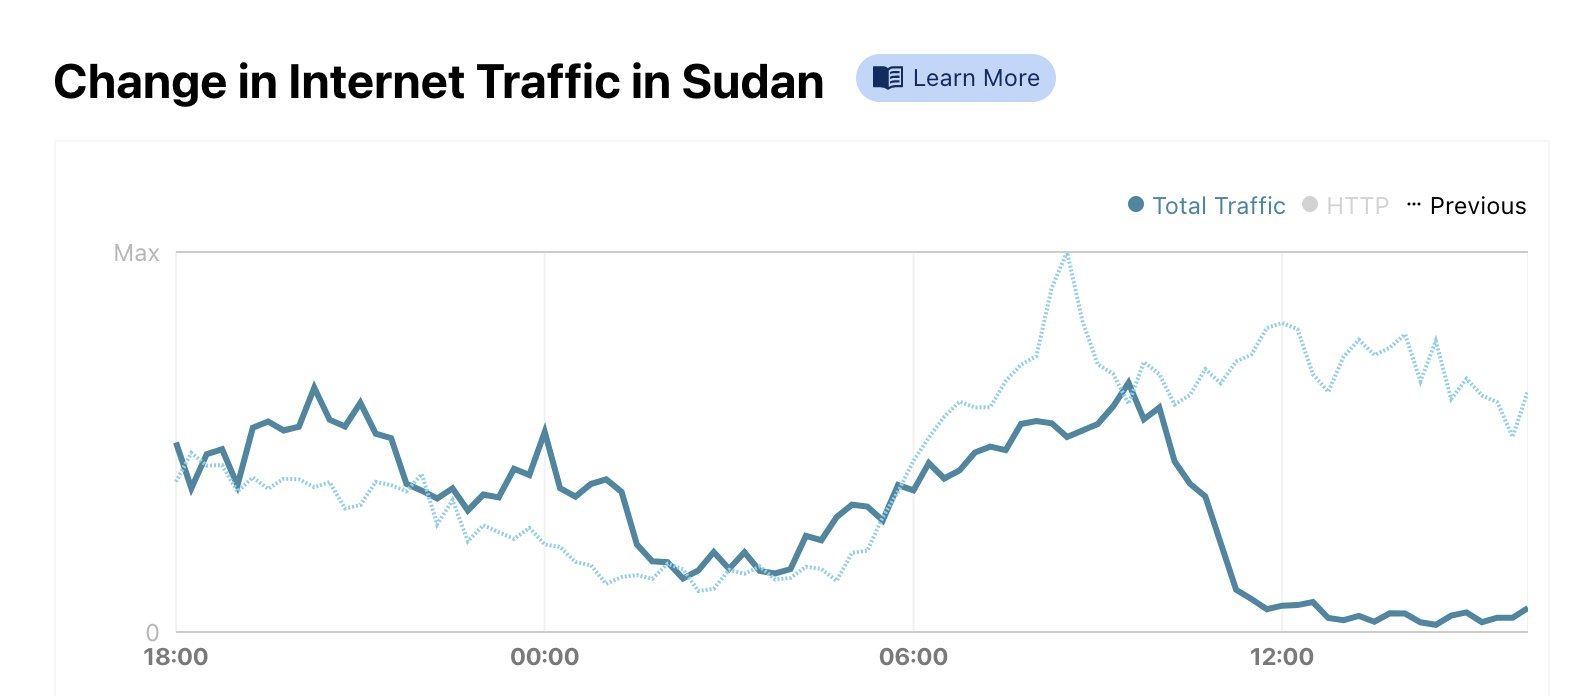
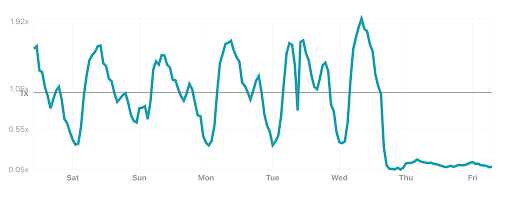
Internet traffic started to come back in Sudan (with limitations) on Thursday, November 18, 2021. This happened after 25 days of an almost complete shutdown that affected the whole country. It’s a simple line going up on a chart for us, but for a country that also meant that Internet access was (at least in part) back on with all of what comes with it for businesses, communities, families and society as a whole.
You can see that trend on Cloudflare Radar, in particular after 13:00 UTC (15:00 local time). After that Internet traffic went up like we haven’t seen at all in the previous three weeks.
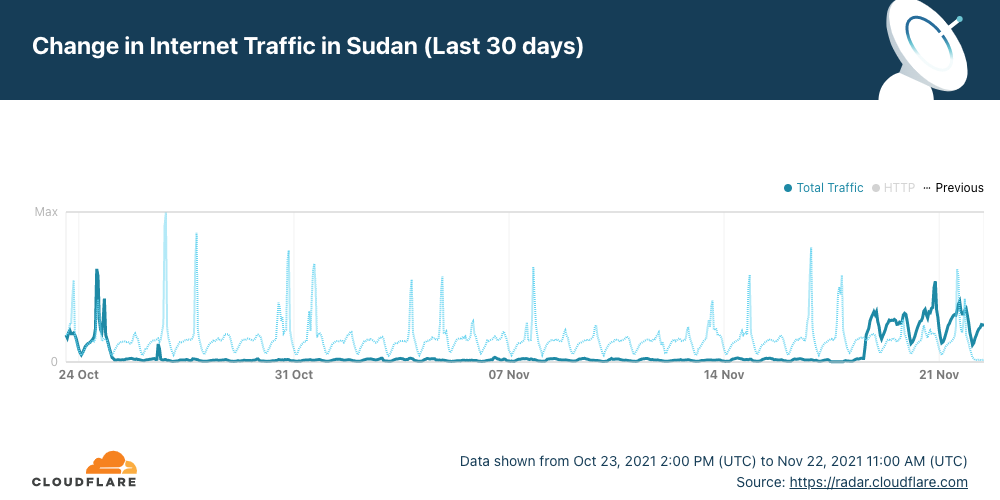
Internet access was mostly cut off on October 25, 2021, after a political turmoil in the country. A Sudanese court previously ordered the restoration of Internet access on November 9, but until last Thursday, November 18, there were no signs of services returning to normal. The biggest Internet access shutdown in recent history in the country was back in 2019 — for a full 36 days.
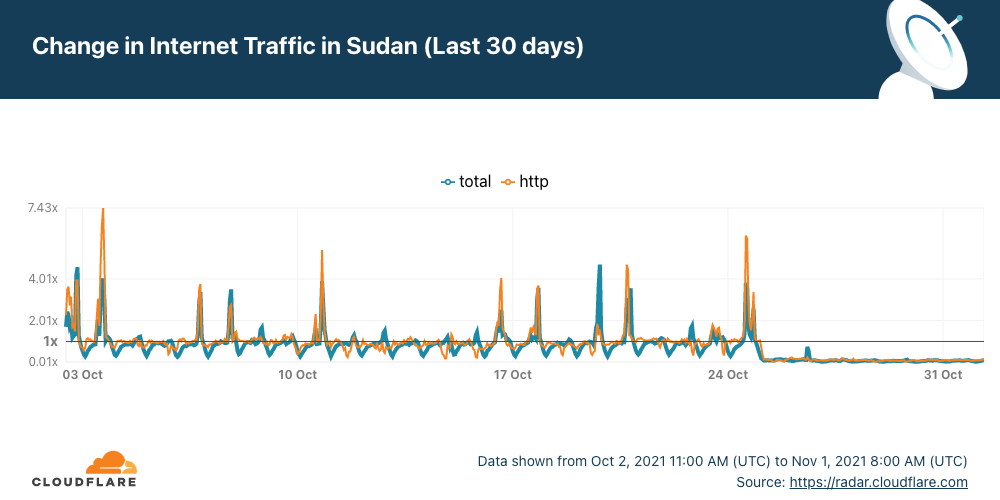
Looking back at the last 30 days Cloudflare Radar shows very distinctively a big difference from what was previously normal in the country.
On Wednesday, November 17, (around 11:00 UTC) we saw a further drop in traffic getting Internet traffic in the country close to zero.
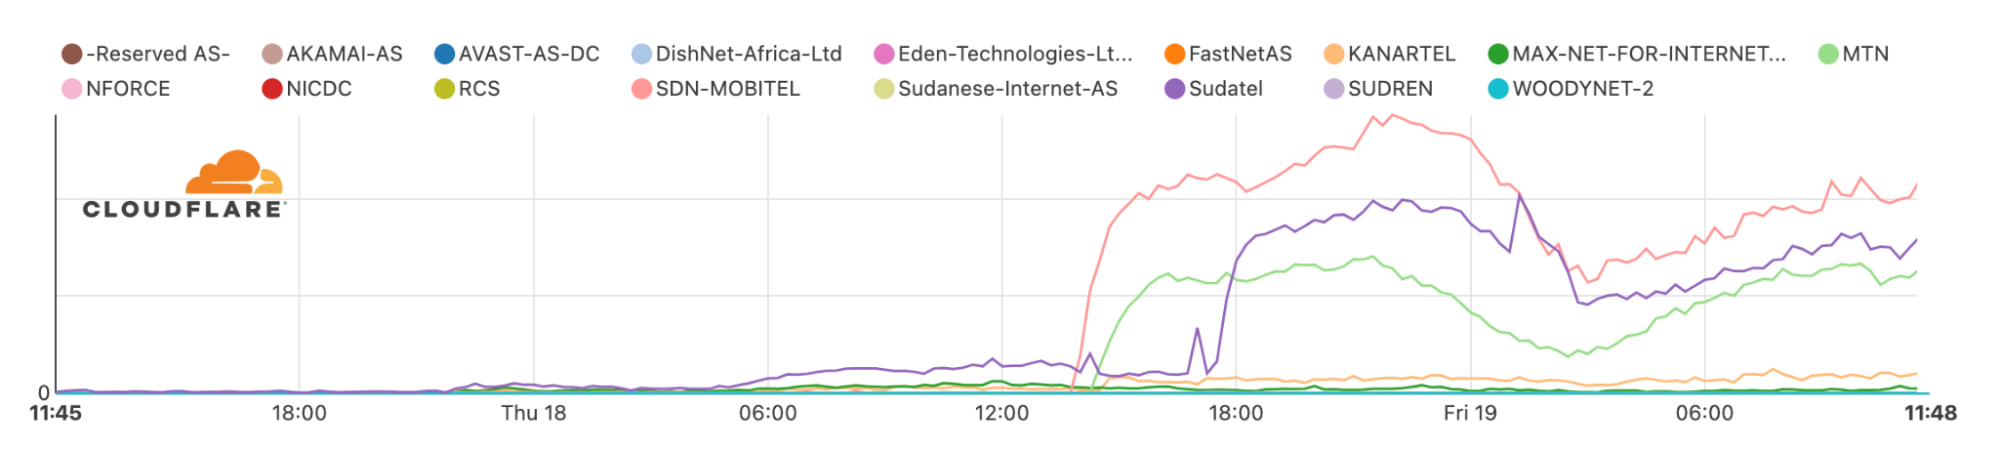
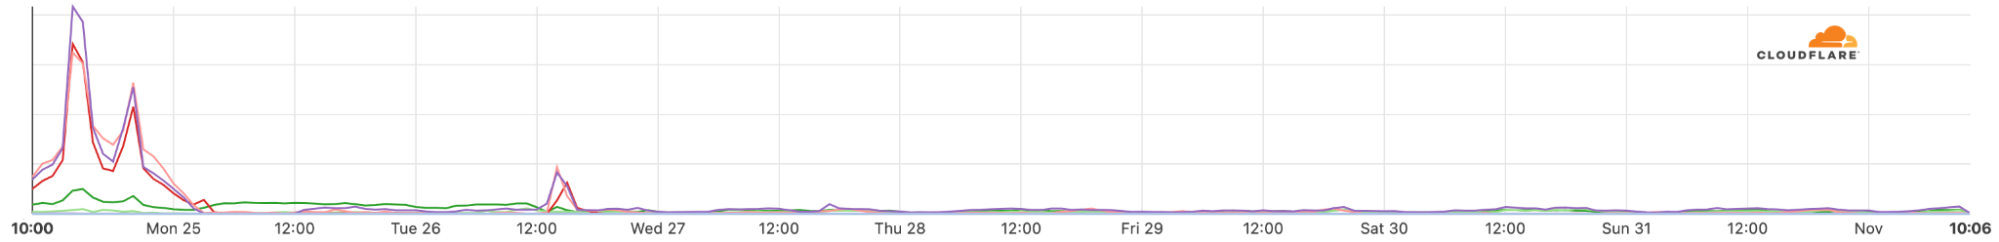
Now our data shows that the Internet in Sudan picked up firstly thanks to two ISPs, Mobitel and MTN. One of the largest in the country, Sudatel (purple line) for a few hours was also still mostly down, but it came back later in the evening (~18:00 UTC).
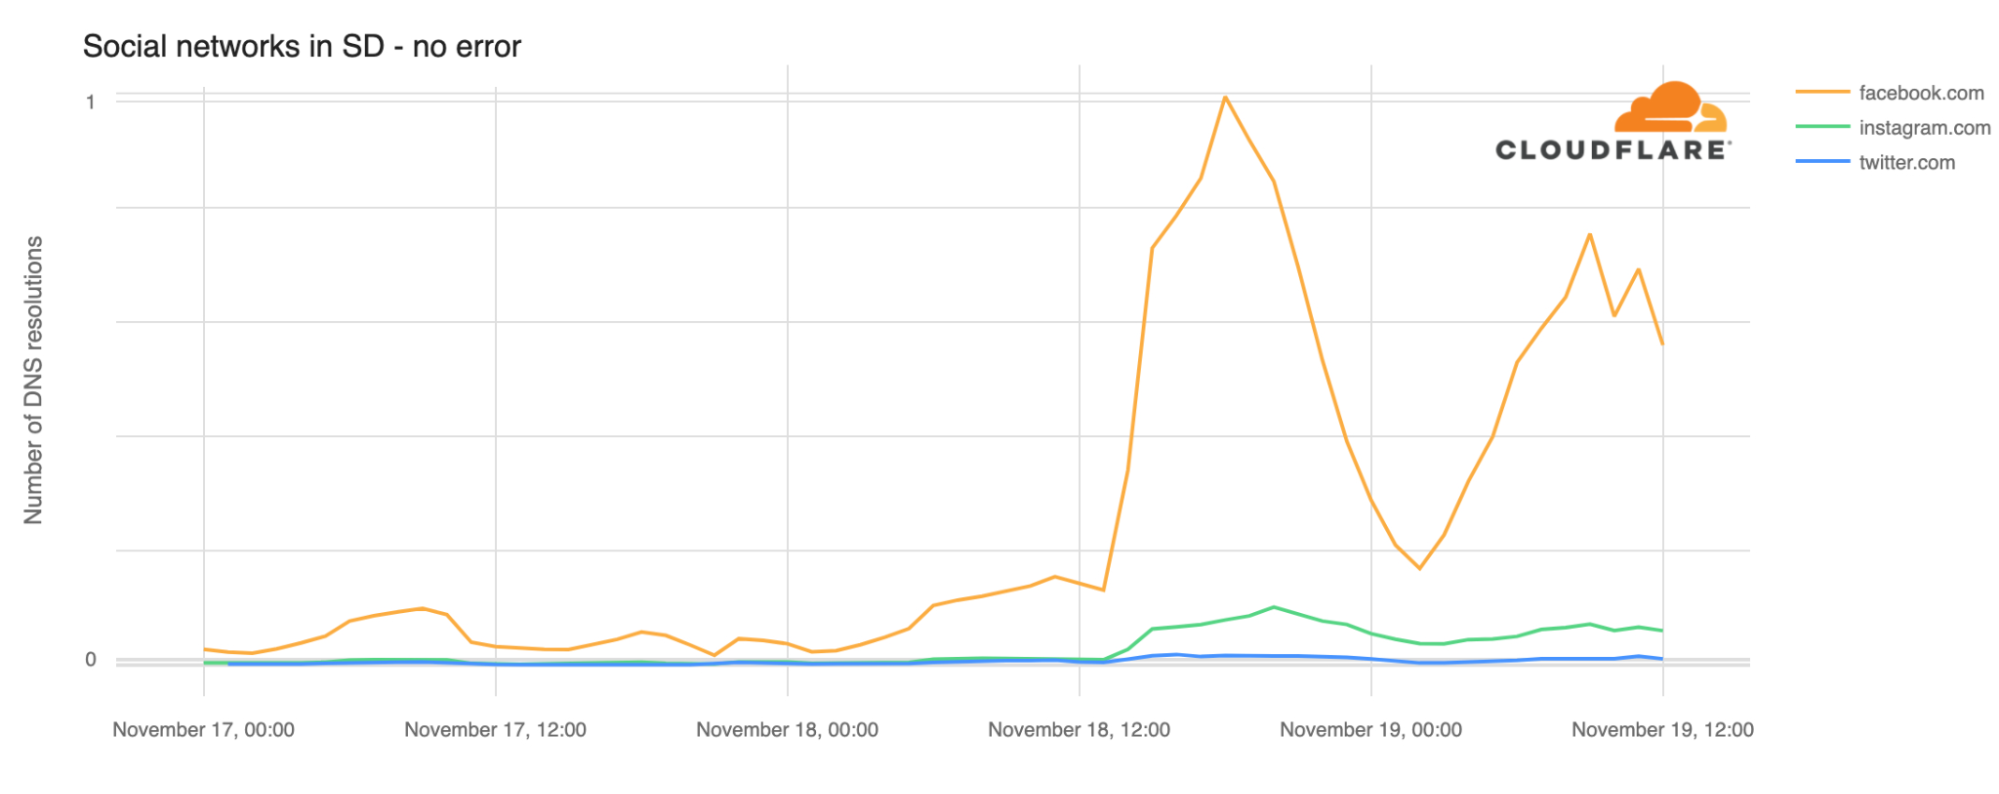
In terms of social media, our data also shows that especially Facebook traffic went up at the same time Internet access was beginning to pick up but went down a few hours later. According to local reports, there could be restrictions to social media on mobile networks in the country.
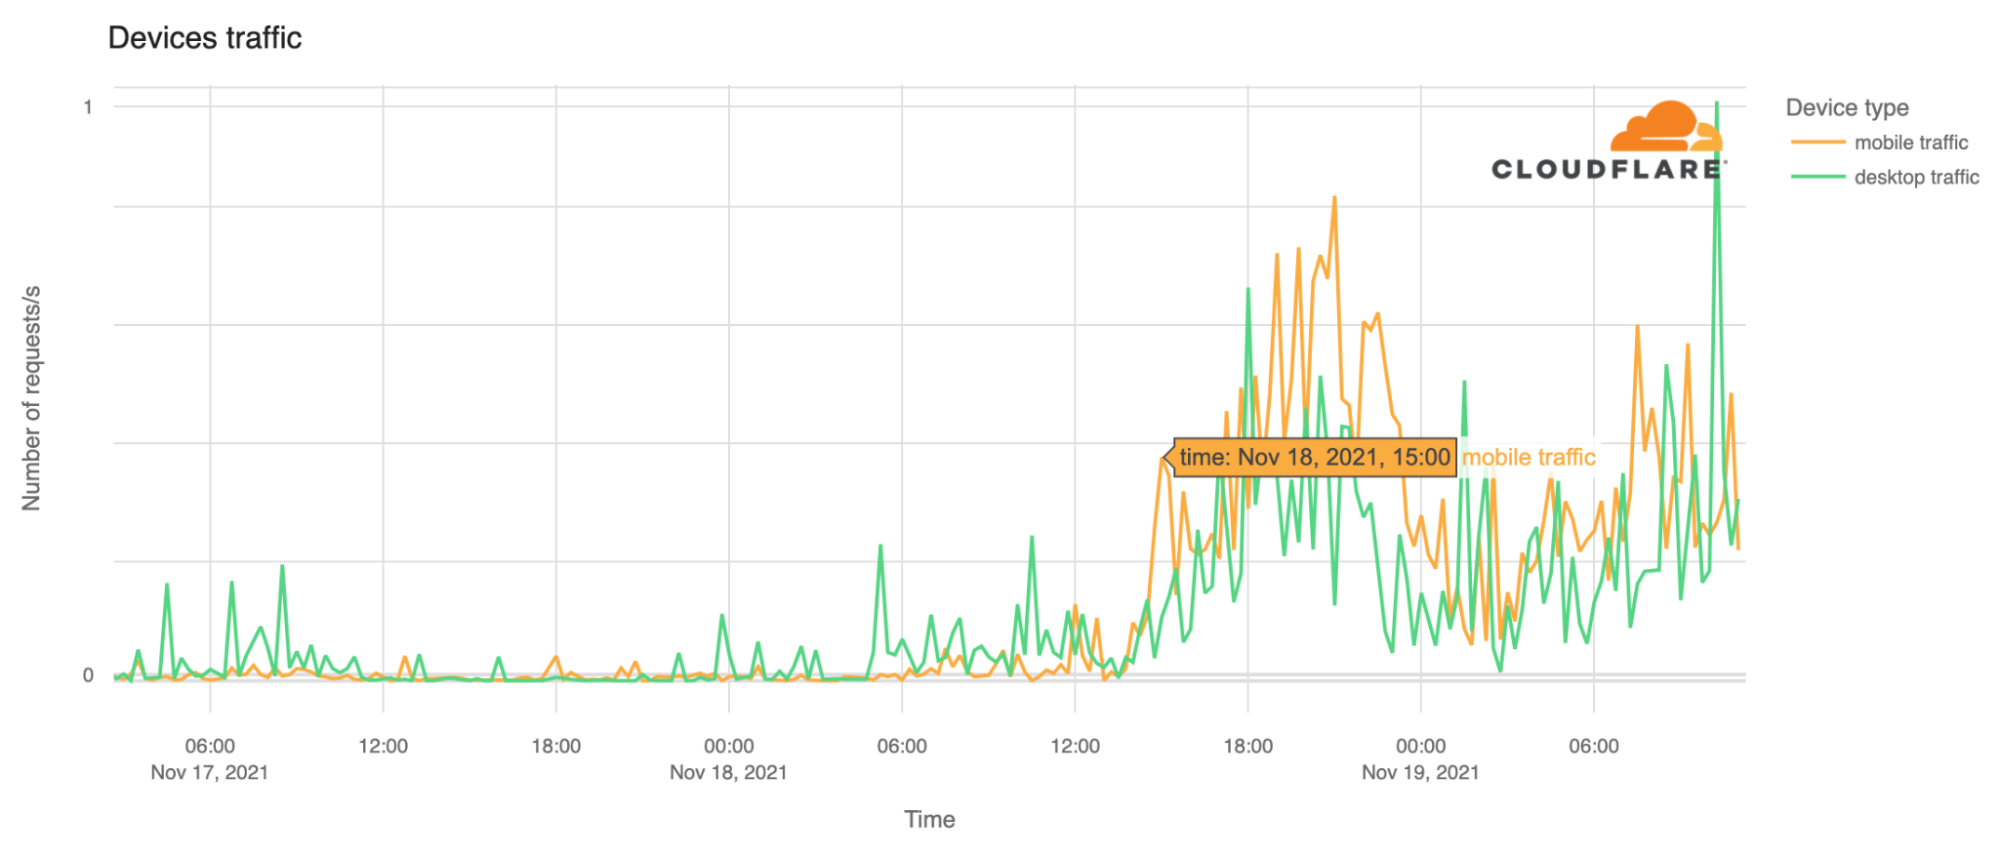
Mobile traffic saw a big increase, especially after 14:00 UTC. That is normal behaviour in a country where mobile traffic is king (back in October we showed in our blog post about mobile traffic how Sudan was one of the countries in the world with a large percentage of mobile traffic — 83%).
Internet shutdowns are not that rare
We’ve said it before here in our blog, but it is always good to emphasize: Internet disruptions, including shutdowns and social media restrictions, are common occurrences in some countries and Sudan is one where this happens more frequently than most countries according to Human Rights Watch.
In our June 22, 2021, blog, we talked about Sudan when the country decided to shut down the Internet to prevent cheating in exams, but there were situations in the past more similar to this days-long shutdown — something that usually happens when there’s political unrest.
The country’s longest recorded network disruption was back in 2018, when Sudanese authorities cut off access to social media (and messaging apps like WhatsApp) for 68 consecutive days from December 21, 2018, to February 26, 2019. After that, there was a full mobile Internet shutdown reported from June 3 to July 9, 2019, that lasted 36 days.
This time, in 2021, it was 25 days when the Internet access was reduced to just a trickle of traffic getting through.
You can keep an eye on Cloudflare Radar to monitor how we see the Internet traffic globally and in every country.
Meris first got our attention due to an exceptionally large 17.2 million requests per second (rps) DDoS attack that it launched against one of our customers. This attack, along with subsequent attacks originated by the Meris botnet, was automatically detected and mitigated by our DDoS protection systems. Cloudflare customers, even ones on the free plan, are protected against Meris attacks.
Over the past months, we’ve been tracking and analyzing the activity of the Meris botnet. Some main highlights include:
Meris targets approximately 50 different websites every single day with a daily average of 104 unique DDoS attacks.
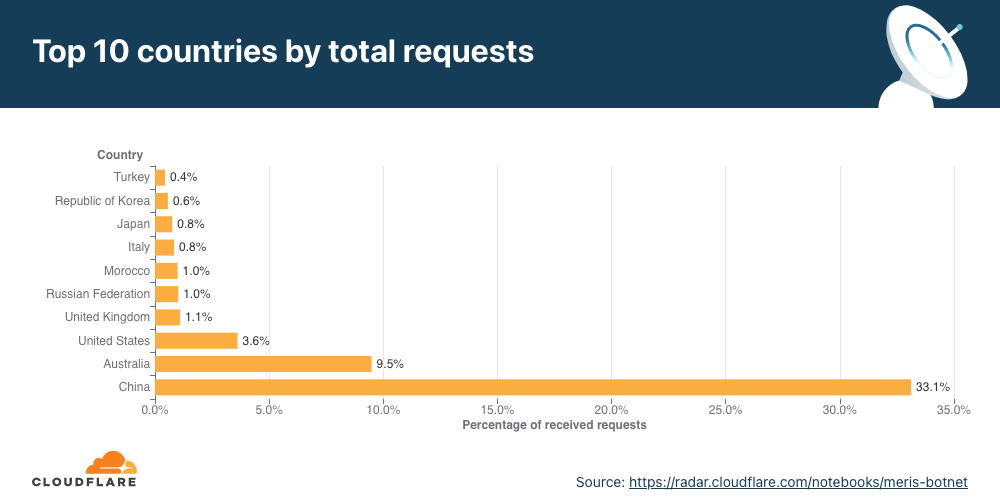
More than 33% of all Meris DDoS attack traffic targeted China-based websites.
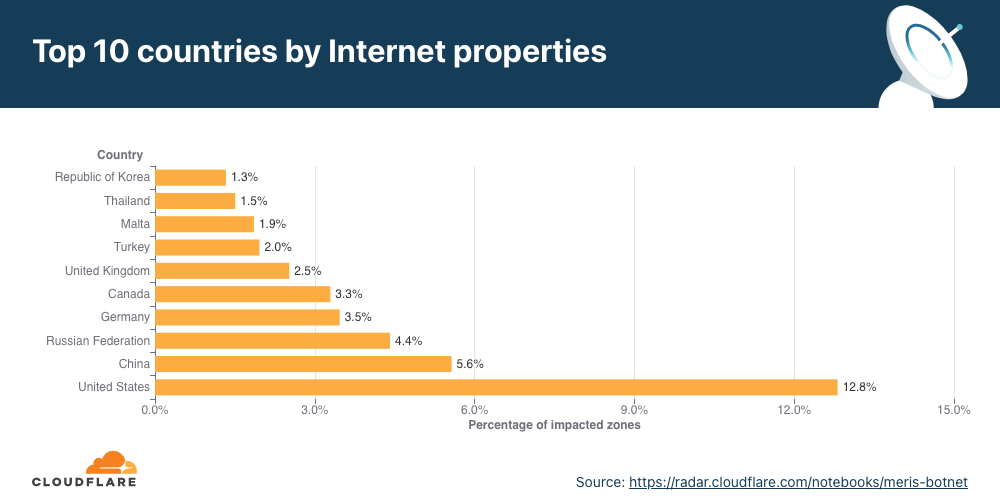
More than 12% of all websites that were attacked by Meris are operated by US-based companies.
View more Meris attack insights and trends in the interactive Radar dashboard.
So what is Meris?
Meris (Latvian for plague) is the name of an active botnet behind a series of recent DDoS attacks that have targeted thousands of websites around the world. It was originally detected in late June 2021 by QRator in joint research they conducted with Yandex. Their initial research identified 30,000 to 56,000 bots, but they estimated that the numbers are actually much higher, in the ballpark of 250,000 bots.
The Meris botnet is formed of infected routers and networking hardware manufactured by the Latvian company MikroTik. According to MikroTik’s blog, the attackers exploited a vulnerability in the router’s operating system (RouterOS) which enabled attackers to gain unauthenticated remote access to read and write arbitrary files (CVE-2018-14847).
RouterOS is the router operating system that’s used by MikroTik’s routers and the RouterBOARD hardware product family, which can also be used to turn any PC into a router. Administration of RouterOS can be done either via direct SSH connection or by using a configuration utility called WinBox. The vulnerability itself was possible due to a directory traversal vulnerability in the WinBox interface with RouterOS.
Directory traversal is a type of exploit that allows attackers to travel to the parent directories to gain access to the operating system’s file system, a method and structure of how data is stored and retrieved in the operating system. Once they gain access to the file system, attackers can then read the existing files that administer the router and write files directly into the file system to administer the routers to their botnet needs.
While the vulnerability was patched after its detection back in 2018, it’s still being exploited in compromised devices that do not use the patched RouterOS versions, or that use the default usernames and passwords. MicroTik has advised its customers to upgrade their devices’ OS version, to only allow access to the devices via secure IPsec, and to inspect for any abnormalities such as unknown SOCKS proxy settings and scripts.
To launch volumetric attacks, the botnet uses HTTP pipelining which allows it to send multiple requests over a single connection, thus increasing its total attack throughput. Furthermore, in an attempt to obfuscate the attack source, the botnet uses open SOCKS proxies to proxy their attack traffic to the target.
Cloudflare’s DDoS protection systems automatically detect and mitigate Meris attacks. One of the mitigation actions that the system can choose to use is the ‘Connection Close’ action which eliminates the risk of HTTP pipelining and helps slow down attackers. Additionally, as part of Cloudflare’s threat intelligence suite, we provide a Managed IP List of Open SOCKS Proxies that customers can use as part of their firewall rules — to block, challenge or rate-limit traffic that arrives via SOCKS proxies.
How does Meris compare to Mirai?
About five years ago, Mirai (Japanese for future) — the infamous botnet that infected hundreds of thousands of IoT devices — launched record-breaking DDoS attacks against websites.
There have been many variants of the Mirai botnet since its source code was leaked. One version of Mirai, called Moobot, was detected last year when it attacked a Cloudflare customer with a 654 Gbps DDoS attack. Another variant recently made a resurgence when it targeted Cloudflare customers with over a dozen UDP and TCP based DDoS attacks that peaked multiple times above 1 Tbps, with a max peak of approximately 1.2 Tbps.
While Mirai infected IoT devices with low computational power, Meris is a swarm of routers that have significantly higher processing power and data transfer capabilities than IoT devices, making them much more potent in causing harm at a larger scale to web properties that are not protected by sophisticated cloud-based DDoS mitigation.
Tracking the Meris botnet attacks
Since the appearance of Meris, Cloudflare’s systems automatically detected and mitigated Meris attacks using the existing mitigation rules. During our analysis of the Meris botnet attacks, our security experts noticed the attack vectors adapt to try and bypass Cloudflare’s defenses. Needless to say, they were not successful. But we wanted to stay many steps ahead of attackers — and so our engineers deployed additional rules that mitigate Meris attacks even more comprehensively. A side effect of these mitigation rules is that it also provides us with more granular threat intelligence on the Meris attacks.
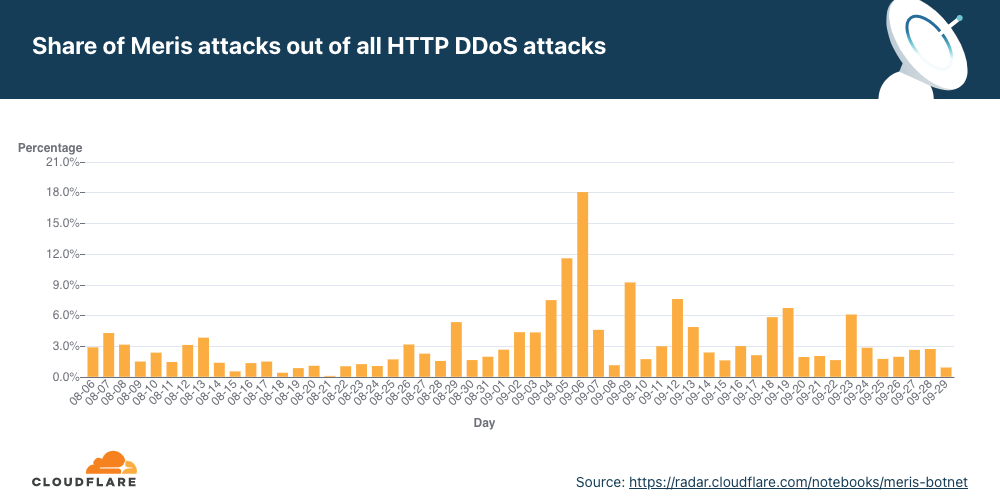
Since we deployed the new rules in early August, we’ve seen Meris launch an average of 104 DDoS attacks on Cloudflare customers every day. The highest figure we’ve seen was on September 6, when Meris was used to launch 261 unique attacks against Cloudflare customers.
Overall, Meris targets about 50 different websites and applications every single day. Although the average attack peaked at 106K rps, the median attack size was actually smaller at 17.6K rps. The largest attack we’ve seen was 17.2M rps and that occurred in July. In the graph below, you can see the daily highest requests per second rate after we deployed the new rules. Since then, the largest attack we’ve seen was 16.7M rps, which took place on August 19.
Meris used to target Banks, Financial Services, and Insurance companies
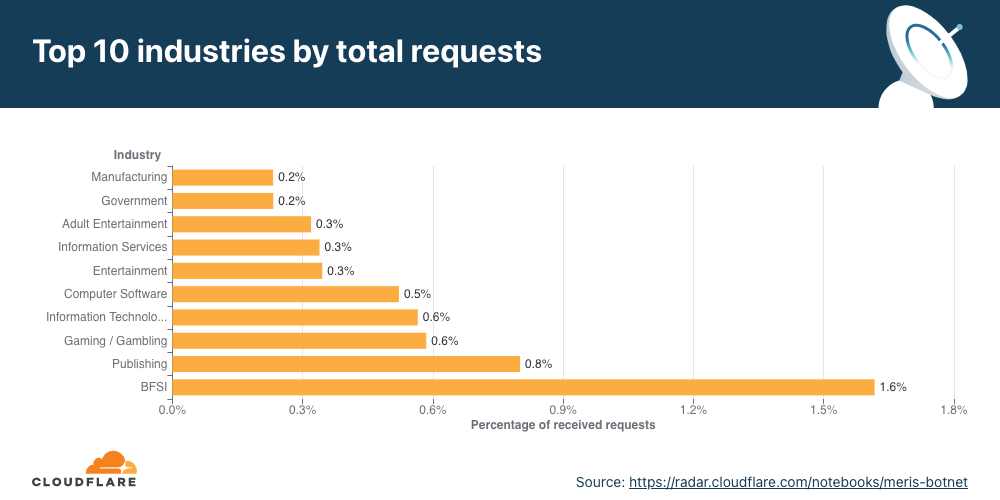
Over the past few months, the industry that received the most attack traffic from the Meris botnet was the Banking, Financial Services, and Insurance (BFSI) industry
Following the BFSI industry, the most attacked industries were the Publishing, Gaming/Gambling, and IT Services industries. And while BFSI was the number one most attacked industry when considering the Meris DDoS activity rate, it only came in fourth place when considering the percentage of targeted websites.
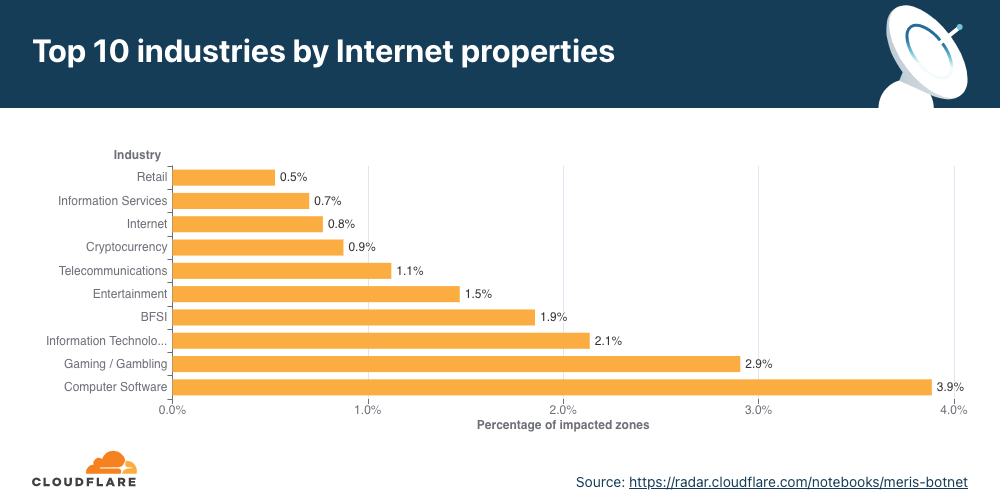
In terms of the percentage of targeted websites, the Computer Software industry came in first place. Almost 4% of all impacted websites were of Computer Software companies protected by Cloudflare, followed by Gaming/Gambling and IT Services with 3% and 2%, respectively.
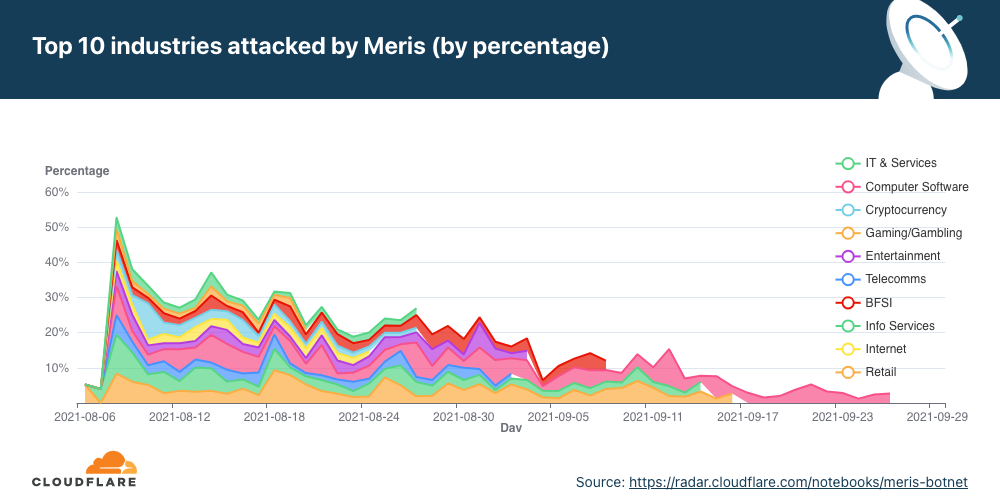
Besides the total breakdowns shown above, we can also view the top industries the botnet attacked over time to understand the changing trends. These trends may be tied to political events, new video game releases, sporting events, or any other global or local public interest events.
Off the top, we can already see the two largest peaks on August 9 and August 29 — mainly on the Computer Software, Gaming/Gambling, and IT industries. Another interesting peak occurred on August 14 against Cryptocurrency providers.
In late August, the botnet was pointed against gambling and casino websites, generating attacks at rates of hundreds of thousands to millions of requests per second. A second significant wave against the same industry was launched in early September.
Meris targets websites in China, Australia, and US
Similarly to the analysis of the top industries, we can calculate the Meris DDoS activity rate per target country to identify which countries came under the most attacks. In total, China-based companies saw the largest amount of DDoS attacks. More than 33% of all requests generated by Meris were destined for China-based companies that are protected by Cloudflare. Australia came in second place, and the US in third.
On the other hand, when we look at the number of websites that were targeted by Meris, the US came in first place. More than 12% of all websites that were targeted by Meris are operated by US-based companies. China came in second place with 5.6% and Russia in third with 4.4%.
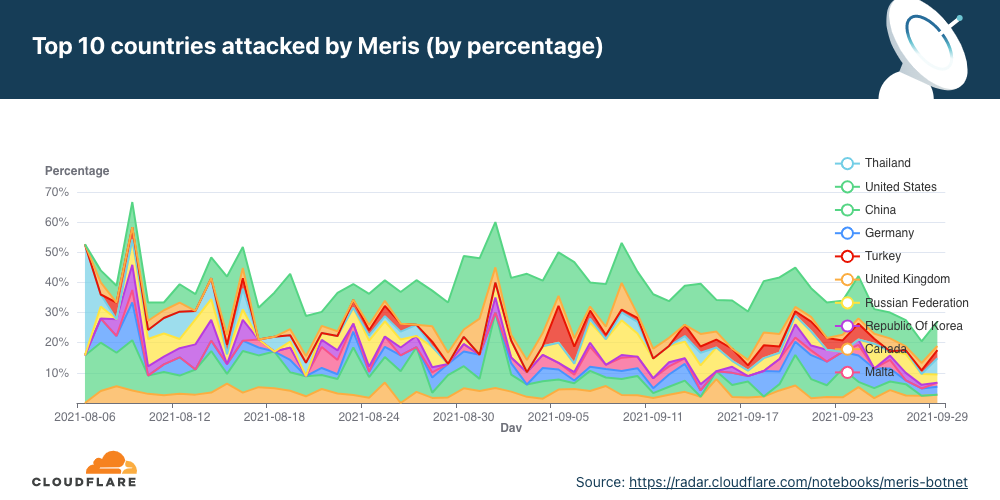
Over time, we can see how the attacks on the top countries change. Similarly to the per-industry breakdown, we can also see two large peaks. The first one occurred on the same spike as the per-industry breakdown on August 9. However, the second one here occurred on September 1.
Although only tens of thousands of bots have been detected per attack, it is estimated that there are roughly 250,000 bots worldwide. As indicated above, the botnet is formed of MikroTik routers. Using the source IP address of the routers, we’re able to identify the origin country of the bots to paint a geographical representation of the bots’ presence and growth over time.
The change in the location of the bots doesn’t necessarily indicate that the botnet is growing or shrinking. It could also be that different bot groups are activated from time to time to spread the load of the attacks while attempting not to get caught.
At the beginning of August, the majority of the bots were located in Brazil. But by the end of August, that number plummeted to a single digit percentage close to zero. Meanwhile, the number of infected devices grew in the United States. From the beginning of September, the number of bots was significantly higher in the US, Russia, India, Indonesia, and China.
Cloudflare operates autonomous DDoS protection systems that automatically detect and mitigate DDoS attacks of all types, including attacks launched by Meris and Mirai. These systems are also customizable, and Cloudflare customers can tweak and tune their DDoS protection settings as needed with the HTTP DDoS Managed Rulesetand the L3/4 DDoS Managed Ruleset.
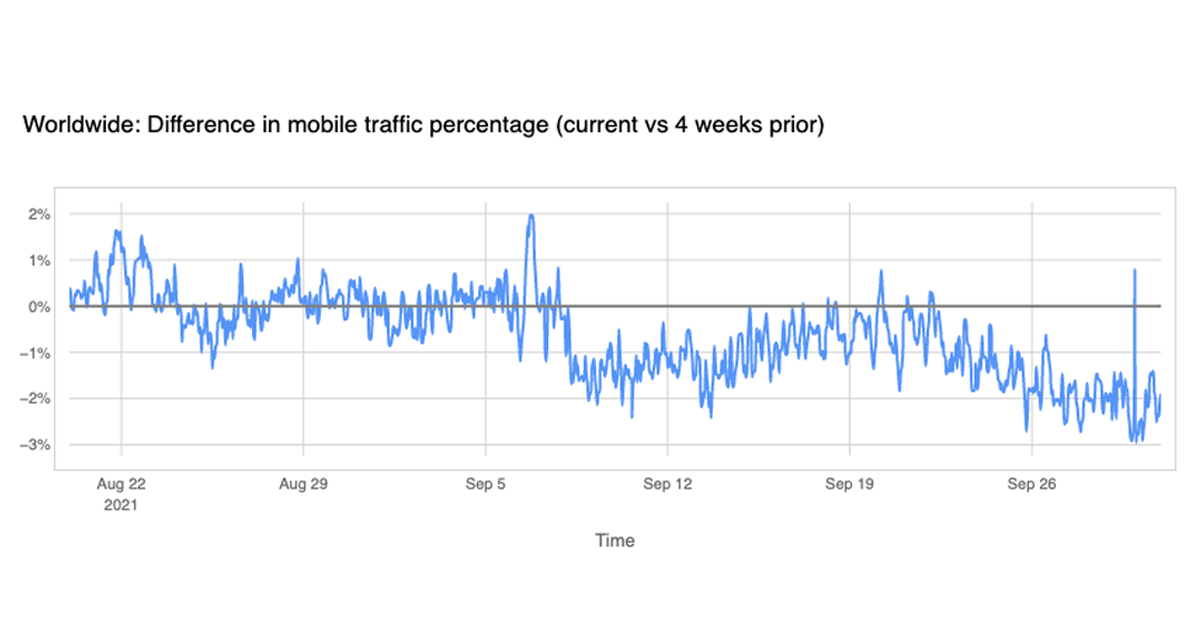
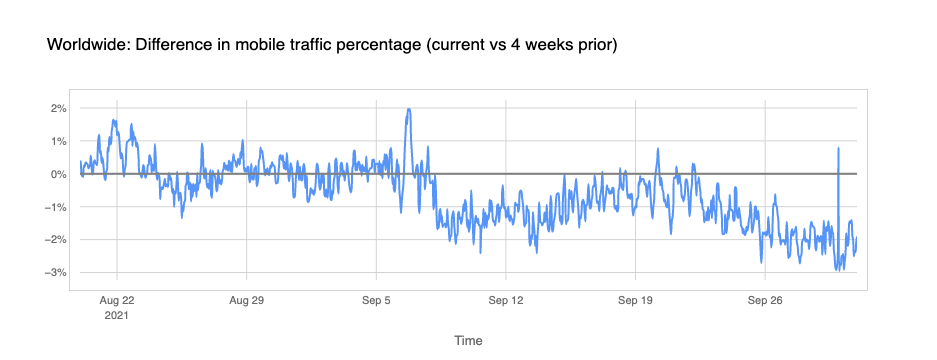
For many (especially in the Northern Hemisphere, where about 87% of humans live), September is the “get back to school” (or work) month after a summer break and that also reflects changes in the Internet traffic, particularly in mobile usage.
Looking at our data (you can see many of these insights in Cloudflare Radar) there’s a global trend: mobile traffic lost importance (compared with desktop traffic) in September. The next chart shows there was less percentage of Internet traffic from mobile devices after Monday, September 6, 2021, with a difference of -2% in some days, compared with the previous four weeks (August), and in late September it’s more than -3%.
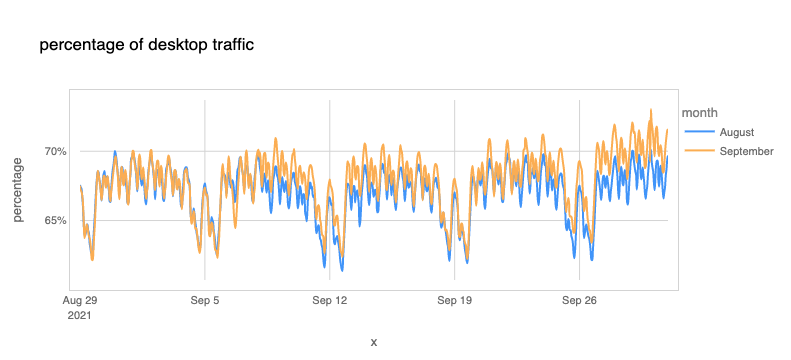
We can also see that the percentage of desktop traffic increased in September compared to August (we compare here to complete weeks between both months because there are significant differences between weekdays and weekends).
A few of weeks ago, we saw there are considerable differences between countries regarding the importance of mobile usage. Getting back to work (or office hours) usually means an increase in desktop traffic. In that blog we highlighted the advantages that mobile devices brought to developing countries — many had their first contact with the Internet via a smartphone.
Different calendars to consider
Looking at September 2021, those shifts in Internet trends are more dependent on countries that start their school period at this time of the year and also there are the COVID lockdowns effects (more limited this year) to consider.
In the Northern Hemisphere, many countries start school in September after a break during the summer.
Europe: Back to school brings less time to be mobile
Europe is mostly coherent, and it is easier to check for mobile traffic patterns there. Most countries start school in the first 14 days of September, although Finland, Norway, Sweden and Denmark start in late August (like some states in the US, for example).
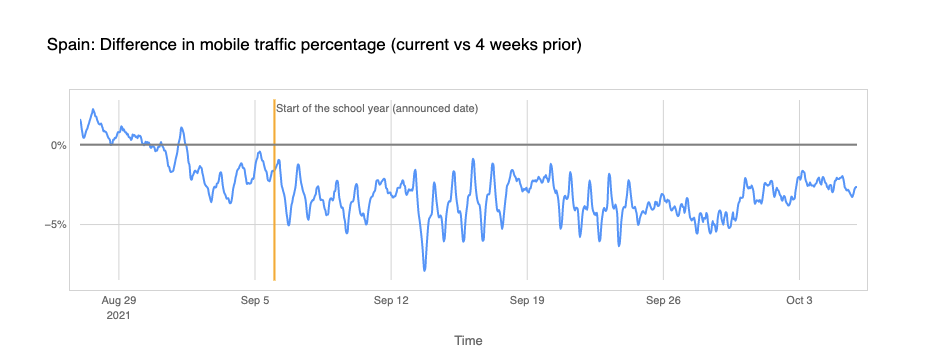
There are some countries in Europe where the mobile traffic went down in September more clearly (the overall picture in the continent is similar to the worldwide situation we described). Poland, Malta, Portugal, Italy, Spain registered a drop in specific periods of a few days in September of more than 5% in the mobile traffic percentage of the total Internet traffic.
Let’s ‘travel’ to Spain, a country where mobile traffic usually represents 45% of Internet traffic (in August this number was higher). Spanish schools officially opened for the new school year on Monday, September 6, and mobile traffic percentage lost more than 5% of its importance in some days of that week, a trend that grew the following week.
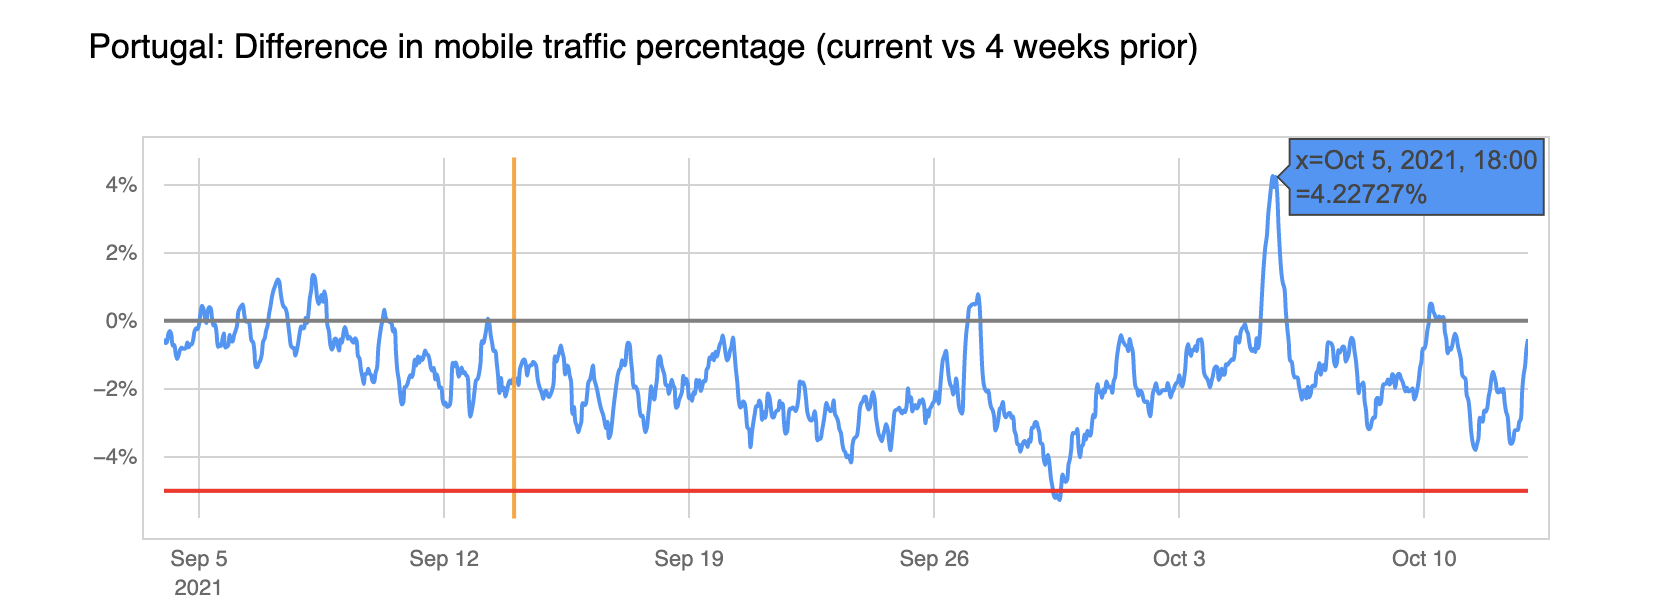
Portugal: A public holiday makes mobile usage go up
Portugal shows the same trend as other European countries but as shown in the following chart there was an apparent increase in mobile traffic percentage on October 5, 2021.
That Tuesday, Cloudflare’s Lisbon office was closed; the same happened across the country because it happens to be a public holiday, Republic Day. With most people not having to work in the middle of the week, the percentage of mobile traffic has risen (most visible at 19:00 local time).
Downs and ups
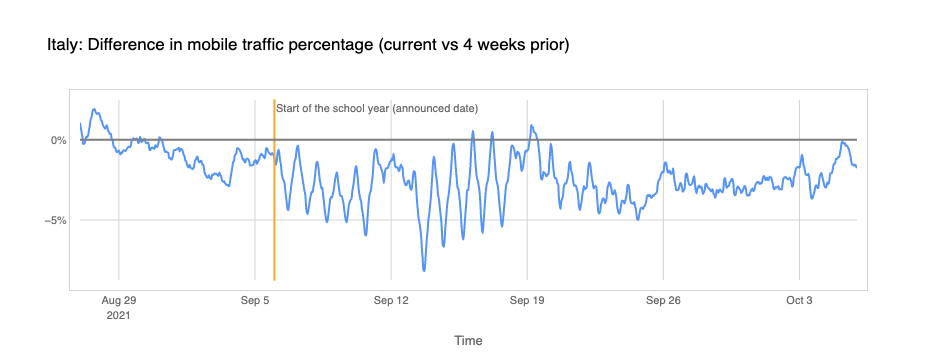
In Italy, we can see the same pattern, and it was also in the second week of school that mobile traffic percentage went down up to 8%. But by the end of September, it began to normalise to the values of the end of August.
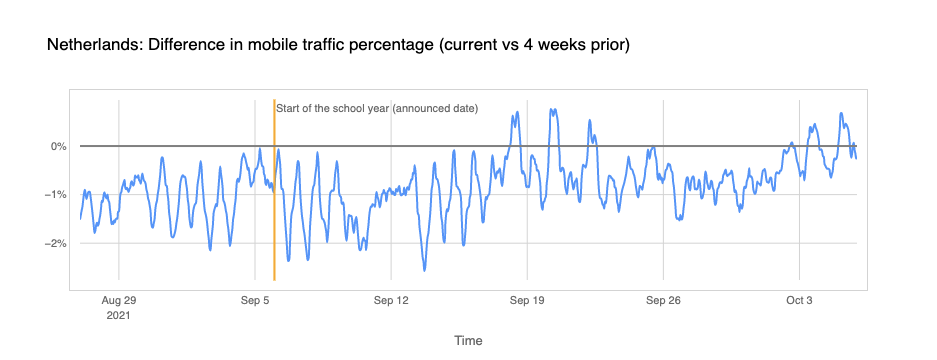
The trend of mobile traffic going back to having the same level as late August is more clear in the Netherlands.
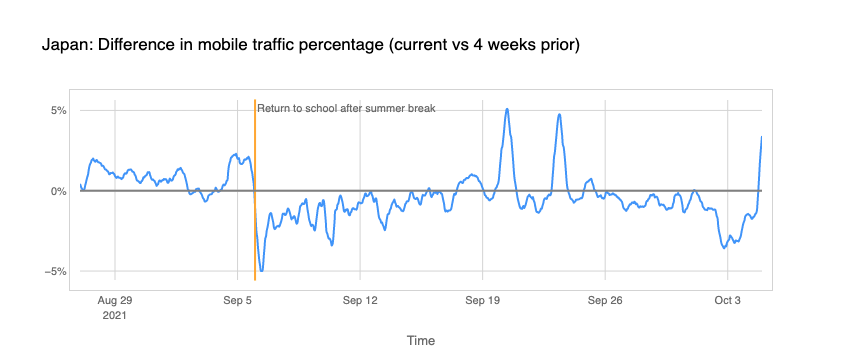
Japan, where the school year starts in April, but there’s a summer break through July and August (this year there were changes related to COVID), also shows the same trend of a decrease in mobile traffic that we saw in the Netherlands after school returned on September 6, 2021.
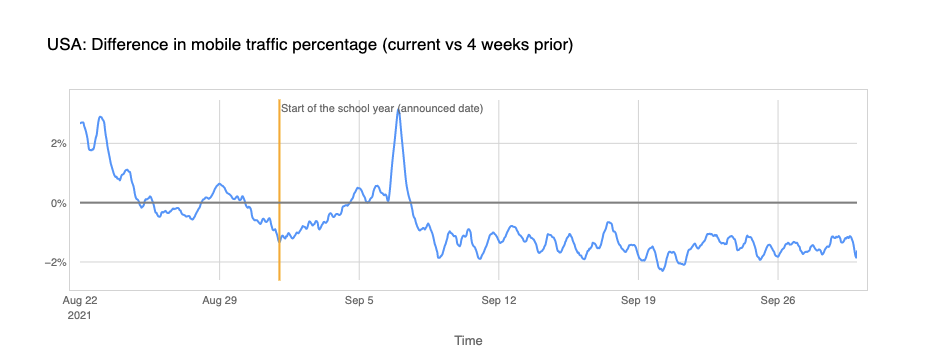
US: Start of the school year influenced by COVID
The United States had an atypical start of the school year because of COVID. Many states pushed the return to school from August to September (New York City started on September 13), and there were several schools with online classes because of the pandemic, but there’s also a drop in mobile traffic percentage, especially after Monday, September 6.
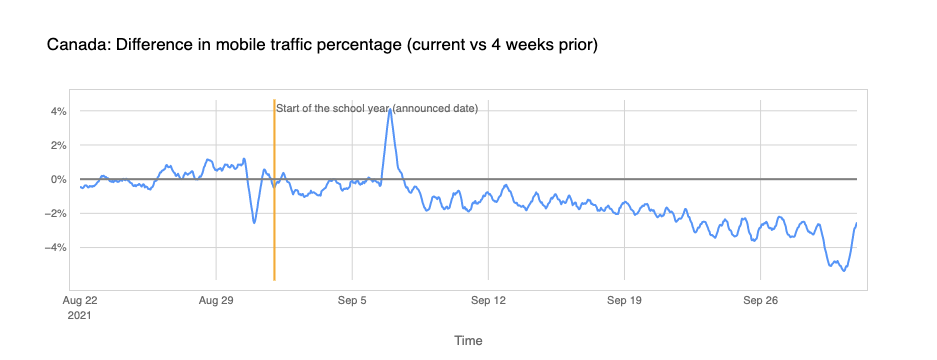
Further north of the continent, Canada (the school year officially started on September 1) saw mobile traffic lose more of its importance after September 6, a trend that grew by the end of the month.
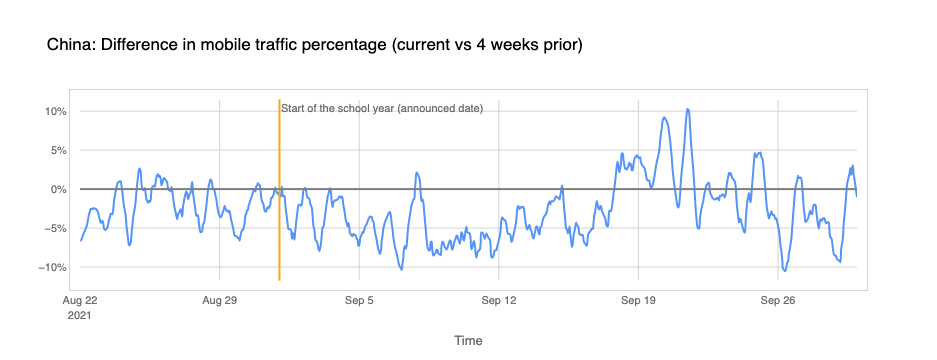
China saw a decrease in mobile traffic percentage right away in the beginning of September (when the school year started), but mobile recovered in the last week of the month.
Russia with different patterns
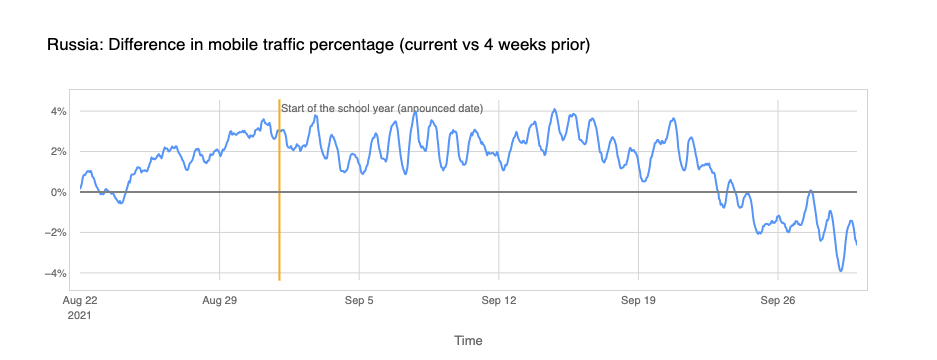
Then there are countries with trends that go the other way around. Russia saw an increase (and not a decrease like in most countries of the Northern Hemisphere) in mobile traffic percentage a few days before the school year. But news reports show that many schools were closed because of COVID and only started to open by September 20 (the next chart shows precisely a decrease of mobile traffic percentage in that week.
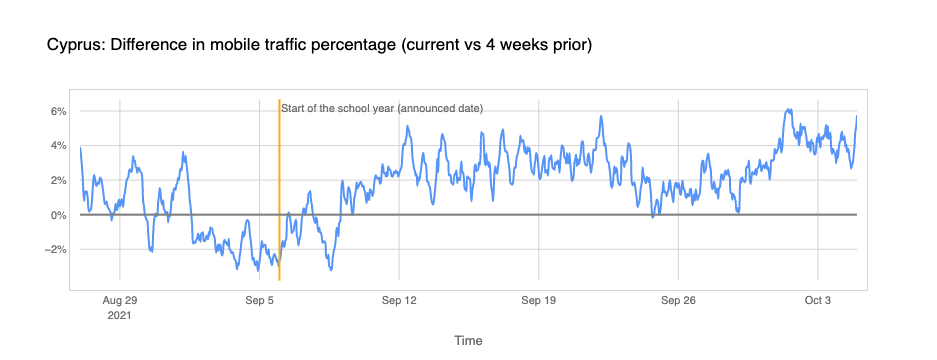
The same trend is observed in Cyprus — the only EU country where mobile traffic percentage increases after the first week of school. That could be related with some school closures in the past few weeks COVID related.
Nigeria: COVID impact
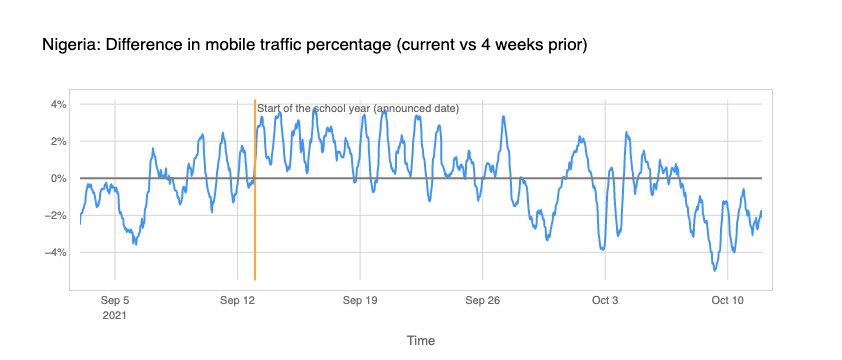
When we go to Africa, Nigeria is just above the Earth’s equator line and is the most populous country on the continent (population: 206 million), and the school year was officially scheduled to start on September 13. But reports from UNICEF show that school reopening was postponed a few weeks because of the pandemic situation in Nigeria.
This seems to go along the same lines as our data shows: mobile traffic percentage grew on the week of September 13 and only started to come down by the end of September and the beginning of October.
Conclusion: September, September, the back to school/work centre
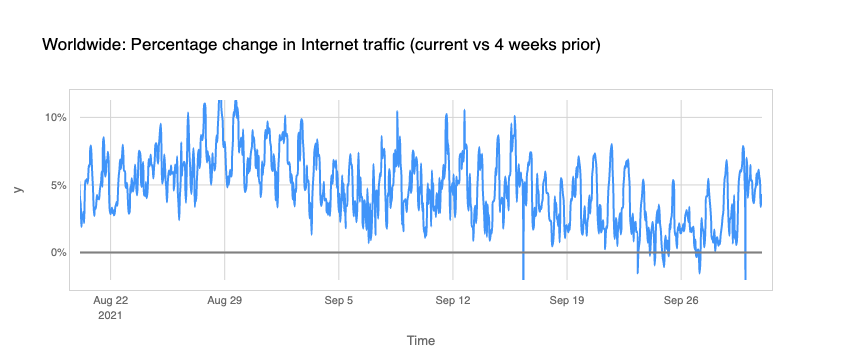
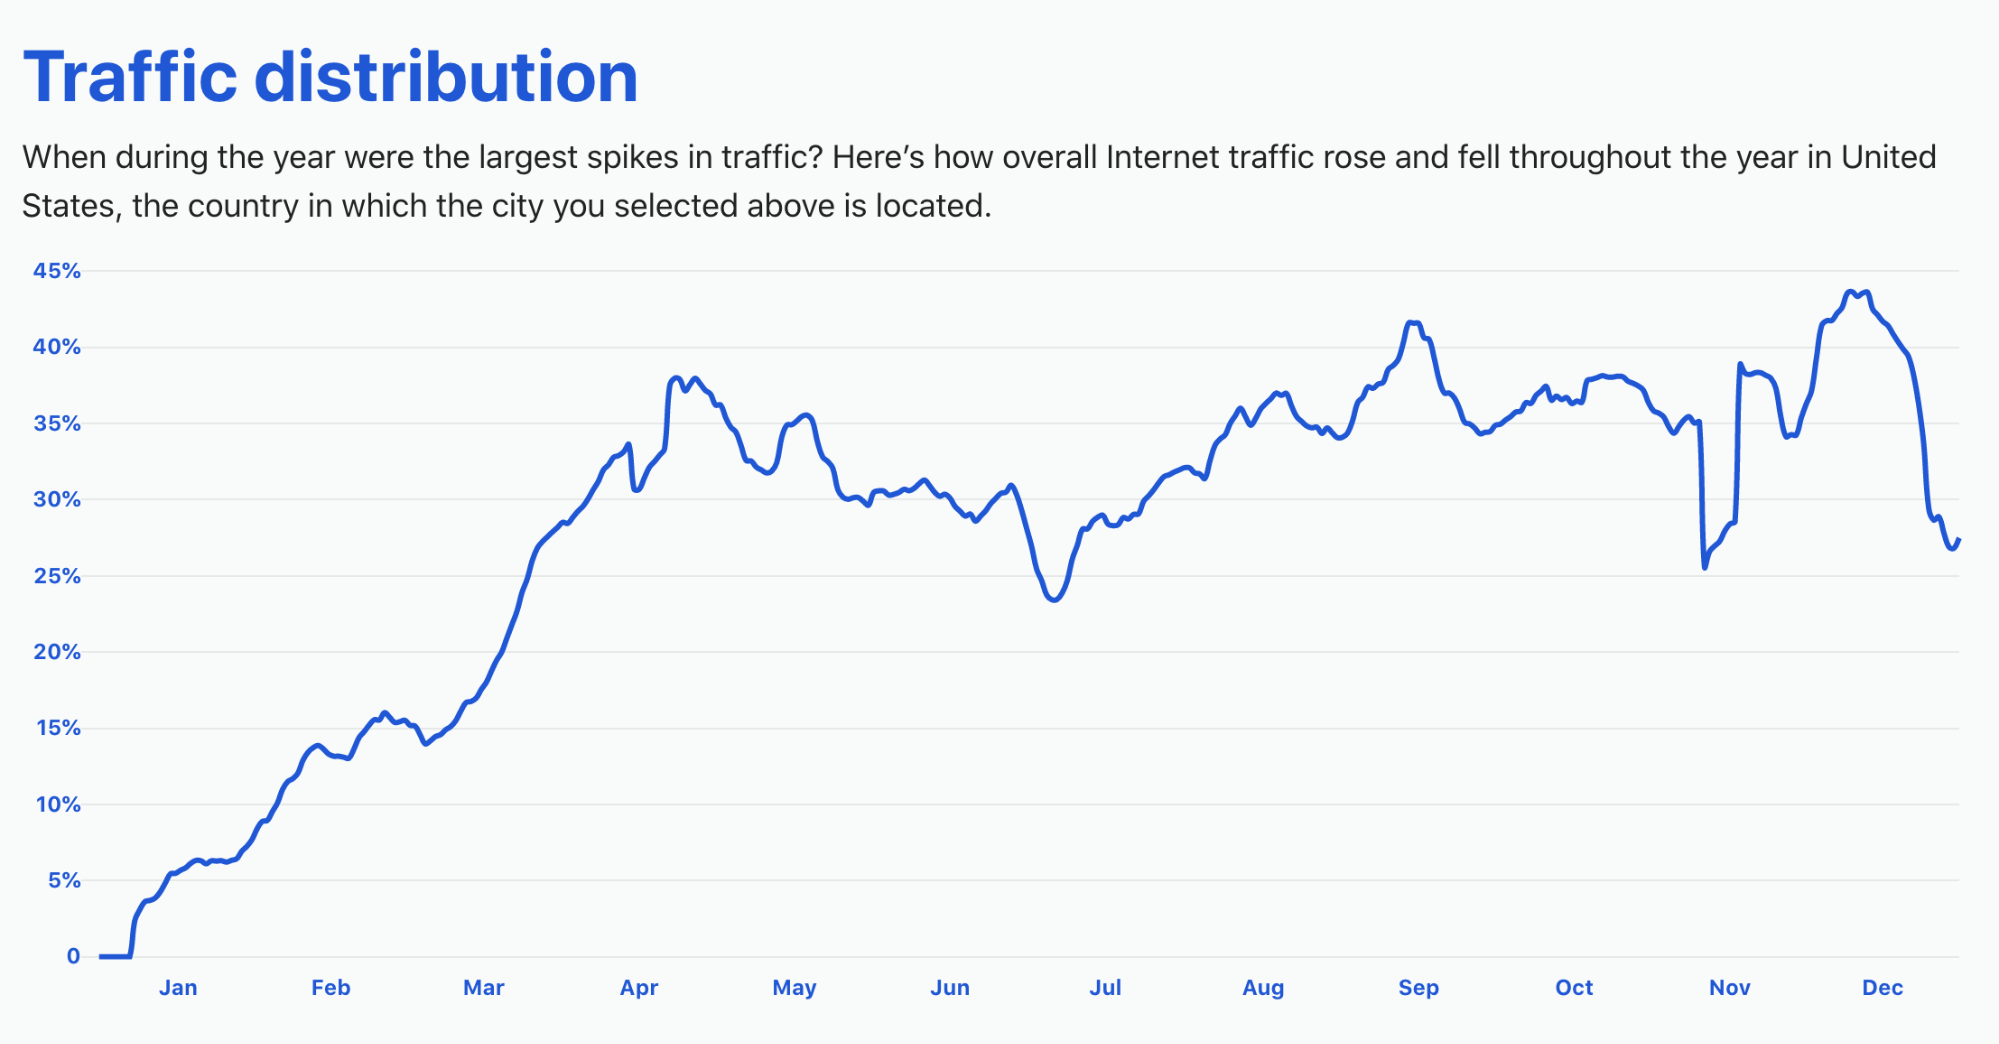
September brings shifts in the Internet traffic trends that seem to have an impact on the way people access the Internet and that goes beyond mobile usage, we can also see that worldwide: the Internet traffic percentage grew significantly — some days more than 10% — in September compared to August (like the graph shows).
It’s not that surprising when you realise that most people on Earth live in the Northern Hemisphere, where August is a summer and vacation month for many – although countries like India have the rainy monsoon season in August and Mid-September before autumn, for example. So September is not only the month wherein some countries students go back to school, but also when many go back to work.
Here’s a summary of the trends observed in Q3 ‘21:
Application-layer (L7) DDoS attack trends:
For the second consecutive quarter in 2021, US-based companies were the most targeted in the world.
For the first time in 2021, attacks on UK-based and Canada-based companies skyrocketed, making them the second and third most targeted countries, respectively.
Attacks on Computer Software, Gaming/ Gambling, IT, and Internet companies increased by an average of 573% compared to the previous quarter.
Meris, one of the most powerful botnets in history, aided in launching DDoS campaigns across various industries and countries. You can read more on that here.
Network-layer (L3/4) DDoS attack trends:
DDoS attacks increased by 44% worldwide compared to the previous quarter.
The Middle East and Africa recorded the largest average attack increase of approximately 80%.
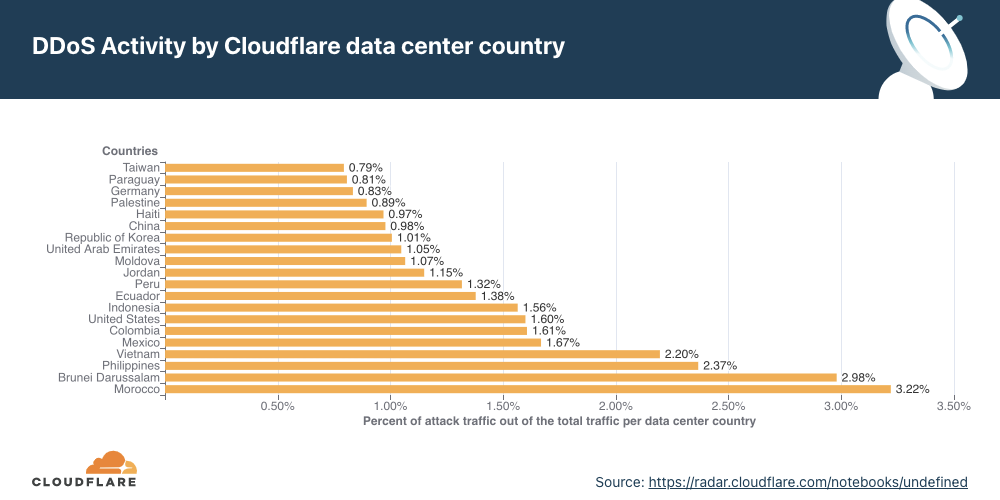
Morocco recorded the highest DDoS activity in the third quarter globally — three out of every 100 packets were part of a DDoS attack.
While SYN and RST attacks remain the dominant attack method used by attackers, Cloudflare observed a surge in DTLS amplification attacks — recording a 3,549% increase QoQ.
Attackers targeted (and continue to target going into the fourth quarter this year) VoIP service providers with massive DDoS attack campaigns in attempts to bring SIP infrastructure down.
Note on avoiding data biases: When we analyze attack trends, we calculate the “DDoS activity” rate, which is the percentage of attack traffic of the total traffic (attack + clean). When reporting application- and network-layer DDoS attack trends, we use this metric, which allows us to normalize the data points and avoid biases toward, for example, a larger Cloudflare data center that naturally handles more traffic and therefore also, possibly, more attacks compared to a smaller Cloudflare data center located elsewhere.
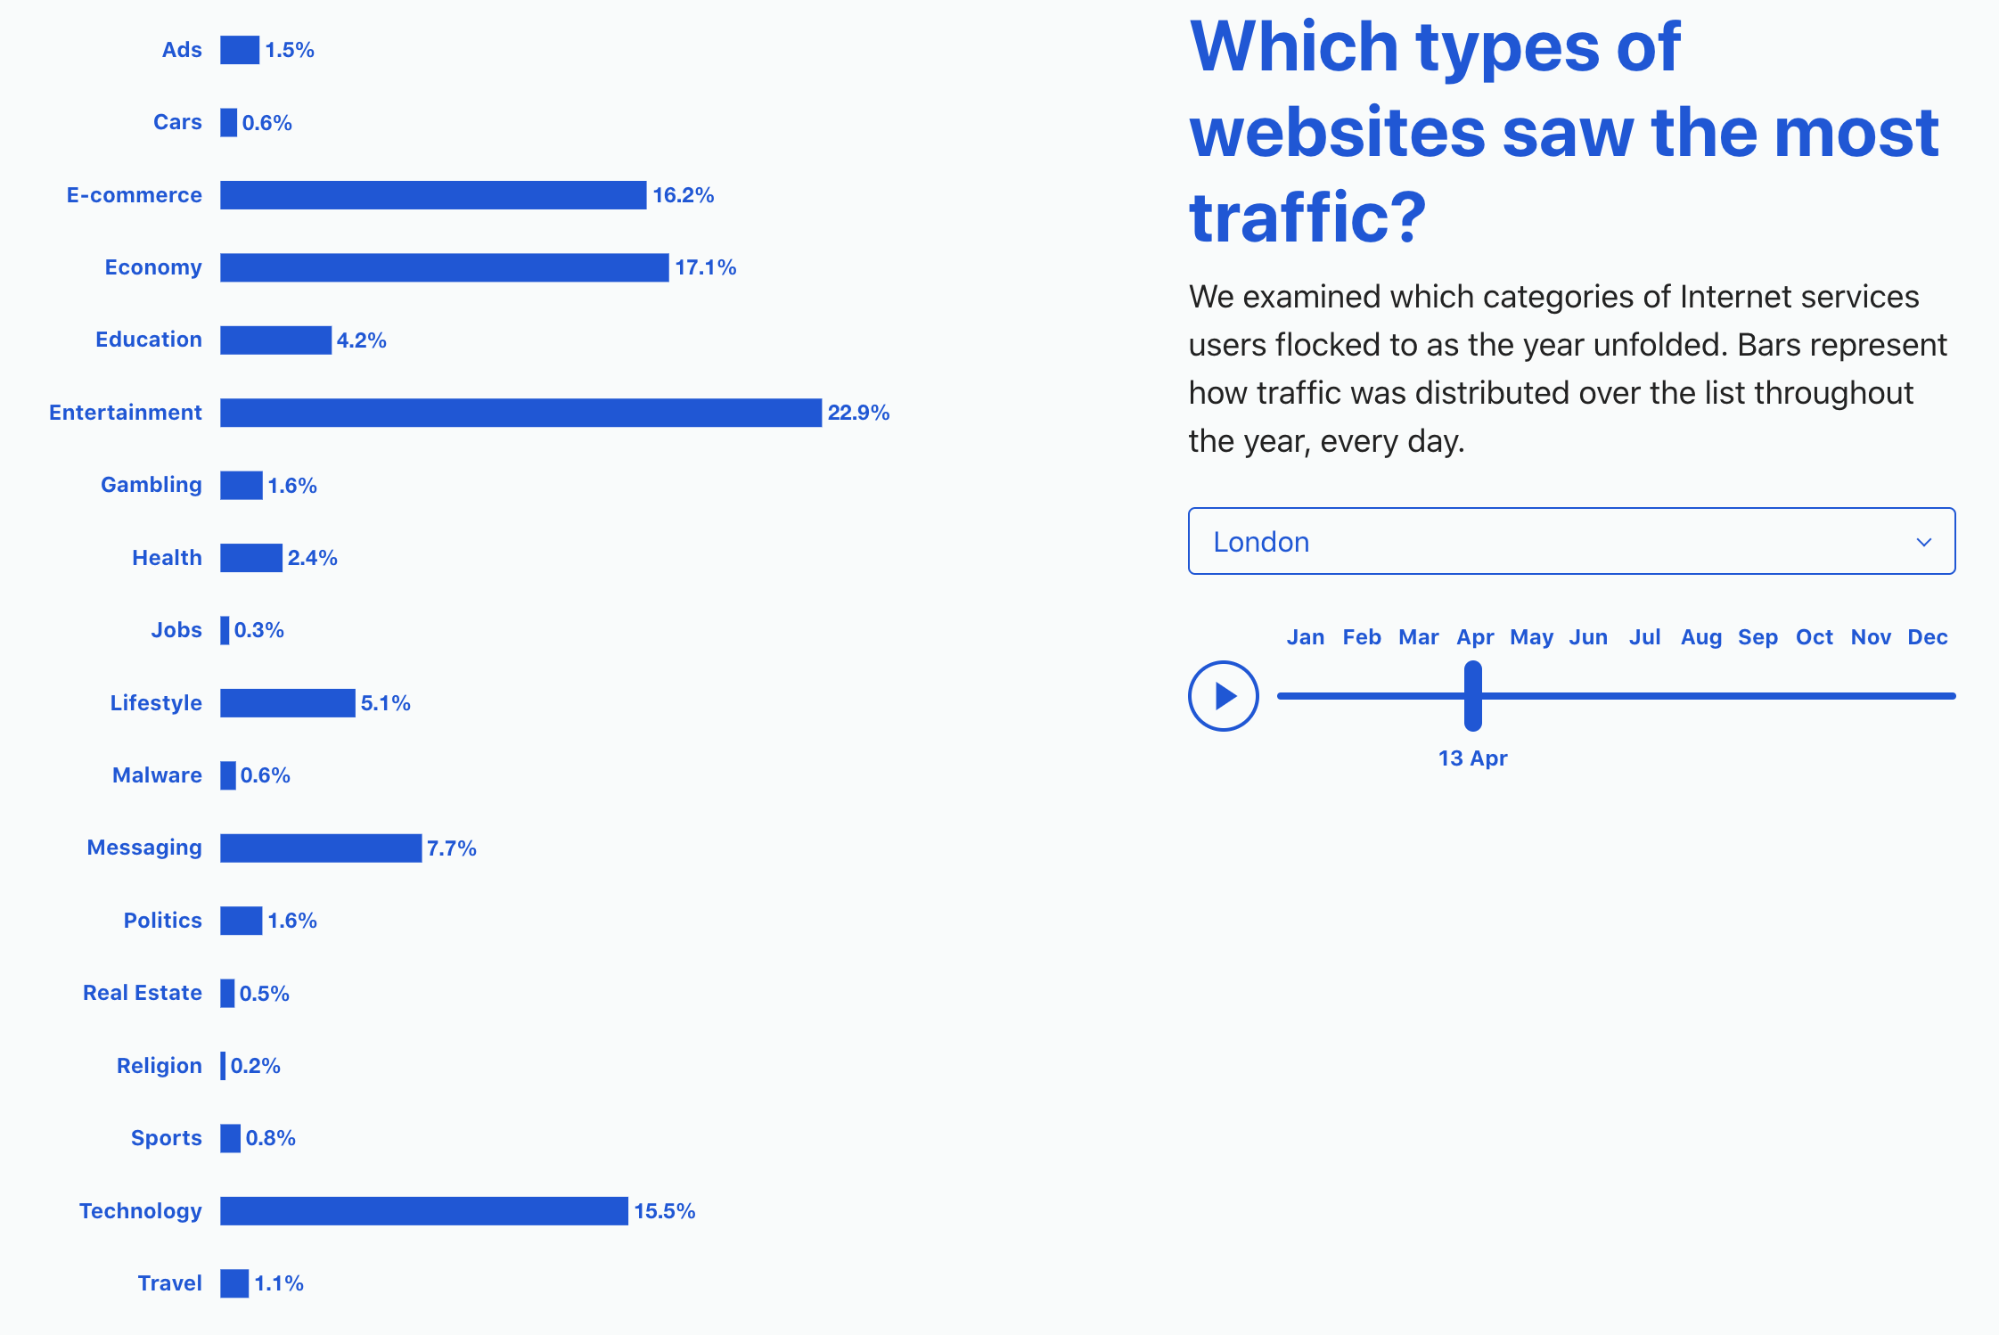
Application-layer DDoS attacks
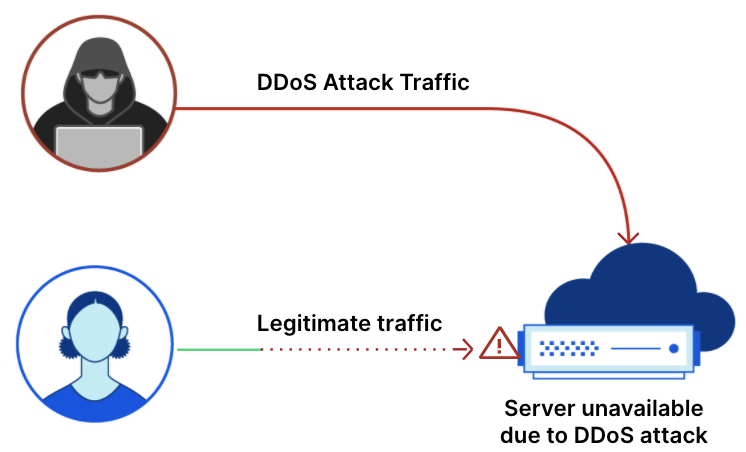
Application-layer DDoS attacks, specifically HTTP DDoS attacks, are attacks that usually aim to disrupt a web server by making it unable to process legitimate user requests. If a server is bombarded with more requests than it can process, the server will drop legitimate requests and — in some cases — crash, resulting in degraded performance or an outage for legitimate users.
Q3 ‘21 was the quarter of Meris — one of the most powerful botnets deployed to launch some of the largest HTTP DDoS attacks in history.
This past quarter, we observed one of the largest recorded HTTP attacks — 17.2M rps (requests per second) — targeting a customer in the financial services industry. One of the most powerful botnets ever observed, called Meris, is known to be deployed in launching these attacks.
Meris (Latvian for plague) is a botnet behind recent DDoS attacks that have targeted networks or organizations around the world. The Meris botnet infected routers and other networking equipment manufactured by the Latvian company MikroTik. According to MikroTik’s blog, a vulnerability in the MikroTik RouterOS (that was patched after its detection back in 2018) was exploited in still unpatched devices to build a botnet and launch coordinated DDoS attacks by bad actors.
Similar to the Mirai botnet of 2016, Meris is one of the most powerful botnets recorded. While Mirai infected IoT devices with low computational power such as smart cameras, Meris is a growing swarm of networking infrastructure (such as routers and switches) with significantly higher processing power and data transfer capabilities than IoT devices — making them much more potent in causing harm at a larger scale. Be that as it may, Meris is an example of how the attack volume doesn’t necessarily guarantee damage to the target. As far as we know, Meris, despite its strength, was not able to cause significant impact or Internet outages. On the other hand, by tactically targeting the DYN DNS service in 2016, Mirai succeeded in causing significant Internet disruptions.
Application-layer DDoS attacks by industry
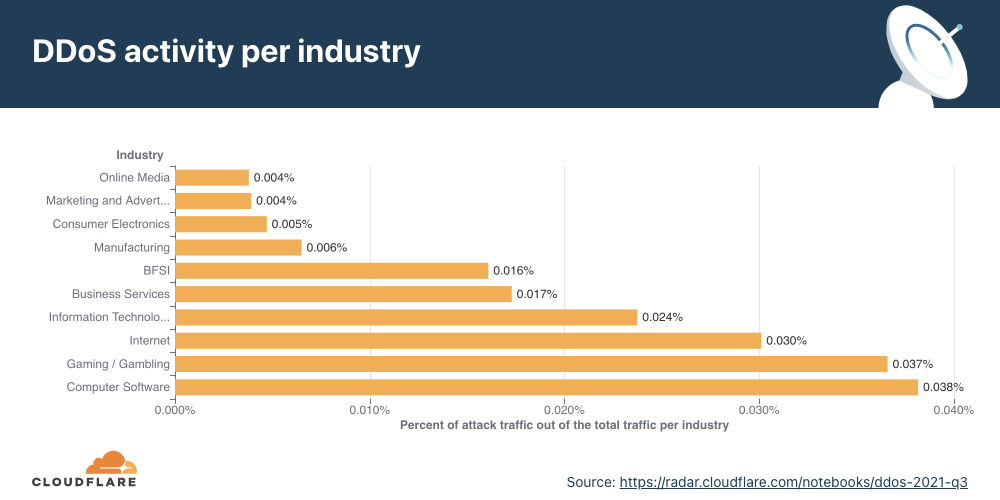
The tech and gaming industries were the most targeted industries in Q3 ‘21.
When we break down the application-layer attacks targeted by industry, Computer Software companies topped the charts. The Gaming/Gambling industry, also known to be regular targets of online attacks, was a close second, followed by the Internet and IT industries.
Application-layer DDoS attacks by source country
To understand the origin of the HTTP attacks, we look at the geolocation of the source IP address belonging to the client that generated the attack HTTP requests. Unlike network-layer attacks, source IPs cannot be spoofed in HTTP attacks. A high DDoS activity rate in a given country usually indicates the presence of botnets operating from within.
In the third quarter of 2021, most attacks originated from devices/servers in China, the United States, and India. While China remains in first place, the number of attacks originating from Chinese IPs actually decreased by 30% compared to the previous quarter. Almost one out of every 200 HTTP requests that originated from China was part of an HTTP DDoS attack.
Additionally, attacks from Brazil and Germany shrank by 38% compared to the previous quarter. Attacks originating from the US and Malaysia reduced by 40% and 45%, respectively.
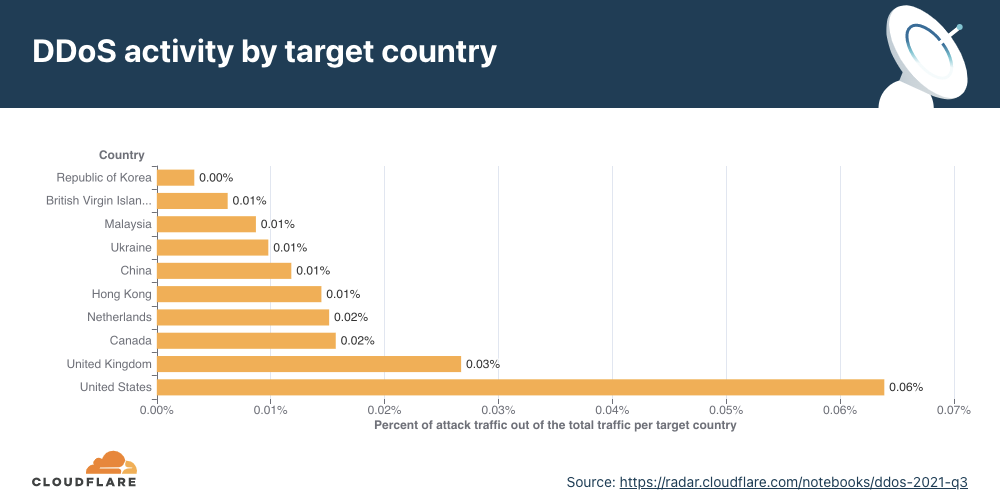
Application-layer DDoS attacks by target country
In order to identify which countries are targeted the most by L7 attacks, we break down the DDoS activity by our customers’ billing countries.
For the second consecutive time this year, organizations in the United States were targeted the most by L7 DDoS attacks in the world, followed by those in the UK and Canada.
Network-layer DDoS attacks
While application-layer attacks target the application (Layer 7 of the OSI model) running the service that end users are trying to access, network-layer attacks aim to overwhelm network infrastructure (such as in-line routers and servers) and the Internet link itself.
Mirai-variant botnet strikes with a force of 1.2 Tbps.
Q3 ‘21 was also the quarter when the infamous Mirai made a resurgence. A Mirai-variant botnet launched over a dozen UDP- and TCP-based DDoS attacks that peaked multiple times above 1 Tbps, with a max peak of approximately 1.2 Tbps. These network-layer attacks targeted Cloudflare customers on the Magic Transit and Spectrum services. One of these targets was a major APAC-based Internet services, telecommunications, and hosting provider and the other was a gaming company. In all cases, the attacks were automatically detected and mitigated without human intervention.
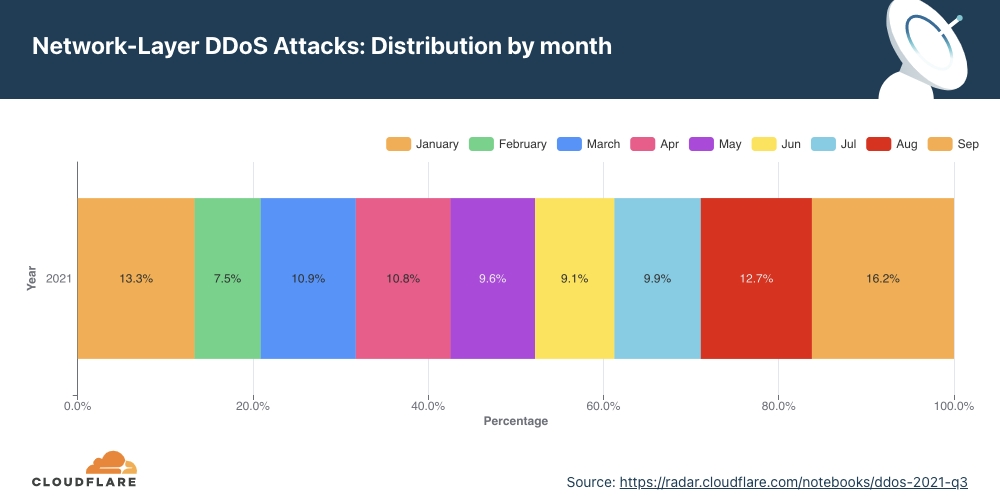
Network-layer DDoS attacks by month
September was, by far, the busiest month for attackers this year.
Q3 ‘21 accounted for more than 38% of all attacks this year. September was the busiest month for attackers so far in 2021 — accounting for over 16% of all attacks this year.
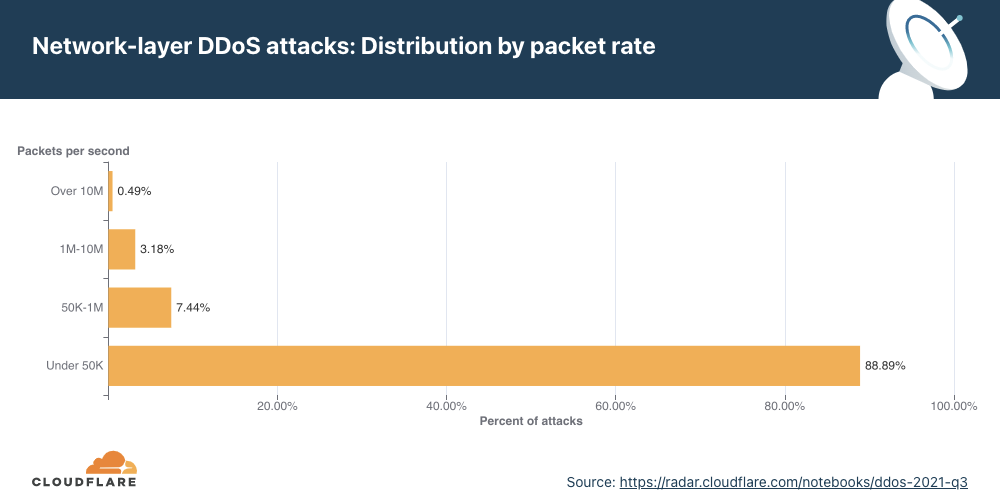
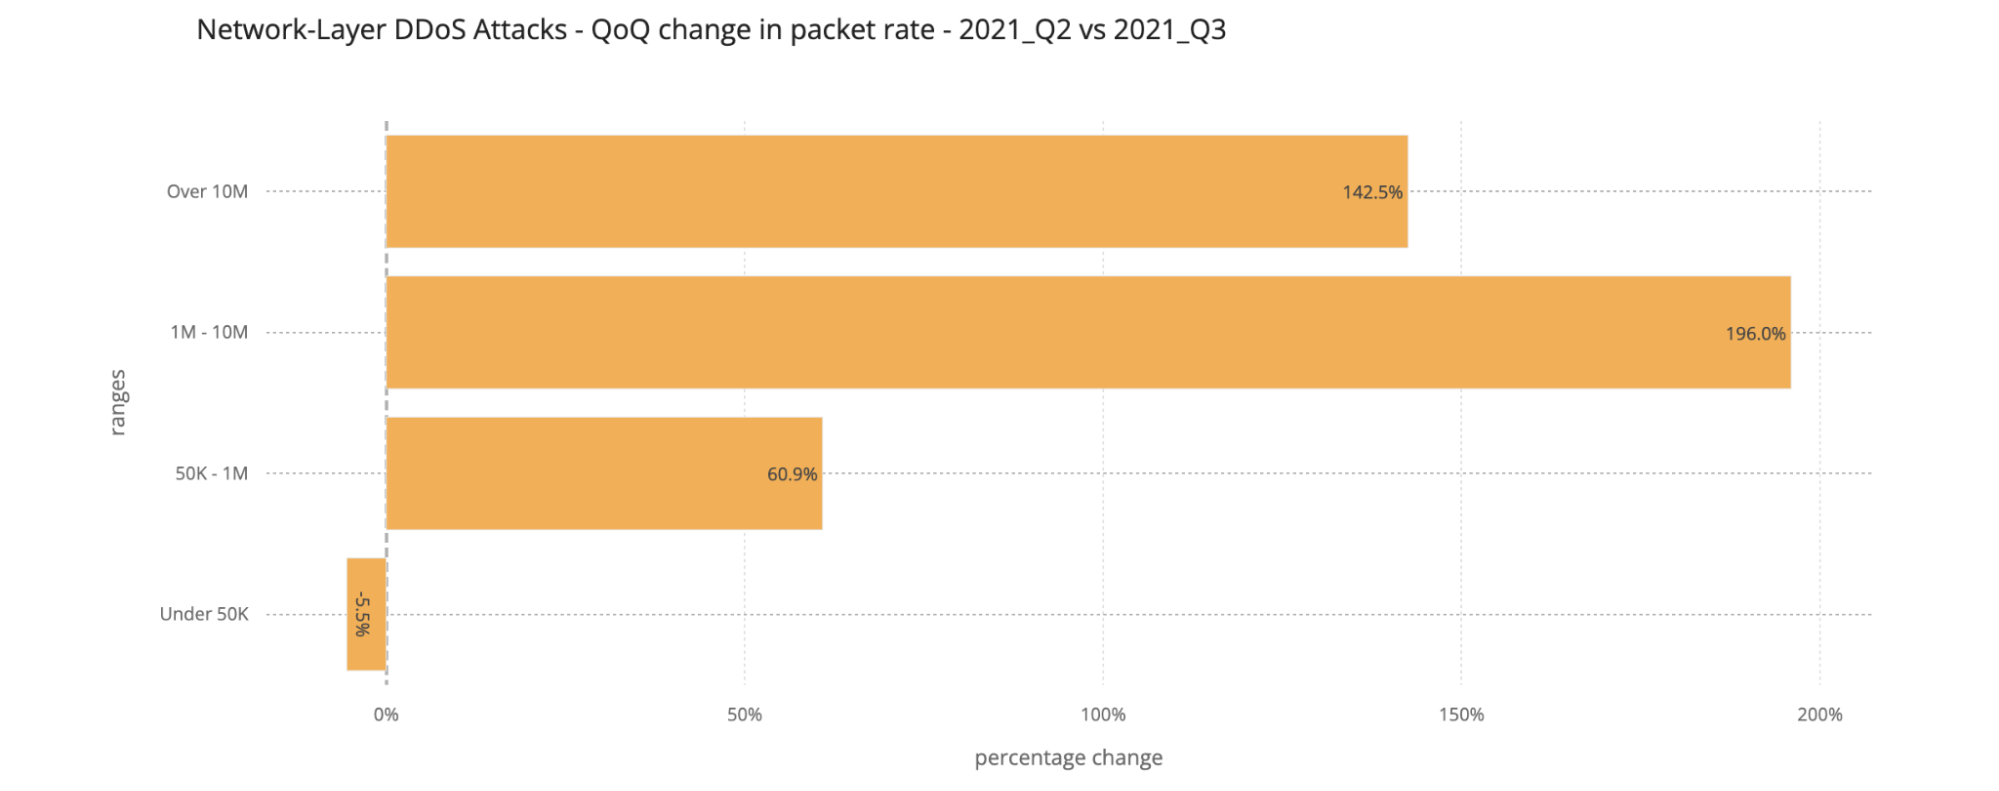
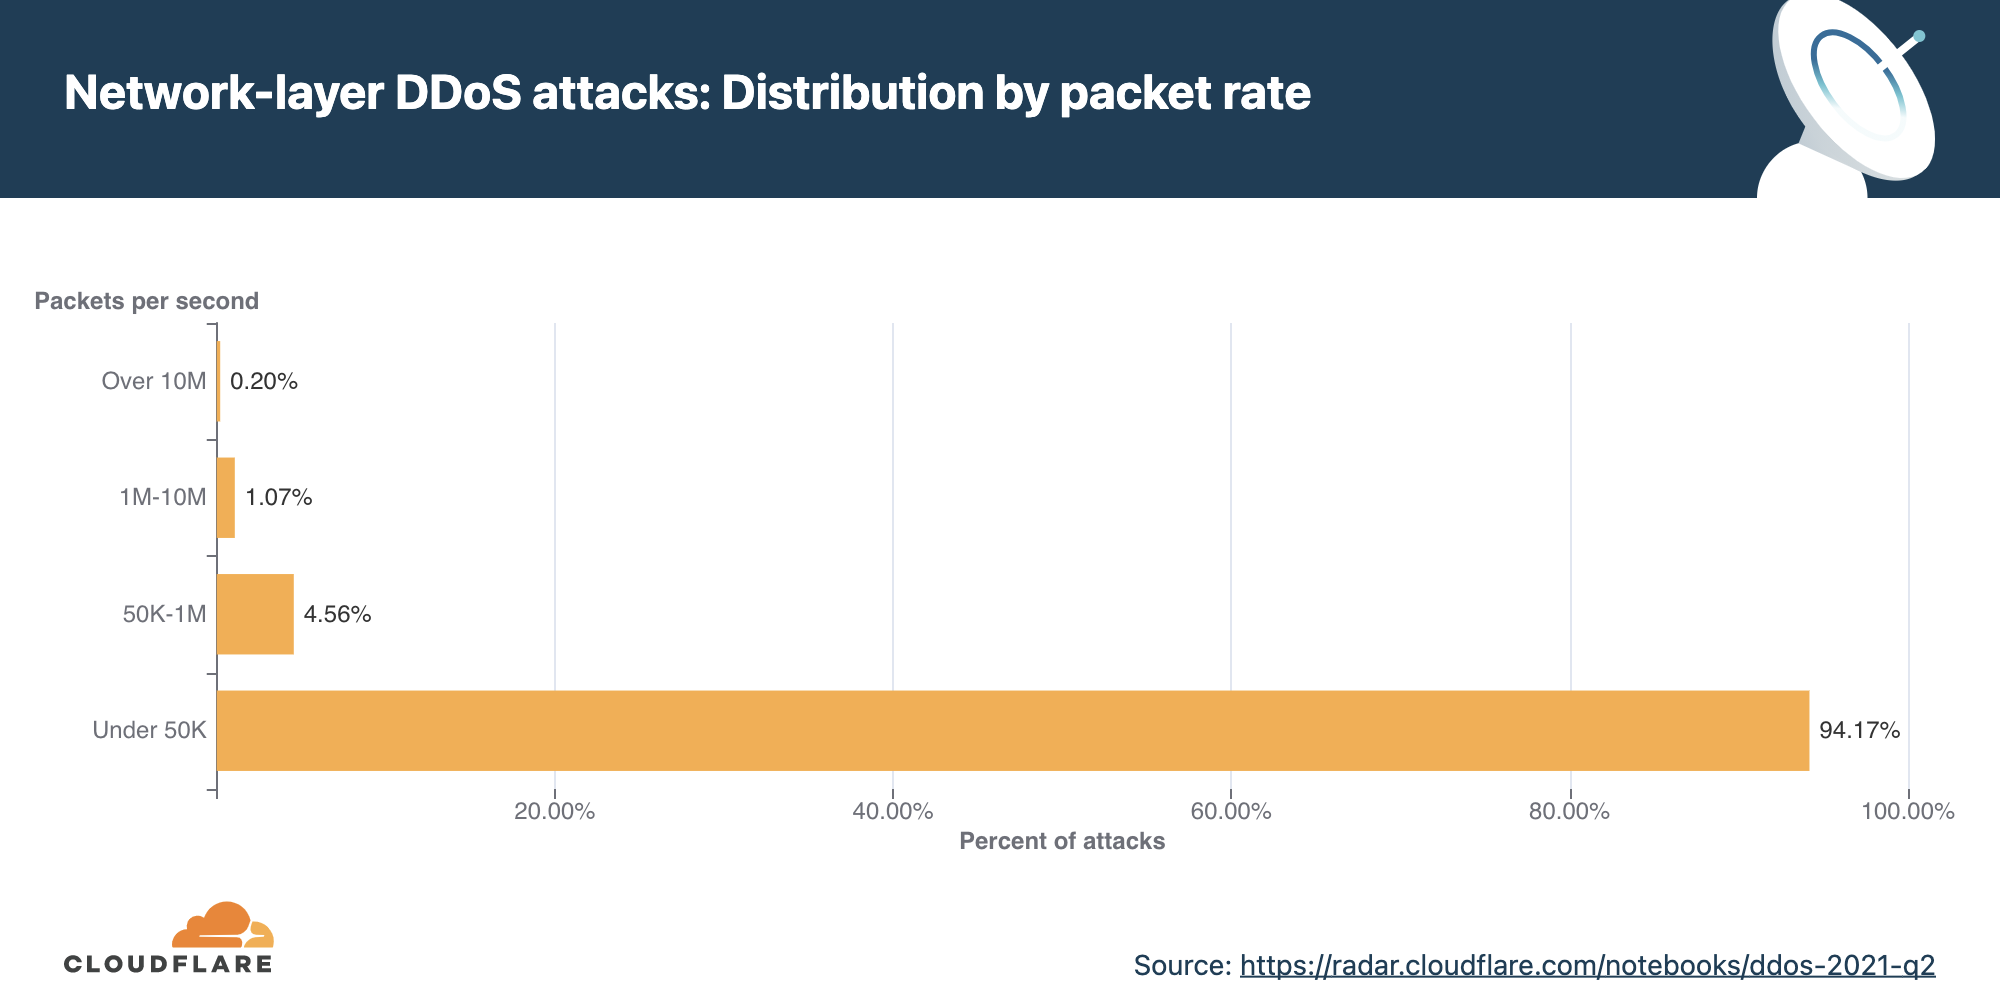
Network-layer DDoS attacks by attack rate
Most attacks are ‘small’ in size, but the number of larger attacks continues to rise.
There are different ways of measuring the size of a L3/4 DDoS attack. One is the volume of traffic it delivers, measured as the bit rate (specifically, terabits per second or gigabits per second). Another is the number of packets it delivers, measured as the packet rate (specifically, millions of packets per second).
Attacks with high bit rates attempt to cause a denial-of-service event by clogging the Internet link, while attacks with high packet rates attempt to overwhelm the servers, routers, or other in-line hardware appliances. Appliances dedicate a certain amount of memory and computation power to process each packet. Therefore, by bombarding it with many packets, the appliance can be left with no further processing resources. In such a case, packets are “dropped,” i.e., the appliance is unable to process them. For users, this results in service disruptions and denial of service.
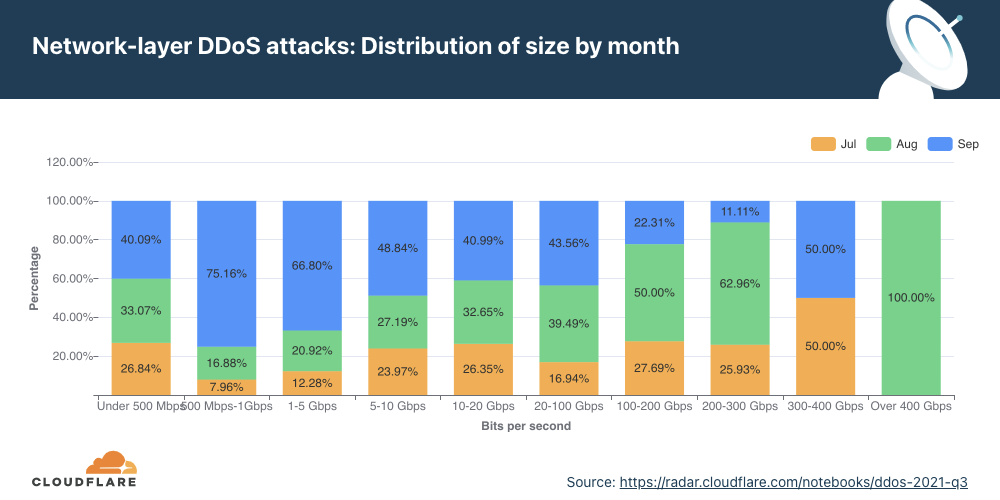
The distribution of attacks by their size (in bit rate) and month is shown below. Interestingly enough, all attacks over 400 Gbps took place in August, including some of the largest attacks we have seen; multiple attacks peaked above 1 Tbps and reached as high as 1.2 Tbps.
Packet rate As seen in previous quarters, the majority of attacks observed in Q3 ‘21 were relatively small in size — nearly 89% of all attacks peaked below 50K packets per second (pps). While a majority of attacks are smaller in size, we observed that the number of larger attacks is increasing QoQ — attacks that peaked above 10M pps increased by 142% QoQ.
Attacks of packet rates ranging from 1-10 million packets per second increased by 196% compared to the previous quarter. This trend is similar to what we observed the last quarter as well, suggesting that larger attacks are increasing.
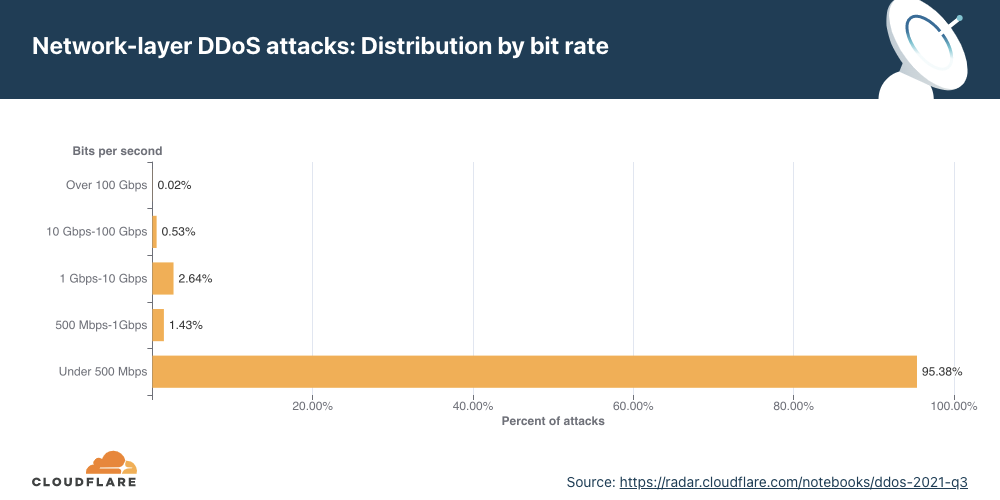
Bit rate From the bit rate perspective, a similar trend was observed — a total of 95.4% of all attacks peaked below 500 Mbps.
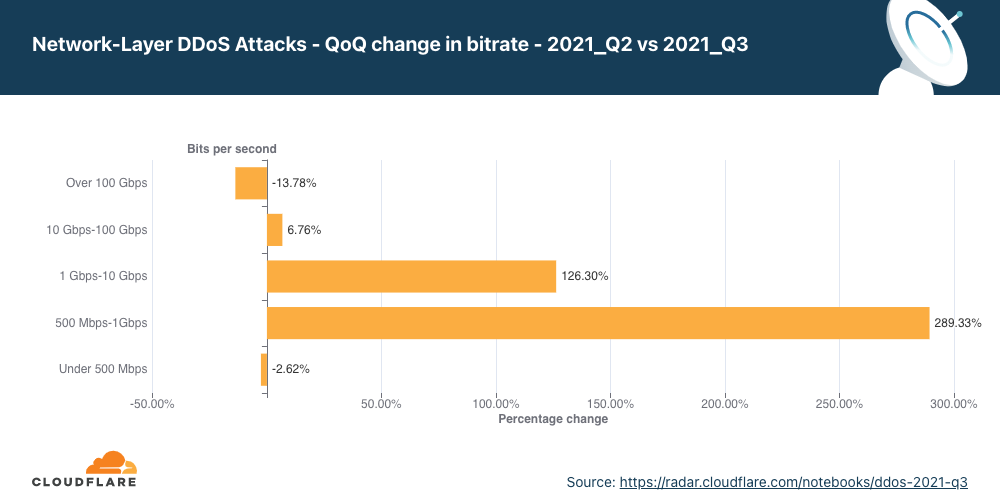
QoQ data shows that the number of attacks of sizes ranging from 500 Mbps to 10 Gbps saw massive increases of 126% to 289% compared to the previous quarter. Attacks over 100 Gbps decreased by nearly 14%.
The number of larger bitrate attacks increased QoQ (with the one exception being attacks over 100 Gbps, which decreased by nearly 14% QoQ). In particular, attacks ranging from 500 Mbps to 1 Gbps saw a surge of 289% QoQ and those ranging from 1 Gbps to 100 Gbps surged by 126%.
This trend once again illustrates that, while (in general) a majority of the attacks are indeed smaller, the number of “larger” attacks is increasing. This suggests that more attackers are garnering more resources to launch larger attacks.
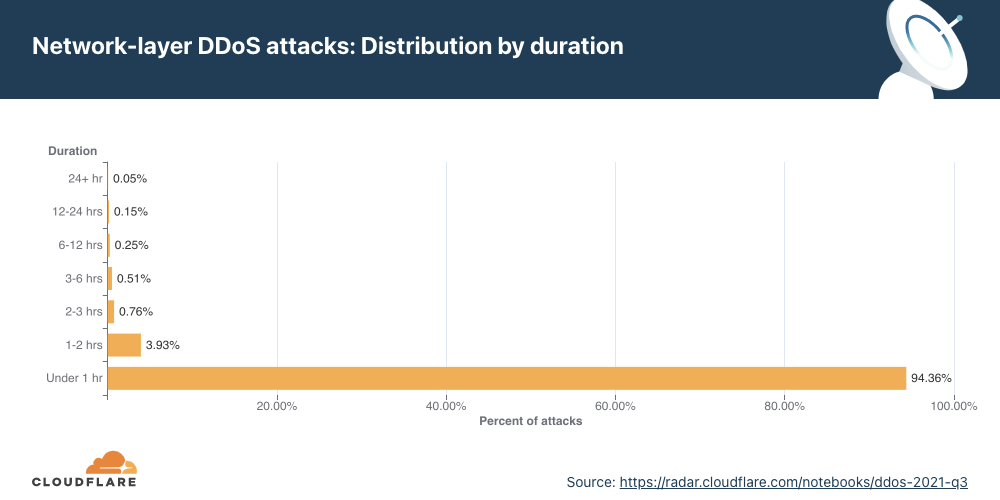
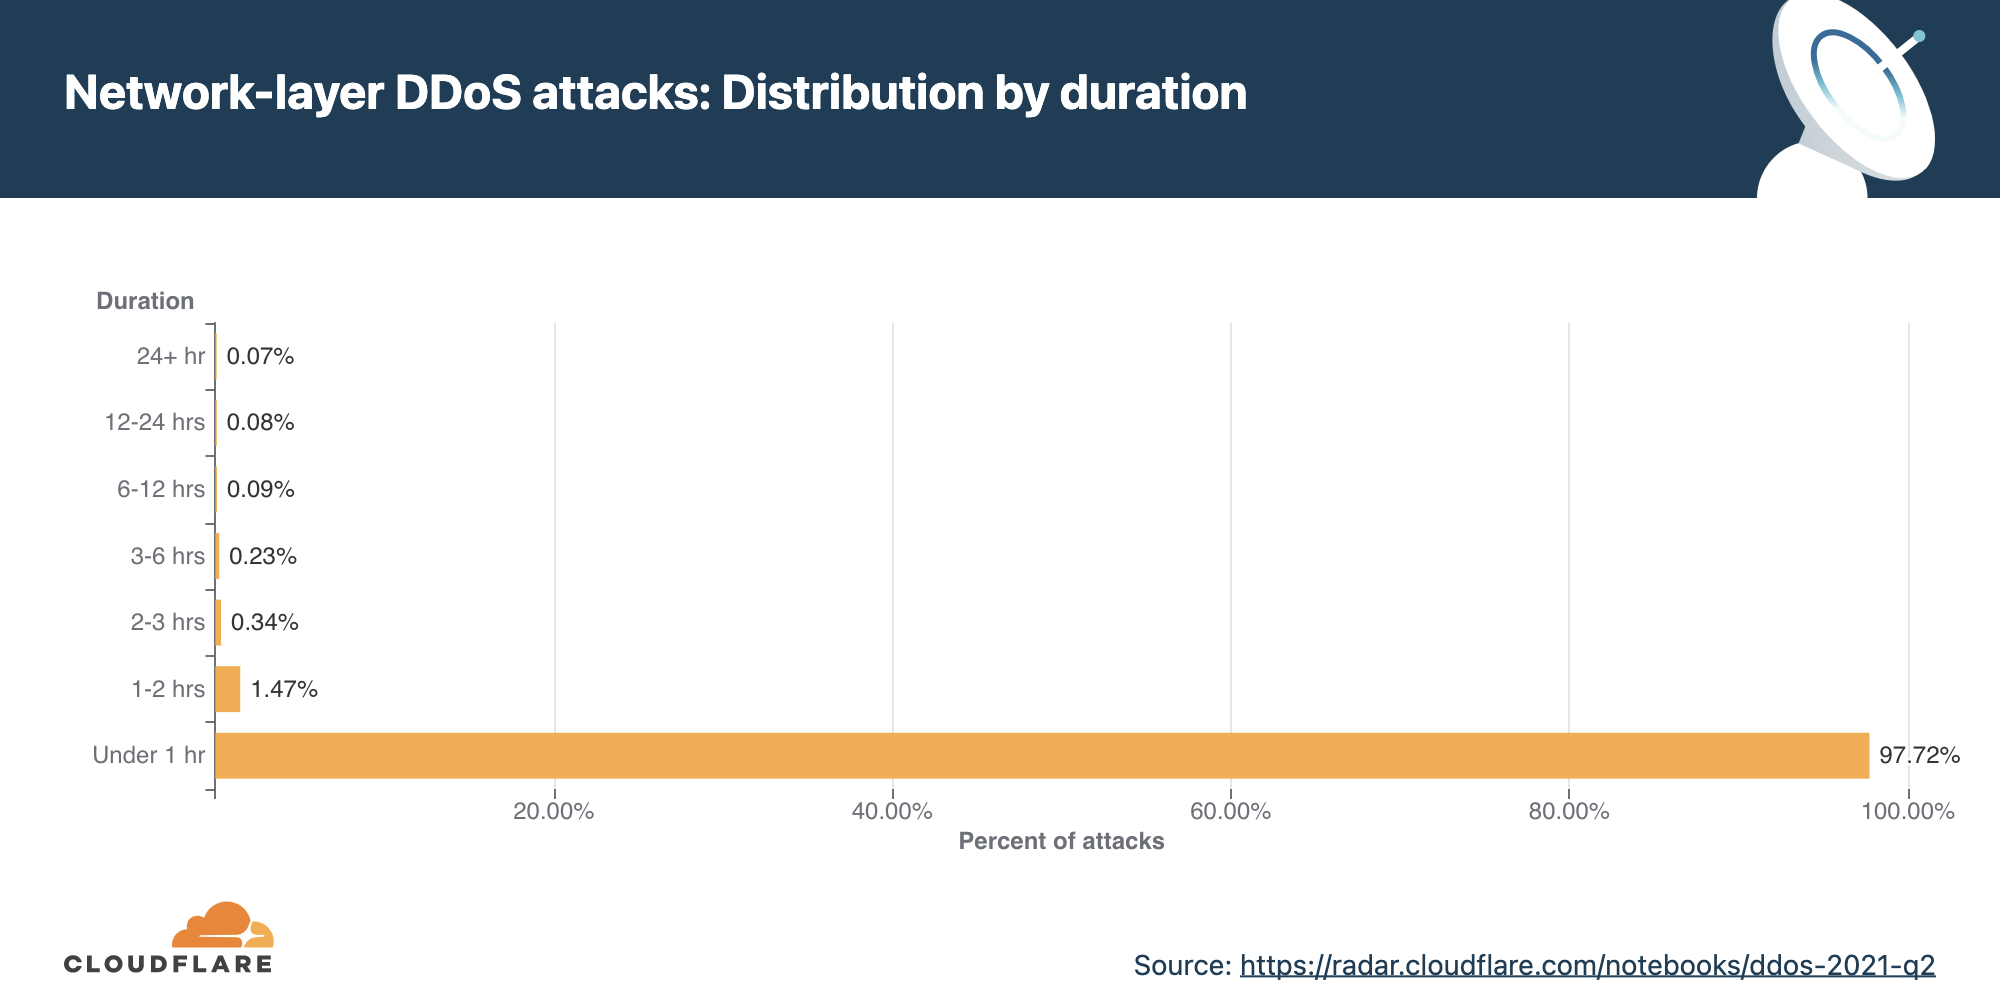
Network-layer DDoS attacks by duration
Most attacks remain under one hour in duration, reiterating the need for automated always-on DDoS mitigation solutions.
We measure the duration of an attack by recording the difference between when it is first detected by our systems as an attack and the last packet we see with that attack signature. As in previous quarters, most of the attacks are short-lived. To be specific, 94.4% of all DDoS attacks lasted less than an hour. On the other end of the axis, attacks over 6 hours accounted for less than 0.4% in Q3 ‘21, and we did see a QoQ increase of 165% in attacks ranging 1-2 hours. Be that as it may, a longer attack does not necessarily mean a more dangerous one.
Short attacks can easily go undetected, especially burst attacks that, within seconds, bombard a target with a significant number of packets, bytes, or requests. In this case, DDoS protection services that rely on manual mitigation by security analysis have no chance in mitigating the attack in time. They can only learn from it in their post-attack analysis, then deploy a new rule that filters the attack fingerprint and hope to catch it next time. Similarly, using an “on-demand” service, where the security team will redirect traffic to a DDoS provider during the attack, is also inefficient because the attack will already be over before the traffic routes to the on-demand DDoS provider.
Cloudflare recommends that companies use automated, always-on DDoS protection services that analyze traffic and apply real-time fingerprinting fast enough to block the short-lived attacks. Cloudflare analyzes traffic out-of-path, ensuring that DDoS mitigation does not add any latency to legitimate traffic, even in always-on deployments. Once an attack is identified, our autonomous edge DDoS protection system (dosd) generates and applies a dynamically crafted rule with a real-time signature. Pre-configured firewall rules comprising allow/deny lists for known traffic patterns take effect immediately.
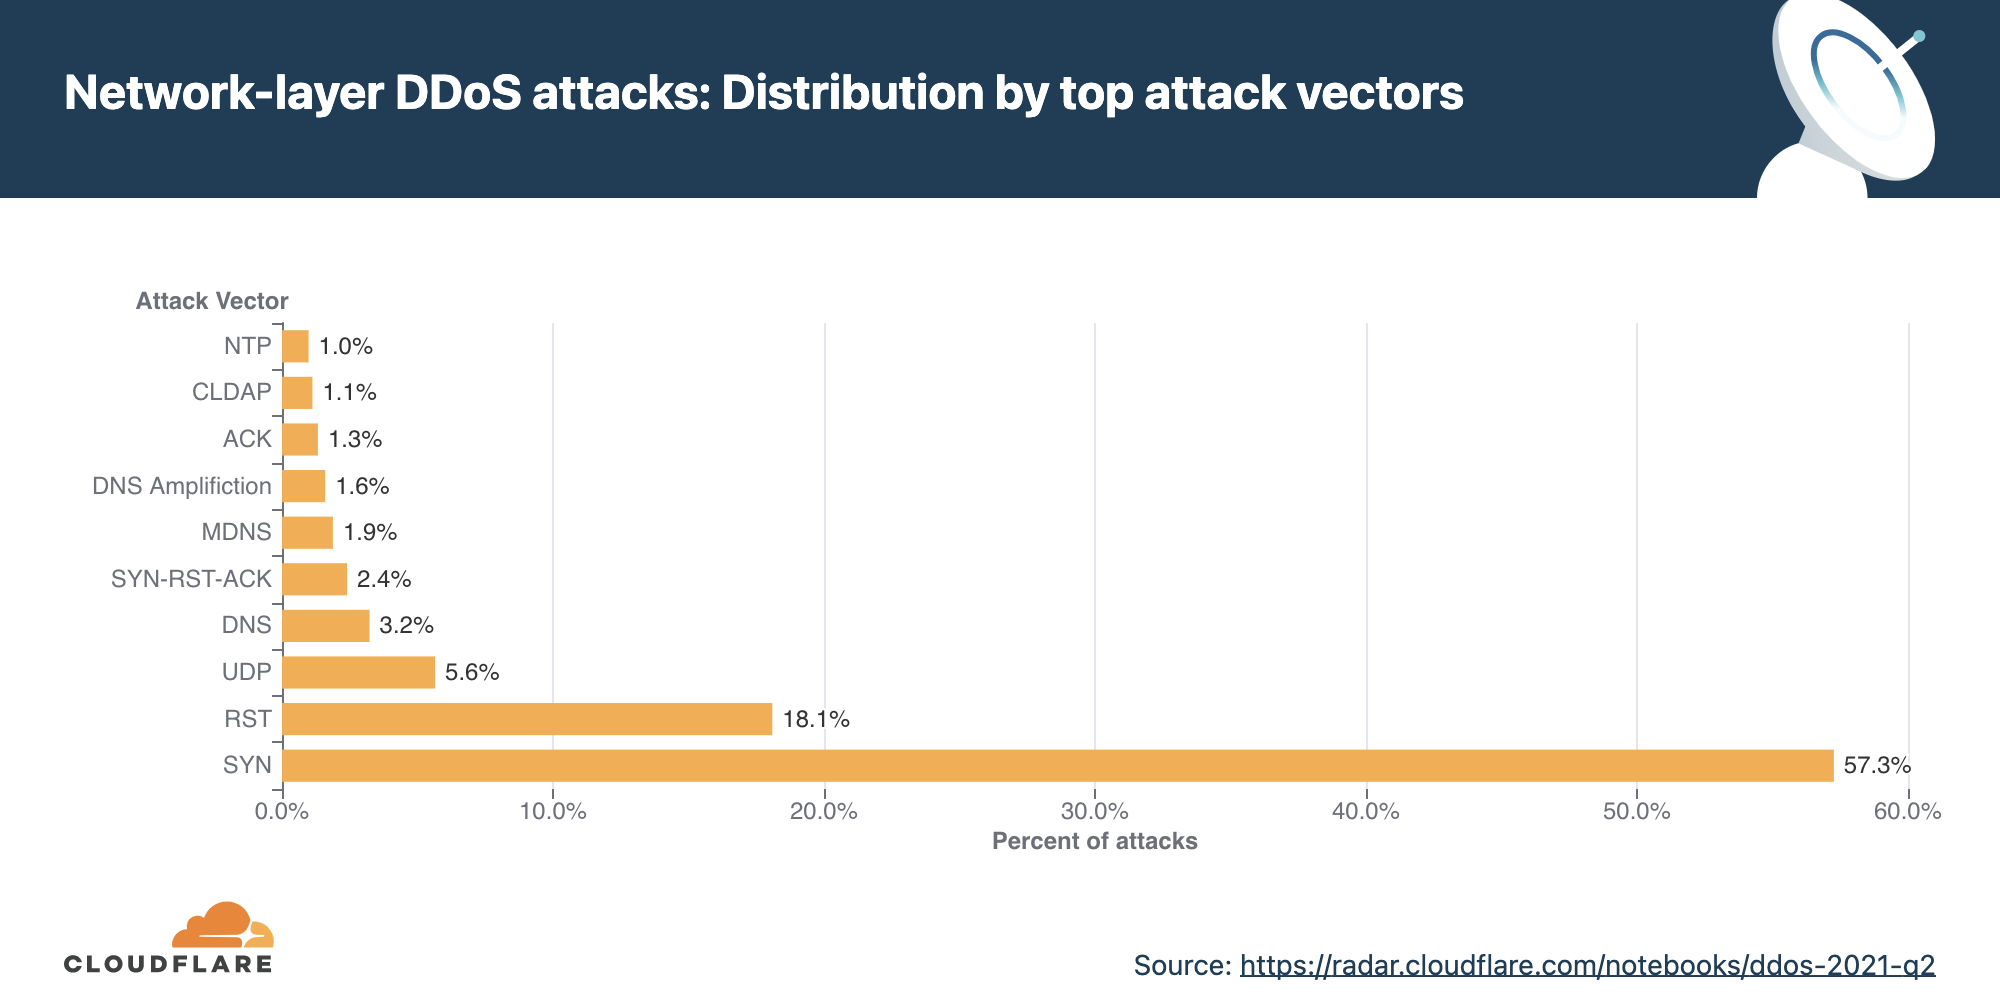
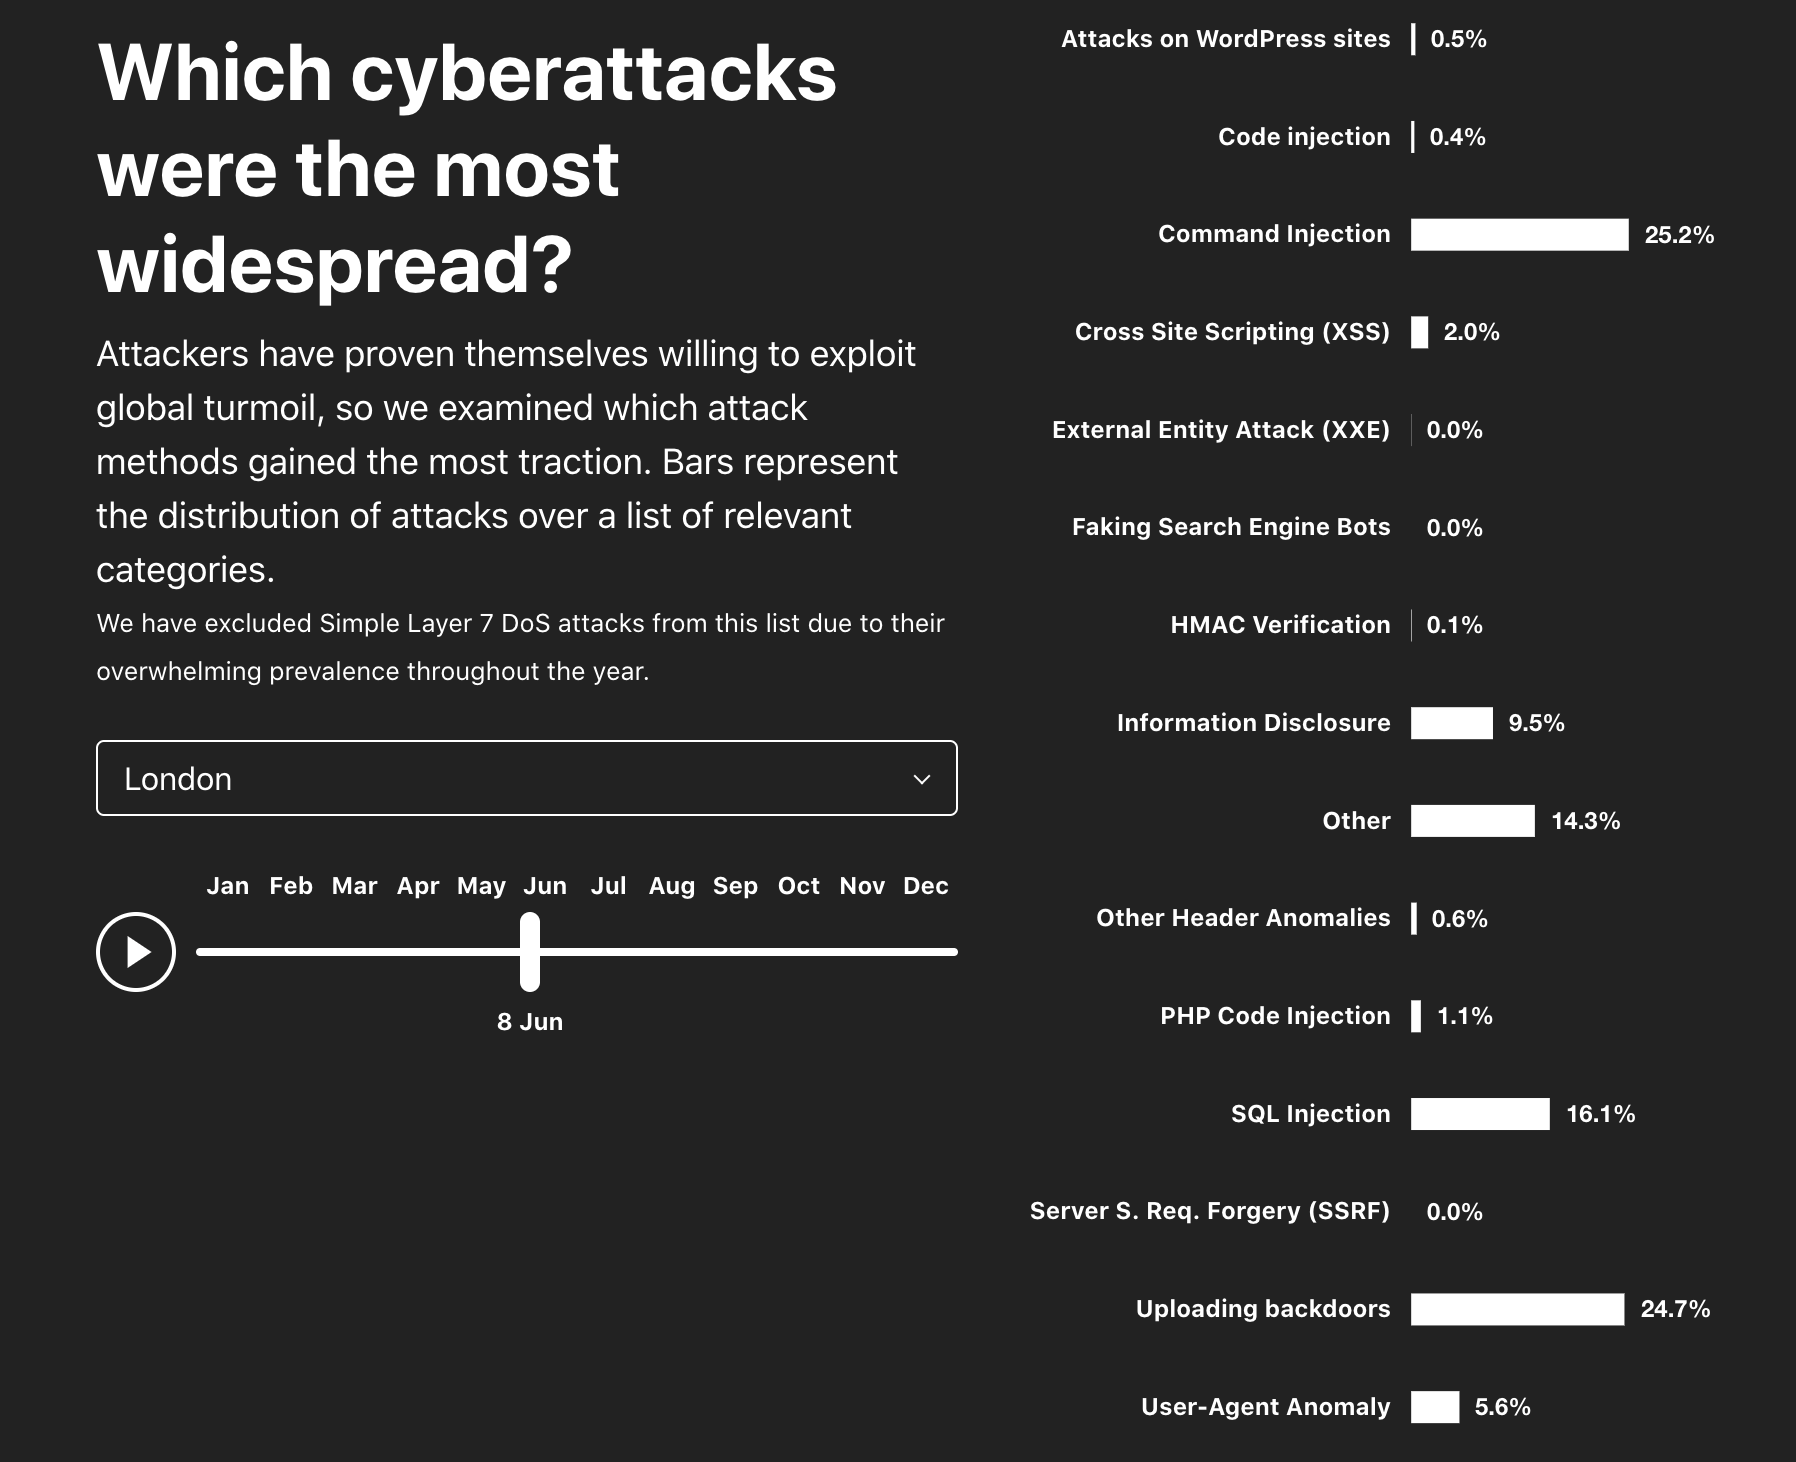
Attack vectors
SYN floods remain attackers’ favorite method of attack, while attacks over DTLS saw a massive surge — 3,549% QoQ.
An attack vector is the term used to describe the method that the attacker utilizes in their attempt to cause a denial-of-service event.
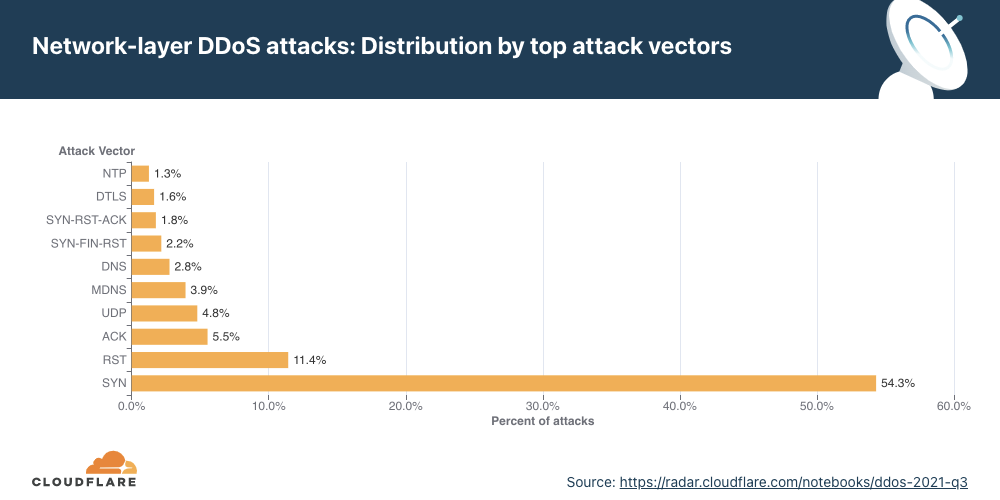
As observed in previous quarters, attacks utilizing SYN floods remain the most popular method used by attackers.
A SYN flood attack is a DDoS attack that works by exploiting the very foundation of the TCP protocol — the stateful TCP connection between a client and a server as a part of the 3-way TCP handshake. As a part of the TCP handshake, the client sends an initial connection request packet with a synchronize flag (SYN). The server responds with a packet that contains a synchronized acknowledgment flag (SYN-ACK). Finally, the client responds with an acknowledgment (ACK) packet. At this point, a connection is established and data can be exchanged until the connection is closed. This stateful process can be abused by attackers to cause denial-of-service events.
By repeatedly sending SYN packets, the attacker attempts to overwhelm a server or the router’s connection table that tracks the state of TCP connections. The server replies with a SYN-ACK packet, allocates a certain amount of memory for each given connection, and falsely waits for the client to respond with the final ACK. Given a sufficient number of connections occupying the server’s memory, the server is unable to allocate further memory for legitimate clients, causing the server to crash or preventing it from handling legitimate client connections, i.e., a denial-of-service event.
More than half of all attacks observed over our network were SYN floods. This was followed by RST, ACK, and UDP floods.
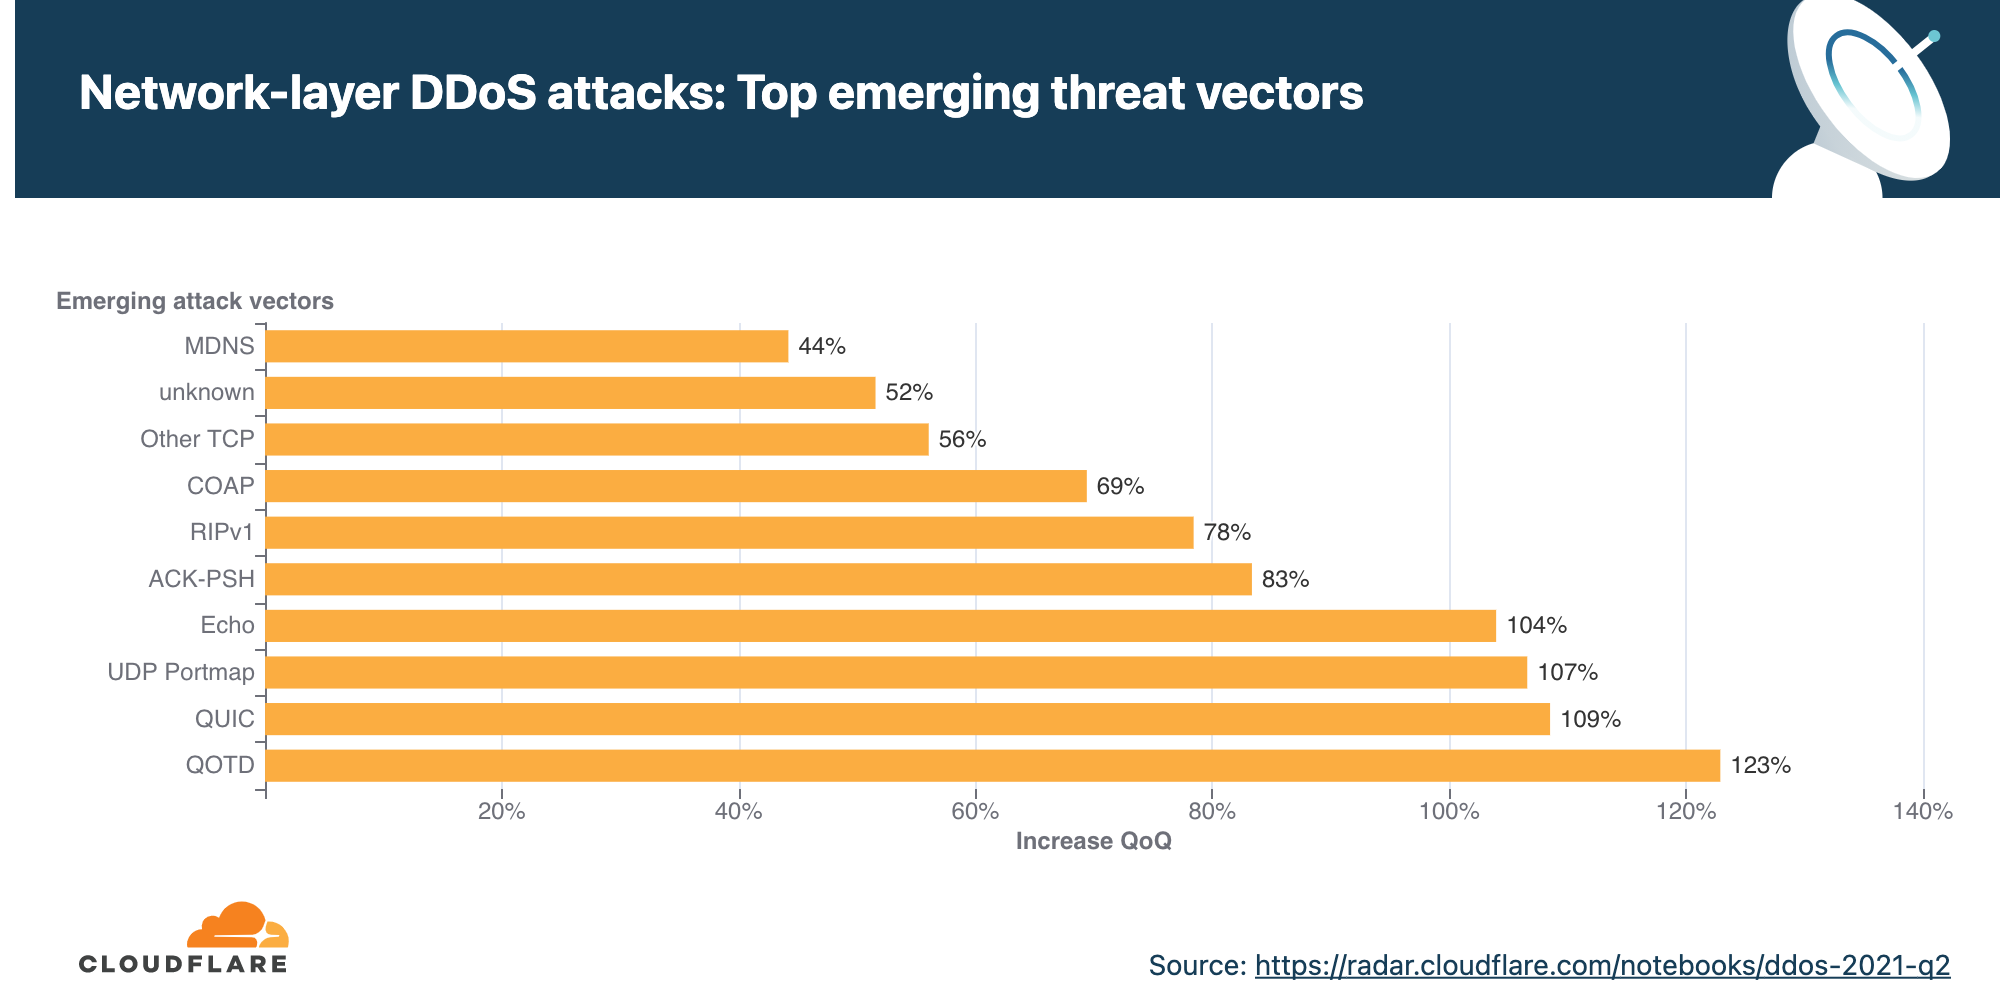
Emerging threats
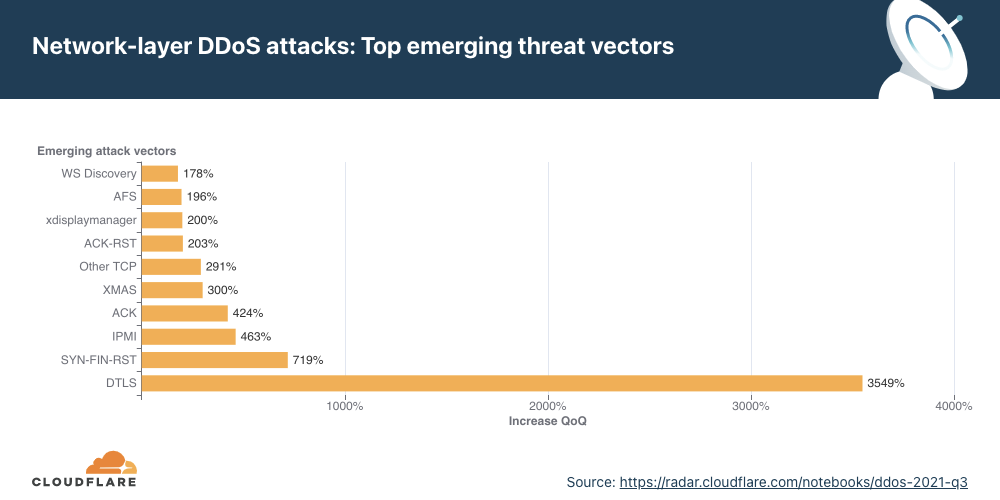
While SYN and RST floods remain popular overall, when we look at emerging attack vectors — which helps us understand what new vectors attackers are deploying to launch attacks — we observed a massive spike in DTLS amplification attacks. DTLS floods increased by 3,549% QoQ.
Datagram Transport Layer Security (DTLS) is a protocol similar to Transport Layer Security (TLS) designed to provide similar security guarantees to connectionless datagram-based applications to prevent message forgery, eavesdropping, or tampering. DTLS, being connectionless, is specifically useful for establishing VPN connections, without the TCP meltdown problem. The application is responsible for reordering and other connection properties.
Just as with most UDP-based protocols, DTLS is spoofable and being used by attackers to generate reflection amplification attacks to overwhelm network gateways.
Network-layer DDoS attacks by country
While Morocco topped the charts in terms of the highest network attack rate observed, Asian countries closely followed.
When analyzing network-layer DDoS attacks, we bucket the traffic by the Cloudflare edge data center locations where the traffic was ingested, and not by the source IP. The reason for this is that, when attackers launch network-layer attacks, they can spoof the source IP address in order to obfuscate the attack source and introduce randomness into the attack properties, which may make it harder for simple DDoS protection systems to block the attack. Hence, if we were to derive the source country based on a spoofed source IP, we would get a spoofed country.
Cloudflare is able to overcome the challenges of spoofed IPs by displaying the attack data by the location of the Cloudflare data center in which the attack was observed. We are able to achieve geographical accuracy in our report because we have data centers in over 250 cities around the world.
A note on recent attacks on voice over-IP service providers — and ransom DDoS attacks
We recently reported and provided an update on the surge in DDoS attacks on VoIP service providers — some of who have also received ransom threats. As of early Q4 ‘21, this attack campaign is still ongoing and current. At Cloudflare, we continue to onboard VoIP service providers and shield their applications and networks against attacks.
HTTP attacks against API gateways and the corporate websites of the providers have been combined with network-layer and transport-layer attacks against VoIP infrastructures.
Examples include:
TCP floods targeting stateful firewalls: These are being used in “trial-and-error” type attacks. They are not very effective against telephony infrastructure specifically (because it is mostly UDP) but very effective at overwhelming stateful firewalls.
UDP floods targeting SIP infrastructure: Floods of UDP traffic that have no well-known fingerprint, aimed at critical VoIP services. Generic floods like this may look like legitimate traffic to unsophisticated filtering systems.
UDP reflection targeting SIP infrastructure: These methods, when targeted at SIP or RTP services, can easily overwhelm Session Border Controllers (SBCs) and other telephony infrastructure. The attacker seems to learn enough about the target’s infrastructure to target such services with high precision.
SIP protocol-specific attacks: Attacks at the application layer are of particular concern because of the higher resource cost of generating application errors versus filtering on network devices.
Organizations also continue to receive ransom notes that threaten attacks in exchange for bitcoin. Ransomware and ransom DDoS attacks, for the fourth consecutive quarter, continue to be a germane threat to organizations all over the world.
Cloudflare products close off several threat vectors that can lead to a ransomware infection and ransom DDoS attacks:
Cloudflare Browser Isolation prevents drive-by downloads and other browser-based attacks.
A Zero Trust architecture can help prevent ransomware from spreading within a network.
Magic Transit protects organizations’ networks against DDoS attacks using BGP route redistribution — without impacting latency.
Helping build a better Internet
Cloudflare was founded on the mission to help build a better Internet. And part of that mission is to build an Internet where the impact of DDoS attacks is a thing of the past. Over the last 10 years, we have been unwavering in our efforts to protect our customers’ Internet properties from DDoS attacks of any size or kind. In 2017, we announced unmetered DDoS protection for free — as part of every Cloudflare service and plan, including the Free plan — to make sure every organization can stay protected and available. Organizations big and small have joined Cloudflare over the past several years to ensure their websites, applications, and networks are secure from DDoS attacks, and remain fast and reliable.
But cyberattacks come in various forms, not just DDoS attacks. Malicious bots, ransomware attacks, email phishing, and VPN / remote access hacks are some many attacks that continue to plague organizations of all sizes globally. These attacks target websites, APIs, applications, and entire networks — which form the lifeblood of any online business. That is why the Cloudflare security portfolio accounts for everything and everyone connected to the Internet.
It’s not every day that there is no Internet access in an entire country. In the case of Sudan, it has been five days without Internet after political turmoil that started last Monday, October 25, 2021 (as we described).
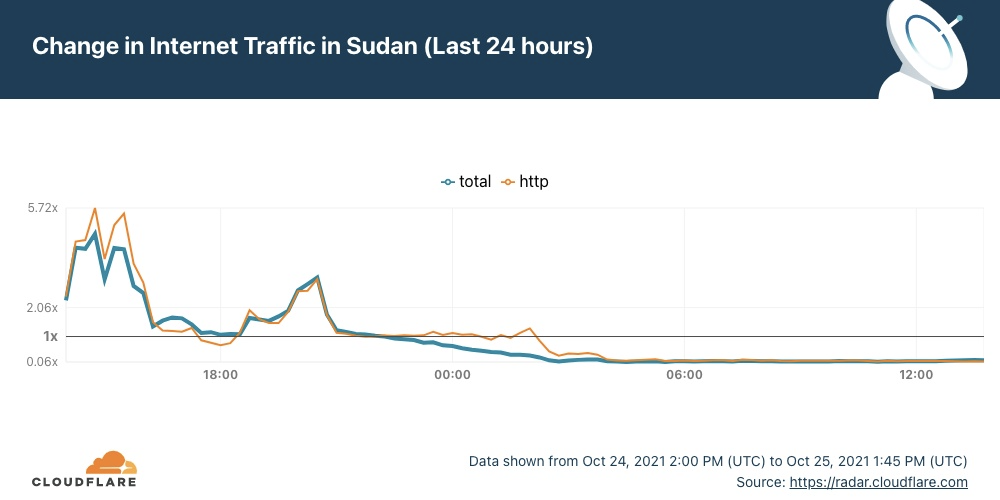
The outage continues with almost a flat line and just a trickle of Internet traffic from Sudan. Cloudflare Radar shows that the Internet in Sudan is still almost completely cut off.
There was a blip of traffic on Tuesday at ~14:00 UTC, for about one hour, but it flattened out again, and it continues like that — anyone can track the evolution on the Sudan page of Cloudflare Radar.
Internet shutdowns are not that rare
Internet disruptions, including shutdowns and social media restrictions, are common occurrences in some countries and Sudan is one where this happens more frequently than most countries according to Human Rights Watch. In our June blog, we talked about Sudan when the country decided to shut down the Internet to prevent cheating in exams, but there were situations in the past more similar to this days-long shutdown — something that usually happens when there’s political unrest.
The country’s longest recorded network disruption was back in 2018, when Sudanese authorities cut off access to social media (and messaging apps like WhatsApp) for 68 consecutive days from December 21, 2018 to February 26, 2019. There was a full mobile Internet shutdown reported from June 3 to July 9, 2019 that lasted 36 days.
You can keep an eye on Cloudflare Radar to monitor how we see the Internet traffic globally and in every country.
Today, October 25, following political turmoil, Sudan woke up without Internet access.
In our June blog, we talked about Sudan when the country decided to shut down the Internet to prevent cheating in exams.
Now, the disruption seems to be for other reasons. AP is reporting that “military forces … detained at least five senior Sudanese government figures.”. This afternoon (UTC) several media outlets confirmed that Sudan’s military dissolved the transitional government in a coup that shut down mobile phone networks and Internet access.
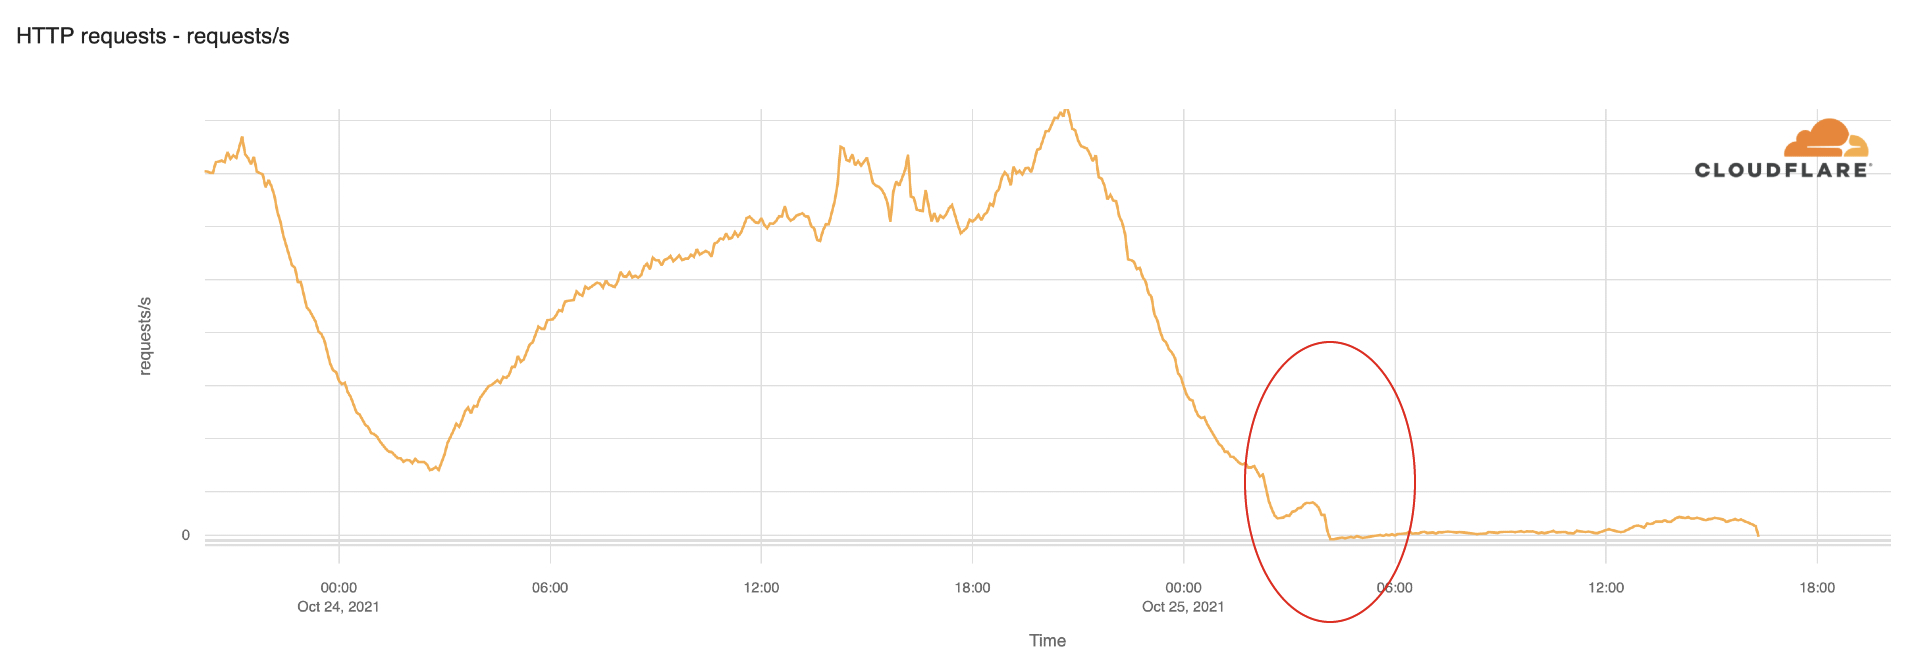
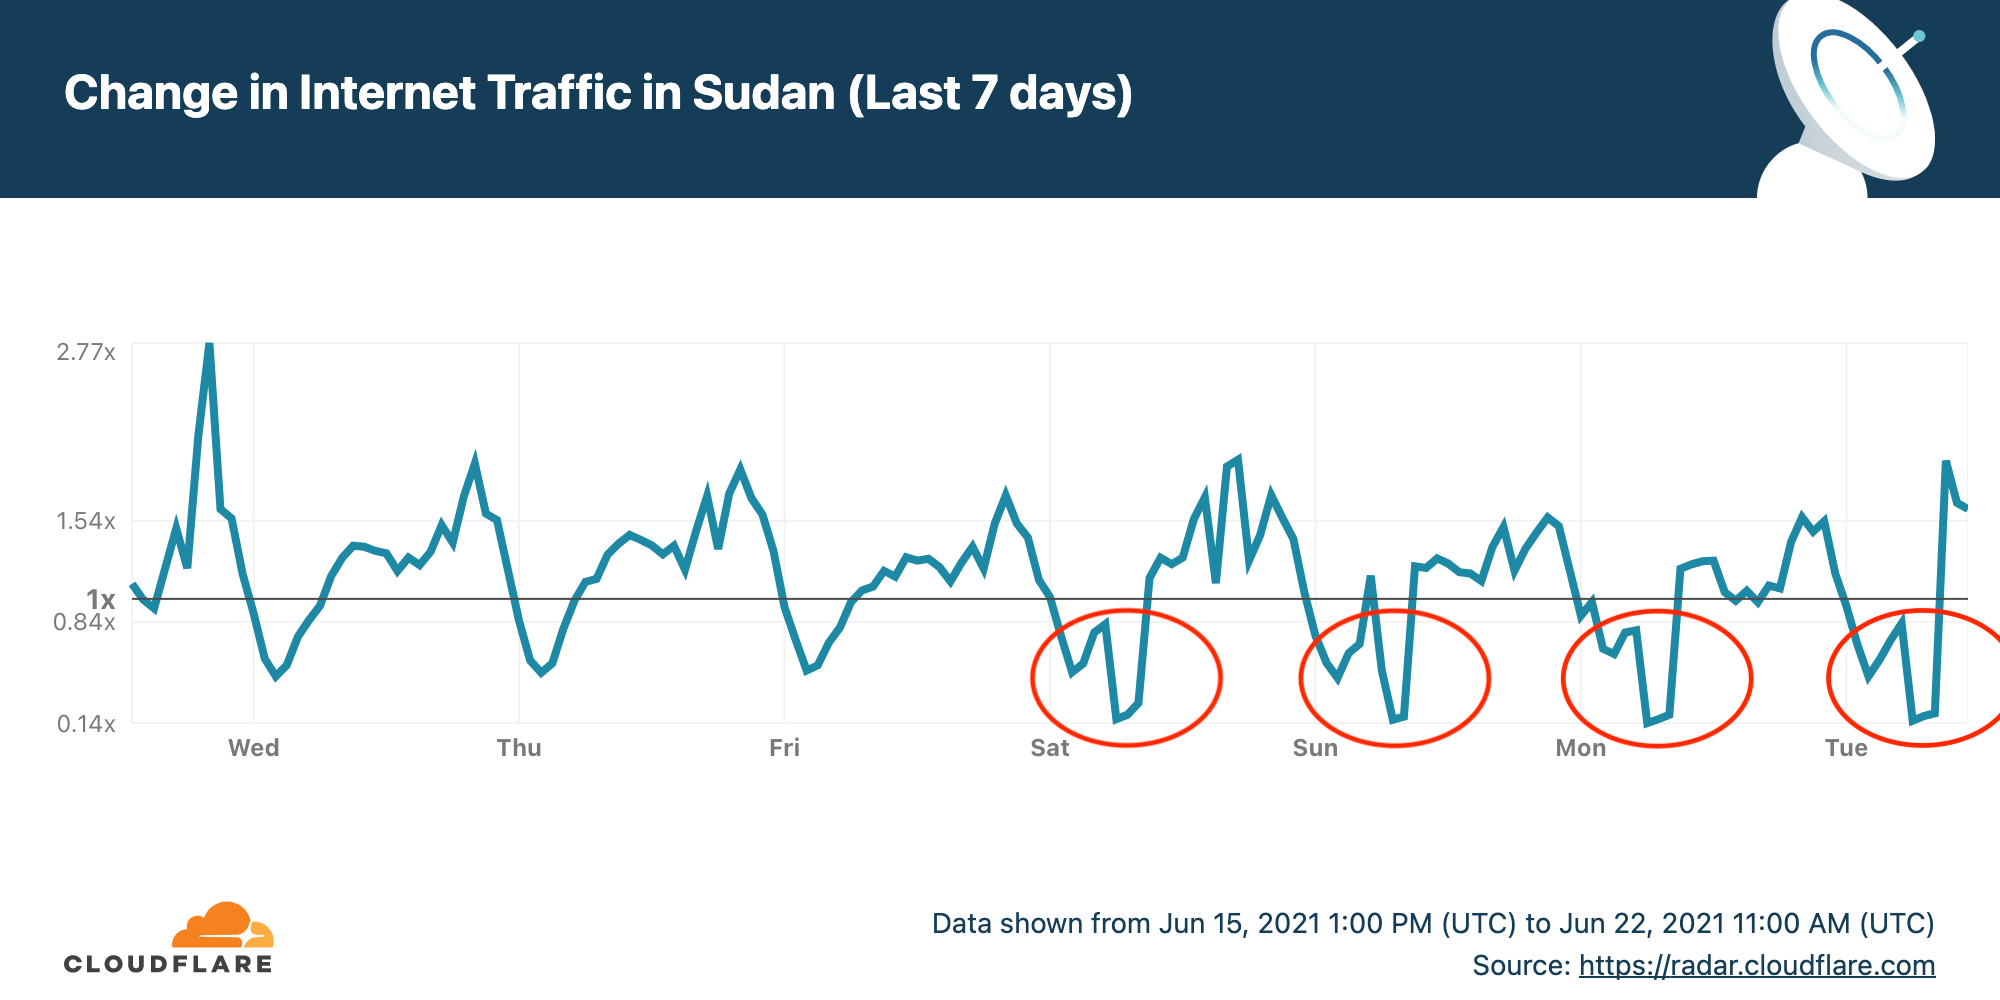
Cloudflare Radar allows anyone to track Internet traffic patterns around the world. The dedicated page for Sudan clearly shows that this Monday, when the country was waking up, the Internet traffic went down and continued that trend through the afternoon (16:00 local time, 14:00 UTC).
We dug in a little more on the HTTP traffic data. It usually starts increasing after 06:00 local time (04:00 UTC). But this Monday morning, traffic was flat, and the trend continued in the afternoon (there were no signs of the Internet coming back at 18:00 local time).
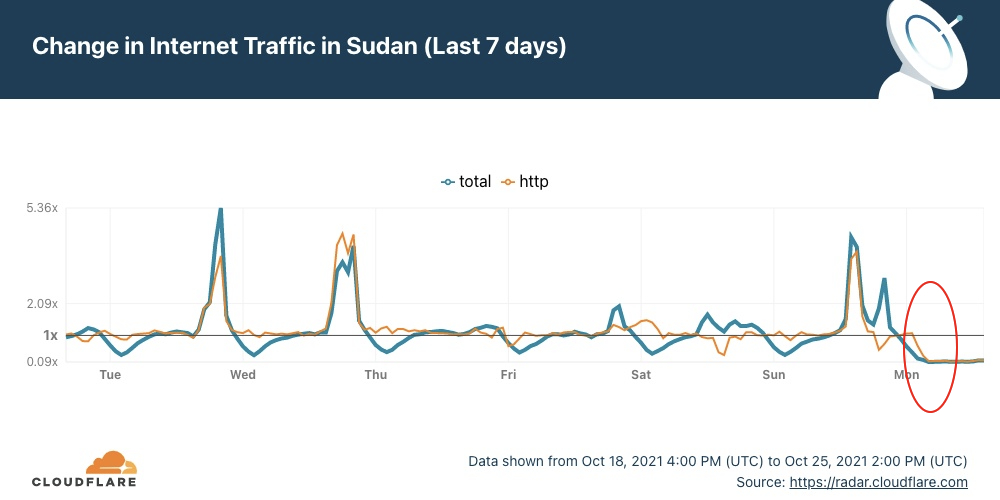
When comparing today with the last seven days’ pattern, we see that today’s drop is abrupt and unusual.
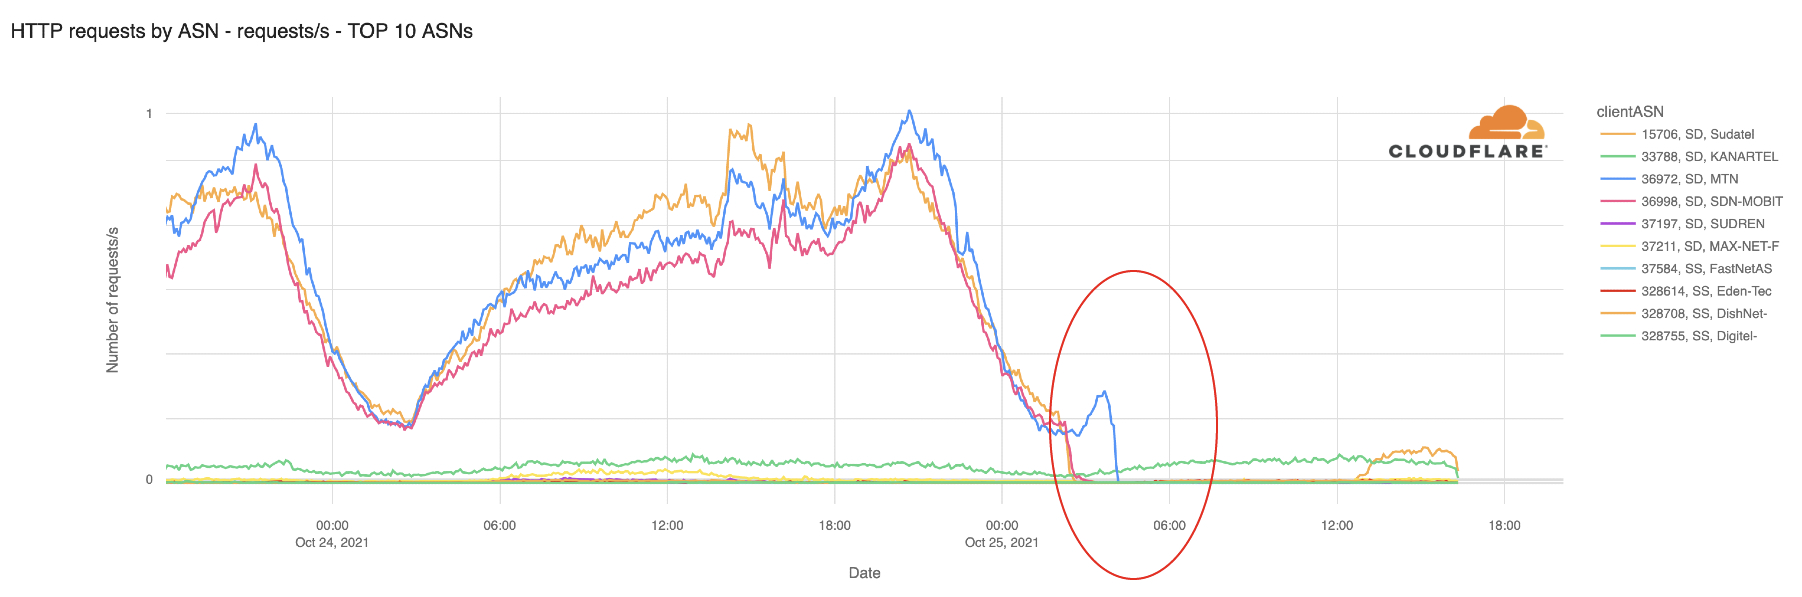
We can see the same pattern when looking at HTTP traffic by ASN (Autonomous Systems Number). The shutdown affects all the major ISPs from Sudan.
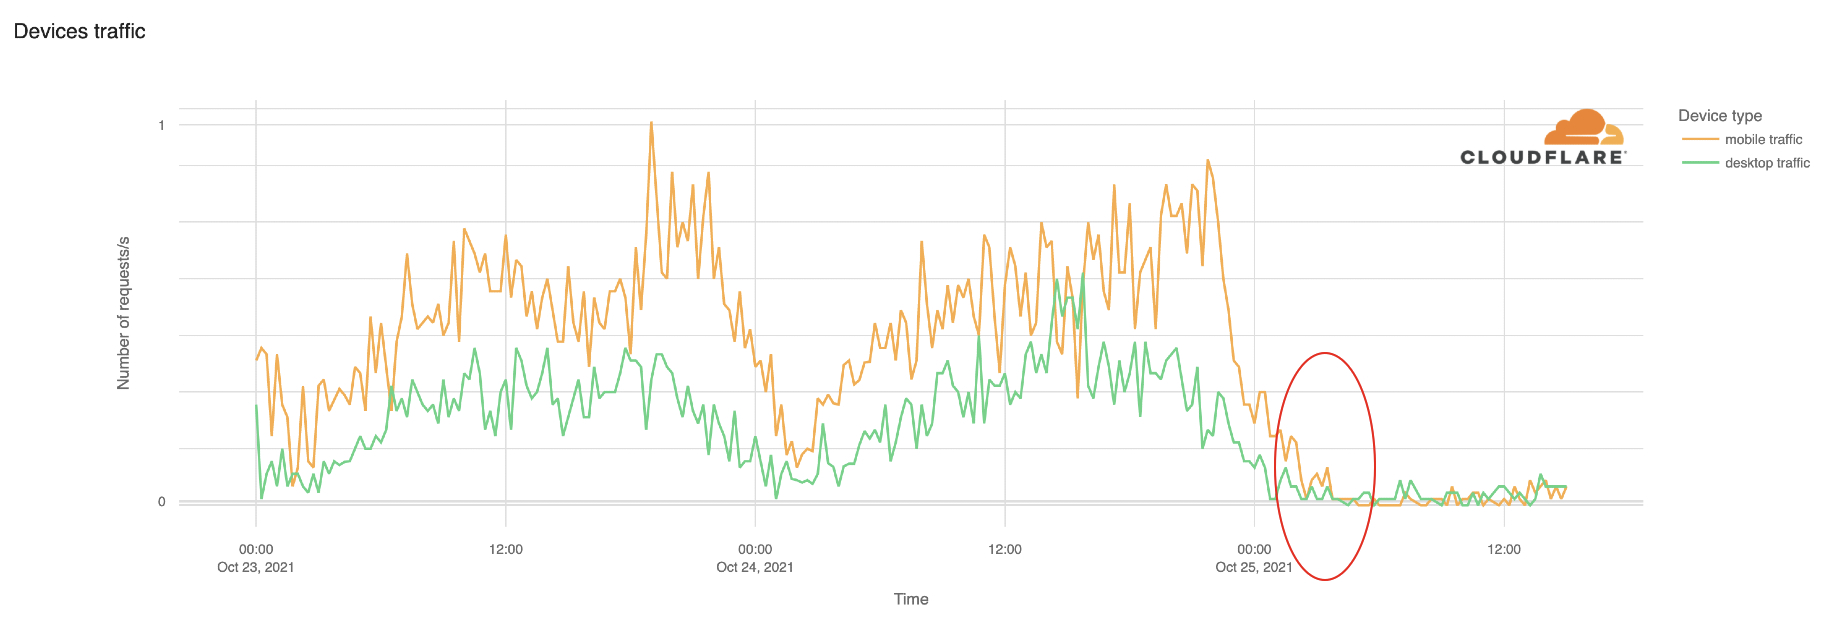
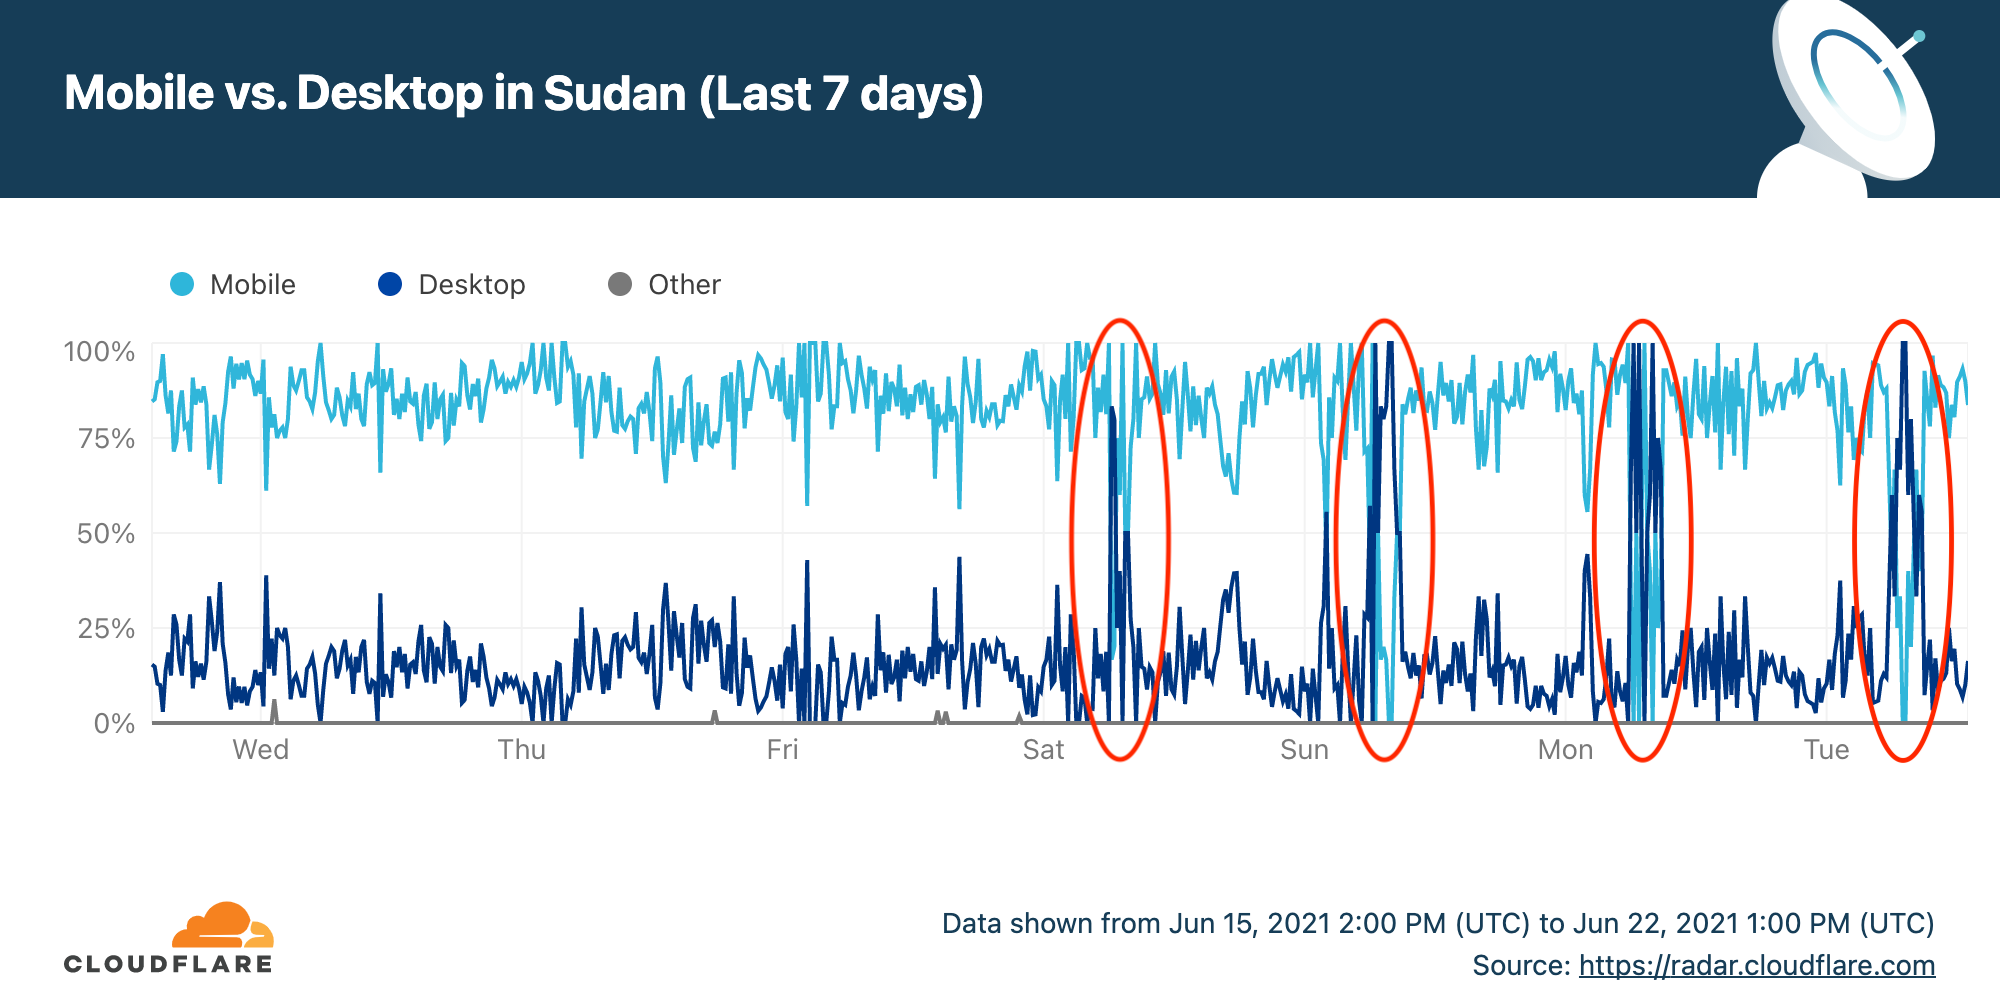
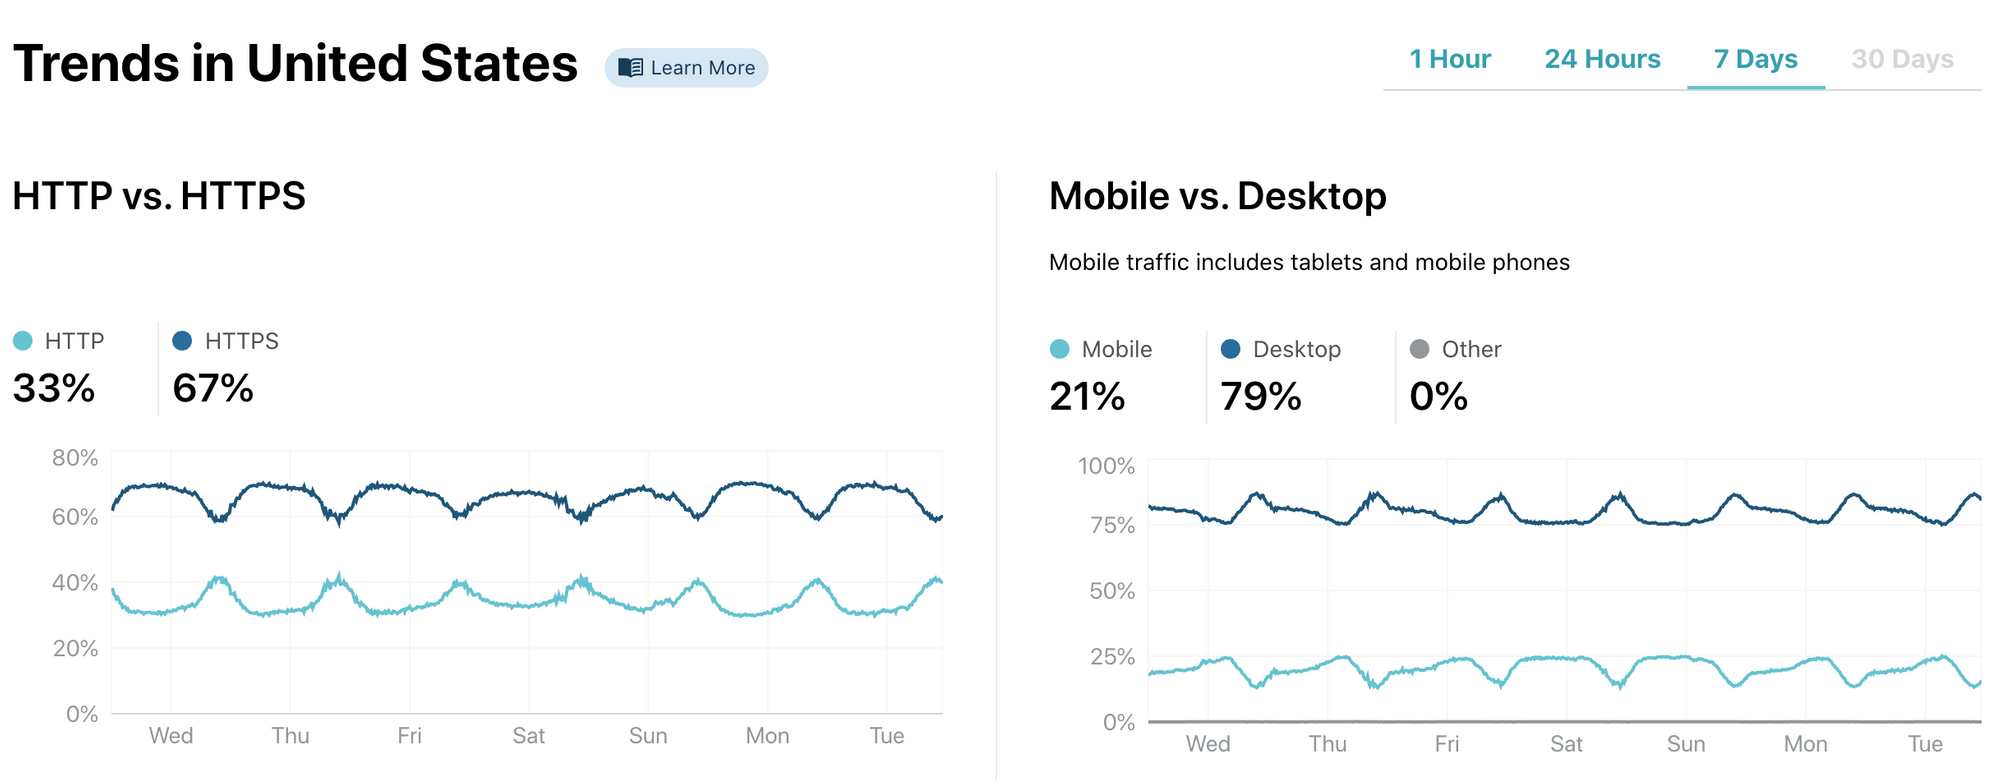
Two weeks ago, we compared mobile traffic worldwide using Cloudflare Radar, and Sudan was one of the most mobile-friendly countries on the planet, with 83% of Internet traffic coming from mobile devices. Today, both mobile and desktop traffic was disrupted.
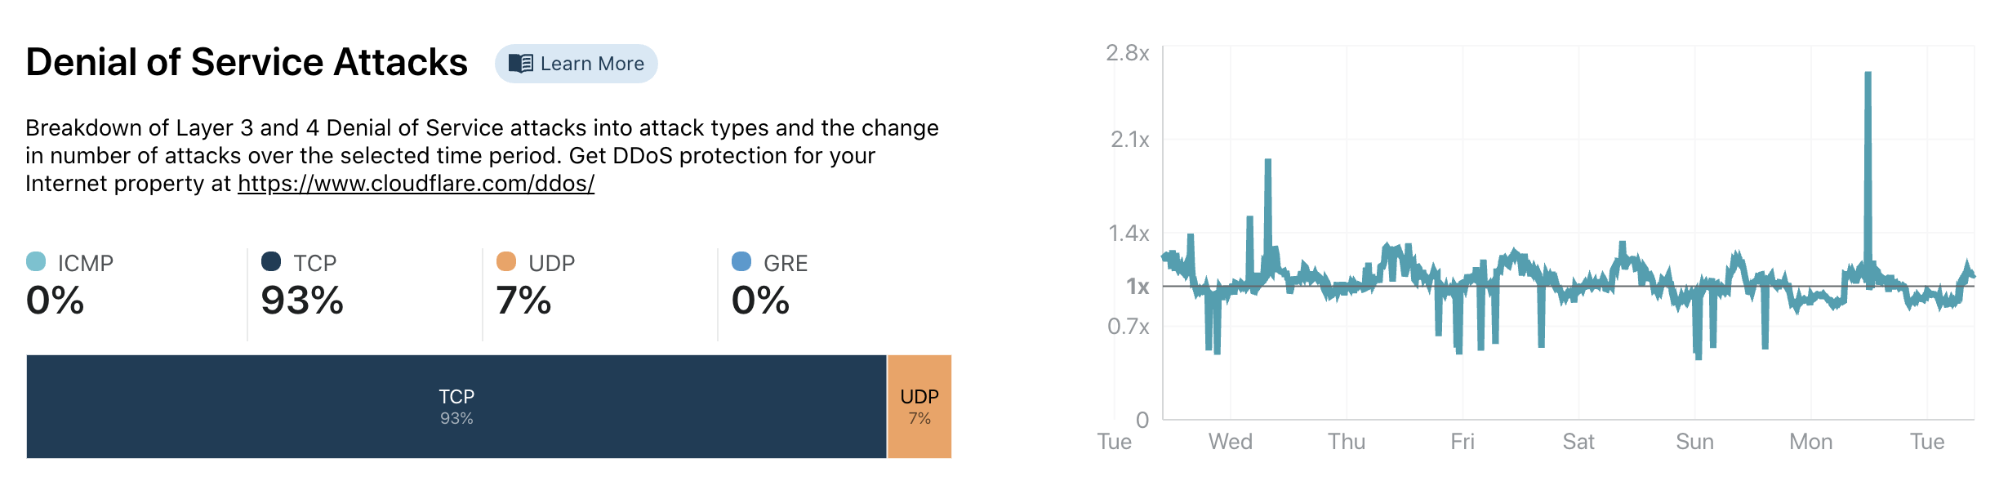
Using Cloudflare Radar, we can also see a change in Layer 3&4 DDoS attacks because of the lack of data.
You can keep an eye on Cloudflare Radar to monitor how we see the Internet traffic globally and in every country.
You’re having dinner, you look at the table next to and everyone is checking their phone, scrolling and browsing and interacting with that little (is getting bigger) piece of hardware that puts you in contact with friends, family, work and the giant public square of sorts that social media has become. That could happen in the car (hopefully with the passengers, never the driver), at home when you’re on the sofa, in bed or even when you’re commuting or just bored in line for the groceries.
Or perhaps you use your mobile phone as your only connection to the Internet. It might be your one means of communication and doing business. For many, the mobile Internet opened up access and opportunity that simply was not possible before.
Around the world the use of mobile Internet differs widely. In some countries mobile traffic dominates, in others desktop still reigns supreme.
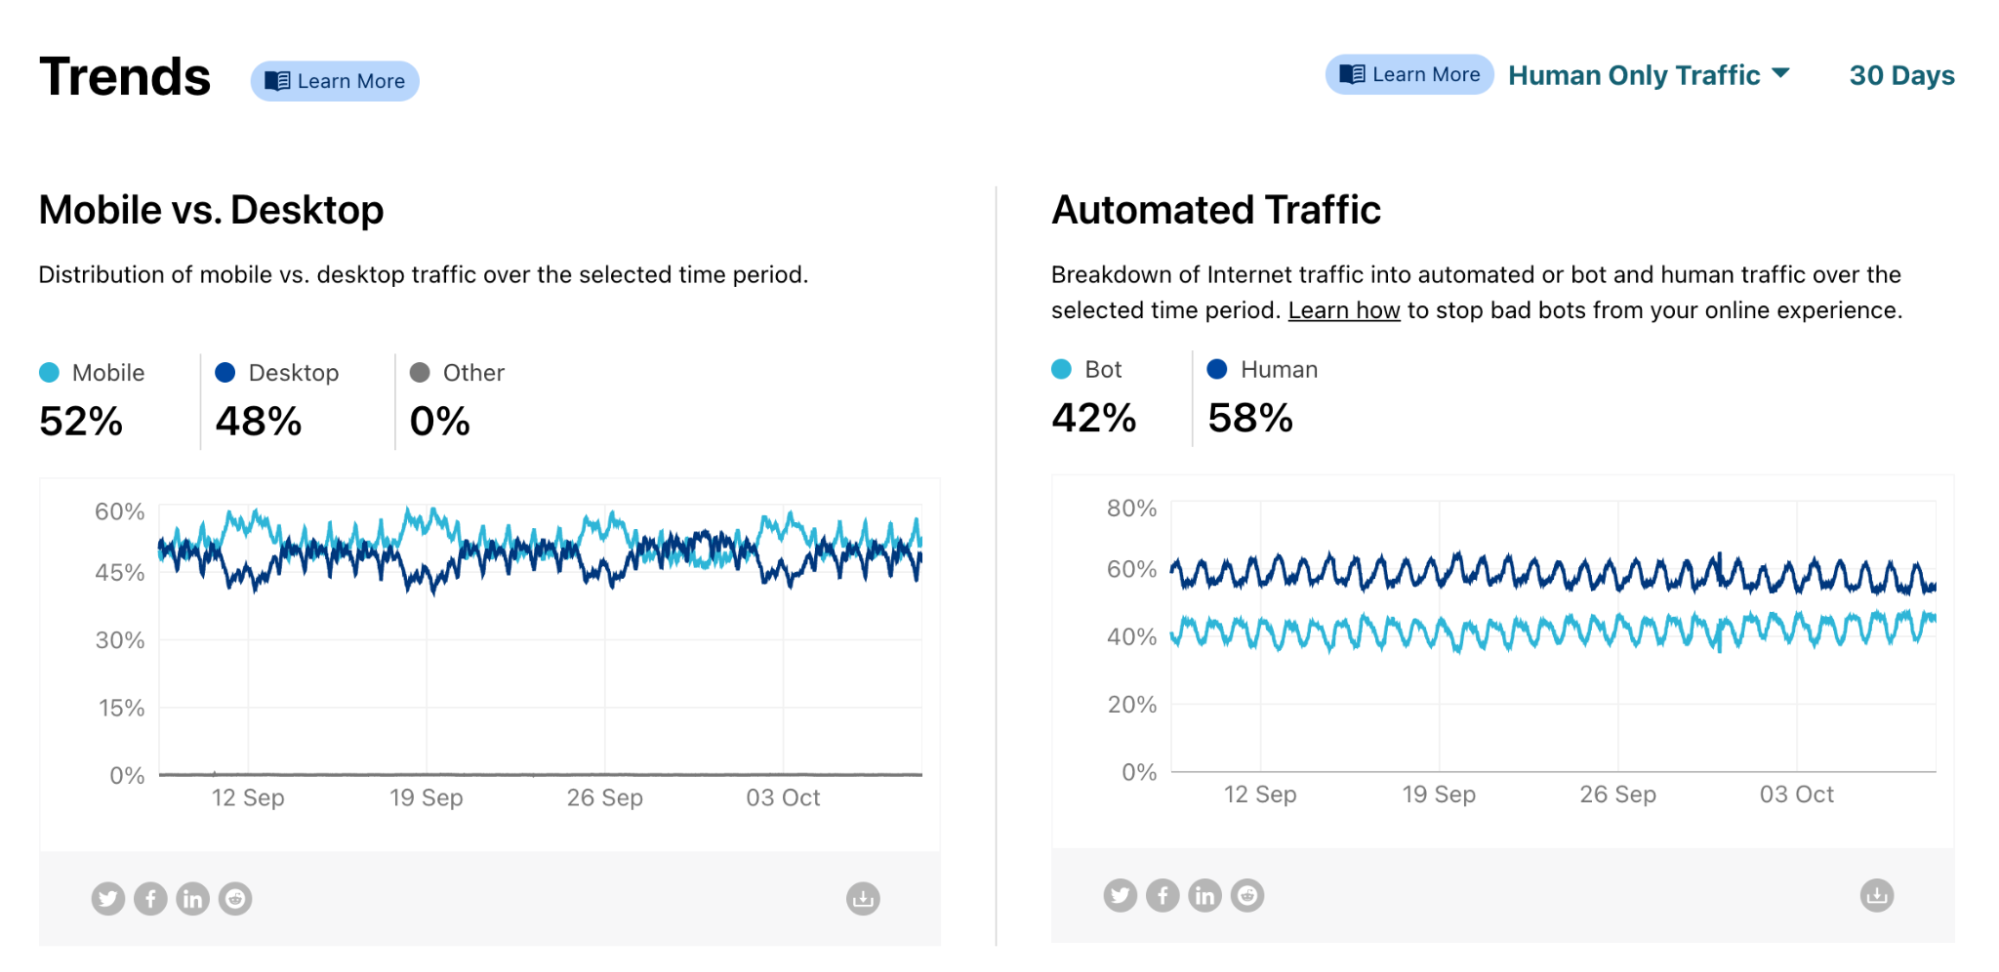
Mobile Internet traffic has changed the way we relate to the online world — work (once, for some, done on desktop/laptop computers) is just one part of it — and Cloudflare Radar can help us get a better understanding of global Internet traffic but also access regional trends, and monitor emerging security threats. So let’s dig into the mobile traffic trends, starting with a kind of contest (the data reflected here is from the 30 days before October 4).
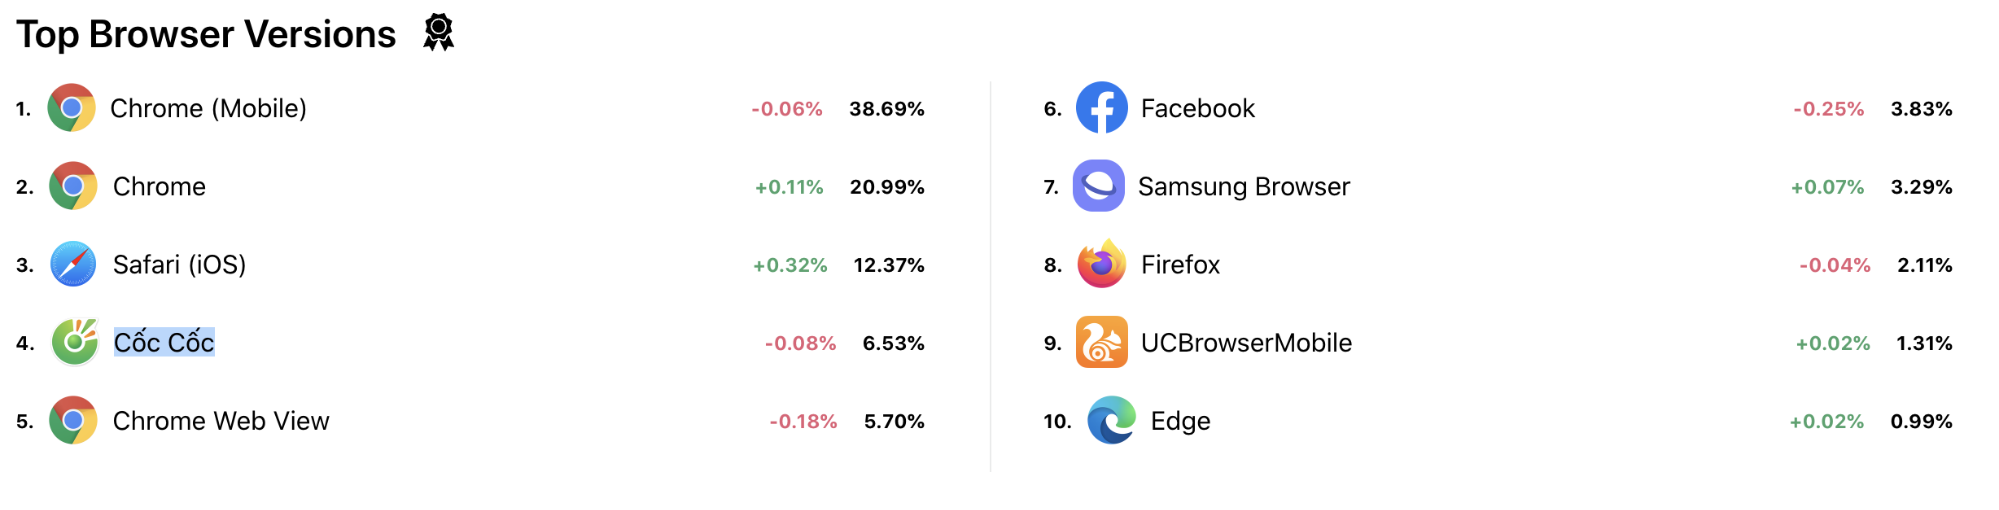
In this area of Cloudflare Radar users can check the mobile traffic trends by country or worldwide (the case shown here) in the past 7 or 30 days. Worldwide we can see that mobile wins over desktop traffic with 52%
The country that has the greatest proportion of mobile Internet traffic is…
Cloudflare Radar has information on countries across the world, so we looked for, in the past month, the country with the highest proportion of mobile Internet traffic. And the answer is… Sudan, with 83% of Internet traffic is done using mobile devices — actually it’s a tie with Yemen, which we talk about a little further below.
In many emerging economies (Sudan is one), a large percent of the population had its first contact with the Internet through a smartphone. In these countries it is normal not to have a computer and some even got their first bank account thanks to the mobile device.
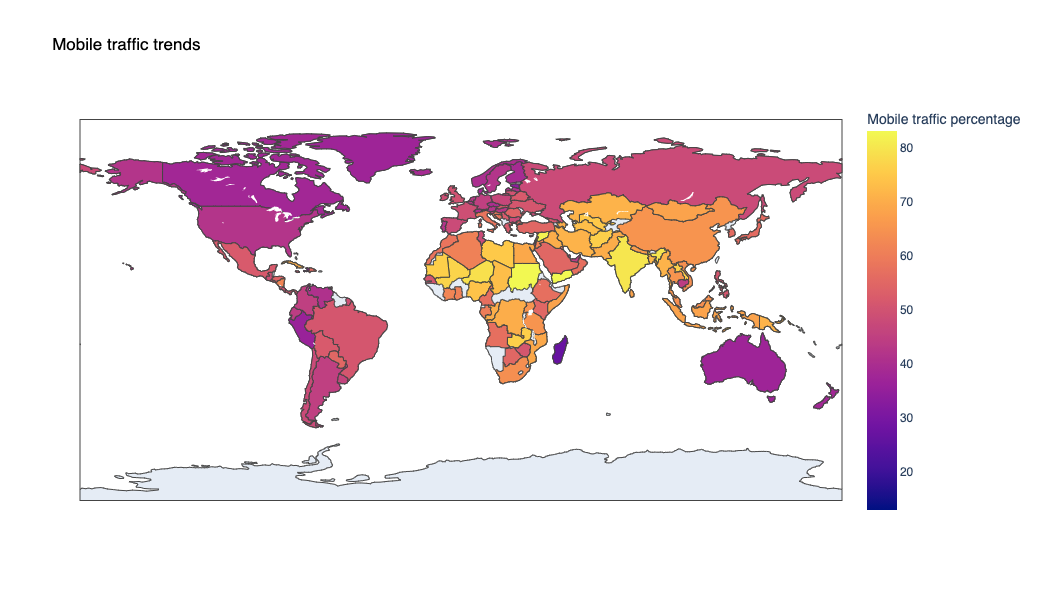
How about Sudan’s neighbours? South Sudan follows that pattern and mobile traffic represents 74% of Internet use. The same in Chad (74%), Libya (75%), Egypt (68%), Eritrea (67%) and Ethiopia (58%). It’s a clear trend throughout Africa, especially in the central and eastern part of the continent, where mobile traffic wins in every country (for the past 30 days).
World map that shows (in yellow) the areas of the planet where most of the Internet traffic is done via mobile devices. Africa, the Middle East and Asia have the highest percentage of mobile traffic.
The Vatican goes for the desktop experience (but Italy loves mobile)
On the other hand, the country we found with the least mobile traffic in the past 30 days is… Vatican City, with only 13% (since the Vatican is literally inside Rome this might be an anomaly caused by mobile devices inside the Vatican connecting to Italian networks). Small countries like Seychelles (29%), Andorra (29%), Estonia (34%) and San Marino (36%) have the same pattern — also with a low mobile traffic percentage there’s Madagascar (27%), Haiti (34%) and Greenland (37%).
We can also see that the pattern inside Vatican City differs greatly from the pattern in Italy. Italy is one of the most mobile-friendly European countries — Italians seem to prefer mobile to desktop. About 57% of Internet traffic is via mobile devices. Italy is only matched, in Europe, by its neighbour Croatia — on the other side of the Adriatic Sea — that in the past month has had 58% mobile traffic.
European countries have differing mobile preferences
While we’re talking about Italy and Croatia, let’s dig a bit more into Europe. Only six countries have more mobile than desktop (laptops included) traffic. Besides Italy and Croatia, there’s Romania (54%), Slovakia (52%) and Greece (51%) — all more to the east of Europe.
At the end of this mobile ranking we have one of the most digitally advanced countries in the world: Estonia (a truly digital society, according to Wired). The small country only has 34% of mobile traffic. Other countries in the north of Europe like Denmark (38%) and Finland (39%) follow the same trend.
Spain (47%), France (48%) and Ireland (49%) are getting close to being mobile-first countries. The UK (50%) has the same trend as its neighbours — Russia is actually in the same ‘neighbourhood’ (with 49%). On the other hand, Portugal (42%), Netherlands (43%) or Germany (44%) are still a little far.
How about the American continent?
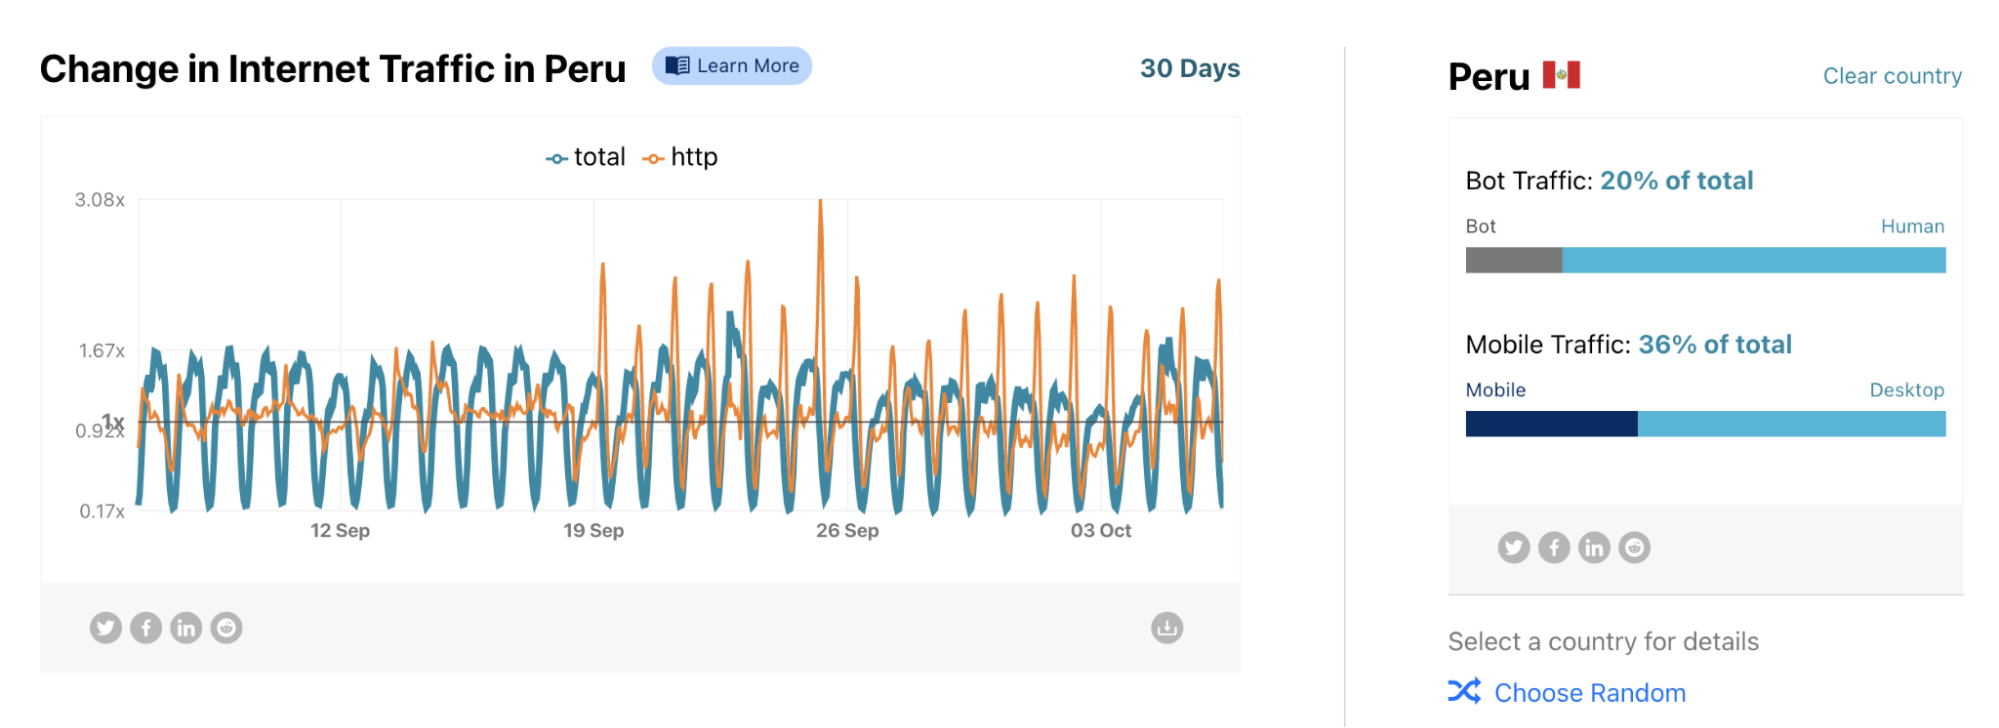
Peru seems to be the country in the American continent that has less mobile use (36%), only compared with Canada (38%). Cuba is the country with more mobile use (70%)
Peru (36%) and Canada (38%) have in common that both are the countries in the American continent with the least mobile use in the past 30 days.
Then there’s Brazil (50%), Mexico (52%) — Chile is not far, with 48% of mobile use. Cuba takes the crown, with 70%, followed by the Dominican Republic (56%), Puerto Rico (51%) and Jamaica (51%), all Caribbean countries. The exception is Haiti, the least mobile of the continent, with 34% of mobile use.
Let’s go to the Middle East: the champion of mobile traffic
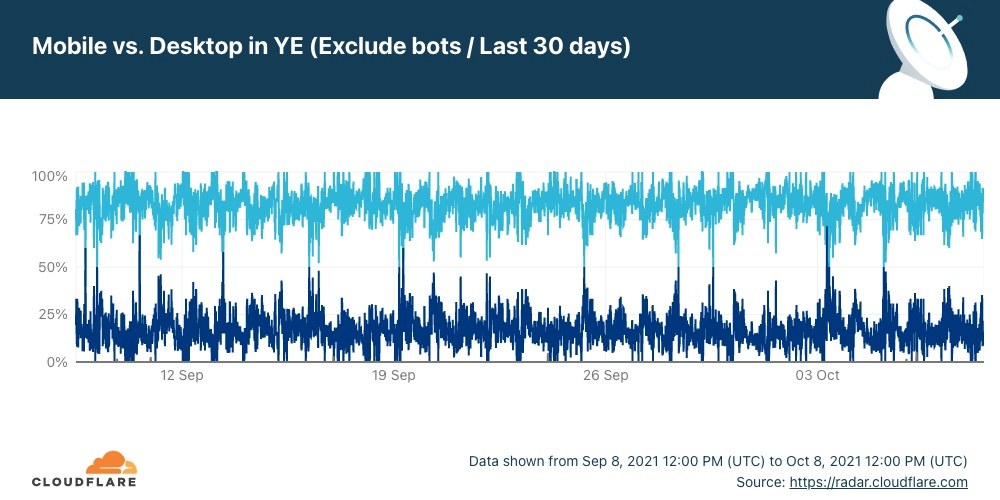
Most Internet traffic in Yemen is done with mobile devices like this chart from Radar of the previous 30 days shows
In this part of our planet there are no doubts whatsoever: mobile traffic rules completely. On the top of the list is Yemen, with the same 83% of mobile traffic as Sudan (that we talked about before). But Syria is actually a close second, with 82%.
Iran (71%), Iraq (70%), Pakistan (70%) and Egypt (69%) show the same trend. The exception, here, is the United Arab Emirates, with 44% of mobile traffic, and also Israel (45%). Nearby, Saudi Arabia (the country with the highest GDP in the region) is at 55%.
A (mobile) giant called India
Of the top 10 most populated countries, the clear winner of our mobile ranking is, without any doubt, India, with 80% mobile use. The country of 1.3 billion people surpasses the biggest country on the planet, China (1.4 billion live there), with 65% mobile.
Also in Asia, the fourth-biggest country in the world (after the US), Indonesia, has 68% of traffic by mobile devices. The same trend of mobile-first is followed by Thailand (65%), Vietnam (64%), Malaysia (64%), South Korea (56%), Japan (56%) and the Philippines (51%). Singapore is in the middle and down under, Australia is desktop first (37% mobile traffic), just like its neighbour New Zealand (38%).
Just as a curiosity, Vanuatu, the South Pacific Ocean nation (population of 307,150), ranked some years as the happiest nation on the planet (by the Happy Planet Index) has 52% of mobile traffic. The current number one in that same index, Costa Rica, is at 50%.
Conclusion
Mobile devices are here to stay and have become already a bridge to help bring more humans to the vast opportunities that the Internet brings. Of the top 15 countries with more mobile Internet traffic, there’s just one that is in the top 15 in terms of GDP, India.
As we already showed, there is a world of trends and even human habits (differing from country to country) to discover on our Cloudflare Radar platform. It’s all a matter of asking a question that could be reflected in our data and searching for the answers.
The Internet is a valuable source of knowledge but also a deeply interesting, interconnected, and complex place. And with Cloudflare Radar (our Internet trends and insights free tool for everyone — including journalists, like I was for several years) you get a sense of different trends in the collection of networks that form the Internet.
We saw that over the past week or so in Spain. Radar shows a clear increase in interest in Spanish media outlets (in comparison with the preceding days and Sundays) after the news of the eruption in La Palma (one of the Spanish Canary Islands) broke on Sunday, September 19.
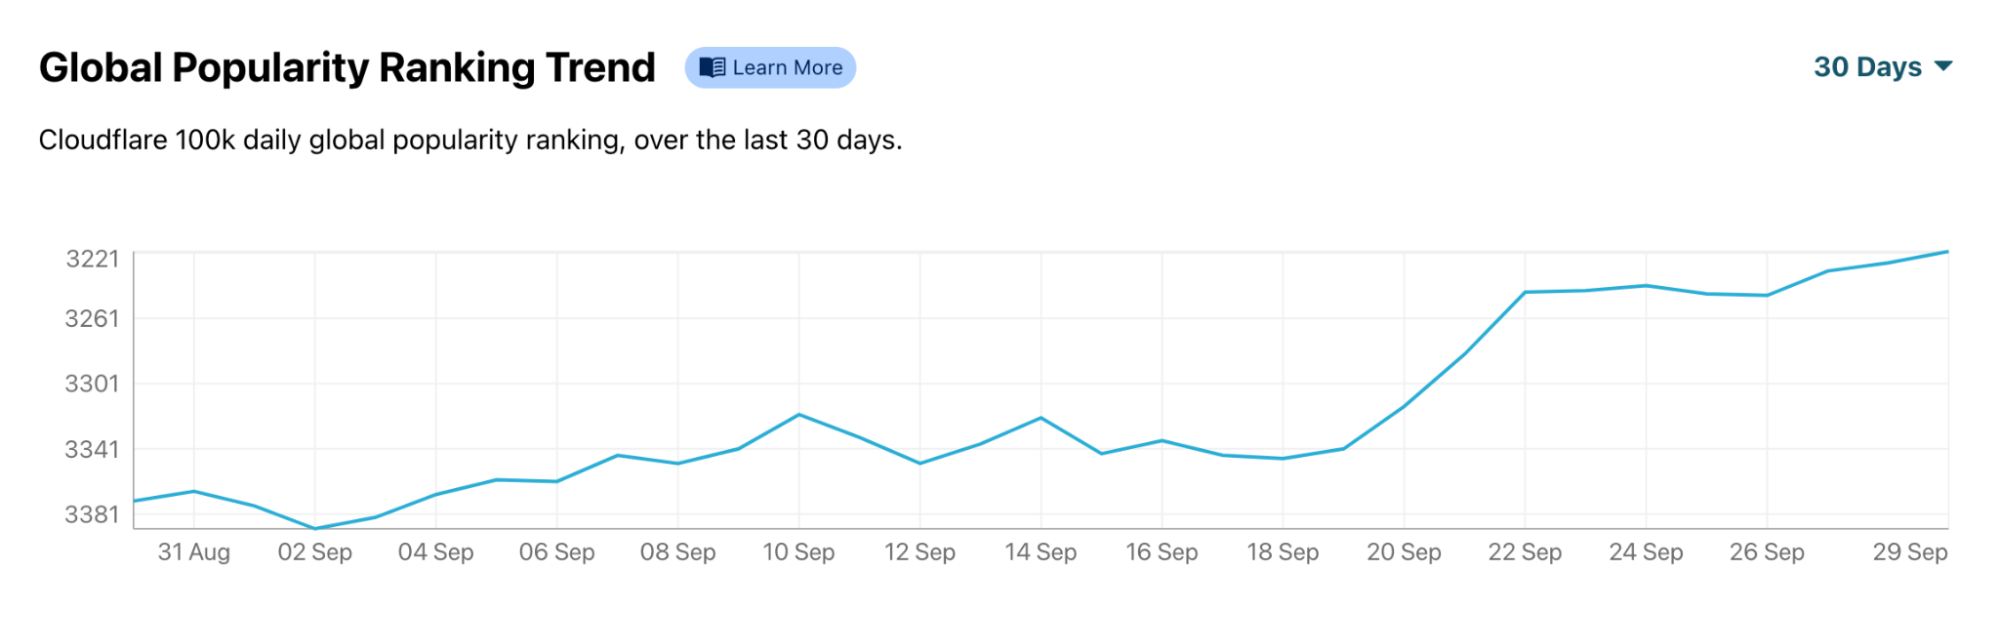
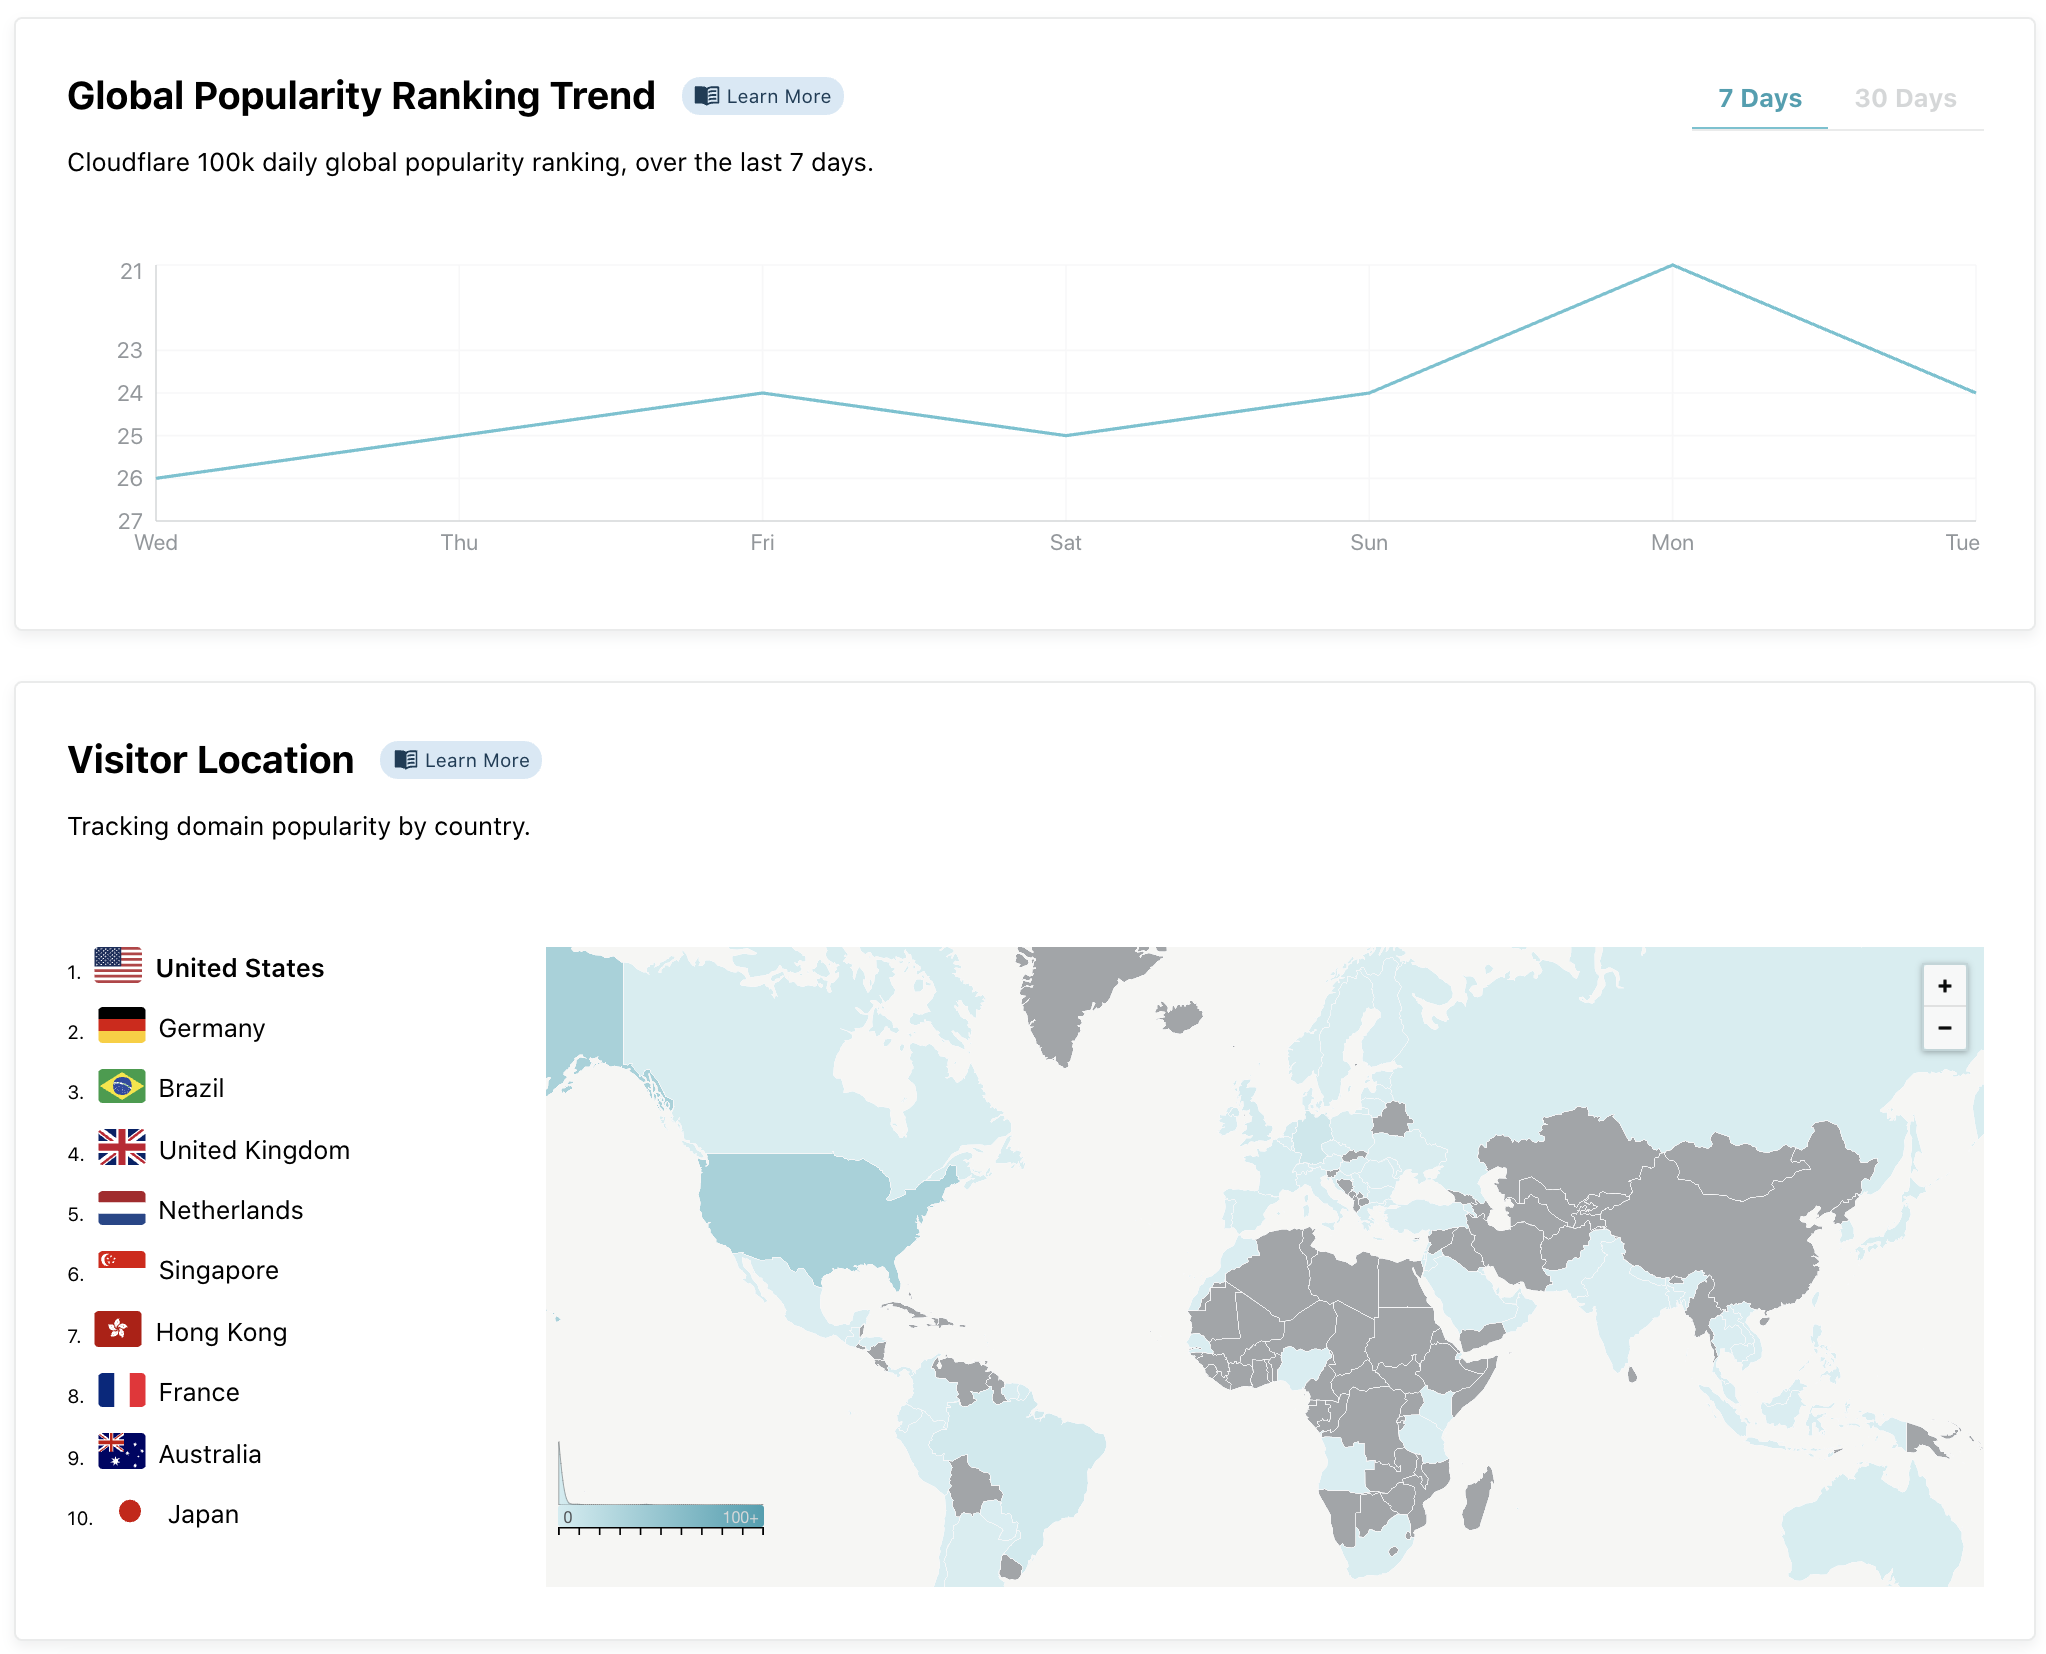
That is particularly clear looking at El País, one of the most well known media outlets in the country. Using our Global Popularity Ranking Trend available on Radar, we can see that ElPais.com jumped several positions in our ranking of most popular domains after September 19. That change is clear in the last seven days, but especially in the last 30, putting El País near the top 3,000 most popular domains in the world.
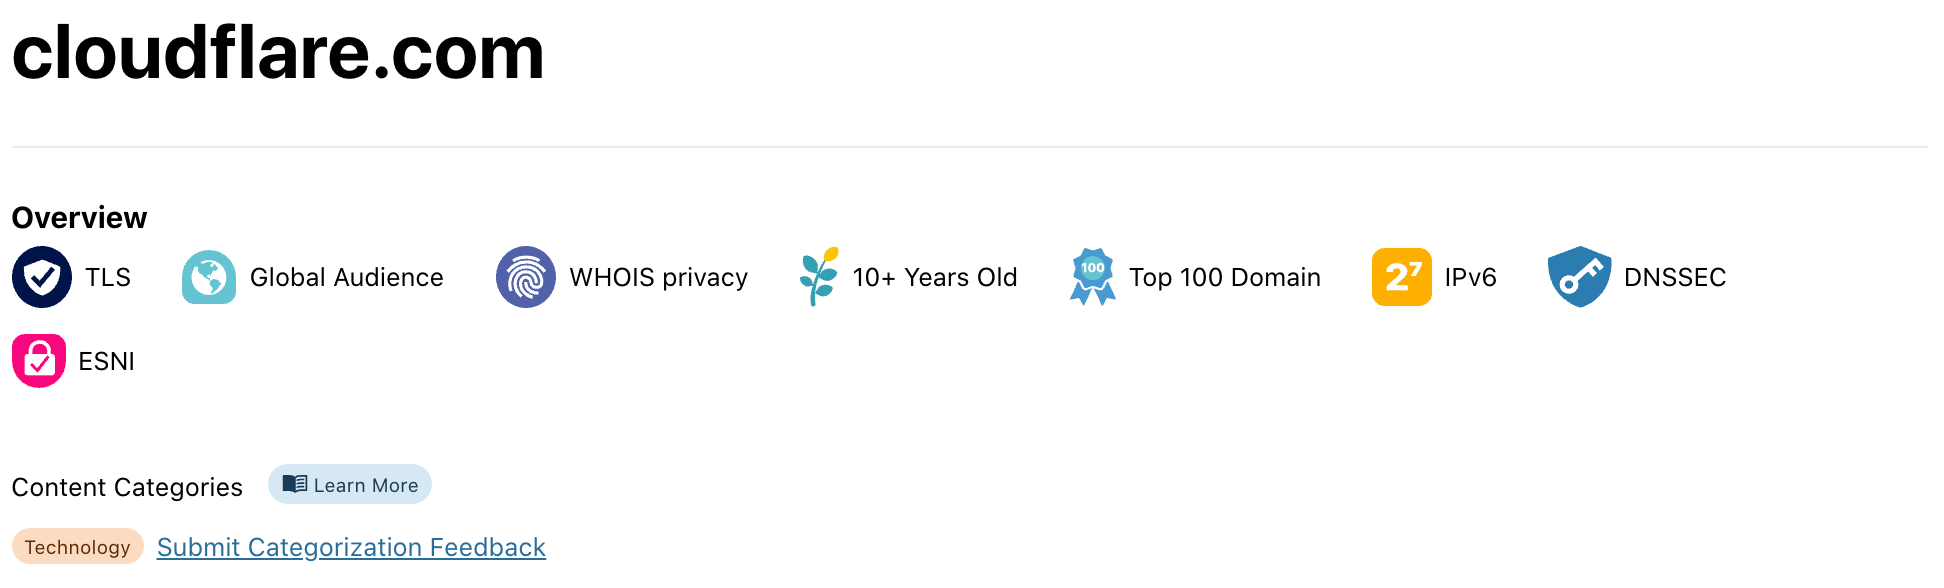
Elpais.com
The increase in El País’s popularity is clearly visible after Sunday, September 19, 2021
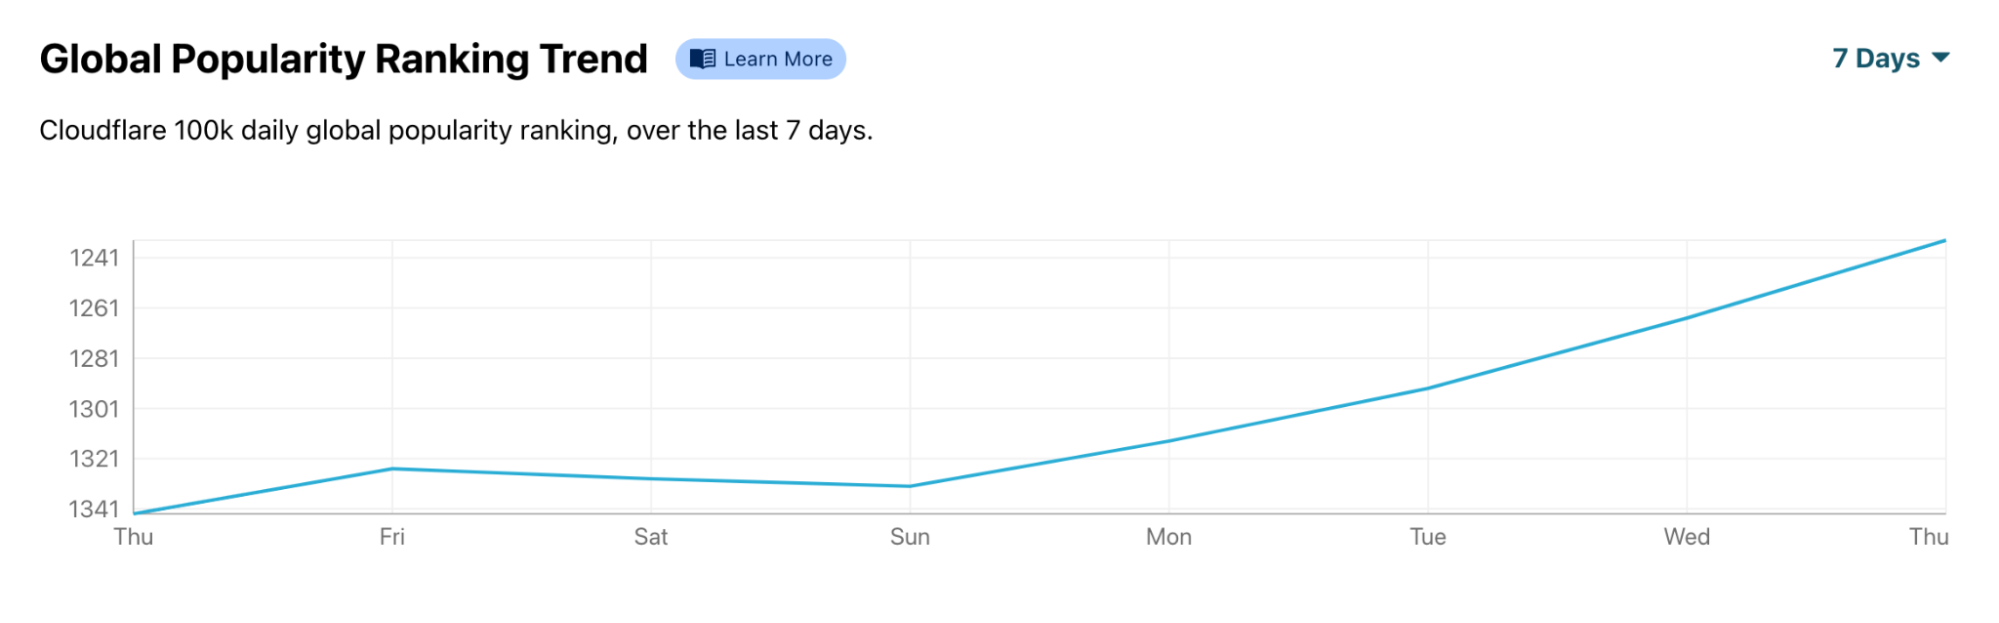
A similar trend is seen on the El Mundo website, which had its highest days of global popularity on Wednesday and Thursday of last week. And Spanish public radio and television, RTVE, after a week of growing popularity, reached the top 1,200 of our Global Popularity Ranking last Friday, climbing more than 100 positions after the news of the volcano’s eruption broke.
Rtve.es
Rtve.es also had a popularity increase that continued to grow throughout the past week.
There is a world of trends and even human habits (different from country to country) to discover on our Cloudflare Radar platform. Start here.
Over the past few years, we’ve seen an increasing use of Internet shutdowns and cyberattacks that restrict the availability of information in communities around the world. In 2020, Access Now’s #KeepItOn coalition documented at least 155 Internet shutdowns in 29 countries. During the same period, Cloudflare witnessed a five-fold increase in cyberattacks against the human rights, journalism, and non-profit websites that benefit from the protection of Project Galileo.
These disruptive measures, which put up barriers to those looking to use the Internet to express themselves, earn a livelihood, gather and disseminate information, and participate in public life, affect the lives of millions of people around the world.
As described by the UN Human Rights Council (UNHRC), the Internet is not only a key means by which individuals exercise their rights to freedom of opinion and expression, it “facilitates the realization of a range of other human rights” including “economic, social and cultural rights, such as the right to education and the right to take part in cultural life and to enjoy the benefits of scientific progress and its applications, as well as civil and political rights, such as the rights to freedom of association and assembly.” The effect of Internet disruptions are particularly profound during elections, as they disrupt the dissemination and sharing of information about electoral contests and undermine the integrity of the democratic process.
At Cloudflare, we’ve spent time talking to human rights defenders who push back on governments that shut down the Internet to stifle dissent, and on those who help encourage fair, democratic elections around the world. Although we’ve long protected those defenders from cyberattacks with programs like Project Galileo, we thought we could do more. That is why today, we are announcing new programs to help our civil society partners track and document Internet shutdowns and protect democratic elections around the world from cyberattacks.
Radar Alerts
Internet shutdowns intended to prevent or disrupt access to or dissemination of information online are widely condemned, and have been described as “measures that can never be justified under human rights law.” Nonetheless, the UN Special Rapporteur on the rights to freedom of peaceful assembly and of association recently reported that Internet shutdowns have increased in length, scale, and sophistication, and have become increasingly challenging to detect. From January 2019 through May 2021, the #KeepItOn coalition documented at least 79 incidents of protest-related shutdowns, including in the context of elections.
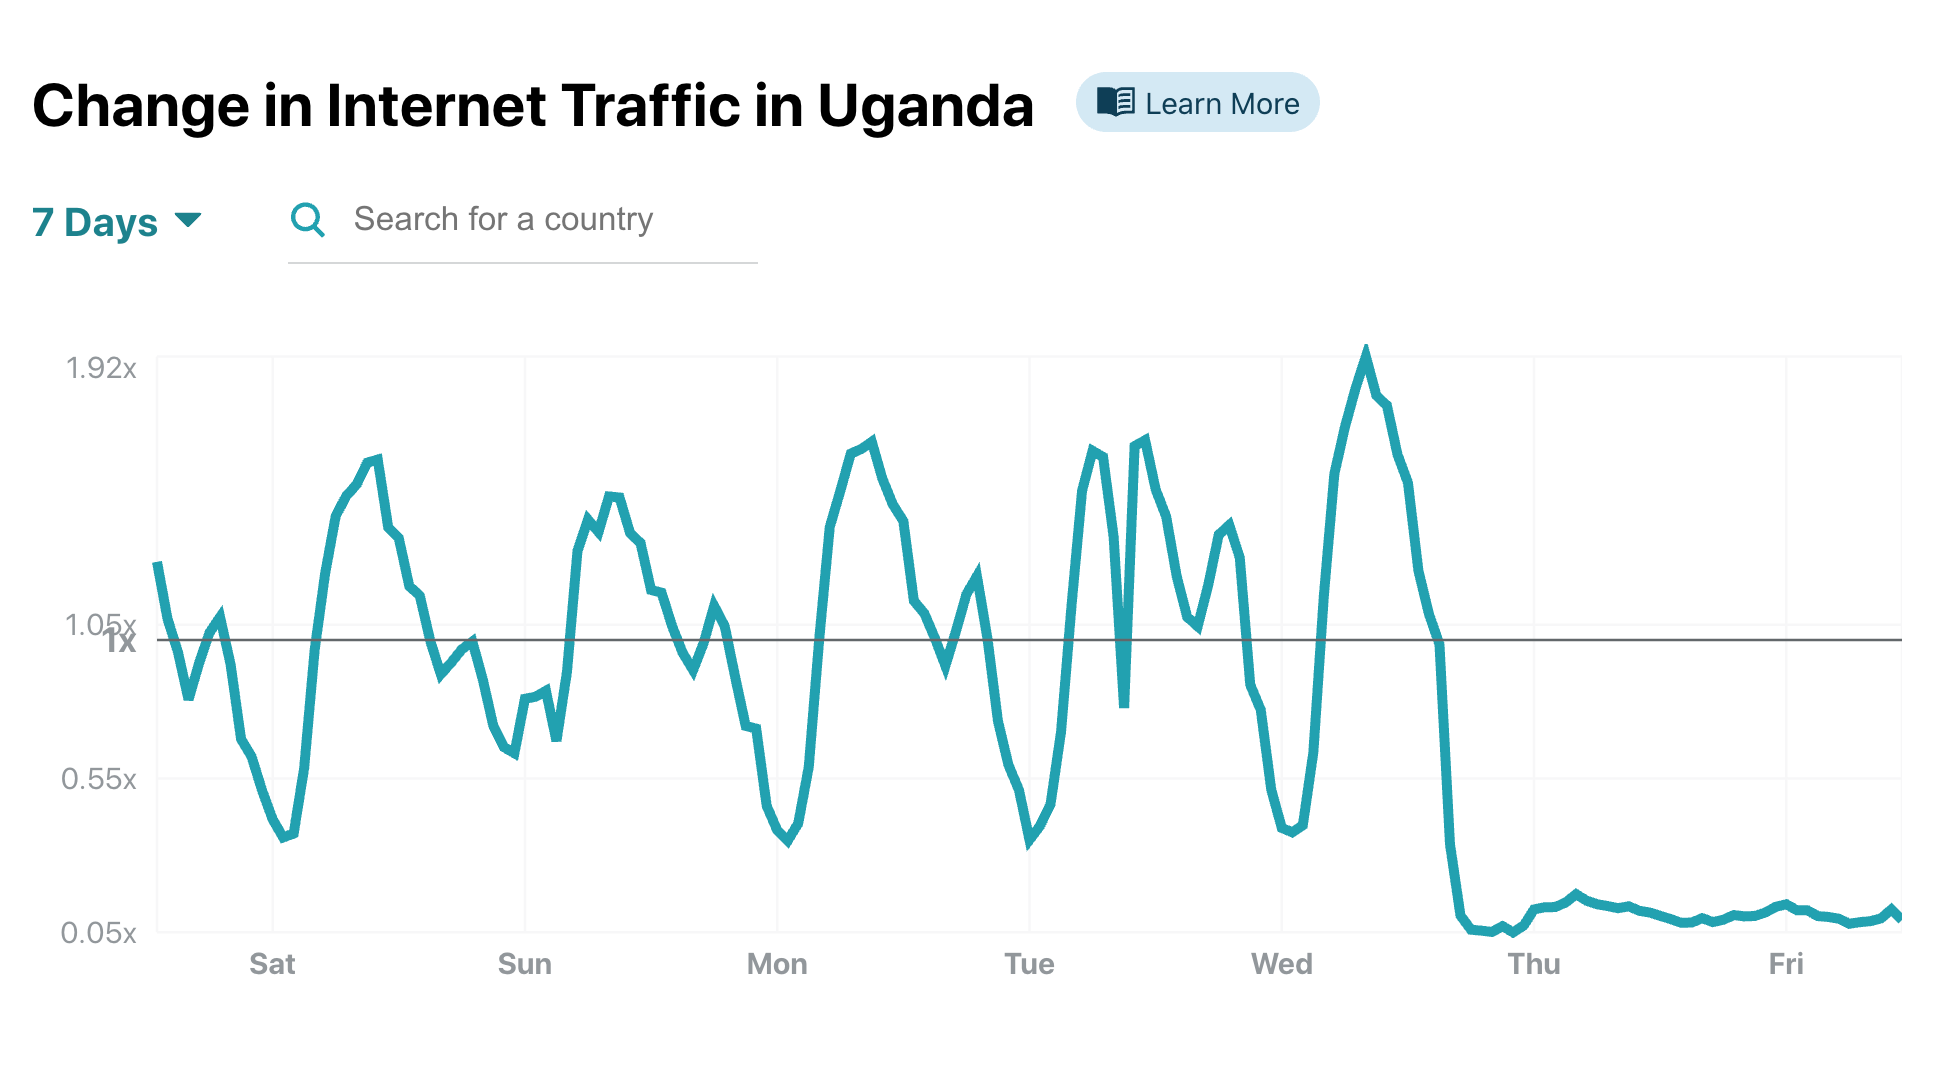
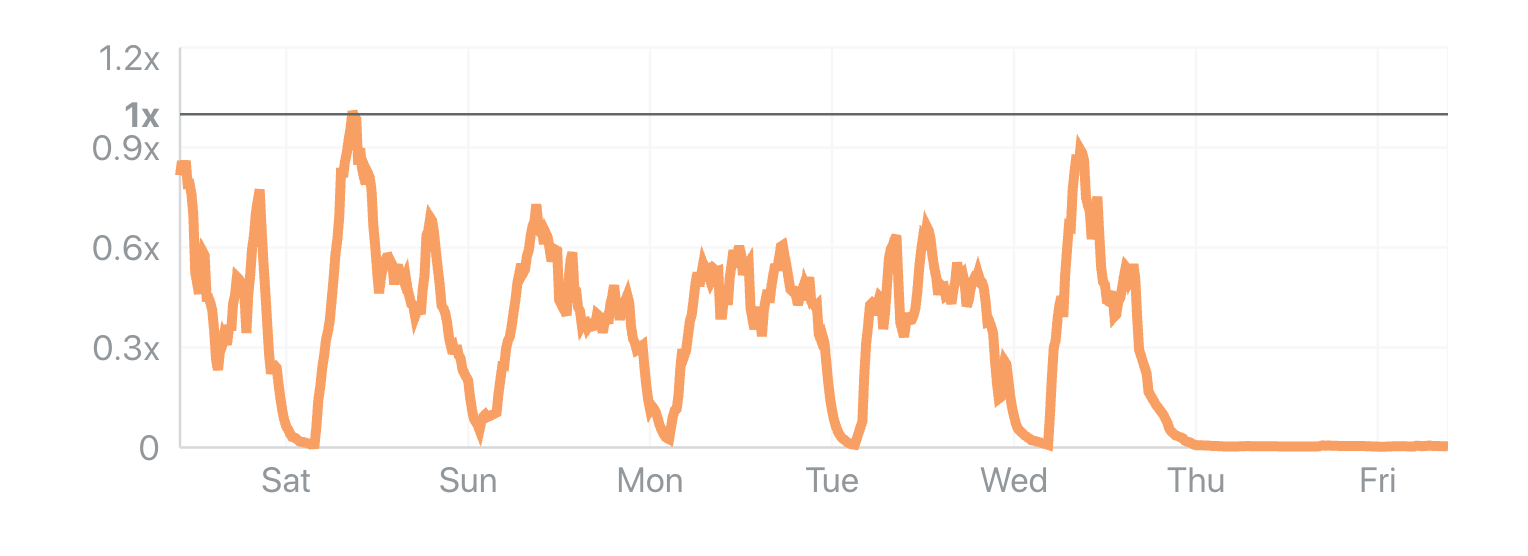
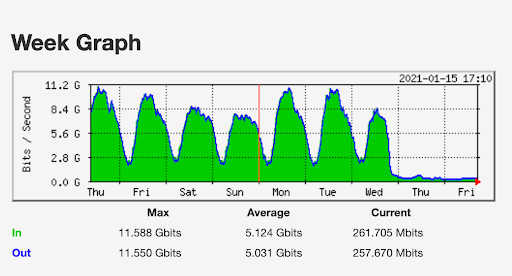
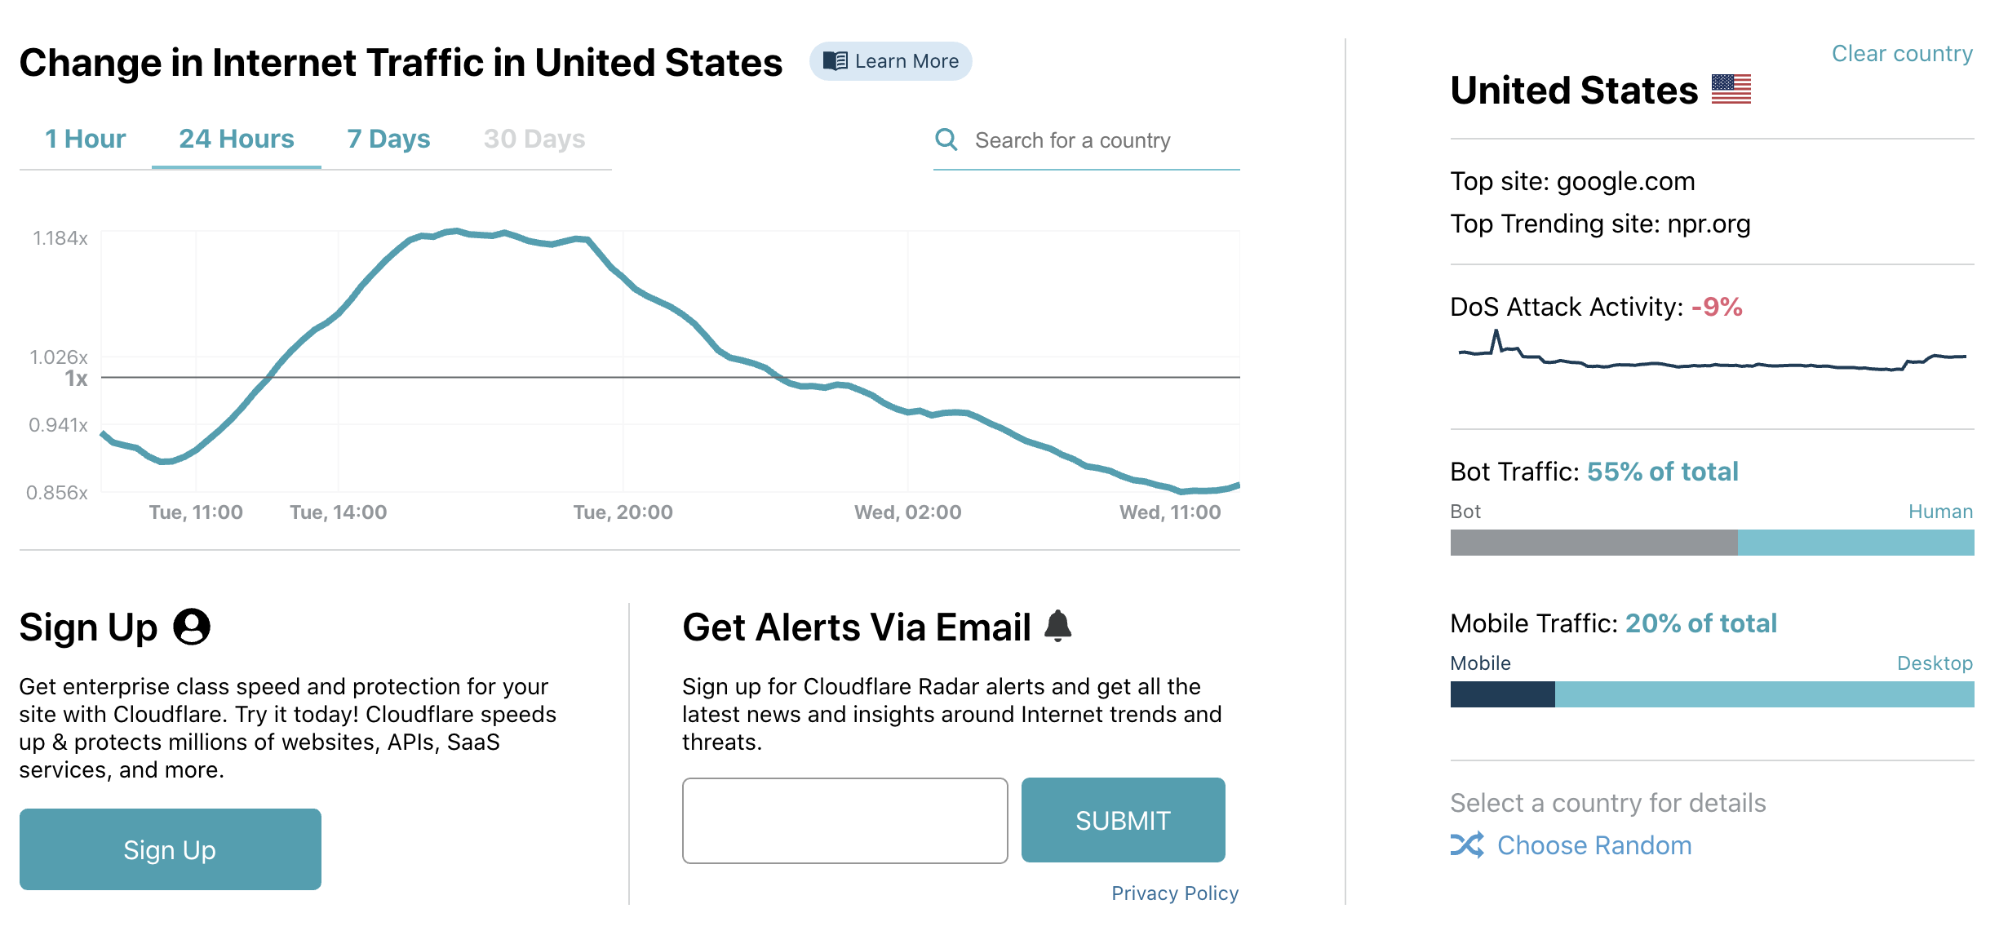
Cloudflare runs one of the world’s largest networks, with data centers in more than 100 countries worldwide and one billion unique IP addresses connecting to Cloudflare’s network. That global network gives us exceptional visibility into Internet traffic patterns, including the variations in traffic that signal network anomalies. To help provide insight to these Internet trends, Cloudflare launched Radar in 2020, a platform that helps anyone see how the Internet is being used around the globe. In Radar one can visually identify significant drops in traffic, typically associated with an Internet shutdown, but these trend graphs are most helpful when one is already looking for something specific.
Radar chart for Internet Traffic in Uganda, showing a significant change for January 13-15
Internally Cloudflare has had an alert system for potential Internet disruptions, that we use as an early warning to shifts in network patterns and incidents. This internal system allows us to see these disruptions in real-time, and after many conversations with civil society groups that track and report these shutdowns, such as The Carter Center, the International Foundation for Electoral Systems, Internet Society, Internews, The National Democratic Institute and Access Now, it was clear that they would benefit from such a system, fine-tuned to report Internet traffic drops quickly and reliably. We then built an additional validation layer and a notification system that sends notifications through various channels, including e-mail and social media.
“In the fight to end internet shutdowns, our community needs accurate reports on internet disruptions at a global scale. When leading companies like Cloudflare share their data and insights, we can make more timely interventions. Together with civil society, Cloudflare will help #KeepItOn.” — Peter Micek, General Counsel, Access Now
“Internet shutdowns undermine election integrity by restricting the right of access to information and freedom of expression. When shutdowns are enacted, reports of their occurrence are often anecdotal, piecemeal, and difficult to substantiate. Radar Alerts provide The Carter Center with real-time information about the occurrence, breadth, and impact of shutdowns on an election process. This information enables The Carter Center to issue evidence-backed statements to substantiate harms to election integrity and demand the restoration of fundamental human rights.” — Michael Baldassaro, Senior Advisor, Digital Threats to Democracy at The Carter Center.
“Internet censorship, throttling and shutdowns are threats to an open Internet and to the ability of people to access and produce trustworthy information. Internews is excited to see Cloudflare share its data to help raise the visibility of shutdowns around the world.” — Jon Camfield, Director of Global Technological Strategy, Internews
Now, as we detect these drops in traffic, we may still not have the expertise, backstory or sense of what is happening on the ground when this occurs — at least not in as much detail as our partners. We are excited to be working with these organizations to provide alerts on when Cloudflare has detected significant drops in traffic with the hope that the information is used to document, track and hold institutions accountable for these human rights violations.
Recent weeks have witnessed massive ransomware and ransom DDoS (Distributed Denial of Service) attack campaigns that interrupted aspects of critical infrastructure around the world, including one of the largest petroleum pipeline system operators, and one of the world’s biggest meat processing companies. Earlier this quarter, more than 200 organizations across Belgium, including the government and parliament websites and other services, were also DDoS’d.
And when most of the United States were celebrating Independence Day on July 4, hundreds of US companies were hit by a ransomware attack demanding 70 million USD in Bitcoin. Attackers known to be affiliated with REvil, a Russian ransomware group, exploited multiple previously unknown vulnerabilities in IT management software. The targets included schools, small public-sector bodies, travel and leisure organizations, and credit unions, to name a few. While the threat of ransomware and ransom DDoS is not new (read our posts on ransomware and ransom DDoS from 2021 Q1), the latest attacks on Internet properties ranging from wineries, professional sports teams, ferry services and hospitals has brought them from just being background noise to front page headlines affecting our day-to-day lives. In fact, recent attacks have propelled ransomware and DDoS to the top of US President Biden’s national security agenda.
The DDoS attack trends observed over Cloudflare’s network in 2021 Q2 paint a picture that reflects the overall global cyber threat landscape. Here are some highlights.
Over 11% of our surveyed customers who were targeted by a DDoS attack reported receiving a threat or ransom letter threatening in advance, in the first six months of this year. Emergency onboarding of customers under an active DDoS attack increased by 41.8% in 2021 H1 compared to 2020 H2.
HTTP DDoS attacks targeting government administration/public sector websites increased by 491%, making it the second most targeted industry after Consumer Services whose DDoS activity increased by 684% QoQ.
China remains the country with the most DDoS activity originating from within their borders — 7 out of every 1,000 HTTP requests originating from China were part of an HTTP DDoS attack targeting websites, and more than 3 out of every 100 bytes that were ingested in our data centers in China were part of a network-layer DDoS attack.
Emerging threats included amplification DDoS attacks that abused the Quote of the Day (QOTD) protocol which increased by 123% QoQ. Additionally, as the adoption of QUIC protocol continues to increase, so do attacks over QUIC — registering a whopping 109% QoQ surge in 2021 Q2. The number of network-layer DDoS attacks in the range of 10-100 Gbps increased by 21.4% QoQ. One customer that was attacked is Hypixel, an American gaming company. Hypixel remained online with no downtime and no performance penalties to their gamer users, even when under an active DDoS attack campaign larger than 620 Gbps. Read their story here.
To view all DDoS attack insights across all regions and industries worldwide, visit Cloudflare’s interactive Radar DDoS dashboard.
Application-layer DDoS attacks
Application-layer DDoS attacks, specifically HTTP DDoS attacks, are attacks that usually aim to disrupt an HTTP server by making it unable to process legitimate user requests. If a server is bombarded with more requests than it can process, the server will drop legitimate requests or even crash resulting in performance penalties or a denial of service event for legitimate users.
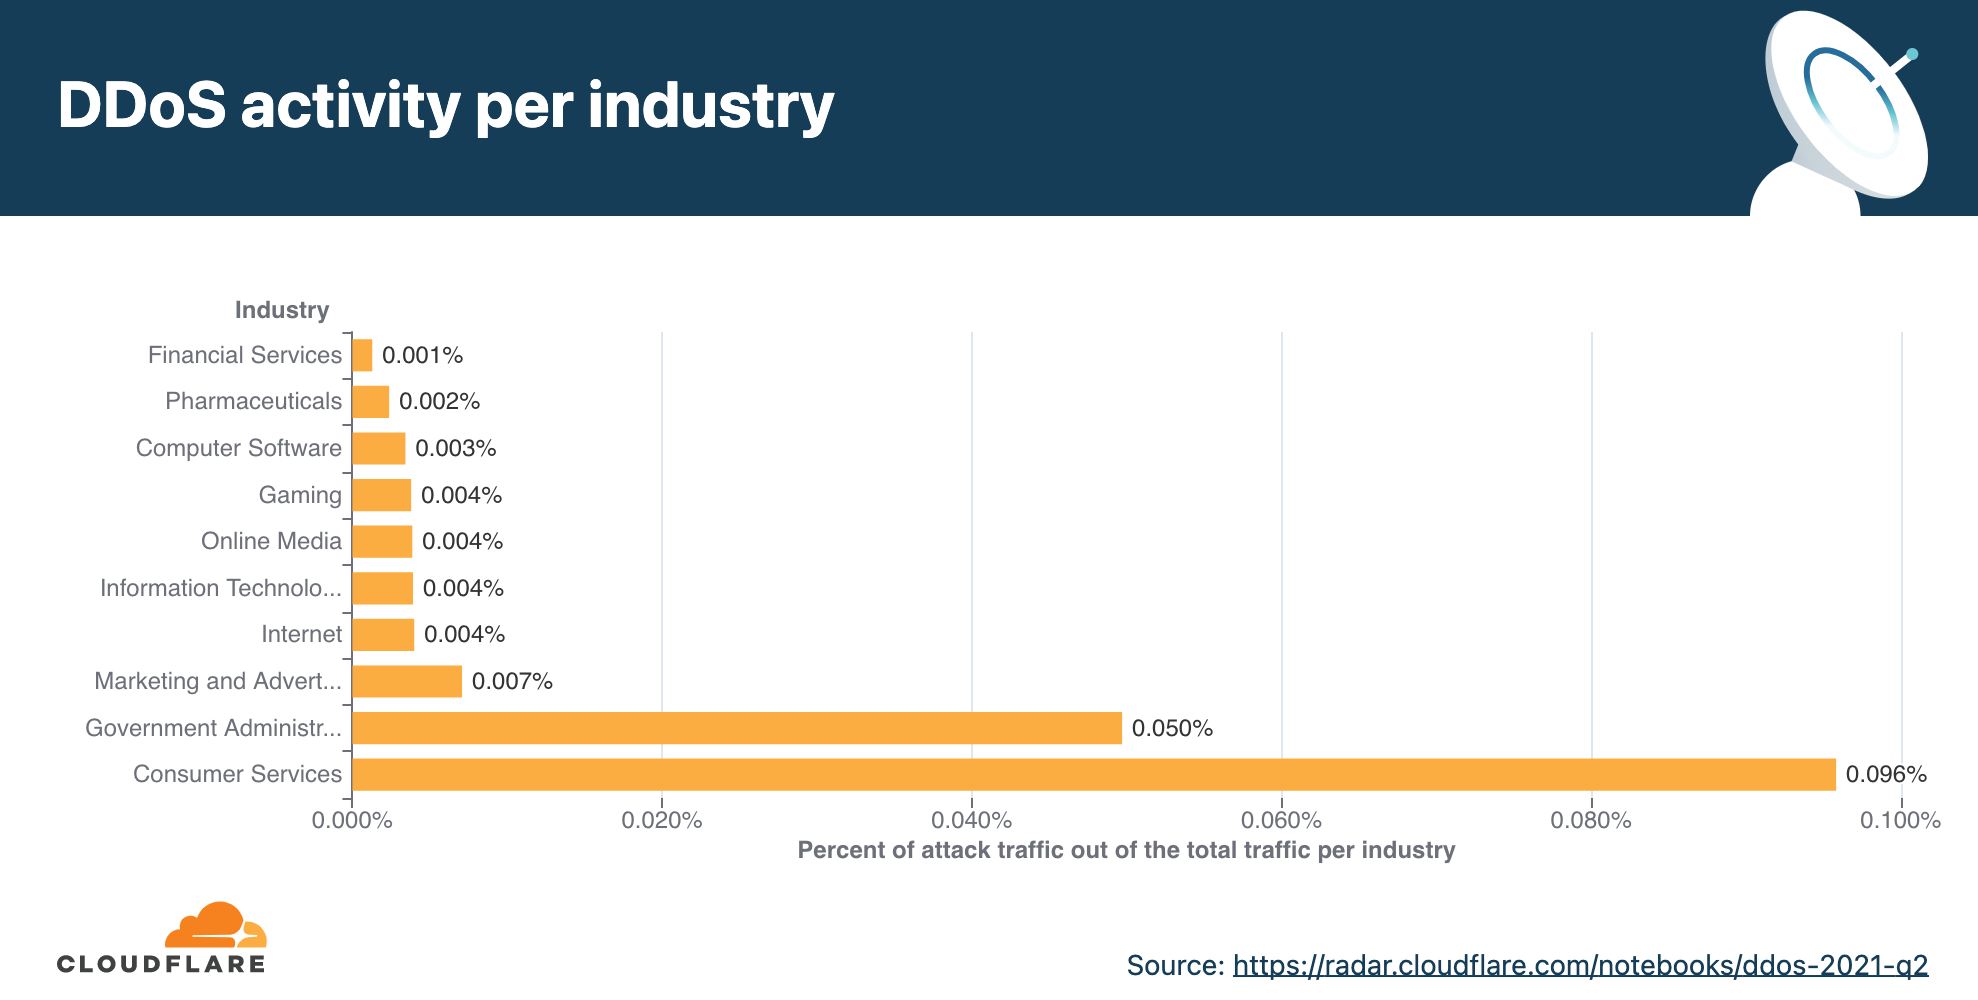
DDoS activity per market industry
When we analyze attacks, we calculate the ‘DDoS activity’ rate, which is the percentage of attack traffic out of the total traffic (attack + clean). This allows us to normalize the data points and avoid biases towards, for example, a larger data center that naturally handles more traffic and therefore also more attacks.
In 2021 Q2, Consumer Services was the most targeted industry followed by Government Administration and Marketing & Advertising.
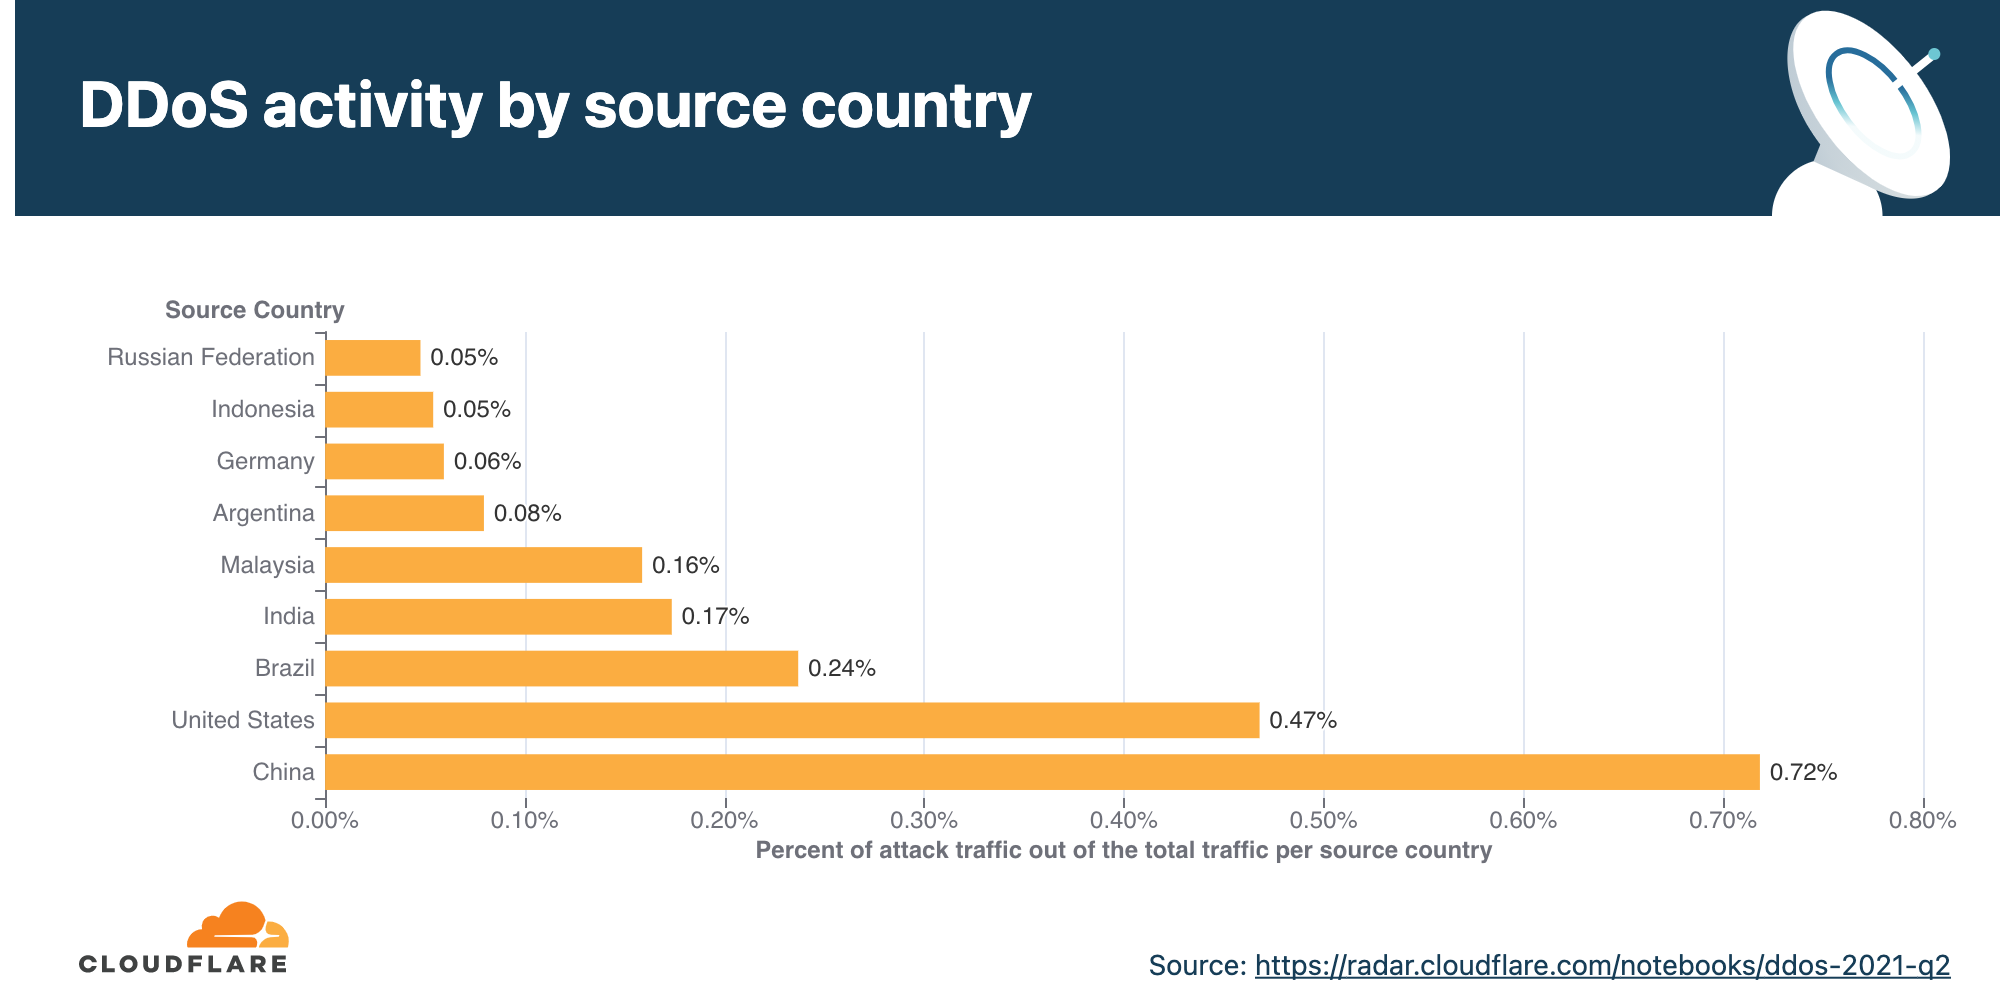
DDoS activity per source country
To understand the origin of the HTTP attacks we observed over Cloudflare’s network, we look at the source IP address of the client generating the attack HTTP requests. Unlike network-layer attacks, source IPs cannot be spoofed in HTTP attacks. A high DDoS activity rate in a given country indicates large botnets operating from within.
China and the US remain in the first and second places, respectively, regarding the percentage of DDoS activity originating from within their territories. In China, more than 7 out of every 1,000 HTTP requests were part of an HTTP DDoS attack, while in the US almost 5 out of 1,000 HTTP requests were part of an attack.
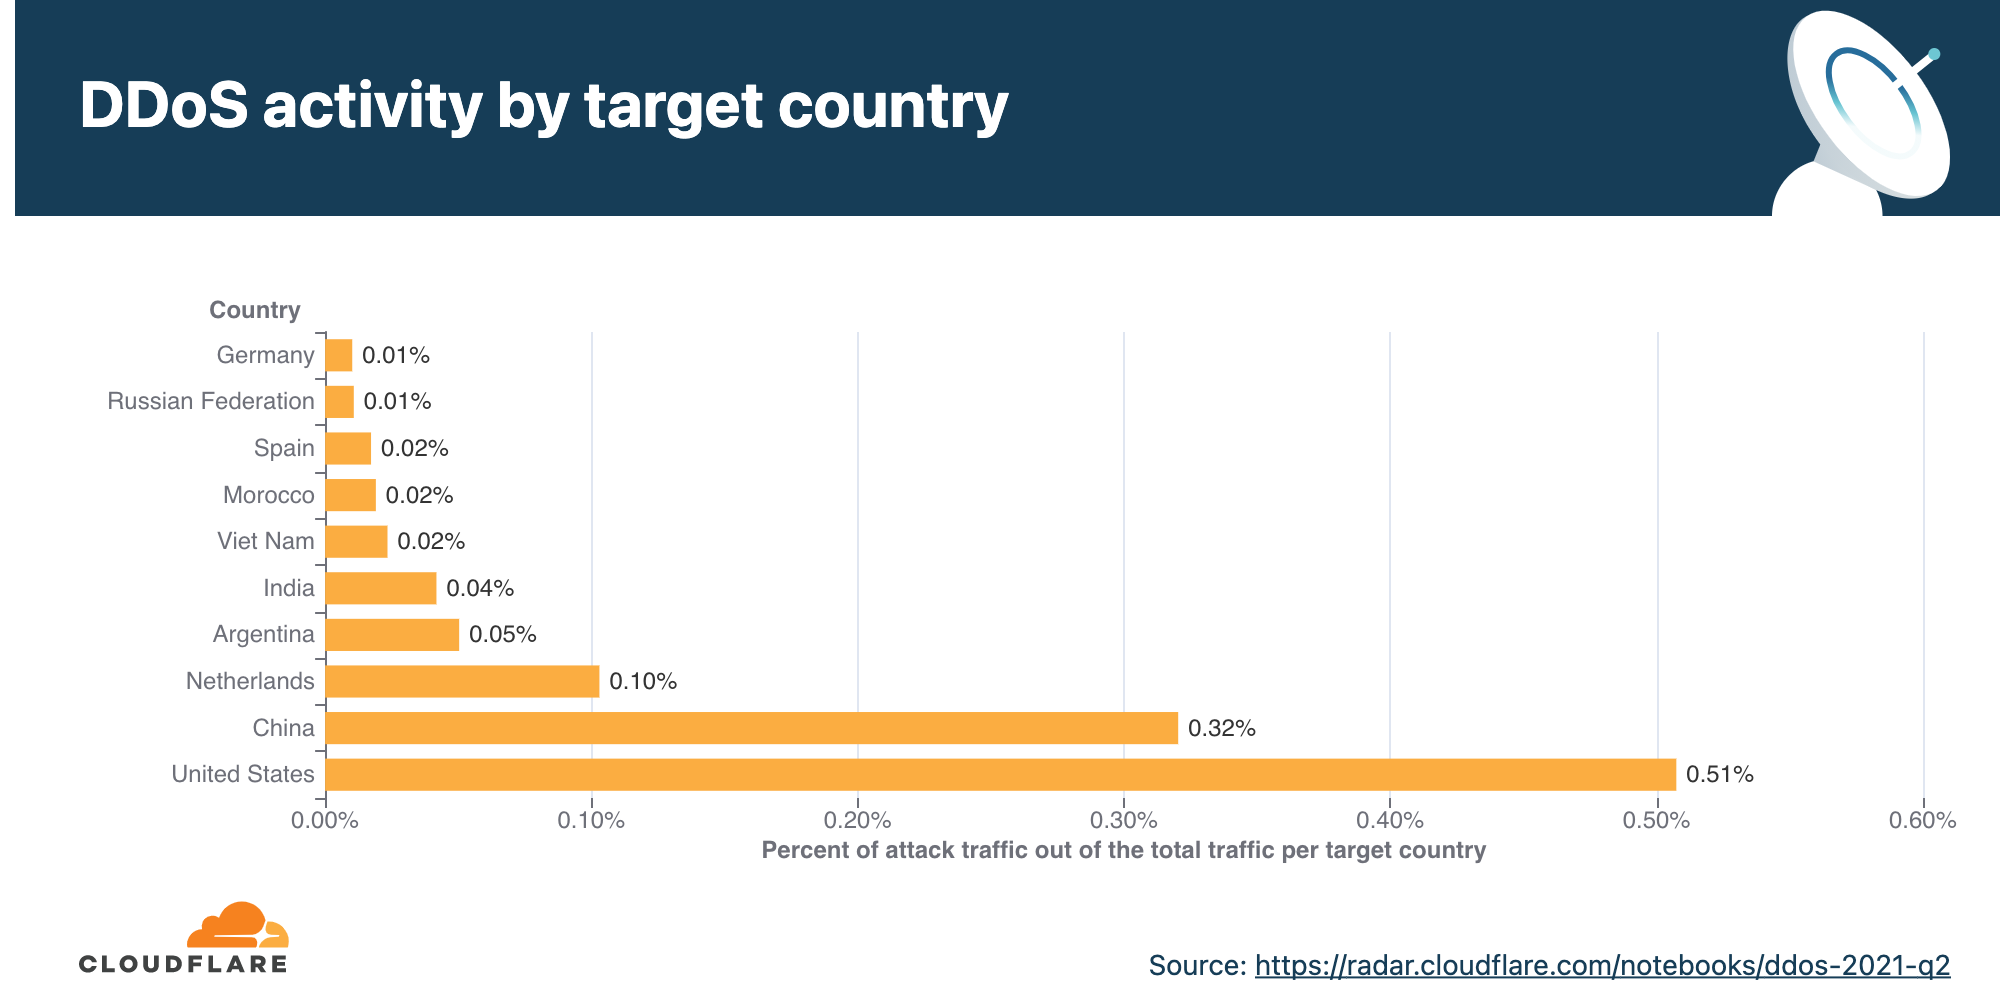
DDoS activity per target country
In order to identify which countries the targets of the DDoS attacks resided in, we break down the DDoS activity by our customers’ billing countries. Note that Cloudflare does not charge for attack traffic and has pioneered providing unmetered and unlimited DDoS protection since 2017. By cross-referencing the attack data with our customers’ billing country, we can identify which countries were attacked the most.
Data observed in 2021 Q2 suggest that organizations in the US and China were the most targeted by HTTP DDoS attacks. In fact, one out of every 200 HTTP requests destined to US-based organizations was part of a DDoS attack.
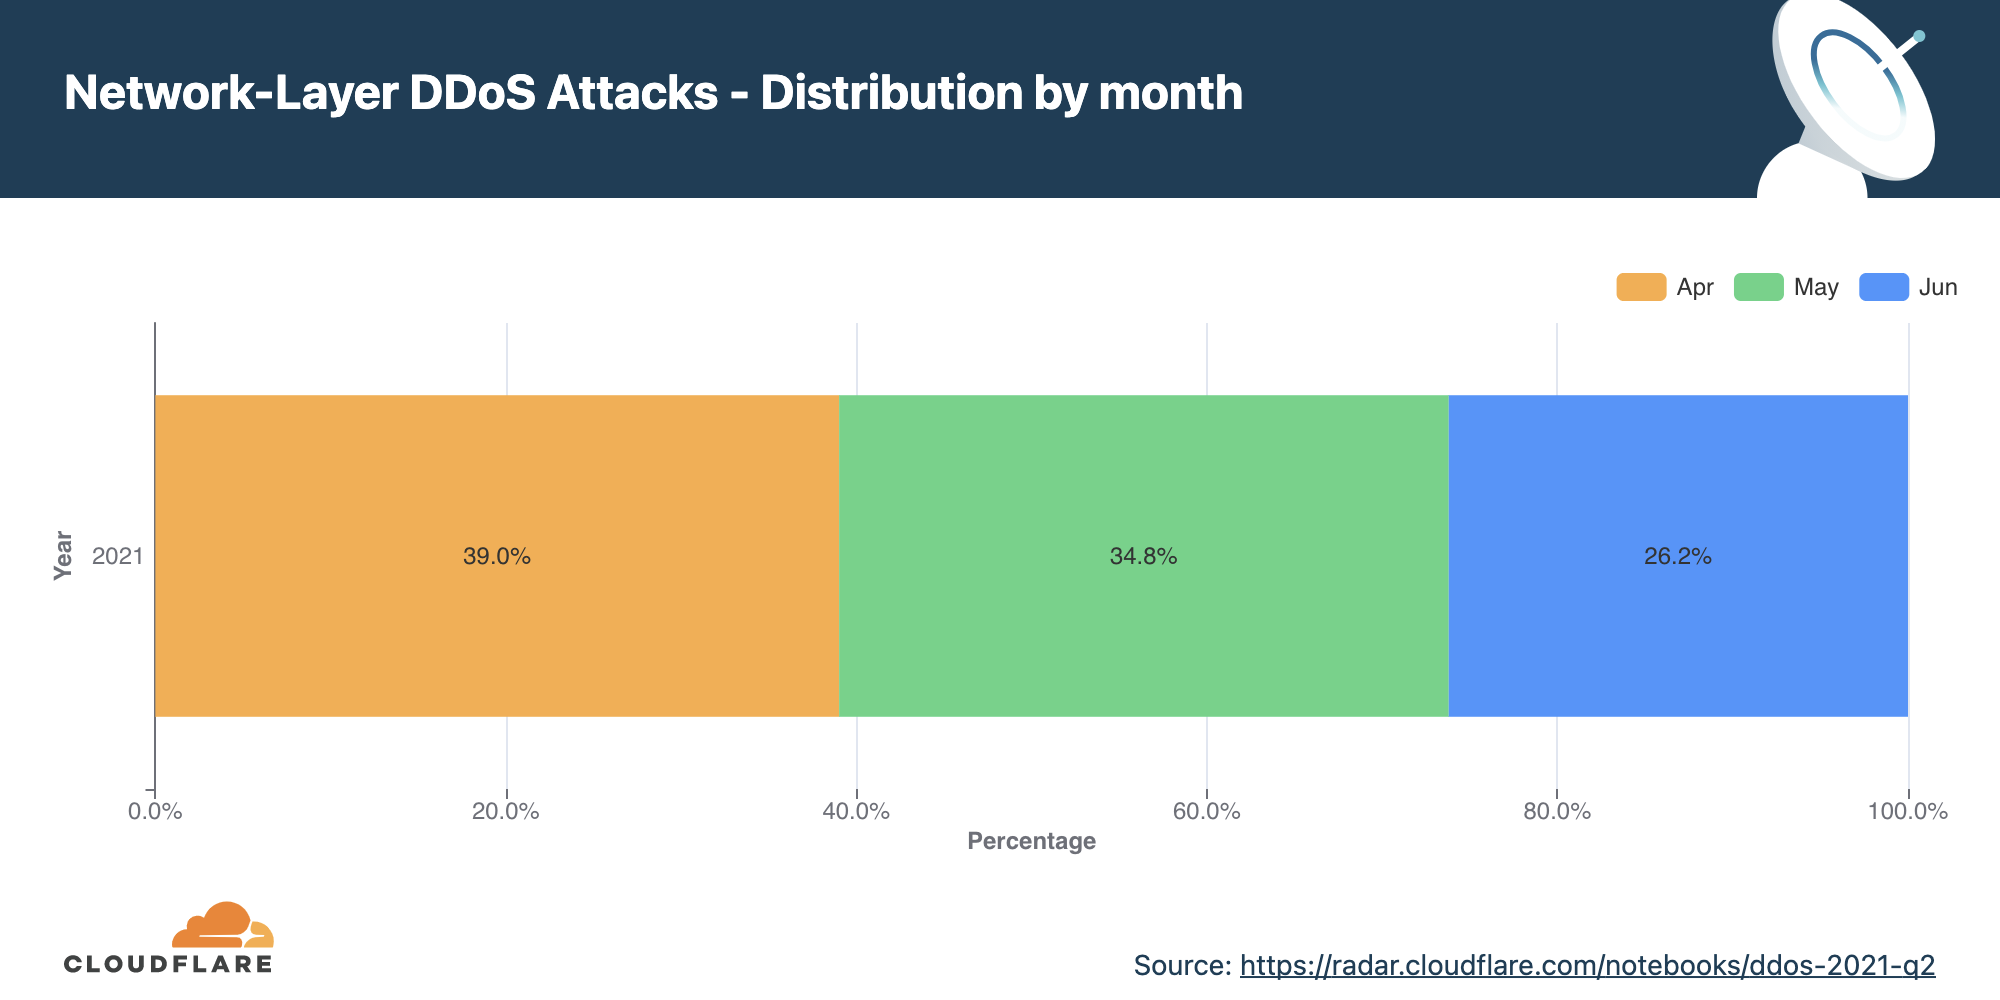
Network-layer DDoS attacks
While application-layer attacks strike the application (Layer 7 of the OSI model) running the service end users are trying to access, network-layer attacks target network infrastructure (such as in-line routers and other network servers) and the Internet link itself.
The chart above shows the distribution of network-layer DDoS attacks in 2021 Q2.
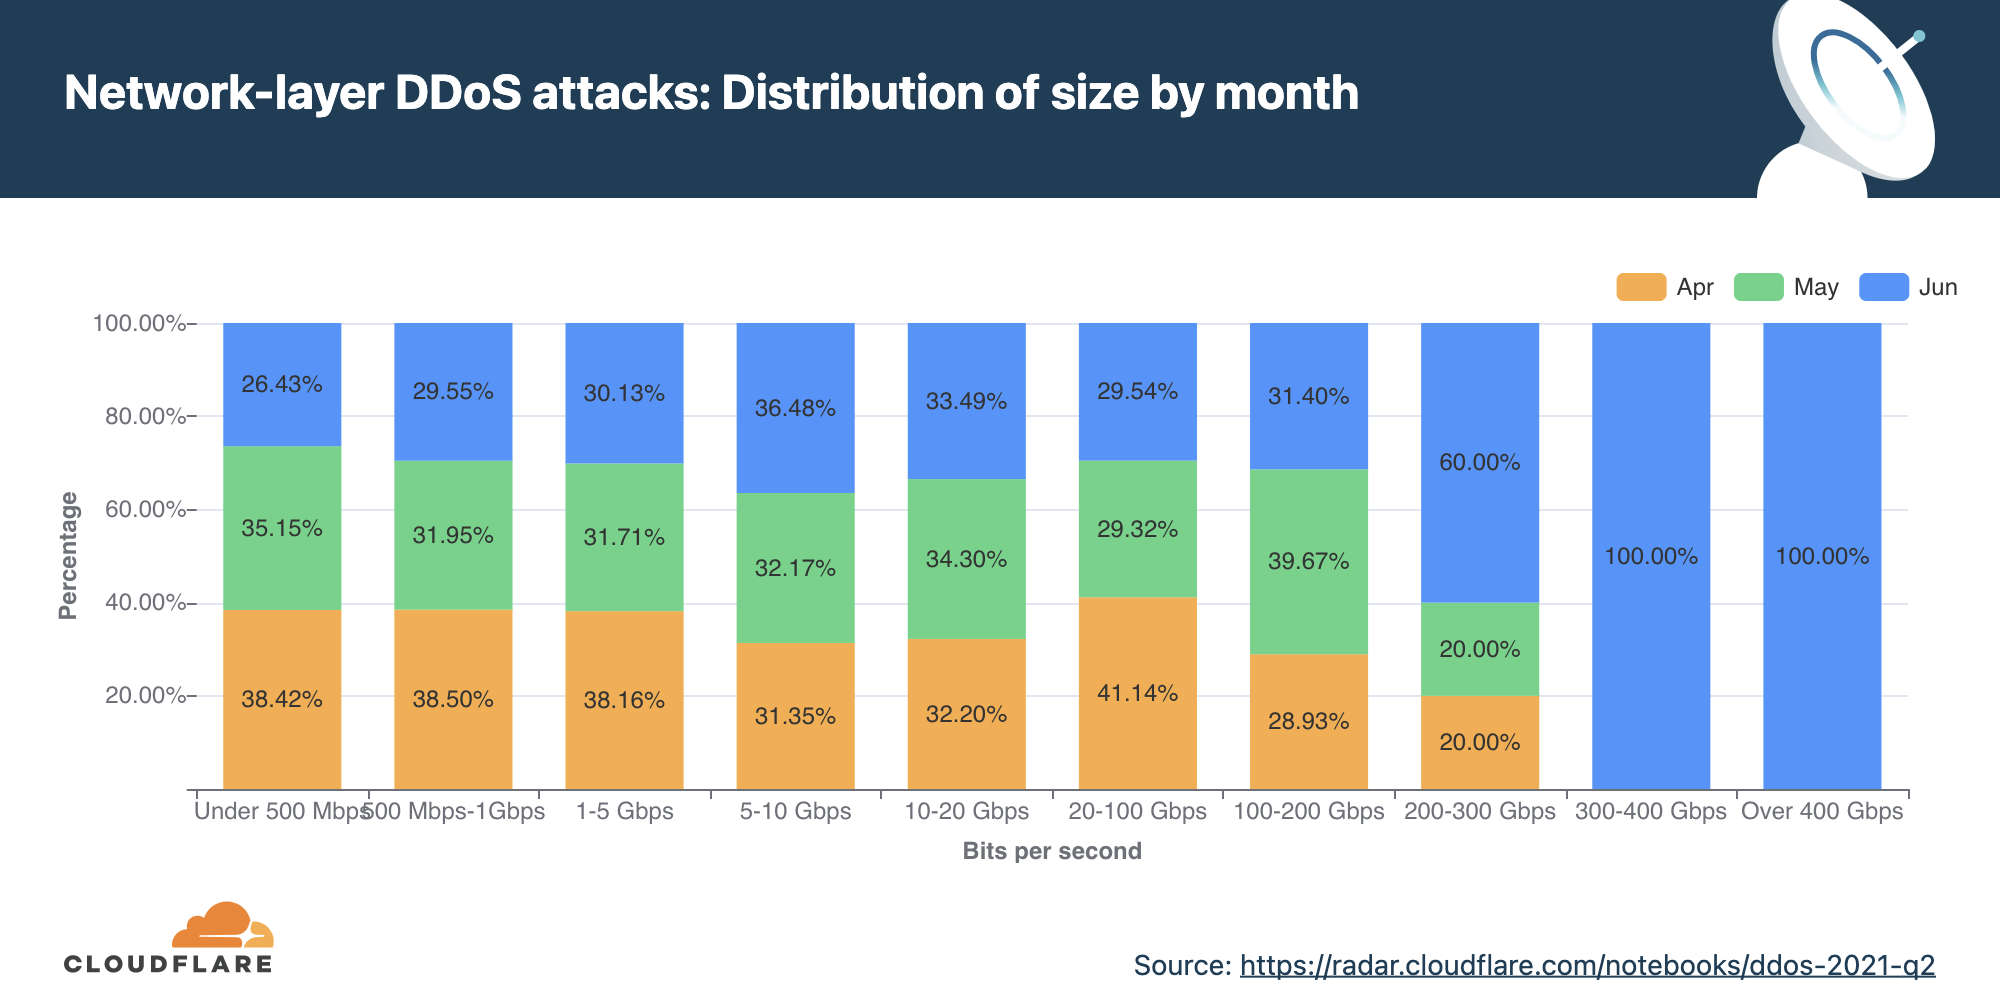
Distribution of attacks by size (packet rate and bit rate)
There are different ways of measuring the size of a L3/4 DDoS attack. One is the volume of traffic it delivers, measured as the bit rate (specifically, gigabits-per-second). Another is the number of packets it delivers, measured as the packet rate (specifically, packets-per-second). Attacks with high bit rates attempt to saturate the Internet link, while attacks with high packet rates attempt to overwhelm the servers, routers or other in-line hardware appliances.
The distribution of attacks by their size (in bit rate) and month is shown below. As observed in the chart, all attacks over 300 Gbps were observed in the month of June.
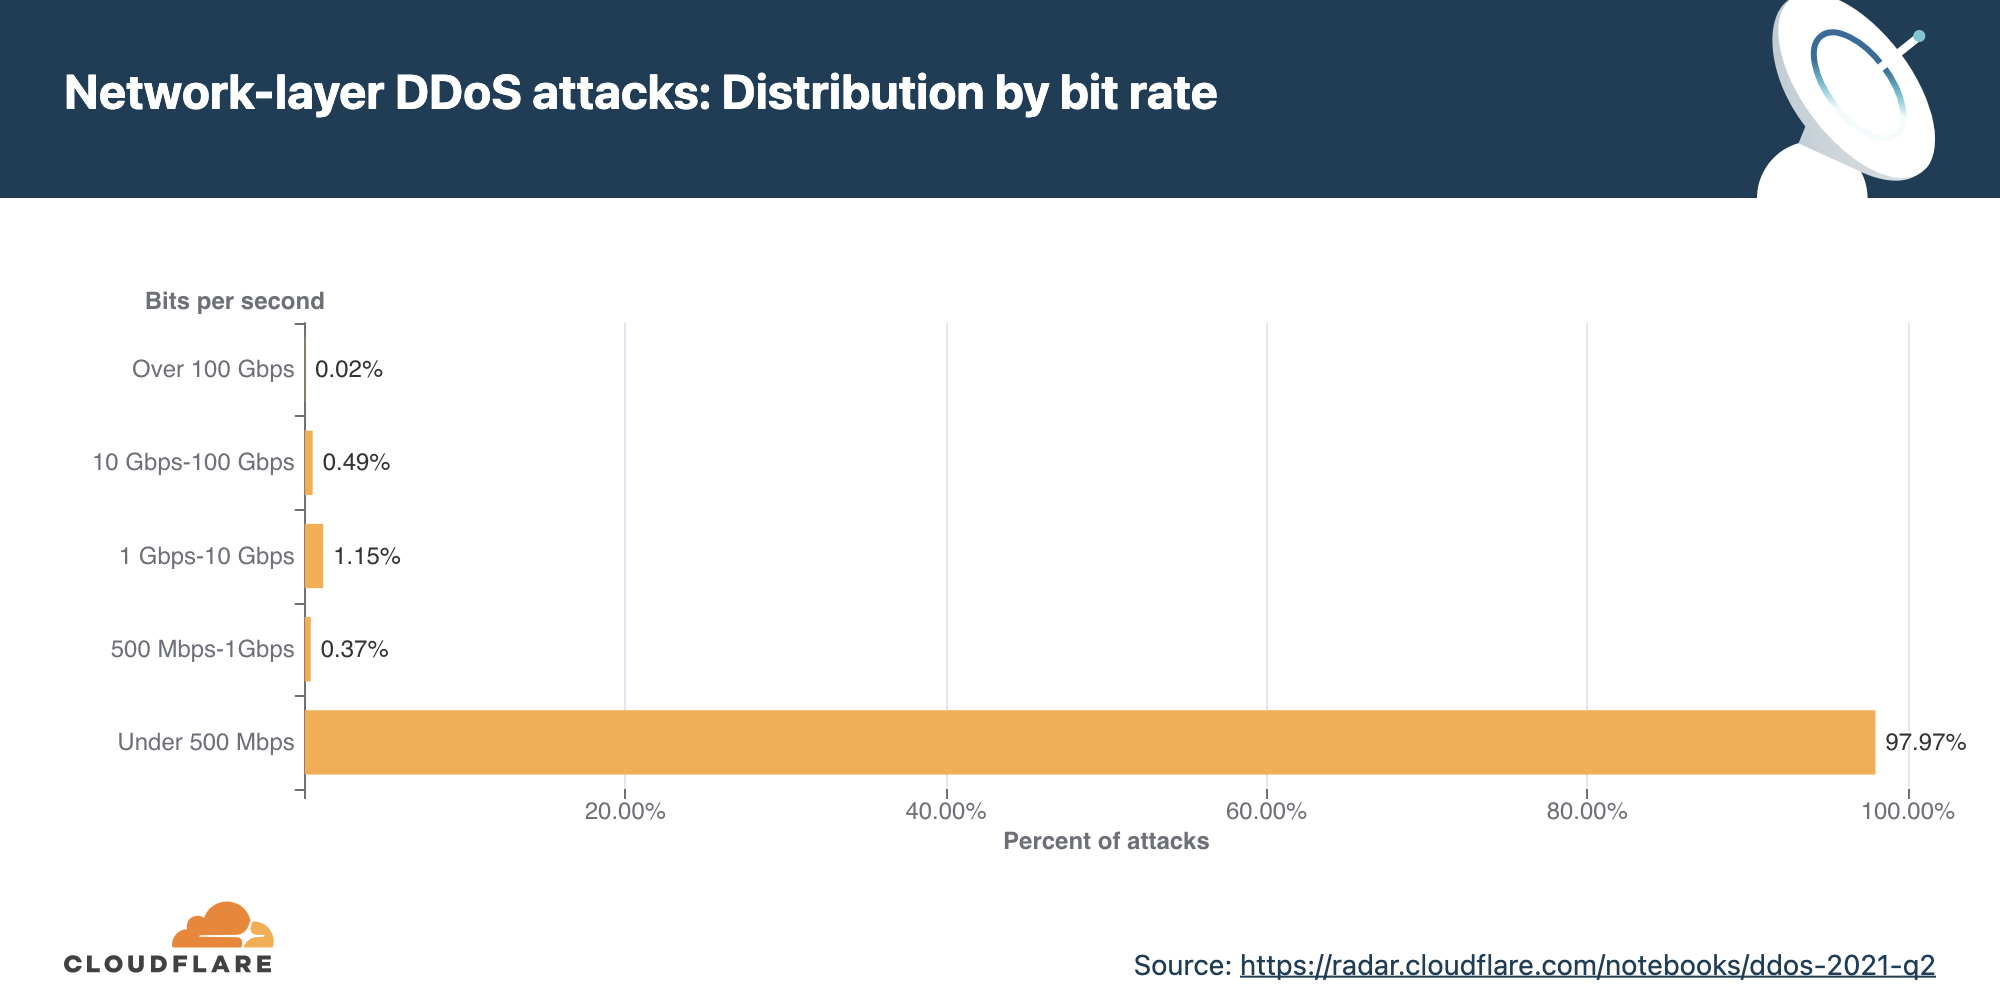
In terms of bit rate, attacks under 500 Mbps constituted a majority of all DDoS attacks observed in 2021 Q2.
Similarly, looking from the lens of packet rate, nearly 94% of attacks were under 50K pps. Even though attacks from 1-10M pps constituted only 1% of all DDoS attacks observed, this number is 27.5% higher than that observed in the previous quarter, suggesting that larger attacks are not diminishing either — but rather increasing.
Note that while attacks under 500 Mbps and 50K pps might seem ‘small’ compared to other headline-making large attacks, they are often sufficient to create major disruptions for Internet properties that are not protected by an always-on, automated cloud-based DDoS protection service. Moreso, many organisations have uplinks provided by their service providers with a bandwidth capacity smaller than 1 Gbps. Assuming their public-facing network interface also serves legitimate traffic, DDoS attacks smaller than 500 Mbps are often capable of taking down exposed Internet properties.
Distribution by attack duration
Cloudflare continues to see a large percentage of DDoS attacks that last under an hour. In Q2, over 97% of all DDoS attacks lasted less than an hour.
Short burst attacks may attempt to cause damage without being detected by DDoS detection systems. DDoS services that rely on manual analysis and mitigation may prove to be useless against these types of attacks because they are over before the analyst even identifies the attack traffic.
Alternatively, the use of short attacks may be used to probe the cyber defenses of the target. Load-testing tools and automated DDoS tools, that are widely available on the dark web, can generate short bursts of a SYN flood, for example, and then follow up with another short attack using a different attack vector. This allows attackers to understand the security posture of their targets before they decide to launch larger attacks at larger rates and longer durations — which come at a cost.
In other cases, attackers generate small DDoS attacks as proof and warning to the target organization of the attacker’s ability to cause real damage later on. It’s often followed by a ransom email to the target organization, demanding payment to avoid suffering an attack that could more thoroughly cripple network infrastructure.
This highlights the need for an always on, automated DDoS protection approach. DDoS protection services that rely on manual re-routing, analysis and mitigation may prove to be useless against these types of attacks because they are over before the analyst can even identify the attack traffic.
Distribution of attacks by attack vectors
An attack vector is the term used to describe the method that the attacker utilizes in their attempt to cause a denial of service event.
As observed in previous quarters, attacks utilizing SYN floods and UDP-based protocols remain the most popular methods by attackers.
What is a SYN flood attack? It’s a DDoS attack that exploits the very foundation of the TCP protocol. A stateful TCP connection between a client and a server begins with a 3-way TCP handshake. The client sends an initial connection request packet with a synchronize flag (SYN). The server responds with a packet that contains a synchronized acknowledgment flag (SYN-ACK). Finally, the client responds with an acknowledgment (ACK) packet. At this point, a connection is established and data can be exchanged until the connection is closed. This stateful process can be abused by attackers to cause denial of service events.
By repeatedly sending SYN packets, the attacker attempts to overwhelm a server or the router’s connection table that tracks the state of TCP connections. The router replies with a SYN-ACK packet, allocates a certain amount of memory for each given connection, and falsely waits for the client to respond with the final ACK. Given a sufficient number of connections occupying the router’s memory, the router is unable to allocate further memory for legitimate clients, causing the router to crash or preventing it from handling legitimate client connections, i.e., a denial of service event.
Emerging threats
Emerging threats included amplification DDoS attacks that abuse the Quote of the Day (QOTD) service which increased by 123% QoQ. QOTD was defined in RFC-865 (1983) and can be sent over either the UDP or TCP protocols. It was originally designed for debugging and as a measurement tool, with no specific syntax for the quote. The RFC does however recommend the use of ASCII characters and to limit the length to 512 characters.
Furthermore, we’ve seen a 107% increase QoQ in UDP Portmap and Echo attacks — all of which are really old attack vectors. This may indicate attackers digging up old methods and attack tools to try and overcome protection systems. As we’ve seen in previous quarters, the adoption of the QUIC protocol continues to increase. Consequently, so do attacks over QUIC, or more specifically floods and amplification attacks of non-QUIC traffic in places where we’d expect to see QUIC traffic. In 2021 Q2, these types of attacks increased by 109% QoQ. This continued trend may indicate that attackers are attempting to abuse the QUIC-designated ports and gateways into organizations’ networks — searching for vulnerabilities and security holes.
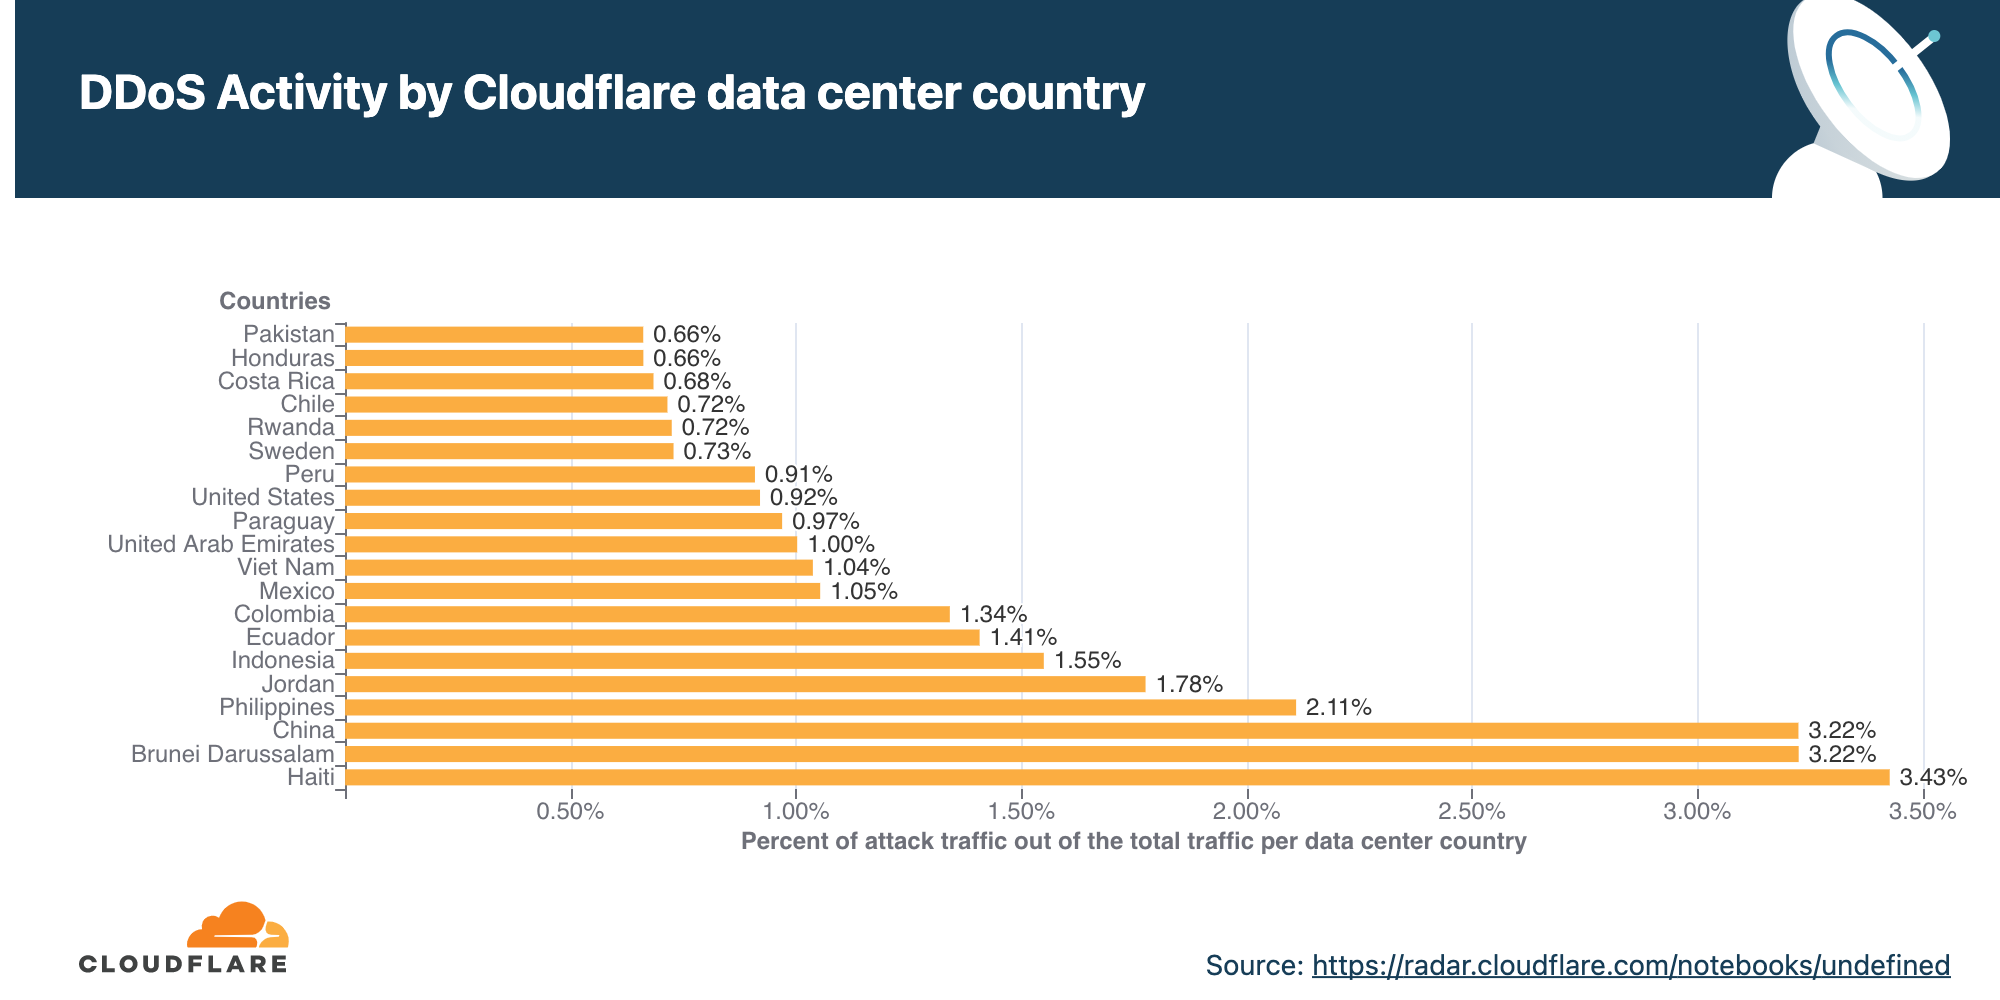
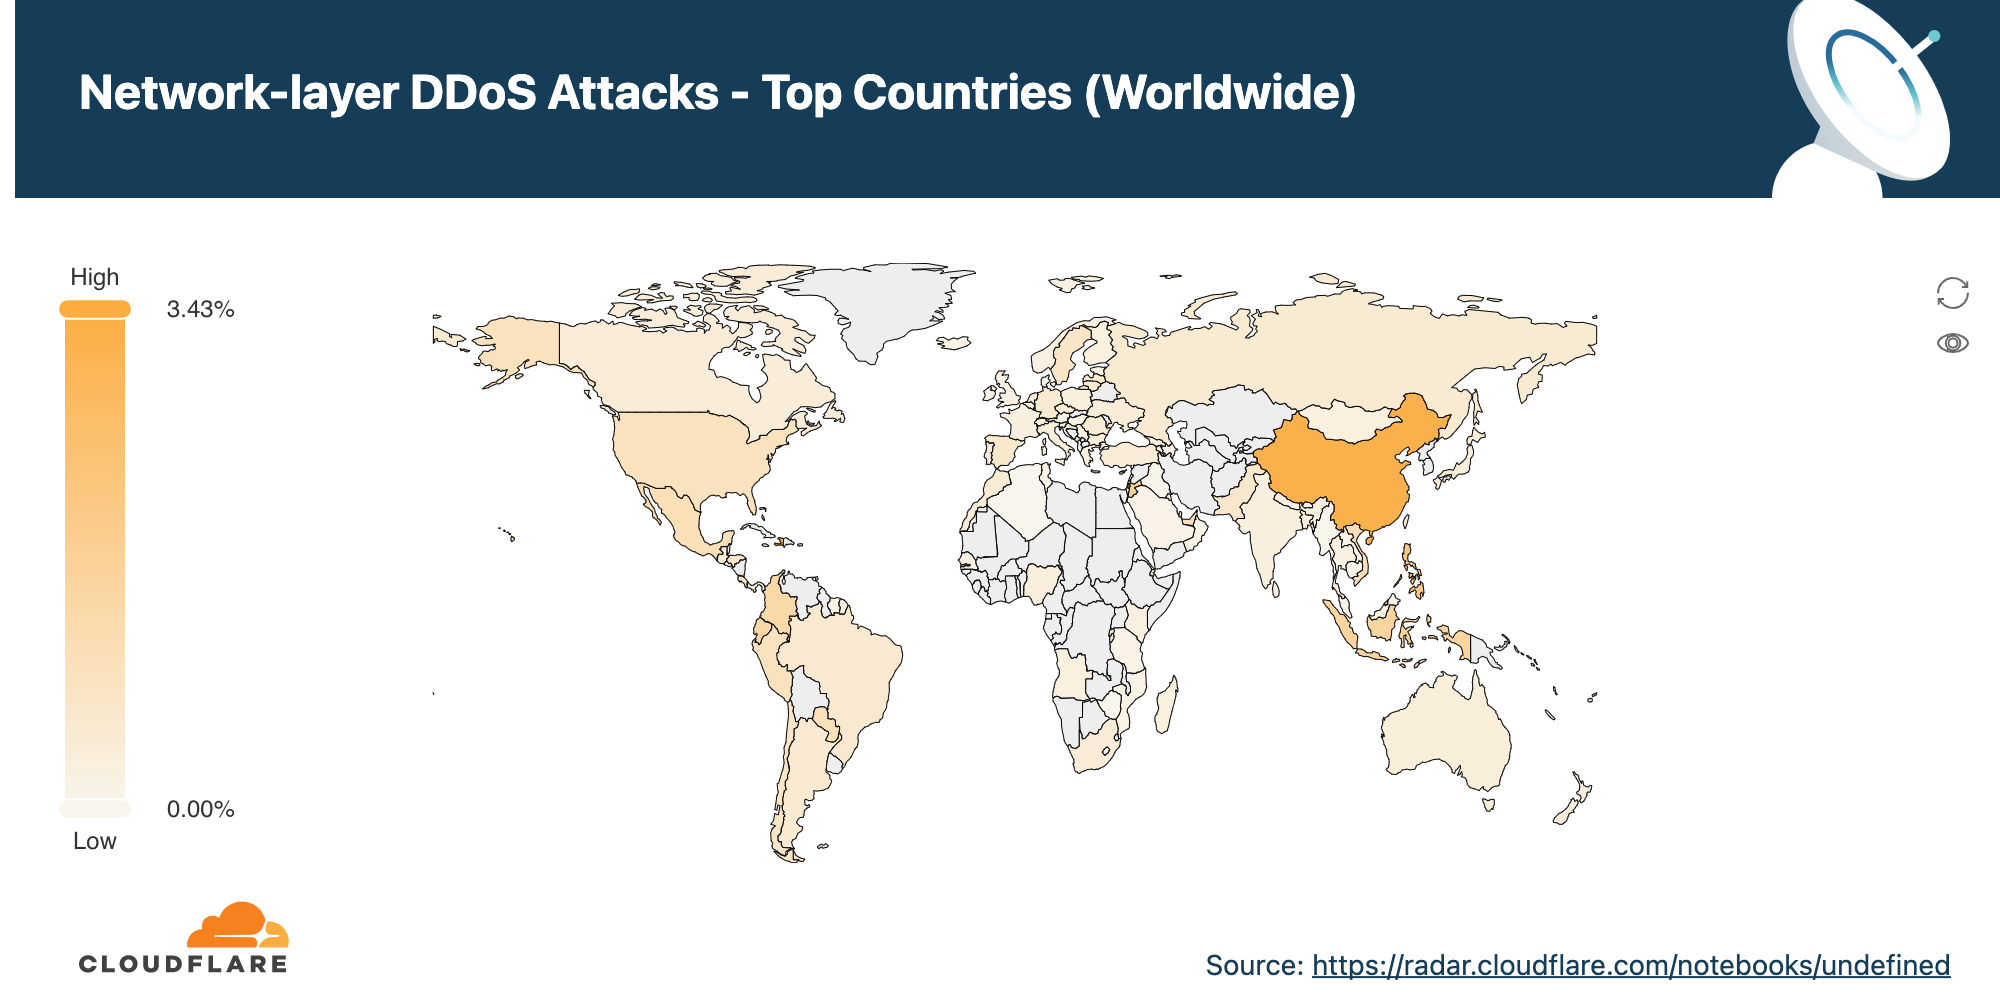
DDoS activity by Cloudflare data center country
In 2021 Q2, our data center in Haiti observed the largest percentage of network-layer DDoS attack traffic, followed by Brunei (almost 3 out of every 100 packets were part of an attack) and China.
Note that when analyzing network-layer DDoS attacks, we bucket the traffic by the Cloudflare edge data center locations where the traffic was ingested, and not by the source IP. The reason for this is that, when attackers launch network-layer attacks, they can spoof the source IP address in order to obfuscate the attack source and introduce randomness into the attack properties, which may make it harder for simple DDoS protection systems to block the attack. Hence, if we were to derive the source country based on a spoofed source IP, we would get a spoofed country. Cloudflare is able to overcome the challenges of spoofed IPs by displaying the attack data by the location of Cloudflare’s data center in which the attack was observed. We’re able to achieve geographical accuracy in our report because we have data centers in over 200 cities around the world.
A note on ransomware and ransom DDoS — a growing global threat
The last few weeks have seen a resurgence of ransom-driven cyber threats: ransomware and ransom DDoS (RDDoS).
So what is ransomware and ransom DDoS, and how are they different?
Ransomware is malicious software that encrypts an organization’s systems and databases, rendering them inaccessible and unusable. Malware is usually introduced into an organization’s systems via phishing emails — tricking employees to click on a link or download a file. Once the malware is installed on the employee’s device, it encrypts the device and can propagate to the entire network of the organization’s servers and employee devices. The attacker will demand money, usually in the form of Bitcoin, in exchange for decrypting the organization’s systems and granting them access back to their systems.
Unlike a ransomware attack, a ransom DDoS attack does not encrypt a company’s systems; it aims to knock them offline if the ransom is not paid. What makes ransom DDoS attacks even more dangerous is that they do not require the attacker to gain access to a business’s internal systems to execute the attack. However, with a strong DDoS protection strategy in place, a ransom DDoS attack has little to no effect on businesses.
Ransomware and ransom DDoS threats are impacting most industries across the globe — the financial industry, transportation, oil and gas, consumer goods, and even education and healthcare.
Entities claiming to be ‘Fancy Lazarus’, ‘Fancy Bear’, ‘Lazarus Group’, and ‘REvil’ are once again launching ransomware and ransom-DDoS attacks against organizations’ websites and network infrastructure unless a ransom is paid before a given deadline. In the case of DDoS threats, prior to the ransom note, a small DDoS attack is usually launched as a form of demonstration. The demonstration attack is typically over UDP, lasting roughly 30-120 minutes.
The ransom note is typically sent to the common group email aliases of the company that are publicly available online such as noc@, support@, help@, legal@, abuse@, etc. In several cases, it has ended up in spam. In other cases, we’ve seen employees disregard the ransom note as spam, increasing the organization’s response time which resulted in further damage to their online properties.
Cloudflare’s recommendation for organizations that receive a threat or ransom note:
Do not panic, and we recommend you do not pay the ransom: Paying ransom only encourages and funds bad actors. There’s also no guarantee that you won’t be attacked again anyway.
Contact local law enforcement: Be ready to provide a copy of the ransom letter you received and any other logs or packet captures.
Activate an effective DDoS protection strategy: Cloud-based DDoS protection can be quickly onboarded in the event of an active threat, and with a team of security experts on your side, risks can be mitigated quickly and effectively.
Here’s a short video by Cloudflare CTO, John Graham-Cumming addressing the threat of ransom DDoS attacks.
Cloudflare protects Hypixel against a massive DDoS attack campaign
At Cloudflare, our teams have been exceptionally busy this past quarter rapidly onboarding (onto our Magic Transit service) a multitude of new and existing customers that have either received a ransom letter or were under an active DDoS attack.
One such customer is Hypixel Inc, the development studio behind the world’s largest Minecraft minigame server. With over 24M total unique logins to date and a world record 216,000+ concurrent players on PC, the Hypixel team works hard to add value to the experience of millions of players across the globe.
The gaming industry is often subject to some of the largest volumetric DDoS attacks — and as a marquee brand, Hypixel attracts more than its fair share. Uptime and high performance are fundamental to the functioning of Hypixel’s servers. Any perceived downtime or noticeable lag could result in an exodus of gamers.
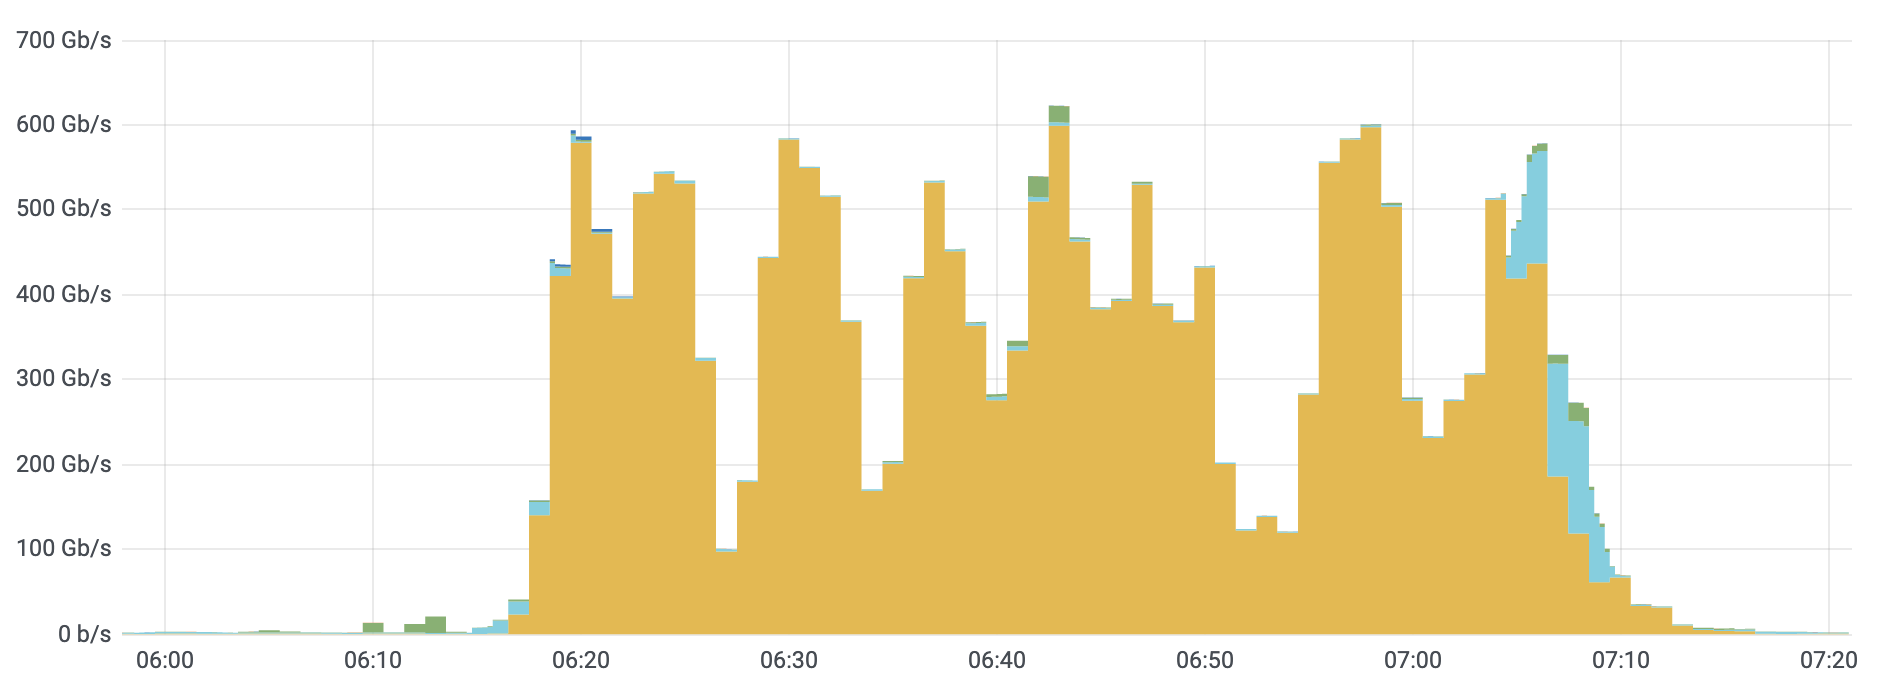
When Hypixel was under a massive DDoS attack campaign, they turned to Cloudflare to extend their services with Cloudflare to include Magic Transit, Cloudflare’s BGP-based DDoS protection service for network infrastructure. After rapidly onboarding them overnight, Cloudflare was automatically able to detect and mitigate DDoS attacks targeting their network — several of which were well over 620 Gbps. The DDoS attack comprised mostly TCP floods and UDP amplification attacks. In the graph, the various colors represent the multiple Cloudflare systems that contribute to detecting and mitigating the multi-vector attack — emphasising the value of our multi-layered DDoS approach.
Even as attack patterns changed in real-time, Magic Transit shielded Hypixel’s network. In fact, because all their clean traffic routed over Cloudflare’s high performing low-latency network, Hypixel’s users noticed no change in gamer experience — even during an active volumetric DDoS attack.
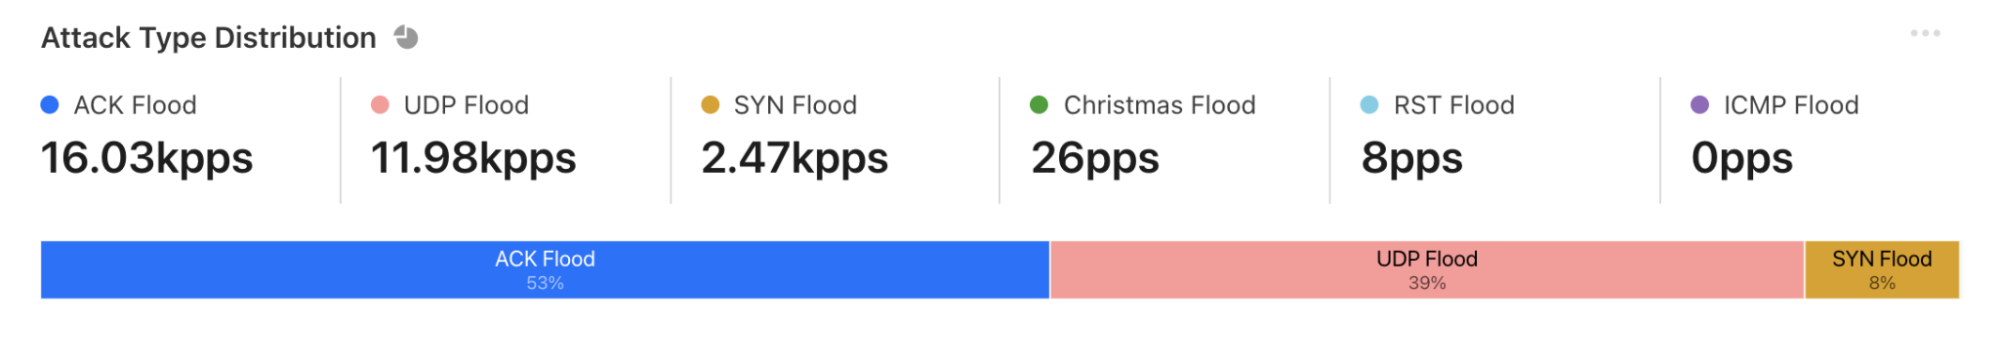
During the attack campaign, Cloudflare automatically detected and mitigated over 5,000 DDoS attacks: 53% were ACK floods, 39% were UDP-based attacks and 8% SYN floods.
“We had several attacks of well over 620 Gbps with no impact at all on our players. Their gaming experience remained uninterrupted and fast, thanks to Cloudflare Magic Transit.” – Simon Collins-Laflamme, CEO, Hypixel Inc.
Hypixel’s journey with Cloudflare began with them employing Cloudflare Spectrum to help protect their gaming infrastructure against DDoS attacks. As their user base grew, they adopted additional Cloudflare products to bolster the robustness and resilience of all of their critical infrastructure. Today, they use multiple Cloudflare products including CDN, Rate Limiting, Spectrum, Argo Smart Routing, and Load Balancing to build and secure infrastructure that provides gamers around the world the real-time gaming experiences they need.
Get holistic protection against cyber attacks of any kind
DDoS attacks constitute just one facet of the many cyber threats organizations are facing today. As businesses shift to a Zero Trust approach, network and security buyers will face larger threats related to network access, and a continued surge in the frequency and sophistication of bot-related and ransomware attacks.
A key design tenet while building products at Cloudflare is integration. Cloudflare One is a solution that uses a Zero Trust security model to provide companies a better way to protect devices, data, and applications — and is deeply integrated with our existing platform of security and DDoS solutions.
In fact, Cloudflare offers an integrated solution that comprises an all-star cast featuring the following to name a few:
DDoS: LEADER in Forrester Wave™ for DDoS Mitigation Solutions, Q1 20211
WAF: Cloudflare is a CHALLENGER in the 2020 Gartner Magic Quadrant for Web Application Firewall (receiving the highest placement in the ‘Ability to Execute’)2
Zero Trust: Cloudflare is a LEADER in the Omdia Market Radar: Zero-Trust Access Report, 20203
Web protection: Innovation leader in the Global Holistic Web Protection Market for 2020 by Frost & Sullivan4
Cloudflare’s global (and growing) network is uniquely positioned to deliver DDoS protection and other security, performance, and reliability services with unparalleled scale, speed, and smarts.
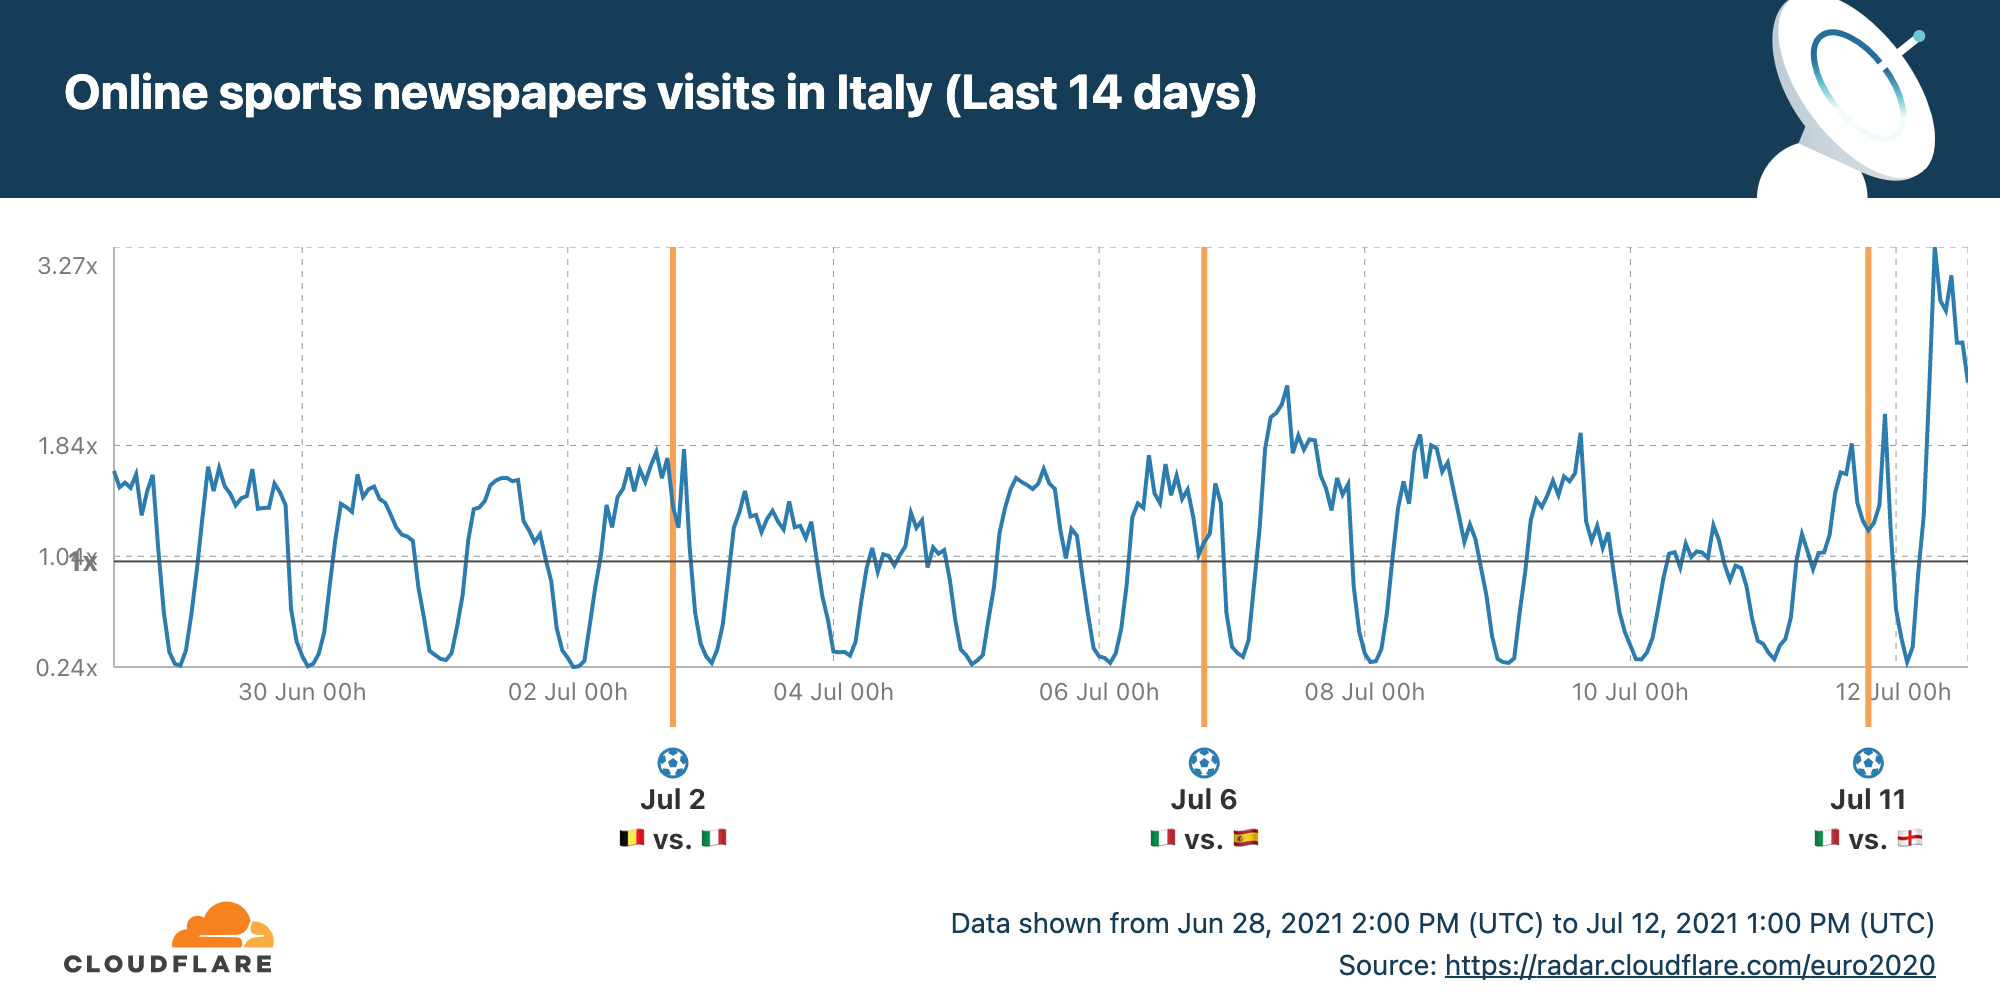
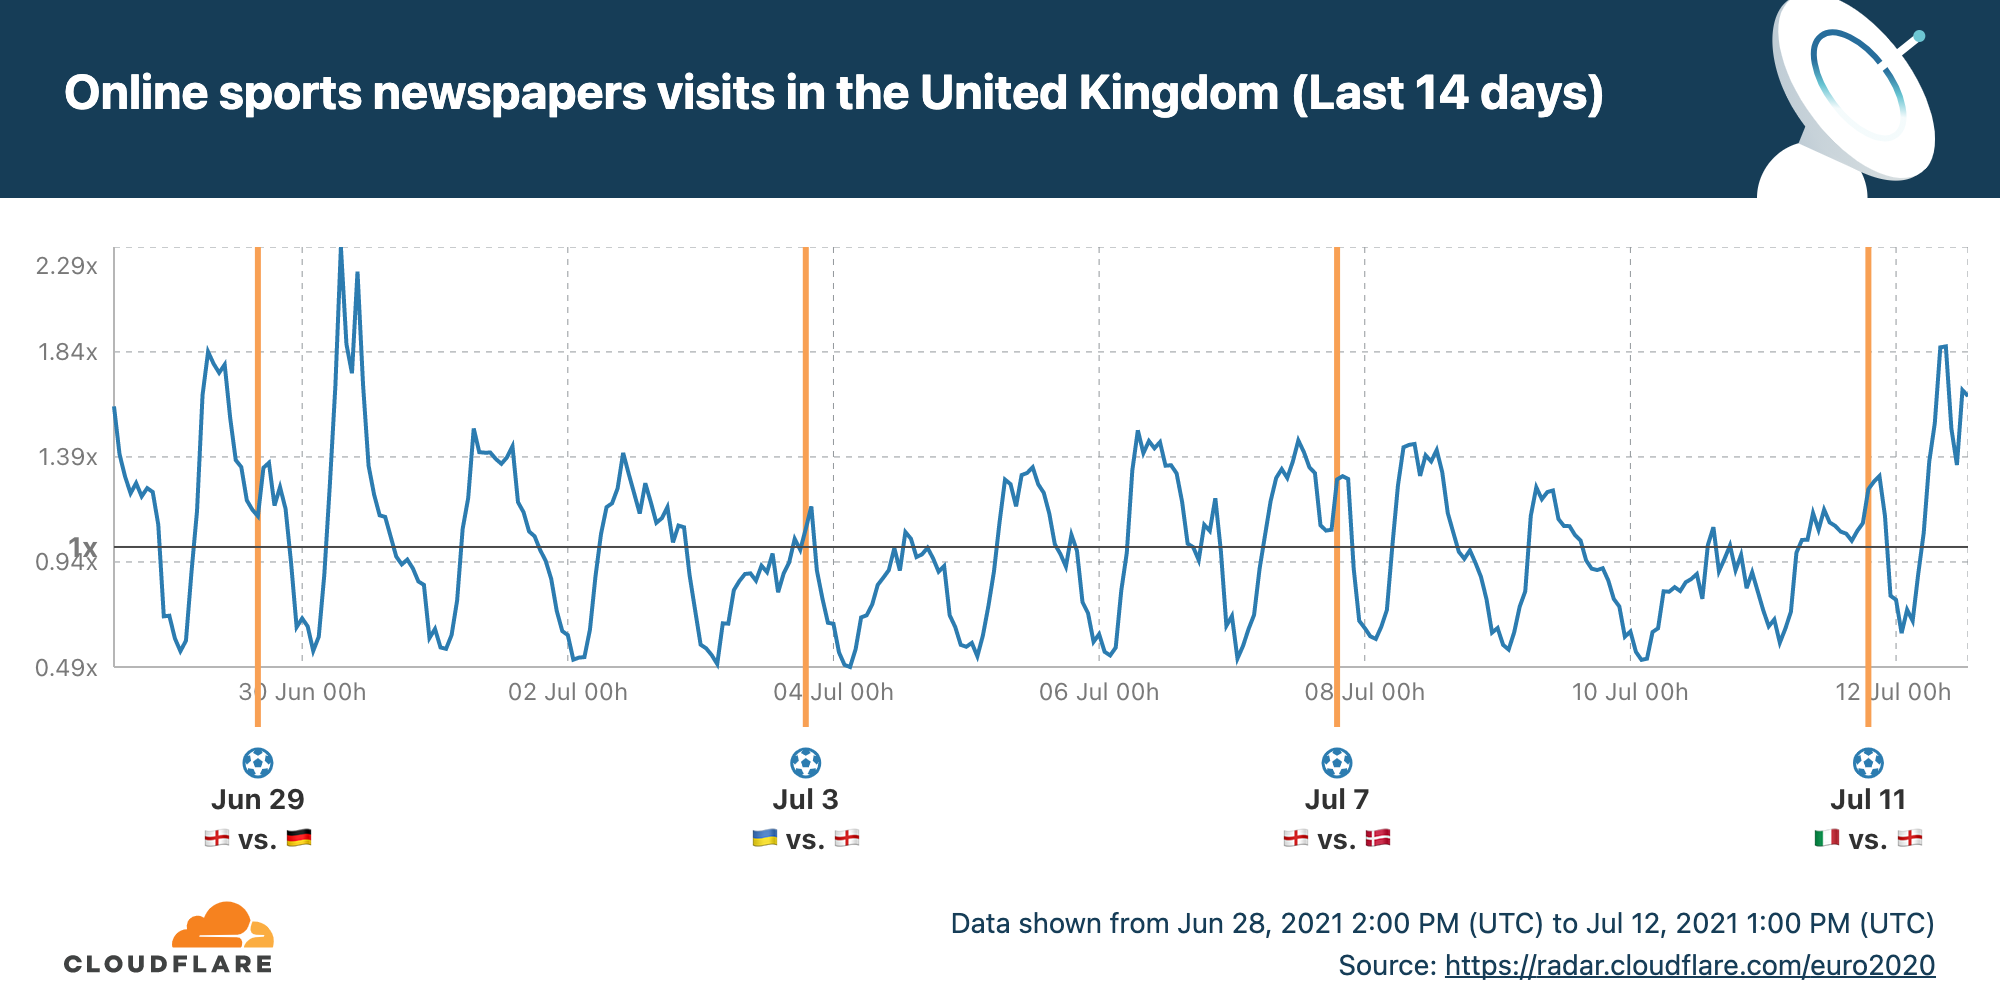
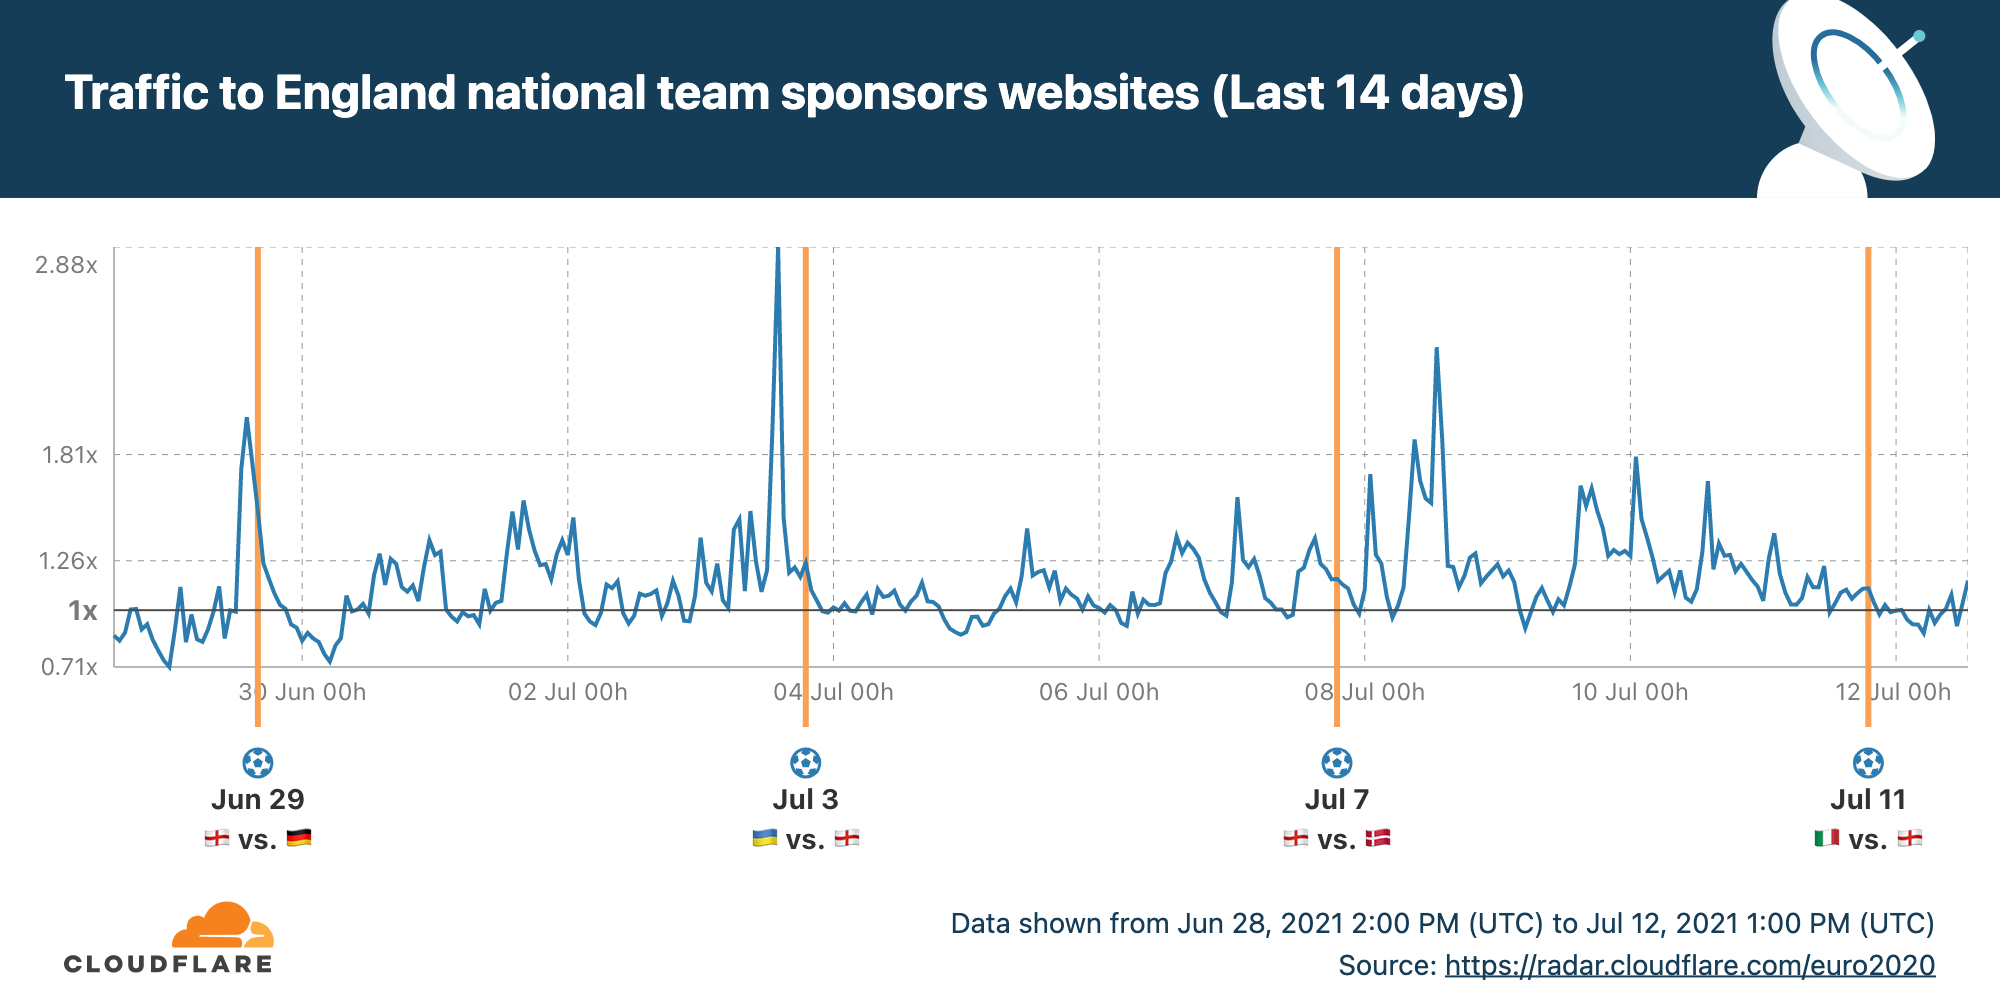
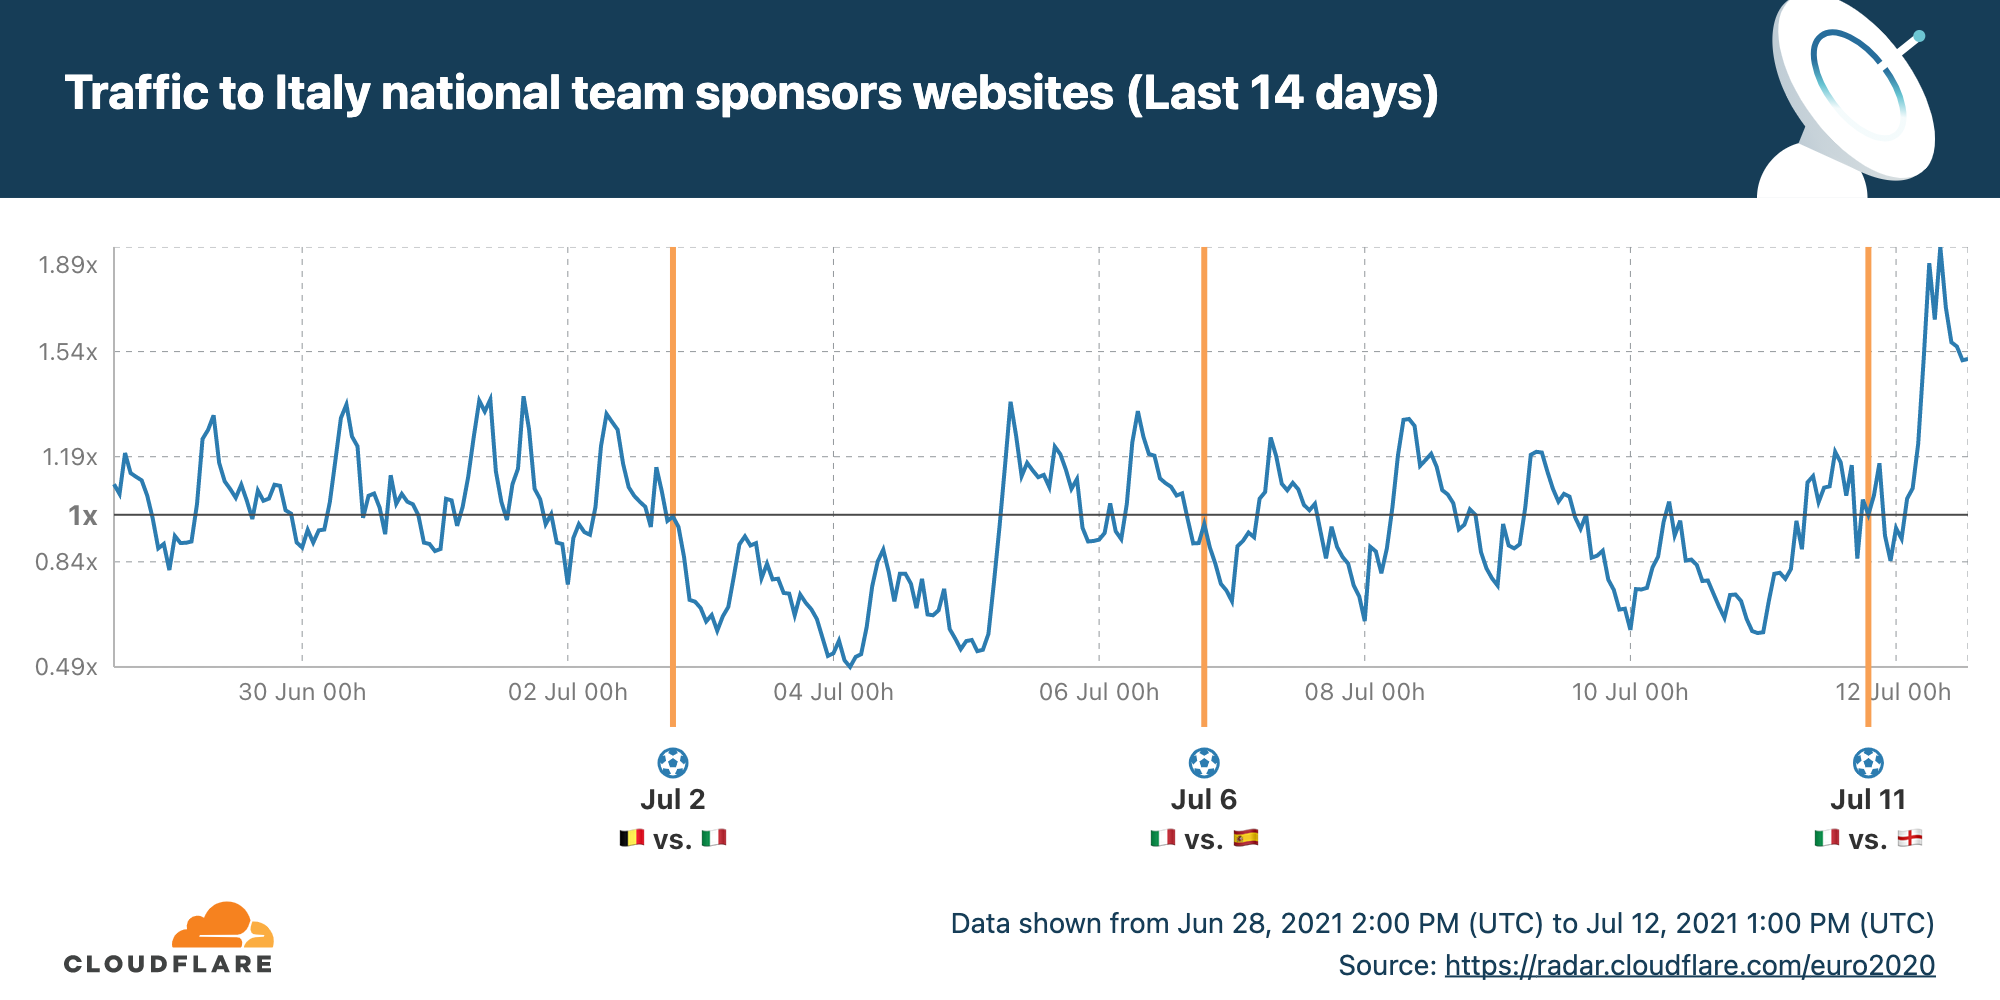
Last night’s Italy-England match was a nail-biter. 1-1 at full time, 1-1 at the end of extra time, and then an amazing penalty shootout with incredible goalkeeping by Pickford and Donnarumma.
Cloudflare has been publishing statistics about all the teams involved in EURO 2020 and traffic to betting websites, sports newspapers, streaming services and sponsors. Here’s a quick look at some specific highlights from England’s and Italy’s EURO 2020.
Two interesting peaks show up in UK visits to sports newspapers: the day after England-Germany and today after England’s defeat. Looks like fans are hungry for analysis and news beyond the goals. You can see all the data on the dedicated England EURO 2020 page on Cloudflare Radar.
But it was a quiet morning for the websites of the England team’s sponsors.
Turning to the winners, we can see that Italian readers are even more interested in knowing more about their team’s success.
And this enthusiasm spills over into visits to the Italian team’s sponsors.
You can follow along on the dedicated Cloudflare Radar page for Italy in EURO 2020.
Visit Cloudflare Radar for information on global Internet trends, trending domains, attacks and usage statistics.
To prevent cheating in exams many countries restrict or even shut down Internet access during critical exam hours. I wrote two weeks ago about Syria having planned Internet shutdowns during June, for exams.
Sudan is doing the same thing and has had four shutdowns so far. Here’s the Internet traffic pattern for Sudan over the last seven days. I’ve circled the shutdowns on Saturday, Sunday, Monday and Tuesday (today, June 22, 2021).
Cloudflare Radar allows anyone to track Internet traffic patterns around the world, and it has country-specific pages. The chart for the last seven days (shown above) came from the dedicated page for Sudan.
The Internet outages start at 0600 UTC (0800 local time) and end three hours later at 0900 UTC (1100 local time). This corresponds to the timings announced by the Sudanese Ministry of Education.
Further shutdowns are likely in Sudan on June 24, 26, 27, 29 and 30 (thanks to Twitter user _adonese for his assistance). Looking deeper into the data, the largest drop in use is for mobile Internet access in Sudan (the message above talks about mobile Internet use being restricted) while some non-mobile access appears to continue.
That can be seen by looking at the traffic mix from Sudan. During the exam times mobile use drops (as a percentage of traffic) and desktop use increases. This chart also shows how popular mobile Internet access is in Sudan: it’s typically above 75% of traffic (compare with, for example, the US).
If you want to follow the other outages for the remaining five exams, you can see live data on the Cloudflare Radar Sudan page.
The obvious answer is the Tampa Bay Buccaneers but the less obvious answer comes from asking “which Super Bowl advertiser got the biggest Internet bump?”. This blog aims to answer that question.
Before, during, and after the game a crack team of three people who work on Cloudflare Radar looked at real time statistics for traffic to advertisers’ websites, social media in the US, US food delivery services, and websites covering (American) football. Luckily, one of us (Kari) is (a) American and (b) a fan of football. Unluckily, one of us (Kari) is a fan of the Kansas City Chiefs.
Cloudflare Radar uses a variety of sources to provide aggregate information about Internet traffic and attack trends. In this blog post we use DNS name resolution data to estimate traffic to websites. We can’t see who visited the websites mentioned below, or what anyone did on the websites, but DNS can give us an estimate of the interest generated by the commercials. This analysis only looked at the top-level names in each domain (so example.com and www.example.com and not any other subdomains).
The Big Picture
To get the ball rolling here’s a look at traffic to NFL team websites and sports websites. Traffic builds to a peak as the game begins just after 1830 local time. As the game progresses traffic to those websites drops off hitting a mid-game low at about 2015 before jumping up for 30 minutes during the halftime show.
The big peak at around 2145 appears to be at the same time as a streaker ran onto the field. A lesser peak comes soon after 2200 when the Buccaneers sealed their victory.
As well as reading about the game, fans were also using social media to get news and add their own commentary. Here’s a look at US social media use during the game.
Social media use dips a little just as the game is about to begin and then ramps up until the Buccaneers’ victory is final. And then, as people go to sleep, social media use falls away.
Taking a look at food delivery services it looks like folks orders ramped up about 90 minutes before the game started and people’s hunger was sated before the game ended.
The Internet Impact of Commercials
One question is “Does a Super Bowl commercial drive traffic to the company’s web site while the game is on?” Answer: yes. Here’s one that went vroom peaking at over 40x baseline:
Vehicles and related services played a big part. GM tried to take on Norway with a commercial about their electric vehicle batteries.
And the electric vehicle theme continued with Cadillac:
Anheuser-Busch had a “corporate” commercial this time (as opposed to a commercial for their individual brands). You can clearly see from this chart when that aired.
And Bud Light got a boost that seemed to keep people thinking about beer through the game.
Some brands see a spike when the commercial airs and then traffic reverts fairly quickly towards the baseline. Another brand that lingered on post-commercial is Mountain Dew. Prior to the commercial, traffic to the Mountain Dew website was steady, then came the airing of the commercial with a greater than 25x peak followed by interest throughout the game and into the night.
Pepsi sponsored the halftime show and that’s clearly visible in the charts as they get a boost through The Weeknd’s performance.
Moving on from drinks and reaching for the snacks we can see that Doritos were pretty popular all evening long with visible commercial induced spikes.
Brands that might not be so well known get a large traffic boost from their Super Bowl commercials. Here’s the impact on oat milk company Oatly:
And ever popular chain Jimmy John’s saw a large traffic jump when their commercial aired.
Keeping Clean
Cleaning products (household and personal) were also the order of the day. First up, we have Dr. Squatch advertising their soap products for men.
Microban24 makes hand sanitizer and got a jump from their commercial:
But perhaps the biggest surprise in this category is Tide, which not only jumped up but stayed up throughout the game. Maybe it was the sight of all the sportswear on the field that was going to need cleaning:
Highlights
The folks at WeatherTech showed their commercial more than once and hit over 20x baseline.
Rocket Mortgage got a lot of people thinking about mortgages well into the night:
Financial services firm Klarna got a big jump as the game was wrapping up.
Throughout the game Paramount+ was touted more than once. Another streaming service? Definitely looked interesting to many.
Skechers’ got people thinking about what they put on their feet throughout the first half of the game:
And lastly, for this look at just some of the Super Bowl LV commercials, Fiverr got the message out about about freelancing:
Which brings us to the all important question…
So, who won Super Bowl LV?
Taking “highest commercial induced peak” as the measure then it’s Dexcom. Dexcom makes wearable continuous glucose monitors for people with diabetes. They got a 100x boost.
A close runner up is Inspiration4, a privately funded trip into space where one seat is up for grabs via a lottery. Inspiration4 went from very little traffic to over 70x and continuous interest throughout.
Of course, this doesn’t tell the whole story. Inspiration4 had very little traffic prior to the game so the magnitude of the peak isn’t that surprising.
After a tough 2020 perhaps it’s not a surprise that a healthcare product and an inspirational project should “win” Super Bowl LV.
Of course, for brands that already get a lot of Internet traffic that spikes aren’t so high yet represent a great deal of traffic because the baseline is so much higher. Here’s online marketplace Mercari getting a 2x jump.
And businesses like Disney or Amazon have so much traffic that commercials might drive a small increase in overall traffic but it tends to get lost.
One More Thing: Tom Brady
One person who didn’t advertise during the game but nevertheless got a bump in traffic to their website was Tom Brady. Brady’s fitness and nutrition brand TB12 saw traffic grow as the game ended and continued interest into the night.
Want more?
Visit Cloudflare Radar for up to date Internet traffic and attack trends.
Two days ago, through its communications regulator, Uganda’s government ordered the “Suspension Of The Operation Of Internet Gateways” the day before the country’s general election. This action was confirmed by several users and journalists who got access to the letter sent to Internet providers. In other words, the government effectively cut off Internet access from the population to the rest of the world.
Ahead of tomorrow’s election the Internet has been shutdown in Uganda (confirmed by a few friends in Kampala). Letter from communications commission below: pic.twitter.com/tRpTIXTPcW
On Cloudflare Radar, we want to help anyone understand what happens on the Internet. We are continually monitoring our network and exposing insights, threats, and trends based on the aggregated data that we see.
Uganda’s unusual traffic patterns quickly popped up in our charts. Our 7-day change in Internet Traffic chart in Uganda shows a clear drop to near zero starting around 1900 local time, when the providers received the letter.
This is also obvious in the Application-level Attacks chart.
The traffic drop was also confirmed by the Uganda Internet eXchange point, a place where many providers exchange their data traffic, on their public statistics page.
We keep an eye on traffic levels and BGP routing to our edge network, and are able to see which networks carry traffic to and from Uganda and their relative traffic levels. The cutoff is clear in those statistics also. Each colored line is a different network inside Uganda (such as ISPs, mobile providers, etc.)
We will continue to keep an eye on traffic levels from Uganda and update the blog when we see significant changes. At the time of writing, Internet access appears to be still cut off.
Throughout 2020, we tracked changing Internet trends as the SARS-Cov-2 pandemic forced us all to change the way we were living, working, exercising and learning. In early April, we created a dedicated website https://builtforthis.net/ that showed some of the ways in which Internet use had changed, suddenly, because of the crisis.
On that website, we showed how traffic patterns had changed; for example, where people accessed the Internet from, how usage had jumped up dramatically, and how Internet attacks continued unabated and ultimately increased.
Today we are launching a dedicated Year In Review page with interactive maps and charts you can use to explore what changed on the Internet in 2020. Year In Review is part of Cloudflare Radar. We launched Radar in September 2020 to give anyone access to Internet use and abuse trends that Cloudflare normally had reserved only for employees.
Where people accessed the Internet
To get a sense for the Year In Review, let’s zoom in on London (you can do the same with any city from a long list of locations that we’ve analyzed). Here’s a map showing the change in Internet use comparing April (post-lockdown) and February (pre-lockdown). This map compares working hours Internet use on a weekday between those two months.
As you can clearly see, with offices closed in central London (and elsewhere), Internet use dropped (the blue colour) while usage increased in largely residential areas. Looking out to the west of London, a blue area near Windsor shows how Internet usage dropped at London’s Heathrow airport and surrounding areas.
A similar story plays out slightly later in the San Francisco Bay Area.
But that trend reverses in July, with an increase in Internet use in many places that saw a rapid decrease in April.
When you select a city from the map, a second chart shows the overall trend in Internet use for the country in which that city is located. For example, here’s the chart for the United States. The Y-axis shows the percentage change in Internet traffic compared to the start of the year.
Internet use really took off in March (when the lockdowns began) and rapidly increased to 40% higher than the start of the year. And usage has pretty much stayed there for all of 2020: that’s the new normal.
Here’s what happened in France (when selecting Paris) on the map view.
Internet use was flat until the lockdowns began. At that point, it took off and grew close to 40% over the beginning of the year. But there’s a visible slow down during the summer months, with Internet use up “only” 20% over the start of the year. Usage picked up again at “la rentrée” in September, with a new normal of about 30% growth in 2020.
What people did on the Internet
Returning to London, we can zoom into what people did on the Internet as the lockdowns began. The UK government announced a lockdown on March 23. On that day, the mixture of Internet use looked like this:
A few days later, the E-commerce category had jumped from 12.9% to 15.1% as people shopped online for groceries, clothing, webcams, school supplies, and more. Travel dropped from 1.5% of traffic to 1.1% (a decline of 30%).
And then by early mid-April E-commerce had increased to 16.2% of traffic with Travel remaining low.
But not all the trends are pandemic-related. One question is: to what extent is Black Friday (November 27, 2020) an event outside the US? We can answer that by moving the London slider to late November and look at the change in E-commerce. Watch carefully as E-commerce traffic grows towards Black Friday and actually peaks at 21.8% of traffic on Saturday, November 28.
As Christmas approached, E-commerce dropped off, but another category became very important: Entertainment. Notice how it peaked on Christmas Eve, as Britons, no doubt, turned to entertainment online during a locked-down Christmas.
And Hacking 2020
Of course, a pandemic didn’t mean that hacking activity decreased. Throughout 2020 and across the world, hackers continued to run their tools to attack websites, overwhelm APIs, and try to exfiltrate data.
Explore More
To explore data for 2020, you can check out Cloudflare Radar’s Year In Review page. To go deep into any specific country with up-to-date data about current trends, start at Cloudflare Radar’s homepage.
There is significant global attention around the upcoming United States election. Through the Athenian Project and Cloudflare for Campaigns, Cloudflare is providing free protection from cyber attacks to a significant number of state and local elections’ websites, as well as those of federal campaigns.
One of the bedrocks of a democracy is that people need to be able to get access to relevant information to make a choice about the future of their country. This includes information about the candidates up for election; learning about how to register, and how to cast a vote; and obtaining accurate information on the results.
A question that I’ve been increasingly asked these past few months: are cyberattacks going to impact these resources leading up to and on election day?
Internally, we have been closely monitoring attacks on the broader elections and campaign websites and have a team standing by 24×7 to help our current customers as well as state and local governments and eligible political campaigns to protect them at no cost from any cyberattacks they may see.
The good news is that, so far, cyberattacks have not been impacting the websites of campaigns and elections officials we are monitoring and protecting. While we do see some background noise of attacks, they have not interfered in the process so far. The attack traffic is below what we saw in 2016 and below what is typical in elections we have observed in other countries.
But there are still nearly two weeks before election day so our guard is up. We thought it was important to provide a view into how overall traffic to campaign and elections sites is trending as well as a view into the cyberattacks we’re observing. To that end, today we’re sharing data from our internal monitoring systems publicly through Cloudflare Radar. You can access the special “Election 2020” Radar dashboard here:
The dashboard is updated continuously with information we’re tracking on traffic to elections-related sites, both legitimate and from cyberattacks. It is normal to see fluctuations in this traffic depending on the time of day as well as when there will be occasional cyberattacks. So far, nothing here surprises us.
It’s important to note that Cloudflare does not see everything. We do not, for instance, have any view into misinformation campaigns that may be on social media. We also do not protect every state and local government or every campaign.
That said, we have Athenian Project participants in more than half of US states — including so-called red states, blue states, purple states, and several of the battleground states. We also have hundreds of federal campaigns that are using us ranging across the political spectrum. While we may not see a targeted cyberattack, given the critical role the web now plays to the election process, we believe we would likely see any wide-spread attacks attempting to disrupt the US elections.
So far, we are not seeing anything that suggests such an attack has impacted the election to date.
Our team will continue to monitor the situation. If any state or local elections agency or campaigns comes under attack, we stand ready to help at no cost through the Athenian Project and Cloudflare for Campaigns.
We could not have built Cloudflare into the company it is today without a stable, functional government. In the United States, that process depends on democracy and fair elections not tainted by outside influence like cyberattacks. We believe it is our duty to provide our technology where we can to help ensure this election runs smoothly.
Unlike the tides, Internet use ebbs and flows with the motion of the sun not the moon. Across the world usage quietens during the night and picks up as morning comes. Internet use also follows patterns that humans create, dipping down when people stopped to applaud healthcare workers fighting COVID-19, or pausing to watch their country’s president address them, or slowing for religious reasons.
And while humans leave a mark on the Internet, so do automated systems. These systems might be doing useful work (like building search engine databases) or harm (like scraping content, or attacking an Internet property).
All the while Internet use (and attacks) is growing. Zoom into any day and you’ll see the familiar daily wave of Internet use reflecting day and night, zoom out and you’ll likely spot weekends when Internet use often slows down a little, zoom out further and you might spot the occasional change in use caused by a holiday, zoom out further and you’ll see that Internet use grows inexorably.
And attacks don’t only grow, they change. New techniques are invented while old ones remain evergreen. DDoS activity continues day and night roaming from one victim to another. Automated scanning tools look for vulnerabilities in anything, literally anything, connected to the Internet.
Sometimes the Internet fails in a country, perhaps because of a cable cut somewhere beneath the sea, or because of government intervention. That too is something we track and measure.
All this activity, good and bad, shows up in the trends and details that Cloudflare tracks to help improve our service and protect our customers. Until today this insight was only available internally at Cloudflare, today we are launching a new service, Cloudflare Radar, that shines a light on the Internet’s patterns.
Each second, Cloudflare handles on average 18 million HTTP requests and 6 million DNS requests. With 1 billion unique IP addresses connecting to Cloudflare’s network we have one of the most representative views on Internet traffic worldwide.
And by blocking 72 billion cyberthreats every day Cloudflare also has a unique position in understanding and mitigating Internet threats.
Our goal is to help build a better Internet and we want to do this by exposing insights, threats and trends based on the aggregated data that we have. We want to help anyone understand what is happening on the Internet from a security, performance and usage perspective. Every Internet user should have easy access to answer the questions that they have.
There are three key components that we’re launching today: Radar Internet Insights, Radar Domain Insights and Radar IP Insights.
Radar Internet Insights
At the top of Cloudflare Radar we show the latest news about events that are currently happening on the Internet. This includes news about the adoption of new technologies, browsers or operating systems. We are also keeping all users up to date with interesting events around developments in Internet traffic. This could be traffic patterns seen in specific countries or patterns related to events like the COVID-19 pandemic.
Sign up for Radar Alerts to always stay up-to-date.
Below the news section users can find rapidly updated trend data. All of which can be viewed worldwide or by country. The data is available for several time frames: last hour, last 24 hours, last 7 days. We’ll soon make available the 30 days time frame to help explore longer term trends.
Change in Internet traffic
You can drill down on specific countries and Cloudflare Radar will show you the change in aggregate Internet traffic seen by our network for that country. We also show an info box on the right with a snapshot of interesting data points.
Most popular and trending domains
Worldwide and for individual countries we have an algorithm calculating which domains are most popular and have recently started trending (i.e. have seen a large change in popularity). Services with multiple domains and subdomains are aggregated to ensure best comparability. We show here the relative rank of domains and are able to spot big changes in ranking to highlight new trends as they appear.
The trending domains section are still in beta as we are training our algorithm to best detect the next big things as they emerge.
There is also a search bar that enables a user to search for a specific domain or IP address to get detailed information about it. More on that below.
Attack activity
The attack activity section gives information about different types of cyberattacks observed by Cloudflare. First we show the attacks mitigated by our Layer 3 and 4 Denial of Service prevention systems. We show the used attack protocol as well as the change in attack volume over the selected time frame.
Secondly, we show Layer 7 threat information based on requests that we blocked. Layer 7 requests get blocked by a variety of systems (such as our WAF, our layer 7 DDoS mitigation system and our customer configurable firewall). We show the system responsible for blocking as well as the change of blocked requests over the selected time frame.
Technology Trends
Based on the analytics we handle on HTTP requests we are able to show trends over a diverse set of data points. This includes the distribution of mobile vs. desktop traffic, or the percentage of traffic detected as coming from bots. We also dig into longer term trends like the use of HTTPS or the share of IPv6.
The bottom section shows the top browsers worldwide or for the selected country. In this example we selected Vietnam and you can see that over 6% of users are using Cốc Cốc a local browser.
Radar Domain Insights
We give users the option to dig in deeper on an individual domain. Giving the opportunity to get to know the global ranking as well as security information. This enables everyone to identify potential threats and risks.
To look up a domain or hostname in Radar by typing it in the search box within the top domains on the Radar Internet Insights Homepage.
For example, suppose you search for cloudflare.com. You’ll get sent to a domain-specific page with information about cloudflare.com.
At the top we provide an overview of the domain’s configuration with Domain Badges. From here you can, at a glance, understand what technologies the domain is using. For cloudflare.com you can see that it supports TLS, IPv6, DNSSEC and eSNI. There’s also an indication of the age of the domain (since registration) and its worldwide popularity.
Below you find the domain’s content categories. If you find a domain that is in the wrong category, please use our Domain Categorization Feedback to let us know.
We also show global popularity trends from our domain ranking formula. For domains with a global audience there’s also a map giving information about popularity by country.
Radar IP Insights
For an individual IP address (instead of a domain) we show different information. To look up an IP address simply insert it in the search bar within the top domains on the Radar Internet Insights. For a quick lookup of your own IP just open radar.cloudflare.com/me.
For IPs we show the network (the ASN) and geographic information. For your own IP we also show more detailed location information as well as an invitation to check the speed of your Internet connection using speed.cloudflare.com.
Next Steps
The current product is just the beginning of Cloudflare’s approach to making knowledge about the Internet more accessible. Over the next few weeks and months we will add more data points and the 30 days time frame functionality. And we’ll allow users to filter the charts not only by country but also by categorization (such as by industry).
Stay tuned for more to come.
The collective thoughts of the interwebz
Manage Consent
To provide the best experiences, we use technologies like cookies to store and/or access device information. Consenting to these technologies will allow us to process data such as browsing behavior or unique IDs on this site. Not consenting or withdrawing consent, may adversely affect certain features and functions.
Functional
Always active
The technical storage or access is strictly necessary for the legitimate purpose of enabling the use of a specific service explicitly requested by the subscriber or user, or for the sole purpose of carrying out the transmission of a communication over an electronic communications network.
Preferences
The technical storage or access is necessary for the legitimate purpose of storing preferences that are not requested by the subscriber or user.
Statistics
The technical storage or access that is used exclusively for statistical purposes.The technical storage or access that is used exclusively for anonymous statistical purposes. Without a subpoena, voluntary compliance on the part of your Internet Service Provider, or additional records from a third party, information stored or retrieved for this purpose alone cannot usually be used to identify you.
Marketing
The technical storage or access is required to create user profiles to send advertising, or to track the user on a website or across several websites for similar marketing purposes.