Modern media workflows don’t run on storage alone. They run on ecosystems—tightly integrated stacks of tools that ingest, process, analyze, move, review, and distribute content at scale. The companies we partner with aren’t just integrating with Backblaze; they’re building on it to solve real, specific problems that media teams face every day: archives that are impossible to search, file transfers that collapse over distance, review cycles that slow production to a crawl, compliance workflows that can’t keep up with library growth.
At NAB Show 2026, we’re bringing ten of those partners into booth N1259 to share what they’ve built. But the stories they’re telling aren’t just for Las Vegas—they’re for any media team trying to understand what a modern, cost-efficient, deeply integrated workflow actually looks like in practice.
Here’s a look at each partner, the problem they solve, and why it matters.
Imaginario AI: From Archive to Action
Presenter: Jose Puga, CEO and Co-Founder, Imaginario AI
Most video archives are passive. Content sits in storage, cataloged by someone who had time to do it years ago, effectively invisible to the people who could use it today. Imaginario AI flips that model.
Jose Puga’s session, “From Archive to Action: How AI Is Turning Your Video Library Into a Revenue Engine,” frames the shift from passive storage and cataloging to intelligent systems that actively surface, repurpose, and monetize content. The talk covers how marketing teams can accelerate campaigns, post-production teams can shortcut assembly, and compliance workflows can move from reactive to automated.
Imaginario is a multimodal video agentic platform that understands video in a human-like way—recognizing sounds, speech, and visual scenes without requiring time-based metadata. The platform is trusted by Warner Bros. Discovery, Sony Music, and Universal Pictures, and has won back-to-back IBC Best of Show honors in 2024 and 2025.
The Backblaze integration means content stays where it lives—no migration, no friction. As Jose puts it: “Backblaze provides our clients a scalable, reliable cloud layer that eliminates the friction of manual data transfers. Our native integration saves video teams dozens of hours by keeping content on Backblaze while unlocking high-speed AI analysis, retrieval, and repurposing in media and entertainment.”
Suite Studios: S3 Native File Streaming
Presenter: Jay Maxwell, Co-Founder & CPO, Suite Studios
Remote and distributed production teams have wrestled with the same problem for years: How do you collaborate on large media files when your team is spread across the globe? Suite’s answer is S3 Native File Streaming on Backblaze B2. The stack makes working with cloud object storage all-around easier, enabling teams to read and write data as standard objects without copying, syncing, or transferring.
Jay Maxwell’s session explores how global teams can instantly access and collaborate on large media files from anywhere—eliminating delays and accelerating production timelines. No syncing, no waiting, no workarounds. Just files that behave the way you need them to, wherever your team happens to be.
TwelveLabs: Unlocking Archive Value with Video AI
Presenter: Jordan Woods, Senior Solutions Architect, TwelveLabs
There’s a pattern across media organizations of all sizes: years of valuable archived content sitting effectively invisible because manual cataloging doesn’t scale. TwelveLabs makes that content searchable and monetizable.
Jordan Woods’ session, “Unlocking Archive Value with TwelveLabs Video Intelligence,” shows how pairing Backblaze’s cost-efficient storage with TwelveLabs’ video AI gives organizations a practical path to turn dormant archives into searchable, monetizable assets.
As Danny Nicolopoulos, Head of Strategic Partnerships at TwelveLabs, explains: “Media companies are sitting on years of valuable archived content that’s effectively invisible because manual cataloging doesn’t scale. Pairing Backblaze’s cost-efficient storage with TwelveLabs’ video AI gives organizations a practical path to turn those dormant archives into searchable, monetizable assets.”
Tillered: Full Speed Cloud Storage Over Any Distance
Presenters: Davey Goode, Founder & Stephen Ceci, Commercial Lead, Tillered
Physics is an undefeated opponent. Move data over long distances and throughput drops—no matter how fast your storage is or how much bandwidth you have. Tillered is built to remove that distance penalty.
The session, “Backblaze B2 Accelerate with Tillered: Full Speed Cloud Storage Over Any Distance,” demonstrates how the B2 Accelerate product brings Tillered’s acceleration technology to Backblaze B2, with transfers up to 34x faster as a result. No simulations—just live transfers with real results, showing what it looks like when enterprises can move data across any distance without adding bandwidth or changing workflows.
Davey Goode founded Tillered after repeatedly running into the same issue building large-scale connectivity infrastructure: No matter how much bandwidth was available, performance collapsed over distance. This session is the solution he built.
Telestream UP.Review: Decide Faster
Presenter: Sebastian Manemann, Senior Director of Product Management, Telestream
Capture, storage, and distribution have gotten faster. Review hasn’t kept up. Proxies, downloads, duplicated files—the approval workflow often undoes the speed gains made everywhere else in the pipeline.
Sebastian Manemann’s session, “Decide Faster: Real-Time Review, QC, and Delivery with Telestream UP.Review and Backblaze B2,” demos how Telestream UP.Review enables real-time, high-resolution playback and QC directly on media stored in Backblaze B2 without moving or duplicating files.
By keeping content in Backblaze as the central storage layer, teams can review instantly, validate quality, and move to delivery faster—all while maintaining a single source of truth across the workflow. As Sebastian frames it: “When you eliminate duplication and review directly from storage, you don’t just move faster—you operate smarter.”
Qencode + Sardius: A Multi-Vendor M&E Workflow in Practice
Presenters: Murad Mordukhay, CEO, Qencode, and Jason Shore & Ari Burt, Sardius Media
This one is different from the others—it’s not a product demo; it’s a case study. Sardius Media rebuilt their media pipeline around a race model: Multiple storage providers write in parallel, and the fastest result wins.
The session breaks down how Backblaze wins approximately 80% of those races, with Qencode orchestrating the encoding layer across the pipeline. It covers what the production data actually shows, and what Sardius would do differently if they were designing the workflow from scratch today.
Qencode uses machine learning to reduce file sizes by an average of 60% without sacrificing quality. Their CEO, Murad Mordukhay, sums up the partnership plainly: “The best partnerships are when two companies solve different halves of the same problem. Backblaze handles storage with the kind of reliability and transparency that perfectly aligns with how we think about transcoding. No surprises, no lock-in, just infrastructure that earns trust by performing every single day.”
Media workflows break down not just because of bad tools, but because of coordination failures between good ones. Files don’t sync. Teams duplicate work. Availability lags behind where content actually needs to be.
Christoph Jurkuhn’s session, “The Hidden Layer: Orchestrating Media Across the Stack with HiScale and Backblaze,” shows in a live demo how HiScale orchestrates media movement across distributed environments while Backblaze B2 provides the durable, scalable storage layer underneath. Files move, sync, and become available across teams and tools without delays, duplication, or manual intervention.
“Backblaze is built for straightforward, cost-efficient storage and HiScale builds on top of that to orchestrate and process your media. It’s a natural fit for modern media workflows.”
Iconik: Control Your Content
Presenter: Jeremy Strootman, Media Workflow Consultant, Iconik
At a certain scale, the problem isn’t creating content; it’s controlling it. Files get lost, search slows to a crawl, and archives become liabilities instead of assets.
Jeremy Strootman’s session, “Control Your Content: Turning Media Chaos into Operational Advantage,” demos how Iconik and Backblaze B2 give teams operational control over their media: making content instantly searchable, accessible, and reusable across the entire workflow.
With a foundational background in storage and archiving, Jeremy has spent over two decades helping content creators maximize efficiency and productivity across the entire media lifecycle, from ingest to archive. His perspective: “Backblaze gives us the scalable foundation; Iconik gives teams control over how that content is actually used.”
ToolsOnAir: Modern Broadcast Workflows on Backblaze
Presenter: Peter Steiner, Chief Business Officer, ToolsOnAir
Peter Steiner’s session, “Record, Store, Play: Modern Broadcast Workflows on Backblaze,” brings ToolsOnAir’s deep broadcast expertise to bear on what it looks like to build a complete ingest-to-playout workflow with Backblaze B2 as the storage foundation.
ToolsOnAir has been building Apple-based broadcast solutions for over a decade, with deployments across broadcast, ingest, and storage workflows worldwide. This session is for anyone running live or near-live operations who wants to understand what a modern, cloud-native broadcast stack actually looks like in practice.
The final session tackles a problem that’s only growing: As video libraries scale into the billions of assets, compliance workflows built for smaller operations don’t hold.
Ethan Steininger’s session, “What You Miss Can Cost You: AI-Powered Media Compliance at Scale on Mixpeek and Backblaze B2,” shows how Mixpeek’s multimodal AI infrastructure platform transforms unstructured content—video, images, audio, and documents—into searchable, programmable assets through a unified API.
Before founding Mixpeek, Ethan led search at MongoDB, and today Mixpeek powers enterprise workflows across media, adtech, healthcare, and brand safety, with core technology spanning feature extraction, multimodal retrieval, and a custom-built distributed vector store engineered for billion-scale workloads.
The Bigger Picture
Ten companies, one through-line: storage that integrates cleanly across the entire media stack changes what’s possible. As I put it in my article for Post Perspective:
What we are seeing is a broader realization that infrastructure decisions directly shape how teams build and operate. When pricing models penalize access or iteration, teams naturally limit how often they experiment or how much data they retain. That has a direct impact on product velocity and long-term value creation.
Backblaze didn’t have to react to this shift; it’s how we have always approached the market. Our cost model removes barriers like egress and transaction fees so teams can operate freely. That allows media organizations to focus on where value is actually created—whether that is content, audience engagement, or new AI-driven capabilities—while still maintaining craft excellence.
When your foundation is cost-efficient, S3-compatible, and built for reliability at scale, every tool in the ecosystem above it gets to do its best work. That’s what we mean when we talk about “building the future of media workflows”—not just that Backblaze stores your files, but that it enables the ecosystem built on top of it.
Join Us at NAB Show 2026
We’d love to show you around. Whether you want to catch one of the in-booth presentations, sit down for a workflow consultation, or talk through your specific storage and integration challenges, our team will be on-site all week.
OpenClaw crossed 250,000 GitHub stars in 60 days, surpassing React’s decade-long record to become the most-starred software project on GitHub. At GTC 2026, NVIDIA CEO Jensen Huang declared it “the operating system for personal AI” and told the room: “For the CEOs, the question is, what’s your OpenClaw strategy?”
At NVIDIA’s Hack for Impact hackathon at GTC, I built and watched engineers build autonomous agents on NemoClaw, OpenClaw, and Nemotron. Wildfire detection ingesting NASA satellite data. Crime pattern analysis across police jurisdictions. Energy grid anomaly forecasting.
The same architectural question surfaced in every project: agents that collect and generate data at scale need a deliberate strategy for archiving, retaining, and surfacing that data. Without one, agent-produced artifacts become dark data, generated but inaccessible, unversioned, and invisible to the rest of the organization. That question only gets more consequential in production.
Beyond NemoClaw’s runtime governance: Architecting for data persistence
NVIDIA’s NemoClaw wraps OpenClaw with security through OpenShell, a runtime that sandboxes each agent at the kernel level. Network requests, file access, and inference calls are governed by declarative YAML policy, enforced outside the agent’s process so the agent itself can never override them.
OpenClaw agents create workspace files (SOUL.md, USER.md, IDENTITY.md) that define the agent’s personality, preferences, and behavioral context. Inside a NemoClaw sandbox, this state lives in a Kubernetes Persistent Volume Claim inside an embedded K3s cluster, and the community is already asking for better backup and restore workflows on the NemoClaw GitHub repo.
At fleet scale, with dozens of agents each maintaining persistent memory, conversation history, and skill artifacts, a durable storage layer beneath the runtime is what keeps agent state from becoming disposable. What that layer looks like depends on the type of data your agents produce.
The agentic data layer
Two categories of data define the storage requirements for autonomous agents.
Operational artifacts
Autonomous agents generate reports, analyses, transformed datasets, alerts, and increasingly, multimodal outputs like processed video, audio, and images. Inside NemoClaw’s sandbox, filesystem access is confined to /sandbox and /tmp, both ephemeral by design.
Cloud storage decouples the artifact from the runtime, enables scoped access via URLs, and plugs into every major orchestration framework. Bucket-level permissions and scoped application keys extend governance into the storage layer, so each agent or agent class gets write access only to its designated output path.
Lineage matters here too: Each artifact should trace back to which agent, model, inputs, and policy produced it. Our GTC project, FireWatch, used Backblaze B2 exactly this way, uploading wildfire risk reports with a bucket-scoped key, generating shareable URLs, and embedding them directly in stakeholder alert emails.
State and compliance data
Agent memory, skill artifacts, and audit logs from policy decisions all require durable, long-term retention. NemoClaw’s privacy router splits inference between local and cloud models based on policy, generating routing metadata that compliance teams will want to retain and query. Cloud storage brings high durability, append-only immutability for audit trails, and lifecycle policies for tiered retention as data ages.
We built an open source OpenClaw plugin (openclaw-b2-backup) around this: Encrypted snapshots of agent config, memory, and sessions pushed to B2 on a daily cron, before compaction events, and on gateway shutdown. Three fields to configure, rollback from chat, one-command migration to a new machine.
The agent landscape is expanding. The storage pattern is consistent.
The open-source, autonomous AI agent ecosystem now spans at least 16 variants, each optimized for a different deployment context: NanoClaw for container-isolated security, ZeroClaw for edge deployment in a 3.4MB Rust binary, IronClaw for regulated industries through Trusted Execution Environments, managed platforms like ClawCloud and Maxclaw, and Qwen-Agent from Alibaba for the Chinese developer ecosystem.
Whether self-hosted or managed, all of them produce artifacts that need to persist beyond the runtime. Teams building autonomous agents for their organizations will need durable output sharing, state backup, and cross-agent data access regardless of which runtime they choose.
What enterprise AI leaders should build toward
Architect your agent data orchestration on cloud storage. As organizations scale from initial agent deployments to multi-team production workloads, data volume grows with every agent added, every week they run, and every modality they process. Agents gather, generate, and transform data continuously. Cloud storage gives you a durable layer for managing that lifecycle: ingestion and collection, versioned outputs, long-term archival, lifecycle policies for retention, and portability across agent platforms as your organization’s runtime choices evolve. Establishing this now, while the ecosystem is still forming, is the strategic move.
Automate agent state backup as part of your deployment standard. Agents building context across customer data, internal systems, and team workflows for weeks carry real operational value. Automated workspace snapshots protect that investment, create a disaster recovery path, and enable migration across environments.
Design for lineage and audit from day one. Policy decisions, tool invocations, inference routing, and multimodal processing chains all generate metadata. For enterprises operating under SOC 2, HIPAA, or GDPR, storing lineage and audit data alongside your artifacts in cloud storage means your compliance posture is ready before the audit, not after.
NemoClaw brought governance to the agentic stack. If your organization is deploying autonomous agents today, data orchestration and lineage are your next architectural decisions. Get them right early, and your agents scale with durable state, shareable outputs, and auditable history from day one.
Lots of us were taught that pi equals 3.14. Maybe 3.14159 if your teacher was ambitious. Akira Haraguchi, who holds the Guiness Book of World Records title for reciting the most digits of pi in a single run, got up to 100,000 digits in 16 hours.
That’s still only a fraction of the record digits of pi that are calculated—3.18471338 × 10⁻⁸% to be exact. So why do we need that much pi?
A pi record isn’t a burst workload. It’s a system that runs at sustained pressure for months, writing checkpoints, flushing buffers, and proving that nothing quietly breaks. Last December, StorageReview set a new record, calculating 314 trillion digits on a Dell PowerEdge R7725.
Pi has long served as a proving ground for computational systems because it offers a deterministic workload with clear correctness criteria and sustained compute and input/output (I/O) demands. Records in pi computation trace back decades and reflect both mathematical and computational advances. In 1949, ENIAC—the first programmable, electronic, general-purpose, digital computer—computed 2,037 digits of pi in about 70 hours, an early demonstration of electronic computing capability that was eventually published in the paper, “The ENIAC’S 1949 Determination of π.”
Algorithms have evolved significantly since then. The Chudnovsky algorithm, developed in 1988, is one of the fastest converging methods for high-precision pi calculation and has been used in many modern record attempts because of its efficiency at large digit counts.
Pi calculations do not mirror typical enterprise workloads such as databases or machine learning training, but their determinism and large scale make them useful for evaluating sustained performance of CPU, memory, and storage subsystems under continuous load. It’s also used in various security functions including random number generation (because computers can’t be truly random), cryptographic algorithms, hash functions, digital signatures, and secure communications protocols like SSL/TLS.
What the 314 trillion digit run represents
In December 2025, StorageReview reported a new record by calculating pi to 314 trillion digits on a single server that ran continuously for approximately 110 days before completion. The achievement emphasizes not only the scale of the computation but also the role of storage architecture, non-uniform memory-access (NUMA) tuning, and system stability in sustaining such a workload.
The raw output of the run, including checkpoints, extended beyond 2PB of data. The finalized dataset hosted in Backblaze B2 exceeds 130TB and is divided into 200GB objects suitable for staged retrieval.
What pi really looks like.
Engineers, researchers, and pi enthusiasts can freely retrieve their own slice of pi (or the whole thing) for analysis, performance characterization, and tool validation. Structuring the dataset into manageable objects enables selective download for analysis, parallelized workflow testing, and evaluation of sustained object retrieval performance.
How to access the dataset
The 314 trillion-digit dataset is available today via Backblaze B2 Cloud Storage.
Submit the required information to receive credentials.
Use the provided instructions to download via rclone, an open-source cloud storage management tool.
The object layout supports both partial and full dataset retrieval strategies.
Enjoy your pi!
With all the ways you can use the pi dataset, we can’t wait to hear what you all are working on. Feel free to let us know what you’re working on in the comments section below, on socials, or by email.
When AWS’s us-east-1 region went down for over 15 hours on October 20, 2025, the cascade of failures exposed just how fragile the internet’s infrastructure has become. Major services like Discord, Slack, Atlassian, and parts of Netflix suddenly went dark. These companies weren’t all direct AWS customers, but the vendors they relied on were. Authentication systems failed. CDNs stopped responding. Monitoring tools went blind. Companies that thought they’d diversified their cloud strategy discovered their backups were just as offline as their primary systems.
The solutions organizations thought they’d implemented, like multi-cloud deployments, redundant architectures, and disaster recovery plans, often provide little more than the illusion of protection.
The illusion of diversification
A company migrates its primary compute workload from AWS to Google Cloud or Azure, checks the “multi-cloud” box, and considers the job done. But authentication still runs through AWS Cognito. The CDN is CloudFront. Monitoring lives in CloudWatch. DNS resolution depends on Route 53. When AWS’s control plane fails, the entire architecture collapses regardless of where the compute actually runs.
ThousandEyes documented exactly this pattern during the October 2025 AWS outage. Packet loss and routing instability affected direct AWS customers and cascaded into dependent networks and services that appeared independent on paper, but shared the same regional infrastructure under the hood. Organizations often discover these dependencies only during outages, when it’s too late to do anything about them.
Why concentration accelerates despite known risks
Everyone knows concentration is dangerous, yet it keeps accelerating. The same forces that make hyperscalers attractive—operational simplicity, unified tooling, procurement efficiency—concentrate risk faster than diversification efforts can mitigate it.
Teams often adopt unified tooling for operational simplicity, which reduces integration costs and builds vendor-specific expertise. As more systems integrate with that tooling, switching costs increase. Eventually, the platform becomes the default rather than a choice. Each new service added to the stack makes it harder to leave.
Hyperscaler architecture isn’t just a risk, it’s a cost
Amplify’s AWS egress fees were growing to 10x their storage costs as customers downloaded more datasets. CTO Ameya Pathare evaluated Azure, Google Cloud, Digital Ocean, and Wasabi before building a modular architecture: Snowflake for data transformation and Backblaze B2 for staging, with outputs available across Google BigQuery and Tableau.
The two-week migration with zero downtime delivered 70% cost savings that compound with every download. When individual providers experience issues, customers maintain access through alternative paths. “If we had stayed on AWS, we’d have needed to change our pricing and pass on those egress fees to the customer,” Pathare says.
Diversification efforts lag behind because they require deliberate architectural decisions that run counter to operational efficiency. According to the CNCF’s 2025 State of Cloud report, 30% of organizations deploy to hybrid cloud environments and 23% to multi-cloud. That sounds encouraging until you look at what they’re actually distributing. Most organizations spread their compute across providers while consolidating authentication, orchestration, and monitoring with a single vendor. Deployment location differs from dependency structure.
Gartner projects that 90% of organizations will adopt hybrid cloud approaches by 2027. But without intentional failure domain separation, these deployments maintain the same concentrated dependencies they’re meant to avoid.
Why untested recovery paths fail
Most organizations treat failover mechanisms like insurance policies: pay the premium, file the documentation, and hope you never need to use it. Then an outage hits and they discover their recovery paths don’t actually work.
Google’s SRE team analyzed this pattern in their twenty-year retrospective: “Recovery mechanisms that are not tested before an incident routinely fail when they are needed most.” Configuration drift makes systems behave differently in production than they did in testing. Teams encounter unfamiliar tooling under pressure. Communication systems fail because they rely on the same infrastructure that’s down.
Three practices separate resilient systems from brittle ones:
Explicit failure domain mapping: Document which components fail together, including indirect dependencies. During Google’s 2017 OAuth incident, teams assumed Hangouts and Meet would remain available for coordination during the recovery. Both services relied on the failing authentication system.
Continuous exercised recovery: Failover paths tested regularly rather than only during incidents. YouTube’s 2016 caching failure required risky load-shedding operations that had never been practiced outside staging environments.
Graceful degradation by design: Systems intentionally reduce functionality rather than collapse completely. Without this capability built in and tested, systems crash entirely instead of slowing down when they encounter partial failures.
Most organizations implement sophisticated monitoring and alerting but lack tested mechanisms to act on that information when infrastructure degrades.
How modular infrastructure reduces risk
Resilient architectures break infrastructure into interoperable components from specialized providers. Organizations can select compute, storage, networking, and delivery independently based on performance and reliability characteristics. A disruption in one layer no longer automatically incapacitates the entire system.
Cloudflare’s October 30, 2023 incident demonstrates what happens when this separation doesn’t exist. A deployment misconfiguration propagated across tightly coupled internal services. Workers KV became unreachable, which cascaded into failures across Pages, Access, Zero Trust, Images, and the Cloudflare Dashboard itself. Shared tooling and control systems collapsed multiple services into a single failure domain, even within a provider marketed as redundant.
Sardius Media demonstrates what modular cloud infrastructure looks like in practice. The company architected its system from inception to be cloud-agnostic, using a race algorithm that queries multiple cloud providers and CDNs for every API call and selects the fastest response. True resilience through competitive redundancy.
The data layer as a gating factor
Storage architecture determines whether all this architectural planning actually works. Can your data move when you need it to? The answer depends on whether systems can replicate and recover across providers under real-world conditions.
Control-plane access matters more than data replication. During Google Cloud’s June 2025 API misconfiguration, Gmail, Spotify, and Cloudflare went dark despite having intact data layers. Replication across availability zones provided no protection when authentication and API access failed.
Three technical barriers trap workloads in place:
Large dataset transfer costs make migration prohibitively expensive.
Proprietary vendor APIs create application lock-in that requires substantial refactoring to escape.
Unpredictable egress charges turn what was supposed to be a temporary deployment into permanent infrastructure because moving the data out costs more than leaving it there.
Storage architectures that support open APIs, predictable pricing, and cross-provider replication enable genuine mobility. Systems can replicate data across providers, recover faster from incidents through parallel data access, and maintain portable compute and delivery layers. Implementation requires mapping both direct dependencies (compute, storage, CDN) and indirect ones (managed services that converge on the same infrastructure), then assigning explicit recovery requirements to critical workloads.
From scattered clouds to a united front
The internet’s reliability challenges stem from correlated dependencies rather than cloud technology. Neocloud ecosystems make resilient architectures achievable by promoting specialization and interoperability.
Organizations can select best-of-breed providers for each infrastructure layer—compute, storage, networking, delivery—without forcing everything through a single vendor’s control plane. Open cloud storage ensures those ecosystems remain flexible under pressure, with data that can replicate across providers, portable applications that aren’t locked into proprietary APIs, and predictable costs that don’t trap workloads in place.
The result is systems that continue operating when individual providers fail. They’ve ensured that failures remain isolated rather than cascading across the entire architecture.
There’s a new open-source plugin that snapshots your OpenClaw config, memory, and sessions to B2. It’s designed to be as simple as possible: Three fields to configure. Rollback from chat. Migrate to a new machine in one restart.
Let’s get into how and why you might want to use it.
OpenClaw keeps everything local. That’s great until it isn’t.
Your config, sessions, memory databases, hooks, cron jobs—everything that makes your OpenClaw instance yours lives on one machine with no built-in redundancy. Compaction can rewrite session transcripts and cause memory loss. A bad config edit or an accidental deletion means rebuilding from scratch: re-onboarding channels, re-pairing devices, re-teaching your agent who you are.
openclaw-b2-backup adds automatic encrypted backups to Backblaze B2 without changing how you use OpenClaw.
Three fields and you’re done
Setup is intentionally minimal:
openclaw plugins install openclaw-b2-backup
Then open ~/.openclaw/openclaw.json and add your B2 credentials to the entry the installer created:
Restart the gateway, and you’re done. Region is auto-detected from your application key. Encryption is on by default. The first backup runs at midnight, and then daily after that. You can change the schedule to weekly or any cron expression you like.
Free tier friendly: Backblaze B2 includes 10GB of free storage. A typical OpenClaw state directory is 50–500 MB, so even with 10 encrypted snapshots retained, you’ll comfortably stay within the free tier.
Backups that actually happen
The hardest part of any backup system is remembering to run it. This plugin takes care of that with multiple automatic triggers:
A daily cron job (configurable) runs a full incremental push at midnight.
Every time you shut down the gateway, a final push runs before exit—so you always have a snapshot of your latest state.
And, before compaction fires (the thing that rewrites your session transcripts and can cause memory loss), the plugin automatically pushes a snapshot. That last one is the one you’ll be most grateful for.
There’s a 5-minute debounce on the compaction trigger, so rapid-fire compactions don’t queue up a dozen pushes.
Rolling back from chat
The plugin registers a b2_rollback tool with your agent, which means you can manage backups conversationally. Just tell your agent:
“Show me my B2 backup snapshots”
And it’ll list all available snapshots with timestamps. To restore one:
“Roll back to the snapshot from before compaction”Before any restore, the plugin automatically creates a safety snapshot of your current state. Safety snapshots are stored separately and never auto-pruned, so you can always recover from a bad rollback. It’s an undo for your undo.
Moving to a new machine
This was one of the most requested use cases: Getting your entire OpenClaw setup onto a new machine without manually copying files and hoping you got everything.
Install the plugin on your new machine, add the same B2 credentials, and restart. The plugin detects the empty state directory, finds your existing snapshots in B2, and automatically restores the latest one. Same memory, same sessions, same config, same personality. No manual file copying.
openclaw plugins install openclaw-b2-backup
# Add your B2 config to openclaw.json
openclaw gateway restart
# Plugin detects empty state + existing snapshots → auto-restores latest
Security by default
Everything is AES-256-GCM encrypted before it leaves your machine. Each file gets a random salt and IV, so identical files produce different ciphertext. The encryption key is derived from your B2 application key via scrypt—no separate key to manage or lose.
Manifests (which contain only file paths and SHA-256 hashes) stay unencrypted so incremental diffing works regardless of encryption. Credentials and auth profiles are excluded from sync by design—secrets stay per-machine, and you re-auth on new machines.
Best practice: Use a B2 application key scoped to a single bucket for least-privilege access. The plugin works perfectly with bucket-scoped keys—region is auto-detected from the authorize response.
Zero external dependencies
The plugin has no external runtime dependencies beyond croner for scheduling. The B2 client is a hand-rolled AWS Signature V4 implementation using only node:crypto. No AWS SDK, no S3 library, no heavyweight dependencies to audit or keep updated.
It runs entirely inside the gateway process—no external scripts, no separate cron daemon, no stopping the gateway to take backups.
Get started
The plugin is open source (under the MIT license) and available now:
Every neocloud in the market right now is winning or losing on the same battlefield: GPUs. Availability, performance, price per hour. That’s the game, and it’s the right game to play.
But there’s a problem compounding underneath it, one that doesn’t show up in benchmark reports or investor decks, and one that customers will eventually force platforms to confront—neoclouds need highly available, performant storage so that GPUs are never waiting on data.
Neocloud customers need more than compute
Cloud storage isn’t adjacent to what neoclouds sell—for buyers, it’s the difference between a complete platform and a partial one. Neocloud customers need:
Somewhere to put a 10PB training dataset before it touches WEKA, VAST, or DDN boxes
Persistent storage for model checkpoints between training runs
A place for production inference pipelines to pull weights from at scale, fast enough that GPU nodes aren’t sitting idle waiting on data
Most platforms know this. The ones that are honest about it will also tell what happened when they tried to solve it: Engineering sprints planned around storage tooling that competed directly with GPU roadmap work. Ops overhead for infrastructure that customers take for granted when it’s working and blame the platform for when it’s not. Capital allocated to storage hardware and the teams to manage it.
The platforms that figured this out first didn’t hire their way through the problem. They stopped building storage and started shipping it.
Introducing B2 Neo
That’s the insight behind Backblaze B2 Neo. We built it in direct collaboration with the neocloud operators already utilizing Backlaze in production. The result is a white label cloud storage backbone that neoclouds can launch as a native extension of their platform. Here’s what that means in practice:
Up to 1Tbps throughput: Storage that keeps GPU clusters fed and AI workflows moving without becoming the bottleneck.
Launch under your own brand: Branded endpoints, partner-controlled pricing, and a native customer experience that keeps the platform front and center.
API-driven provisioning: Provision accounts, manage permissions, and handle billing through existing platform tools without a separate console or manual setup.
17 years of operational maturity and exabyte scale expertise: Enterprise durability and reliability that customers expect, operated by Backblaze so internal teams don’t have to.
It doesn’t require a storage team. It doesn’t compete with the GPU roadmap. And it doesn’t route customers away from neocloud platforms where their workflows slowly migrate away.
Already in production with leading platforms
Multiple neoclouds are already using B2 Neo. It’s infrastructure that’s already handling AI training workloads, high performance compute (HPC) pipelines, and media delivery at scale and the platforms already running it are direct about why they made the call.
One global edge services platform, after a rigorous technical and business evaluation, put it this way: Their customers were demanding cost-effective yet performant storage as their AI business scaled and Backblaze gave them the ability to deliver cloud object storage as a native extension of their own platform without taking focus away from their roadmap.
Rob Strechay, Principal Analyst at Smuget & theCUBE Research, framed it simply:
With B2 Neo as a first-party service offering to neoclouds, I see the advantage for those organizations of being able to turn on cloud storage without the toil and expense of building it themselves. It is a near-instant value-add offering, helping their customers control costs and achieve the ROI of AI faster.
The question for the rest of the market is how many more quarters of DIY storage ops—or hyperscaler dependency—they can absorb while competitors ship that outcome instead.
B2 Neo is available now. If you’re building a neocloud and storage is either a distraction or a gap, I’d encourage you to talk to us.
The Backblaze Flameflower Startup Program is here, and it’s built by people who’ve been burned before (and that’s a good thing for you).
Startups don’t fail because they pick the wrong cloud storage provider.
They fail because everything else is already hard enough, and infrastructure quietly becomes the thing that slows them down, surprises them, or blows up their budget at exactly the wrong moment.
That’s why we’re launching Flamethrower, the new startup program from Backblaze.
It’s not a gimmick. It’s not a lead trap. And it definitely doesn’t bring the “here’s some credits, good luck” energy.
Flamethrower exists for one simple reason: Founders deserve storage infrastructure that helps them move faster, not learn expensive lessons the hard way.
Why Flamethrower exists
Why Flamethrower?
Startups don’t need more friction, they need a way through it. Metaphor-wise, flames have always been a part of Backblaze’s DNA, and we want this program to speak to the strongest parts of that fire: speed when you need it, reliability when it counts, and power to scale without drama.
Flamethrower takes these ideas and applies it directly to startups, burning away the biggest blockers between you and your next milestone.
I’ve spent most of my career in and around startups, as a founder, an operator, a partner, a mentor, and occasionally as the person explaining to a CFO why last month’s cloud bill looked like a typo.
I’ve seen the pattern repeat over and over:
Early teams optimize for speed (correct)
Infrastructure decisions get made quickly (also correct)
Those decisions quietly become very sticky
And later… someone realizes storage costs are now a board-level discussion
Flamethrower is designed to meet teams before that moment, making your architecture deliberate, not accidental.
Not with abstract promises, but with:
Real infrastructure used in real production environments
Credits that actually help you get to product-market fit
And access to real, live humans who understand what it’s like to build under pressure
Documentation should be written by people who actually use the product
And success shouldn’t be punished with surprise bills
That mindset is exactly why Flamethrower fits here.
This isn’t a side project. It’s an extension of how Backblaze already works with developers and builders, just with a little more gas on the fire (if you will).
I’ve spent years building and running startup programs, developer ecosystems, partnerships, and learning, sometimes painfully, what not to do. I’ve been on the receiving end of “exciting programs” that turned out to be mostly slide decks.
Flamethrower is my attempt (with a very smart team) to build the kind of program I wish existed when I was earlier in my career: practical, honest, and actually useful.
No heroics. No silver bullets. Just support where it counts.
This year marks 13 years of collecting Drive Stats data. Thirteen is an unlucky number (to some), but we count our lucky stars (or perhaps our lucky stats?) that we’ve had 13 years of this experiment.
The traditional 13-year anniversary gift is lace—intricate, impressive, and vulnerable to a snag if you don’t plan ahead to protect the pattern. Systems, like lace, don’t survive by pretending there are no points of vulnerability. When it comes to our infrastructure, we want to build with the snags in mind to create something durable, and the Drive Stats series is always seeking to publish and provide data so that you, too, can go the distance with your drives.
This year-end Drive Stats report looks at Q4 2025, the full year, and the lifetime view with that in mind. I think you’ll find the same things we do: over time, the patterns matter more than any single strand (or drive, to run this lace metaphor into the ground once and for all). Let’s look at the stats.
Drive Stats is here for you
Drive Stats is not a situationship. We’re a conversation and a relationship—to the data. Join the Drive Stats team for our regularly scheduled webinar to walk through the 2025 annualized failure rates, break down the data for interesting trends, and get the latest from the Backblaze drive fleet happenings.
Drive Stats: The digest version
Q4 2025 hard drive failure rates
As of the end of 2025, Backblaze was monitoring 341,664 drives used to store data. For our evaluation, we removed from consideration 4,013 boot drives and 459 hard drives, as they did not meet the criteria to be included. We’ll discuss the criteria we used in the next section of this report. Removing these drives leaves us with 337,192 hard drives to analyze. The table below shows the annualized failure rates for Q4 2025 for this collection of drives.
Backblaze Hard Drive Failure Rates for Q4 2025
Reporting period October 1, 2025–December 31, 2025 inclusive Drive models with drive count > 100 as of December 31, 2025 and drive days > 10,000 in Q4 2025.
Note and observations
New drives!
Seagate ST16000NM000J 16TB, with 112 drives
WDC WUH722626ALE6L4 26TB with 1,201 drives. Our first 26TB drive!
The honor roll:
HGST HMS5C4040BLE640 4TB: 1 failure
Seagate ST8000NM000A 8TB: 0 failure
Seagate ST12000NM000J 12TB: 1 failure
Seagate ST16000NM000J 16TB: 1 failure
Seagate ST16000NM002J 16TB: 0 failure
WDC WUH722626ALE6L4 26TB: 1 failure. Shoutout to the new kid—starting off strong!
Red flags:
HGST HUH728080ALE600 8TB: 10.29%
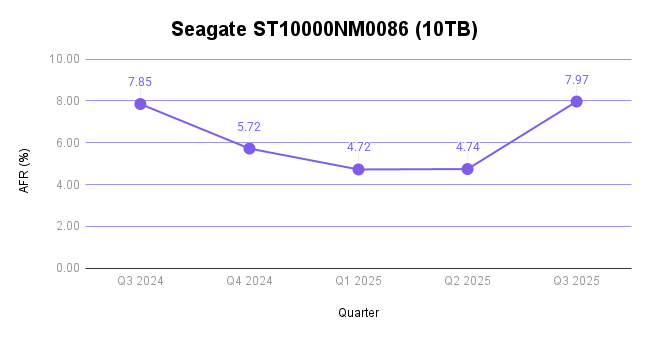
Seagate ST10000NM0086 10TB: 5.23%
Toshiba MG08ACA16TEY 16TB: 4.14%
We talked about two of these drives last quarter, and what we said about the Seagate still holds true—we’re seeing end of life activity with this drive. But, let’s dig in on the 8TB HGST and 16TB Toshiba and see what’s going on.
HGST HUH728080ALE600 8TB
There’s always some digging to be done when we see a double digit failure rate, especially on a drive that, in the past year, hasn’t had terrible failure rates (despite the fact that it’s about 7.5 years old).
It’s worth contextualizing, first, that the total drive count of this model is 1,073, which equates to less than one Vault. (A standard Vault has 1,200 drives.) While Vaults aren’t always the same drive model, especially with older drives, in an ideal world, those Vaults would be uniform. So, in this case, we’re dealing with drives that are all hanging out in the same location in a data center, which means we could be working with environmental factors like a change in temperature or airflow.
By the time Drive Stats data gets to me, of course, lots of smart people have already seen the disturbances in the force, so to speak. When I dug into the data center work tickets, it turned turned out that folks had already ruled out temperature as a factor—the working theory at the moment is that the drive could be sensitive to vibration, but given the age of these drives, we decided to just flag them for our normal CVT migration process.
Toshiba MG08ACA16TEY 16TB
We talked about this model last quarter because it clocked in at a 16.95% AFR (!!). Our investigation turned up some collaborative (and routine) firmware work with Toshiba, and at that time, we predicted that these failure rates would normalize once again. We’re still a little high, but that’s likely a function of rolling out the work. As predicted, this is a healthy normalization.
Defining the relationship, aka setting some boundaries
We’ve covered the reasons that we’ve designed these exclusions in past reports, but here’s the quick and dirty:
Period
Drive Count
Drive Days
Quarterly
> 100
> 10,000
Annual
> 250
> 50,000
Lifetime
> 500
>100,000
Regardless of whether or not a given drive model is included in this article’s charts and tables, all of the line item data is included in our Drive Stats dataset which you can download by visiting our Drive Stats page.
2025 Annual hard drive failure rates
As of the end of 2025, Backblaze was monitoring 349,462 hard drives used to store data. We removed 4,176 boot drives and 1,090 hard drives from consideration as they did not meet the annual criteria we have defined. This leaves us with 344,196 drives divided across 30 different drive models. The table below shows the AFRs for 2025 for this collection of drives.
Backblaze Hard Drive Failure Rates for 2025
Reporting period January 1, 2025–December 31, 2025 inclusive Drive models with drive count > 250 and drive days > 50,000 in 2025
Notes and observations
The annual AFR is down: This year finishes strong at 1.36%, down from 1.55% in 2024. Still those paying attention to the quarterly AFR have seen some volatility in that number.
Nobody made it out unscathed: There are zero 0 failures.
But, let’s talk about it: These are the drives that averaged less than two failures per quarter (though, not necessarily evenly distributed when you look at the data).
HGST HMS5C4040BLE640 4TB: 5 failures
Seagate ST12000NM000J 12TB: 4 failures
Seagate ST14000NM000J 14TB: 7 failures
Seagate ST16000NM002J 16TB: 1 failure
Toshiba MG09ACA16TE 16TB: 3 failures
WDC WUH722626ALE6L4 26TB: 1 failures.
Note that this drive is in its first quarter of life, so it’s hard to call this significant yet.
And, all those drive tickets and models mean lots and lots of work—we wrote a whole article on that front, but here’s a breakdown of hours spent in each data center.
And here’s an even more interesting slice, from a drive perspective:
Yes, you’ll see some funky drive sizes on that list; it’s inclusive of all of our drives, not just the hard drives we include in this report.
Comparing Drive Stats for 2023, 2024, and 2025
Let’s take a look back at the previous years’ annual AFRs to get a sense of how 2025 compares:
Three Year Comparison of Annual Backblaze Hard Drive Failure Rates
For drive models with > 250 drives as of 12/31/25 and drive models with > 50,000 drive days in 2025 Data for each year is inclusive of that year.
Notes and observations
The annual AFR is down to 1.36%. We haven’t seen those numbers since 2022 (1.37%). Cool!
Slicing our data by drive size shows how impactful the shift to high capacity drives really is: based on the current quarterly data, our drive size breakdown looks like this:
0–12TB: 25.13%
14–16TB: 52.06%
20TB+: 22.81%
This is an already long report, so in the interest of time, we’ll just say this: There are multiple factors that go into how and why things are changing, including the average age of drives within our cohort, how much drive technology has improved over the years, how drives on the market have gotten bigger over time while the cost per GB has also dropped, and how the current demand for drives has been changing some of those things.
If that sentence sounds confusing, welcome to the world of enterprise drive buying. But, as always, we have to contextualize the real data we see with the way we source and use drives.
Lifetime hard drive failure rates
Backblaze Lifetime Hard Drive Failure Rates
Reporting period ending December 31, 2025 inclusive Drive models with > 500 drives and > 100,000 lifetime drive days
Notes and observations
Ol’ faithful: Lifetime AFR is 1.30% this quarter, and there’s been no significant change in that number for quite some time.
Say hi to the new guy: The Toshiba MG11ACA24TE 24TB made the cut for the lifetime table. Last quarter, we deployed another 2,400 of these, bringing us to 4,806 drives total.
The Hard Drive dataset (and beyond)
Thank you, as always, for making it through ~2,500 or so words to examine the fun side of data. Here’s our standard fine print:
The complete dataset used to create the tables and charts in this report is available on our Hard Drive Test Data page. You can download and use this data for free for your own purpose. All we ask are three things:
You cite Backblaze as the source if you use the data;
You accept that you are solely responsible for how you use the data, and;
You do not sell this data itself to anyone; it is free.
If you’re a new Drive Stats fan, consider signing up for the newsletter. If you’re not ready for that kind of commitment, sound off in the comments section below or reach out directly to us to let us know what you’re working on. Happy investigating!
As data footprints swell and multi-cloud strategies become the norm, the complexity of managing object lifecycles—from initial creation to eventual archival or deletion—can introduce significant risk and operational overhead. To help our customers solve for this, we recently announced support for lifecycle rules through S3-compatible APIs.
While the previous post focused on what the feature enables and why it matters, this follow-up will look at how lifecycle rules work at a deeper level and what to keep in mind when using them in production.
Why S3 compatible lifecycle rules matter
Let’s quickly refresh your memory about why this feature matters. Many customers already rely on lifecycle rules in Backblaze B2 to manage storage costs and data retention. These rules automate actions like deleting old objects, hiding previous versions, or cleaning up incomplete multipart uploads.
By adding S3 compatible support for lifecycle rules in Backblaze B2, it allows you:
Lift and shift migrations from AWS S3 to Backblaze B2
Reuse of existing tools, xml configurations, scripts, applications & infrastructure as code
Predictable behavior across environments as part of multi-cloud strategy
API surface area and XML structure
Lifecycle rules are managed using three APIs:
PutBucketLifecycleConfiguration
GetBucketLifecycleConfiguration
DeleteBucketLifecycleConfiguration
These APIs accept and return XML documents that follow the AWS S3 lifecycle configuration format. From a client perspective, this behaves the same way it does on S3, including rule IDs, status flags, filters, and actions.
Example put lifecycle request
Below is a simple example that hides objects under the logs/ prefix after 30 days.
PUT /?lifecycle HTTP/1.1
Host: my-bucket.s3.us-west-004.backblazeb2.com
Content-Type: application/xml
At evaluation time, B2 walks object versions in order and applies rules like this:
Pseudo code:
for each object in bucket:
  for each version of object with data prefix:
    if version is non current:
      if age_in_days >= NoncurrentDays:
        delete version
For current versions, expiration works differently.
Expiring the current version
When a lifecycle rule expires the current version, B2 creates a hide marker instead of deleting data immediately.
This matches S3 semantics and preserves version history.
current version expired
        |
        v
hide marker created
        |
        v
current version becomes non current
Overlapping and nested prefix rules
Backblaze B2 supports multiple lifecycle rules on the same bucket, including overlapping and nested prefixes.
For example, you might configure:
A general rule for logs/ that deletes objects after 365 days
A more specific rule for logs/audit/ that deletes objects after 90 days
When rules overlap, the configuration with lowest value is applied to save cost to you. This mirrors S3 behavior and allows fine grained control without duplicating buckets.
Matching logic:
object path: logs/audit/2024/01/file.json

matching rules:
- logs/
- logs/audit/

selected rule:
- logs/audit/ because it has lowest value, 90 days
Multipart upload cleanup
Lifecycle rules can also be used to abort incomplete multipart uploads if not completed in a certain number of days. This is implemented by tracking the initiation time of multipart uploads and periodically removing uploads that exceed the configured threshold. This helps prevent abandoned uploads from consuming storage indefinitely.
Below is an example rule to delete multipart uploads that are not completed after seven days after starting the upload process.
Multipart uploads are tracked with their initiation timestamp.
Pseudo code:
for each multipart_upload:
  if now - initiation_time >= DaysAfterInitiation:
    abort upload
    delete uploaded parts
Lifecycle execution model
Lifecycle rules are not executed in real time. Instead, they are evaluated by background processes that scan eligible objects and apply actions asynchronously.
Important characteristics:
Rules are not evaluated in real time
Execution is eventually consistent
Large buckets may take multiple passes to fully apply changes
This design allows lifecycle processing to scale across billions of objects efficiently without impacting foreground operations.
High level execution flow:
scan bucket periodically
   |
   v
identify eligible objects
   |
   v
apply lifecycle actions (hide and/or delete)
   |
   v
record progress and continue
Error handling and validation
Lifecycle XML is validated using S3 compatible rules:
Invalid combinations of actions are rejected
Missing required fields return errors
Unsupported actions return descriptive failures
While error messages may differ slightly from AWS, the validation logic follows the same constraints.
Compatibility considerations
While the goal is strong S3 compatibility, there are still some things to keep in mind:
Not all S3 lifecycle actions are supported yet
XML validation follows S3 rules, but error messages may differ slightly
The underlying storage model of B2 can affect timing and visibility
We recommend testing lifecycle rules in a non production bucket before rolling them out broadly.
Final thoughts
Adding S3 compatible support for lifecycle rules on Backblaze B2 was all about making migrations simpler and letting customers reuse existing automation with confidence. It behaves the way you expect while benefiting from B2’s internal scalability.
If you already manage lifecycle rules using S3 APIs, those same configurations can now run on Backblaze B2 with minimal or no changes.
Welcome to our second quarterly Network Stats report covering Q4 of 2025. Along with Drive Stats and Performance Stats, Network Stats pulls back the curtain on real-world infrastructure data, particularly how network-level analytics reflect emerging AI industry trends and usage patterns.
Get more Network Stats (and the details of the dataset)
If you are curious about what metrics we’re recording and how we classify data in this series, check out the details outlined in our Q3 2025 Network Stats report.
One of the roles of the Network Engineering (NetEng) team at Backblaze is to monitor how traffic moves into, out of, and across our platform—not just day-to-day, but over time as customer behavior and industry dynamics evolve. Right now, few forces are reshaping networks faster than AI.
With the launch of B2 Overdrive in April 2025, we built a direct, high-performance path between our storage layers and neoclouds where processing, inference, and modeling take place. It has given us a front-row seat to the impact of AI and how network behavior is changing with it. This quarter, in addition to our regular data analysis, I’ll walk through where AI-driven traffic is concentrated, how ingress and egress patterns showed up, and what the findings say about where AI infrastructure might be headed next.
Continue the conversation
Join us live for the Q4 2025 Network Stats webinar Wednesday, February 4, 2025 at 10:00 a.m. PT / 1:00 p.m. ET. We’ll explore where AI traffic concentrates, how high-magnitude data flows behave, and what early indicators suggest about the future of AI-native infrastructure design.
Can’t make it live, or reading this article after-the-fact? Sign up anyway and catch the recording on demand.
Brave new market
AI workflows don’t just need a place to store data, they need to be able to move it quickly, easily, and nearly constantly for short bursts. Large, multi-petabyte datasets are ingested, transformed, exported for training, pulled back for evaluation, and periodically refreshed as models evolve.
Backblaze plays a key role at both ends of that lifecycle. We serve as a durable storage layer for the initial data ingestion, and as the high-throughput source feeding model training, evaluation, and validation to whatever best neocloud is suitable at the moment. Once that model has been trained, it needs to be stored, served, and periodically retrained, where we serve as the storage medium.
This quarter, we saw a large amount of traffic between Backblaze, neoclouds, and traditional hyperscalers for processing concentrated across the months of June to November. This reflects large-scale ingestion events followed by intensive data manipulation and model-related egress.
From a network perspective, this represents a meaningful shift from diffuse, internet-style traffic patterns to large, high-bandwidth flows between a smaller set of endpoints typical of AI-centric infrastructure.
The neocloud slice
The defining theme of the quarter is “new:” new AI-oriented workflows, new traffic patterns, and leading indicators of new infrastructure trends.
The stacked area graph below shows total traffic by network type over time. While content delivery network (CDN), hosting, and internet service provider (ISP) traffic stayed largely within historical norms reflecting steady-state usage patterns like content delivery, web hosting, and traditional backup workflows, two slices stand out:
Migration traffic: We saw a notable increase in migration traffic from August through October. This classification reflects an influx of data into our network over fiber connections we have in the data centers to cost effectively migrate large amounts of data over private links, not using the public Internet.
Neocloud traffic: We saw a sharp increase in July through November, peaking in October.
Monthly view of all bits transferred to each network type
What do we think is happening? Taken together, these patterns suggest a familiar AI lifecycle: large datasets consisting of assets like images, videos, and metadata are ingested and consolidated then exported for training and experimentation. Now, those assets can be periodically updated as new assets are added and generated models and stored. We see that heading into the new year, the overall baseline has increased indicating a new normal.
Quick terminology refresher
Regions
US-West: Our largest and longest-running region
US-East: Region with the most observed proximity to neocloud infrastructure
CA-East: Our newest region in Canada.
Network Types
CDN: Networks that use Backblaze as an origin store for content delivery
Hosting: Traditional hosting providers that runs workloads like physical or virtual servers for web, database, or application tasks
Hyperscaler: Large, traditional cloud providers
ISP Regional: Local or regional ISPs, think of these as the “last mile” paths as these networks are very close to customer equipment and efficient
ISP Tier1: National or international ISPs that carry our traffic long distances
Neocloud: AI -focused compute networks
Migration: Network links that we use for large-scale data onboarding
Heatmaps: Where AI traffic concentrates
To better understand where AI activity is happening, we thought it would be interesting to isolate the different Backblaze regions and to view concentrations of metrics visualized through heatmaps. We’re going to look at the following three dimensions:
Total traffic volume: Where did we send and receive the most traffic?
Magnitude: Where were the data transfers with the most bits per unique IP address?
Uniqueness: What does the number of distinct IP addresses look like?
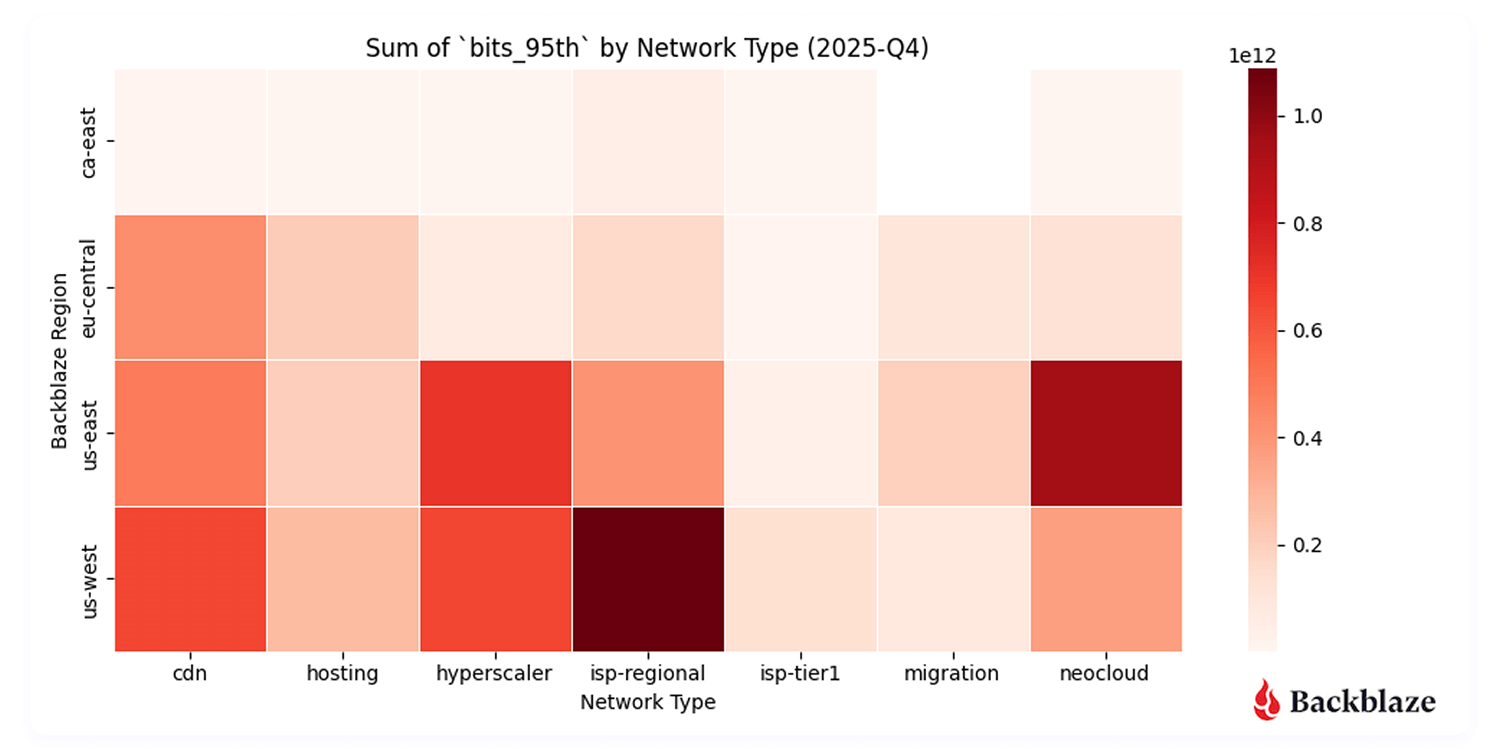
Heatmap #1: Where did we send and receive the most traffic?
Unsurprisingly, US-West ISP-Regional traffic dominates in total traffic volume. This region has the largest data center footprint behind it, with connectivity to internet exchanges (IX) such as Equinix-IX that were brought online in 2023. Internet exchanges bring us closer to consumer networks, where we can deliver traffic with lower latency.
More interesting, however, is the US-East neocloud concentration. Our flow data shows neocloud activity clustering in regions including Chicago, Dallas-Houston, Denver, New York, Northern Virginia (Reston/Ashburn corridor), and Atlanta—skewed more towards the East Coast where there’s dense AI compute availability.
From a performance standpoint, this makes sense. It’s important to keep latency (the time between the source and destination) lower to achieve consistent high bandwidth rates for AI data transfers. For now, that gravity is pulling activity towards the East coast.
Total number of bits transferred across our regions to each network type
Will neocloud traffic concentrations shift over time? Since this is our first quarter with a full dataset, it’s a bit early to draw long-term conclusions. But this is exactly the kind of trend we’ll be tracking. Stay tuned for future Network Stats reports.
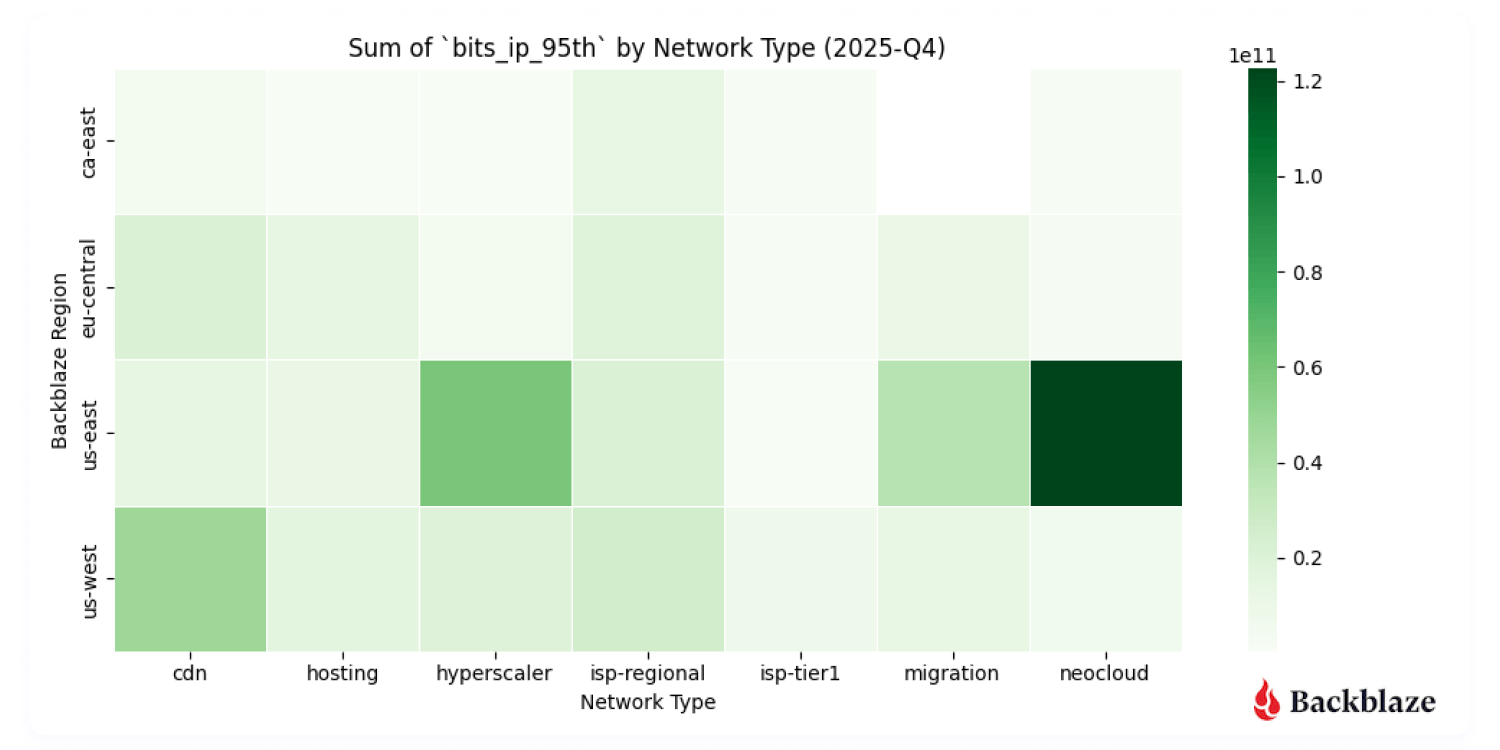
Heatmap #2: Where were the data transfers with the most magnitude (bits per IP address)?
Another metric we record is bits per IP or what we termed in our last report “magnitude.” This combination of the amount of traffic transferred with how many actors are involved per network is a good proxy to measure how heavy or impactful individual data flows are. In short:
High volume, many IPs: Easier to distribute and load-balance across infrastructure. And many source and destination pairs means that we can traffic engineer at the WAN layer, sending some traffic over one provider and some over another.
High volume, few IPs: More difficult, but more interesting, from a NetEng perspective.
Magnitude transferred across our regions to each network type
With B2 Overdrive, we routinely support client transfers starting at 100Gbps up to 1Tbps of throughput.These high-magnitude flows show up clearly in the data, especially in regions serving AI-heavy neocloud endpoints. Seeing these patterns emerge in the data validates that customers are actively using the platform the way it was designed.
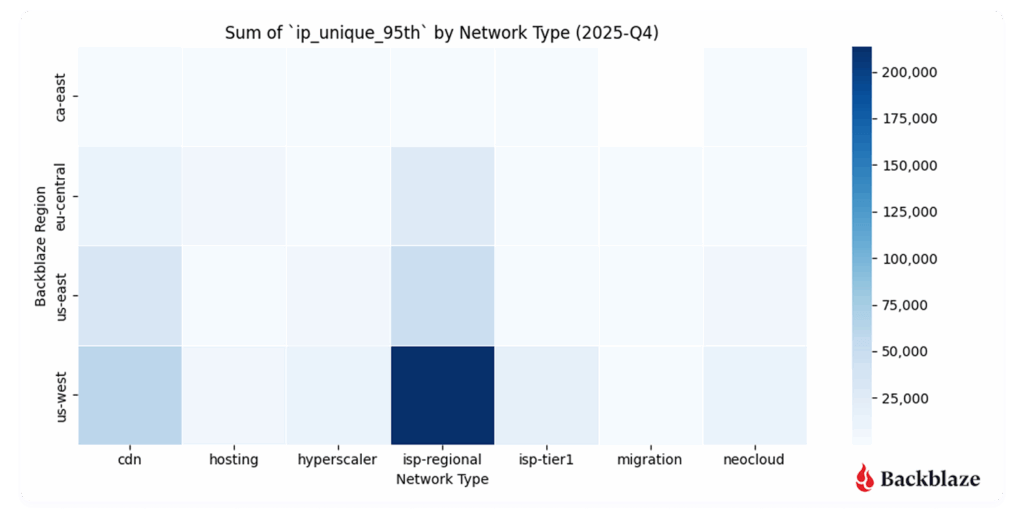
Heatmap #3: How many unique addresses do we interact with?
Uniqueness—measured by the number of distinct IP addresses per network type—adds another dimension to the story.
US-West shows the highest overall uniqueness, driven by its larger number of data centers and mix of workloads.
Neocloud traffic, by contrast, tends to involve fewer, more persistent endpoints, consistent with AI pipelines that rely on stable, long-standing connections between storage and compute.
This contrast reveals a broader trend: AI networking is less about many-to-many communication and more about sustained high-throughput relationships between specialized systems.
Communication uniqueness across our regions to each network type
Summary: Early indicators of an AI-native network era
This quarter represents an early but important snapshot of how AI is reshaping network behavior:
AI-driven traffic is concentrated and heavy (not groundbreaking news by any means, but interesting to see it played out on a network).
Neocloud connectivity is a defining feature of data movement today.
Data gravity is pulling storage, compute, and network design into tighter alignment.
This is our first look at these patterns specifically. As we gather more quarters of data, we’ll be watching closely to see how cyclical neocloud activity becomes, how regional concentrations shift, and how the growing ecosystem of AI-focused ISVs continues to change the shape of the network.
Quarter over quarter data
Last quarter we started capturing data and metrics that we were interested in tracking over time. This represents our first full quarter of data as we only started tracking in August of 2025, so it’s still early to start to see trends, but we’re including the visualizations for fidelity.
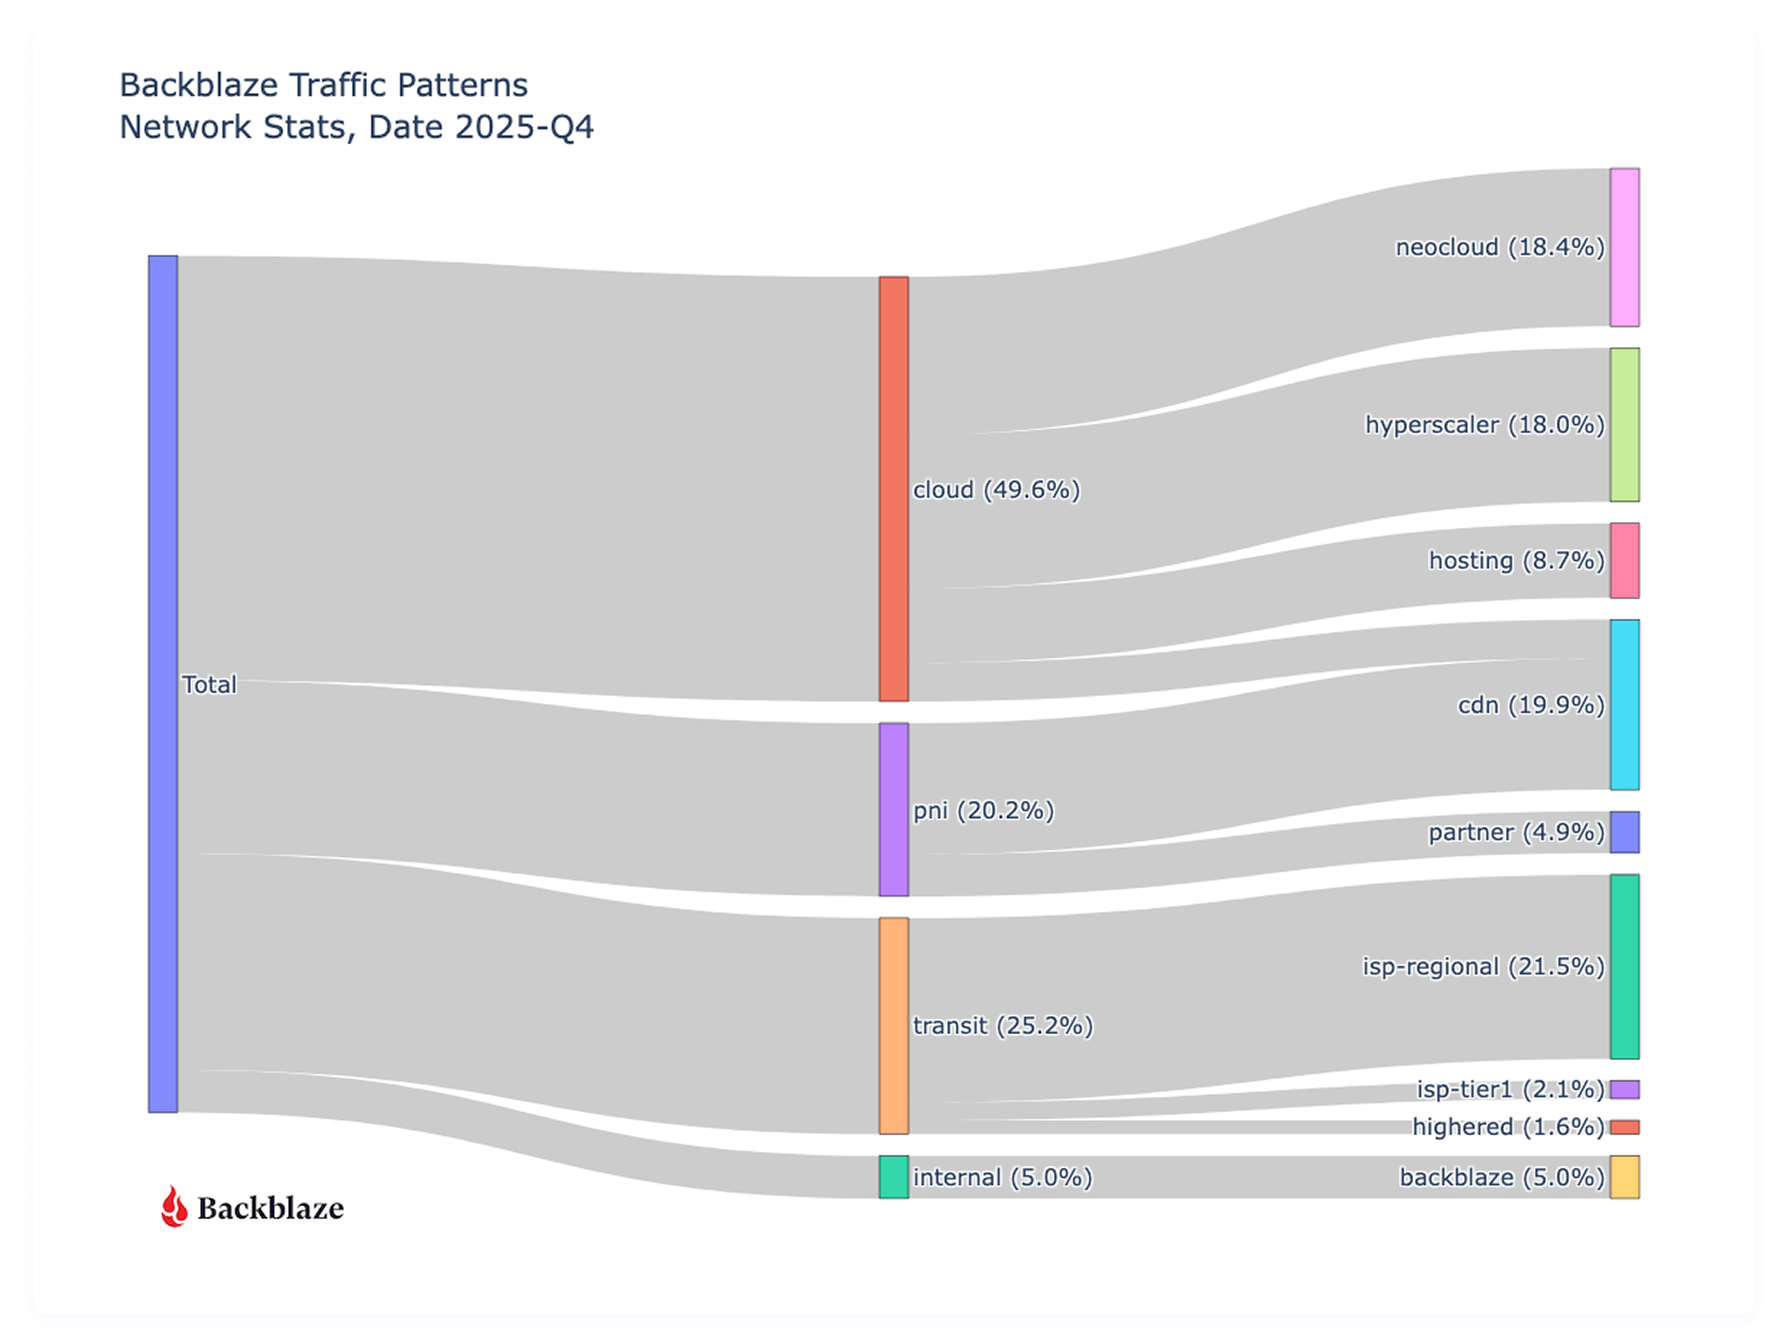
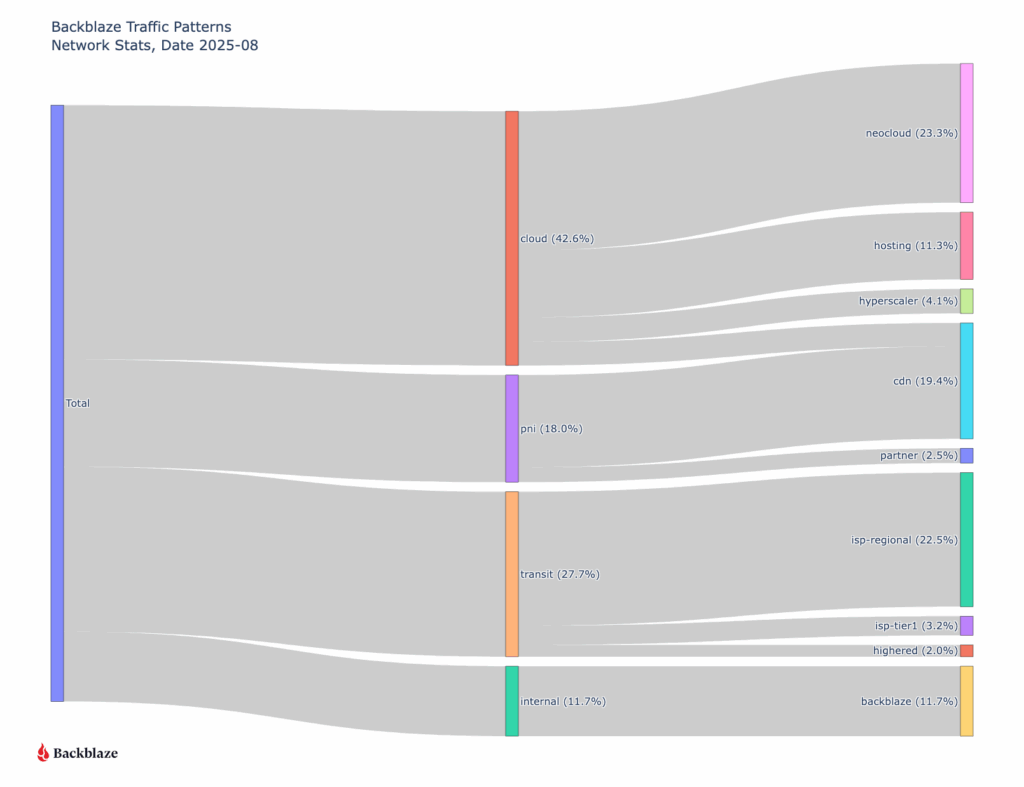
First let’s take a look at where all our traffic goes from a global perspective with an updated view of last quarter.
Sankey diagram of all August ingress and egress traffic grouped by type of network
Traffic to other clouds has increased (36.2% to 49.6%) since we last reported in August of 2025, with a slight decrease (19.8% to 18.4%) in Neocloud destinations, but a large increase (3.5% to 18%) to hyperscalers. It’s too early to call these things statistically significant trends or patterns that impact the cloud storage industry broadly, because they’re reflective of what types of customers Backblaze specifically has and our sampling range is only a quarter. That said, we do see an overall increase in cloud to cloud traffic, but the higher percentage to the type of clouds rotated from last quarter.
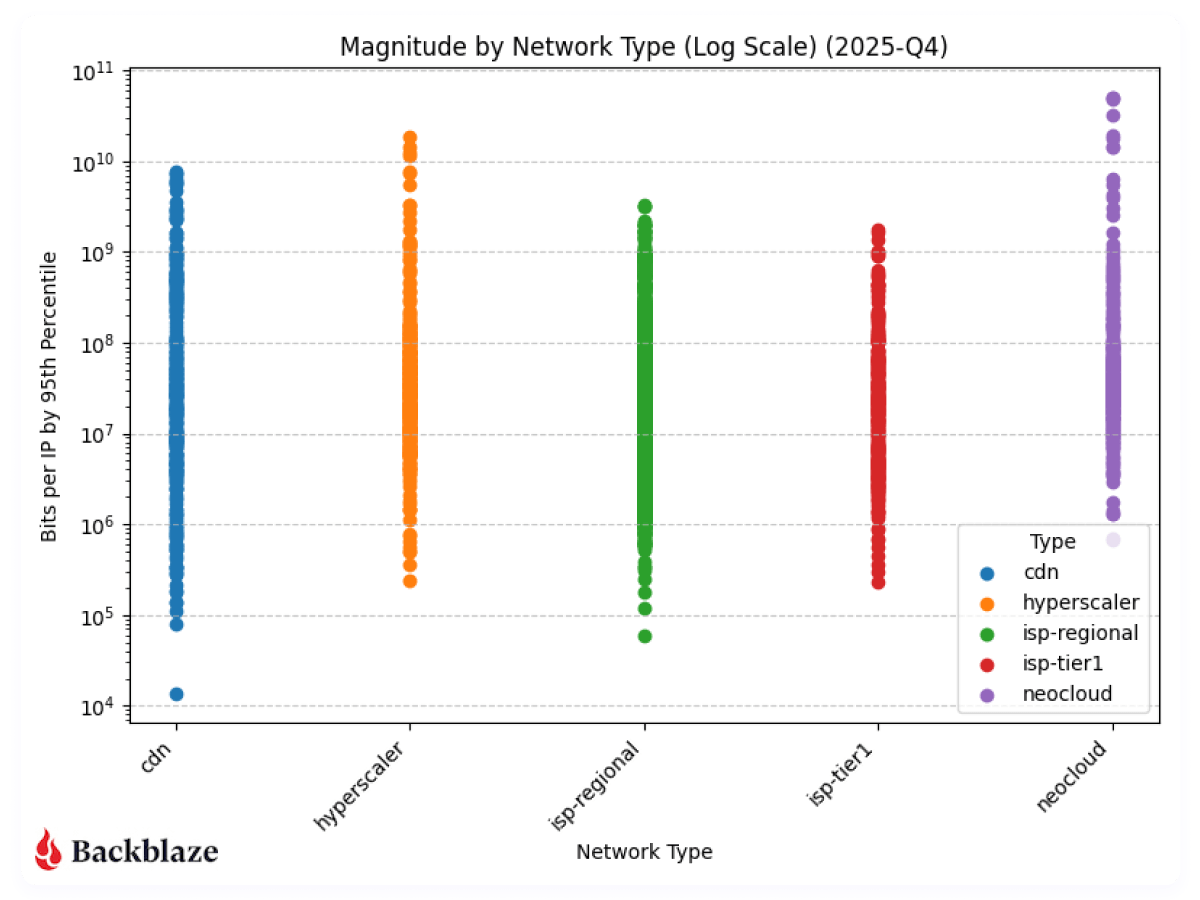
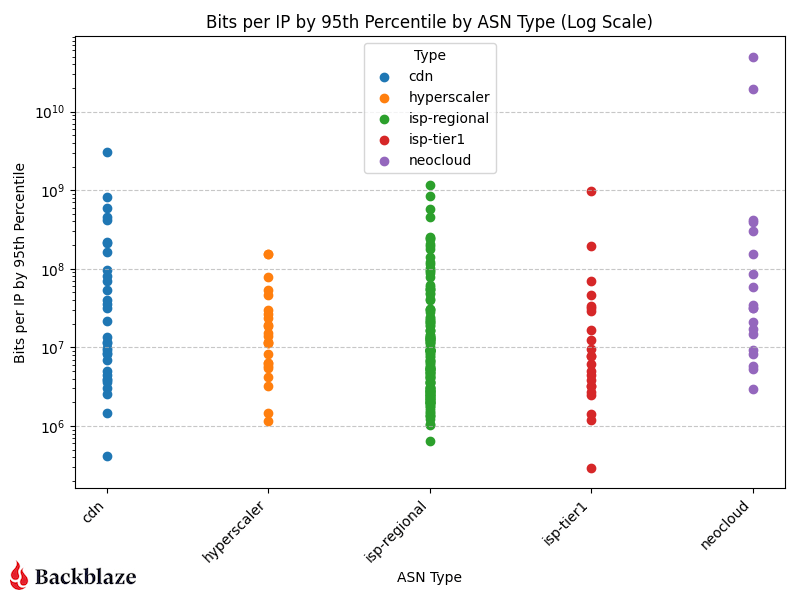
Next, let’s look at the magnitude of our network traffic based on the category of the traffic destination. As a reminder, magnitude represents the amount of traffic transferred with how many actors are involved per network.
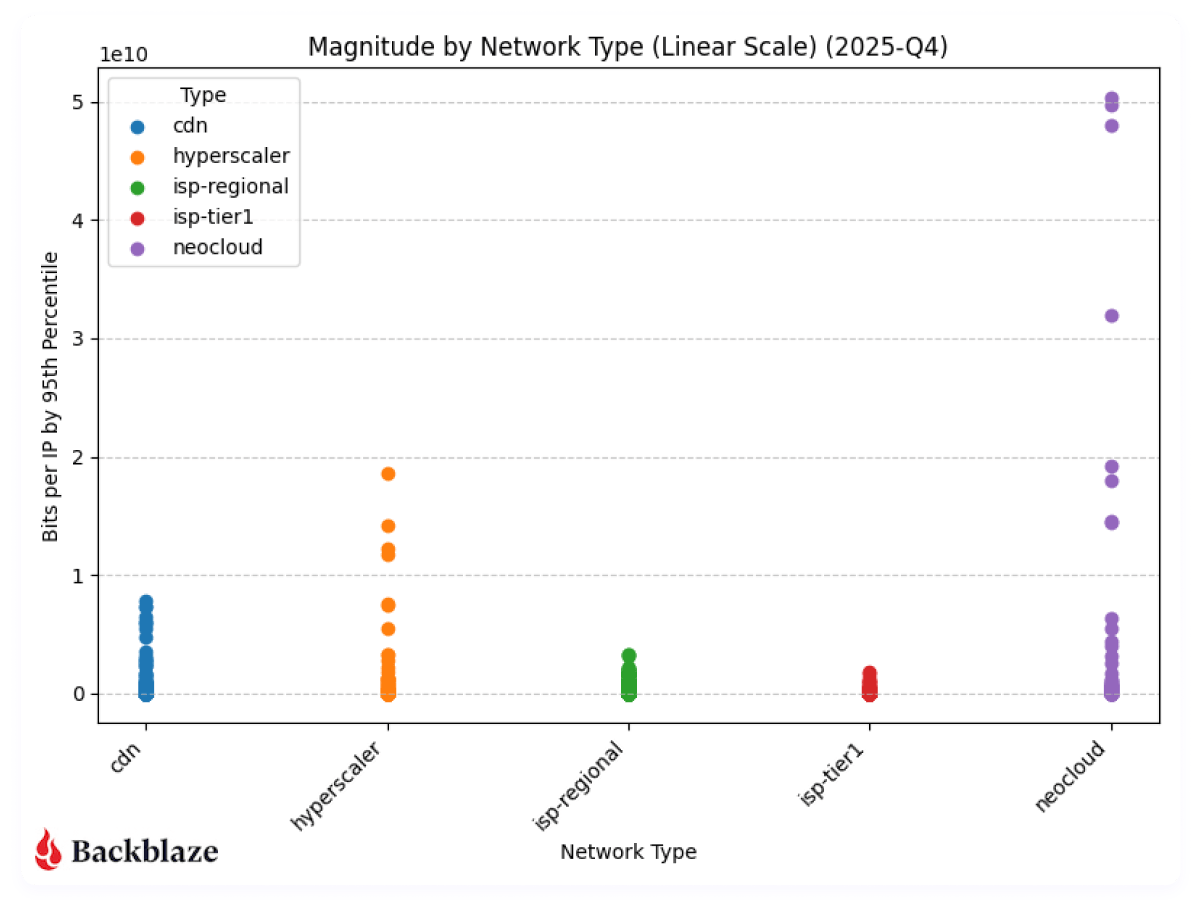
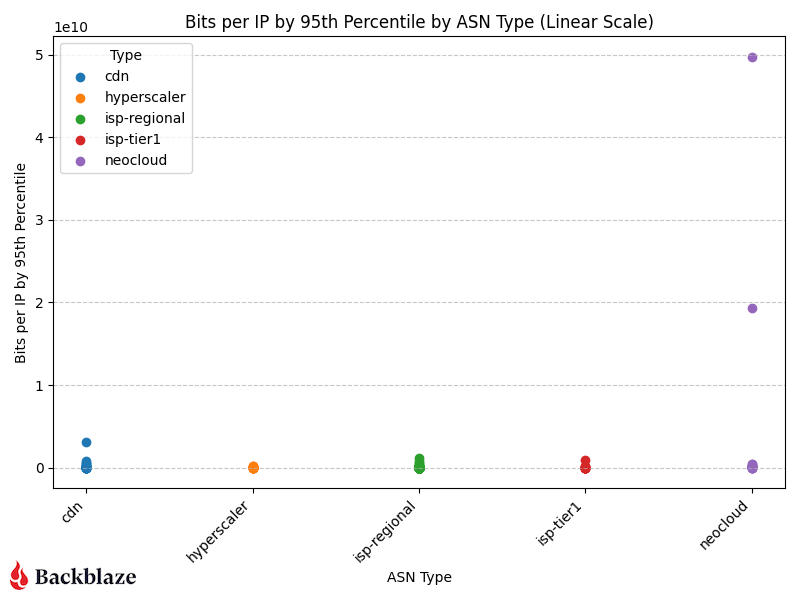
Next, to be consistent with our previous report, we’ll look at magnitude on a linear scale.
With more datapoints, we can clearly see the magnitude of the neocloud and hyperscaler transfers when compared to other network types. As above, it’s a bit early to claim concrete quarter over quarter patterns, but we’ll keep monitoring and updating the dataset.
What’s next?
Next quarter will be the first where we have true quarter over quarter data to analyze, and we’ll be back with more on how AI-driven flows change quarter over quarter. And as we get more data, we’re interested in looking at other trends like IPv4 vs. IPv6 traffic, cross-cloud connectivity trends, and revisiting the concentration analysis we did this quarter.
Anything specific you want to see? Let us know in the comments or reach out to our Evangelism team. Or, keep up-to-date with the latest technical content with our Developer Newsletter.
Managing object lifecycles is one of the simplest ways to control storage costs, keep buckets organized, and automate data hygiene. Backblaze B2 has supported lifecycle rules for years through our B2 Native APIs and the web application. Today, we’re expanding that support by adding S3 compatible lifecycle rule APIs, making it easier for you to use S3 tools and workflows to manage your data on Backblaze B2 (check out the docs: S3 Put Lifecycle Configuration, S3 Get Lifecycle Configuration, S3 Delete Lifecycle Configuration). This provides you with more flexibility and control over object management—all with Backblaze’s signature simplicity and affordability.
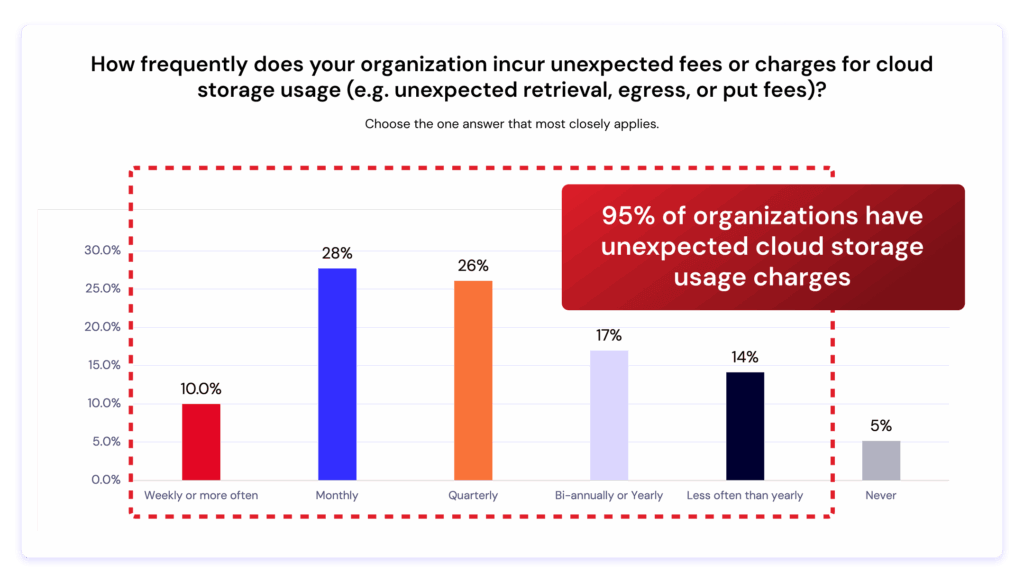
New survey: The Hidden Cost of Cloud Storage
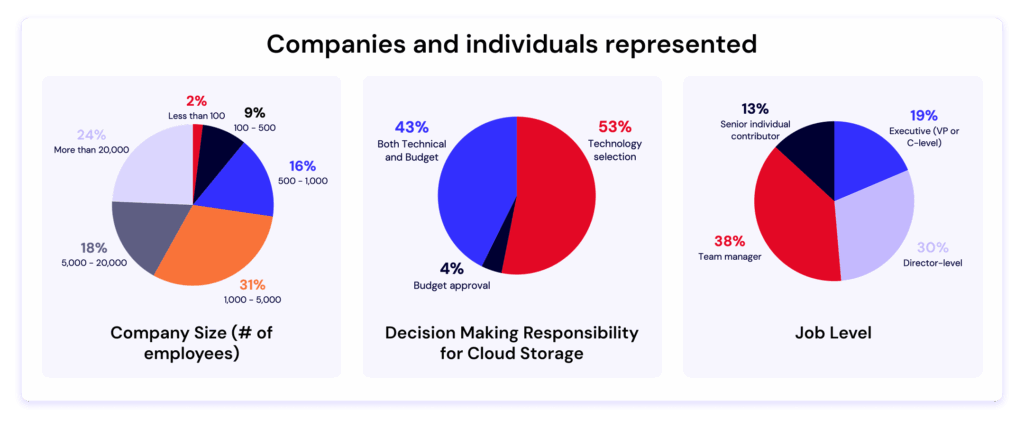
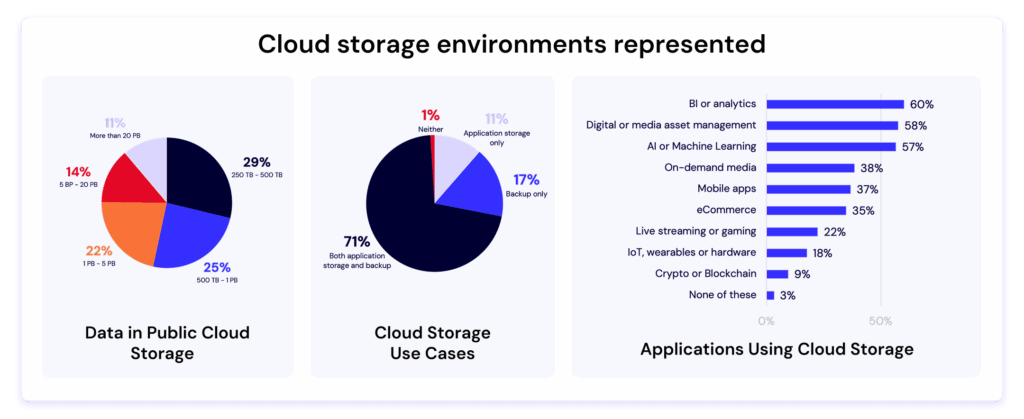
We surveyed over 400 IT decision makers and one thing stood out. Surprise charges affect almost everyone. Learn what’s driving them—and how to avoid them.
What’s new
You can now create, edit, and manage lifecycle rules on B2 Cloud Storage using standard S3 compatible APIs, including:
Nested folders with overlapping logic (e.g., animals/ and animals/cows/)
Why this matters
1. Seamless migrations from AWS
If you’re moving workloads from AWS S3, you can bring your existing lifecycle configurations with minimal changes. This reduces work while migrating your workloads to Backblaze B2.
2. More flexibility for complex data structures
With support for nested and overlapping prefixes, you can apply precise expiration rules to different datasets with overlapping prefixes in the same bucket. Whether you’re managing rapidly changing logs or long-term archives, lifecycle rules allow more controlled, automated retention.
3. Increased functionality for multi-cloud architectures
This configuration automatically hides objects under temp/ after 30 days.
Example use cases
Automated cleanup for short-lived objects: Temporary files, build artifacts, or test data can expire automatically after a given retention period.
Compliance-driven policies: Organizations with strict retention and deletion requirements can enforce rules consistently across buckets.
Automated cleanup of incomplete multipart uploads: Save money by removing partial upload fragments that were never completed due to network interruptions, client failures, or abandoned sessions automatically.
Tiered retention for nested prefixes: Allow broad retention for the general dataset while enforcing a faster cleanup cycle for a particular subset that changes more frequently or has lower long-term value. For example, you can apply a 30-day expiration rule to all objects under the prefix temp/, while assigning a shorter 7-day expiration rule to the more specific prefix temp/webserver/.
How it complements existing B2 Lifecycle Rules
Backblaze continues to support lifecycle rules through the B2 Native API, which many customers use today. The new S3 compatible support offers an additional path for lifecycle automation, especially for customers with S3 style infrastructure or tooling.
Although both S3 compatible and B2 Native lifecycle rules can coexist, we strongly recommend using a single method depending on your workflow preferences to manage lifecycle rules.
Getting started
You can begin using lifecycle rules today through:
S3 compatible SDKs
S3 CLI tools
Direct API calls
Refer to Backblaze S3 Compatible API documentation for more details, specifically:
Most customers can apply their existing AWS lifecycle rules directly, without modification.
Availability
S3 compatible lifecycle rules are now available.
Wrapping up
Lifecycle rules help automate routine object cleanup and give teams predictable control over object retention. With the addition of S3 compatible lifecycle APIs, Backblaze B2 makes it even easier for customers to bring their existing S3 workflows to our platform while continuing to use the lifecycle management strategies they already trust.
Get started with Backblaze today by signing up for an account or contacting Sales.
AI training data is now a company’s most valuable intellectual property—often worth more than the models themselves. Models can be replicated and architectures become public knowledge, but the datasets that capture your domain expertise and years of careful curation are irreplaceable.
Yet as AI workflows become increasingly distributed, that data moves constantly between environments, increasing exposure while reducing visibility. According to IBM, “Forty percent of breaches involved data stored across multiple environments… highlighting the challenge of tracking and safeguarding data, including shadow data, and data in AI workloads.” Meanwhile MIT Sloan researchers have documented that AI training datasets are often inconsistently documented and poorly understood, creating exposure that extends beyond technical vulnerabilities into operational and compliance failures.
Yet many organizations still treat training datasets as just another storage bucket. But protecting data at rest is both a compliance requirement and a competitive necessity. The integrity of your datasets now determines the integrity of your models.
Free resource: Understand why object storage is a strategic driver
Download our free ebook to learn how object storage supports every stage of the AI pipeline—from data collection to model deployment.
Why training data is the new target
The attack surface for AI systems has fundamentally shifted. Rather than targeting models in production, sophisticated adversaries now focus on the training pipeline itself.
Data poisoning has emerged as an insidious threat
Attackers inject subtle changes like biased samples, mislabeled data, or adversarial examples that skew model outcomes or introduce hidden backdoors. Recent research reveals that 26% of organizations surveyed in the US and UK have been victims of AI data poisoning in the last year. These poisoned models can quietly undermine fraud detection, weaken cyber defenses, and corrupt business-critical decisions.
Intellectual property theft takes on new dimensions
When adversaries steal training datasets, they’re stealing the accumulated expertise that gives your models their edge. Your training data represents thousands of hours of curation and annotation that encodes institutional knowledge about your customers and market. A competitor with your datasets can replicate your capabilities in weeks rather than years.
Silent corruption poses an equally serious but less visible threat
Infrastructure failures, human errors, or gradual drift in data pipelines can corrupt training datasets without triggering alerts. For organizations in regulated industries such as healthcare, financial services, or autonomous systems, this creates a reproducibility crisis. How do you prove your model was trained on authentic, unaltered data when you can’t verify the data’s provenance?
The NIST AI Risk Management Framework emphasizes that maintaining the provenance of training data and supporting attribution of AI system decisions to subsets of training data can assist with both transparency and accountability. Regulators and customers increasingly expect verifiable proof of data integrity throughout the training lifecycle.
The takeaway? The trustworthiness of every model begins with the trustworthiness of its data.
The principles of a secure AI data foundation
A strong protection model rests on three pillars—immutability, encryption, and regional control—each reinforcing long-term integrity.
1. Immutability: Protect against tampering or deletion
Immutability means write-once, read-many (WORM) protection that prevents modification or removal. Once data is written, it becomes locked—no one can modify, overwrite, or delete it for a defined retention period, but it remains fully accessible for reading. This technical guarantee prevents data poisoning attacks, stops accidental deletion, and enables verifiable reproducibility.
CISA advisories recommend immutable backups to guard against ransomware, but the benefits extend much further for AI systems. When you lock a dataset snapshot before training begins, you guarantee the ability to reproduce that exact model state, which is critical for debugging, regulatory audits, and forensic investigations when models fail.
Object Lock capabilities enforce immutability at the storage layer for set retention periods. Each dataset version becomes permanently immutable, creating an unalterable record of your training history that no administrator or attacker can modify.
Implementation tip: Enable Object Lock at the bucket level and integrate it with your data-ingestion scripts to automatically lock datasets as they’re created.
2. Encryption: Safeguard confidential data
Training datasets contain extraordinary value—customer information, proprietary annotations, competitive intelligence embedded in data selection. Server-side encryption protects this data both in transit and at rest, defending against unauthorized access even if other security layers fail. The EU’s recent NIS2 technical guidance explicitly prescribes cryptography as a required control measure for compliance.
The key to practical encryption is simplicity. Solutions should integrate seamlessly into existing workflows without requiring separate key-management infrastructure or introducing performance overhead that disrupts training pipelines.
Implementation tip: Look for server-side encryption options (like SSE-B2 or SSE-C) that remain transparent to your applications while providing the protection regulators require.
3. Regional control: Ensure data sovereignty and availability
Where your data physically resides matters for compliance, latency, and operational resilience. GDPR and similar regulations often require that sensitive data remain within specific jurisdictions. Beyond compliance, regional placement affects training performance—positioning data near compute resources or using high-performance delivery mechanisms can reduce transfer delays when moving large datasets.
The critical factor is transparency. You need explicit control over region selection and assurance that data won’t be replicated to secondary regions without your knowledge. Ambiguous “regional” configurations that might span continents create compliance risk.
Consider a U.S. biomedical AI startup working with patient-derived data. They need datasets stored exclusively in U.S. regions to satisfy HIPAA requirements, Object Lock enabled to prove data integrity for regulatory submissions, and encryption applied to protect sensitive patient information—all while maintaining the competitive advantage their proprietary data provides. Regional control with clear guarantees makes this achievable.
Implementation tip: Choose storage providers that let you explicitly select regions during bucket creation with clear guarantees about where data resides, including replication destinations.
Beyond security: Enabling trust and traceability
Immutable, encrypted, regionally contained object storage enables AI governance at a level traditional storage infrastructure cannot.
Each dataset snapshot becomes a verifiable record of model history. When a model behaves unexpectedly in production, you can trace back to the exact training data used to create it. This capability accelerates debugging and provides the evidence needed to explain model decisions to regulators, customers, or internal stakeholders.
Storage infrastructure with built-in immutability and access logging provides the verifiable evidence that auditors require. Instead of reconstructing data lineage from logs and documentation, you can demonstrate exactly what happened with cryptographic proof.
These capabilities transform storage from a passive repository into an active component of your AI governance framework.
Implementation snapshot: Putting it all together
Establishing these protections with Backblaze B2 follows a straightforward path:
Create buckets in regions that match your compliance and latency requirements.
Enable Object Lock and configure retention policies aligned with your model development lifecycle.
Apply server-side encryption (SSE-B2 or SSE-C) to all training data buckets.
Activate versioning to maintain a complete history of dataset evolution.
Configure logging to track access patterns and enable lineage verification.
Integrate with compute using standard S3 compatible tools.
For organizations running intensive training workloads, Backblaze B2 Overdrive provides high-throughput object storage with up to 1Tbps throughput speeds and unlimited free egress. This allows enterprises to perform large quantities of concurrent data operations without performance degradation, keeping compute resources—including expensive GPUs—from sitting idle while waiting for data transfers. B2 Overdrive maintains the same security and compliance capabilities as standard Backblaze B2 while enabling faster iteration on model development.
The bottom line: Trust begins with proven data
The datasets you’ve built represent years of institutional knowledge—far more difficult to replace than the models trained on them. Protecting that intellectual property requires more than access controls and perimeter security. You need to prove the integrity of your data to regulators who demand accountability, to customers who expect trustworthy AI, and to your own teams who need confidence in model reproducibility.
The AI and cloud infrastructure industry talks endlessly about GPUs, model size, and compute capacity, but there’s an invisible Achilles heel that can quietly undermine even the most promising AI projects: data egress.
According to a new Dimensional Research survey, 95% of organizations experience unexpected cloud storage fees, often from retrieval, egress, or API transactions. These hidden costs are rarely visible in early budgets, but they can torpedo innovation as workloads scale, especially when video enters the mix. Raw footage, frame-level training data, model checkpoints, and final renders can add up to hundreds of terabytes every week, straining both budgets and infrastructure.
Read the full report
We surveyed over 400 IT decision makers and one thing stood out. Surprise charges affect almost everyone. Learn what’s driving them—and how to avoid them.
Most generative AI video outputs today max out at 480p or 720p resolution. As demand grows for 1080p and 4K, storage and bandwidth requirements will multiply. Without a deliberate egress strategy, that growth becomes a silent tax on innovation. Over time, it restricts experimentation, reduces iteration speed, and undermines cost predictability.
The future of AI video belongs to teams that treat egress strategy as part of their innovation architecture and choose partners that let them move data freely between storage and compute, without penalty.
Inside the generative AI data pipeline
Modern AI systems no longer operate inside a single environment. Data is stored in one place, trained in another, and increasingly delivered at the edge. As workloads scale, the ability to move data efficiently becomes as important as compute capacity.
According to IDC, 88% of cloud buyers now deploy hybrid cloud environments, and 79% already use multiple providers. The Dimensional Research survey found that 99% of organizations struggle with limited flexibility and interoperability, highlighting how closed ecosystems are slowing progress just as multimodal AI demands more open, composable infrastructure.
To understand why egress matters so much for generative AI video, it helps to look at the AI data pipeline, which follows five continuous stages:
Data ingest and active archive: Collect and store raw images, video, audio, and metadata for future processing.
Data processing: Clean, label, and transform data into usable training sets.
Model experimentation and training: Run GPU-intensive model development and fine-tuning, save checkpoints and weights.
Model deployment and inference: Apply trained models to new video, user queries, or edge devices to generate results.
Monitoring: Track accuracy, latency, and system health to retrain and optimize continuously.
Each stage has distinct storage and compute requirements, but data moves between them constantly. For AI video, those transfers can span regions and providers. When egress is slow or expensive, the entire pipeline backs up, delaying iteration and driving up cost.
When data can’t move, innovation can’t either
Keeping everything under one cloud provider once simplified management. At first glance, it still seems convenient to keep storage, compute, and archive all in one place. Within a single AWS region, egress is free. But as soon as data crosses regions or providers, the model breaks down.
Tiered pricing makes costs hard to forecast. Egress fees penalize movement. Resource contention slows performance, and interoperability gaps lock teams into static configurations. AI video workloads amplify the problem: training, inference, and storage often require different environments optimized for each stage.
Dimensional Research’s data shows that 55% of organizations note egress costs as the single biggest barrier to switching cloud providers. Many stay with less efficient or more expensive infrastructure simply because the economics of mobility make innovation too costly. Moving just 1 PB of data out of AWS storage in the US East region costs about $53,800 per month—often enough to halt multi-cloud testing entirely.
The true cost, however, is in the experiments that are never run and the innovations that don’t get discovered because of a pricing structure that discourages exploration.
Freedom of data movement is the new competitive edge
In generative AI, the pace of progress is set by how quickly teams can test, retrain, and redeploy new models. That agility requires data mobility.
As organizations adopt composable AI stacks that mix specialized compute, regional storage, and orchestration tools, success depends on how openly data flows between them. Teams that design for movement can scale faster, adapt to new technologies, and stay resilient as infrastructure changes.
For teams building generative AI video applications, the impact is especially pronounced. A studio fine-tuning a diffusion model might burst to GPU providers with available capacity, render high-resolution outputs, and archive them for reuse, all without rewriting code or paying to move the data each time.
Data mobility has become a measure of competitiveness. The faster teams can move information across environments, the faster they can innovate.
How to build an egress strategy that fuels innovation
A good egress strategy ensures that storage and compute stay aligned as workloads scale. It helps teams anticipate cost, performance, and interoperability issues before they turn into blockers.
Here are a few practical steps to get there:
Map your data flows. Identify where data originates, how it moves between services, and which transfers happen most frequently.
Quantify transfer and API transaction costs. Include both in your total cost of ownership models. Even small fees add up quickly at petabyte scale.
Test portability. Run controlled migrations or bursts to secondary compute providers to expose hidden bottlenecks.
Select for openness. Favor vendors with flat, transparent pricing, free or low-cost egress, and broad S3 compatibility.
Plan for growth. Multimodal models and higher-resolution video outputs will multiply data transfer volumes. Design bandwidth and budget models accordingly.
Beyond controlling costs, the goal is to keep flexibility built into your architecture so your team can use the best tools for each stage of the AI pipeline, without being trapped by pricing friction or closed ecosystems.
The Backblaze difference: Open by design
Storage that supports innovation shouldn’t penalize movement. That’s why we created Backblaze B2 Overdrive to give teams with high-throughput, data-intensive workloads the flexibility they need to innovate.
Overdrive is the right fit for AI video because of its:
Predictable economics: $15/TB/month with unlimited free egress (no penalties for moving data to the compute you need).
Zero transaction fees: API calls don’t become a hidden tax as pipelines scale.
S3 compatibility and high throughput: Drop into existing pipelines without rewrites and keep large media workflows moving quickly across training, rendering, inference, and archive.
AI startup Decart put Backblaze B2 through its paces as it developed a real-time generative AI open world model, with millions of hours of training video data and multi-petabyte workloads daily.
What we really needed was a place where we could store an insane amount of data and, at the same time, download it to a few different GPU clusters around the world, and for all that to not cost an insane amount of money. That’s why we chose Backblaze.
—Dean Leitersdorf, Co-Founder and CEO, Decart
With Backblaze’s free egress model, they reduced AI operation costs by 75% while maintaining flexibility across compute environments.
If you’re scaling generative AI video, Backblaze B2 Overdrive gives you the freedom to put data where it performs best, without egress penalties, transaction surprises, or architectural do-overs.
In cloud storage and compute, “less is more” no longer applies. As data grows and expectations rise, businesses need performance, reliability, and real value—not just lower costs. It can be tempting to rely solely on hyperscalers like AWS, but the challenge is understanding where cloud performance truly meets value.
That’s why Backblaze is launching Performance Stats, our newest stats content built on the transparency of Drive Stats and Network Stats. This ongoing, quarterly report will share performance testing results—for both Backblaze and competitors—as well as the testing methodology so that anyone can recreate, compare results, and contribute to building better tests if necessary. (So, feel free to argue with us in the comments.)
By publishing everything—strengths, weaknesses, and all—we’re hoping to give AI leaders, app developers, and decision-makers a clear, honest view of how Backblaze and other cloud storage providers perform in the wild.
Get the full Stats picture live
Drive Stats was the beginning. Want to see the evolution? Check out the Backblaze Stats webinar, bringing together content from all of our Stats series. We’re going to chat about all things Backblaze and beyond—by the numbers.
Cutting through the noise on cloud performance
Frankly, it’s super frustrating how opaque performance metrics can be, and how many misleading storage reports are out there. Building accurate tests is complicated for a lot of reasons—so many factors are contingent on things that product builders and even end users control, like where and how data is stored, where it’s being served to end users, and so on. And, most published content on this topic has been tested from inside the cloud storage company’s architecture, which means that they’d give themselves preferential results.
While our report may not be perfect, our transparent approach—particularly publishing the testing methodology—will allow us to mitigate some of those concerns.
We want to take a hard look at performance on a level playing field for two reasons:
Buyers should know what they’re getting and have the tools to sniff out the hype and misleading messaging many providers peddle about their performance.
If we don’t measure ourselves, we won’t get better. We want you to understand where we’re doing well today, and we want to take you along for the ride as we work to improve where we’re not.
Without further ado, here are the results
We ran performance testing for Backblaze B2, AWS S3, Cloudflare R2, and Wasabi Object Storage. These tests were conducted using Warp, an open-source S3 benchmarking tool for cloud object storage performance. We’ll expand on the methodology after we get into the numbers.
Key findings:
While AWS S3 demonstrates the lowest average download speeds across the board, the hyperscaler didn’t win on sustained download throughput measurements. Five minute single- and multi-threaded benchmarking tests showed AWS winning on only one out of eight sustained throughput tests, indicating that there’s much more to the story than average download speeds. Meanwhile, Backblaze won in six out of eight categories, with Wasabi coming in first on the remaining test. (That being said, it’s wise to take this with a grain of salt given the small cohort in this initial dataset—more robust testing may show different results.)
Sustained throughput testing shows the most differentiation at small file sizes for both single and multi-threaded testing. For example, in multi-threaded upload benchmarking for the 256KiB file size, our highest value was 580% higher than the lowest. In single threaded upload benchmarking for the same file size, the highest value is 700% higher. Download throughput showed 247% and 304% in multi- and single-threaded tests, respectively. Small file size testing can have interesting impacts on overall performance—these files have the most overhead, and are typically more likely to show latency.
Backblaze B2 demonstrates the fastest average upload speeds for small file sizes, with AWS S3 leading for larger file sizes. And, similar to downloads, the story becomes more nuanced when we look at sustained upload throughput, where Backblaze leads for both the smallest (256KiB) and largest (100MiB) file sizes on multi-threaded tests with Wasabi taking the lead in the mid-range.
And, here’s a jump-to if you want to quickly reach each test:
This test shows the average time in milliseconds it takes to upload a file. Averages were taken across a month of data and for three different file sizes.
In these tests, a lower result is better (i.e., it represents a faster result). Note that we do not have data for Wasabi: Wasabi does not allow users to run HTTP requests for the first 30 days of a new account period, and when we ran this report, our testing account was still within that time period.
In each of the charts, we’ve outlined the “winner” in green for each category for easy readability.
Backblaze B2 wins for small files, coming in at 12.11ms, and AWS S3 leads for 2MiB and 5MiB files, coming in at 76.79ms and 201.40ms, respectively. Whether or not these numbers are inherently “good” or tolerable depends on quite a few factors—we’ll run through some examples comparing use cases to where we see Backblaze succeeding later in the report.
Five minute multi-threaded upload benchmark
In these tests, a higher result is better, as the result represents more average data being pushed in the five minute time period. This gives us quite a bit more information than just average upload time for a single file—rather, it tells us the sustained amount of data you can push to a cloud storage provider in five minutes.
Interestingly, we have a pretty large spread between our highest and lowest values, most stark amongst the smallest files where Backblaze B2 demonstrates the highest sustained throughput at 163.80MiB/s and Cloudflare R2 demonstrates the lowest at 24.10MiB/s.
This is important because the strength of object storage is that it lets you run concurrent operations to read many ranges of bytes in the same file. Moreover, thread operations are a configurable element of most cloud storage accounts (though too many concurrent operations can trip rate limits that are dependent on the provider).
So, when we think about contextualizing with the average time to a file upload completion, the task includes making the request, the handshake between requester and server, routing the request through the cloud storage provider, then time it takes to read all data, and then notification that your upload is complete.
Threading lets you run the actual process of the return of information concurrently—so while file overhead (handshake) should be relatively consistent, you can get quite a bit faster on large file uploads. And, even when you have consistent results on file overhead, networking paths can make a difference on delivery times. While we can consider networking routes mostly stable (especially for synthetic performance testing), it’s certainly not a guarantee. Peering policy changes, network maintenance and/or outages, and CDN usage can all affect your routing day to day or month to month.
Changing the view a bit, we see some interesting shapes when we plot each providers’ improvement as file sizes get larger:
It’s intuitive that you’d automatically push more data as file sizes get larger, but the shape of each’s improvement is a stark contrast. The rate of increase (which you can see in our trendlines as the slope) isn’t constant, and we see Backblaze and AWS showing consistently better performance at the higher file sizes. Wasabi tracks with that growth in the smaller file sizes, but falls off at the 50MiB and 100MiB. Meanwhile, we see Cloudflare returning the lowest net values, while flattening out at smaller file sizes as well.
In most performance data, you expect a logarithmic relationship between data points—and so comparing their different shapes—when the trendline flattens out and/or when it deviates from an ideal logarithmic scale—can be telling. You can define an expected logarithmic curve using an average of all providers, then compare each provider’s residuals (how far above or below that curve it sits). We’ll save that analysis for another day, and a more mature dataset.
It’s also interesting to look at data point clustering by file size. As our dataset matures over time and as we add providers, clustering in these charts start to tell a story. If you want a quick idea of good, better, best and you don’t have a large enough cohort for a true tiered definitional schema, it’s a good visual shortcut—you can easily see if different providers’ results are spread out or if they cluster together at a specific level of performance. The winners for each test are labeled in green.
And, as we said above, in all cases (and one of the most frustrating parts about collecting performance stats) is that your mileage may vary—you always want to compare the needs of your customers and product to the performance you need and how much it costs you.
Five minute single threaded upload
Once again, higher is better in this result, and it measures the sustained amount of data you can push to a server based on file size. As a reminder, multi-threading allows you to concurrently read a single file; while single threading is one, sustained process from start to finish.
Backblaze B2 again leads in small file sizes, with AWS S3 leading for 5MiB files and Wasabi for 50MiB and 100MiB files.
As above, here’s the trendline:
And, like in the multi-threading results, we can look at the clustering in each file type size:
Download comparisons
This test shows the average time in milliseconds it takes to download a file. Averages were taken across a month of data and for three different file sizes.
A reminder that lower is better in this test as it represents a faster result, and there’s no data for Wasabi in this series due to limitations on HTTP requests within the first 30 days of opening a new account.
AWS S3 leads across the board on this test, with Backblaze B2 taking second and Cloudflare R2 taking third consistently.
And, it’s worth separately tracking TTFB because TTFB is a good, but not sufficient statistic when we’re interpreting results.
Why isn’t this datapoint sufficient to fastest speeds? Not only does TTFB conflate many parts of your networking layer (so it can be affected by things like connection reuse policies), but it’s also such a small part of the overall transfer time and highly variable based on environment. So, its use is really in conversation with the sustained throughput numbers.
Cached vs. uncached downloads (Backblaze only)
We were also curious to see if caching within our own network would show up, and, if so, we’d want to make sure we weren’t unintentionally giving ourselves a favorable stance. So, we ran a series of tests for cached and uncached downloads by including the header X-Bz-Flush-Cache-First=true.
We do see slightly slower speeds in uncached downloads, but they’re likely a result of the same factors anyone externally hitting our system would see. Additionally, during the course of our testing, Backblaze made cacheless downloads the default behavior for our architecture—so, it will be interesting to monitor this statistic going forward.
Five minute multi-threaded download benchmark
In these tests, a higher result is better, as the result represents more average data being downloaded in the five minute time period.
Backblaze B2 leads for 256KiB, 50MiB, and 100MiB file sizes. AWS S3 has a slight advantage for 5MiB files.
And, let’s give ourselves the same charts as our above upload tests for consistency’s sake. Here’s the trendline:
While AWS and Backblaze track closely for the 256KiB and 5MiB file sizes, Backblaze wins out at 50MiB and 100MiB. Meanwhile, Cloudflare lags at the smallest file sizes, but shows rapid improvement, peaking at the 50MiB file sizes. Interestingly, this is arguably Wasabi’s weakest showing compared to all other sustained throughput testing, though they have strong results at the 256KiB file size and a respectable showing at the 5MiB file size.
And here’s the per-file size clustering:
Five minute single-threaded download throughput
Again, in these tests, a higher result is better, as the result represents more average data being downloaded in the five minute time period.
Here, Wasabi wins for 256KiB files, and Backblaze wins for 5MiB, 50MiB and 100MiB files. Note that this is a solid trend for Wasabi in the 256KiB file sizes—they came in second in the multi-threading download testing, as well as both single and multi-threaded upload testing.
And here’s our clustering:
Test methodology
Our goal with these benchmarks is simple: to understand how our cloud performs under real-world conditions and to share that information as clearly as possible. To do that, our Cloud Operations team runs repeatable, synthetic tests that measure upload (PUT) and download (GET) performance.
We ran both upload and download tests across all four vendors. Upload tests measured the following file sizes:
256KiB
5MiB
50MiB
100MiB
Download tests measured:
Time-to-first-byte (TTFB)
Total time to download the following file sizes:
256KiB
5MiB
50MiB
100MiB
Why do performance tests use mebibytes (MiB) instead of megabytes (MB)?
We’ve written articles in the past about how all computers are fundamentally a collection of logic circuits (transistors) in either an on or an off state, which means that they communicate in binary, or a base two language. Humans, however, tend to prefer base 10 languages. There are lots of reasons for this, but that’s a story for another time.
MiB is a base two unit of measurement, whereas MB is a base 10. Here’s a comparison:
Unit
Definition
Bytes
1MB (megabyte)
Base-10 (decimal)
1,000,000 bytes
1MiB (mebibyte)
Base-2
1,048,576 bytes (1024×1024)
The difference between those two measurements may seem small, but it has a significant impact when you’re talking about performance sensitive systems. Oftentimes you’ll see marketing language shift to talking about MB because it’s more understandable to a wider audience, but to get accurate results, MiB is what you need.
Tests run in five-minute profiles to observe consistency over time, and we ran both single and multi-threaded download and upload tests. From a practical perspective, what’s happening is that we’re pushing repeated requests to a cloud storage provider as many times as we can for five minutes.
All tests originate from a Vultr-hosted Ubuntu virtual machine (VM) located in the New York/New Jersey area, routing through Catchpoint’s network into object storage regions located generally in US-East. By keeping the source environment stable and the test target consistent, we isolate performance variables within each provider’s infrastructure rather than the test environment itself.
Consistency measures
To ensure each test result represents genuine performance rather than environmental noise, we built repeatability into the process:
Identical test instances: All runs used the same VM type, operating system (OS) image, and configuration.
Fixed regions: Tests originated from the same location (NY/NJ) targeting the same US-East region across providers.
Controlled routing: Network paths were held constant through Catchpoint’s monitoring network to minimize geographic or peering variation.
Repeated runs: Each test profile (5 min) was executed multiple times, and averages were used to reduce the impact of transient spikes.
Standardized payloads: All uploads and downloads used identical objects to ensure a consistent file-size baseline.
Unchanged test intervals: Tests were scheduled at regular intervals over multiple days to capture both typical and outlier performance.
About synthetic testing
Synthetic monitoring provides a controlled, apples-to-apples comparison, but it doesn’t replicate every production workload. These tests are run outside our own infrastructure—from neutral vantage points—to simulate a customer’s experience at the “last mile.” This distinguishes our approach from competitors who benchmark internally under optimized conditions.
It’s important to note that synthetic results won’t mirror every customer’s experience. Different architectures, connection paths, and file patterns will produce different performance profiles. Our intent is to offer transparency into the methodology and relative behaviors, not to suggest that all workloads will perform identically.
Limitations and future work
Every benchmark is an approximation. These results provide a controlled look at how cloud storage performs under repeatable conditions, but they don’t capture every variable in production environments. Below, we outline what our current tests don’t measure and where we’re headed next to deepen the picture.
Synthetic, not real-world workloads: These benchmarks simulate real activity but don’t reproduce the full variability of customer workloads, concurrency levels, or data locality patterns. They are best understood as directional insights rather than absolute truths.
The internet is the internet: Once traffic leaves the test node, we can’t control the routing, peering, or transient network conditions between endpoints. Each provider’s own network policies and routing optimizations—for example, Wasabi’s inbound connection rules—can influence the results.
Static test conditions: All tests were conducted from a single region (NY/NJ to US-East cloud providers). Real-world customers operate globally, where peering arrangements, congestion, and latency differ widely.
Potential caching effects: Although we designed the tests to avoid cached reads, Catchpoint does not allow full data randomization. It’s possible some repeated reads benefited from intermediate caching at any network layer.
Traffic shaping and rate limiting: Providers may apply rate limits or throttling when detecting high-frequency test traffic. For example, Wasabi temporarily blacklisted our IPs due to testing volume—a reminder that these results represent observed behavior, not formal service guarantees.
Each of these limitations points toward future testing opportunities. Here’s what’s next on our testing roadmap:
Regional expansion: Extend current US-East tests to US-West and EU regions using equivalent test setups.
Vendor expansion: Extend testing to more vendors, including Google Cloud Platform and Azure.
File size sensitivity testing: Investigate performance across a wider range of file sizes, including 100MiB+ objects. This will help clarify where different architectures favor small-object throughput versus sustained large transfers.
Traffic rate & throttling analysis: Incorporate monitoring for request-per-minute and total-bytes-transferred metrics to detect possible provider-level rate limiting. We’d love to invite vendors to validate thresholds and eliminate false negatives.
Concurrency patterns: Test multiple thread and connection strategies to model real-world transfer concurrency, especially for use cases involving parallel uploads or downloads.
Benchmark visualization: Transition from CSV data collection to Grafana dashboards, enabling continuous visualization of test results and performance drift over time.
Performance is an evolving target, and so is our testing methodology. Each round of analysis helps us not only understand how Backblaze performs in context, but also refine how we measure, compare, and communicate that performance. Our goal remains the same: make the data real, repeatable, and useful.
What this means for real-world use cases
Based on the results we’ve shared here, there’s plenty of room for argument around the value of different performance profiles. But, continuing our theme of transparency: Since we’re transparent about our performance, warts and all, we’re going to be transparently candid in the areas where think the Backblaze platform is showing some nice results:
AI/ML inference: Our strong read latency and throughput make Backblaze ideal for inference workloads that need to pull model artifacts, inputs, and outputs quickly. For example, when a service like Hugging Face or Runway ML feeds an image into a convolutional neural network, lower read latency directly translates to faster inference delivery.
Feature stores & embedding lookups (AI/ML): Optimized small-object reads and efficient small writes support rapid lookups and occasional updates common in vector databases and feature stores like Feast, Qdrant, Pinecone, or Weaviate.
LLM-based retrieval-augmented generation (RAG) systems: RAG systems store many small document chunks that are written once and read repeatedly, so our read-optimized performance accelerates retrieval of document chunks or embeddings, improving response times for large language model applications. Vectorized databases are also a hot topic right now for good reason—they’re changing patterns around file sizes and retrieval patterns in RAG applications and LLM training.
Log & event analytics (SIEM, IoT, etc.): Competitive small-write performance and fast reads make Backblaze well suited for log aggregation and analytical querying with tools like Loki, Fluentd, Vector.dev, and OpenObserve once data is ingested.
Interactive data lake querying: Consistent throughput and fast download speeds deliver responsive querying and exploration for business intelligence (BI) and ad hoc analytics workloads.
CDN origin: Excellent read throughput, stable performance, and free egress make Backblaze a high-value choice for powering content delivery at scale.
As discussed, one of the reasons it’s so hard to get directly comparable performance benchmarks is because there are so many configurable elements on the user’s side that can affect the results. For example, if you know that your provider is faster on smaller files, you might choose to store your unstructured data in smaller parts so that you achieve faster performance.
That means that when we share results like this, it enables you to interpret which provider is a better fit for your different types of workflows.
For a cloud storage provider, tracking these metrics over time and comparing to other aspects of our internal architecture enables us to support ongoing and continual performance improvement, and to understand how much of an impact single changes might make. This means that what seems like a simple project to change the way we read header requests can produce asymmetrically favorable results.
And, there’s a layer of this that’s always going to come down to design decisions. For example, we’ve talked about some of the logic behind where our architecture knows which server to store data on. Basically, our system chooses to store a new file based on the available space of each server. So, if we have a server that has 40% space available, it would receive 40% of the incoming storage writes. (That’s a bit of an oversimplification, but you get the idea.)
Other cloud storage providers might prioritize, say, randomness in their write architecture. When a request would enter their system, the routing protocol would say, “Hey, we haven’t written to this server over here in a while,” and write it in that sector. It’s a different choice that can have a subtle ripple effect across different aspects of storage architecture.
What’s next?
Our performance story is one of steady, measurable progress. We’re not optimizing for a single headline number; we’re building toward consistent reliability across diverse workloads. That’s why we test openly, publish what we find, and continuously refine how we measure.
Looking ahead, our next Performance Stats report will continue to share these findings quarterly, which will give us all a more mature dataset to work with, and will expand testing. This isn’t just a transparency exercise for us, it’s a commitment to the developers and teams building on Backblaze: you deserve data you can trust—and we intend to keep earning it.
We’d love it if others—third parties and our competitors—also got involved, but we’ll see how things evolve. For now, feel free to let us know if these tests work for you.
Disclaimer: The performance data and comparisons presented here are based on tests conducted by Backblaze under the specific environments, configurations, and conditions described in this post. Actual results may vary depending on network conditions, workloads, geographic location, and other factors.
Backblaze has published its testing methodology so others can replicate or challenge the results; however, Backblaze makes no representation or warranty that its tests capture all possible variables or configurations. The information is provided for general informational purposes only and does not constitute a guarantee of future performance. In addition, the information in this post is based on data available at the time of publication, and Backblaze reserves the right to update or revise this information as new data, testing methodologies, or performance results become available.
All product names, trademarks, and registered trademarks are property of their respective owners. References to third-party products or services are for identification purposes only and do not imply endorsement or affiliation.
Every quarter, Drive Stats gives us the numbers. This quarter, it gave us a crisis of meaning. What does it really mean for a hard drive to fail? Is it the moment the lights go out, or the moment we decide they have? Philosophers might call that an ontological gray area. We just call it Q3.
As of June 30, 2025, we had 332,915 drives under management. Of that total, there were 3,970 boot drives and 328,348 data drives. Let’s dig into our stats, then talk about the meaning of failure.
This quarter, we have more to talk about (Stats-wise)
Drive Stats was the beginning. Want to see more of the full picture? Check out the Stats Lab webinar, bringing together content from all of our Stats articles. We’re going to chat about all things Backblaze (and beyond)—by the numbers.
Drive Stats: The digest version
Q3 2025 hard drive failure rates
During Q3 2025, we were tracking 328,348 storage drives. Here are the numbers:
Backblaze Hard Drive Failure Rates for Q3 2025
Reporting period July 1, 2025–September 30, 2025 inclusive Drive models with drive count > 100 as of July 1, 2025 and drive days > 10,000 in Q3 2025
Notes and observations
The failure rate has increased: The failure rate has changed, and by quite a bit. As a reminder, last quarter’s AFR was 1.36% compared with this quarter’s 1.55%. (Interestingly, the 2024 yearly AFR was 1.57%.)
That new drive energy: Say hello to the 24TB Toshiba MG11ACA24TE, joining the drive pool with 2,400 drives and 24,148 drive days. That means that we’ve hit the thresholds for the quarterly stats, but not the lifetime.
The zero failure club: It was a big month for the zero failure club, with four drives making the cut:
Seagate HMS5C4040BLE640 (4TB)
Seagate ST8000NM000A (8TB)
Toshiba MG09ACA16TE (16TB)
Toshiba MG11ACA24TE (24TB)—and yes, that’s the new drive.
For those of you tracking the stats closely, you’ll notice that the Seagate ST8000NM000A (8TB) is a frequent flier on this list. The last time it had a failure was in Q3 2024—and it was just a single failure for the whole quarter!
The highest AFRs were really high: The high end was so high that this month, it inspired us to run an outlier analysis using the standard quartile analysis (Tukey method). Based on that information, any drive with a quarterly AFR higher than 5.88% is an outlier, and there are three:
Seagate ST10000NM0086 (10TB): 7.97%
Seagate ST14000NM0138 (14TB): 6.86%
Toshiba MG08ACA16TEY (16TB): 16.95%
What’s going on there? Great question, and we’ll get into that after the lifetime failure rates.
Lifetime hard drive failure rates
To be considered for the lifetime review, a drive model was required to have 500 or more drives as of the end of Q2 2025 and have over 100,000 accumulated drive days during their lifetime. When we removed those drive models which did not meet the lifetime criteria, we had drives grouped into 27 models remaining for analysis as shown in the table below.
Backblaze Hard Drive Failure Rates for Q2 2025
Reporting period ending September 30, 2025 Drive models > 500 drives and > 100,000 lifetime drive days
Notes and observations
That lifetime AFR is pretty consistent, isn’t it? The lifetime AFR is 1.31%. Last quarter we reported that it was 1.30%, and the quarter before that, it was 1.31%.
The 4TB average age hasn’t shifted: As we’ve reported on previously, the 4TB drives are being decommissioned over time. Now, we’re down to just a handful left—just 11 of the ALE models and 187 of the BLE models. But, because their lifetime populations are so comparatively large, the additional drive days aren’t enough to move the needle on the average age in months. So, no ghosts in the machine here, and decommissioning is proceeding as planned.
Steady uptick in higher capacity drives: Of the 20TB+ drives that meet our lifetime data parameters, we’ve added 7,936 since last quarter. And, don’t forget that our newest entrée to the cohort, the Toshiba MG11ACA24TE (24TB), hasn’t made its way to this table yet—that adds an additional 2,400 drive models. All together, the 20TB+ club represents 67,939 drives, or about 21% of the drive pool.
Defining a failure—from a technical perspective
A question that’s come up a few times when we’re hosting a webinar or chatting in the comments section is how we define a failure. While it may seem intuitive, it’s actually something of a meaty conundrum, and something we haven’t addressed since the early days of this series. Tracking down the answer to this question touches internal drive fleet monitoring tools (via SMART stats), the actual Drive Stats collection program, and our data engineering layer. I’ll dig into each of these in detail, then we’ll take a look at the outliers for this quarter.
SMART stats reporting
We use Smartmontools to collect the SMART attributes of drives, and another monitoring tool called drive sentinel to flag read/write errors that exceed a certain threshold as well as some other anomalies.
The main indicator we use for determining if a drive should be replaced is when it responds to reads with uncorrectable medium errors. When a drive reads the data from the disk, but the data fails its integrity check, the drive will try to reconstruct the data using internal error correction codes. If it is unable to reconstruct the data, it notifies the host by reporting it as an uncorrectable error and marks that part of the disk as pending reallocation, which shows up in SMART under an attribute like Current_Pending_Sector.
On Storage Pods that control drives through SATA links, the drive sentinel will count the number of these uncorrectable errors a drive reports and if it exceeds a threshold, access to the drive will be removed. This is important in the classic Backblaze Storage Pods where five drives share a single SATA link and errors by one drive will affect all drives on the link.
On Dell and SMCI pods that use a SAS topology to connect drives, drive sentinel doesn’t remove access to drives because the errors are reported differently; but, that’s also not as critical since SAS minimizes the impact that a problem disk can have on others.
The Drive Stats program
We’ve talked about the custom program we use to collect Drive Stats in the past, and here’s a quick recap:
The podstats generator runs on every Storage Pod, what we call any host that holds customer data, every few minutes. It’s a C++ program that collects SMART stats and a few other attributes, then converts them into an .xml file (“podstats”). Those are then pushed to a central host in each datacenter and bundled. Once the data leaves these central hosts, it has entered the domain of what we will call Drive Stats.
For this program, the logic is relatively simple: A failure in Drive Stats occurs when a drive vanishes out of the reporting population. It is considered “failed” until it shows up again. Drives are tracked by serial number and we report daily logs on a per-drive basis, so truly, we can get pretty granular here.
The data engineering layer
To recap, we’ve collected our SMART stats and compiled them with the podstats program. Now we’ve got all the information, and data intelligence needs to add the context. A drive may go offline for a day or so (not return a response to those tools that collect daily logs of SMART stats), but it could be something as simple as a loose cable. So, time-wise, if a drive reappears after one day or 30, at what point in that period of time do we classify it as an official failure?
Previously, we manually cross-referenced data center work tickets, but these days, we’ve automated that process. On the backend, it’s a SQL query, but in human speak, this is what it comes down to:
If a drive logs data on the last day of the selection period (which in this case is a quarter) then it has not failed.
There are three human-curated tables that the query cross references. If a drive serial number appears on one of them, it tells us whether there’s a failure or not (depending on the table’s function).
If the drive serial number is the primary serial number in a drive replacement Jira ticket then it has failed. (Jira is where we track our data center work tickets.)
If the drive serial number is the target serial number in a clone Jira ticket or a (temp) replacement ticket, then it has not failed.
Basically, when we go to write the Drive Stats reports at the end of the quarter, if a drive has either appeared in one of our various work trackers or hasn’t re-entered the population, then it’s considered failed.
In rare instances, that can mean that we have so-called “cosmetic” failures when we have some work we’re doing on a drive model that lasts more than that quarterly collection period. And, spoiler, we have one of those instances that showed up in the data this month—our outlier Toshiba drive with the 16.9% failure rate. We’ll dig in in just a minute; but first, some context.
Connecting drive failure to overall picture of the drive pool
As we mentioned above, certain drives in the pool had such high swings in AFR that we ended up running an outlier analysis using the quartile method. (It’s also worth mentioning that a cluster analysis could potentially be a better fit, but we can save that for another day.) Based on that analysis, anything that has above a 5.88% failure rate is an outlier.
The primary motivation was inspired by an attempt to visualize the relationship between the age in months of a drive versus this quarter’s AFRs.
And yes, we’re fully aware that that’s a… super unreadable scatter plot. Removing the labels, this is a bit better:
We’re interested, really, in the shape of the relationship. If we posit that the older drives get, the higher their failure rates, you’d expect a larger concentration in the top right quadrant. But, our data follows a much more interesting pattern than that, with most of our data points concentrated in the lowest regions of the graph regardless of age—something you’d expect from a set of data that reflects a bunch of smart folks actively working towards the goal of a healthy drive population. And yet, we have some data points that break the mold.
As is pretty intuitive to my business intelligence folks in the audience, the process of identifying outliers is actionable data as well. Just like all press is good press; in our world, more data is more better. So, let’s take a closer look at those outliers. As a reminder, that’s these three drive models:
Seagate ST10000NM0086 (10TB): 7.97%
Seagate ST14000NM0138 (14TB): 6.86%
Toshiba MG08ACA16TEY (16TB): 16.95%
Seagate ST10000NM0086 (10TB)
This drive has some pretty explainable factors for the high failure rate. It’s well over seven years old (92.35 months). And, since it only has 1,018 drive models in operation, single failures hold a lot of weight compared with the average drive count per model—which comes in at 10,952 if you use the mean of this quarterly data and 6,177 if you use the median.
And, you can see that borne out in the trend in the last year of data:
Seagate ST14000NM0138 (14TB)
This drive is nearing five years in age (56.57 months) and, again, has a lower drive count at 1,286. More importantly, this particular drive model has had historically high failure rates. In parallel with above, here’s the last year of quarterly failure rates:
Toshiba MG08ACA16TEY (16TB)
Finally, our Toshiba model is the most interesting of all. It’s less than four years old (44.61 months), and has 5,145 drives in the pool. And, this quarter is clearly a change from its normal, decent, AFRs.
When we see deviations like this one, it’s usually an indication that there’s something afoot.
Never fear, Drive Stats fans; this was a known quantity before we went on this journey. This past quarter, working with Toshiba, we deployed some firmware updates they provided to optimize performance on these drives. Because we needed to pull drives to achieve this in some cases, we had an abnormal number of “failed” drives in this population.
What that means for this drive is that it’s actually not a bad drive model; and, given the ways we and Toshiba have worked together on a fix, we should see failure rates normalizing in the near future. And, this also goes back to our conversation of defining a failure—in this case, while the drives “failed,” the failure wasn’t mechanical and was based on something that we’ll be able to fix without replacing the drives. In short, don’t sweat the spike and pay attention to the long arc of performance on this population. We expect to see those drives happy and spinning for years to come (and with better performance, too).
The Hard Drive dataset (and beyond)
Thank you, as always, for making it through ~2,500 or so words to examine the fun side of data. Here’s our standard fine print:
The complete dataset used to create the tables and charts in this report is available on our Hard Drive Test Data page. You can download and use this data for free for your own purpose. All we ask are three things:
You cite Backblaze as the source if you use the data;
You accept that you are solely responsible for how you use the data, and;
You do not sell this data itself to anyone; it is free.
If you’re a new Drive Stats fan, consider signing up for the newsletter. If you’re not ready for that kind of commitment, sound off in the comments section below or reach out directly to us to let us know what you’re working on. Happy investigating!
The way data moves is changing in the age of AI. As AI training, model tuning, and inferencing accelerate massive, unpredictable flows of data across clouds, our network telemetry here at Backblaze offers a real-world view into the AI data gravity shift: where data lives, how it moves, and what it takes to keep it accessible and affordable.
Over the past couple of years, we’ve shared Network Stats snapshots that shed light on how data moves across Backblaze’s storage cloud. This quarter, we’re taking that foundation further, and evolving this series into a full-fledged transparency report that stands alongside Drive Stats with regular quarterly reporting and stats you can analyze for yourself.
This report isn’t just about traffic patterns. It’s a look at how data movement is changing in the age of AI and what those shifts reveal about performance, cost, and resilience at scale.
Tune in live for The Stats Lab webinar
Drive Stats was the beginning. Want to see the evolution? Check out the Backblaze Stats Lab webinar, bringing together content from all of our Stats articles. We’re going to chat about all things Backblaze and beyond—by the numbers.
In this first report, we’re going to outline the fundamentals of our dataset, highlight standout examples for AI related traffic, and lay the foundation to start sharing our quarter-over-quarter metrics.
Dataset details
Our internal tools allow us to capture network flow data, meaning transmission control protocol (TCP) conversations between parties on our network. Along with basic information such as who is talking and how many bits are being exchanged, we have the ability to record additional pieces of anonymized information like what country, what ISP, or if we’ve seen a particular IP address before. And for each of these metrics, we have numbers for the average, 95th percentile, and maximum values.
Let’s talk about the three elements that make up our dataset: time, values, and metadata.
1. Monthly time slices
For every month, for every region, and for each direction (egress and ingress), we are data warehousing the following metrics. We plan on either using month-by-month numbers, or rolling up into a quarterly value for Network Stats reports going forward.
Item
Detail
Date range
Every month
Location scope
Every region (eg US-West, EU-Central)
Network traffic direction
Ingress, egress
2. Metric values
For each monthly snapshot, we’re recording the following details in our data warehouse. Capturing the average, 95th weighted value, and the maximum allows us enough information to profile our traffic.
The 95th value (discarding the highest 5% bursts) gives us a good profile for daily operations and the maximum helps profile bust traffic.
The most interesting metrics that I’m excited to explore are the “bits per IP” values. This combination of “amount of traffic” transferred with “how many actors are involved” per network is a good proxy for what I’m calling the “magnitude” of the network flow. We’re exploring the first insight into this metric below in our chart section.
Defining the Network Stats Quarterly Data
Item
Field(s)
Detail
Name
name
asn
Common name and BGP ASN of the network
Bits
bits_avg
bits_95th
bits_max
Number of bits/second
Packets
packets_avg
packets_95th
packets_max
Number of packets/second
Flows
flow_avg
flow_95th
flow_max
Number of TCP flows
IPs
ip_unique_avg
ip_unique_95th
ip_unique_max
Number of unique IP addresses
Bits per IP
bits_ip_avg
bits_ip_95th
bits_ip_max
Number of bits per IP address
Protocol
v4
v6
Amount of traffic using IPv4 vs IPv6
3. Additional metadata
One of the first custom additions to our dataset is a category field. This helps us define the BGP ASNs (Autonomous System Number), basically the organizations common name associated with a range of IP addresses, that we talk to and group them into categories such as neocloud, hyperscaler, CDN, or general ISP.
Additional Network Stats Metadata
Item
Field
Detail
category
group
The class of network carrying the traffic (Cloud, PNI, traditional Internet Transit, or Internal Backblaze-Backblaze)
category
type
The type of network receiving the traffic (Neocloud, Hosting/Compute provider, Hyperscaler, CDN, Regional ISP, more localised ISP, etc)
The global picture
We started capturing this dataset in August of 2025, so we don’t yet have a good amount of data to pull out quarter over quarter trends. But what we can do for now is take a look into some standout metrics for the month of August that we’re interested in tracking over time.
First let’s take a look at where all our traffic goes from a global perspective.
Sankey diagram of all August ingress and egress traffic grouped by type of network
When we look at the data, one pattern stands out immediately: traffic associated with neocloud networks—cloud providers offering compute, GPU, or other AI-related services—already represents nearly a quarter of total ingress and egress across Backblaze’s network. That’s a meaningful signal. Historically CDN traffic has been the majority of our traffic as our B2 Object Storage has been growing. Now, we’re seeing clear evidence of a new class of workload emerging, and it’s AI-shaped.
Neocloud network behavior
Let’s look at the magnitude of our network traffic based on the category of the traffic destination. To help quantify our data set, we interact with around 123,000 unique IP addresses every month.
“Magnitude” bits per IP address on a log scale
CDN, hyperscaler, isp-regional, and isp-tier one traffic cluster in the same general range of bits per IP, but neoclouds have a couple outliers—the two purple data points in the upper right corner of the log scale graph.
If we change the scale to linear (chart below), now we can see how much of an outlier the AI related traffic is in our sample range.
“Magnitude” bits per IP address on a linear scale
The “magnitude” (as we’re calling it) of the transfers we’re servicing for AI related flows to neoclouds is an order of magnitude greater than all our traffic patterns. This means that there are only a few unique IP addresses that we’re interacting with transferring large amounts of data in their flows.
The rise of AI-driven data movement
Over the past year, AI training and inference have transformed global data flows. Where traditional workloads move steadily, AI workloads move in bursts—rapid retrievals of massive datasets, short high-volume transfers for model training or tuning, and sustained outbound throughput for inferencing pipelines. The magnitude metric we’re introducing (bits per IP address) captures this shift.
As shown in the charts above, AI-related traffic to neoclouds isn’t just heavier, it’s denser. Those purple data points represent a small number of IPs exchanging a disproportionate amount of data. That concentration of flow is a hallmark of AI compute pipelines, where a few high-bandwidth endpoints (often GPU clusters) interact with object storage to repeatedly feed and retrieve training data.
In other words:
Fewer talkers, bigger flows. AI systems operate in fewer, more intense network sessions than traditional applications.
Shorter duration, higher peaks. Transfer patterns spike sharply, often corresponding to dataset replication or model checkpointing cycles.
Cross-cloud mobility. Much of this traffic routes between Backblaze and external compute platforms (classified as neoclouds) showing the rise of multi-cloud AI architectures.
The macro trend: The AI data gravity shift
This pattern reflects a broader macro trend in the cloud ecosystem: AI data gravity is pulling more storage and compute closer together. As AI models grow larger and datasets become more complex, organizations are rethinking where data “lives.” Instead of centralizing everything in one hyperscaler like AWS or Google Cloud Platform, they’re increasingly using cost-efficient, high-throughput storage clouds like Backblaze connected to specialized GPU clouds for compute (case in point: Why CoreWeave’s Object Storage Launch is Good for AI—and Everyone Building It).
This architectural shift explains the outlier traffic patterns we’re seeing on our network. Data isn’t just moving more—it’s moving smarter, following cost, performance, and regional availability cues.
Why it matters
Tracking this kind of data movement and magnitude helps us, and more importantly our customers, understand a few key things:
Operational readiness for AI workloads: How our network scales under bursty, compute-linked demands. (For more on this check out Making the Backblaze Network AI Ready)
Cost predictability: Where and when ingress or egress volume spikes may occur.
Industry evolution: How AI is reshaping the underlying patterns of internet traffic.
What’s next?
This is just the first glimpse of that industry evolution. As our dataset matures, we’ll be able to watch these AI-linked flows change quarter over quarter, offering not just transparency, but a longitudinal view of how the data backbone of the AI economy takes shape.
We’re planning to look at quarter over quarter number tracking for network types, IPv4 traffic vs IPv6 traffic, AI related workflows, cross-cloud connectivity trends, and more. We’re also planning to release the raw data quarterly going forward.
Anything specific you want to see? Let us know in the comments or reach out to our Evangelism team.
We’re excited to share these insights from our network telemetry, the patterns we’re seeing, and what they mean for the broader data economy. This is the stuff we stay up at night studying, and sharing it publicly means we can all better understand the forces shaping digital infrastructure and build with greater confidence and foresight.
It’s no secret that Kubernetes is the de facto container orchestrator for scaling containerized applications. As the Backblaze team gets ready to head to KubeCon North America, we’ve been exploring the ecosystem of tools and integrations that make it easier to store application data in S3 compatible object storage.
From workarounds that make an object storage bucket behave like a persistent volume to cluster backups and early Cloud Native Computing Foundation (CNCF) storage projects we’re excited to watch, here’s a quick guide to making object storage services like Backblaze B2 Cloud Storage work (as close to) seamlessly with your Kubernetes clusters.
Mountpoint for Amazon S3 CSI Driver
AWS Labs released the mountpoint for Amazon S3 container storage interface (CSI) driver to allow Kubernetes clusters to access files in object storage through a file system interface. Essentially, this mountpoint disguises S3 compatible object storage as a persistent storage volume so the Kubernetes cluster can access your object storage without the need for another tool or integration. This also works with other S3 compatible storage services, including Backblaze B2. Check out our GitHub repo for step by step instructions on how to deploy a sample application to test with B2, or see this in action during our upcoming webinar, The State of K8s + S3 Compatible Storage.
MinIO
MinIO is a popular tool for running object storage natively inside Kubernetes clusters, by exposing data through standard APIs to enable containerized application to store, retrieve, and manage unstructured data. MinIO designed to run natively in Kubernetes, and allows you to bring-your-own S3 compatible storage or use your device’s local storage for a self-hosted solution. MinIO is flexible enough for individual developers to experiment with, but its power comes from its scalability, with 77% of Fortune 500 companies using MinIO in their cloud native workloads.
Velero
Rapidly creating and deleting infrastructure, and being able to quickly rebuild and recover are core tenets of Kubernetes. Velero makes it incredibly easy to back up Kubernetes clusters to your preferred object storage service. Run one-off backups as needed with one simple command, or set up a schedule to make sure your clusters are backed up consistently.
Read more about Kubernetes cluster security and backup strategy.
Rook
Rook is a storage orchestrator for Kubernetes that manages distributed storage systems (including Ceph and Cassandra) as native Kubernetes resources. Though Rook’s functionality doesn’t directly extend to S3 compatible object storage like Backblaze B2, you can mirror the data to B2 or set up your preferred object storage service as a backup destination.
Container Object Storage Interface (COSI) (Currently available in Alpha)
The COSI project is a set of abstractions currently available in Alpha that aims to provide Kubernetes with the ability to request and provision object storage buckets from multiple cloud vendors, similar to how file/block storage is abstracted with the CSI driver. Since each cloud provider builds out object storage differently, COSI intends to provide a unified set of protocols so Kubernetes can be inclusive to all object storage vendors, and adhere to the Kubernetes portability tenet.
Learn more about these tools, see a demo of how to attach a Backblaze B2 bucket via the mountpoint for Amazon S3 CSI driver, and get some initial key takeaways from KubeCon North America during our upcoming webinar, The State of K8s + S3 Compatible Storage. Register to watch live on November 20, 2025 and get access to an on-demand recording.
AI isn’t just reshaping how data is processed—it’s rewriting how data moves. Behind every training run or inference pipeline is a torrent of data, and how efficiently (or not) that data travels through networks (and whether it’s an AI-ready network) can make or break performance.
Data workloads have massively evolved over the 18 years we’ve been in business from computer backups to exabyte-scale storage to AI data pipelines. And that has implications for not just our storage hardware, but our network.
What started as a single ISP serving a few racks in the early days has grown into a global, multi-terabit backbone connecting customers, compute, and storage in real time via multiple Tier 1 carriers, Internet Exchanges, and PNI links.
So why talk about it now? Because AI is testing the limits of every part of the infrastructure stack—and the network is where those limits are most visible. Running an AI-ready network means rethinking how you design, route, and scale traffic to handle not just more data, but faster, more synchronized, and more resilient data movement than ever before.
In this post, I’m talking about how our network has evolved to support AI workflows, including what’s changed under the hood, how we’re adapting our hardware and architecture, and what that means for the way data moves through Backblaze today.
Go with the flow
The Network Engineering (NetEng) group at Backblaze is responsible for the design, implementation, and support of our physical network—everything from the physical copper and fiber cables inside our datacenters to the routers and switches that connect our storage to the world.
When we talk about network traffic, we often refer to a “flow”—a stream of information sent between two or more parties. Downloading a file? That’s a flow between your computer and the server offering the file. Multiple small requests loading a website (text, formatting code, animation code, etc.)? Those are known as “mouse” flows. Massive dataset transfers that sustain hundreds of gigabits per second? Those are “elephant” flows.
The elephant in the room
AI workloads are the largest “elephant” flows our network has ever sustained. These aren’t just big files, they’re ecosystems of data: multi-petabyte datasets, hundreds of thousands of objects ranging from a single megabyte to hundreds of megabytes per object, and thousands of simultaneous connections working in parallel.
Moving these data sets around is no small task. It means engineering for sustained, lossless throughput. It’s cutting edge, using many machines to perform parallel operations, all at large transfer rates. Let’s say we’re the source of a dataset that is being transferred to a neocloud for processing, the processing layers (often GPUs) want a continuous stream of high bandwidth with no loss. And a single dropped packet in a training pipeline can trigger expensive re-requests, idle GPUs, and cascading slowdowns.
With that in mind, we’ve evolved our infrastructure from traditional cloud networking—designed for smaller flows—to handle the relentless firehose of AI data.
Traditional cloud vs AI cloud
AI changes everything about traffic behavior. It doesn’t just mean that our total capacity is bigger, but also that our considerations for how we design, support, and scale our infrastructure morphed along with our capacity upgrades.
Here’s a quick overview of the former challenges and the new ones we’re engineering to serve our AI workflows.
Traditional Cloud Network
AI Cloud Network
Small to large flow sizes (megabits to, gigabits)
Very large flows (multi-gigabit to terabit)
High entropy flows (many sources and destinations)
In short: AI traffic is heavier, stickier, and far less forgiving. So the goal is to design networks that can transfer 100Gbps, 200Gbps, and up to 1,000 Gbps (1 Terabit) a second with a low latency, low jitter, and a zero loss profile. Simple right?
Hardware network upgrades
To meet these new demands of AI workflows, we’ve upgraded nearly every layer of our physical infrastructure. We needed to increase the density of our networking hardware, deploy denser fiber optic solutions, and upgrade the capacity of our edge network.
What technologies are we deploying?
1. Transitioning from NRZ to PAM4 Optics
The fiber optic modules that are used to connect all our infrastructure hardware (servers, switches, routers) have been transitioned to modules that support a denser encoding method. Both NRZ and PAM4 are technologies used to modulate signals. Think of NRZ as a one-lane highway with one passenger per car. PAM4 adds three more passengers per car, doubling the rate without doubling lanes and with controllable cons such as increased noise sensitivity. By using four voltage levels instead of two, PAM4 transmits twice the information per signal change, effectively doubling bandwidth per fiber strand.
Comparison of (NRZ) and (PAM4) signals
2. MTP-8 and MTP-16 Fiber
MTP is a fiber connector type and the number after denotes the number of fiber optic strands contained within the cable. The higher the number, the more fiber pairs in the cable. We’ve used MTP-8 for years (four pairs of fiber), but to handle AI-scale traffic, we’re now deploying MTP-16 for higher-density connections. That means where we once ran 100G links, we now run 400G—and can scale up to multiple 100G paths as workloads grow (4x100G, 8x100G, etc).
3. Expanding edge and core capacity
We’ve refreshed routers and switches to handle higher port speeds and density—moving from 100G to 400G interfaces across our interconnects. The result: higher aggregate throughput and better fault isolation for massive parallel transfers.
Visualizing an AI workflow
Our monitoring tools track network flows (TCP conversations) in real time, giving us visibility into how large AI workflows move across the infrastructure. We use this type of information to monitor and make sure that large workflows are distributed across our physical infrastructure to allow for traffic balancing.
So, what does a large “AI workflow” look like? It’s not one device talking to one device at a high rate, but rather a collection of actors all working together.
On our side, our API layer speaks to our storage layer, requesting the files. Once the files are retrieved from our storage layer, they flow through our API servers and are then sent to a destination. In order to achieve a high throughput, many API servers talk to many destination servers.
A typical 200+ Gbps transfer (diagrammed below) might involve four API virtual IPs (VIPs), each hosted on multiple backend servers sending 5–7 Gbps to ten destination nodes for a total output of 52Gbps from each API server. On the receiving side, each destination server might be ingesting 20Gbps across multiple streams.
AI data transfer from Backblaze (left) and client servers (right)
The key insight: AI data transfer isn’t one big pipe—it’s a distributed mesh of many coordinated streams. Our design scales linearly—add more API servers, add more destination nodes, and the flow grows predictably without congestion or packet loss.
Conclusion
AI workflows have redefined what “fast” means on the network. At Backblaze, we’ve evolved from a single-ISP startup to an AI-scale infrastructure provider by continuously pushing the boundaries of connectivity, throughput, and reliability.
As our customers push the frontiers of AI, we’ll keep tuning the invisible layer that makes it possible: the AI-ready network.
CoreWeave just launched their own AI Object Storage. Our take? We love to see it.
At first glance, it might look like a competitive offering, but as far as we’re concerned, the more storage options out there, the better for builders. It’s another sign that object storage has officially arrived as a key ingredient in the AI stack.
Now, your AI stack can look like this: Fast, flexible storage close to your GPUs from CoreWeave (essential for training and inference). And when the run’s over? Move it to Backblaze B2 Overdrive to keep it ready for your next run at the right temperature and price-to-performance ratio.
More options mean more ways to build smart, cost-efficient pipelines that let teams train faster and iterate more without getting locked in. We’ll always cheer for that.
Why object storage is essential for AI workloads
How do you balance scalability with performance while staying on budget? This ebook explores how object storage enhances every stage of the pipeline from collection to training to deployment, and provides real-world use cases.
Why object storage matters in the AI stack
Every AI model depends on moving massive datasets through training, inference, and retraining cycles. Each stage requires fast, reliable access to data. That’s where object storage comes in.
Object storage enables this by offering:
Elastic scalability for petabyte-scale data.
Reliability and durability across long model lifecycles.
Lifecycle management features to balance cost, performance, and accessibility.
As AI projects scale, smart data management becomes just as important as GPU performance. High-end GPUs can only deliver full value when they’re continuously fed the right data at the right time. When data sits in the wrong tier or takes too long to retrieve, compute resources go underused. And that means wasted time and money.
Balancing performance and cost in AI workloads
CoreWeave’s Local Object Transport Accelerator (LOTA) delivers up to 7GB/s throughput per GPU, helping data move quickly between storage and compute. With pricing around $110 per terabyte (about $60 with discounts) and regional capacity up to 10TiB, it’s built for performance-critical workloads where proximity to GPUs makes a measurable difference.
Its launch adds more choice to the ecosystem and highlights the growing demand for storage built specifically for AI. As more specialized options emerge, organizations are thinking carefully about how to right-size their infrastructure for each stage of the AI lifecycle.
When maximum performance is the goal, GPU-adjacent storage like CoreWeave’s can help teams squeeze out every last bit of speed during intensive training cycles. But for most AI workloads, B2 Overdrive provides the right balance of cost and performance. It offers the throughput and durability needed to support active training while keeping pricing predictable and scalable.
Many AI builders combine these strengths through a multi-cloud setup. Teams might use CoreWeave Object Storage when latency and proximity to GPUs deliver measurable gains, and then keep the rest of their AI pipeline on B2 Overdrive so datasets remain readily available for retraining, testing, or deployment.
Example configuration:
CoreWeave Object Storage for specialized, compute-intensive training where every millisecond counts. It’s ideal for short bursts of high-throughput processing, such as large-scale model fine-tuning or time-sensitive inferencing.
B2 Overdrive for the broader AI workflow, including day-to-day training, staging, versioning, and long-term dataset management. It provides the performance needed for ongoing model development while keeping data costs predictable and accessible across teams and environments.
B2 Overdrive offers:
Storage at roughly $15 per terabyte
High throughput and rapid access for post-training workflows
Simple APIs and event notifications to automate data movement across environments
This kind of architecture gives teams the freedom to use each platform where it shines. Backblaze handles the heavy lifting for most workloads, while CoreWeave adds targeted acceleration when raw GPU performance is the top priority. The result is a flexible, cost-aware workflow that supports both innovation and scale.
AI infrastructure that plays to every strength
The most effective AI setups use the right cloud for the right job. They run training where GPUs can perform at their peak, and store data where it stays organized and ready to move when needed.
B2 Overdrive provides a foundation for this strategy, offering a layer of object storage that keeps data secure, accessible, and easy to integrate across environments. Teams can combine each platform’s strengths to achieve speed when it’s needed, scalability that endures, and freedom from lock-in and runaway costs.
The AI ecosystem is expanding, and with the right partners, so are the possibilities.
Cloud storage was supposed to simplify infrastructure. Instead, it’s become one of the most unpredictable—and expensive—line items in IT budgets.
A new Dimensional Research report, commissioned by Backblaze, reveals that 95% of organizations experience unexpected cloud storage charges—costs that disrupt budgets, slow innovation, and limit flexibility.
The 2025 study surveyed more than 400 IT decision makers responsible for managing at least 250TB of data in the public cloud. The findings make one thing clear: as AI, analytics, and data-intensive workloads expand, hidden costs and limited interoperability are forcing companies to rethink their cloud strategies.
The problem: Hidden fees are everywhere
According to the research, nearly every organization surveyed has been hit by surprise charges like retrieval, egress, or PUT fees.
95% of respondents reported unexpected costs for cloud storage usage.
Larger organizations—those with more than 5PB of data—were even more likely to experience frequent charges.
These hidden costs have become such a burden that 85% of companies are taking steps to manage them. The top tactics include:
Reducing the size of datasets stored in the cloud (56%)
Shortening storage duration policies (45%)
Cutting spending elsewhere in the tech stack (40%)
In short: IT teams are making trade-offs to avoid surprise costs—trade-offs that can limit innovation and reduce the value of their data
Egress costs are locking companies in
One of the most striking findings:
55% of respondents said that the cost of egressing and moving data is the biggest barrier to switching cloud storage providers.
That means many organizations feel trapped in their current solutions—not because the technology is best-in-class, but because moving their data would be too expensive.
This dynamic creates what’s often called a “walled garden” effect—where providers profit from data lock-in rather than delivering value through performance or innovation.
The result? Slower cloud adoption, limited agility, and higher total cost of ownership for IT teams trying to scale modern workloads.
Flexibility and interoperability are the new imperatives
If cost surprises weren’t enough, nearly all respondents (99%) said that limited flexibility and lack of interoperability are impacting their ability to deliver and scale.
In other words: even when data is stored safely, it’s often stuck—difficult to move, integrate, or use across tools and platforms.
This friction hits hardest at large enterprises and data-heavy organizations that depend on cross-cloud workflows, hybrid architectures, or AI pipelines that require moving large volumes of data frequently.
A turning point for cloud storage strategy
With 62% of respondents preferring to select best of breed providers vs. one-stop-shops, these findings highlight a growing shift:
IT teams are no longer choosing cloud providers solely based on performance or ecosystem.
They’re prioritizing predictability, transparency, and interoperability—the ability to move and use data freely, without hidden penalties.
Backblaze has long championed this model with open cloud storage that puts customers—not pricing structures—in control. Our egress fee transparency, S3 compatible APIs, and simple pricing are designed to eliminate the pain points identified in this report.As one respondent put it: “We need a cloud partner that helps us use our data, not pay to move it.”
What’s next: Join the conversation
The full report—The Hidden Cost of Cloud Object Storage—is now available for download. Inside, you’ll find all the data, charts, and insights from 400+ IT leaders across industries and company sizes.
And, to dive deeper into the findings, join us for an upcoming live webinar with experts from Dimensional Research and Backblaze. We’ll unpack the key trends, share real-world stories from IT leaders, and discuss how to build a more transparent, flexible cloud strategy.
About the research
The survey, conducted by Dimensional Research in May–June 2025, included responses from 403 qualified technology stakeholders responsible for cloud storage strategy and budgets. All participants represented companies with over 250TB of data stored in the public cloud.
To provide the best experiences, we use technologies like cookies to store and/or access device information. Consenting to these technologies will allow us to process data such as browsing behavior or unique IDs on this site. Not consenting or withdrawing consent, may adversely affect certain features and functions.
Functional
Always active
The technical storage or access is strictly necessary for the legitimate purpose of enabling the use of a specific service explicitly requested by the subscriber or user, or for the sole purpose of carrying out the transmission of a communication over an electronic communications network.
Preferences
The technical storage or access is necessary for the legitimate purpose of storing preferences that are not requested by the subscriber or user.
Statistics
The technical storage or access that is used exclusively for statistical purposes.The technical storage or access that is used exclusively for anonymous statistical purposes. Without a subpoena, voluntary compliance on the part of your Internet Service Provider, or additional records from a third party, information stored or retrieved for this purpose alone cannot usually be used to identify you.
Marketing
The technical storage or access is required to create user profiles to send advertising, or to track the user on a website or across several websites for similar marketing purposes.



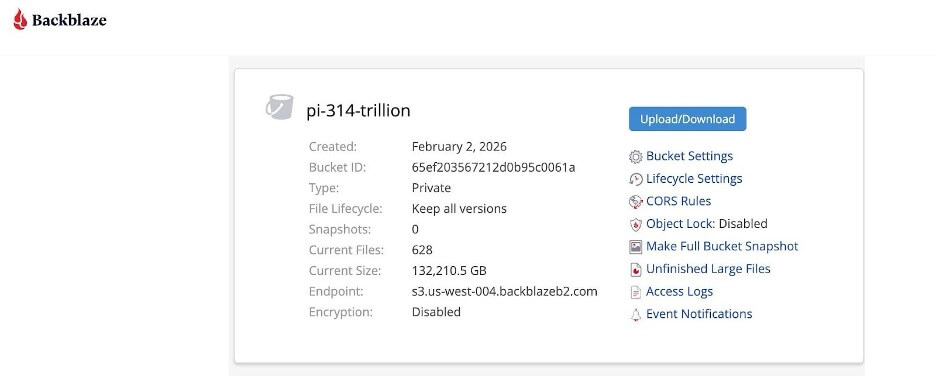



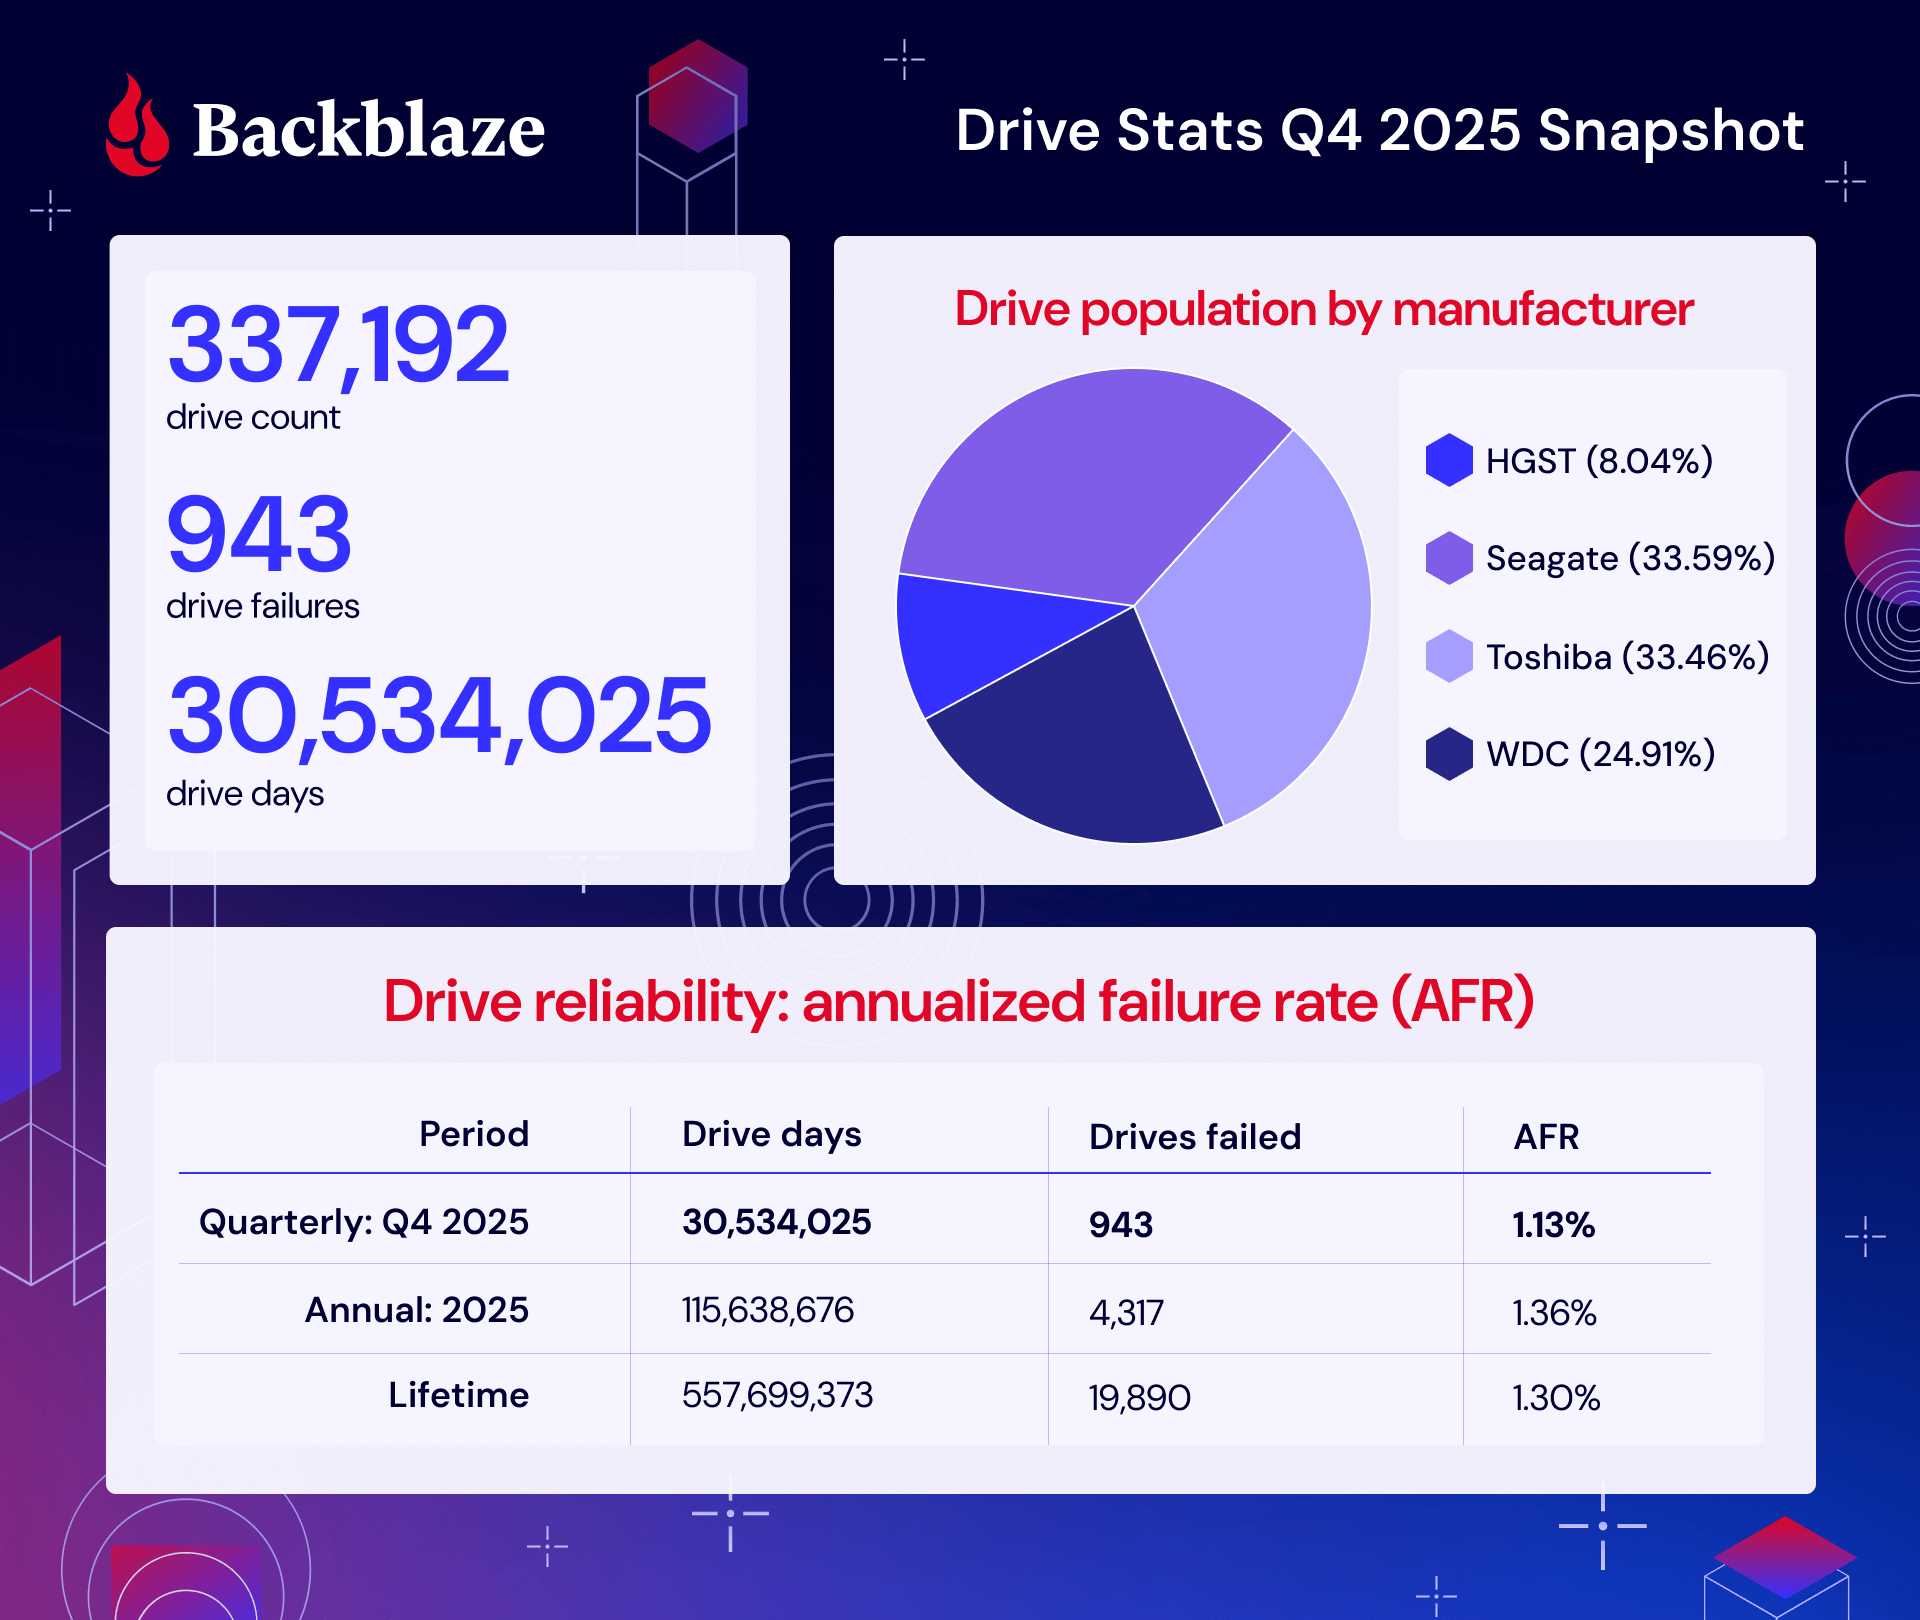

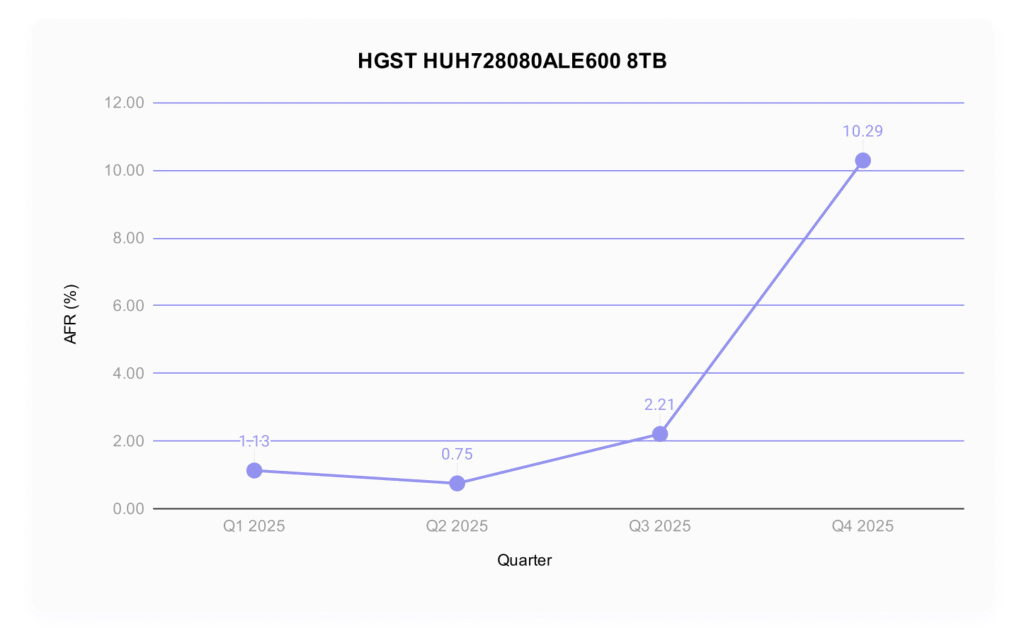
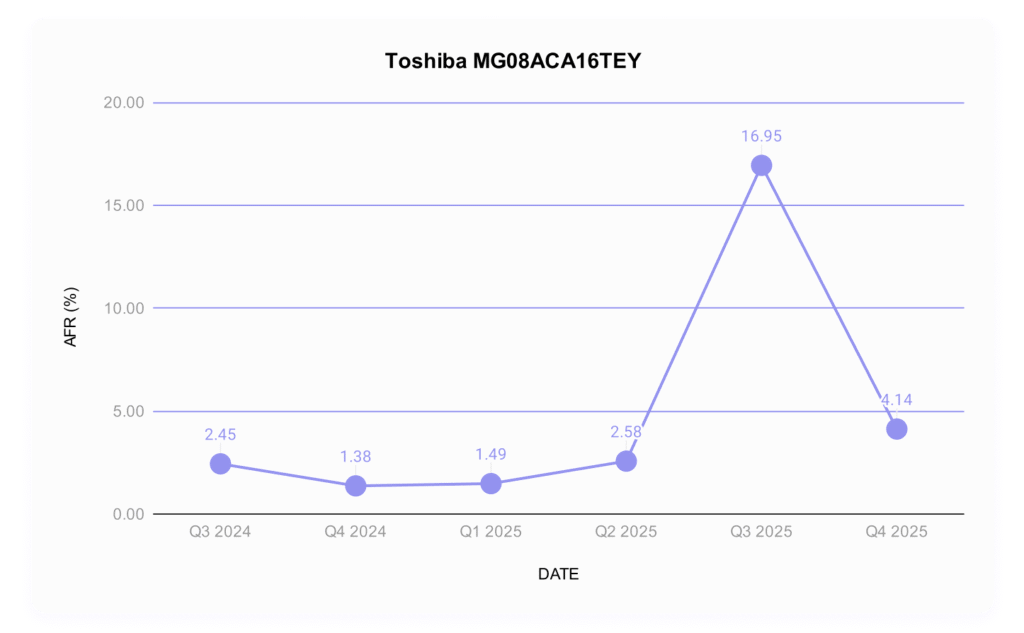


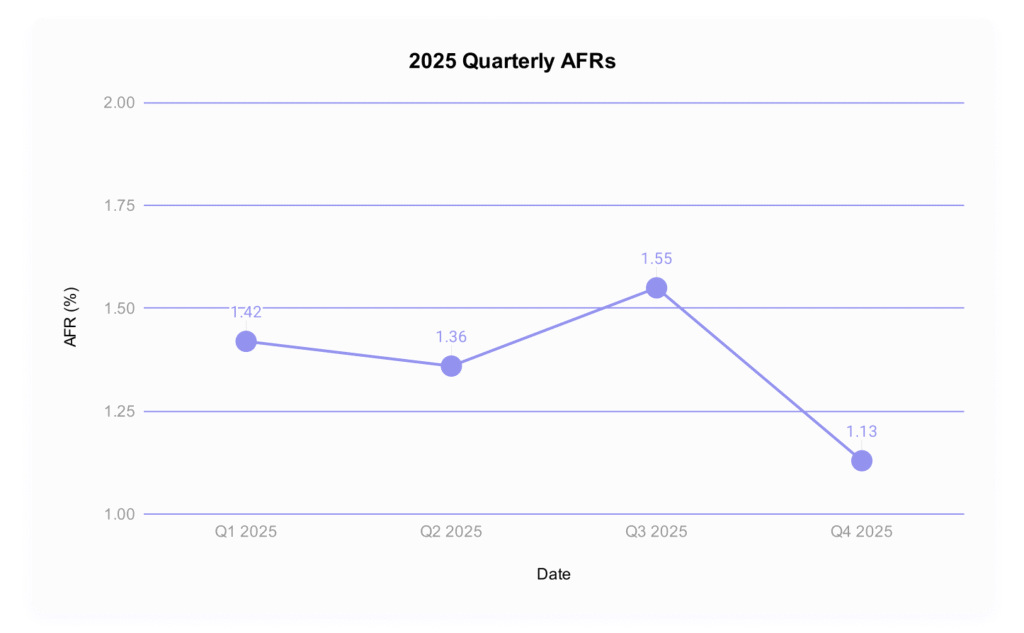

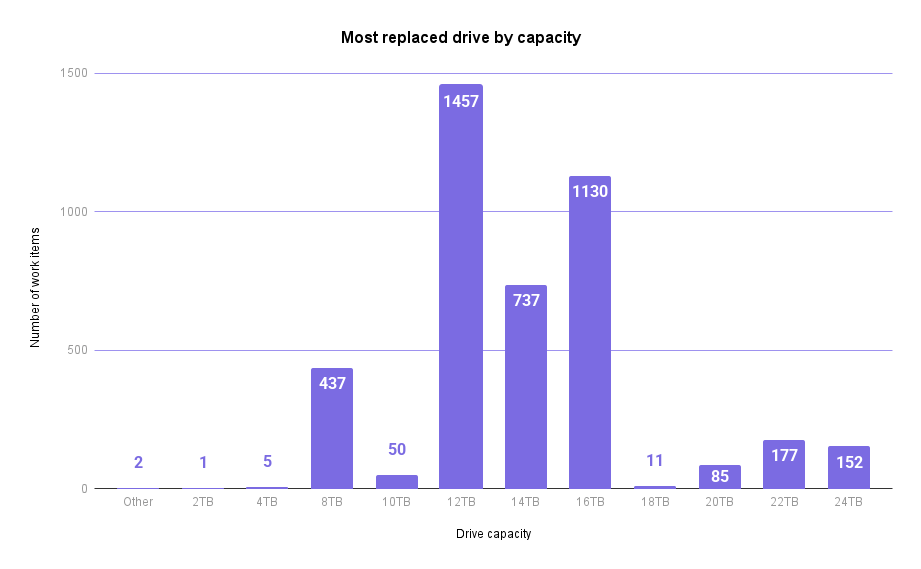
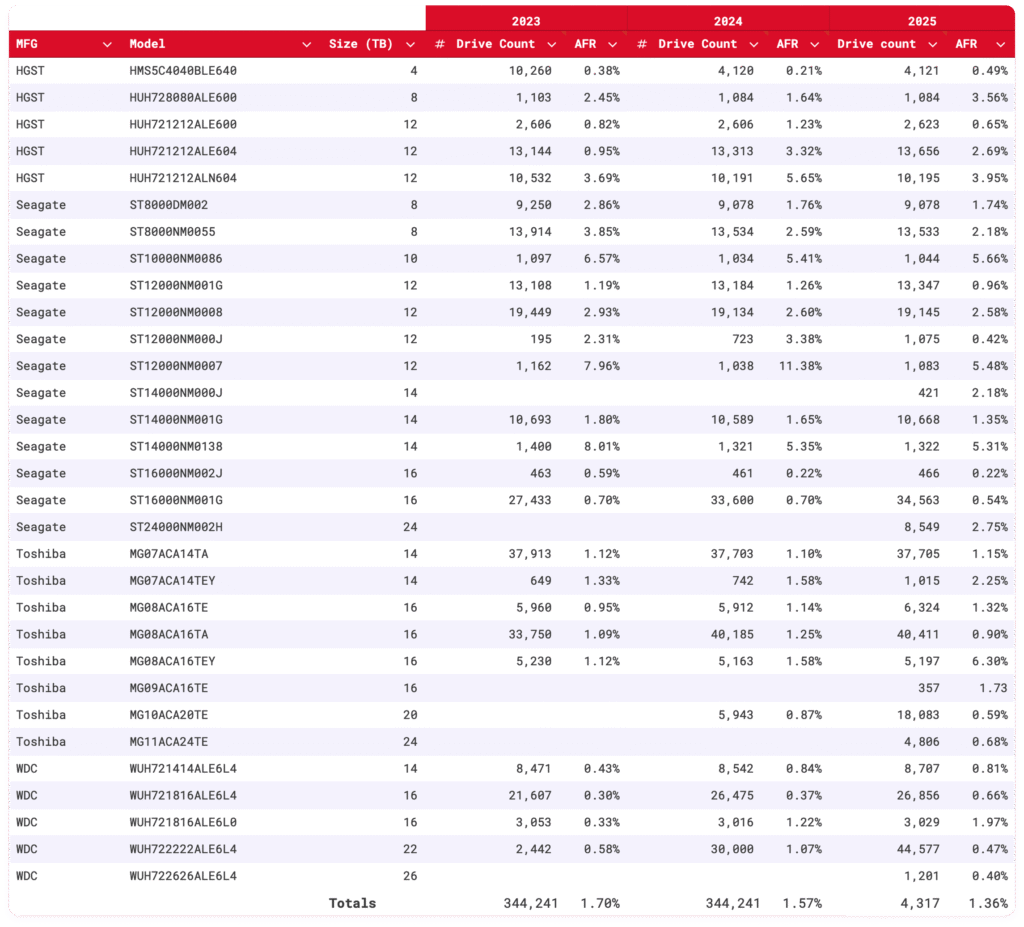

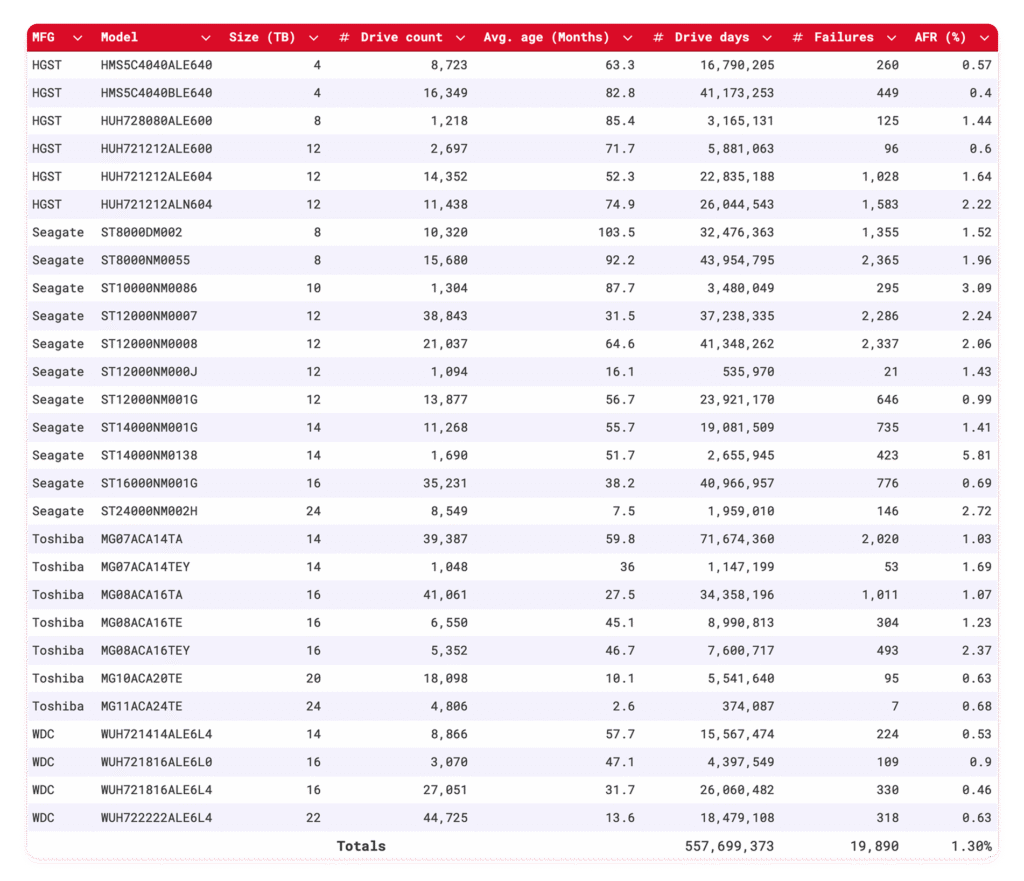


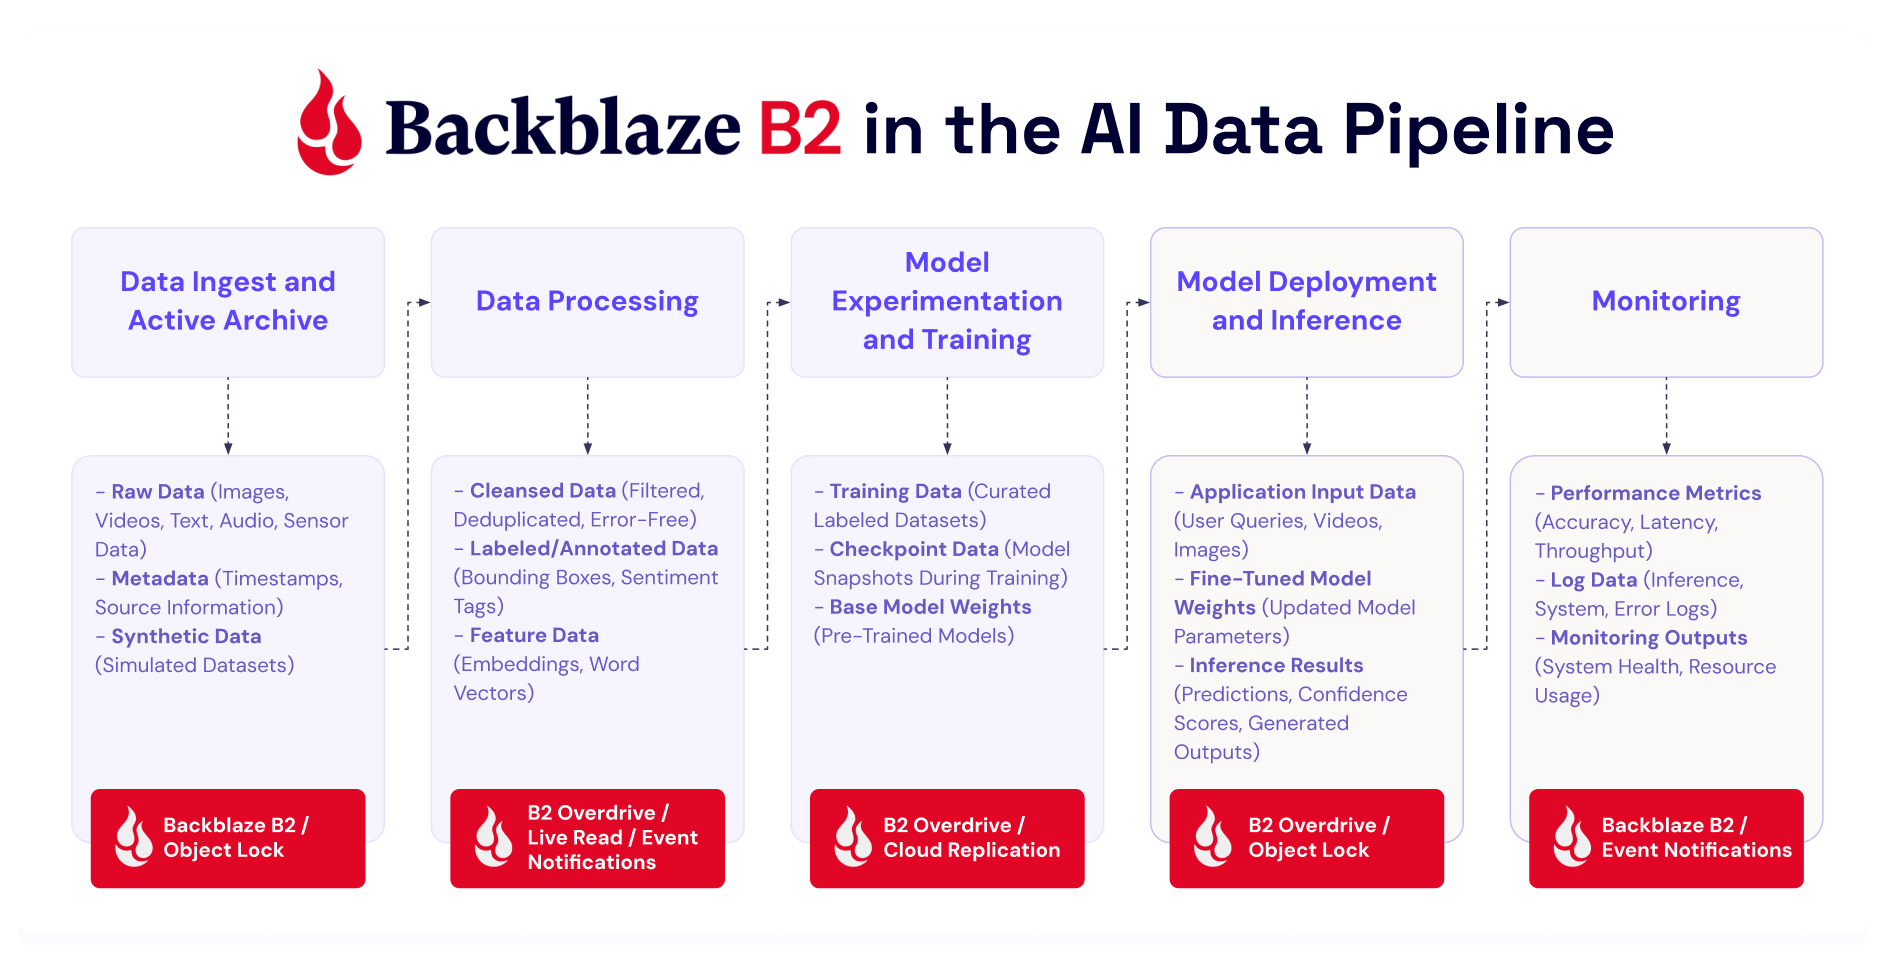

 ISP-Regional traffic dominates in total traffic volume. This region has the largest data center footprint behind it, with connectivity to internet exchanges (IX) such as