Tag Archives: IOT

What’s Up, Home? – Automatic Temperature Control

Post Syndicated from Janne Pikkarainen original https://blog.zabbix.com/whats-up-home-automatic-temperature-control/23401/

Can you automatically control the temperature of your home in a time- and room-based manner using Zabbix? Of course, you can!

By day, I am a monitoring technical lead in a global cyber security company. By night, I monitor my home with Zabbix & Grafana and make some weird experiments with them. Welcome to my weekly blog about this project.

Earlier in this blog series, I made Zabbix read the status of our air conditioner, and made it possible to use Zabbix as manual remote control for the device. But we need to take a step further and make Zabbix control the AC based on the time of day and if I am at home or not.

Forget the sweaty nights

Usually in Finland during the summer, the nights are not so hot that an AC would be needed. However, that can happen during any rare heat wave we get. It’s annoying to wake up in the middle of the night all sweaty and turn on the AC when it’s already too late.

Of course, I could just leave the AC on when I go to bed, but let’s make Zabbix do some good for our electricity bill and for the environment by not using the AC when it’s not needed.

Detecting if I am at home

Like so many times before in this blog series, Cozify smart home hub is the true star of this story. It detects if anyone is at home based on if a specific phone or, for example, a smart key fob is present and reachable in Cozify’s range. For this case, I will be using my smart key fob in Zabbix, too. This is how it looks in Cozify.

… and here’s the key fob reachability status in Zabbix.

Surprisingly enough, it shows 1 (or “True”) as my status now that I type this blog entry at home and my keys are at home.

A deeper dive into my key fob Zabbix item

To make this all work, I have a set of Python scripts gathering data from Cozify via an unofficial Cozify API Python library. One of the scripts gets the reachability status for all the items, and here’s the configuration for my key fob Zabbix item.

… and some preprocessing …

Let’s add some triggers

Now that we have the key fob data, let’s create some triggers to combine the data about my presence with the temperature information.

I created the triggers by using Zabbix expression constructor:

.. and when I was done, this is how it looked.

I made a similar trigger for our living room, too.

Next, some scripts

Next I added some scripts under Zabbix Administration → Scripts and made them as Action operations.

This one turns on the AC:

… and this one turns it off.

Lights, camera, action!

We have our triggers and scripts, great! Next, it’s time to add some actions.

  • During the daytime, Zabbix will be interested in the living room temperature and will turn on AC if the temperature goes over 23C for ten consecutive times
  • During the nighttime, Zabbix will be reading the temperature of our bedroom and turn on AC if the temperature goes over 23C for ten consecutive times

We will see how well my attempt at this will work. Here’s what the operations look like — if it’s too hot, turn on the AC, and when the temperature comes down enough, turn off the AC.

As I built this thing while I was writing this blog entry, it’s possible I would need to fine-tune the thresholds somewhat to not make my automatic AC control too aggressive. Anyway, this now works in theory.

Oh, BTW, Cozify could also make similar rules, but as it does not directly support our air conditioner (but would require a separate Air Patrol device for that), this is again a great example of how I can utilize Cozify, but with Zabbix extend my home’s IoT functionality even more for free.

I have been working at Forcepoint since 2014 and always try to find out new ways to automate things. — Janne Pikkarainen

This post was originally published on the author’s LinkedIn account.

The post What’s Up, Home? – Automatic Temperature Control appeared first on Zabbix Blog.

Baxter SIGMA Spectrum Infusion Pumps: Multiple Vulnerabilities (FIXED)

Post Syndicated from Deral Heiland original https://blog.rapid7.com/2022/09/08/baxter-sigma-spectrum-infusion-pumps-multiple-vulnerabilities-fixed/

Baxter SIGMA Spectrum Infusion Pumps: Multiple Vulnerabilities (FIXED)

Rapid7, Inc. (Rapid7) discovered vulnerabilities in two TCP/IP-enabled medical devices produced by Baxter Healthcare. The affected products are:

  • SIGMA Spectrum Infusion Pump (Firmware Version 8.00.01)
  • SIGMA Wi-Fi Battery (Firmware Versions 16, 17, 20 D29)

Rapid7 initially reported these issues to Baxter on April 20, 2022. Since then, members of our research team have worked alongside the vendor to discuss the impact, resolution, and a coordinated response for these vulnerabilities.

Product description

Baxter’s SIGMA Spectrum product is a commonly used brand of infusion pumps, which are typically used by hospitals to deliver medication and nutrition directly into a patient’s circulatory system. These TCP/IP-enabled devices deliver data to healthcare providers to enable more effective, coordinated care.

Credit

The vulnerabilities in two TCP/IP-enabled medical devices were discovered by Deral Heiland, Principal IoT Researcher at Rapid7. They are being disclosed in accordance with Rapid7’s vulnerability disclosure policy after coordination with the vendor.

Vendor statement

“In support of our mission to save and sustain lives, Baxter takes product security seriously. We are committed to working with the security researcher community to verify and respond to legitimate vulnerabilities and ask researchers to participate in our responsible reporting process. Software updates to disable Telnet and FTP (CVE-2022-26392) are in process. Software updates to address the format string attack (CVE-2022-26393) are addressed in WBM version 20D30 and all other WBM versions. Authentication is already available in Spectrum IQ (CVE-2022-26394). Instructions to erase all data and settings from WBMs and pumps before decommissioning and transferring to other facilities (CVE-2022-26390) are in process for incorporation into the Spectrum Operator’s Manual and are available in the Baxter Security Bulletin.”

Exploitation and remediation

This section details the potential for exploitation and our remediation guidance for the issues discovered and reported by Rapid7, so that defenders of this technology can gauge the impact of, and mitigations around, these issues appropriately.

Battery units store Wi-Fi credentials (CVE-2022-26390)

Rapid7 researchers tested Spectrum battery units for vulnerabilities. We found all units that were tested store Wi-Fi credential data in non-volatile memory on the device.

When a Wi-Fi battery unit is connected to the primary infusion pump and the infusion pump is powered up, the pump will transfer the Wi-Fi credential to the battery unit.

Exploitation

An attacker with physical access to an infusion pump could install a Wi-Fi battery unit (easily purchased on eBay), and then quickly power-cycle the infusion pump and remove the Wi-Fi battery – allowing them to walk away with critical Wi-Fi data once a unit has been disassembled and reverse-engineered.

Also, since these battery units store Wi-Fi credentials in non-volatile memory, there is a risk that when the devices are de-acquisitioned and no efforts are made to overwrite the stored data, anyone acquiring these devices on the secondary market could gain access to critical Wi-Fi credentials of the organization that de-acquisitioned the devices.

Remediation

To mitigate this vulnerability, organizations should restrict physical access by any unauthorized personnel to the infusion pumps or associated Wi-Fi battery units.

In addition, before de-acquisitioning the battery units, batteries should be plugged into a unit with invalid or blank Wi-Fi credentials configured and the unit powered up. This will overwrite the Wi-Fi credentials stored in the non-volatile memory of the batteries. Wi-Fi must be enabled on the infusion pump unit for this overwrite to work properly.

Format string vulnerabilities

“Hostmessage” (CVE-2022-26392)

When running a telnet session on the Baxter Sigma Wi-Fi Battery Firmware Version 16, the command “hostmessage” is vulnerable to format string vulnerability.

Exploitation

An attacker could trigger this format string vulnerability by entering the following command during a telnet session:

Baxter SIGMA Spectrum Infusion Pumps: Multiple Vulnerabilities (FIXED)

To view the output of this format string vulnerability, `settrace state=on` must be enabled in the telnet session. `set trace` does not need to be enabled for the format string vulnerability to be triggered, but it does need to be enabled if the output of the vulnerability is to be viewed.

Once `set trace` is enabled and showing output within the telnet session screen, the output of the vulnerability can be viewed, as shown below, where each `%x` returned data from the device’s process stack.

Baxter SIGMA Spectrum Infusion Pumps: Multiple Vulnerabilities (FIXED)

SSID (CVE-2022-26393)

Rapid7 also found another format string vulnerability on Wi-Fi battery software version 20 D29. This vulnerability is triggered within SSID processing by the `get_wifi_location (20)` command being sent via XML to the Wi-Fi battery at TCP port 51243 or UDP port 51243.

Baxter SIGMA Spectrum Infusion Pumps: Multiple Vulnerabilities (FIXED)

Exploitation

This format string vulnerability can be triggered by first setting up a Wi-Fi access point containing format string specifiers in the SSID. Next, an attacker could send a `get_wifi_location (20)` command via TCP Port 51243 or UDP port 51243 to the infusion pump. This causes the device to process the SSID name of the access point nearby and trigger the exploit.  The results of the triggering of format strings can be viewed with trace log output within a telnet session as shown below.

Baxter SIGMA Spectrum Infusion Pumps: Multiple Vulnerabilities (FIXED)

The SSID of `AAAA%x%x%x%x%x%x%x%x%x%x%x%x%x%x` allows for control of 4 bytes on the stack, as shown above, using the `%x` to walk the stack until it reaches 41414141. By changing the leading `AAAA` in the SSID, a malicious actor could potentially use the format string injection to read and write arbitrary memory. At a minimum, using format strings of `%s` and `%n` could allow for a denial of service (DoS) by triggering an illegal memory read (`%s`) and/or illegal memory write (`%n`).

Note that in order to trigger this DoS effect, the attacker would need to be within normal radio range and either be on the device’s network or wait for an authorized `get_wifi_location` command (the latter would itself be a usual, non-default event).

Remediation

To prevent exploitation, organizations should restrict access to the network segments containing the infusion pumps. They should also monitor network traffic for any unauthorized host communicating over TCP and UDP port 51243 to infusion pumps. In addition, be sure to monitor Wi-Fi space for rogue access points containing format string specifiers within the SSID name.

Unauthenticated network reconfiguration via TCP/UDP (CVE-2022-26394)

All Wi-Fi battery units tested (versions 16, 17, and 20 D29) allowed for remote unauthenticated changing of the SIGMA GW IP address. The SIGMA GW setting is used for configuring the back-end communication services for the devices operation.

Exploitation

An attacker could accomplish a remote redirect of SIGMA GW by sending an XML command 15 to TCP or UDP port 51243. During testing, only the SIGMA GW IP was found to be remotely changeable using this command. An example of this command and associated structure is shown below:

Baxter SIGMA Spectrum Infusion Pumps: Multiple Vulnerabilities (FIXED)

This could be used by a malicious actor to man-in-the-middle (MitM) all the communication initiated by the infusion pump. This could lead to information leakage and/or data being manipulated by a malicious actor.

Remediation

Organizations using SIGMA Spectrum products should restrict access to the network segments containing the infusion pumps. They should also monitor network traffic for any unauthorized host communicating over TCP and UDP port 51243 to the infusion pumps.

UART configuration access to Wi-Fi configuration data (additional finding)

The SIGMA Spectrum infusion pump unit transmits data unencrypted to the Wi-Fi battery unit via universal asynchronous receiver-transmitter (UART). During the power-up cycle of the infusion pump, the first block of data contains the Wi-Fi configuration data. This communication contains the SSID and 64-Character hex PSK.

Baxter SIGMA Spectrum Infusion Pumps: Multiple Vulnerabilities (FIXED)

Exploitation

A malicious actor with physical access to an infusion pump can place a communication shim between the units (i.e., the pump and the Wi-Fi battery) and capture this data during the power-up cycle of the unit.

Baxter SIGMA Spectrum Infusion Pumps: Multiple Vulnerabilities (FIXED)

Remediation

To help prevent exploitation, organizations should restrict physical access by unauthorized persons to the infusion pumps and associated Wi-Fi battery units.

Note that this is merely an additional finding based on physical, hands-on access to the device. While Baxter has addressed this finding through better decommissioning advice to end users, this particular issue does not rank for its own CVE identifier, as local encryption is beyond the scope of the hardware design of the device.

Disclosure timeline

Baxter is an exemplary medical technology company with an obvious commitment to patient and hospital safety. While medtech vulnerabilities can be tricky and expensive to work through, we’re quite pleased with the responsiveness, transparency, and genuine interest shown by Baxter’s product security teams.

  • April, 2022: Issues discovered by Deral Heiland of Rapid7
  • Wed, April 20, 2022: Issues reported to Baxter product security
  • Wed, May 11, 2022: Update requested from Baxter
  • Wed, Jun 1, 2022: Teleconference with Baxter and Rapid7 presenting findings
  • Jun-Jul 2022: Several follow up conversations and updates between Baxter and Rapid7
  • Tue, Aug 2, 2022: Coordination tracking over VINCE and more teleconferencing involving Baxter, Rapid7, CERT/CC, and ICS-CERT (VU#142423)
  • Wed, Aug 31, 2022: Final review of findings and mitigations
  • Thu Sep 8, 2022: Baxter advisory published
  • Thu, Sep 8, 2022: Public disclosure of these issues
  • Thu, Sep 8, 2022: ICS-CERT advisory published

NEVER MISS A BLOG

Get the latest stories, expertise, and news about security today.

Additional reading:

What’s Up, Home? – The Relaxing Breeze

Post Syndicated from Janne Pikkarainen original https://blog.zabbix.com/whats-up-home-the-relaxing-breeze/22031/

Can you monitor a home air conditioner with Zabbix? Of course, you can! By day, I am a monitoring tech lead in a global cyber security company. By night, I monitor my home. Welcome to my weekly blog about how I monitor my home with Zabbix & Grafana and do some weird experiments.

At the moment I was writing this blog post, the summer — and thus maybe the heat wave season — was only approaching. For the past two summers, our home has been a hot place to be. Enough is enough, so that day we got an air conditioner. It’s not a very high-end model, but these things currently come with built-in Wi-Fi.

Wouldn’t it be cool to monitor that with Zabbix? Yes.

Wi-Fi, do you read me?

Getting the air conditioner connected to our Wi-Fi was as easy as the manual promised: press the Health button eight times in a row and wait until the air conditioner says “be-be-be-be-be-beep”. Sure enough, that happened, and moments later the AC Freedom app I installed on my iPhone started to show this.

For a normal person, this would be more than enough. For me, this was only the beginning and the next step would be adding the thing to Zabbix.

Encountering headwind

Checking the first things first — no, Zabbix does not seem to support this AC out of the box. No worries, that is not the end of the world, it just slightly slows things down, and also makes things a bit more interesting.

Now that the AC was connected to our Wi-Fi, I first went to check out some data about the AC from the Wi-Fi admin interface. It revealed to me that the device contains network hardware by Broadlink in it. Ah-ha! Search engine, here I come!

Moments later, I found out Broadlink Air Conditioners to Mqtt.

Okay, MQTT it is. That’s a lightweight protocol designed for IoT device communication, and I had absolutely no clue how that worked, as this was the first time I got to use it. It would blow if this step proved to be too cumbersome.

Luckily, thanks to open source and 2022, getting it to run was not that hard.

It’s nearly summer, welcome mosquitos

The aforementioned Broadlink AC to MQTT quickly raised my confidence, as it immediately found my new device. Yes, I can do this!

… that’s nice, but how to use this any further? I could not see any MQTT messages anywhere.

Soon enough I realized I need to install an MQTT message broker to catch the messages and I found Eclipse Mosquitto.

An apt install mosquitto mosquitto-clients and some config file guessing later my jaw dropped, as I saw this:

Wow, that’s a wind-wind situation. It returns sane values! My next step was then to find out if I can somehow access those URL-like paths with Zabbix.

With Zabbix, MQTT is just a breeze

I remembered from some ancient Zabbix Summit that Zabbix 5.x gained Modbus/MQTT support. My Raspberry Pi 4 is running Zabbix 6.0.4, so certainly that part should be covered.

In the end, getting MQTT to run with Zabbix was almost too easy. Zabbix agent 2 has native MQTT support with its mqtt.get active check, so I tried to add an item like this:

And, as this is Zabbix, of course, it works:

Yay! From now on, my home Zabbix can alert me about the AC as well and generate some fancy graphs.

What’s next?

As I’ve got the AC unit recently and this is just the beginning, I still have more things to add later.

  • Add some “Yikes! It’s too hot!” triggers
  • Create a Grafana dashboard
  • Try out if I can adjust the air conditioner settings using Zabbix

Anyway, in the end, this certainly was easier than I expected.

I have been working at Forcepoint since 2014 and monitoring has never been cooler. — Janne Pikkarainen

The post What’s Up, Home? – The Relaxing Breeze appeared first on Zabbix Blog.

Keep Things Cool with Zabbix

Post Syndicated from Laura Schilder original https://blog.zabbix.com/keep-things-cool-with-zabbix/21534/

Do your friends, colleagues or maybe even your significant other have a nasty habit of leaving the fridge half-open causing you a frustrating evening and potentially even ruining your cherished batch of pistachio-flavored ice cream?

With the right thermometer and a little Zabbix knowledge, you can configure Zabbix to keep a watchful eye on the temperature of your fridge and alert you whenever things in your fridge are about to stop being cool.

IoT

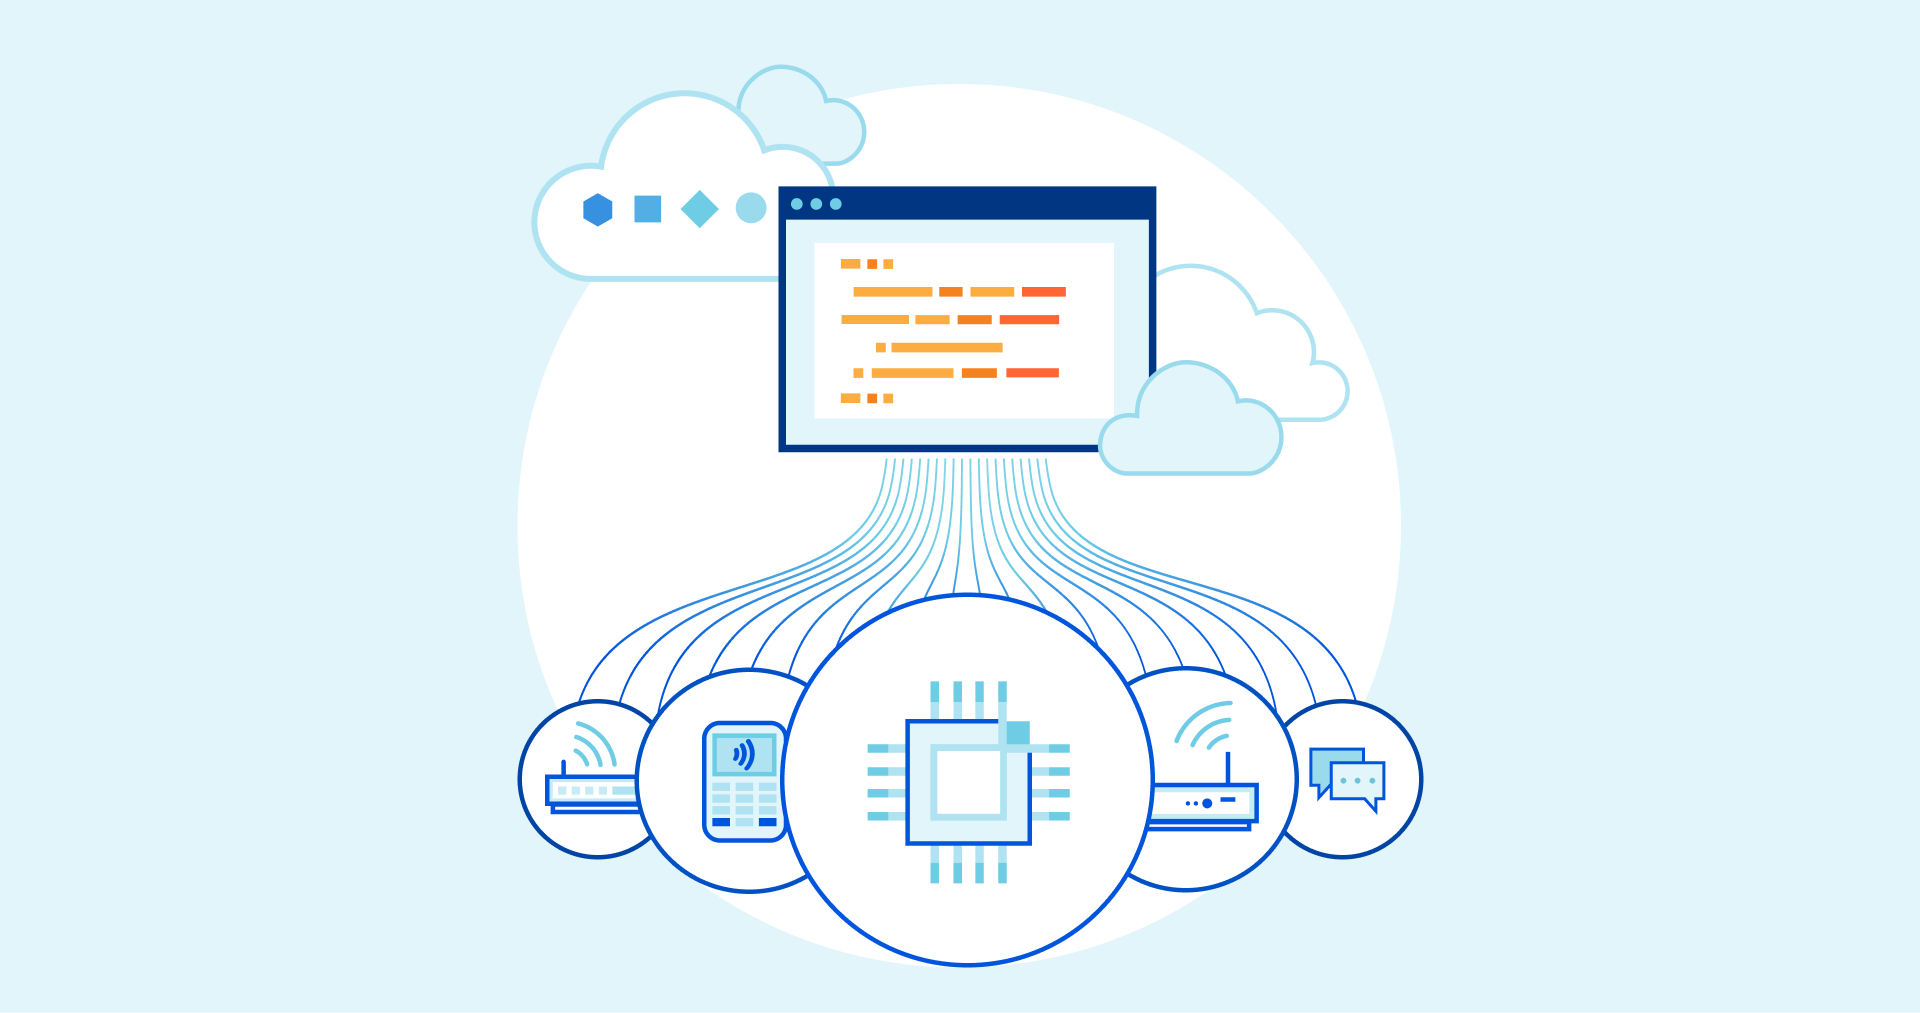
The Internet of things represents objects that are capable of autonomously transferring data over a network. The objects can be something like a temperature sensor, a smart fridge, or an electric scooter Even a garbage can and a vending equipped with proper sensors can be IoT objects.

Well, let’s go back to the thermometer that I was talking about. That thermometer is also an IoT device and it uses a specific protocol; for this specific one, we will use an aggregator: The Things Network (TTN).

But why do we need an aggregator? If you plan on monitoring a large number of sensors you will have to establish connections to each of these sensors individually. An aggregator can be used as the central point of communication, instead of directly connecting to each of the sensors.

In this blog post we will be using the following components:

  • Mini hub TBMH100 (the gateway)
  • Dragino LHT65 (the thermometer)

The Things Network

Now, not just any thermometer can connect to the internet. But the thermometer I used is one from The Things Network. The Things Network is open source, just like Zabbix, and works with LoRaWAN. If you do not know what LoRaWAN is just keep reading and I will explain what it is.

LoRaWAN stands for Long Range Wide Area Network and it’s a protocol that is made for long-distance communication and low power consumption. Certain nodes use this protocol and send information via radio. For Europe the frequency used for transferring data is 868MHz. This is how the thermometer sends the temperature to The Things Network.

Before we are able to see the sent values, we do have to configure a gateway and add it to The Things Network. After adding a gateway to TTN, the only thing remaining is having to add the thermometers. All of this information is also available in The Things Network console. We’re going to set up an MQTT connection via The Things Network console, and configure it so Zabbix can collect, process, and visualize your IoT data, as well as receive alerts whenever the temperature in our fridge gets too hot or too cold.

What is MQTT? In short –  MQTT is a lightweight network protocol. MQTT is designed for remote locations that have devices with resources that have limited bandwidth. It has to run over a transport protocol and is characterized by: Ordered, lossless and bi-directional connections. Typically, TCP/IP connections are used for this. It also is an OASIS standard and an ISO recommendation.

TTN configuration

Let’s start by adding a gateway to The Things Network. To do that, you will have to create an account on the things stack and own a gateway. But, before we get started, check what kind of gateway you have. We will be using the gateway that is meant to be inside a building. If that is done let’s start with adding it to TTN.

Let’s start at the beginning. Open the TTN webpage and log in. Easy as that. Now when you see this screen: click on the Go to gateways button.

After that, you click on the white Claim gateway button. Do not confuse it with the Add gateway button – we need to press Claim gateway.

All the fields you see on the next page will have to be filled in:

As I mentioned before the frequency should be around 868MHz. For this example, I will just use the recommended frequency. After that, click on the Claim gateway button. The gateway should work after this. If you do not know what to fill in the form fields, you can find all the information you need on the backside of your gateway.

This is what it will look like when you have successfully claimed the gateway:


Since we now have a gateway we can add the thermometer to The Things Network. To do this, we have to go to the Application tab in the console. Once we clicked on the Application tab, it will be empty. We will have to make our own application before we can add the thermometer and we will do that by pressing the Add application button. Once clicked, you should see the following:


After you have created your application, click on it and you will see a screen like this:

There you will have to go to End devices and click on Add devices. It will bring you to a screen like this:

Now, you will see just one drop-down menu, but once you start filling them in, additional menus will show up. In our case, we’re using a thermometer from Dragino. After filling in the model and region, the screen should look something like this:


For step two, we had to grab the box in which the sensor was shipped. Inside the box is a sticker with all the information that you need. When you have filled in all the fields, click on the Add device button. After adding the device it will look something like this:


Now, that’s all for adding the thermometers. If everything works, we will just have to set up an MQTT connection between The Things Network and Zabbix. On the TTN side, we have to go to integrations, and then MQTT. Everything you have on that page we can just copy. Generate an API key and copy it. Save it as we will need it later.

Zabbix

After all these steps on The Things Network side, we will finally move to Zabbix. What we will do first in Zabbix is make sure that we can get the information from The Things Network. This will be done via MQTT. For that, we will need Zabbix agent 2. Now there are of course more steps than just that. So, let me explain.

Zabbix MQTT

Let’s start by downloading Zabbix agent 2 (if you already have it you can skip this step) for that we will use this command:

dnf install zabbix-agent2

Once the agent is installed, we will have to modify the config file:

vim /etc/zabbix/zabbix_agent2.conf

I am using vim, but if you want to use something else, feel free to use another text editor. Once the configuration file has been opened, we will go ahead and change the Hostname parameter. We will be changing it to this:

Hostname=TTN

Don’t forget to start (or restart, if the agent 2 has already been installed) your agent 2 service.

systemctl start zabbix-agent2

Now that we have that out of the way we can start by making a new host. It will be a regular Zabbix host. This is what mine looks like:

Note that the Host name here matches the Hostname parameter which we edited in the previous step.  Do you recall when I said that you have to copy all the MQTT information from The Things Network? Well, we will use it here. We will have to make an item that will use the Zabbix agent (active) item type to get the information. Now, for the key, we can select the mqtt key from Zabbix but we will be missing some of the required parameters. The key will have to look something like this:

mqtt.get[broker,topic,username,password]

In the end, the item itself will look something like this:

In our case, the key looks like this:

mqtt.get[tls://eu1.cloud.thethings.network:8883, #, thermometers@ttn, NNSXS.EMK3T5FLBB2YPLYWXLP7BYOG7JHFSBKEUG23BMY.IJSZ4AC475CU5JJOLRJRYLDU6MXEODWCUYIOLZSAWSXP4L32473Q].

To check if it works just navigate to MonitoringLatest data, find our host and you should see the collected data. It should look something like this:

{"v3/thermometers@ttn/devices/eui-a84041a4e10000/up":"{\"end_device_ids\":{\"device_id\":\"eui-a84041a4e1000000\",\"application_ids\":{\"application_id\":\"thermometers\"},\"dev_eui\":\"A84041A4E10000\",\"join_eui\":\"A000000000000100\",\"dev_addr\":\"260B4F08\"},\"correlation_ids\":[\"as:up:01G7CJFS1180WT7M2GHQRWVFKA\",\"gs:conn:01G7A3RFY7CT62SGBH2BGJ7T31\",\"gs:up:host:01G7A3RG2EWWCHEW9HVBQ6KA5A\",\"gs:uplink:01G7CJFRTGY0NV6R4Y8AV9XKGG\",\"ns:uplink:01G7CJFRTHSDCK3DVR7EDGJY5V\",\"rpc:/ttn.lorawan.v3.GsNs/HandleUplink:01G7CJFRTHP5JMRVSNP8ZZR1X1\",\"rpc:/ttn.lorawan.v3.NsAs/HandleUplink:01G7CJFS10A5RAD5SE864Q99R8\"],\"received_at\":\"2022-07-07T14:54:39.137181192Z\",\"uplink_message\":{\"session_key_id\":\"AYGu5fFGW+vxth9cFIw2+g==\",\"f_port\":2,\"f_cnt\":601,\"frm_payload\":\"y/kH5QIoAX//f/8=\",\"decoded_payload\":{\"BatV\":3.065,\"Bat_status\":3,\"Ext_sensor\":\"Temperature Sensor\",\"Hum_SHT\":55.2,\"TempC_DS\":327.67,\"TempC_SHT\":20.21},\"rx_metadata\":[{\"gateway_ids\":{\"gateway_id\":\"gateway7\",\"eui\":\"58A0CBFFFE803D17\"},\"time\":\"2022-07-07T14:54:38.903268098Z\",\"timestamp\":945990219,\"rssi\":-61,\"channel_rssi\":-61,\"snr\":7.5,\"uplink_token\":\"ChYKFAoIZ2F0ZXdheTcSCFigy//+gD0XEMvUisMDGgwIrueblgYQ/fHaugMg+Omki8TiEioMCK7nm5YGEIKO264D\"}],\"settings\":{\"data_rate\":{\"lora\":{\"bandwidth\":125000,\"spreading_factor\":7}},\"coding_rate\":\"4/5\",\"frequency\":\"868500000\",\"timestamp\":945990219,\"time\":\"2022-07-07T14:54:38.903268098Z\"},\"received_at\":\"2022-07-07T14:54:38.929160377Z\",\"consumed_airtime\":\"0.061696s\",\"version_ids\":{\"brand_id\":\"dragino\",\"model_id\":\"lht65\",\"hardware_version\":\"_unknown_hw_version_\",\"firmware_version\":\"1.8\",\"band_id\":\"EU_863_870\"},\"network_ids\":{\"net_id\":\"000013\",\"tenant_id\":\"ttn\",\"cluster_id\":\"eu1\",\"cluster_address\":\"eu1.cloud.thethings.network\"}}}"}

Zabbix LLD with Dependent items

Now, after seeing all the data you want to be able to read it normally. Well, for that we will use Low-Level Discovery. It will also help add the thermometer to Zabbix.

To achieve our goal we will start by navigating to the Configuration – Hosts page. Select the host that you created earlier. Once there, select Discovery rules at the top. Now we are going to create a new Low-level discovery rule. It will be a dependent item. The master item is the item we made in the previous step. Once you have done that, it should look like so:

But we have not finished yet. We will also need to add a pre-processing step. For the pre-processing step, we need to provide a javascript script. The data that has been sent is not ‘native’ Zabbix LLD data, so we need to make it suitable for Zabbix.

We will use a script like this to format our data:

var lld = [];
var regexp = /@ttn\/devices\/([\w-]+)/g;
var lines = value.split("\n");
var lines_num = lines.length;
for (i = 0; i < lines_num; i++)
{
var match = regexp.exec(lines);
var row = {};
row["{#SENSOR}"] = match[1];
lld.push(row);
}
return JSON.stringify(lld);

In the script above we are transforming the data into a format that Zabbix can use it. Let’s drill it down line by line:
Line 1: Declare a new array with name lld
Line 2: Declare a regex with a specific value
Line 3: Let’s split the received value into an array of substrings. Splitting happens on the value “\n” which represents a newline
Line 4: Count the number of lines
Line 5: A For loop to populate the array that is declared in line 1.
Line 7: Match the regex in the lines.
Line 8: Declare an object with the name ‘row’
Line 9: Add the text {#SENSOR} with the 1st value of the variable ‘match’
Line 10: Push the row object into the lld array
Line 12: Convert the lld array into a JSON string

After Line 12, you will get something like this returned:

[{"{#SENSOR}":"eui-a84041a4exxxxxxx"},{"{#SENSOR}":"eui-a84041a4eyyyyyyy"}]

Now the data is formatted into the Zabbix LLD format, ready to be parsed.

Once the preprocessing step is added, the rule should be complete. This means that Zabbix will start discovering the thermometers, but no items are created by just adding the LLD rule like we have done so far. We also need to add the item prototypes.

I will use temperature for the internal sensor as an example here. So, let’s start at the beginning and go to Item prototypes. We will add a new item prototype. In the name and key fields, we will use the Low-level discovery macro: {#SENSOR}. The key is arbitrary – we ill put our LLD macro as a parameter, to make each item created from the prototypes unique. For units, we will use C because it stands for temperature in Celsius. When finished, it should look like this:

Now, if you look closely at the screenshot I also have a tag and preprocessing step. You can see the tag configuration in the image below. The tag will be used for filtering and providing additional information – the  sensor ID.

As for the item prototype preprocessing step –  it is a little bit harder. Do you remember the data that you got from the first item we made? Well, if you take that and throw in a regex, you can make the preprocessing step. What I did was go to https://regex101.com and paste the complete string we received from the master item and start matching the temperatures.

Once the regex is done, go to the Preprocessing tab in Zabbix. Add one step, and choose Regular Expression as the Name. Now the parameters will be (in case of this thermometer):

TempC_SHT\\":(\d+.\d+)}

and in the output field we will use the first capture group – \1. It should look like this:

If we take a careful look at the data provided by the Master item, there is a “decoded payload”:

decoded_payload\":{\"BatV\":3.056,\"Bat_status\":3,\"Ext_sensor\":\"Temperature Sensor\",\"Hum_SHT\":50.8,\"TempC_DS\":21.75,\"TempC_SHT\":21.95}

From that payload, we are cherry-picking the TempC_SHT value. There are more values to collect here, like battery status, voltage, humidity, etc. This highly depends on the sensors used, of course.
In the Low-Level Discovery rule, we can keep on adding more item prototypes to parse all of these metrics and let the LLD automatically create the items from the prototypes.

After adding the low-level discovery rule and the preprocessing step you will see something like this:

Now, as you can see, Multiple items have been created from our prototypes. If you look closely, you will also notice that I get two of everything. This is because the Low-Level Discovery discovered two thermometers.

Conclusion

Now that everything has been configured, we can finally track the temperature of our IoT thermometers. The next time somebody leaves your fridge open, you can find out in time. Cool, right? Well, that’s just one of many IoT examples that we can start to monitor –  the potential for discovering and monitoring IoT devices is unlimited. If you wish to check out the template used for this example, feel free to visit our github page.

The post Keep Things Cool with Zabbix appeared first on Zabbix Blog.

What’s Up, Home? – Razor-sharp Thinking

Post Syndicated from Janne Pikkarainen original https://blog.zabbix.com/whats-up-home-razor-sharp-thinking/21507/

Can you monitor a Philips OneBlade shaver with Zabbix? Of course, you can! But why do that and how to monitor a dumb device with zero IoT capabilities?

Welcome to my weekly blog: I get my bread and butter by being a monitoring tech lead in a global cyber security company, but I monitor my home for fun with Zabbix & Grafana and do some weird experiments.

Staying Alive

We all know how the battery-operated shavers, toothbrushes and similar devices sound very energetic and trustworthy immediately after you have charged their battery to full. Over time (over not so long time) they start to sound tired, but technically you can still use them. Or, you think you can still use them, but instead, they will betray you and die in the middle of the operation. Zabbix to the rescue!

Sing to me, bad boy

To get an idea about the battery runtime left, I needed to somehow capture the sound frequency and analyze it. The recording part was easy — after I had charged my razor to full level, I did leave it running and recorded the sound with my iPhone Voice Memos.

But how to get the sound frequency? This is the part where the audio engineers of the world can laugh at me in unison.

At first, I tried with Audacity as traditionally it has done all the tricks I possibly need to do with audio. Unfortunately, I could not find a way to accomplish my dream with it, and even if I would have, I fear I would have to manually do something with it, instead of the automated fashion I’m wishing for.

I could see all kinds of frequencies with Audacity, but was not able to isolate the humming sound of Philips OneBlade, at least not to a format I could use with Zabbix. Yes, Audacity has macros and some functionality remotely from the command line, but I interrupted my attempts with it. If you can do stuff like this with Audacity, drop me a note, I’m definitely interested!

Here come the numbers

Then, after a bit of searching, I found out aubiopitch. It analyzes the sample and returns a proper heckton of numbers back to you.

Those are not GPS coordinates or lottery numbers. That’s a timestamp in seconds and the sound frequency in Hz. And, just by peeking at the file manually, I found out that the values around 100, plus-minus something, were constantly present in the file. Yes, my brains have developed a very good pattern matching algorithm when it comes to log files, as that’s what I have been staring at for the last 20+ years.

As my 30+ minutes sample contained over 300,000 lines of these numbers, I did not want to bother my poor little home Zabbix with this kind of data volume for my initial analysis. I hate spreadsheet programs, especially with data that spans to hundreds of thousands of rows or more, so how to analyze my data? I possibly could have utilized Grafana’s CSV plugin, but to make things more interesting (for me, anyway), I called to my old friend gnuplot instead. Well, a friend in a sense that I know that it exists and that I occasionally used it two decades ago for simple plotting.

There it is, my big long needle in a haystack! Among some other environmental sounds, aubiopitch did recognize the Philips soundtrack as well! What if I filter out those higher frequencies? Or at least attempt to, my gnuplot-fu is not strong.

Yes, there it is, the upper line steadily coming down. After my first recording, it looks like that with a full battery the captured frequency starts from about 115 Hz, and everything goes well until about 93 Hz, but if I would start to shave around that time, I would better be quick, as I would only have two to three minutes left before the frequency quickly spirals down.

Production show-stoppers

This thing is not in “production” yet, because

  • I need to do more recordings to see if I get similar frequencies each time
  • I need to fiddle with iPhone Shortcuts to make this as automated as possible.

Anyway, I did start building a preliminary Zabbix template with some macros already filled in…

… and I have a connection established between my dear Siri and Zabbix, too; this will be a topic for another blog entry in the future.

I am hoping that I could get Siri to upload the Voice Memo automatically to my Zabbix Raspberry Pi, which then would immediately analyze the data with aubiopitch maybe with a simple incron hook, and Zabbix would parse the values. That part is yet to be implemented, but I am getting there. It’s just numbers, and in the end, I will just point Zabbix to a simple text file to gather its numbers or make zabbix_sender to send in the values. Been there, done that.

I have been working at Forcepoint since 2014 and for this post to happen I needed to use some razor-sharp thinking. — Janne Pikkarainen

The post What’s Up, Home? – Razor-sharp Thinking appeared first on Zabbix Blog.

What’s Up, Home? Welcome to my Zabbixverse

Post Syndicated from Janne Pikkarainen original https://blog.zabbix.com/whats-up-home-welcome-to-my-zabbixverse/21353/

By day, I am a monitoring technical lead in a global cyber security company. By night, I monitor my home with Zabbix and Grafana in very creative ways. But what has Zabbix to do with Blender 3D software or virtual reality? Read on.

Full-stack monitoring is an old concept — in the IT world, it means your service is monitored all the way from physical level (data center environmental status like temperature or smoke detection, power, network connectivity, hardware status…) to operating system status, to your application status, enriched with all kinds of data such as application logs or end-to-end testing performance. Zabbix has very mature support for that, but how about… full house monitoring in 3D and, possibly, in virtual reality?

Slow down, what are you talking about?

The catacombs of my heart do have a place for 3D modeling. I am not a talented 3D artist, not by a long shot, but I have flirted with 3D apps since Amiga 500 and it’s Real 3D 1.4, then later with Amiga 1200 a legally purchased Tornado 3D, and not so legally downloaded Lightwave. With Linux, so after 1999 for me, I have used POV-Ray about 20 years ago, and as Blender went open source a long time ago, I have tried it out every now and then.

So, in theory, I can do 3D. In practice, it’s the “Hmm, I wonder what happens if I press this button” approach I use.

Not so slow, get to the point, please

Okay. There are several reasons why I am doing this whole home monitoring thing.

  1. I have been doing IT monitoring for 20+ years, so really, there is not much new for me. Don’t get that wrong — boring is GOOD when it comes to business monitoring. Your business does count on it, and it’s perfect that whatever you need to monitor, you can do it reliably and easily. But for me, it does not challenge my brain or get my creative juices flowing. Monitoring the 3D world sure does.
  2. With my home Zabbix & Grafana, I can get as wild and childish as I ever want. Of course, not so much at work. (Though I admit that at work I did set up an easter egg Grafana dashboard called OnlyFans — it is literally showing how the cooling fans of our servers and other devices are doing).
  3. I want to give y’all new ideas and motivation to take your monitoring to the next level.
  4. I want to help raise Zabbix as a product to a whole new level from traditional IT monitoring to monitoring the environment we all live in — anyway, the future of monitoring will more and more be in the real world, too
2D or not 2D, that is the question

For traditional IT monitoring, 2D interface and 2D alerts are OK, maybe apart from physical rack location visualization, where it definitely helps if a sysadmin can locate a malfunctioning server easily from a picture.

For the Real World monitoring, it is a different story. I’m sure an electrician would appreciate if the alert would contain pictures or animations visualizing the exact location of whatever was broken. The same for plumbers, guards, whoever needs to get to fix something in huge buildings, fast.

Let’s get to it

Now that you know my motivation, let’s finally get started!

In my case, leaping Zabbix from 2D to 3D meant just a bunch of easy steps:

  1. Model my home in Sweet Home 3D; it’s very easy to use and definitely easier for my back than my wife requesting “could we try out how the sofa would look like over there…?”
  2. Import the Sweet Home 3D object to Blender
  3. In Blender, relabel the interesting objects to match with the names in Zabbix
  4. Hook Zabbix and Blender together with Python and Blender Python API, so Zabbix can change the alerting object somehow for its properties — change material, change color, add a glow effect, make it fire/smoke/explode, whatever
  5. Ask Blender Python API to export the rendered results as PNG images and as X3D files
Home sweet home

Sweet Home 3D is a relatively easy-to-use home modeling application. It’s free, and already contains a generous bunch of furniture, and with a small sum, you’ll get access to many, many more items.

After a few moments, I had my home modeled in Sweet Home 3D.


Next, I exported the file to .obj format, recognized by Blender.

Will it blend?

In Blender, I created a new scene, removed the meme-worthy default cube, and imported the Sweet Home 3D model to Blender.

Oh wow, it worked! Next, I needed to label the interesting items, such as our living room TV to match the names in Zabbix.

You modeled your home. Great! But does this Zabbix —> Blender integration work?

Yes, it does. Here is my first “let’s throw in some random objects into a Blender scene and try to manipulate it from Zabbix” attempt before any Sweet Home 3D business.

Fancy? No. Meaningful? Yes. There’s a lot going on in here.

  1. Through Python, Zabbix was able to modify a Blender scene and change some colors to red.
  2. Blender rendered the scene in its headless server mode (without GUI), and saved the resulting PNG still frame.
  3. The script ran by Zabbix did copy the image to be available for Zabbix UI (in my case, I created /assets/3d/ directory which contains everything relevant to this experiment).
  4. Zabbix URL widget is showing the image.

My Zabbix is now consulting Blender for every severity >=Average trigger, and I can also run the rendering manually any time I want.

First, here’s the manual refresh.


Next, here is the trigger:


Static image result

Here is a static PNG image rendering result by Blender Eevee rendering engine. Like gaming engines, Eevee cuts some corners when it comes to accuracy, but with a powerful GPU it can do wonders in real-time or at least in near-real-time.

The “I am not a 3D artist” part will hit you now hard. Cover your eyes, this will hurt. Here’s the Eevee rendering result.

 That green color? No, our home is not like that. I just tried to make this thing look more futuristic, perhaps Matrix-like… but now it looks like… well… like I would have used a 3D program. The red Rudolph the Rednose Reindeer nose-like thing? I imagined it would be a neatly glowing red sphere along with the TV glowing, indicating an alert with our TV. Fail for the visual part, but at least the alert logic works! And don’t ask why the TV looks so strange.

But you get the point. Imagine if a warehouse/factory/whatever monitoring center would see something like this in their alerts. No more cryptic “Power socket S1F1A255DU not working” alerts, instead, the alert would pinpoint the alert in a visual way.

There was supposed to be an earth-shattering VR! Where’s the VR?

Mark Zuckerberg, be very afraid with your Metaverse, as Zabbixverse will rule the world. Among many other formats, Blender can export its scenes to X3D format. It’s one of the virtual world formats our web browsers do support, and dead simple to embed inside Zabbix/Grafana. Blender would support WebGL, too, but getting X3D to run only needed the use of <x3d> tag, so for my experiment, it was super easy.

The video looks crappy because I have not done any texture/light work yet, but the concept works! In the video, it is me controlling the movement.

In my understanding, X3D/WebGL supports VR headsets, too, so in theory you could be observing the status of whatever physical facility you monitor through your VR headset.

Of course, this works in Grafana, too.

How much does this cost to implement?

It’s free! I mean, Zabbix is free, Python is free and Blender is free, and open source. If you have some 3D blueprints of your facility in a format Blender can support — it supports plenty — you’re all set! Have an engineer or two or ten for doing the 3D scene labeling work, and pretty soon you will see you are doing your monitoring in 3D world.

What are the limitations?

The new/resolved alerts are not updated to the scene in real-time. For PNG files that does not matter much, as those are static and Zabbix can update those as often as needed, but for the interactive X3D files it’s a shame that for now the scene will only be updated whenever you refresh the page, or Zabbix does it for you. I need to learn if I can update X3D properties in real-time instead of a forced page load.

Coming up next week: monitoring Philips OneBlade

Next week I will show you how I monitor a Philips OneBlade shaver for its estimated runtime left. The device does not have any IoT functionality, so how do I monitor it? Tune in to this blog next week at the same Zabbix time.

I have been working at Forcepoint since 2014 and never get bored of inventing new ways to visualize data.

The post What’s Up, Home? Welcome to my Zabbixverse appeared first on Zabbix Blog.

What’s Up, Home? – Observe!

Post Syndicated from Janne Pikkarainen original https://blog.zabbix.com/whats-up-home-observe/21201/

By day, I monitor a global cyber security company for a living. By night, I monitor my home with Zabbix and Grafana. In this weekly blog series, I’m sharing my weird experiments and new ideas on how to utilize monitoring.

On Easter, we were not at home but doing Easter stuff, that week I did not implement any major functionality to my home monitoring environment. But while I’m brewing new weird features, here are some bits and pieces of what I have learned about my home, and not shown here earlier.

I’m watching you, TV

We have one of those ‘smart’ TVs, just like about every recent TV happens to be. The one we have is a Samsung 2021 model. And, of course, I monitor it.

On the last two-day graph above, value 1.0 means that our TV is awake and responding to ICMP ping. During the annotated short spikes the TV does not have its screen on, but it is just silently awake and doing something with the network — may be checking for firmware updates or sending telemetry?

Anyway, it is definitely doing that many times per day. I will need to snoop more closely on what the heck it is doing.

A longer period of responding to ping indicates that we are actually watching the TV (or me playing PS5).

Garage, or not to garage?

That time, when I was writing this blog post, the spring has finally come, so we were doing some spring cleaning at home; no need for heavy winter jackets to be in our hallway closet anymore and so forth. For some items, my wife wondered what would be the humidity percentage in our garage.

Zabbix & Grafana to the rescue! The graph below shows the humidity levels of our living room and garage.

So, our garage definitely is a more humid place, and for now, some humidity-sensitive items were left inside our house instead of the garage.

Don’t get lost, get a map

This part is very much of a work in progress and is lacking the majority of the IoT devices we have, but I am also building a visual network map of my home environment. The map below uses the traditional Zabbix network map, but if I manage to pull a rabbit or two out of my hat, during the upcoming weeks you will see something Completely Else. Stay tuned!

Next week I will show you a definitely very weird target to monitor if I just manage to figure out how to do it.

There’s an app for that

But what if I am not at home? Sure, for any serious situations like a freezer temperature rapidly rising my Zabbix will e-mail me, but what if I just want to browse around? Using the web interface via iPhone could be done but is definitely not very convenient, so I am using ZBX Viewer app for iPhone instead. It’s handy, it’s free and it works.

I have been working at Forcepoint since 2014 and never get bored of staying up to date about the status of my house. — Janne Pikkarainen

* Please note that this blog post was originally written in April and some events mentioned do not correspond to the actual date at the time of publication.

The post What’s Up, Home? – Observe! appeared first on Zabbix Blog.

What’s Up, Home? – Don’t Forget the Facial Cream

Post Syndicated from Janne Pikkarainen original https://blog.zabbix.com/whats-up-home-dont-forget-the-facial-cream/21063/

Can you monitor the regular use of facial cream with Zabbix? Of course, you can! Here’s how. This same method could be very useful for monitoring if the elderly remember to take their meds or so.

What the heck?

A little background story. My forehead has a tendency for dry skin, so I should be using facial cream daily. Of course, as a man, I can guarantee you that 100% of the days I remember to use the cream, I apply it, so in practice, this means about 40-50% hit ratio.

As lately I have been adding more monitored targets to my home Zabbix, one night my wife probably thought she was being snarky or funny when she said “One monitor I could happily receive data about would be how often you remember to use your facial cream.

A monitoring nerd does not take such ideas lightly.

Howdy door sensor, would you like to do some work?

I found a spare magnetic door sensor and a handy box where to store the cream.

You can see where this is going. This totally beautiful prototype of my Facial Cream Smart Storage Box is now deployed to test. If I open or close the box, the door sensor status changes, thus the facial cream mercy countdown timer resets.

How does it work? And does it really work?

Cozify smart IoT hub is keeping an eye on the magnetic door sensor’s last status change. And look, that awesome brown tape does not bother the magnets at all, Cozify reported the status as changed.

Now that I got the Cozify part working, my Zabbix can then receive the last change time as in Unix time.

On my Grafana, there’s now this absolutely gorgeous new panel, converting the Unix time to the “How long ago the last event happened?” indicator.

So the dashboard part is now working. But that is not all we need to do.

Alerting and escalation

Dashboards and monitoring are not useful at all if proper alerts are not being sent out. I now have this new alert trigger action rule in place.

In other words, if I forget to apply the facial cream, I have a one-hour time window to apply it, or otherwise, the alert gets escalated to my wife.

Will this method work? Is my prototype box reliable? I will tell you next time.

I have been working at Forcepoint since 2014 and never get tired of finding out new areas to monitor. — Janne Pikkarainen

The post What’s Up, Home? – Don’t Forget the Facial Cream appeared first on Zabbix Blog.

Evaluating the Security of an Enterprise IoT Deployment at Domino’s Pizza

Post Syndicated from Deral Heiland original https://blog.rapid7.com/2022/06/06/evaluating-the-security-of-an-enterprise-iot-deployment-at-dominos-pizza/

Evaluating the Security of an Enterprise IoT Deployment at Domino's Pizza

Recently, I had a great opportunity to work with Domino’s Pizza to evaluate an internally conceived Internet of Things (IoT)-based business solution they had designed and deployed throughout their US store locations. The goal of this research project was to understand the security implications around a large-scale enterprise IoT project and processes related to:

  • Acquisition, implementation, and deployment
  • Technology and functionality
  • Management and support

Laying the groundwork

I sat down with each of the internal teams involved with this project, and we discussed those key areas and how security was defined and applied within each. I gained valuable new insight into how security should play into the design and construction of a large IoT business solution, especially within the planning and acquisition phases. This opportunity allowed me to see how a security-driven organization like Domino’s approaches a large-scale project like this.

I walked away from this phase of the project with some great takeaways that should be considered on all like-minded projects:

  • Always consider vendor security in your risk planning and modeling
  • Security “must-haves” should map to your organization’s internal security policies

Assessing the security status quo

Also, as part of this research project, I conducted a full ecosystem security assessment, examining all the critical hardware components, operation software, and associated network communications. As with any large-scale enterprise implementation, we did find a few security problems. This is the main reason all projects, even those with security built in from the start, should go through a wide-ranging security assessment to flush out any shortcomings that could be lurking under the hood. Once completed, I delivered a comprehensive report, which the security teams and project developers then used to quickly create solutions for fixing the identified issues.

This also allowed me the chance to observe and discuss the processes and methodologies used by this enterprise organization for building and deploying fixes into production and doing that in a safe way to avoid impacting production.

During a typical security assessment of an enterprise-wide business solution like this, we are reminded of a couple key best-practice items that should always be considered, such as:

  • When testing the security for a new technology, use a holistic approach that targets the entire solutions ecosystem.
  • Conduct regular testing of documented security procedures — security is a moving target, and testing these procedures regularly can help identify deficiencies.

Bringing the idea to life

Once an idea is designed, built, and deployed into production, we have to make sure the deployed solution remains fully functional and secure. To accomplish that, we moved the deployed enterprise IoT solution under a structured management and support plan at Domino’s. This support structure was designed as expected to help avoid or prevent outages and security incidents that could impact production, loss of services, or loss of data, focusing on:

Again, it was nice to sit down with the various teams involved in the support infrastructure and talk security and to also see how it was not only applied to this specific project, but how the organization applied these same security methodologies across the whole enterprise.

During this final evaluation phase of this project, I was reminded of one of the most critical takeaways that many organizations — unlike Domino’s, who did it correctly — fail to apply: When deploying new embedded technology within your enterprise environment, make sure the technology is properly integrated into your organization’s patch management.

At the conclusion of this research project, I took away a greatly improved understanding of the complexity, difficulties, and security best-practice challenges a large enterprise IoT project could demand. I was pleased to see, and work with, an organization that was up to that challenge and who successfully delivered this project to their business.

If you’d like to read more detail on this security research project, check out my report here.

Additional reading:

NEVER MISS A BLOG

Get the latest stories, expertise, and news about security today.

Announcing Pub/Sub: Programmable MQTT-based Messaging

Post Syndicated from Matt Silverlock original https://blog.cloudflare.com/announcing-pubsub-programmable-mqtt-messaging/

Announcing Pub/Sub: Programmable MQTT-based Messaging

Announcing Pub/Sub: Programmable MQTT-based Messaging

One of the underlying questions that drives Platform Week is “how do we enable developers to build full stack applications on Cloudflare?”. With Workers as a serverless environment for easily deploying distributed-by-default applications, KV and Durable Objects for caching and coordination, and R2 as our zero-egress cost object store, we’ve continued to discuss what else we need to build to help developers both build new apps and/or bring existing ones over to Cloudflare’s Developer Platform.

With that in mind, we’re excited to announce the private beta of Cloudflare Pub/Sub, a programmable message bus built on the ubiquitous and industry-standard MQTT protocol supported by tens of millions of existing devices today.

In a nutshell, Pub/Sub allows you to:

  • Publish event, telemetry or sensor data from any MQTT capable client (and in the future, other client-facing protocols)
  • Write code that can filter, aggregate and/or modify messages as they’re published to the broker using Cloudflare Workers, and before they’re distributed to subscribers, without the need to ferry messages to a single “cloud region”
  • Push events from applications in other clouds, or from on-prem, with Pub/Sub acting as a programmable event router or a hook into persistent data storage (such as R2 or KV)
  • Move logic out of the client, where it can be hard (or risky!) to push updates, or where running code on devices raises the materials cost (CPU, memory), while still keeping latency as low as possible (your code runs in every location).

And there’s likely a long list of things we haven’t even predicted yet. We’ve seen developers build incredible things on top of Cloudflare Workers, and we’re excited to see what they build with the power of a programmable message bus like Pub/Sub, too.

Why, and what is, MQTT?

If you haven’t heard of MQTT before, you might be surprised to know that it’s one of the most pervasive “messaging protocols” deployed today. There are tens of millions (at least!) of devices that speak MQTT today, from connected payment terminals through to autonomous vehicles, cell phones, and even video games. Sensor readings, telemetry, financial transactions and/or mobile notifications & messages are all common use-cases for MQTT, and the flexibility of the protocol allows developers to make trade-offs around reliability, topic hierarchy and persistence specific to their use-case.

We chose MQTT as the foundation for Cloudflare Pub/Sub as we believe in building on top of open, accessible standards, as we did when we chose the Service Worker API as the foundation for Workers, and with our recently announced participation in the Winter Community Group around server-side runtime APIs. We also wanted to enable existing clients an easy path to benefit from Cloudflare’s scale and programmability, and ensure that developers have a rich ecosystem of client libraries in languages they’re familiar with today.

Beyond that, however, we also think MQTT meets the needs of a modern “publish-subscribe” messaging service. It has flexible delivery guarantees, TLS for transport encryption (no bespoke crypto!), a scalable topic creation and subscription model, extensible per-message metadata, and importantly, it provides a well-defined specification with clear error messages.

With that in mind, we expect to support many more “on-ramps” to Pub/Sub: a lot of the best parts of MQTT can be abstracted away from clients who might want to talk to us over HTTP or WebSockets.

Building Blocks

Given the ability to write code that acts on every message published to a Pub/Sub Broker, what does it look like in practice?

Here’s a simple-but-illustrative example of handling Pub/Sub messages directly in a Worker. We have clients (in this case, payment terminals) reporting back transaction data, and we want to capture the number of transactions processed in each region, so we can track transaction volumes over time.

Specifically, we:

  1. Filter on a specific topic prefix for messages we care about
  2. Parse the message for a specific key:value pair as a metric
  3. Write that metric directly into Workers Analytics Engine, our new serverless time-series analytics service, so we can directly query it with GraphQL.

This saves us having to stand up and maintain an external metrics service, configure another cloud service, or think about how it will scale: we can do it all directly on Cloudflare.

# language: TypeScript

async function pubsub(
  messages: Array<PubSubMessage>,
  env: any,
  ctx: ExecutionContext
): Promise<Array<PubSubMessage>> {
  
  for (let msg of messages) {
    // Extract a value from the payload and write it to Analytics Engine
    // In this example, a transactionsProcessed counter that our clients are sending
    // back to us.
    if (msg.topic.startsWith(“/transactions/”)) {
      // This is non-blocking, and doesn’t hold up our message
      // processing.
      env.TELEMETRY.writeDataPoint({
        // We label this metric so that we can query against these labels
        labels: [`${msg.broker}.${msg.namespace}`, msg.payload.region, msg.payload.merchantId],
        metrics: [msg.payload.transactionsProcessed ?? 0]
      });
    }
  }

  // Return our messages back to the Broker
  return messages;
}

const worker = {
  async fetch(req: Request, env: any, ctx: ExecutionContext) {
    // Critical: you must validate the incoming request is from your Broker
    // In the future, Workers will be able to do this on your behalf for Workers
    // in the same account as your Pub/Sub Broker.
    if (await isValidBrokerRequest(req)) {

      // Parse the incoming PubSub messages
      let incomingMessages: Array<PubSubMessage> = await req.json();
      
      // Pass the message to our pubsub handler, and capture the returned
      // messages
      let outgoingMessages = await pubsub(incomingMessages, env, ctx);

      // Re-serialize the messages and return a HTTP 200 so our Broker
      // knows we’ve successfully handled them
      return new Response(JSON.stringify(outgoingMessages), { status: 200 });
    }

    return new Response("not a valid Broker request", { status: 403 });
  },
};

export default worker;

We can then query these metrics directly using a familiar language: SQL. Our query takes the metrics we’ve written and gives us a breakdown of transactions processed by our payment devices, grouped by merchant (and again, all on Cloudflare):

SELECT
  label_2 as region,
  label_3 as merchantId,
  sum(metric_1) as total_transactions
FROM TELEMETRY
WHERE
  metric_1 > 0
  AND timestamp >= now() - 604800
GROUP BY
  region,
  merchantId
ORDER BY
  total_transactions DESC
LIMIT 10

You could replace or augment the calls to Analytics Engine with any number of examples:

  • Asynchronously writing messages (using ctx.waitUntil) on specific topics to our R2 object storage without blocking message delivery
  • Rewriting messages on-the-fly with data populated from KV, before the message is pushed to subscribers
  • Aggregate messages based on their payload and HTTP POST them to legacy infrastructure hosted outside of Cloudflare

Pub/Sub gives you a way to get data into Cloudflare’s network, filter, aggregate and/or mutate it, and push it back out to subscribers — whether there’s 10, 1,000 or 10,000 of them listening on that topic.

Where are we headed?

As we often like to say: we’re just getting started. The private beta for Pub/Sub is just the beginning of our journey, and we have a long list of capabilities we’re already working on.

Critically, one of our priorities is to cover as much of the MQTT v5.0 specification as we can, so that customers can migrate existing deployments and have it “just work”. Useful capabilities like shared subscriptions that allow you to load-balance messages across many subscribers; wildcard subscriptions (both single- and multi-tier) for aggregation use cases, stronger delivery guarantees (QoS), and support for additional authentication modes (specifically, Mutual TLS) are just a few of the things we’re working on.

Beyond that, we’re focused on making sure Pub/Sub’s developer experience is the best it  can be, and during the beta we’ll be:

  • Supporting a new set of “pubsub” sub-commands in Wrangler, our developer CLI, so that getting started is as low-friction as possible
  • Building ‘native’ bindings (similar to how Workers KV operates) that allow you to publish messages and subscribe to topics directly from Worker code, regardless of whether the message originates from (or is destined for) a client beyond Cloudflare
  • Exploring more ways to publish & subscribe from non-MQTT based clients, including HTTP requests and WebSockets, so that integrating existing code is even easier.

Our developer documentation will cover these capabilities as we land them.

We’re also aware that pricing is a huge part of developer experience, and are committed to ensuring that there is an accessible and flexible free tier. We want to enable developers to experiment, prototype and solve problems we haven’t thought of yet. We’ll be sharing more on pricing during the course of the beta.

Getting Started

If you want to start using Pub/Sub, sign up for the private beta: we plan to start enabling access within the next month. We’re looking forward to collecting feedback from developers and seeing what folks start to build.

In the meantime, review the brand-new Pub/Sub developer documentation to understand how Pub/Sub works under the hood, the MQTT protocol, and how it integrates with Cloudflare Workers.

Marrying Zabbix and Cozify IoT hub

Post Syndicated from Janne Pikkarainen original https://blog.zabbix.com/marrying-zabbix-and-cozify-iot-hub/20377/

For those of you who know me, this should not come as a surprise: I absolutely love Zabbix. It gives me the ultimate freedom to monitor whatever I need to monitor and is flexible enough to be able to monitor absolutely everything you can imagine. It’s free, it’s open-source, and scales to whatever needs you might have.

What does a monitoring nerd who is a technical lead for monitoring in a global cyber security company do during his downtime? That’s a silly question, mind you. Of course, he monitors his home with a home Zabbix instance.

Temperatures at our home, measured by Cozify, data collected by Zabbix

Hello, Cozify

We have had a Cozify home automation system in our household since 2017. It is a nice central hub that supports IoT devices from a plethora of vendors and a vast selection of device categories, ranging from Philips Hue lights to motion sensors to cameras to fire alarm systems. You can then configure actions on some other device based on actions on one device: for example, turn on a light if a motion sensor detects movement.

Cozify is a very capable device, but where it definitely lacks is monitoring and analytics about what’s going on underneath.

As a monitoring addict, that is something I simply cannot stand.

Let’s build a bridge between Cozify and Zabbix

Someone has built an unofficial Python library for communicating with Cozify API. The library is a bit limited in functionality, the most limiting factor being that it only supports read-only operations. However, for my monitoring purposes, that does not matter, as I anyway need to read data.

For my initial testing purposes, I wrote a couple of small Python scripts to gather temperature and humidity data from our temperature sensors, and one script to monitor the general availability of the different IoT devices we have around. The scripts are run from cron every five minutes, and the results are written to text files that Zabbix reads. Zabbix has master items for temperature, humidity and reachability files, and using the dependent items, it can populate the data for all the 40+ data points I have now using just three polls.

Benefits of such project

Other than the cool geek factor, what’s the benefit of monitoring your home IoT hub? There’s plenty!

  • I get to learn all kinds of patterns about our home status: temperatures, reliability of individual devices, and the amount of time any device has been on/off
  • I get notified immediately if a critical device, like a smoke alarm, does not function properly
  • I get notified if the battery level on any battery-operated IoT device is getting low and can react before a device dies
  • I can follow how quickly the battery is draining on some device
Still for me to do

The current implementation is way too manual. It would be possible to utilize Zabbix low-level discovery to parse the JSON received from Cozify, but if I just dump everything from it, it contains all the possible device categories with different parameters: Philips Hue lights do report everything from their current brightness/color settings to if their firmware has been upgraded, and then the temperature or motion sensors do report back completely different set of data. That makes creating the monitored items automatically in a sane way a bit difficult.

So, I need to think a bit and figure out how to make my Cozify template more automatic.

I also need to set up a home Grafana instance speaking to Zabbix. Zabbix is excellent at collecting the monitoring data and sending out alerts, but Grafana is the perfect partner for Zabbix to do all the analytics and eye candy.

I have 20+ years of sysadmin/monitoring experience. Forcepoint has been my landing spot since 2014, and there I have been a monitoring technical lead since 2016. Everything Linux/FreeBSD, Zabbix, Grafana and open source in general is close to my heart. So close, in fact, that monitoring is also my hobby and I do weird experiments with Zabbix & Grafana at home. — Janne Pikkarainen

The post Marrying Zabbix and Cozify IoT hub appeared first on Zabbix Blog.

Lessons in IoT Hacking: How to Dead-Bug a BGA Flash Memory Chip

Post Syndicated from Deral Heiland original https://blog.rapid7.com/2022/04/07/lessons-in-iot-hacking-how-to-dead-bug-a-bga-flash-memory-chip/

Lessons in IoT Hacking: How to Dead-Bug a BGA Flash Memory Chip

Dead-bugging — what is that, you ask? The concept comes from the idea that a memory chip, once it’s flipped over so you can attach wires to it, looks a little like a dead bug on its back.

Lessons in IoT Hacking: How to Dead-Bug a BGA Flash Memory Chip

So why would we do this for the purposes of IoT hacking? The typical reason is if you want to extract the memory from the device, and you either don’t have a chip reader socket for that chip package type or your chip reader and socket pinouts don’t match the device.

I encounter this issue regularly with Ball Grid Array (BGA) memory devices. BGA devices don’t have legs like the chip shown above, but they do have small pads on the bottom, with small solder balls for attaching the device to a circuit board. The following BGA chip has 162 of these pads — here it is placed on a penny for size comparison.

Lessons in IoT Hacking: How to Dead-Bug a BGA Flash Memory Chip

Sometimes, I encounter memory chips and don’t have a socket for attaching it to my chip reader. Sourcing the correct socket could take months, often from China, and I need to extract the data today. Other times, it’s just not cost-effective to purchase one of these sockets for my lab because I don’t encounter that chip package type very often. However, I do encounter the chip package type shown above all the time on embedded Multi Chip Packages (eMCP), and I have a chip reader for that device type.

Unfortunately, further research on this flash memory chip revealed that it is a Multi-Chip Package (MCP), meaning it does not have a built-in embedded controller, so my chip readers can’t interact with it. Also, I couldn’t find a chip reader socket that was even available to support this. This is where a little research and the dead-bugging method came in handy.

Getting started

The first step was to track down a datasheet for this Macronix memory chip MX63U1GC12HA. Once I located the datasheet, I searched it to identify key characteristics of the chip that I would help me match it to another chip package type, which I could target with my chip reader, an RT809H.

Although this MCP chip package has 162 pads on the bottom, most of those aren’t necessary for us to be able to access the flash memory. MCP packages contain both RAM and NAND Flash memory, so I only needed to find the pads associated with the NAND flash along with ground and power connection.

The next step I identified the correct chip type using the datasheet and identification number MX63U1GC12HA. Here’s what the components of that number mean:

  • MX = Macronix
  • 63 = NAND + LPDRAM
  • U = NAND Voltage: 1.8V
  • 1G = 1Gig NAND Density
  • C = x8 Bus

Next, the NAND flash pads I needed to identify and connect to were:

  • I/O 0-7 = Data Input/Output x8
  • CLE = Command Latch Enable
  • ALE = Address Latch Enable
  • CE# = Chip Enable
  • WE# = Write Enable
  • RE# = Read Enable
  • WP# = Write Protect
  • R/B# = Ready / Busy Out
  • VCC = Voltage
  • VSSm = Ground
  • PT = Chip Protection Enable

With the datasheet, I also identified the above listed connection on the actual chip pad surface.

Lessons in IoT Hacking: How to Dead-Bug a BGA Flash Memory Chip

Typically, the hardest part is soldering the wires to these pads. This is the part that often scares most people away, but it looks harder than it really is. To avoid making it any harder than it has to be, I recommend going light on the coffee that morning – a recommendation I often don’t follow myself, which I end up regretting.

I have found one trick that works well to make attaching wires easier. This adds an extra step to the process but will speed things up later and remove much of the frustration. I recommend first attaching BGA balls to pads you need to attach wires to. Since the pads on this MCP chip are only 0.3 mm, I recommend using a microscope. I typically lay the balls by hand — once flux is placed on the chip surface, it’s simple to move the balls onto the pads one at a time and have them stay in place. Of course, this can also be done with solder paste and stencil. So, pick your favorite poison.

Once the balls have been placed on the correct pads, I place the chip in an InfraRed (IR) reflow oven to fix the balls to the pads. The lead-based BGA balls I use are Sn63/Pb37 and should melt at 183°C or 361°F.  I use the following temperature curve set on my IR oven, which I determined using a thermal probe along with some trial-and-error methods. During the reflow process, it’s easy to accidentally damage a chip by overheating it, so take caution. My curve tops out just above 200°C, which has worked well, and I have yet to damage the chips using this curve.

Lessons in IoT Hacking: How to Dead-Bug a BGA Flash Memory Chip

Once the oven has run through its cycle and the chip has cooled down, I clean the chip with alcohol to remove any remaining flux. If all goes well with the reballing process, the chip should have balls attached at each of the required locations, as shown below.

Lessons in IoT Hacking: How to Dead-Bug a BGA Flash Memory Chip

Attaching the wires

The next part is attaching wires to each of these pads. The wire I use for this is 40 gauge magnet wire, which is small enough to be attached to pads that are often .25 to .35 mm in size. This magnet wire is insulated with a thin coat of clear enamel, which can be problematic when soldering it to very small pads and trying to keeping the heat to a reasonable level. To resolve this issue, I burn the enamel insulation away and also coat the end of the wire with a thin coat of solder during that process. To do this, I melt solder onto the end of my solder iron and then stick the end of the magnet wire into the ball of solder on the end of the iron. This method works to remove the enamel insulation and tin the end of the wire, as shown below.

Lessons in IoT Hacking: How to Dead-Bug a BGA Flash Memory Chip

Once the magnet wire has been tinned, I next cut off the excess tinned area with wire cutters. How much you clip off depends on how big the pads are on the chip you’re attaching it to. The goal is to leave enough to properly solder it but not enough overhanging that could cause it to electrically short to other pads.

Lessons in IoT Hacking: How to Dead-Bug a BGA Flash Memory Chip

By pre-tinning the wire and adding solder balls to the chip pads, the process of attaching the wires becomes much quicker and less frustrating. To attach the wires, I take the tinned magnet wire and place a small amount of flux on the tinned area. Then, I push the wire against the solder ball on the chip pad I am attaching it to, and with the hot solder iron, I just barely touch the solder ball on the pad – instantly, the wire is attached. I use a micro-tip solder iron and set the heat high, so it is instant when I do this process. An example of this is shown below:

Lessons in IoT Hacking: How to Dead-Bug a BGA Flash Memory Chip

For the MX63U1GC12HA MCP chip, I used this process to attach all 17 of the needed wires, as shown below, and then held them in place using E6000 brand glue to prevent accidentally knocking the wires loose from mechanical stress on the solder joints.

Lessons in IoT Hacking: How to Dead-Bug a BGA Flash Memory Chip

Reading the chip

Next, it’s time to figure out how to read this chip to extract the firmware data from it. First, we need to attach the 17 wires to the chip reader. To do this, I custom-built a 48-pin Zero insertion force (ZIF) plug with screw terminals that I could attach to the ZIF socket of my RT809H chip programmer. This jig allows each wire to be attached via the screw terminals to any of the 48 pins as needed.

Lessons in IoT Hacking: How to Dead-Bug a BGA Flash Memory Chip

How we wire up a dead-bugged memory chip for reading depends on several things.

  • Do we have a datasheet?
  • Does the chip we are dead-bugging come in other package styles?
  • Does the chip reader support the chip we have, and we just don’t have the correct socket?
  • Does the manufacturer of our chip produce an unrelated chip that has a similar memory size, bus width, and layout?

Since I didn’t have a chip reader that supports this 162 BGA MCP device, I started looking for another Macronix chip that:

  • Had 48 pins or less so I could wire it up to my chip reader
  • Was a NAND Single Level Cell (SLC)
  • Had 1g in density
  • Had 8 bit bus
  • Had operational voltage of 1.8v

After a little time Googling followed by digging through several different datasheets, I found a MX30UF1G18AC-TI, which was for a 48 TSOP package and appeared to match the key areas I was looking for.

Here’s what the name MX30UF1G18AC-TI tells us:

  • MX = Macronix
  • 30 = NAND
  • U = 1.7V to 1.95V
  • F = SLC
  • 1G= 1G-bit
  • 18A= 4-bit ECC with standard feature, x8

The diagrams found in the MX30UF1G18AC datasheet showed the pinout for the TSOP48 NAND memory chip. Using that data, I was able to match each of the required pins to the 162 BGA MCP MX63U1GC12HA so I could correctly wire each connection to the 48-pin ZIF socket for my RT809H chip programmer.

Lessons in IoT Hacking: How to Dead-Bug a BGA Flash Memory Chip

Lessons in IoT Hacking: How to Dead-Bug a BGA Flash Memory Chip

Once all of the connecting wires were properly connected to the screw terminal of my Zif socket, I selected the MX30UF1G18AC chip from the drop-down on the chip programmer and clicked “read.” As expected, the chip programmer first queried the chip for its ID. If it does not match, it will prompt you with “Chip ID does not match,” as shown below.

In this case, I selected “Ignore,” and the devices successfully extracted the data from the NAND flash chip. Some chip readers allow you to just turn this off before attempting to read the chip. Also, if the chip you’re reading is only different in package style, the chip ID will probably match.

Lessons in IoT Hacking: How to Dead-Bug a BGA Flash Memory Chip

The perfect solution is always to have all the proper equipment needed to read all memory chips you encounter, but very few pockets are that deep — or maybe the correct socket is months out for delivery, and you need the data from the chip today. In those cases, having the skills to do this work is important.  

I have successfully used this process in a pinch many times to extract firmware from chips when I didn’t have the proper sockets at hand – and in some cases, I didn’t have full datasheets either. If you have not done this, I recommend giving it a try. Expand those soldering skills, and build out test platforms and methods to further simplify the process. Eventually, you may need to use this method, and it’s always better to be prepared.

Additional reading:

NEVER MISS A BLOG

Get the latest stories, expertise, and news about security today.

Is the Internet of Things the Next Ransomware Target?

Post Syndicated from Deral Heiland original https://blog.rapid7.com/2022/01/20/is-the-internet-of-things-the-next-ransomware-target/

Is the Internet of Things the Next Ransomware Target?

Ransomware attacks over the last couple years have been traumatic, impacting nearly every business sector and costing billions of dollars. The targets have mostly been our data: steal it, encrypt it, and then charge us a fee to get it back.

Over the last several years, there’s been concern across the security community about the risks related to the Internet of Things (IoT) being impacted by ransomware. For the most part, this has not occurred — although I wouldn’t be surprised if IoT has played a role as the entry point that malicious actors have used, on occasion, to gain access to plant their ransomware on critical systems. Also, we do know of examples where IoT technologies, such as those used within medical and industrial control environments, were impacted during ransomware attacks through key components of their ecosystem involving standard Windows server and desktop solutions.

IoT ransomware risk and its implications

So, what would it take for IoT to be the target of ransomware? First, the IoT being attacked would need to be a large deployment with significant importance in its functions and capabilities. The attack would also need to be disruptive enough that an organization would be willing to pay.  

Personally, I’m not confident such an environment exists, at least as it would apply to the average organization. But let’s step back and look at this from the perspective of the vendor who remotely manages, controls, and updates their products over the Internet. For example, imagine what would happen if a malicious actor successfully breached an automotive organization with smart-capable cars — could they shut down every car and lock the company and owner out of fixing them?

If we apply that train of thought across the board for all IoT deployed out there, it becomes very concerning. What if we shut down every multifunction printer by a major manufacturer, home thermostat, building HVAC, or building lighting solution? What happens if the target is a smart city and traffic lights are impacted? We could go on all day talking about the impact from smart city breaches or attacks against small deployed IoT solutions from major brands with global footprints.

Building a threat model

So, are there steps we can take to head off such an event? The answer is yes. I believe IoT vendors and solution owners could best accomplish this by identifying the potential attack vector and risk through threat modeling.

As part of building out a threat model, the first step would be to identify and map out a complete conceptual structure of the IoT system that could be potentially targeted. In the case of IoT technology, this should consist of all components of the system ecosystem that make the solution function as intended, which would include:

  • Embedded hardware system actuators, sensors, and gateways
  • Management and control applications, such as mobile and cloud services, as well as thick clients on servers, desktops, and laptops systems
  • Communication infrastructure used for data and operational controls including Ethernet, Wi-Fi, and other radio frequency (RF)

Any component or subcomponent of this ecosystem is at potential risk for being targeted. Mapping out this information gives us the ability to better understand and consider the potential points of attack that a malicious actor could use to deliver or execute a ransomware style attack against IoT.

In the second step of this threat modeling process, we need to understand the possible goals of a malicious actor who would be targeting an IoT ecosystem, who they may be, and what their end game and potential methods of attack would look like. The threat actors would likely look very similar to any malicious actor or group that carries out ransomware attacks. I think the big difference would be how they would approach attacking IoT ecosystems.

This is the phase where creative thinking plays a big role, and having the right people involved can make all the difference. This means having people on the threat modeling team who can take an attacker mindset and apply that thinking against the IoT ecosystems to map out as many potential attack vectors as possible.

Mapping out the threat and response

The third step in the threat modeling process is building a list of threats we would expect to be used against the above IoT ecosystems. One example, which is also common with typical ransomware attacks, is locking. By locking a component of the IoT solutions ecosystem, a malicious actor could prevent the IoT ecosystem from properly functioning or communicating with other key components, completely taking the technology out of service or preventing it from functioning as intended.

In the final part, we take the detailed information we’ve put together and map out specific attack scenarios with the greatest chance of success. Each scenario should define the various components of the IoT ecosystem potentially at risk, along with the perceived attacker motives, methods, and threats that can lead to the attacker being successful. Once you’ve mapped out these various scenarios in detail, you can use them to define and implement specific controls to mitigate or reduce the probability of success for those attack scenarios.

Using these threat modeling methods will help IoT solution vendors and the organizations that use their products identify and mitigate the risk and impact of ransomware attacks against IoT solutions before they happen.

NEVER MISS A BLOG

Get the latest stories, expertise, and news about security today.

A Quick Look at CES 2022

Post Syndicated from Deral Heiland original https://blog.rapid7.com/2022/01/13/a-quick-look-at-ces-2022/

A Quick Look at CES 2022

The first thing I noticed about CES this year was COVID’s impact on the event, which was more than just attendance size. A large amount of the technology focused on sanitation, everything from using light to sanitize surfaces on point-of-sale systems to hand-washing stations.

A Quick Look at CES 2022

When I attend events such as this, which are not 100% security-related, I still approach them with a very strong security mindset and take the opportunity to talk to many of the vendors about the subject of security within their products. This often has mixed results, with many of those working the booths at CES having more focused knowledge on product functionality and capabilities, not technical questions related to product security.  This year was no different, but I still had fun talking about security with many of those working their product booth, and as usual, I had some great conversations.

For example, I love when I see a product that typically wouldn’t be considered smart technology, but then see that it has been retrofitted with some level of smart tech to expand its usefulness, like a toothbrush. This year, I headed right to those booths and started asking security questions, and I was surprised at the responses I got, even though security was not their area of expertise as, say, an oral hygienist. They were still interested in talking about security and made every effort to either answer my question or find the answer. They also were quick to start asking me questions around what they should be concerned with and how would products like theirs be properly tested.

A healthy curiosity

Moving on from there, as usual, I encountered wearable smart technology, which has always been a big item at CES. Going beyond the typical devices to track your steps, smartwatches continue to be improved with a focus on monitoring key health stats including blood pressure, oxygen levels, heart rate, EKG, and even blood sugar levels for diabetics.

A Quick Look at CES 2022

At Abbott’s booth, which had several products including the Libre Freestyle for monitoring blood glucose level, which is a product I use. Abbott is releasing a new sensor for this product that has a much smaller profile, and I’m looking forward to that. Since they had no live demos of their currently marketed Libre FreeStyle product, I volunteered to demo my unit for another CES attendee.

A Quick Look at CES 2022

One of the Abbott booth employees asked me why I still use their handheld unit and haven’t switched to their mobile application, which was perfect timing for me to start talking security. During the conversation, I told them that I hadn’t personally tested their mobile application and regularly avoid placing apps on my phone that I haven’t security-tested. They all chimed in and recommended that I test their mobile application and let them know if it has any issues that they need to fix. So, I guess I need to add that to my to-do list.

Facing the future

Next, I encountered the typical facial recognition systems we regularly see at CES — but now, they all appear to be able to measure body temperatures and identify you despite wearing a mask. Of course, they also now support contract tracing to help identify if you’ve encountered someone who is COVID-positive.  Also, many companies have made their devices more friendly by enabling them to automatically greet you at the door.

Personally, I always have reservations when it comes to facial recognition systems. Don’t get me wrong: I get the value they can bring. But sadly, in the long haul, I expect the data gathered will end up being misused, just like data gathered using other methods. Someone will find a way to commoditize this data if they aren’t already.

A Quick Look at CES 2022

Charged up

Another area I expected to see at CES was electric-vehicle (EV) technology, and I wasn’t disappointed. Some may think I’m weird, but my focus wasn’t necessarily on the expensive cars and flying vehicles, although they’re very interesting — it was the charging stations.

With US plans to deploy charging stations across the nation, there’s a large marketplace to support public and home charging systems, and there were many solutions of this kind on display at CES. Several of the vendors indicated they were looking to snap up some of that market share and were actively working to have their products certified in the US.  

With EV chargers most likely all being connected or potentially having the ability to impact the electric grid in various ways, I think security should play a big role in their design and deployment, and I took the opportunity to have some security discussions with several vendors. One vendor specifically designed and produced only EV charging hardware, not the software, and had staff at the event who could engage comfortably on the subject of security. Even though this organization hadn’t yet conducted any independent security testing on their product, they understood the value of doing so and asked a number of questions, including details on the processes and methodologies.

A Quick Look at CES 2022

Robots: Convenient or creepy?

What would CES be if we didn’t take a quick look at robot technology?  

Like many, I’m intrigued and freaked out by robots  at the same time. The first ones to look at were the service robots, which are less creepy than others and could be very useful in activities like delivering parts on a shop floor or serving up refreshments at a party.

A Quick Look at CES 2022

The convenience of using robots for these tasks is great, and I look forward to seeing this play out some day at a party I am attending. Although, with the typical crowds I run with, I expect everyone will be trying to hack on it and paying very little attention to the food it’s serving.

Finally, I looked at the creepier side of robots. The UK pavilion had a robot that was able to have lifelike facial and hand gestures. I found these features to be very impressive. If this tech could be built to be mobile and handle human interactions, I would say we have advanced to a new level, but I expect this is only mimicking these features, and we still have further to go before we will be living the Jetsons.

A Quick Look at CES 2022

Also, Boston Dynamics and Hyundai were at CES.  Their advanced robotics work always impresses and also scares me a little, and I’m not alone.  My only disappointment was that I couldn’t get into the live demo of the technology. I waited in line, but the interest in the live show was high, and space was limited.  

With advancements in robotics like these, we must all give this some deep consideration and answer the questions: What will this tech be used for? And how can we properly secure it? Because if it’s misused or not properly secured, it can lead to issues we never want to deal with. With that said, this robot tech is amazing, and I expect it can be a real game-changer in a number of positive areas.

A Quick Look at CES 2022

NEVER MISS A BLOG

Get the latest stories, expertise, and news about security today.

Hands-On IoT Hacking: Rapid7 at DefCon 29 IoT Village, Part 4

Post Syndicated from Deral Heiland original https://blog.rapid7.com/2021/11/11/hands-on-iot-hacking-rapid7-at-defcon-29-iot-village-part-4/

Hands-On IoT Hacking: Rapid7 at DefCon 29 IoT Village, Part 4

The first 3 installments of our series on Rapid7’s hands-on exercise from the IoT Village at this year’s DefCon covered how to set up a UART header, how to determine UART status and baud rate, and how to log into single-user mode on the device. In this final post, we’ll discuss how to gain full root access and successfully complete this exercise in IoT hacking.

Mount rootfs_data and configure user accounts

Once you’re logged on in single-user mode (root), I recommend taking a quick look at a few other things that are interesting. For example, look at the partition layout on the flash chips. This can be done by running cat against /proc/mtd. (MTD stands for Memory Technology Devices.) Enter the command “cat /proc/mtd” and hit enter. This should return the list of MTDs (Figure 25), which list their dev number, size, and names.

As you can see, there are a couple of partitions that appear to have similar names, such as “kernel” and “kernel1,” as well as “ubi_rootfs” and “ubi_rootfs1.” The purpose of having duplicate file system partitions is to allow system firmware updates without potentially bricking the device if there were issues during the update process, such as a power failure. During normal operation, one of these partition pairs is online, while the others are offline. So, when a firmware update is done, the offline partitions are updated and then placed online, and the others are taken offline during a system reboot. If there is a failure during the update process, the system can safely roll back to the partition pair that was not corrupted.

Hands-On IoT Hacking: Rapid7 at DefCon 29 IoT Village, Part 4
Figure 25: /proc/mtd

To gain full running root access on the LUMA, we’re interested in the rootfs_data partition file system (Figure 26).

Hands-On IoT Hacking: Rapid7 at DefCon 29 IoT Village, Part 4
Figure 26: rootfs_data Partition

This file system “rootfs_data” is used to hold the dynamically configurable system data and user configuration information, which is typically removed if you do a factory reset on the device. This data partition filesystem is typically on all IoT devices but often has different names.

Earlier in this blog series, while reviewing the captured UART console logs, we made note of what UBIFS device number and volume number this partition was mounted on. With that information, our next step will be to mount the rootfs_data partition and create a shadow and passwd file with account information, so when we reboot the system, we’ll be able to gain full root access on a fully operational device. To make this happen, the first step is to create a writable directory that we can mount this file system to. The best place for doing this on an IoT device will always be the /tmp folder, which is a temporary location in RAM and is always read/writable.

To accomplish this, I typically change directory to /tmp and create a folder for a mount point on the device using the following commands:

  • cd /tmp
  • mkdir ubifs

Now, use the correct UBIFS device number and volume number we observed in the boot logs:

device 0, volume 2 = /dev/ubi0_2

device 0, volume 3 = /dev/ubi0_3

Enter the following command corrected to either (/dev/ubi0_2 or /dev/ubi0_3) to mount the partition to the mount point you created at /tmp/ubifs:

  • mount -t ubifs /dev/ubi0_3 /tmp/ubifs/

This command should return results that look similar to Figure 27 without any errors. The only time I have encountered errors was when the rootfs_data volume was corrupted. I was able to correct that by conducting a factory reset on the device and starting over.

Hands-On IoT Hacking: Rapid7 at DefCon 29 IoT Village, Part 4
Figure 27: Mount UBIFS Partition

If successful, you should be able to change directory to this mounted volume and list the files and folders using the following commands:

  • cd /tmp/ubifs
  • ls -al

If the partition was properly mounted, you should see folders and files within the mount point that may look similar to the example shown in Figure 28. Also note that if the device has been factory reset, it may show far fewer folders and files. Although, with the LUMA device, it should at least show the /etc folder.

Hands-On IoT Hacking: Rapid7 at DefCon 29 IoT Village, Part 4
Figure 28: Mounted rootfs_data Partition

Once you’ve mounted the rootfs_data volume, the next step is to change the directory to the “/tmp/ubifs/etc” folder and create and/or alter the passwd and shadow file to add an account to allow root access privileges. You can do this by entering the following commands, which will create a root account with the username of defcon with a blank password, which we used for the Defcon IoT Village exercises.

  • cd /tmp/ubifs/etc/
  • echo “defcon:::0:99999:7:::” > /tmp/ubifs/etc/shadow
  • echo “defcon:x:0:0:root:/root:/bin/ash” > /tmp/ubifs/etc/passwd
Hands-On IoT Hacking: Rapid7 at DefCon 29 IoT Village, Part 4
Figure 29: passwd & shadow file creation

The reason why this works is the data volume — in this case, rootfs_data — contains all dynamic configurations and settings for the device, so anything typically added to this volume will take precedence over any setting on the core root filesystem.

As a quick check to make sure everything was done correctly, run the following commands, and make sure the shadow and passwd file were created and the contents are correct.

  • cat shadow
  • cat passwd

If correct, the output should look like the following example in Figure 30:

Hands-On IoT Hacking: Rapid7 at DefCon 29 IoT Village, Part 4
Figure 30: Content of shadow and passwd Files

Reboot and log in

If everything looks good, you’re ready to reboot the system and gain full root access. To reboot the system, you can just enter “reboot” on the UART console or power cycle the device.

Once the system appears to be close to being booted, a good indication on LUMA is seeing the message “Please press Enter to activate this console” in the console. You can then hit the return key to see a login prompt. There may be a lot of log message noise in the console, but you can still enter the configured username defcon that was created during the creation of the shadow and passwd file, followed by the enter key. If everything was configured correctly, you should login without the need of a password as shown in Figure 31:

Hands-On IoT Hacking: Rapid7 at DefCon 29 IoT Village, Part 4
Figure 31: Login with defcon

If this fails and you’re prompted for a password, the most common cause is that you entered the commands to create the “passwd” and “shadow” files incorrectly. If you logged in, then you’re now fully authenticated as root, and the system should be in the full operational mode. Also, it’s not uncommon to see a lot of output messages to the UART console, which can be a pain and prevent you from easily interacting with the console. To get around this issue, you can temporarily disable most of the messages. Try entering the following command to make it a little quieter:

  • dmesg -n 1

Once you’ve run that command, it should be much easier to see what’s going on. At this point, you can interact with the system as root. For example, by running the commands below, you can see running processes and show current network open ports and connections.

  • ps -ef “ List the processes running on the system”
  • netstat -an “ Shows UDP/TCP ports and connection”

I often get asked during this exercise, “What do we gain from getting this level of root access to an IoT device?” I think the best answer is that this level of access allows us to do more advanced and detailed security testing on a device. This is not as easily done when setting on the outside of the IoT devices or attempting to emulate on some virtual machine, because often, the original hardware contains components and features that are difficult to emulate. With root-level access, we can interact more directly with running services and applications and better monitor the results of any testing we may be conducting.

NEVER MISS A BLOG

Get the latest stories, expertise, and news about security today.

Hands-On IoT Hacking: Rapid7 at DefCon 29 IoT Village, Part 3

Post Syndicated from Deral Heiland original https://blog.rapid7.com/2021/11/04/hands-on-iot-hacking-rapid7-at-defcon-29-iot-village-part-3/

Hands-On IoT Hacking: Rapid7 at DefCon 29 IoT Village, Part 3

In our first post in this series, we covered the setup of Rapid7’s hands-on exercise at Defcon 29’s IoT Village. Last week, we discussed how to determine the UART status of the header we created and how to actually start hacking on the IoT device. The goal in this next phase of the IoT hacking exercise is to turn the console back on.

To accomplish this, we need to reenter the bootargs variable without the console setting. To change the bootargs variable, the “setenv” command should be used. In the case of this exercise, enter the following command as shown in Figure 16. You can see that the “console=off” has been removed. This will overwrite the current bootargs environment variable setting.

Hands-On IoT Hacking: Rapid7 at DefCon 29 IoT Village, Part 3
Figure 16: setenv command

Once you’ve run this command, we recommend verifying that you’ve correctly made the changes to the bootargs variable by running the “printenv” command again and observing that the output shows that “console=off” has been removed. It is very common to accidentally mistype an environment variable, which will cause errors on reboot or just create an entirely new variable that has no usable value. The correct bootargs variable line should read as shown in Figure 17:

Hands-On IoT Hacking: Rapid7 at DefCon 29 IoT Village, Part 3
Figure 17: bootargs setting

Once you’re sure the changes made to bootargs are correct, you’ll need to save the environment variable settings. To do this, you’ll use the “saveenv” command. Enter this command in the UART console, and hit enter. If you miss this step, then none of the changes made to the environment variables of U-Boot will be saved and all will be lost on reboot.

The saveenv should cause the U-Boot environment variables to be written to flash and return a response indicating it is being saved. An example of this is shown in Figure 18:

Hands-On IoT Hacking: Rapid7 at DefCon 29 IoT Village, Part 3
Figure 18: saveenv command response

Reboot and capture logs for review

Once you’ve made all the needed changes to the U-Boot environment variables and saved them, you can reboot the device, observe console logs from the boot process, and save the console log data to a file for further review. The boot log data from the console will play a critical role in the next steps as you work toward gaining full root access to the device.

Next, reboot the systems. You can do this in a couple of different ways. You can either type the “reset” command within the U-Boot console and hit enter, which tells the MCU to reset and causes the system to restart, or just cycle the power on the device. After entering the reset command or power cycling the device, the device should reboot. The console should now be unlocked, and you should see the kernel boot up. If you still do not have a functioning console, you either entered the wrong data for bootargs or failed to save the settings with the “saveenv” command. I must admit I am personally guilty of both many times.

During the Defcon IoT Village exercise, we had the attendees capture console logs to a file for review using the following process in GtkTerm. If you are using a different serial console application, this process will be different for capture and saving logs.

In GtkTerm, to capture logs for review, select “Log” on the task bar pulldown menu on GtkTerm as shown below in Figure 19:

Hands-On IoT Hacking: Rapid7 at DefCon 29 IoT Village, Part 3
Figure 19: Enable logging

Once “Log” is selected, a window will pop up. From here, you need to select the file to write out the logs to. In this case, we had the attendees select the defcon_log.txt file on the laptops desktop as shown below in Figure 20:

Hands-On IoT Hacking: Rapid7 at DefCon 29 IoT Village, Part 3
Figure 20: Select defcon_log.txt file

Once you’ve selected a log file, you should now start capturing logs to that file. From here, the device can be powered back on or restarted to start capturing logs for review. Let the system boot up completely. Once it appears to be up and running, you can turn off logging by selecting “Log” and then selecting “Stop” in the dropdown, as shown in Figure 21:

Hands-On IoT Hacking: Rapid7 at DefCon 29 IoT Village, Part 3
Figure 21: Stop log capture

Once logging is stopped, you can open the captured log file and review the contents. During the Defcon IoT Village exercise, we had the participants search for the keyword “failsafe” in the captured logs. Searching for failsafe should take you to the log entry containing the line:

  • “Press the [f] key and hit [enter] to enter failsafe mode”

This is a prompt that allows you to hit the “f” key followed by return to boot the system into single-user mode. You won’t find this mode on all IoT devices, but you will find it on some, like in this case with the LUMA device. Single-user mode will start the system up with limited functionality and is often used for conducting maintenance on an operating system — and, yes, this is root-level access to the device, but with none of the critical system function running that would allow network service, USB access, and applications that are run as part of the device’s normal operation features. Our goal later is to use this access and the following data to eventually gain full running system root access.

There is also another critical piece of data in the log file just shortly after the failsafe mode prompt, which we need to note. Approximately 8 lines below failsafe prompt, there is a reference to “rootfs_data” as shown in Figure 22:

Hands-On IoT Hacking: Rapid7 at DefCon 29 IoT Village, Part 3
Figure 22: Log review

The piece of data we need from this line is the Unsorted Block Image File System (UBIFS) device number and the volume number. This will let us properly mount the rootfs_data partition later. With the LUMA, we found this to be one of the two following values.

  • Device 0, volume 2
  • Device 0, volume 3

Boot into single-user mode

Now that the captured logs have been reviewed, allowing us to identify the failsafe mode and the UBIFS mount data. The next step is to reboot the system into single-user mode, so we can work on getting full root access to the devices. To do this, you’ll need to monitor the system booting up in the UART console, watching for the failsafe mode prompt as shown below in Figure 23:

Hands-On IoT Hacking: Rapid7 at DefCon 29 IoT Village, Part 3
Figure 23: Failsafe mode prompt

When this prompt shows up, you will only have a couple of seconds to press the “f” key followed by the return key to get the system to launch into single-user root access mode. If you miss this, you’ll need to reboot and start over. If you’re successful, the UART console should show the following prompt (Figure 24):

Hands-On IoT Hacking: Rapid7 at DefCon 29 IoT Village, Part 3
Figure 24: Single-user mode

In single-user mode, you’ll have root access, although most of the partitions, applications, networks, and associated functions will not be loaded or running. Our goal will be to make changes so you can boot the device up into full operation system mode and have root access.

In our fourth and final installment of this series, we’ll go over how to configure user accounts, and finally, how to reboot the device and login. Check back with us next week!

NEVER MISS A BLOG

Get the latest stories, expertise, and news about security today.

Hands-On IoT Hacking: Rapid7 at DefCon IoT Village, Part 2

Post Syndicated from Deral Heiland original https://blog.rapid7.com/2021/10/28/hands-on-iot-hacking-rapid7-at-defcon-29-iot-village-pt-2/

Hands-On IoT Hacking: Rapid7 at DefCon IoT Village, Part 2

In our last post, we discussed how we set up Rapid7’s hands-on exercise at the Defcon 29 IoT Village. Now, with that foundation laid, we’ll get into how to determine whether the header we created is UART.

When trying to determine baud rate for IoT devices, I often just guess. Generally, for typical IoT hardware, the baud rate is going to be one of the following:

  • 9600
  • 19200
  • 38400
  • 57600
  • 115200

Typically, 115200 and 57600 are the most commonly encountered baud rates on consumer-grade IoT devices. Other settings that need to be made are data bits, stop bits, and parity bits. Typically, these will be set to the following standard defaults, as shown in Figure 5:

Hands-On IoT Hacking: Rapid7 at DefCon IoT Village, Part 2
Figure 5: Logic 2 Async Serial Decoder Settings

Once all the correct settings have been determined, and if the test point is UART, then the decoder in the Logic 2 application should decode the bit stream and reveal console text data for the device booting up. An example of this is shown in Figure 6:

Hands-On IoT Hacking: Rapid7 at DefCon IoT Village, Part 2
Figure 6: UART Decode of Channel 1

FTDI UART Setup

Once you’ve properly determined the header is UART and identified transmit, receive, and ground pins, you can next hook up a USB to UART FTDI and start analyzing and hacking on the IoT device. During the IoT Village exercise, we used a Shikra for UART connection. Unfortunately, the Shikra appears to no longer be available, but any USB to UART FTDI device supporting 3.3vdc can be used for this exercise. However, I do recommend purchasing a multi-voltage FTDI device if possible. It’s common to encounter IoT devices that require either 1.8, 3.3, or 5 vdc, so having a product that can support these voltage levels is the best solution.

The software we used to connect to the FTDI device for the exercise at Defcon IoT Village was GtkTerm running on an Ubuntu Linux — but again, any terminal software that supports tty terminal connection will work for this. For example, I have also used CoolTerm or Putty, which both work fine. So just find a terminal software that works best for you and substitute it for what is referenced here.

The next step is to attach the Shikra (pin out) or whatever brand of FTDI USB device you’re using to the UART header on Luma (Figure 7) using this table:

Shikra Pins Luma Header J19 Pins
Pin 1 TXT Pin 2 RCV
Pin 2 RCV Pin 3 TXT
Pin 18 GND Pin 1 GND

Hands-On IoT Hacking: Rapid7 at DefCon IoT Village, Part 2
Figure 7: LUMA UART PINOUT

Once the UART to USB device is connected to the LUMA, double-click on the GtkTerm icon located on the Linux Desktop and configure the application by selecting Configuration on the menu bar followed by Port in the drop-down menu. From there, set the Port (/dev/ttyUSB0) and Baud Rate (115200) to match the figure below (Figure 8), and click OK.

Hands-On IoT Hacking: Rapid7 at DefCon IoT Village, Part 2
Figure 8: Serial Port Settings

Once configured, power on the LUMA device. At this point, you should start to see the device’s boot process logged to the UART console. For the Defcon IoT hacking exercise, we had preconfigured the devices to disable the console, so once we loaded U-boot and started the system kernel image, the console became disabled, as shown in Figure 9:

Hands-On IoT Hacking: Rapid7 at DefCon IoT Village, Part 2
Figure 9: Console Stops at Kernel Starting

We made these changes so the attendees working on the exercise would experience a common setting often encountered, where the UART console is disabled during the booting process, and they’d have the chance to conduct another common attack that would allow them to break out of this lockdown.

For example, during the boot sequence, it’s often possible to force the device to break out of the boot process and to drop into a U-Boot console. For standard U-Boot, this will often happen when the Kernel image is inaccessible, causing the boot process to error out and drop into a U-Boot console prompt. This condition can sometimes be forced by shorting the data line (serial out) from the flash memory chip containing the kernel image to ground during the boot process. This prevents the boot process from loading the kernel into memory. Figure 5 shows a pin-out image of the flash memory chip currently in use on this device. The data out from the flash memory chip is Serial Out (SO) on pin 2.

Hands-On IoT Hacking: Rapid7 at DefCon IoT Village, Part 2
Figure 10: Flash Memory Pinout

Also, I would like to note that during the Defcon IoT Village exercises, I had a conversation with several like-minded IoT hackers who said that they typically do this same attack but use the clock pin (SCLK). So, that is another viable option when conducting this type of attack on an IoT device to gain access to the U-Boot console.

During our live exercises at Defcon IoT Village, to help facilitate the process of grounding the data line Pin 2 Serial Out (SO) — and to avoid ending up with a bunch of dead devices because of accidentally grounding the wrong pins — we attached a lead from pin 2 of the flash memory chip, as shown in Figure 11:

Hands-On IoT Hacking: Rapid7 at DefCon IoT Village, Part 2
Figure 11: Pin Glitch Lead Connected to Flash

To conduct this “pin glitch” attack to gain access to the U-Boot console, you will need to first power down the device. Then, restart the device by powering it back on while also monitoring the UART Console for the U-boot to start loading. Once you see the U-Boot loading, hold the shorting lead against the metal shielding or some other point of ground within the device, as shown in Figure 12:

Hands-On IoT Hacking: Rapid7 at DefCon IoT Village, Part 2
Figure 12: Short Pin2 Serial Out (SO) to Ground

Shorting this or the clock pin to ground will prevent U-Boot from being able to load the kernel. If your timing is accurate, you should be successful and now see U-Boot console prompt IPQ40xx, as shown below in Figure 13. Once you see this prompt, you can lay the shorting lead to the side. If this prompt does not show up, then you will need to repeat this process.

Hands-On IoT Hacking: Rapid7 at DefCon IoT Village, Part 2
Figure 13: U-Boot Console Prompt

With the LUMA device used in this example, this attack is more forgiving and easier to carry out successfully. The main reason, in my opinion, is because the U-Boot image and the kernel image are on separate flash memory chips. In my experience, this seems to cause more of a delay between U-Boot load and kernel loading, allowing for a longer window of time for the pin glitch to succeed.

Alter U-boot environment variables

U-boot environment variables are used to control the boot process of the devices. During this phase of the exercise, we used the following three U-Boot console commands to view, alter, and save changes made to the U-Boot environment variables to re-enable the console, which we had disabled before the exercise.

  • “Printenv” is used to list the current environment variable settings.
  • “Setenv” is used to create or modify environment variables.
  • “Saveenv” is used to write the environment variables back to memory so they are permanent.

When connected into the U-Boot console to view the device’s configured environment variables, the “printenv” command is used. This command will return something that looks like the following Figure 14 below. Scrolling down and viewing the environment settings will reveal a lot about how the device boot process is configured. In the case of the Defcon IoT Village, we had attendees pay close attention to the bootargs variable, because this is where the console was disabled from.

Hands-On IoT Hacking: Rapid7 at DefCon IoT Village, Part 2
Figure 14: printenv

With a closer look at the bootargs variable as shown below in Figure 15, we can see that the console had been set to off. This is the reason the UART console halted during the boot process once the kernel was loaded.

Hands-On IoT Hacking: Rapid7 at DefCon IoT Village, Part 2
Figure 15: bootargs Environment Variable Setting

In our third post, we’ll cover the next phase of our IoT Village exercise: turning the console back on and achieving single-user mode. Check back with us next week!

NEVER MISS A BLOG

Get the latest stories, expertise, and news about security today.

Hands-On IoT Hacking: Rapid7 at DefCon IoT Village, Part 1

Post Syndicated from Deral Heiland original https://blog.rapid7.com/2021/10/21/hands-on-iot-hacking-rapid7-at-defcon-iot-village-pt-1/

Hands-On IoT Hacking: Rapid7 at DefCon IoT Village, Part 1

This year, Rapid7 participated at the IoT Village during DefCon29 by running a hands-on hardware hacking exercise, with the goal of exposing attendees to concepts and methods for IoT hacking. Over the years, these exercises have covered several different embedded device topics, including how to use a Logic Analyzer, extracting firmware, and gaining root access to an embedded IoT device.

This year’s exercise focused on the latter and covered the following aspects:

  • Interaction with Universal Asynchronous Receiver Transmitter (UART)
  • Escaping the boot process to gain access to a U-Boot console
  • Modification of U-Boot environment variables
  • Monitoring system console during boot process for information
  • Accessing failsafe (single-user mode)
  • Mounting UBIFS partitions
  • Modifying file system for root access

While at DefCon, we had many IoT Village attendees request a copy of our exercise manual, so I decided to create a series of in-depth write-ups about the exercise we ran there, with better explanation of several of these key topic areas. Over the course of four posts, we’ll detail the exercise and add some expanded context to answer several questions and expand on the discussion we had with attendees at this year’s DefCon IoT Village.

The device we used in our exercise was a Luma Mesh WiFi device. The only change I made to the Luma devices for the exercise was to modify the U-Boot environment variables and add console=off to the bootargs variable to disable the console. I did this to add more complexity to the exercise and show a state that is often encountered.

Identify UART

One of the first steps in gaining root access to an IoT device is to identify possible entry points, such as a UART connection. In the case of our exercise, we performed this ahead of time by locating the UART connection and soldering a 2.54 mm header onto the board. This helped streamline the exercise, so attendees could complete it in a reasonable timeframe. However, the typical method to do this is to examine the device’s circuit board looking for an empty header, as in the example shown in Figure 1:

Hands-On IoT Hacking: Rapid7 at DefCon IoT Village, Part 1
Figure 1: Common 4 port 2.54mm header

This example shows 4 port headers. Although 4 port headers are common for UART, it is not always the rule. UART connections can be included in larger port headers or may not even have an exposed header. So, when you find a header that you believe to be UART, you’ll need to validate it.

To do this, we first recommend soldering male pins into the exposed socket. This will allow easier connectivity of test equipment. An example of this is shown in Figure 2:

Hands-On IoT Hacking: Rapid7 at DefCon IoT Village, Part 1
Figure 2: Soldered 2.54mm header

Once you’ve installed a header, I recommend using a logic analyzer to examine the connection for UART data. There are many different logic analyzers available on the market, which range in value from $12 or $15 to hundreds of dollars. In my case, I prefer using a Saleae logic analyzer.

The next step is to identify if any of the header pins are ground. To do this, first make sure the device is powered off. Then, you can use a multimeter set on continuity check and attach the ground lead “Black” to one of the metal shields covering various components on the circuit board, or one of the screws used to hold the circuit board in the cases — both often are found to be electrical ground.

Next, touch each pin in the header with the positive lead “Red” until the multimeter makes a ringing noise. This will indicate which pin is electrically ground. Once you’ve identified ground, you can attach the Logic Analyzer ground to that header pin and then connect the logic channel leads to the remaining pins, as shown in Figure 3:

Hands-On IoT Hacking: Rapid7 at DefCon IoT Village, Part 1
Figure 3: Logic Analyzer hooked up

Once hooked up, make sure the appropriate analyzer software is installed and running. In my case, I used Saleae’s Logic2. You can then power on the device and capture data on this header to analyze and identify:

  • Whether or not this header is UART
  • What the baud rate is
  • Which pin is transmit
  • Which pin is receive

As shown in the capture example in Figure 4, I captured 30 seconds of data during power-up of the device for channel 0 and 1. Here, we can see that data is shown on pin 1, which in this case indicates that channel 1, if determined to be UART, is most likely connected to the transmit pin. Since we are not sending any data to the device, channel 0 should show nothing, indicating it is most likely the receive pin.

Hands-On IoT Hacking: Rapid7 at DefCon IoT Village, Part 1
Figure 4: Logic-2 Capture 30 seconds

The next step is to make a final determination as to whether this is a UART header? If so, what is the baud rate?

We’ll cover this and the subsequent steps in our next post. Check back next week for more!

NEVER MISS A BLOG

Get the latest stories, expertise, and news about security today.

Introducing the Security at the Edge: Core Principles whitepaper

Post Syndicated from Maddie Bacon original https://aws.amazon.com/blogs/security/introducing-the-security-at-the-edge-core-principles-whitepaper/

Amazon Web Services (AWS) recently released the Security at the Edge: Core Principles whitepaper. Today’s business leaders know that it’s critical to ensure that both the security of their environments and the security present in traditional cloud networks are extended to workloads at the edge. The whitepaper provides security executives the foundations for implementing a defense in depth strategy for security at the edge by addressing three areas of edge security:

  • AWS services at AWS edge locations
  • How those services and others can be used to implement the best practices outlined in the design principles of the AWS Well-Architected Framework Security Pillar
  • Additional AWS edge services, which customers can use to help secure their edge environments or expand operations into new, previously unsupported environments

Together, these elements offer core principles for designing a security strategy at the edge, and demonstrate how AWS services can provide a secure environment extending from the core cloud to the edge of the AWS network and out to customer edge devices and endpoints. You can find more information in the Security at the Edge: Core Principles whitepaper.

If you have feedback about this post, submit comments in the Comments section below.

Want more AWS Security how-to content, news, and feature announcements? Follow us on Twitter.

Author

Maddie Bacon

Maddie (she/her) is a technical writer for AWS Security with a passion for creating meaningful content. She previously worked as a security reporter and editor at TechTarget and has a BA in Mathematics. In her spare time, she enjoys reading, traveling, and all things Harry Potter.

Author

Jana Kay

Since 2018, Jana has been a cloud security strategist with the AWS Security Growth Strategies team. She develops innovative ways to help AWS customers achieve their objectives, such as security table top exercises and other strategic initiatives. Previously, she was a cyber, counter-terrorism, and Middle East expert for 16 years in the Pentagon’s Office of the Secretary of Defense.

IoT gets a machine learning boost, from edge to cloud

Post Syndicated from Ashley Whittaker original https://www.raspberrypi.org/blog/iot-gets-a-machine-learning-boost-from-edge-to-cloud/

Today, it’s easy to run Edge Impulse machine learning on any operating system, like Raspberry Pi OS, and on every cloud, like Microsoft’s Azure IoT. Evan Rust, Technology Ambassador for Edge Impulse, walks us through it.

Building enterprise-grade IoT solutions takes a lot of practical effort and a healthy dose of imagination. As a foundation, you start with a highly secure and reliable communication between your IoT application and the devices it manages. We picked our favorite integration, the Microsoft Azure IoT Hub, which provides us with a cloud-hosted solution backend to connect virtually any device. For our hardware, we selected the ubiquitous Raspberry Pi 4, and of course Edge Impulse, which will connect to both platforms and extend our showcased solution from cloud to edge, including device authentication, out-of-box device management, and model provisioning.

From edge to cloud – getting started 

Edge machine learning devices fall into two categories: some are able to run very simple models locally, and others have more advanced capabilities that allow them to be more powerful and have cloud connectivity. The second group is often expensive to develop and maintain, as training and deploying models can be an arduous process. That’s where Edge Impulse comes in to help to simplify the pipeline, as data can be gathered remotely, used effortlessly to train models, downloaded to the devices directly from the Azure IoT Hub, and then run – fast.

This reference project will serve you as a guide for quickly getting started with Edge Impulse on Raspberry Pi 4 and Azure IoT, to train a model that detects lug nuts on a wheel and sends alerts to the cloud.

Setting up the hardware

Hardware setup for Edge Impulse Machine Learning
Raspberry Pi 4 forms the base for the Edge Impulse machine learning setup

To begin, you’ll need a Raspberry Pi 4 with an up-to-date Raspberry Pi OS image which can be found here. After flashing this image to an SD card and adding a file named wpa_supplicant.conf

ctrl_interface=DIR=/var/run/wpa_supplicant GROUP=netdev
update_config=1
country=<Insert 2 letter ISO 3166-1 country code here>

network={
	ssid="<Name of your wireless LAN>"
	psk="<Password for your wireless LAN>"
}

along with an empty file named ssh (both within the /boot directory), you can go ahead and power up the board. Once you’ve successfully SSH’d into the device with 

$ ssh pi@<IP_ADDRESS>

and the password raspberry, it’s time to install the dependencies for the Edge Impulse Linux SDK. Simply run the next three commands to set up the NodeJS environment and everything else that’s required for the edge-impulse-linux wizard:

$ curl -sL https://deb.nodesource.com/setup_12.x | sudo bash -
$ sudo apt install -y gcc g++ make build-essential nodejs sox gstreamer1.0-tools gstreamer1.0-plugins-good gstreamer1.0-plugins-base gstreamer1.0-plugins-base-apps
$ npm config set user root && sudo npm install edge-impulse-linux -g --unsafe-perm

Since this project deals with images, we’ll need some way to capture them. The wizard supports both the Pi Camera modules and standard USB webcams, so make sure to enable the camera module first with 

$ sudo raspi-config

if you plan on using one. With that completed, go to the Edge Impulse Studio and create a new project, then run the wizard with 

$ edge-impulse-linux

and make sure your device appears within the Edge Impulse Studio’s device section after logging in and selecting your project.

Edge Impulse Machine Learning screengrab

Capturing your data

Training accurate machine learning models requires feeding plenty of varied data, which means a lot of images are required. For this use case, I captured around 50 images of a wheel that had lug nuts on it. After I was done, I headed to the Labeling queue in the Data Acquisition page and added bounding boxes around each lug nut within every image, along with every wheel.

Edge Impulse Machine Learning screengrab

To add some test data, I went back to the main Dashboard page and clicked the Rebalance dataset button, which moves 20% of the training data to the test data bin. 

Training your models

So now that we have plenty of training data, it’s time to do something with it, namely train a model. The first block in the impulse is an Image Data block, and it scales each image to a size of 320 by 320 pixels. Next, image data is fed to the Image processing block which takes the raw RGB data and derives features from it.

Edge Impulse Machine Learning screengrab

Finally, these features are sent to the Transfer Learning Object Detection model which learns to recognize the objects. I set my model to train for 30 cycles at a learning rate of .15, but this can be adjusted to fine-tune the accuracy.

As you can see from the screenshot below, the model I trained was able to achieve an initial accuracy of 35.4%, but after some fine-tuning, it was able to correctly recognize objects at an accuracy of 73.5%.

Edge Impulse Machine Learning screengrab

Testing and deploying your models

In order to verify that the model works correctly in the real world, we’ll need to deploy it to our Raspberry Pi 4. This is a simple task thanks to the Edge Impulse CLI, as all we have to do is run 

$ edge-impulse-linux-runner

which downloads the model and creates a local webserver. From here, we can open a browser tab and visit the address listed after we run the command to see a live camera feed and any objects that are currently detected. 

Integrating your models with Microsoft Azure IoT 

With the model working locally on the device, let’s add an integration with an Azure IoT Hub that will allow our Raspberry Pi to send messages to the cloud. First, make sure you’ve installed the Azure CLI and have signed in using az login. Then get the name of the resource group you’ll be using for the project. If you don’t have one, you can follow this guide on how to create a new resource group. After that, return to the terminal and run the following commands to create a new IoT Hub and register a new device ID:

$ az iot hub create --resource-group <your resource group> --name <your IoT Hub name>
$ az extension add --name azure-iot
$ az iot hub device-identity create --hub-name <your IoT Hub name> --device-id <your device id>

Retrieve the connection string with 

$ az iot hub device-identity connection-string show --device-id <your device id> --hub-name <your IoT Hub name>
Edge Impulse Machine Learning screengrab

and set it as an environment variable with 

$ export IOTHUB_DEVICE_CONNECTION_STRING="<your connection string here>" 

in your Raspberry Pi’s SSH session, as well as 

$ pip install azure-iot-device

to add the necessary libraries. (Note: if you do not set the environment variable or pass it in as an argument, the program will not work!) The connection string contains the information required for the device to establish a connection with the IoT Hub service and communicate with it. You can then monitor output in the Hub with 

$ az iot hub monitor-events --hub-name <your IoT Hub name> --output table

 or in the Azure Portal.

To make sure it works, download and run this example to make sure you can see the test message. For the second half of deployment, we’ll need a way to customize how our model is used within the code. Thankfully, Edge Impulse provides a Python SDK for this purpose. Install it with 

$ sudo apt-get install libatlas-base-dev libportaudio0 libportaudio2 libportaudiocpp0 portaudio19-dev
$ pip3 install edge_impulse_linux -i https://pypi.python.org/simple

There’s some simple code that can be found here on Github, and it works by setting up a connection to the Azure IoT Hub and then running the model.

Edge Impulse Machine Learning screengrab

Once you’ve either downloaded the zip file or cloned the repo into a folder, get the model file by running

$ edge-impulse-linux-runner --download modelfile.eim

inside of the folder you just created from the cloning process. This will download a file called modelfile.eim. Now, run the Python program with 

$ python lug_nut_counter.py ./modelfile.eim -c <LUG_NUT_COUNT>

where <LUG_NUT_COUNT> is the correct number of lug nuts that should be attached to the wheel (you might have to use python3 if both Python 2 and 3 are installed).

Now whenever a wheel is detected the number of lug nuts is calculated. If this number falls short of the target, a message is sent to the Azure IoT Hub.

And by only sending messages when there’s something wrong, we can prevent an excess amount of bandwidth from being taken due to empty payloads.

The possibilities are endless

Imagine utilizing object detection for an industrial task such as quality control on an assembly line, or identifying ripe fruit amongst rows of crops, or detecting machinery malfunction, or remote, battery-powered inferencing devices. Between Edge Impulse, hardware like Raspberry Pi, and the Microsoft Azure IoT Hub, you can design endless models and deploy them on every device, while authenticating each and every device with built-in security.

You can set up individual identities and credentials for each of your connected devices to help retain the confidentiality of both cloud-to-device and device-to-cloud messages, revoke access rights for specific devices, transmit code and services between the cloud and the edge, and benefit from advanced analytics on devices running offline or with intermittent connectivity. And if you’re really looking to scale your operation and enjoy a complete dashboard view of the device fleets you manage, it is also possible to receive IoT alerts in Microsoft’s Connected Field Service from Azure IoT Central – directly.

Feel free to take the code for this project hosted here on GitHub and create a fork or add to it.

The complete project is available here. Let us know your thoughts at [email protected]. There are no limits, just your imagination at work.

The post IoT gets a machine learning boost, from edge to cloud appeared first on Raspberry Pi.