For those of you who know me, this should not come as a surprise: I absolutely love Zabbix. It gives me the ultimate freedom to monitor whatever I need to monitor and is flexible enough to be able to monitor absolutely everything you can imagine. It’s free, it’s open-source, and scales to whatever needs you might have.
What does a monitoring nerd who is a technical lead for monitoring in a global cyber security company do during his downtime? That’s a silly question, mind you. Of course, he monitors his home with a home Zabbix instance.
Temperatures at our home, measured by Cozify, data collected by Zabbix
Hello, Cozify
We have had a Cozify home automation system in our household since 2017. It is a nice central hub that supports IoT devices from a plethora of vendors and a vast selection of device categories, ranging from Philips Hue lights to motion sensors to cameras to fire alarm systems. You can then configure actions on some other device based on actions on one device: for example, turn on a light if a motion sensor detects movement.
Cozify is a very capable device, but where it definitely lacks is monitoring and analytics about what’s going on underneath.
As a monitoring addict, that is something I simply cannot stand.
Let’s build a bridge between Cozify and Zabbix
Someone has built an unofficial Python library for communicating with Cozify API. The library is a bit limited in functionality, the most limiting factor being that it only supports read-only operations. However, for my monitoring purposes, that does not matter, as I anyway need to read data.
For my initial testing purposes, I wrote a couple of small Python scripts to gather temperature and humidity data from our temperature sensors, and one script to monitor the general availability of the different IoT devices we have around. The scripts are run from cron every five minutes, and the results are written to text files that Zabbix reads. Zabbix has master items for temperature, humidity and reachability files, and using the dependent items, it can populate the data for all the 40+ data points I have now using just three polls.
Benefits of such project
Other than the cool geek factor, what’s the benefit of monitoring your home IoT hub? There’s plenty!
I get to learn all kinds of patterns about our home status: temperatures, reliability of individual devices, and the amount of time any device has been on/off
I get notified immediately if a critical device, like a smoke alarm, does not function properly
I get notified if the battery level on any battery-operated IoT device is getting low and can react before a device dies
I can follow how quickly the battery is draining on some device
Still for me to do
The current implementation is way too manual. It would be possible to utilize Zabbix low-level discovery to parse the JSON received from Cozify, but if I just dump everything from it, it contains all the possible device categories with different parameters: Philips Hue lights do report everything from their current brightness/color settings to if their firmware has been upgraded, and then the temperature or motion sensors do report back completely different set of data. That makes creating the monitored items automatically in a sane way a bit difficult.
So, I need to think a bit and figure out how to make my Cozify template more automatic.
I also need to set up a home Grafana instance speaking to Zabbix. Zabbix is excellent at collecting the monitoring data and sending out alerts, but Grafana is the perfect partner for Zabbix to do all the analytics and eye candy.
I have 20+ years of sysadmin/monitoring experience. Forcepoint has been my landing spot since 2014, and there I have been a monitoring technical lead since 2016. Everything Linux/FreeBSD, Zabbix, Grafana and open source in general is close to my heart. So close, in fact, that monitoring is also my hobby and I do weird experiments with Zabbix & Grafana at home. — Janne Pikkarainen
Dead-bugging — what is that, you ask? The concept comes from the idea that a memory chip, once it’s flipped over so you can attach wires to it, looks a little like a dead bug on its back.
So why would we do this for the purposes of IoT hacking? The typical reason is if you want to extract the memory from the device, and you either don’t have a chip reader socket for that chip package type or your chip reader and socket pinouts don’t match the device.
I encounter this issue regularly with Ball Grid Array (BGA) memory devices. BGA devices don’t have legs like the chip shown above, but they do have small pads on the bottom, with small solder balls for attaching the device to a circuit board. The following BGA chip has 162 of these pads — here it is placed on a penny for size comparison.
Sometimes, I encounter memory chips and don’t have a socket for attaching it to my chip reader. Sourcing the correct socket could take months, often from China, and I need to extract the data today. Other times, it’s just not cost-effective to purchase one of these sockets for my lab because I don’t encounter that chip package type very often. However, I do encounter the chip package type shown above all the time on embedded Multi Chip Packages (eMCP), and I have a chip reader for that device type.
Unfortunately, further research on this flash memory chip revealed that it is a Multi-Chip Package (MCP), meaning it does not have a built-in embedded controller, so my chip readers can’t interact with it. Also, I couldn’t find a chip reader socket that was even available to support this. This is where a little research and the dead-bugging method came in handy.
Getting started
The first step was to track down a datasheet for this Macronix memory chip MX63U1GC12HA. Once I located the datasheet, I searched it to identify key characteristics of the chip that I would help me match it to another chip package type, which I could target with my chip reader, an RT809H.
Although this MCP chip package has 162 pads on the bottom, most of those aren’t necessary for us to be able to access the flash memory. MCP packages contain both RAM and NAND Flash memory, so I only needed to find the pads associated with the NAND flash along with ground and power connection.
The next step I identified the correct chip type using the datasheet and identification number MX63U1GC12HA. Here’s what the components of that number mean:
MX = Macronix
63 = NAND + LPDRAM
U = NAND Voltage: 1.8V
1G = 1Gig NAND Density
C = x8 Bus
Next, the NAND flash pads I needed to identify and connect to were:
I/O 0-7 = Data Input/Output x8
CLE = Command Latch Enable
ALE = Address Latch Enable
CE# = Chip Enable
WE# = Write Enable
RE# = Read Enable
WP# = Write Protect
R/B# = Ready / Busy Out
VCC = Voltage
VSSm = Ground
PT = Chip Protection Enable
With the datasheet, I also identified the above listed connection on the actual chip pad surface.
Typically, the hardest part is soldering the wires to these pads. This is the part that often scares most people away, but it looks harder than it really is. To avoid making it any harder than it has to be, I recommend going light on the coffee that morning – a recommendation I often don’t follow myself, which I end up regretting.
I have found one trick that works well to make attaching wires easier. This adds an extra step to the process but will speed things up later and remove much of the frustration. I recommend first attaching BGA balls to pads you need to attach wires to. Since the pads on this MCP chip are only 0.3 mm, I recommend using a microscope. I typically lay the balls by hand — once flux is placed on the chip surface, it’s simple to move the balls onto the pads one at a time and have them stay in place. Of course, this can also be done with solder paste and stencil. So, pick your favorite poison.
Once the balls have been placed on the correct pads, I place the chip in an InfraRed (IR) reflow oven to fix the balls to the pads. The lead-based BGA balls I use are Sn63/Pb37 and should melt at 183°C or 361°F. I use the following temperature curve set on my IR oven, which I determined using a thermal probe along with some trial-and-error methods. During the reflow process, it’s easy to accidentally damage a chip by overheating it, so take caution. My curve tops out just above 200°C, which has worked well, and I have yet to damage the chips using this curve.
Once the oven has run through its cycle and the chip has cooled down, I clean the chip with alcohol to remove any remaining flux. If all goes well with the reballing process, the chip should have balls attached at each of the required locations, as shown below.
Attaching the wires
The next part is attaching wires to each of these pads. The wire I use for this is 40 gauge magnet wire, which is small enough to be attached to pads that are often .25 to .35 mm in size. This magnet wire is insulated with a thin coat of clear enamel, which can be problematic when soldering it to very small pads and trying to keeping the heat to a reasonable level. To resolve this issue, I burn the enamel insulation away and also coat the end of the wire with a thin coat of solder during that process. To do this, I melt solder onto the end of my solder iron and then stick the end of the magnet wire into the ball of solder on the end of the iron. This method works to remove the enamel insulation and tin the end of the wire, as shown below.
Once the magnet wire has been tinned, I next cut off the excess tinned area with wire cutters. How much you clip off depends on how big the pads are on the chip you’re attaching it to. The goal is to leave enough to properly solder it but not enough overhanging that could cause it to electrically short to other pads.
By pre-tinning the wire and adding solder balls to the chip pads, the process of attaching the wires becomes much quicker and less frustrating. To attach the wires, I take the tinned magnet wire and place a small amount of flux on the tinned area. Then, I push the wire against the solder ball on the chip pad I am attaching it to, and with the hot solder iron, I just barely touch the solder ball on the pad – instantly, the wire is attached. I use a micro-tip solder iron and set the heat high, so it is instant when I do this process. An example of this is shown below:
For the MX63U1GC12HA MCP chip, I used this process to attach all 17 of the needed wires, as shown below, and then held them in place using E6000 brand glue to prevent accidentally knocking the wires loose from mechanical stress on the solder joints.
Reading the chip
Next, it’s time to figure out how to read this chip to extract the firmware data from it. First, we need to attach the 17 wires to the chip reader. To do this, I custom-built a 48-pin Zero insertion force (ZIF) plug with screw terminals that I could attach to the ZIF socket of my RT809H chip programmer. This jig allows each wire to be attached via the screw terminals to any of the 48 pins as needed.
How we wire up a dead-bugged memory chip for reading depends on several things.
Do we have a datasheet?
Does the chip we are dead-bugging come in other package styles?
Does the chip reader support the chip we have, and we just don’t have the correct socket?
Does the manufacturer of our chip produce an unrelated chip that has a similar memory size, bus width, and layout?
Since I didn’t have a chip reader that supports this 162 BGA MCP device, I started looking for another Macronix chip that:
Had 48 pins or less so I could wire it up to my chip reader
Was a NAND Single Level Cell (SLC)
Had 1g in density
Had 8 bit bus
Had operational voltage of 1.8v
After a little time Googling followed by digging through several different datasheets, I found a MX30UF1G18AC-TI, which was for a 48 TSOP package and appeared to match the key areas I was looking for.
Here’s what the name MX30UF1G18AC-TI tells us:
MX = Macronix
30 = NAND
U = 1.7V to 1.95V
F = SLC
1G= 1G-bit
18A= 4-bit ECC with standard feature, x8
The diagrams found in the MX30UF1G18AC datasheet showed the pinout for the TSOP48 NAND memory chip. Using that data, I was able to match each of the required pins to the 162 BGA MCP MX63U1GC12HA so I could correctly wire each connection to the 48-pin ZIF socket for my RT809H chip programmer.
Once all of the connecting wires were properly connected to the screw terminal of my Zif socket, I selected the MX30UF1G18AC chip from the drop-down on the chip programmer and clicked “read.” As expected, the chip programmer first queried the chip for its ID. If it does not match, it will prompt you with “Chip ID does not match,” as shown below.
In this case, I selected “Ignore,” and the devices successfully extracted the data from the NAND flash chip. Some chip readers allow you to just turn this off before attempting to read the chip. Also, if the chip you’re reading is only different in package style, the chip ID will probably match.
The perfect solution is always to have all the proper equipment needed to read all memory chips you encounter, but very few pockets are that deep — or maybe the correct socket is months out for delivery, and you need the data from the chip today. In those cases, having the skills to do this work is important.
I have successfully used this process in a pinch many times to extract firmware from chips when I didn’t have the proper sockets at hand – and in some cases, I didn’t have full datasheets either. If you have not done this, I recommend giving it a try. Expand those soldering skills, and build out test platforms and methods to further simplify the process. Eventually, you may need to use this method, and it’s always better to be prepared.
Ransomware attacks over the last couple years have been traumatic, impacting nearly every business sector and costing billions of dollars. The targets have mostly been our data: steal it, encrypt it, and then charge us a fee to get it back.
Over the last several years, there’s been concern across the security community about the risks related to the Internet of Things (IoT) being impacted by ransomware. For the most part, this has not occurred — although I wouldn’t be surprised if IoT has played a role as the entry point that malicious actors have used, on occasion, to gain access to plant their ransomware on critical systems. Also, we do know of examples where IoT technologies, such as those used within medical and industrial control environments, were impacted during ransomware attacks through key components of their ecosystem involving standard Windows server and desktop solutions.
IoT ransomware risk and its implications
So, what would it take for IoT to be the target of ransomware? First, the IoT being attacked would need to be a large deployment with significant importance in its functions and capabilities. The attack would also need to be disruptive enough that an organization would be willing to pay.
Personally, I’m not confident such an environment exists, at least as it would apply to the average organization. But let’s step back and look at this from the perspective of the vendor who remotely manages, controls, and updates their products over the Internet. For example, imagine what would happen if a malicious actor successfully breached an automotive organization with smart-capable cars — could they shut down every car and lock the company and owner out of fixing them?
If we apply that train of thought across the board for all IoT deployed out there, it becomes very concerning. What if we shut down every multifunction printer by a major manufacturer, home thermostat, building HVAC, or building lighting solution? What happens if the target is a smart city and traffic lights are impacted? We could go on all day talking about the impact from smart city breaches or attacks against small deployed IoT solutions from major brands with global footprints.
Building a threat model
So, are there steps we can take to head off such an event? The answer is yes. I believe IoT vendors and solution owners could best accomplish this by identifying the potential attack vector and risk through threat modeling.
As part of building out a threat model, the first step would be to identify and map out a complete conceptual structure of the IoT system that could be potentially targeted. In the case of IoT technology, this should consist of all components of the system ecosystem that make the solution function as intended, which would include:
Embedded hardware system actuators, sensors, and gateways
Management and control applications, such as mobile and cloud services, as well as thick clients on servers, desktops, and laptops systems
Communication infrastructure used for data and operational controls including Ethernet, Wi-Fi, and other radio frequency (RF)
Any component or subcomponent of this ecosystem is at potential risk for being targeted. Mapping out this information gives us the ability to better understand and consider the potential points of attack that a malicious actor could use to deliver or execute a ransomware style attack against IoT.
In the second step of this threat modeling process, we need to understand the possible goals of a malicious actor who would be targeting an IoT ecosystem, who they may be, and what their end game and potential methods of attack would look like. The threat actors would likely look very similar to any malicious actor or group that carries out ransomware attacks. I think the big difference would be how they would approach attacking IoT ecosystems.
This is the phase where creative thinking plays a big role, and having the right people involved can make all the difference. This means having people on the threat modeling team who can take an attacker mindset and apply that thinking against the IoT ecosystems to map out as many potential attack vectors as possible.
Mapping out the threat and response
The third step in the threat modeling process is building a list of threats we would expect to be used against the above IoT ecosystems. One example, which is also common with typical ransomware attacks, is locking. By locking a component of the IoT solutions ecosystem, a malicious actor could prevent the IoT ecosystem from properly functioning or communicating with other key components, completely taking the technology out of service or preventing it from functioning as intended.
In the final part, we take the detailed information we’ve put together and map out specific attack scenarios with the greatest chance of success. Each scenario should define the various components of the IoT ecosystem potentially at risk, along with the perceived attacker motives, methods, and threats that can lead to the attacker being successful. Once you’ve mapped out these various scenarios in detail, you can use them to define and implement specific controls to mitigate or reduce the probability of success for those attack scenarios.
Using these threat modeling methods will help IoT solution vendors and the organizations that use their products identify and mitigate the risk and impact of ransomware attacks against IoT solutions before they happen.
NEVER MISS A BLOG
Get the latest stories, expertise, and news about security today.
The first thing I noticed about CES this year was COVID’s impact on the event, which was more than just attendance size. A large amount of the technology focused on sanitation, everything from using light to sanitize surfaces on point-of-sale systems to hand-washing stations.
When I attend events such as this, which are not 100% security-related, I still approach them with a very strong security mindset and take the opportunity to talk to many of the vendors about the subject of security within their products. This often has mixed results, with many of those working the booths at CES having more focused knowledge on product functionality and capabilities, not technical questions related to product security. This year was no different, but I still had fun talking about security with many of those working their product booth, and as usual, I had some great conversations.
For example, I love when I see a product that typically wouldn’t be considered smart technology, but then see that it has been retrofitted with some level of smart tech to expand its usefulness, like a toothbrush. This year, I headed right to those booths and started asking security questions, and I was surprised at the responses I got, even though security was not their area of expertise as, say, an oral hygienist. They were still interested in talking about security and made every effort to either answer my question or find the answer. They also were quick to start asking me questions around what they should be concerned with and how would products like theirs be properly tested.
A healthy curiosity
Moving on from there, as usual, I encountered wearable smart technology, which has always been a big item at CES. Going beyond the typical devices to track your steps, smartwatches continue to be improved with a focus on monitoring key health stats including blood pressure, oxygen levels, heart rate, EKG, and even blood sugar levels for diabetics.
At Abbott’s booth, which had several products including the Libre Freestyle for monitoring blood glucose level, which is a product I use. Abbott is releasing a new sensor for this product that has a much smaller profile, and I’m looking forward to that. Since they had no live demos of their currently marketed Libre FreeStyle product, I volunteered to demo my unit for another CES attendee.
One of the Abbott booth employees asked me why I still use their handheld unit and haven’t switched to their mobile application, which was perfect timing for me to start talking security. During the conversation, I told them that I hadn’t personally tested their mobile application and regularly avoid placing apps on my phone that I haven’t security-tested. They all chimed in and recommended that I test their mobile application and let them know if it has any issues that they need to fix. So, I guess I need to add that to my to-do list.
Facing the future
Next, I encountered the typical facial recognition systems we regularly see at CES — but now, they all appear to be able to measure body temperatures and identify you despite wearing a mask. Of course, they also now support contract tracing to help identify if you’ve encountered someone who is COVID-positive. Also, many companies have made their devices more friendly by enabling them to automatically greet you at the door.
Personally, I always have reservations when it comes to facial recognition systems. Don’t get me wrong: I get the value they can bring. But sadly, in the long haul, I expect the data gathered will end up being misused, just like data gathered using other methods. Someone will find a way to commoditize this data if they aren’t already.
Charged up
Another area I expected to see at CES was electric-vehicle (EV) technology, and I wasn’t disappointed. Some may think I’m weird, but my focus wasn’t necessarily on the expensive cars and flying vehicles, although they’re very interesting — it was the charging stations.
With US plans to deploy charging stations across the nation, there’s a large marketplace to support public and home charging systems, and there were many solutions of this kind on display at CES. Several of the vendors indicated they were looking to snap up some of that market share and were actively working to have their products certified in the US.
With EV chargers most likely all being connected or potentially having the ability to impact the electric grid in various ways, I think security should play a big role in their design and deployment, and I took the opportunity to have some security discussions with several vendors. One vendor specifically designed and produced only EV charging hardware, not the software, and had staff at the event who could engage comfortably on the subject of security. Even though this organization hadn’t yet conducted any independent security testing on their product, they understood the value of doing so and asked a number of questions, including details on the processes and methodologies.
Robots: Convenient or creepy?
What would CES be if we didn’t take a quick look at robot technology?
Like many, I’m intrigued and freaked out by robots at the same time. The first ones to look at were the service robots, which are less creepy than others and could be very useful in activities like delivering parts on a shop floor or serving up refreshments at a party.
The convenience of using robots for these tasks is great, and I look forward to seeing this play out some day at a party I am attending. Although, with the typical crowds I run with, I expect everyone will be trying to hack on it and paying very little attention to the food it’s serving.
Finally, I looked at the creepier side of robots. The UK pavilion had a robot that was able to have lifelike facial and hand gestures. I found these features to be very impressive. If this tech could be built to be mobile and handle human interactions, I would say we have advanced to a new level, but I expect this is only mimicking these features, and we still have further to go before we will be living the Jetsons.
Also, Boston Dynamics and Hyundai were at CES. Their advanced robotics work always impresses and also scares me a little, and I’m not alone. My only disappointment was that I couldn’t get into the live demo of the technology. I waited in line, but the interest in the live show was high, and space was limited.
With advancements in robotics like these, we must all give this some deep consideration and answer the questions: What will this tech be used for? And how can we properly secure it? Because if it’s misused or not properly secured, it can lead to issues we never want to deal with. With that said, this robot tech is amazing, and I expect it can be a real game-changer in a number of positive areas.
NEVER MISS A BLOG
Get the latest stories, expertise, and news about security today.
Once you’re logged on in single-user mode (root), I recommend taking a quick look at a few other things that are interesting. For example, look at the partition layout on the flash chips. This can be done by running cat against /proc/mtd. (MTD stands for Memory Technology Devices.) Enter the command “cat /proc/mtd”and hit enter. This should return the list of MTDs (Figure 25), which list their dev number, size, and names.
As you can see, there are a couple of partitions that appear to have similar names, such as “kernel” and “kernel1,” as well as “ubi_rootfs” and “ubi_rootfs1.” The purpose of having duplicate file system partitions is to allow system firmware updates without potentially bricking the device if there were issues during the update process, such as a power failure. During normal operation, one of these partition pairs is online, while the others are offline. So, when a firmware update is done, the offline partitions are updated and then placed online, and the others are taken offline during a system reboot. If there is a failure during the update process, the system can safely roll back to the partition pair that was not corrupted.
Figure 25: /proc/mtd
To gain full running root access on the LUMA, we’re interested in the rootfs_data partition file system (Figure 26).
Figure 26: rootfs_data Partition
This file system “rootfs_data” is used to hold the dynamically configurable system data and user configuration information, which is typically removed if you do a factory reset on the device. This data partition filesystem is typically on all IoT devices but often has different names.
Earlier in this blog series, while reviewing the captured UART console logs, we made note of what UBIFS device number and volume number this partition was mounted on. With that information, our next step will be to mount the rootfs_data partition and create a shadow and passwd file with account information, so when we reboot the system, we’ll be able to gain full root access on a fully operational device. To make this happen, the first step is to create a writable directory that we can mount this file system to. The best place for doing this on an IoT device will always be the /tmp folder, which is a temporary location in RAM and is always read/writable.
To accomplish this, I typically change directory to /tmp and create a folder for a mount point on the device using the following commands:
cd /tmp
mkdir ubifs
Now, use the correct UBIFS device number and volume number we observed in the boot logs:
device 0, volume 2 = /dev/ubi0_2
device 0, volume 3 = /dev/ubi0_3
Enter the following command corrected to either (/dev/ubi0_2 or /dev/ubi0_3) to mount the partition to the mount point you created at /tmp/ubifs:
mount -t ubifs /dev/ubi0_3 /tmp/ubifs/
This command should return results that look similar to Figure 27 without any errors. The only time I have encountered errors was when the rootfs_data volume was corrupted. I was able to correct that by conducting a factory reset on the device and starting over.
Figure 27: Mount UBIFS Partition
If successful, you should be able to change directory to this mounted volume and list the files and folders using the following commands:
cd /tmp/ubifs
ls -al
If the partition was properly mounted, you should see folders and files within the mount point that may look similar to the example shown in Figure 28. Also note that if the device has been factory reset, it may show far fewer folders and files. Although, with the LUMA device, it should at least show the /etc folder.
Figure 28: Mounted rootfs_data Partition
Once you’ve mounted the rootfs_data volume, the next step is to change the directory to the “/tmp/ubifs/etc” folder and create and/or alter the passwd and shadow file to add an account to allow root access privileges. You can do this by entering the following commands, which will create a root account with the username of defcon with a blank password, which we used for the Defcon IoT Village exercises.
The reason why this works is the data volume — in this case, rootfs_data — contains all dynamic configurations and settings for the device, so anything typically added to this volume will take precedence over any setting on the core root filesystem.
As a quick check to make sure everything was done correctly, run the following commands, and make sure the shadow and passwd file were created and the contents are correct.
cat shadow
cat passwd
If correct, the output should look like the following example in Figure 30:
Figure 30: Content of shadow and passwd Files
Reboot and log in
If everything looks good, you’re ready to reboot the system and gain full root access. To reboot the system, you can just enter “reboot” on the UART console or power cycle the device.
Once the system appears to be close to being booted, a good indication on LUMA is seeing the message “Please press Enter to activate this console” in the console. You can then hit the return key to see a login prompt. There may be a lot of log message noise in the console, but you can still enter the configured username defcon that was created during the creation of the shadow and passwd file, followed by the enter key. If everything was configured correctly, you should login without the need of a password as shown in Figure 31:
Figure 31: Login with defcon
If this fails and you’re prompted for a password, the most common cause is that you entered the commands to create the “passwd” and “shadow” files incorrectly. If you logged in, then you’re now fully authenticated as root, and the system should be in the full operational mode. Also, it’s not uncommon to see a lot of output messages to the UART console, which can be a pain and prevent you from easily interacting with the console. To get around this issue, you can temporarily disable most of the messages. Try entering the following command to make it a little quieter:
dmesg -n 1
Once you’ve run that command, it should be much easier to see what’s going on. At this point, you can interact with the system as root. For example, by running the commands below, you can see running processes and show current network open ports and connections.
ps -ef “ List the processes running on the system”
netstat -an “ Shows UDP/TCP ports and connection”
I often get asked during this exercise, “What do we gain from getting this level of root access to an IoT device?” I think the best answer is that this level of access allows us to do more advanced and detailed security testing on a device. This is not as easily done when setting on the outside of the IoT devices or attempting to emulate on some virtual machine, because often, the original hardware contains components and features that are difficult to emulate. With root-level access, we can interact more directly with running services and applications and better monitor the results of any testing we may be conducting.
NEVER MISS A BLOG
Get the latest stories, expertise, and news about security today.
In our first post in this series, we covered the setup of Rapid7’s hands-on exercise at Defcon 29’s IoT Village. Last week, we discussed how to determine the UART status of the header we created and how to actually start hacking on the IoT device. The goal in this next phase of the IoT hacking exercise is to turn the console back on.
To accomplish this, we need to reenter the bootargs variable without the console setting. To change the bootargs variable, the “setenv” command should be used. In the case of this exercise, enter the following command as shown in Figure 16. You can see that the “console=off” has been removed. This will overwrite the current bootargs environment variable setting.
Figure 16: setenv command
Once you’ve run this command, we recommend verifying that you’ve correctly made the changes to the bootargs variable by running the “printenv” command again and observing that the output shows that “console=off” has been removed. It is very common to accidentally mistype an environment variable, which will cause errors on reboot or just create an entirely new variable that has no usable value. The correct bootargs variable line should read as shown in Figure 17:
Figure 17: bootargs setting
Once you’re sure the changes made to bootargs are correct, you’ll need to save the environment variable settings. To do this, you’ll use the “saveenv” command. Enter this command in the UART console, and hit enter. If you miss this step, then none of the changes made to the environment variables of U-Boot will be saved and all will be lost on reboot.
The saveenv should cause the U-Boot environment variables to be written to flash and return a response indicating it is being saved. An example of this is shown in Figure 18:
Figure 18: saveenv command response
Reboot and capture logs for review
Once you’ve made all the needed changes to the U-Boot environment variables and saved them, you can reboot the device, observe console logs from the boot process, and save the console log data to a file for further review. The boot log data from the console will play a critical role in the next steps as you work toward gaining full root access to the device.
Next, reboot the systems. You can do this in a couple of different ways. You can either type the “reset” command within the U-Boot console and hit enter, which tells the MCU to reset and causes the system to restart, or just cycle the power on the device. After entering the reset command or power cycling the device, the device should reboot. The console should now be unlocked, and you should see the kernel boot up. If you still do not have a functioning console, you either entered the wrong data for bootargs or failed to save the settings with the “saveenv” command. I must admit I am personally guilty of both many times.
During the Defcon IoT Village exercise, we had the attendees capture console logs to a file for review using the following process in GtkTerm. If you are using a different serial console application, this process will be different for capture and saving logs.
In GtkTerm, to capture logs for review, select “Log” on the task bar pulldown menu on GtkTerm as shown below in Figure 19:
Figure 19: Enable logging
Once “Log” is selected, a window will pop up. From here, you need to select the file to write out the logs to. In this case, we had the attendees select the defcon_log.txt file on the laptops desktop as shown below in Figure 20:
Figure 20: Select defcon_log.txt file
Once you’ve selected a log file, you should now start capturing logs to that file. From here, the device can be powered back on or restarted to start capturing logs for review. Let the system boot up completely. Once it appears to be up and running, you can turn off logging by selecting “Log” and then selecting “Stop” in the dropdown, as shown in Figure 21:
Figure 21: Stop log capture
Once logging is stopped, you can open the captured log file and review the contents. During the Defcon IoT Village exercise, we had the participants search for the keyword “failsafe” in the captured logs. Searching for failsafe should take you to the log entry containing the line:
“Press the [f] key and hit [enter] to enter failsafe mode”
This is a prompt that allows you to hit the “f” key followed by return to boot the system into single-user mode. You won’t find this mode on all IoT devices, but you will find it on some, like in this case with the LUMA device. Single-user mode will start the system up with limited functionality and is often used for conducting maintenance on an operating system — and, yes, this is root-level access to the device, but with none of the critical system function running that would allow network service, USB access, and applications that are run as part of the device’s normal operation features. Our goal later is to use this access and the following data to eventually gain full running system root access.
There is also another critical piece of data in the log file just shortly after the failsafe mode prompt, which we need to note. Approximately 8 lines below failsafe prompt, there is a reference to “rootfs_data” as shown in Figure 22:
Figure 22: Log review
The piece of data we need from this line is the Unsorted Block Image File System (UBIFS) device number and the volume number. This will let us properly mount the rootfs_data partition later. With the LUMA, we found this to be one of the two following values.
Device 0, volume 2
Device 0, volume 3
Boot into single-user mode
Now that the captured logs have been reviewed, allowing us to identify the failsafe mode and the UBIFS mount data. The next step is to reboot the system into single-user mode, so we can work on getting full root access to the devices. To do this, you’ll need to monitor the system booting up in the UART console, watching for the failsafe mode prompt as shown below in Figure 23:
Figure 23: Failsafe mode prompt
When this prompt shows up, you will only have a couple of seconds to press the “f” key followed by the return key to get the system to launch into single-user root access mode. If you miss this, you’ll need to reboot and start over. If you’re successful, the UART console should show the following prompt (Figure 24):
Figure 24: Single-user mode
In single-user mode, you’ll have root access, although most of the partitions, applications, networks, and associated functions will not be loaded or running. Our goal will be to make changes so you can boot the device up into full operation system mode and have root access.
In our fourth and final installment of this series, we’ll go over how to configure user accounts, and finally, how to reboot the device and login. Check back with us next week!
NEVER MISS A BLOG
Get the latest stories, expertise, and news about security today.
In our last post, we discussed how we set up Rapid7’s hands-on exercise at the Defcon 29 IoT Village. Now, with that foundation laid, we’ll get into how to determine whether the header we created is UART.
When trying to determine baud rate for IoT devices, I often just guess. Generally, for typical IoT hardware, the baud rate is going to be one of the following:
9600
19200
38400
57600
115200
Typically, 115200 and 57600 are the most commonly encountered baud rates on consumer-grade IoT devices. Other settings that need to be made are data bits, stop bits, and parity bits. Typically, these will be set to the following standard defaults, as shown in Figure 5:
Figure 5: Logic 2 Async Serial Decoder Settings
Once all the correct settings have been determined, and if the test point is UART, then the decoder in the Logic 2 application should decode the bit stream and reveal console text data for the device booting up. An example of this is shown in Figure 6:
Figure 6: UART Decode of Channel 1
FTDI UART Setup
Once you’ve properly determined the header is UART and identified transmit, receive, and ground pins, you can next hook up a USB to UART FTDI and start analyzing and hacking on the IoT device. During the IoT Village exercise, we used a Shikra for UART connection. Unfortunately, the Shikra appears to no longer be available, but any USB to UART FTDI device supporting 3.3vdc can be used for this exercise. However, I do recommend purchasing a multi-voltage FTDI device if possible. It’s common to encounter IoT devices that require either 1.8, 3.3, or 5 vdc, so having a product that can support these voltage levels is the best solution.
The software we used to connect to the FTDI device for the exercise at Defcon IoT Village was GtkTerm running on an Ubuntu Linux — but again, any terminal software that supports tty terminal connection will work for this. For example, I have also used CoolTerm or Putty, which both work fine. So just find a terminal software that works best for you and substitute it for what is referenced here.
The next step is to attach the Shikra (pin out) or whatever brand of FTDI USB device you’re using to the UART header on Luma (Figure 7) using this table:
Shikra Pins
Luma Header J19 Pins
Pin 1 TXT
Pin 2 RCV
Pin 2 RCV
Pin 3 TXT
Pin 18 GND
Pin 1 GND
Figure 7: LUMA UART PINOUT
Once the UART to USB device is connected to the LUMA, double-click on the GtkTerm icon located on the Linux Desktop and configure the application by selecting Configuration on the menu bar followed by Port in the drop-down menu. From there, set the Port (/dev/ttyUSB0) and Baud Rate (115200) to match the figure below (Figure 8), and click OK.
Figure 8: Serial Port Settings
Once configured, power on the LUMA device. At this point, you should start to see the device’s boot process logged to the UART console. For the Defcon IoT hacking exercise, we had preconfigured the devices to disable the console, so once we loaded U-boot and started the system kernel image, the console became disabled, as shown in Figure 9:
Figure 9: Console Stops at Kernel Starting
We made these changes so the attendees working on the exercise would experience a common setting often encountered, where the UART console is disabled during the booting process, and they’d have the chance to conduct another common attack that would allow them to break out of this lockdown.
For example, during the boot sequence, it’s often possible to force the device to break out of the boot process and to drop into a U-Boot console. For standard U-Boot, this will often happen when the Kernel image is inaccessible, causing the boot process to error out and drop into a U-Boot console prompt. This condition can sometimes be forced by shorting the data line (serial out) from the flash memory chip containing the kernel image to ground during the boot process. This prevents the boot process from loading the kernel into memory. Figure 5 shows a pin-out image of the flash memory chip currently in use on this device. The data out from the flash memory chip is Serial Out (SO) on pin 2.
Also, I would like to note that during the Defcon IoT Village exercises, I had a conversation with several like-minded IoT hackers who said that they typically do this same attack but use the clock pin (SCLK). So, that is another viable option when conducting this type of attack on an IoT device to gain access to the U-Boot console.
During our live exercises at Defcon IoT Village, to help facilitate the process of grounding the data line Pin 2 Serial Out (SO) — and to avoid ending up with a bunch of dead devices because of accidentally grounding the wrong pins — we attached a lead from pin 2 of the flash memory chip, as shown in Figure 11:
Figure 11: Pin Glitch Lead Connected to Flash
To conduct this “pin glitch” attack to gain access to the U-Boot console, you will need to first power down the device. Then, restart the device by powering it back on while also monitoring the UART Console for the U-boot to start loading. Once you see the U-Boot loading, hold the shorting lead against the metal shielding or some other point of ground within the device, as shown in Figure 12:
Figure 12: Short Pin2 Serial Out (SO) to Ground
Shorting this or the clock pin to ground will prevent U-Boot from being able to load the kernel. If your timing is accurate, you should be successful and now see U-Boot console prompt IPQ40xx, as shown below in Figure 13. Once you see this prompt, you can lay the shorting lead to the side. If this prompt does not show up, then you will need to repeat this process.
Figure 13: U-Boot Console Prompt
With the LUMA device used in this example, this attack is more forgiving and easier to carry out successfully. The main reason, in my opinion, is because the U-Boot image and the kernel image are on separate flash memory chips. In my experience, this seems to cause more of a delay between U-Boot load and kernel loading, allowing for a longer window of time for the pin glitch to succeed.
Alter U-boot environment variables
U-boot environment variables are used to control the boot process of the devices. During this phase of the exercise, we used the following three U-Boot console commands to view, alter, and save changes made to the U-Boot environment variables to re-enable the console, which we had disabled before the exercise.
“Printenv” is used to list the current environment variable settings.
“Setenv” is used to create or modify environment variables.
“Saveenv” is used to write the environment variables back to memory so they are permanent.
When connected into the U-Boot console to view the device’s configured environment variables, the “printenv” command is used. This command will return something that looks like the following Figure 14 below. Scrolling down and viewing the environment settings will reveal a lot about how the device boot process is configured. In the case of the Defcon IoT Village, we had attendees pay close attention to the bootargs variable, because this is where the console was disabled from.
Figure 14: printenv
With a closer look at the bootargs variable as shown below in Figure 15, we can see that the console had been set to off. This is the reason the UART console halted during the boot process once the kernel was loaded.
Figure 15: bootargs Environment Variable Setting
In our third post, we’ll cover the next phase of our IoT Village exercise: turning the console back on and achieving single-user mode. Check back with us next week!
NEVER MISS A BLOG
Get the latest stories, expertise, and news about security today.
This year, Rapid7 participated at the IoT Village during DefCon29 by running a hands-on hardware hacking exercise, with the goal of exposing attendees to concepts and methods for IoT hacking. Over the years, these exercises have covered several different embedded device topics, including how to use a Logic Analyzer, extracting firmware, and gaining root access to an embedded IoT device.
This year’s exercise focused on the latter and covered the following aspects:
Interaction with Universal Asynchronous Receiver Transmitter (UART)
Escaping the boot process to gain access to a U-Boot console
Modification of U-Boot environment variables
Monitoring system console during boot process for information
Accessing failsafe (single-user mode)
Mounting UBIFS partitions
Modifying file system for root access
While at DefCon, we had many IoT Village attendees request a copy of our exercise manual, so I decided to create a series of in-depth write-ups about the exercise we ran there, with better explanation of several of these key topic areas. Over the course of four posts, we’ll detail the exercise and add some expanded context to answer several questions and expand on the discussion we had with attendees at this year’s DefCon IoT Village.
The device we used in our exercise was a Luma Mesh WiFi device. The only change I made to the Luma devices for the exercise was to modify the U-Boot environment variables and add console=off to the bootargs variable to disable the console. I did this to add more complexity to the exercise and show a state that is often encountered.
Identify UART
One of the first steps in gaining root access to an IoT device is to identify possible entry points, such as a UART connection. In the case of our exercise, we performed this ahead of time by locating the UART connection and soldering a 2.54 mm header onto the board. This helped streamline the exercise, so attendees could complete it in a reasonable timeframe. However, the typical method to do this is to examine the device’s circuit board looking for an empty header, as in the example shown in Figure 1:
Figure 1: Common 4 port 2.54mm header
This example shows 4 port headers. Although 4 port headers are common for UART, it is not always the rule. UART connections can be included in larger port headers or may not even have an exposed header. So, when you find a header that you believe to be UART, you’ll need to validate it.
To do this, we first recommend soldering male pins into the exposed socket. This will allow easier connectivity of test equipment. An example of this is shown in Figure 2:
Figure 2: Soldered 2.54mm header
Once you’ve installed a header, I recommend using a logic analyzer to examine the connection for UART data. There are many different logic analyzers available on the market, which range in value from $12 or $15 to hundreds of dollars. In my case, I prefer using a Saleae logic analyzer.
The next step is to identify if any of the header pins are ground. To do this, first make sure the device is powered off. Then, you can use a multimeter set on continuity check and attach the ground lead “Black” to one of the metal shields covering various components on the circuit board, or one of the screws used to hold the circuit board in the cases — both often are found to be electrical ground.
Next, touch each pin in the header with the positive lead “Red” until the multimeter makes a ringing noise. This will indicate which pin is electrically ground. Once you’ve identified ground, you can attach the Logic Analyzer ground to that header pin and then connect the logic channel leads to the remaining pins, as shown in Figure 3:
Figure 3: Logic Analyzer hooked up
Once hooked up, make sure the appropriate analyzer software is installed and running. In my case, I used Saleae’s Logic2. You can then power on the device and capture data on this header to analyze and identify:
As shown in the capture example in Figure 4, I captured 30 seconds of data during power-up of the device for channel 0 and 1. Here, we can see that data is shown on pin 1, which in this case indicates that channel 1, if determined to be UART, is most likely connected to the transmit pin. Since we are not sending any data to the device, channel 0 should show nothing, indicating it is most likely the receive pin.
Figure 4: Logic-2 Capture 30 seconds
The next step is to make a final determination as to whether this is a UART header? If so, what is the baud rate?
We’ll cover this and the subsequent steps in our next post. Check back next week for more!
NEVER MISS A BLOG
Get the latest stories, expertise, and news about security today.
Amazon Web Services (AWS) recently released the Security at the Edge: Core Principles whitepaper. Today’s business leaders know that it’s critical to ensure that both the security of their environments and the security present in traditional cloud networks are extended to workloads at the edge. The whitepaper provides security executives the foundations for implementing a defense in depth strategy for security at the edge by addressing three areas of edge security:
Additional AWS edge services, which customers can use to help secure their edge environments or expand operations into new, previously unsupported environments
Together, these elements offer core principles for designing a security strategy at the edge, and demonstrate how AWS services can provide a secure environment extending from the core cloud to the edge of the AWS network and out to customer edge devices and endpoints. You can find more information in the Security at the Edge: Core Principles whitepaper.
If you have feedback about this post, submit comments in the Comments section below.
Want more AWS Security how-to content, news, and feature announcements? Follow us on Twitter.
Today, it’s easy to run Edge Impulse machine learning on any operating system, like Raspberry Pi OS, and on every cloud, like Microsoft’s Azure IoT. Evan Rust, Technology Ambassador for Edge Impulse, walks us through it.
Building enterprise-grade IoT solutions takes a lot of practical effort and a healthy dose of imagination. As a foundation, you start with a highly secure and reliable communication between your IoT application and the devices it manages. We picked our favorite integration, the Microsoft Azure IoT Hub, which provides us with a cloud-hosted solution backend to connect virtually any device. For our hardware, we selected the ubiquitous Raspberry Pi 4, and of course Edge Impulse, which will connect to both platforms and extend our showcased solution from cloud to edge, including device authentication, out-of-box device management, and model provisioning.
From edge to cloud – getting started
Edge machine learning devices fall into two categories: some are able to run very simple models locally, and others have more advanced capabilities that allow them to be more powerful and have cloud connectivity. The second group is often expensive to develop and maintain, as training and deploying models can be an arduous process. That’s where Edge Impulse comes in to help to simplify the pipeline, as data can be gathered remotely, used effortlessly to train models, downloaded to the devices directly from the Azure IoT Hub, and then run – fast.
This reference project will serve you as a guide for quickly getting started with Edge Impulse on Raspberry Pi 4 and Azure IoT, to train a model that detects lug nuts on a wheel and sends alerts to the cloud.
Setting up the hardware
Raspberry Pi 4 forms the base for the Edge Impulse machine learning setup
To begin, you’ll need a Raspberry Pi 4 with an up-to-date Raspberry Pi OS image which can be found here. After flashing this image to an SD card and adding a file named wpa_supplicant.conf
ctrl_interface=DIR=/var/run/wpa_supplicant GROUP=netdev
update_config=1
country=<Insert 2 letter ISO 3166-1 country code here>

network={
	ssid="<Name of your wireless LAN>"
	psk="<Password for your wireless LAN>"
}
along with an empty file named ssh (both within the /boot directory), you can go ahead and power up the board. Once you’ve successfully SSH’d into the device with
$ ssh pi@<IP_ADDRESS>
and the password raspberry, it’s time to install the dependencies for the Edge Impulse Linux SDK. Simply run the next three commands to set up the NodeJS environment and everything else that’s required for the edge-impulse-linux wizard:
$ npm config set user root && sudo npm install edge-impulse-linux -g --unsafe-perm
Since this project deals with images, we’ll need some way to capture them. The wizard supports both the Pi Camera modules and standard USB webcams, so make sure to enable the camera module first with
$ sudo raspi-config
if you plan on using one. With that completed, go to the Edge Impulse Studio and create a new project, then run the wizard with
$ edge-impulse-linux
and make sure your device appears within the Edge Impulse Studio’s device section after logging in and selecting your project.
Capturing your data
Training accurate machine learning models requires feeding plenty of varied data, which means a lot of images are required. For this use case, I captured around 50 images of a wheel that had lug nuts on it. After I was done, I headed to the Labeling queue in the Data Acquisition page and added bounding boxes around each lug nut within every image, along with every wheel.
To add some test data, I went back to the main Dashboard page and clicked the Rebalance dataset button, which moves 20% of the training data to the test data bin.
Training your models
So now that we have plenty of training data, it’s time to do something with it, namely train a model. The first block in the impulse is an Image Data block, and it scales each image to a size of 320 by 320 pixels. Next, image data is fed to the Image processing block which takes the raw RGB data and derives features from it.
Finally, these features are sent to the Transfer Learning Object Detection model which learns to recognize the objects. I set my model to train for 30 cycles at a learning rate of .15, but this can be adjusted to fine-tune the accuracy.
As you can see from the screenshot below, the model I trained was able to achieve an initial accuracy of 35.4%, but after some fine-tuning, it was able to correctly recognize objects at an accuracy of 73.5%.
Testing and deploying your models
In order to verify that the model works correctly in the real world, we’ll need to deploy it to our Raspberry Pi 4. This is a simple task thanks to the Edge Impulse CLI, as all we have to do is run
$ edge-impulse-linux-runner
which downloads the model and creates a local webserver. From here, we can open a browser tab and visit the address listed after we run the command to see a live camera feed and any objects that are currently detected.
Integrating your models with Microsoft Azure IoT
With the model working locally on the device, let’s add an integration with an Azure IoT Hub that will allow our Raspberry Pi to send messages to the cloud. First, make sure you’ve installed the Azure CLI and have signed in using az login. Then get the name of the resource group you’ll be using for the project. If you don’t have one, you can follow this guide on how to create a new resource group. After that, return to the terminal and run the following commands to create a new IoT Hub and register a new device ID:
to add the necessary libraries. (Note: if you do not set the environment variable or pass it in as an argument, the program will not work!) The connection string contains the information required for the device to establish a connection with the IoT Hub service and communicate with it. You can then monitor output in the Hub with
To make sure it works, download and run this example to make sure you can see the test message. For the second half of deployment, we’ll need a way to customize how our model is used within the code. Thankfully, Edge Impulse provides a Python SDK for this purpose. Install it with
where <LUG_NUT_COUNT> is the correct number of lug nuts that should be attached to the wheel (you might have to use python3 if both Python 2 and 3 are installed).
Now whenever a wheel is detected the number of lug nuts is calculated. If this number falls short of the target, a message is sent to the Azure IoT Hub.
And by only sending messages when there’s something wrong, we can prevent an excess amount of bandwidth from being taken due to empty payloads.
The possibilities are endless
Imagine utilizing object detection for an industrial task such as quality control on an assembly line, or identifying ripe fruit amongst rows of crops, or detecting machinery malfunction, or remote, battery-powered inferencing devices. Between Edge Impulse, hardware like Raspberry Pi, and the Microsoft Azure IoT Hub, you can design endless models and deploy them on every device, while authenticating each and every device with built-in security.
You can set up individual identities and credentials for each of your connected devices to help retain the confidentiality of both cloud-to-device and device-to-cloud messages, revoke access rights for specific devices, transmit code and services between the cloud and the edge, and benefit from advanced analytics on devices running offline or with intermittent connectivity. And if you’re really looking to scale your operation and enjoy a complete dashboard view of the device fleets you manage, it is also possible to receive IoT alerts in Microsoft’s Connected Field Service from Azure IoT Central – directly.
Want to dabble in the Internet of Things but don’t know where to start? Well, our friends at Microsoft have developed something fun and free just for you. Here’s Senior Cloud Advocate Jim Bennett to tell you all about their brand new online curriculum for IoT beginners.
IoT — the Internet of Things — is one of the biggest growth areas in technology, and one that, to me, is very exciting. You start with a device like a Raspberry Pi, sprinkle some sensors, dust with code, mix in some cloud services and poof! You have smart cities, self-driving cars, automated farming, robotic supermarkets, or devices that can clean your toilet after you shout at Alexa for the third time.
Why doesn’t my local supermarket have a restocking robot?
It feels like every week there is another survey out on what tech skills will be in demand in the next five years, and IoT always appears somewhere near the top. This is why loads of folks are interested in learning all about it.
In my day job at Microsoft, I work a lot with students and lecturers, and I’m often asked for help with content to get started with IoT. Not just how to use whatever cool-named IoT services come from your cloud provider of choice to enable digital whatnots to add customer value via thingamabobs, but real beginner content that goes back to the basics.
‘IoT for Beginners’ is totally free for anyone wanting to learn about the Internet of Things
This is why a few of us have spent the last few months locked away building IoT for Beginners. It’s a free, open source, 24-lesson university-level IoT curriculum designed for teachers and students, and built by IoT experts, education experts and students.
What will you learn?
The lessons are grouped into projects that you can build with a Raspberry Pi so that you can deep-dive into use cases of IoT, following the journey of food from farm to table.
You’ll build projects as you learn the concepts of IoT devices, sensors, actuators, and the cloud, including:
An automated watering system, controlling a relay via a soil moisture sensor. This starts off running just on your device, then moves to a free MQTT broker to add cloud control. It then moves on again to cloud-based IoT services to add features like security to stop Farmer Giles from hacking your watering system.
A GPS-based vehicle tracker plotting the route taken on a map. You get alerts when a vehicle full of food arrives at a location by using cloud-based mapping services and serverless code.
AI-based fruit quality checking using a camera on your device. You train AI models that can detect if fruit is ripe or not. These start off running in the cloud, then you move them to the edge running directly on your Raspberry Pi.
Smart stock checking so you can see when you need to restack the shelves, again powered by AI services.
A voice-controlled smart timer so you have more devices to shout at when cooking your food! This one uses AI services to understand what you say into your IoT device. It gives spoken feedback and even works in many different languages, translating on the fly.
In this post, you’ll learn how the integration of IoT security findings into Security Hub works, and you can download AWS CloudFormation templates to implement the solution. After you deploy the solution, every failed audit check will be recorded as a Security Hub finding. The findings within Security Hub provides an AWS IoT Device Defender finding severity level and direct link to the AWS IoT Device Defender console so that you can take possible remediation actions. If you address the underlying findings or suppress the findings by using the AWS IoT Device Defender console, the solution function will automatically archive any related findings in Security Hub when a new audit occurs.
The solution is intended for AWS accounts with fewer than 10,000 findings per scan. If AWS IoT Device Defender has more than 10,000 findings, the limit of 15 minutes for the duration of the serverless AWS Lambda function might be exceeded, depending on the network delay, and the function will fail.
The templates that we provide here will provision an Amazon Simple Notification Service (Amazon SNS) topic notifying you when the AWS IoT Device Defender report is ready, and a Lambda function that imports the findings from the report into Security Hub. Figure 1 shows the solution architecture.
Figure 1: Solution architecture
The solution workflow is as follows:
AWS IoT Device Defender performs an audit of your environment. You should set up a regular audit as described in Audit guide: Enable audit checks.
AWS IoT Device Defender sends an SNS notification with a summary of the audit report.
A Lambda function named import-iot-defender-findings-to-security-hub is triggered by the SNS topic.
The Lambda function gets the details of the findings from AWS IoT Device Defender.
The Lambda function imports the new findings to Security Hub and archives the previous report findings. An example of findings in Security Hub is shown in Figure 2.
Figure 2: Security Hub findings example
Prerequisites
You must have Security Hub turned on in the Region where you’re deploying the solution.
You must also have AWS IoT Device Defender audit checks turned on. Learn how to configure recurring audit checks across all your IoT devices by using this tutorial.
Deploy the solution
You will need to deploy the solution once in each AWS Region where you want to integrate IoT security findings into Security Hub.
To deploy the solution
Choose Launch Stack to launch the AWS CloudFormation console with the prepopulated CloudFormation demo template.
Additionally, you can download the latest solution code from GitHub.
(Optional) In the CloudFormation console, you are presented with the template parameters before you deploy the stack. You can customize these parameters or keep the defaults:
S3 bucket with sources: This bucket contains all the solution sources, such as the Lambda function and templates. You can keep the default text if you’re not customizing the sources.
Prefix for S3 bucket with sources: The prefix for all the solution sources. You can keep the default if you’re not customizing the sources.
Go to the AWS IoT Core console and set up an SNS alert notification parameter for the audit report. To do this, in the left navigation pane of the console, under Defend, choose Settings, and then choose Edit to edit the SNS alert. The SNS topic is created by the solution stack and named iot-defender-report-notification.
Figure 3: SNS alert settings for AWS IoT Device Defender
Test the solution
To test the solution, you can simulate an “AWS IoT policies are overly permissive” finding by creating an insecure policy.
To create an insecure policy
Go to the AWS IoT Core console. In the left navigation pane, under Secure, choose Policies.
Choose Create. For Name, enter InsecureIoTPolicy.
For Action, select iot:*. For Resources, enter *. Choose Allow statement, and then choose Create.
Next, run a new IoT security audit by choosing IoT Core > Defend > Audit > Results > Create and selecting the option Run audit now (Once).
After the audit is finished, you’ll see audit reports in the AWS IoT Core console, similar to the ones shown in Figure 4. One of the reports shows that the IoT policies are overly permissive. The same findings are also imported into Security Hub as shown in Figure 2.
Figure 4: AWS IoT Device Defender report
Troubleshooting
To troubleshoot the solution, use the Amazon CloudWatch Logs of the Lambda function import-iot-defender-findings-to-security-hub. The solution can fail if:
The wrong SNS topic is configured in the AWS IoT Device Defender settings
The Lambda function times out because there are more than 10,000 findings
To find these issues, go to the CloudWatch console, choose Log Group, and then choose /aws/lambda/import-iot-defender-findings-to-security-hub.
Conclusion
In this post, you’ve learned how to integrate AWS IoT Device Defender audit findings with Security Hub to gain a centralized view of security findings across both your enterprise and IoT workloads. If you have more questions about IoT, you can reach out to the AWS IoT forum, and if you have questions about Security Hub, visit the AWS Security Hub forum. If you need AWS experts to help you plan, build, or optimize your infrastructure, contact AWS Professional Services.
If you have feedback about this post, submit comments in the Comments section below.
Want more AWS Security how-to content, news, and feature announcements? Follow us on Twitter.
Usually, when you read an IoT hacking report or blog post, it ends with something along the lines of, “and that’s how I got root,” or “and there was a secret backdoor credential,” or “and every device in the field uses the same S3 bucket with no authentication.” You know, something bad, and the whole reason for publishing the research in the first place. While such research is of course interesting, important, and worth publishing, we pretty much never hear about the other outcome: the IoT hacking projects that didn’t uncover something awful, but instead ended up with, “and everything looked pretty much okay.”
So, this HaXmas, I decided to dig around a little in Rapid7’s library of IoT investigations that never really went anywhere, just to see which tools were used. The rest of this blog post is basically a book report of the tooling used in a recent engagement performed by our own Jonathan Stines, and can be used as a starting point if you’re interested in getting into some casual IoT hacking yourself. Even though this particular engagement didn’t go anywhere, I had a really good time reading along with Stines’ investigation on a smart doorbell camera.
Burp Suite
While Burp Suite might be a familiar mainstay for web app hackers, it has a pretty critical role in IoT investigations as well. The “I” in IoT is what makes these Things interesting, so checking out what and how those gadgets are chatting on the internet is pretty critical in figuring out the security posture of those devices. Burp Suite lets investigators capture, inspect, and replay conversations in a proxied context, and the community edition is a great way to get started with this kind of manual, dynamic analysis.
Frida
While Burp is great, if the IoT mobile app you’re looking at (rightly) uses certificate pinning in order to secure communications, you won’t get very far with its proxy capabilities. In order to deal with this, you’ll need some mechanism to bypass the application’s pinned cert, and that mechanism is Frida. While Frida might be daunting for the casual IoT hacker, there’s a great HOWTO by Vedant that provides some verbose instructions for setting up Frida, adb, and Burp Suite in order to inject a custom SSL certificate and bypass that pesky pinning. Personally, I had never heard of Frida or how to use it for this sort of thing, so it looks like I’m one of today’s lucky 10,000.
Binwalk
When mucking about with firmware (the packaged operating system and applications that makes IoT devices go), Binwalk from Refirm Labs is the standard for exploring those embedded filesystems. In nearly all cases, a “check for updates” button on a newly opened device will trigger some kind of firmware download—IoT devices nearly always update themselves by downloading and installing an entirely new firmware—so if you can capture that traffic with something like Wireshark (now that you’ve set up your proxied environment), you can extract those firmware updates and explore them with Binwalk.
Allsocket eMMC153 chip reader
Now, with the software above, you will go far in figuring out how an IoT device does its thing, but the actual hands-on-hardware experience in IoT hacking is kinda the fun part that differentiates it from regular old web app testing. So for this, you will want to get your hands on a chip reader for your desoldered components. Pictured below is an Allsocket device that can be used to read both 153-pin and 169-pin configurations of eMMC storage, both of which are very common formats for solid-state flash memory in IoT-land. Depending on where you get it, they can run about $130, so not cheap, but also not bank-breaking.
Thanks!
Thanks again to Jonathan Stines, who did all the work that led to this post. If you need some validation of your IoT product, consider hiring him for your next IoT engagement. Rapid7’s IoT assessment experts are all charming humans who are pretty great at not just IoT hacking, but explaining what they did and how they did it. And, if you like this kind of thing, drop a comment below and let me know—I’m always happy to learn and share something new (to me) when it comes to hardware hacking.
T’was the night before HaXmas, when all through the house, Not a creature was stirring, not even a mouse. The stockings were hung by the chimney with care, in hopes that St. Nicholas soon would be there.
This may be the way you start your holiday cheer, but before you get started, let me make you aware. I spend my holidays quite differently, I fear. As a white-hat hacker with a UPnP cheer.
And since you may not be aware, let me share what I learned with you, so that you can also care, how to port forward with UPnP holiday cheer.
Universal Plug and Play (UPnP) is a service that has been with us for many years and is used to automate discovery and setup of network and communication services between devices on your network. For today’s discussion, this blog post will only cover the port forwarding services and will also share a Python script you can use to start examining this service.
UPnP port forwarding services are typically enabled by default on most consumer internet-facing Network Address Translation (NAT) routers supplied by internet service providers (ISP) for supporting IPv4 networks. This is done so that devices on the internal network can automate their setup of needed TCP and UDP port forwarding functions on the internet-facing router, so devices on the internet can connect to services on your internal network.
So, the first thing I would like to say about this is that if you are not running applications or systems such as internet gaming systems that require this feature, I would recommend disabling this on your internet-facing router. Why? Because it has been used by malicious actors to further compromise a network by opening up port access into internal networks via malware. So, if you don’t need it, you can remove the risk by disabling it. This is the best option to help reduce any unnecessary exposure.
To make all this work, UPnP uses a discovery protocol known as Simple Service Discovery Protocol (SSDP). This SSDP discovery service for UPnP is a UDP service that responds on port 1900 and can be enumerated by broadcasting an M-SEARCH message via the multicast address 239.255.255.250. This M-SEARCH message will return device information, including the URL and port number for the device description file ‘rootDesc.xml’. Here is an example of a returned M-SEARCH response from a NETGEAR Wi-Fi router device on my network:
To send a M-SEARCH multicast message, here is a simple Python script:
# simple script to enumerate UPNP devices

import socket

# M-Search message body
MS = \
    'M-SEARCH * HTTP/1.1\r\n' \
    'HOST:239.255.255.250:1900\r\n' \
    'ST:upnp:rootdevice\r\n' \
    'MX:2\r\n' \
    'MAN:"ssdp:discover"\r\n' \
    '\r\n'

# Set up a UDP socket for multicast
SOC = socket.socket(socket.AF_INET, socket.SOCK_DGRAM, socket.IPPROTO_UDP)
SOC.settimeout(2)

# Send M-Search message to multicast address for UPNP
SOC.sendto(MS.encode('utf-8'), ('239.255.255.250', 1900) )

#listen and capture returned responses
try:
    while True:
        data, addr = SOC.recvfrom(8192)
        print (addr, data)
except socket.timeout:
        pass
The next step is to access the rootDesc.xml file. In this case, this is accessible on my device via http://192.168.2.74:5555/rootDesc.xml. Looking at the M-SEARCH response above, we can see that the IP address for rootDesc.xml at 169.254.39.187. 169.254.*.* is known as an Automatic Private IP address. It is not uncommon to see an address in that range returned by an M-SEARCH request. Trying to access it will fail because it is incorrect. To actually access the rootDesc.xml file, you will need to use the device’s true IP address, which in my case was 192.168.2.74 and was shown in the header of the M-SEARCH message response.
Once the rootDesc.xml is returned, you will see some very interesting things listed, but in this case, we are only interested in port forwarding. If port forwarding service is available, it will be listed in the rootDesc.xml file as service type WANIPConnection, as shown below:
You can open WANIPCn.xml on the same http service and TCP port location that you retrieved the rootDesc.xml file. The WANIPCn.xml file identifies various actions that are available, and this will often include the following example actions:
AddPortMapping
GetExternalIPAddress
DeletePortMapping
GetStatusInfo
GetGenericPortMappingEntry
GetSpecificPortMappingEntry
Under each of these actions will be an argument list. This argument list specifies the argument values that can be sent via Simple Object Access Protocol (SOAP) messages to the control URL at http://192.168.2.74:5555/ctl/IPConn, which is used to configure settings or retrieve status on the router device. SOAP is a messaging specification that uses a Extensible Markup Language (XML) format to exchange information.
Below are a couple captured SOAP messages, with the first one showing AddPortMapping. This will set up port mapping on the router at the IP address 192.168.1.1. The port being added in this case is TCP 1234 and it is set up to map the internet side of the router to the internal IP address of 192.168.1.241, so anyone connecting to TCP port 1234 on the external IP address of the router will be connected to port 1234 on internal host at 192.168.1.241.
The following captured SOAP message shows the action DeletePortMapping being used to delete the port mapping that was created in the above SOAP message:
To conclude this simple introduction to UPnP, SSDP, and port forwarding services, I highly recommend that you do not experiment on your personal internet-facing router or DSL modem where you could impact your home network’s security posture. But I do recommend that you set up a test environment. This can easily be done with any typical home router or Wi-Fi access point with router services. These can often be purchased used, or you may even have one laying around that you have upgraded from. It is amazing how simple it is to modify a router using these UPnP services by sending SOAP messages, and I hope you will take this introduction and play with these services to further expand your knowledge in this area. If you are looking for further tools for experimenting with port forwarding services, you can use the UPnP IGD SOAP Port Mapping Utility in Metasploit to create and delete these port mappings.
But I heard him exclaim, ere he drove out of sight-
Happy HaXmas to all, and to all a good UPnP night
NEVER MISS A BLOG
Get the latest stories, expertise, and news about security today.
Most cattle are not raised in cities—they live on cattle stations, large open plains, and tracts of land largely unpopulated by humans. It’s hard to keep connected with the herd. Cattle don’t often carry their own mobile phones, and they don’t pay a mobile phone bill. Naturally, the areas in which cattle live, often do not have cellular connectivity or reception. But they now have one way to stay connected: a world-first satellite ear tag.
Ceres Tag co-founders Melita Smith and David Smith recognized the problem given their own farming background. David explained that they needed to know simple things to begin with, such as:
Where are they?
How many are out there?
What are they doing?
What condition are they in?
Are they OK?
Later, the questions advanced to:
Which are the higher performing animals that I want to keep?
Where do I start when rounding them up?
As assets, can I get better financing and insurance if I can prove their location, existence, and condition?
To answer these questions, Ceres Tag first had to solve the biggest challenge, and it was not to get cattle to carry their mobile phones and pay mobile phone bills to generate the revenue needed to get greater coverage. David and Melita knew they needed help developing a new method of tracking, but in a way that aligned with current livestock practices. Their idea of a satellite connected ear tag came to life through close partnership and collaboration with CSIRO, Australia’s national science agency. They brought expertise to the problem, and rallied together teams of experts across public and private partnerships, never accepting “that’s not been done before” as a reason to curtail their innovation.
Figure 1: How Ceres Tag works in practice
Thinking Big: Ceres Tag Protocol
Melita and David constructed their idea and brought the physical hardware to reality. This meant finding strategic partners to build hardware, connectivity partners that provided global coverage at a cost that was tenable to cattle operators, integrations with existing herd management platforms and a global infrastructure backbone that allowed their solution to scale. They showed resilience, tenacity and persistence that are often traits attributed to startup founders and lifelong agricultural advocates. Explaining the purpose of the product often requires some unique approaches to defining the value proposition while fundamentally breaking down existing ways of thinking about things. As David explained, “We have an internal saying, ‘As per Ceres Tag protocol …..’ to help people to see the problem through a new lens.” This persistence led to the creation of an easy to use ear tagging applicator and a two-prong smart ear tag. The ear tag connects via satellite for data transmission, providing connectivity to more than 120 countries in the world and 80% of the earth’s surface.
Figure 2: The Ceres Tag applicator, smart tag, and global satellite connectivity
Unlocking the blocker: data-driven insights
With the hardware and connectivity challenges solved, Ceres Tag turned to how the data driven insights would be delivered. The company needed to select a technology partner that understood their global customer base, and what it means to deliver a low latency solution for web, mobile and API-driven solutions. David, once again knew the power in leveraging the team around him to find the best solution. The evaluation of cloud providers was led by Lewis Frost, COO, and Heidi Perrett, Data Platform Manager. Ceres Tag ultimately chose to partner with AWS and use the AWS Cloud as the backbone for the Ceres Tag Management System.
Figure 3: Ceres Tag conceptual diagram
The Ceres Tag Management System houses the data and metadata about each tag, enabling the traceability of that tag throughout each animal’s life cycle. This includes verification as to whom should have access to their health records and history. Based on the nature of the data being stored and transmitted, security of the application is critical. As a startup, it was important for Ceres Tag to keep costs low, but to also to be able to scale based on growth and usage as it expands globally.
Ceres Tag is able to quickly respond to customers regardless of geography, routing traffic to the appropriate end point. They accomplish this by leveraging Amazon CloudFront as the Content Delivery Network (CDN) for traffic distribution of front-end requests and Amazon Route 53 for DNS routing. A multi-Availability Zone deployment and AWS Application Load Balancer distribute incoming traffic across multiple targets, increasing the availability of your application.
Ceres Tag is using AWS Fargate to provide a serverless compute environment that matches the pay-as-you-go usage-based model. AWS also provides many advanced security features and architecture guidance that has helped to implement and evaluate best practice security posture across all of the environments. Authentication is handled by Amazon Cognito, which allows Ceres Tag to scale easily by supporting millions of users. It leverages easy-to-use features like sign-in with social identity providers, such as Facebook, Google, and Amazon, and enterprise identity providers via SAML 2.0.
The data captured from the ear tag on the cattle is will be ingested via AWS PrivateLink. By providing a private endpoint to access your services, AWS PrivateLink ensures your traffic is not exposed to the public internet. It also makes it easy to connect services across different accounts and VPCs to significantly simplify your network architecture. In leveraging a satellite connectivity provider running on AWS, Ceres Tag will benefit from the AWS Ground Station infrastructure leveraged by the provider in addition to the streaming IoT database.
Animator/engineer Ashok Fair has put witch-level finger pointing powers in your hands by sticking a SmartEdge Agile, wirelessly controlled by Raspberry Pi Zero, to a golf glove. You could have really freaked the bejeezus out of Halloween party guests with this (if we were allowed to have Halloween parties that is).
The build uses a Smart Edge Agile IoT device with Brainium, a cloud-based tool for performing machine learning tasks.
The Rapid IoT kit is interfaced with Raspberry Pi Zero and creates a thread network connecting to light, car, and fan controller nodes.
The Brainium app is installed on Raspberry Pi and bridges between the cloud and Smart Edge device. MQTT is running on Python and processes the Rapid IoT Kit’s data.
The device is mounted onto a golf glove, giving the wearer seemingly magical powers with the wave of a hand.
NXP Rapid IoT Prototyping Kit (the square blue screen stuck on the adaptor board with the Raspberry Pi Zero)
Brainium AI Studio app
Golf glove
Waking up the Rapid IoT screen
To get started, the glove wearer draws a pattern above the screen attached to the Raspberry Pi to unlock it and wake up all the controller nodes.
The light controller node is turned on by drawing a clockwise circle, and turned off with an counter-clockwise circle.
The full kit and caboodle
The fan is turned on and off in the same way, and you can increase the fan’s speed by moving your hand upwards and reduce the speed by moving your hand down. You know it’s working by the look of the fan’s LEDs: they blinker faster as the fan speeds up.
Make a pushing motion in the air above the car to make it move forward, and you can also make it turn and reverse.
“Driving glove”
If you wear the glove while driving, it collects data in real time and logs it on the Brainium cloud so you can review your driving style.
To provide the best experiences, we use technologies like cookies to store and/or access device information. Consenting to these technologies will allow us to process data such as browsing behavior or unique IDs on this site. Not consenting or withdrawing consent, may adversely affect certain features and functions.
Functional
Always active
The technical storage or access is strictly necessary for the legitimate purpose of enabling the use of a specific service explicitly requested by the subscriber or user, or for the sole purpose of carrying out the transmission of a communication over an electronic communications network.
Preferences
The technical storage or access is necessary for the legitimate purpose of storing preferences that are not requested by the subscriber or user.
Statistics
The technical storage or access that is used exclusively for statistical purposes.The technical storage or access that is used exclusively for anonymous statistical purposes. Without a subpoena, voluntary compliance on the part of your Internet Service Provider, or additional records from a third party, information stored or retrieved for this purpose alone cannot usually be used to identify you.
Marketing
The technical storage or access is required to create user profiles to send advertising, or to track the user on a website or across several websites for similar marketing purposes.


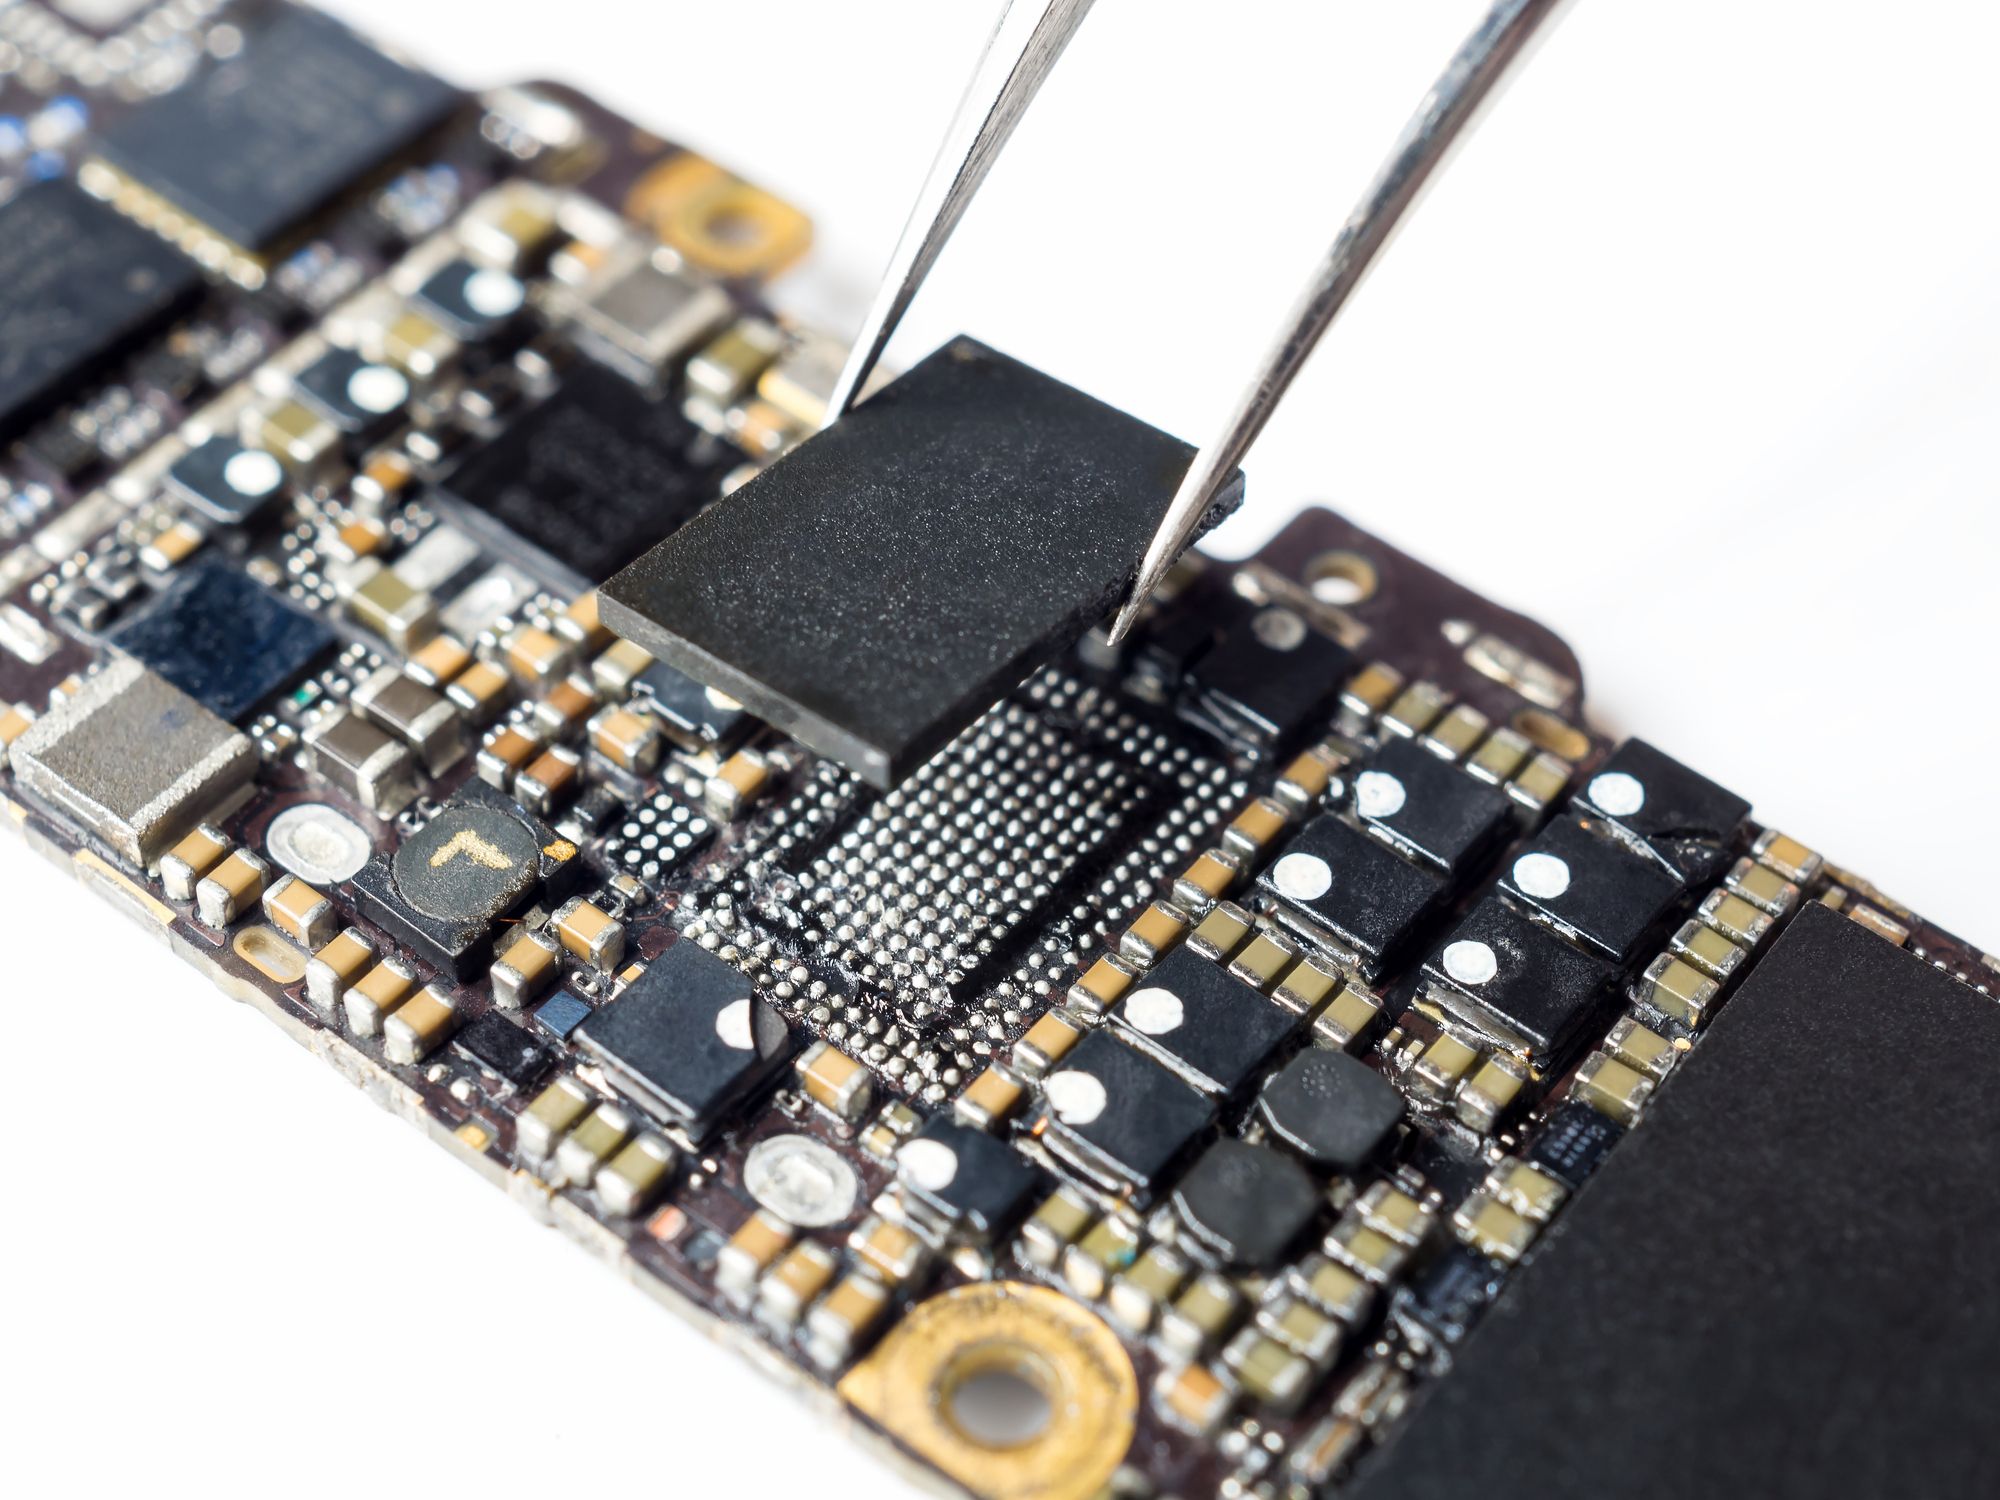
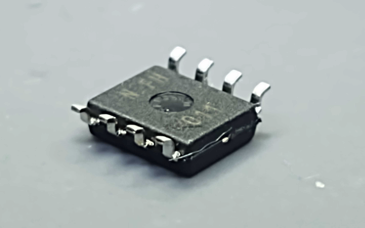
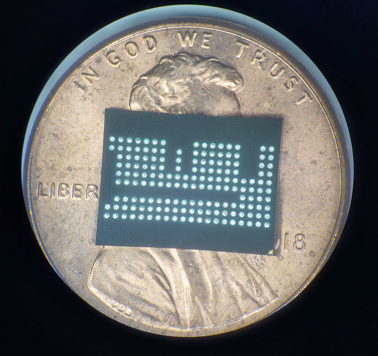
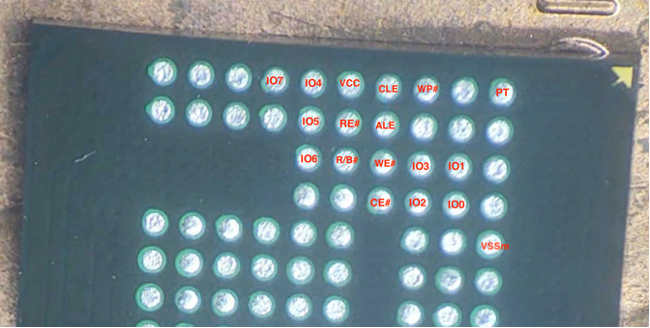

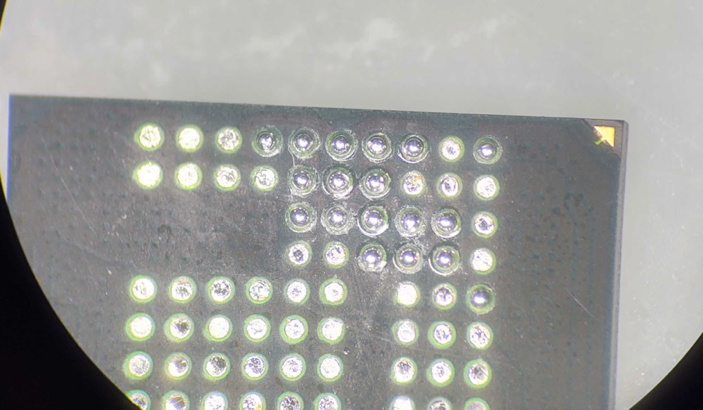
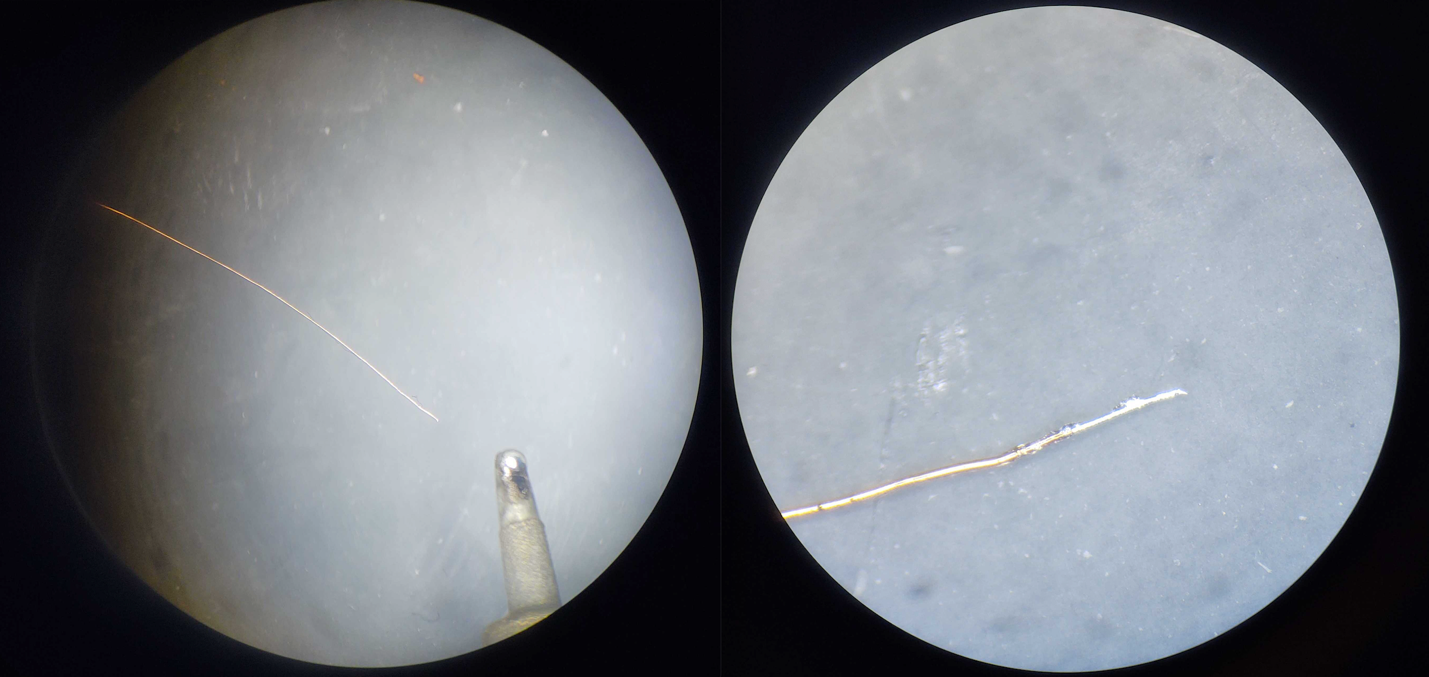

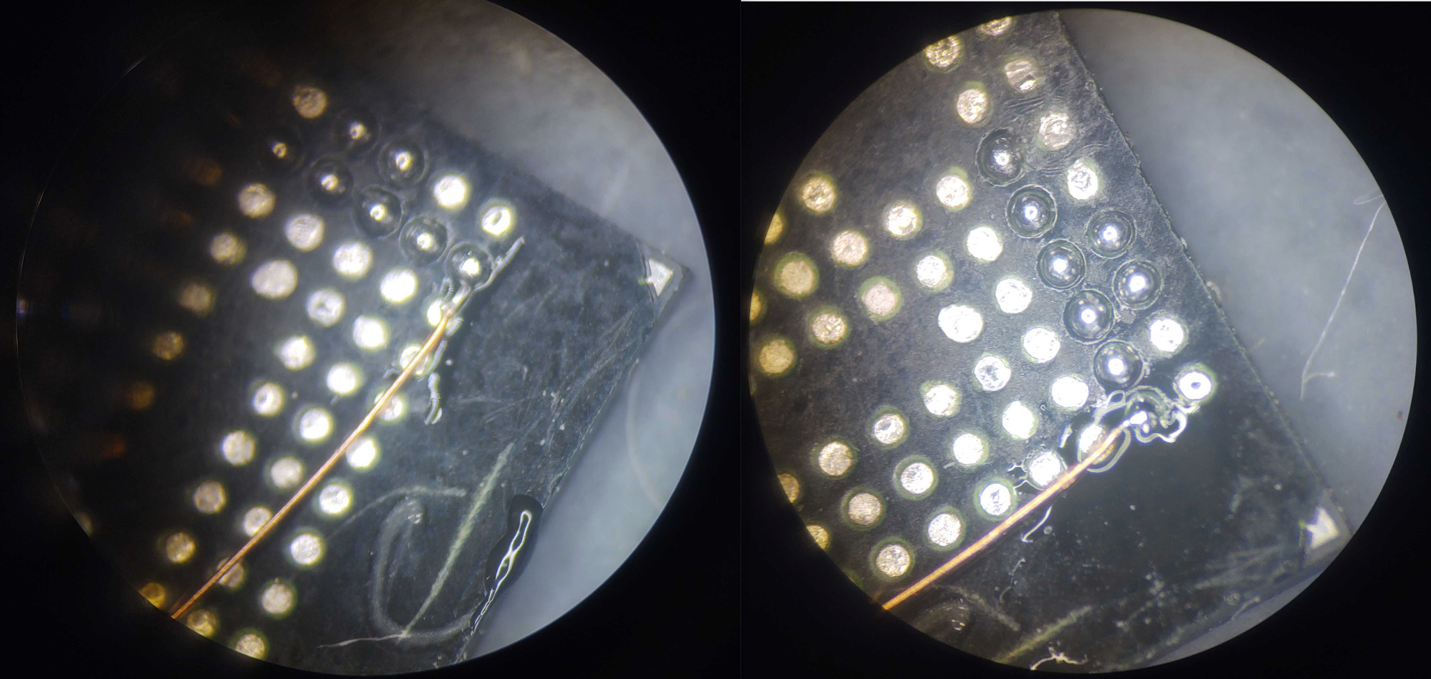
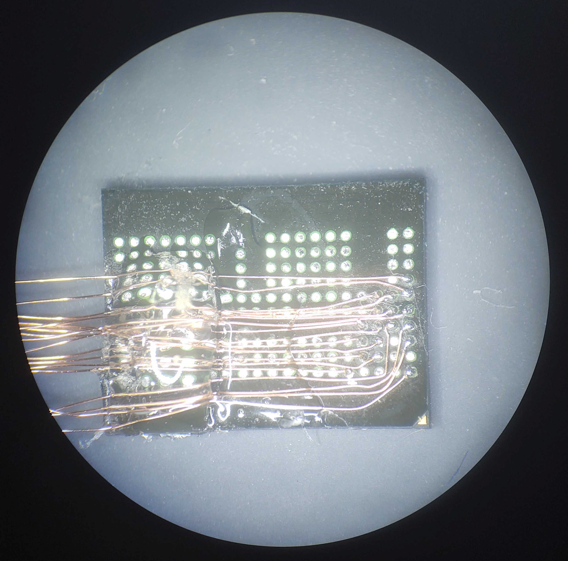
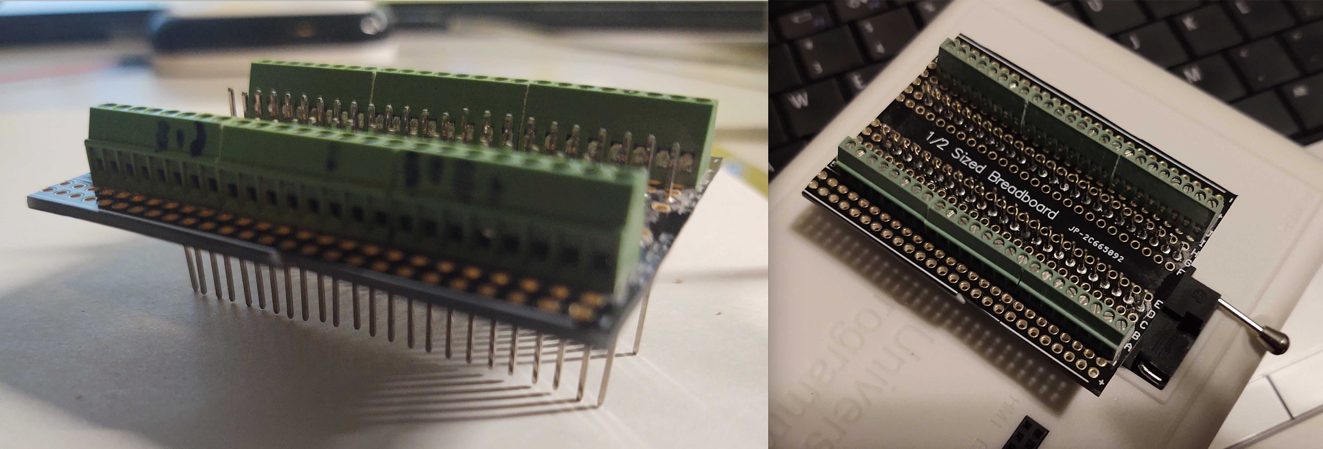

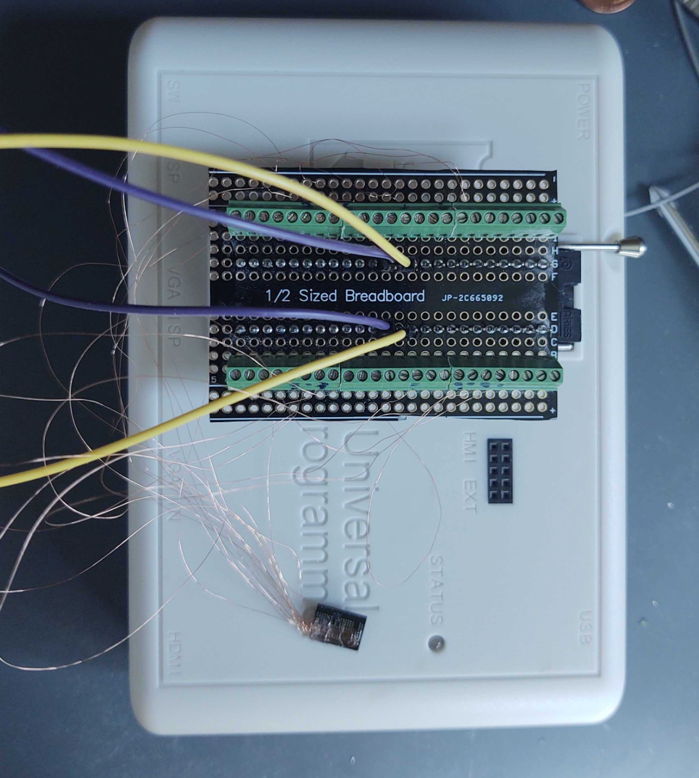
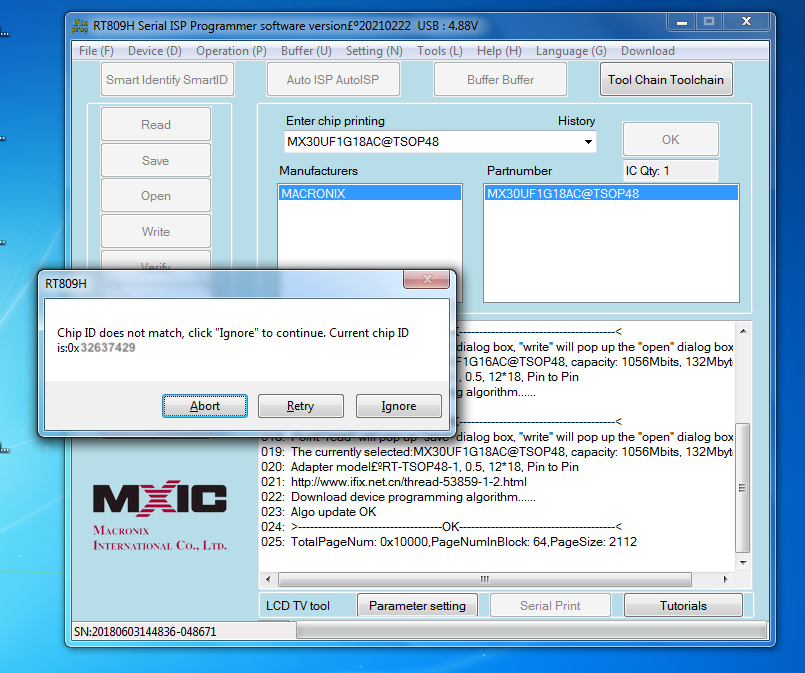


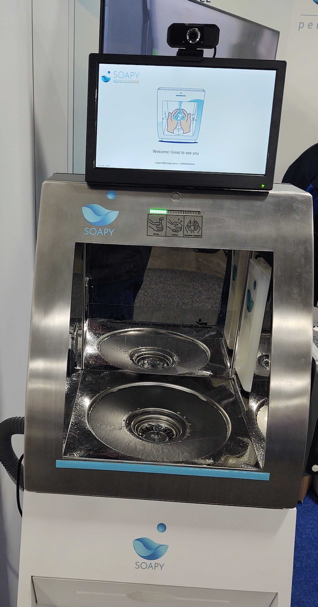
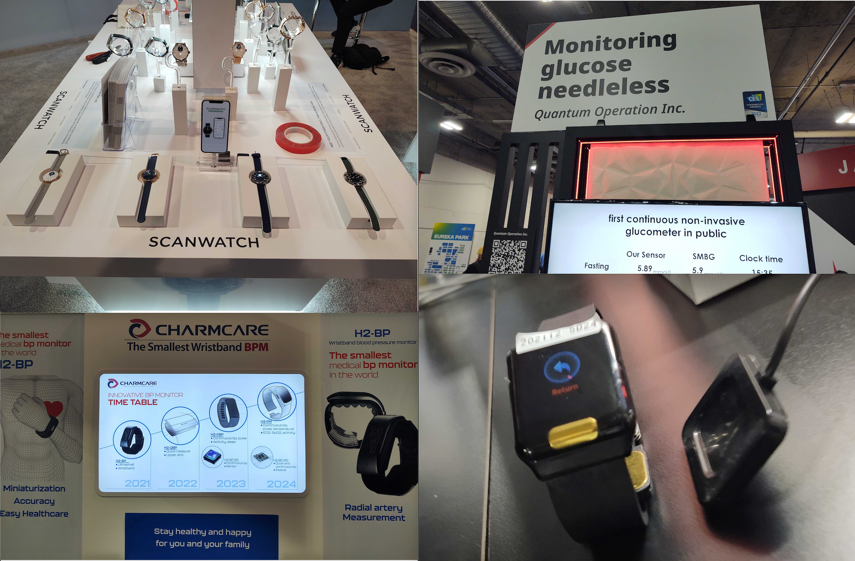
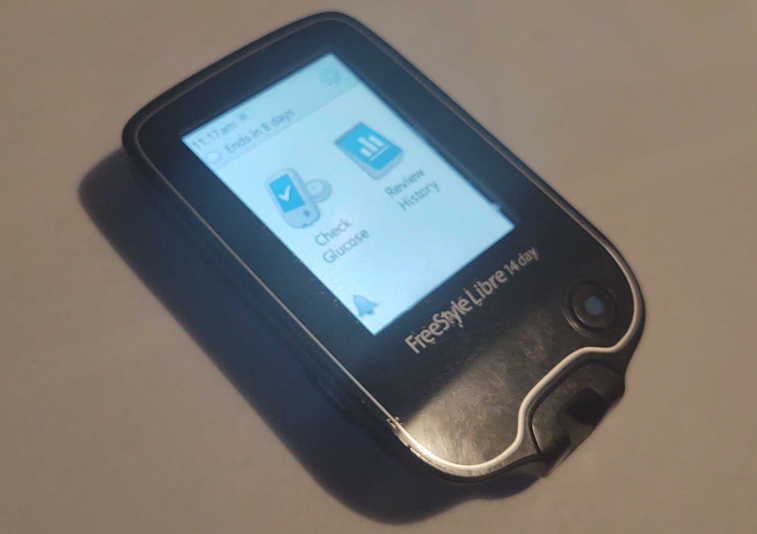
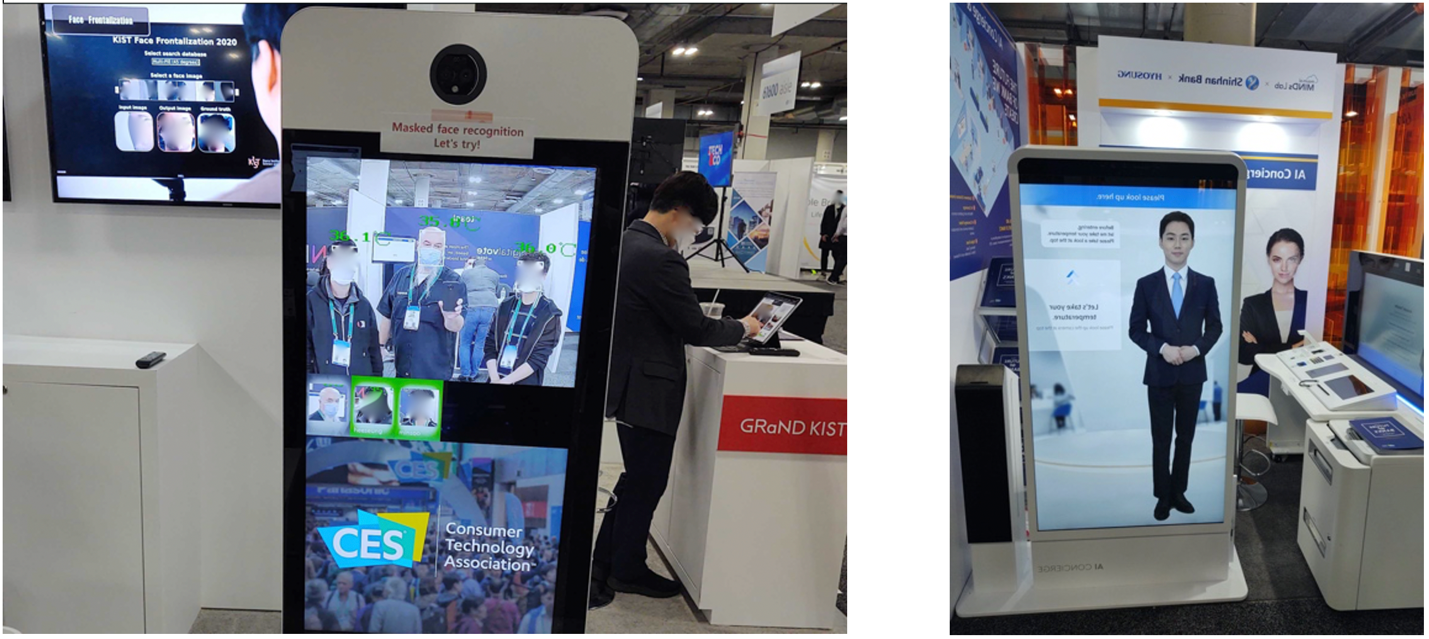
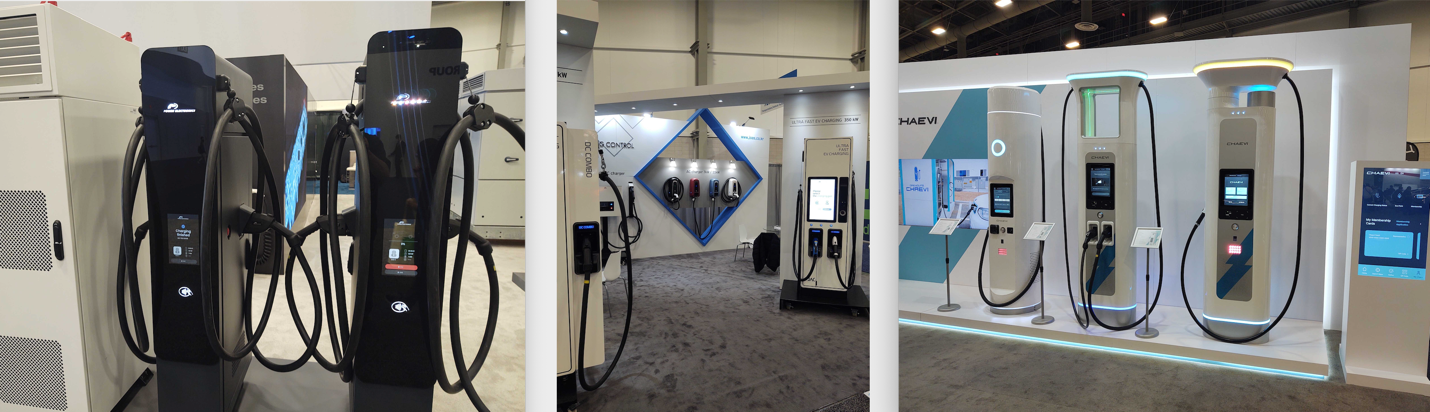
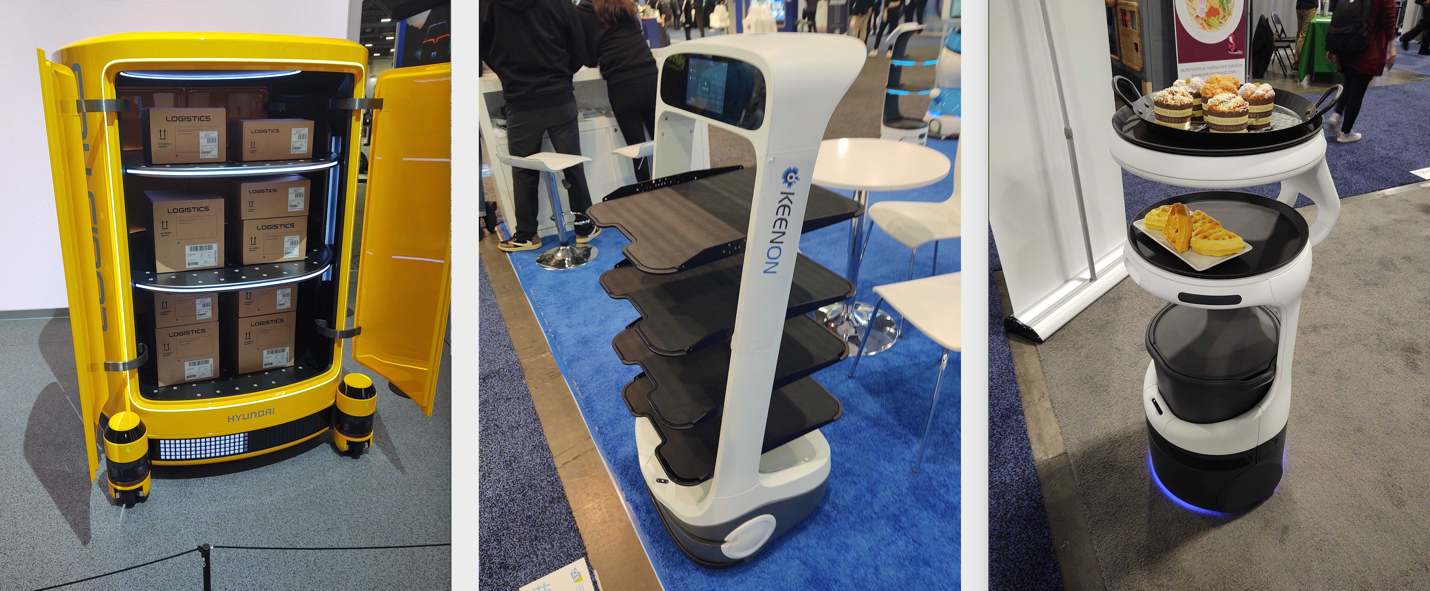

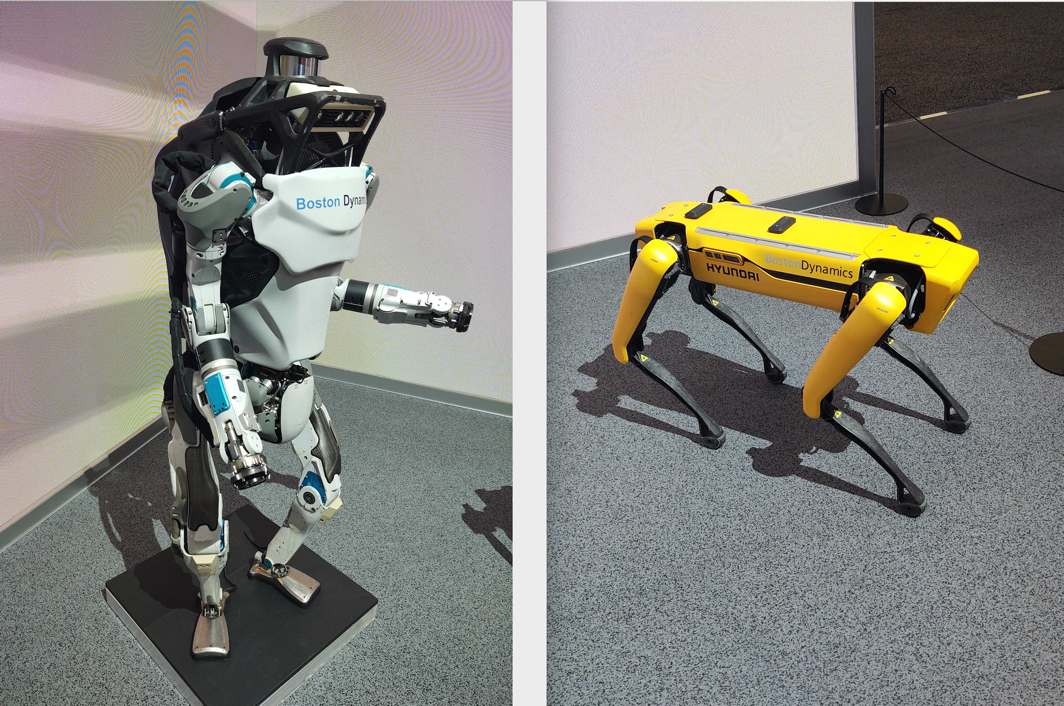

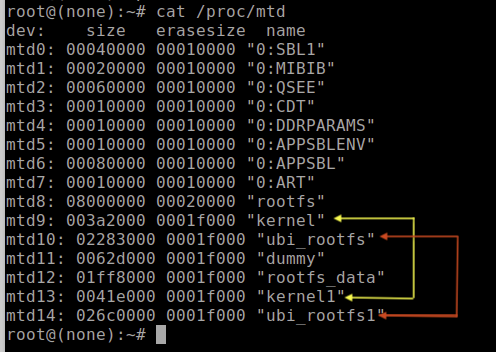
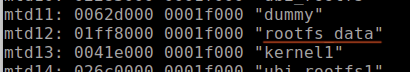
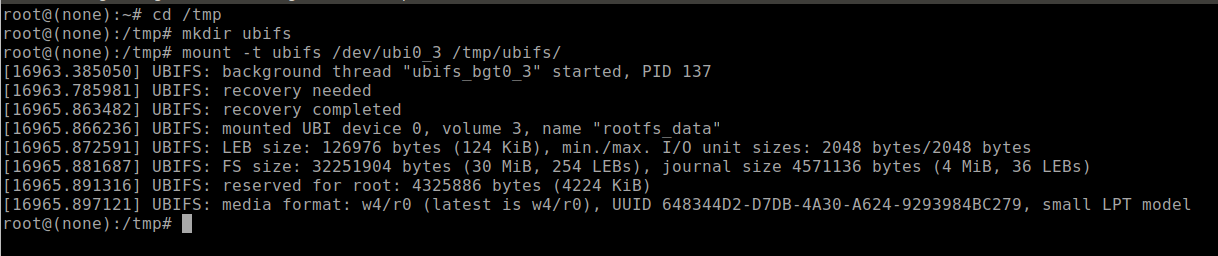
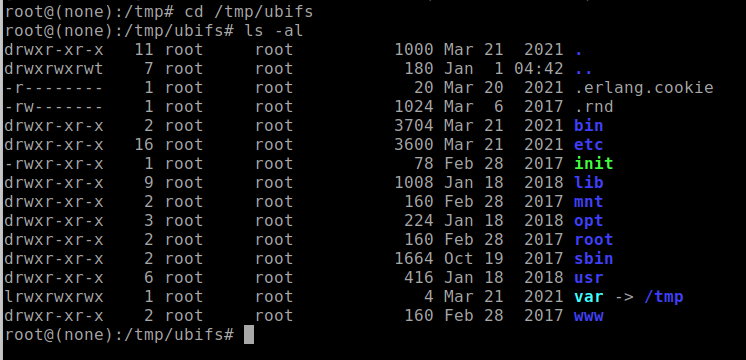
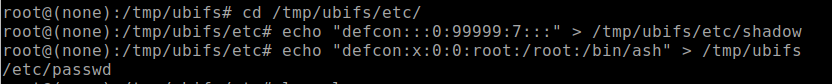
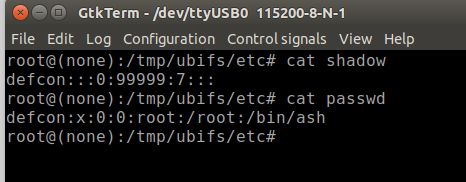
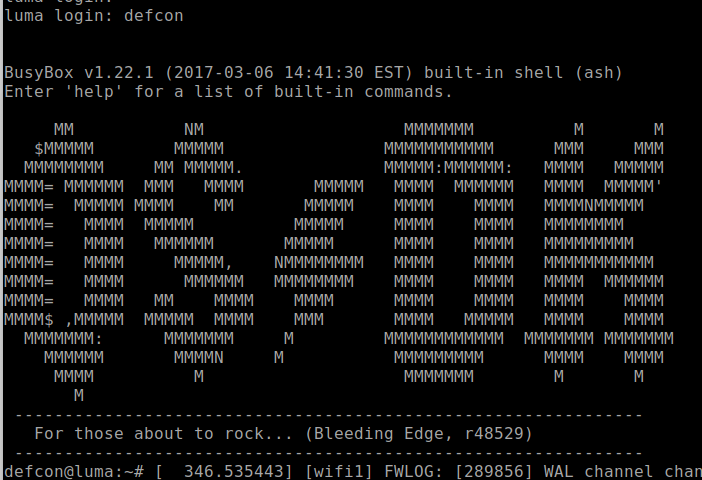


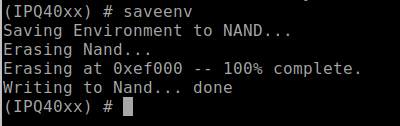
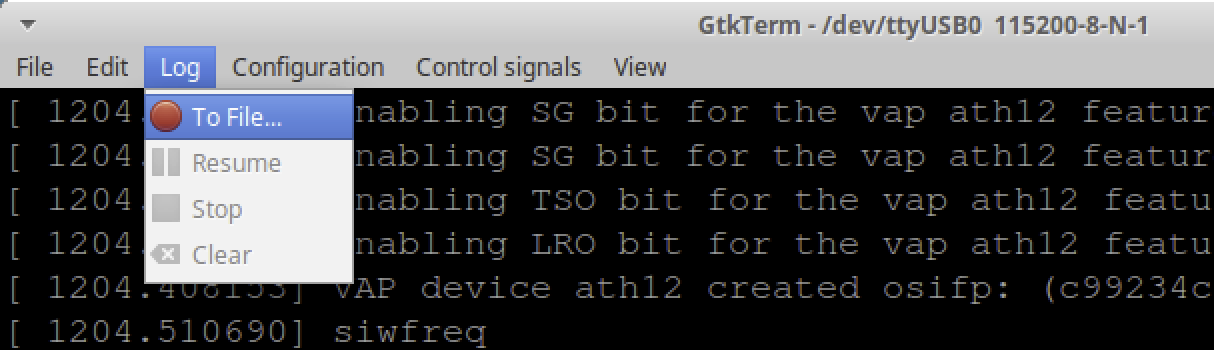
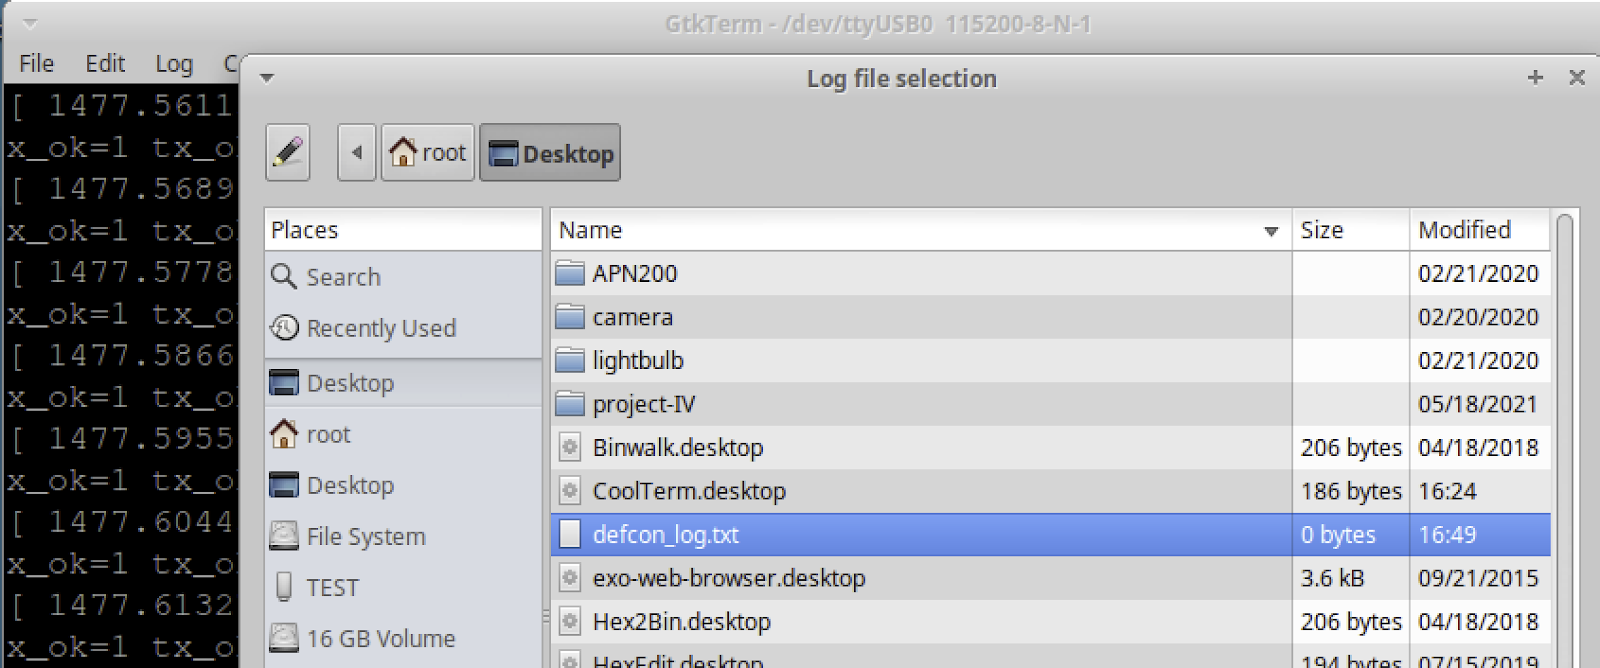
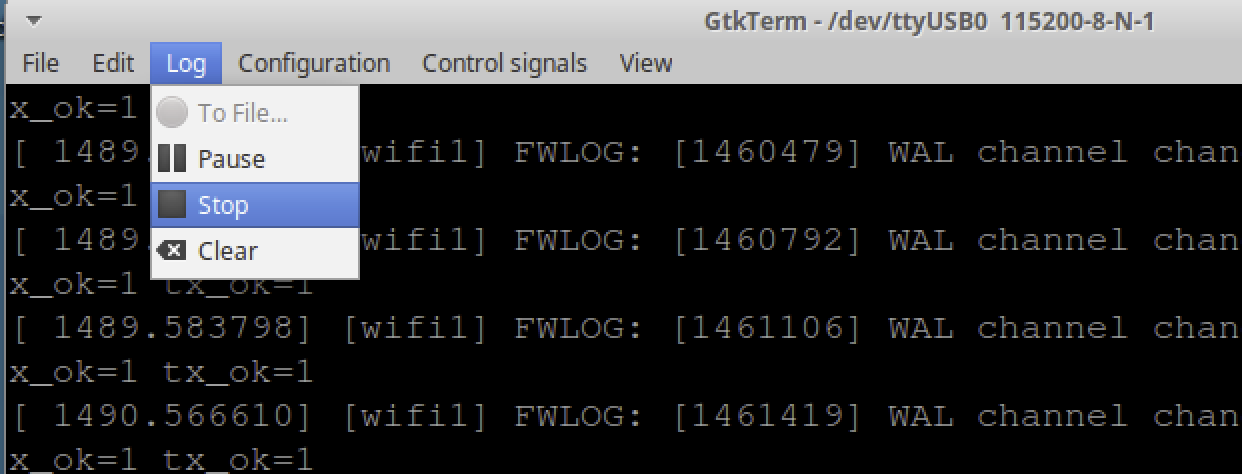
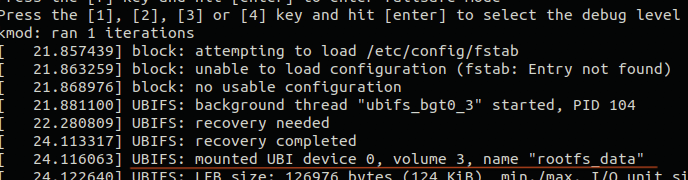

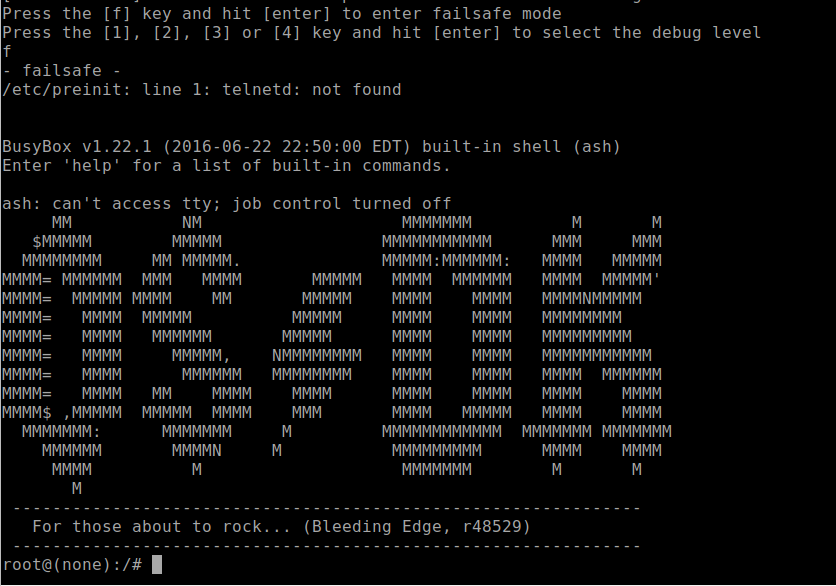

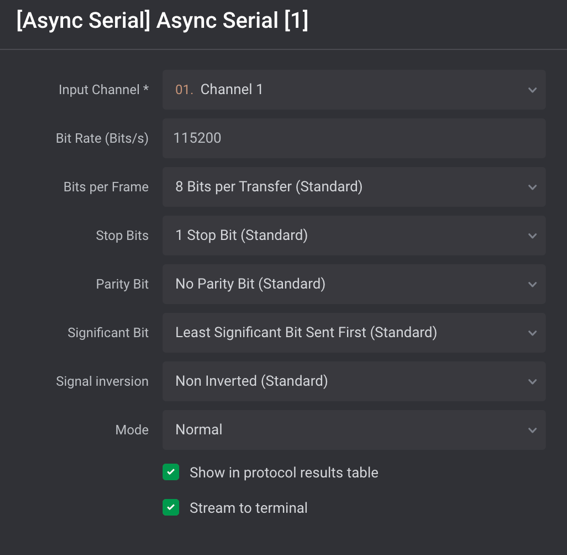
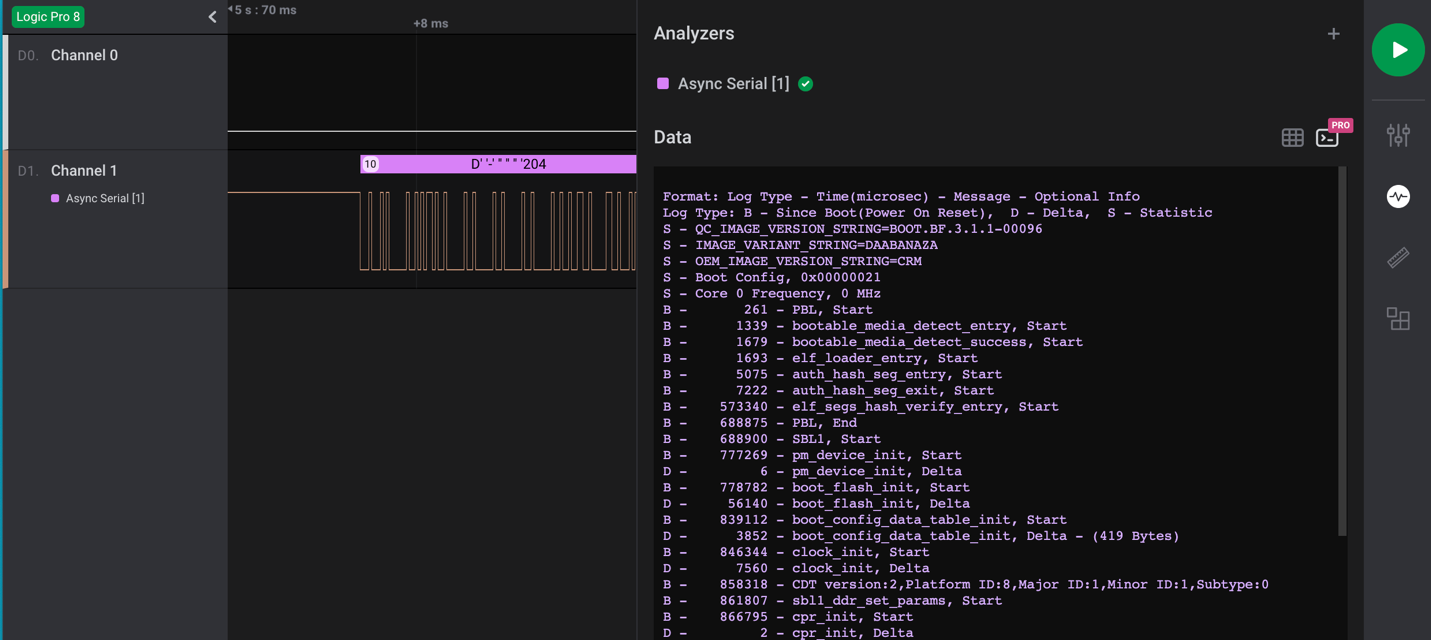
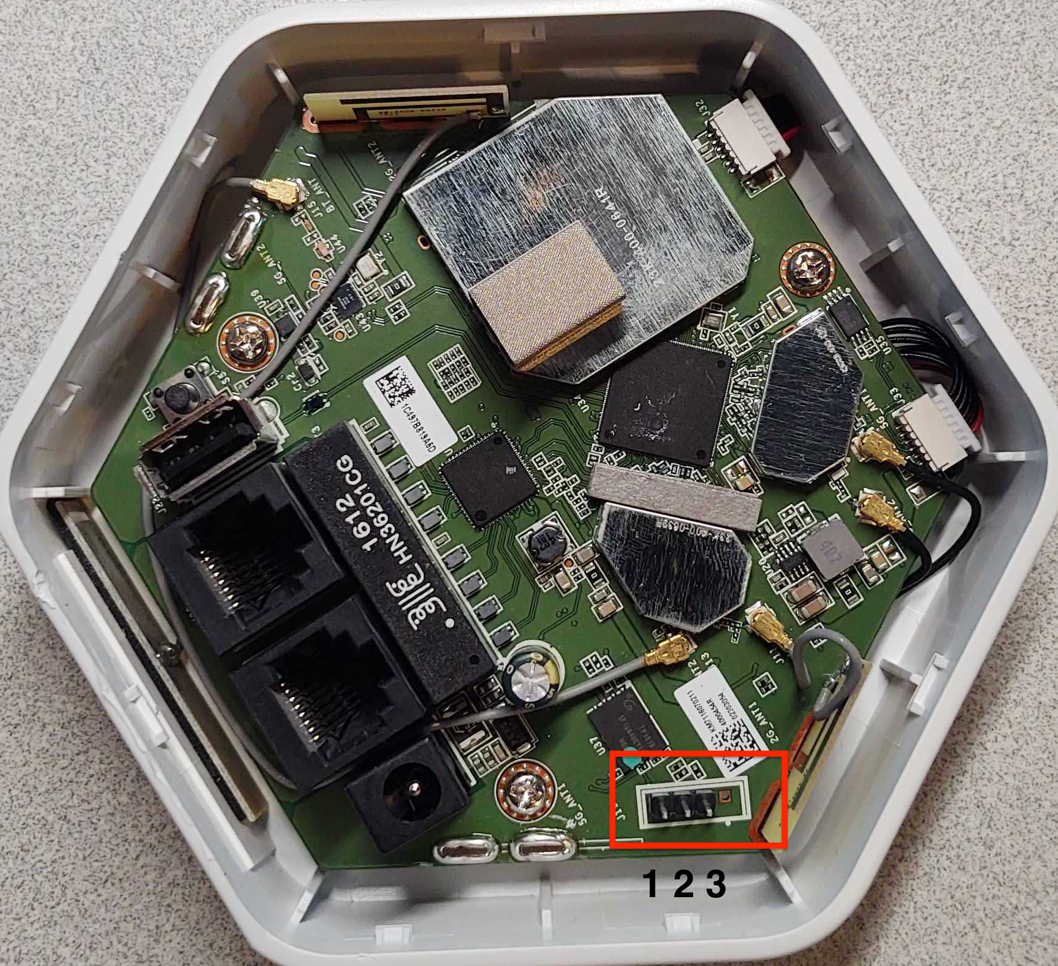
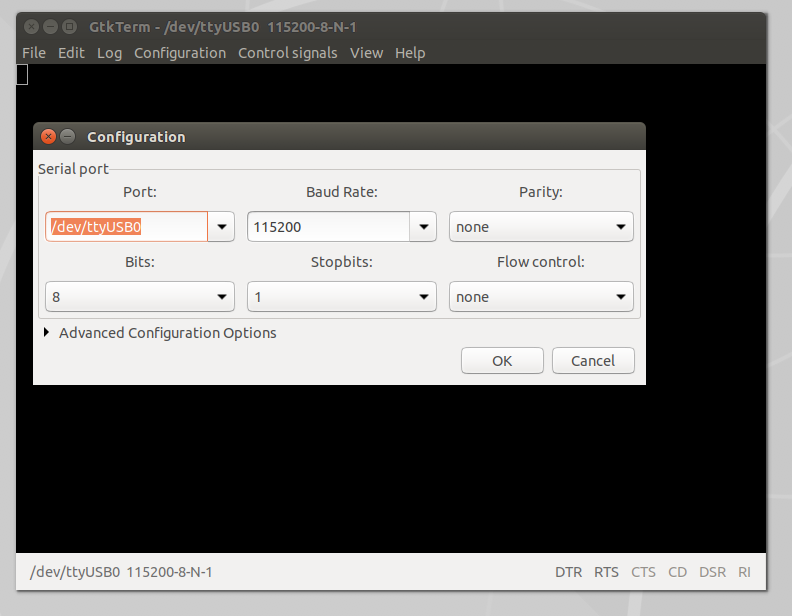
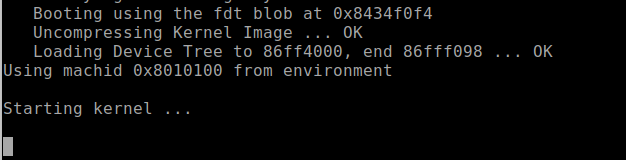
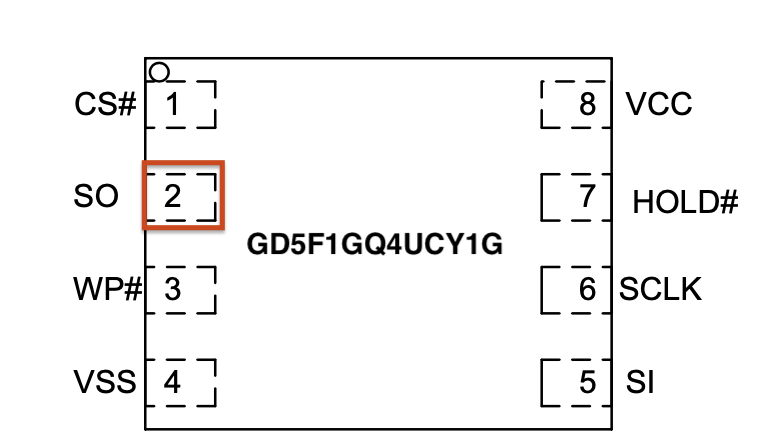
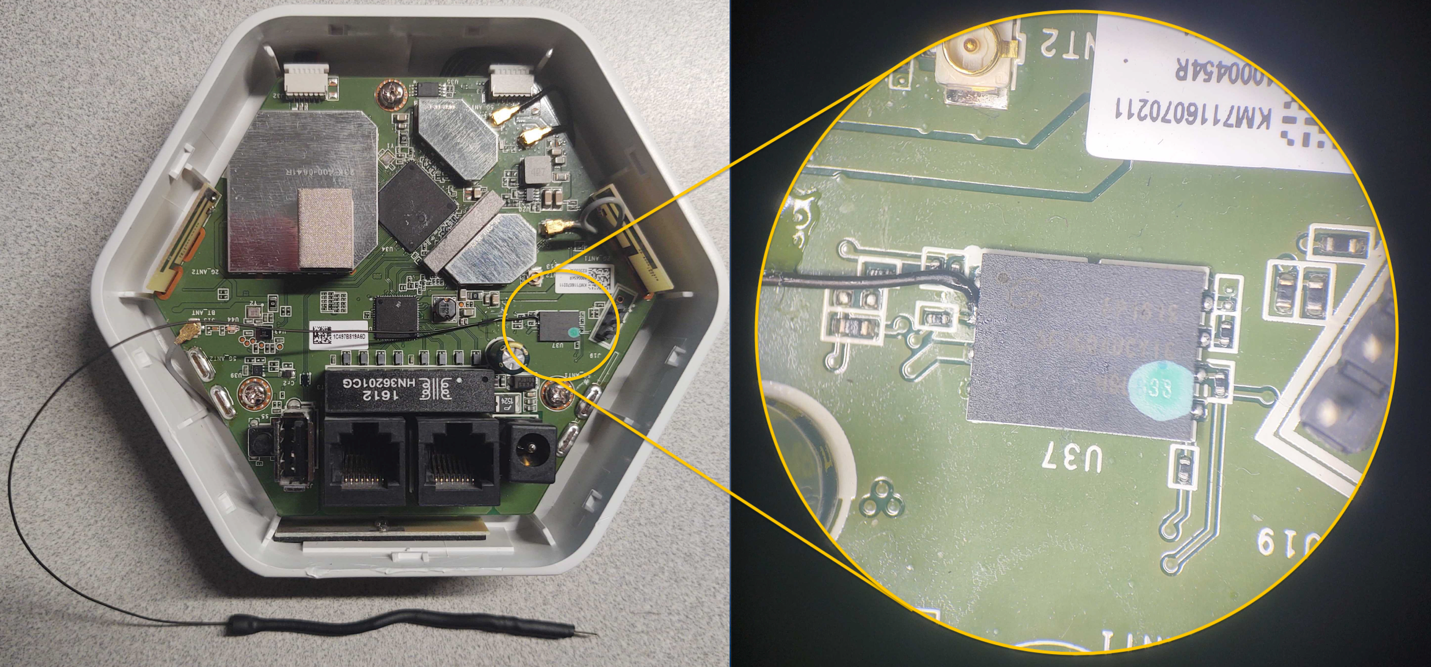
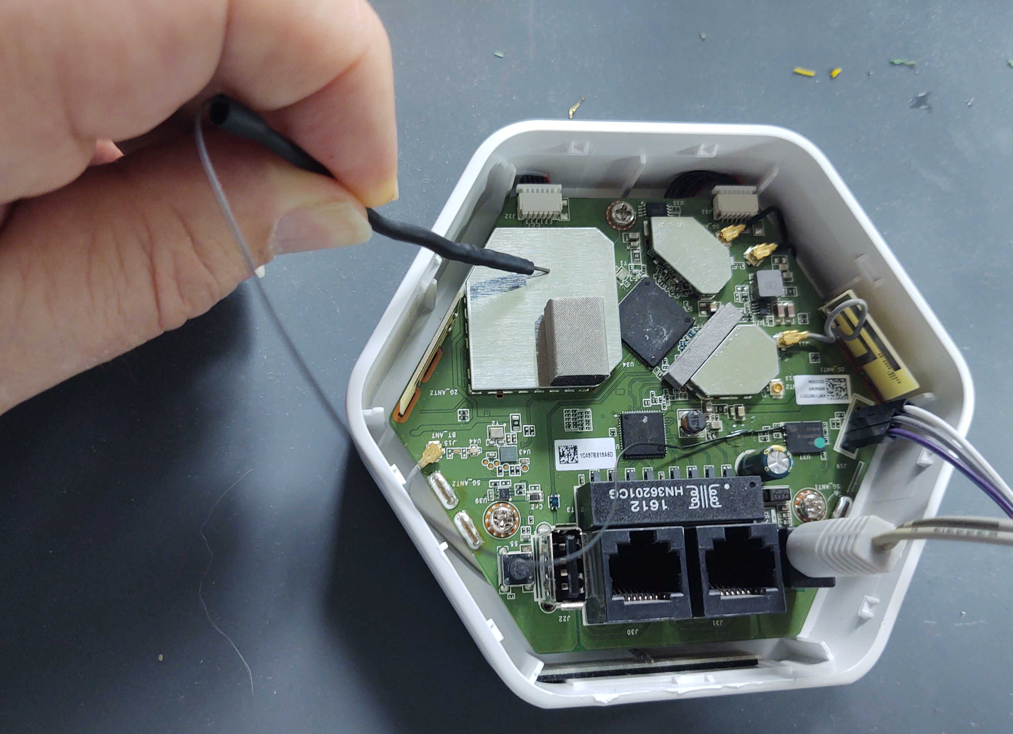
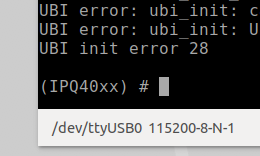
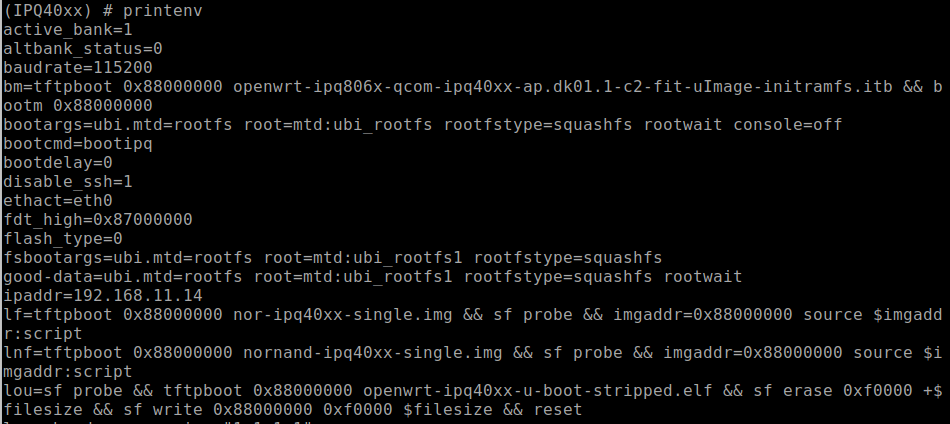


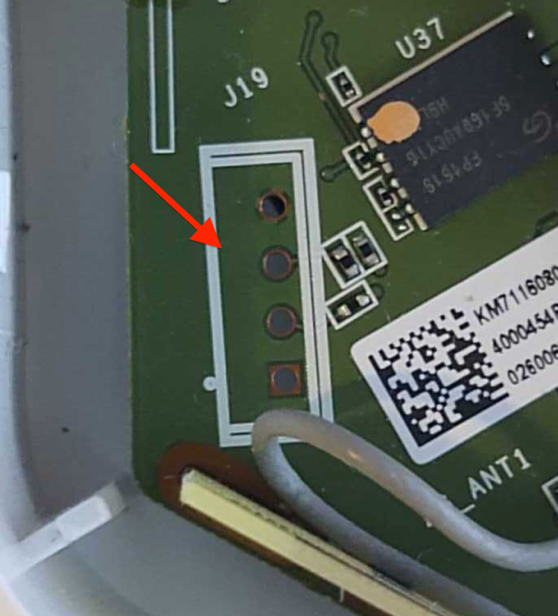
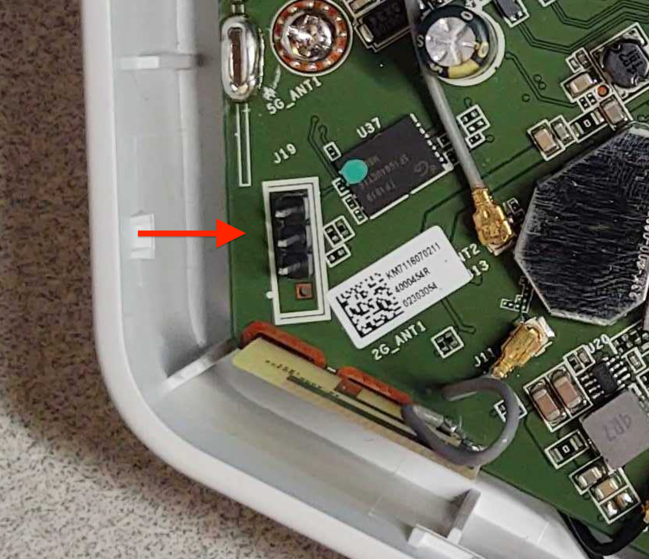
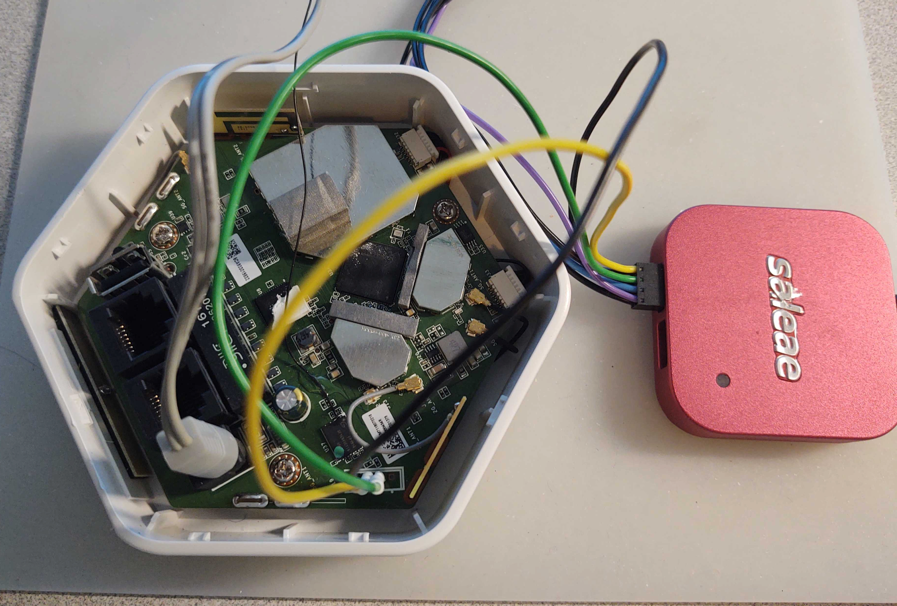
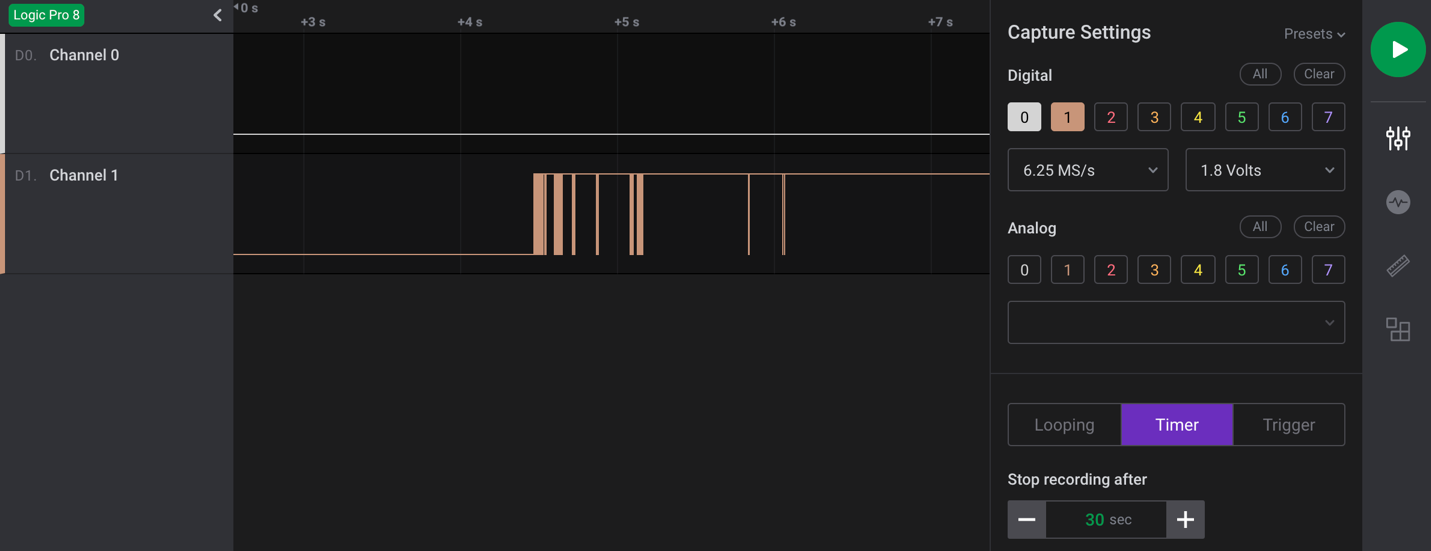
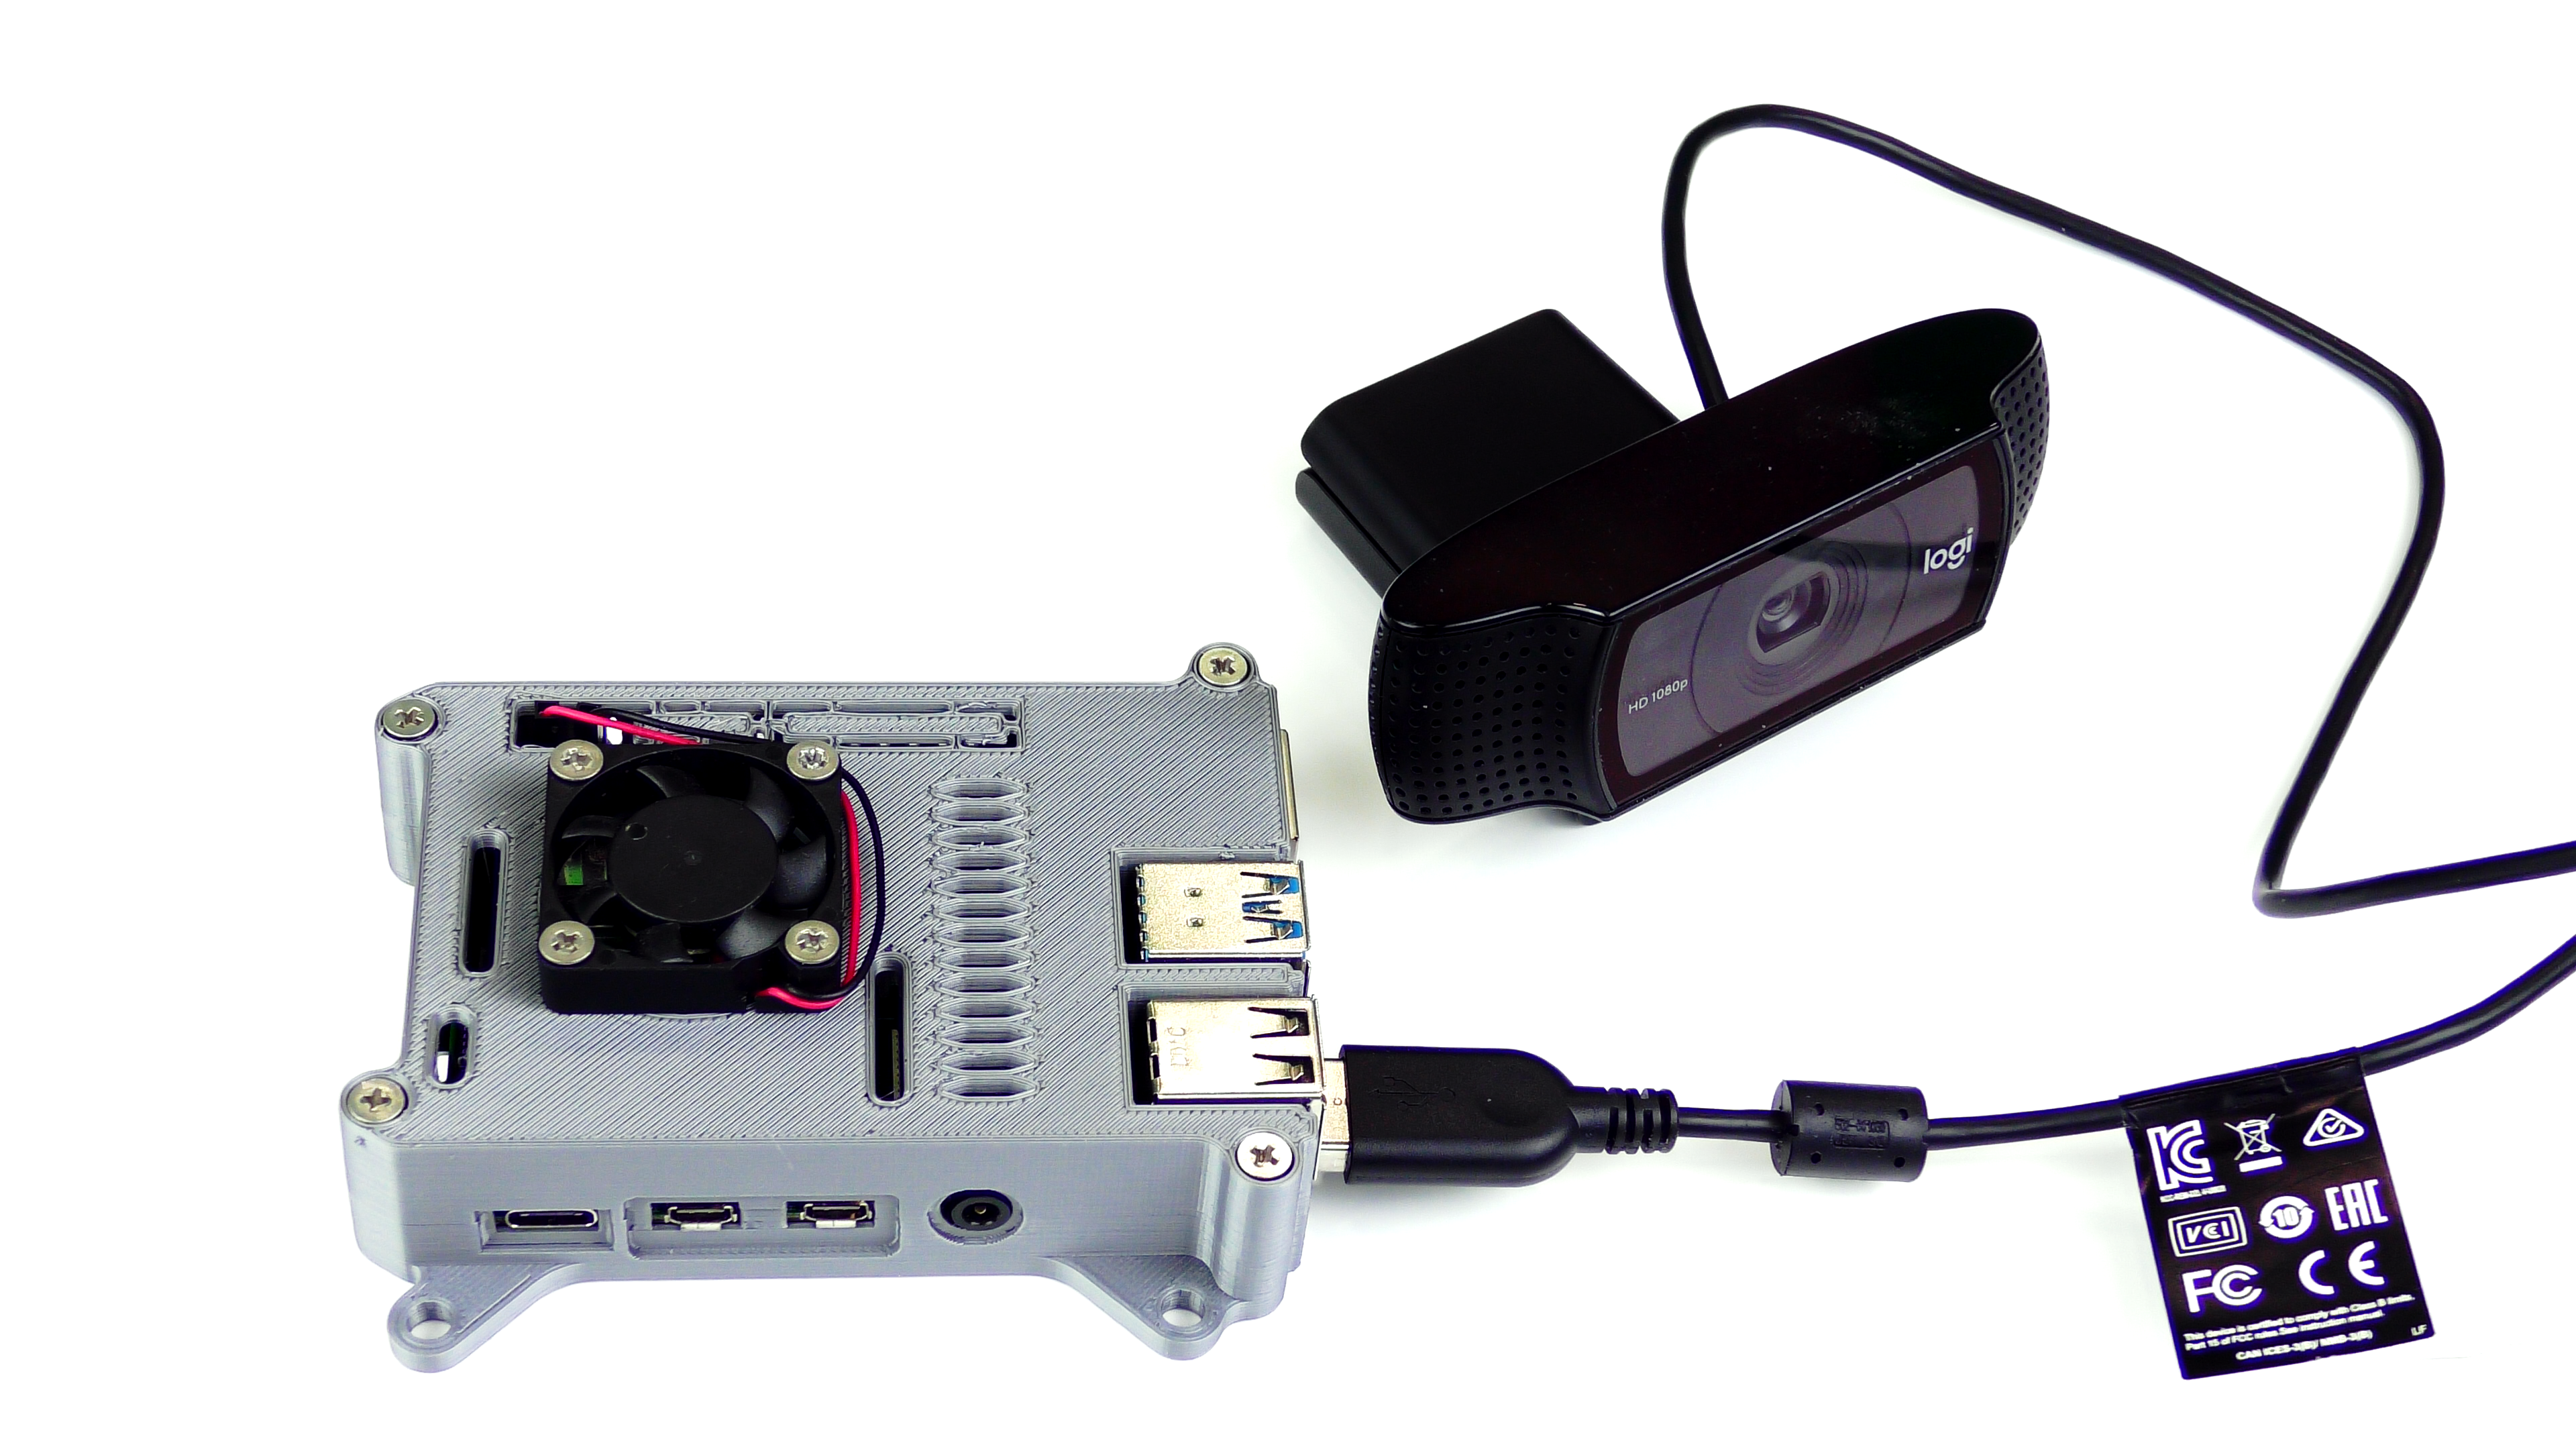
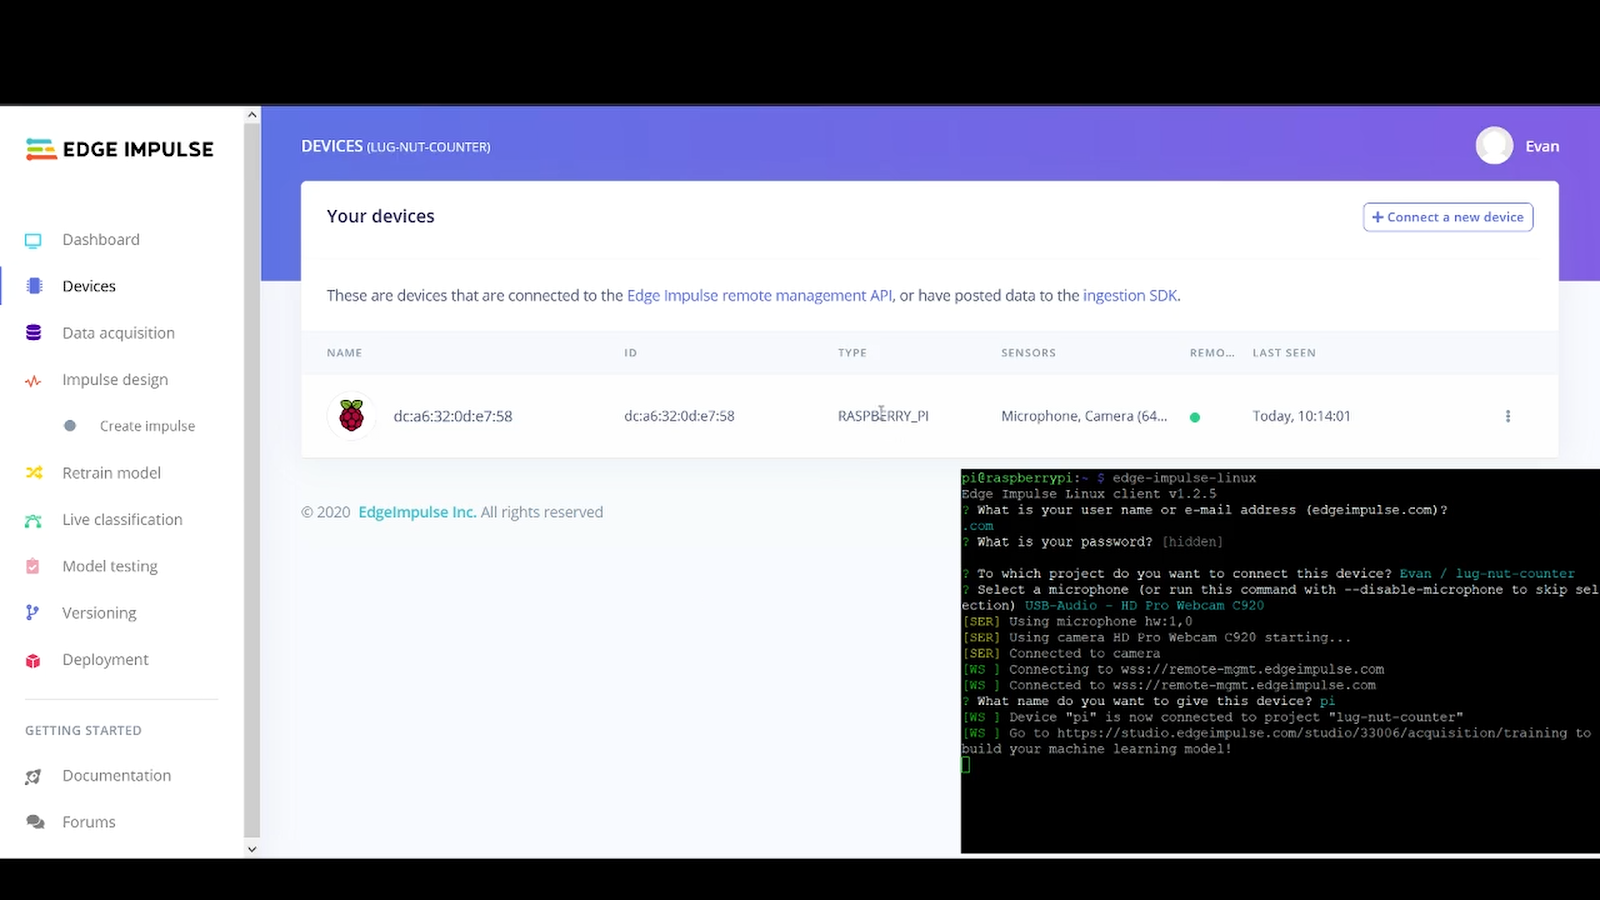
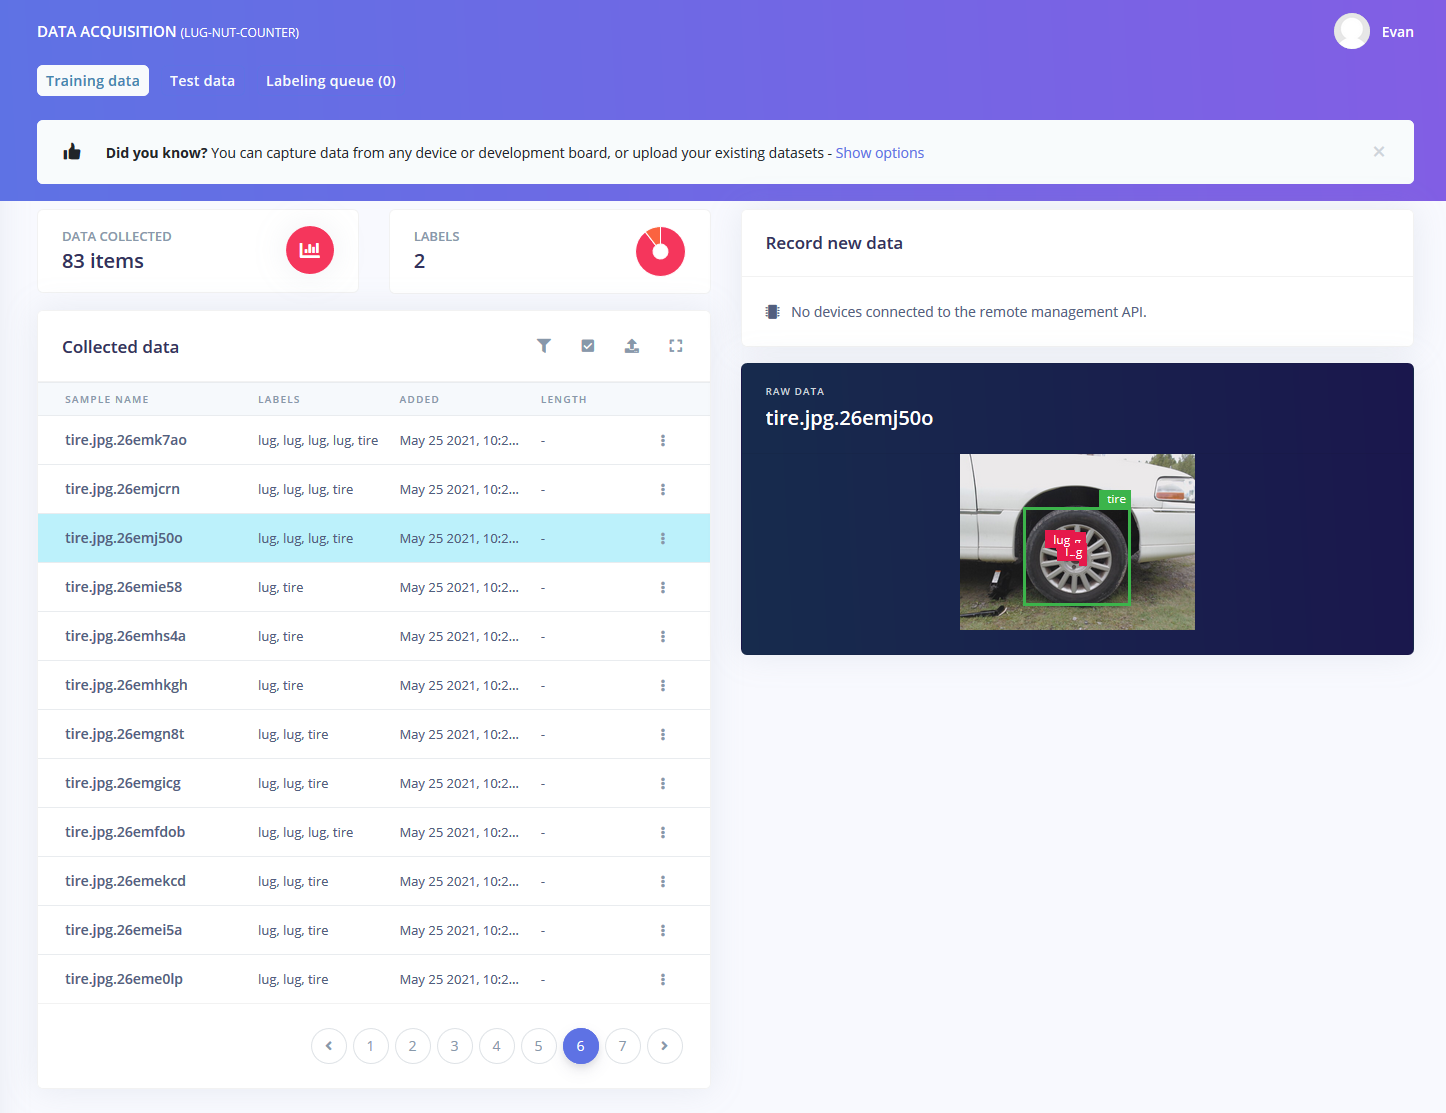
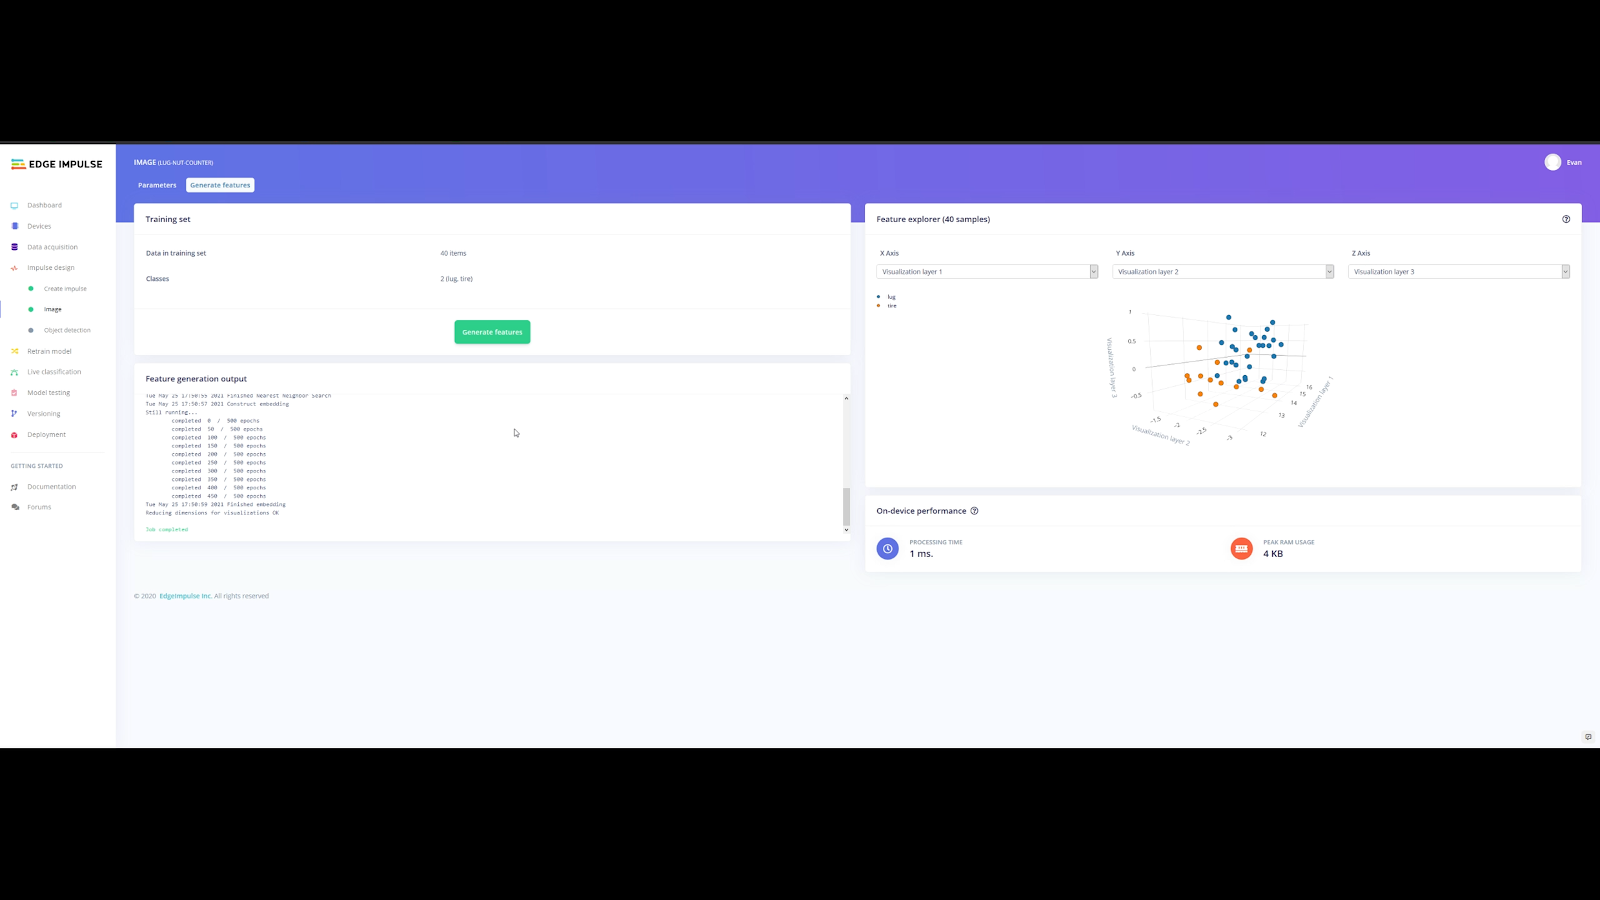
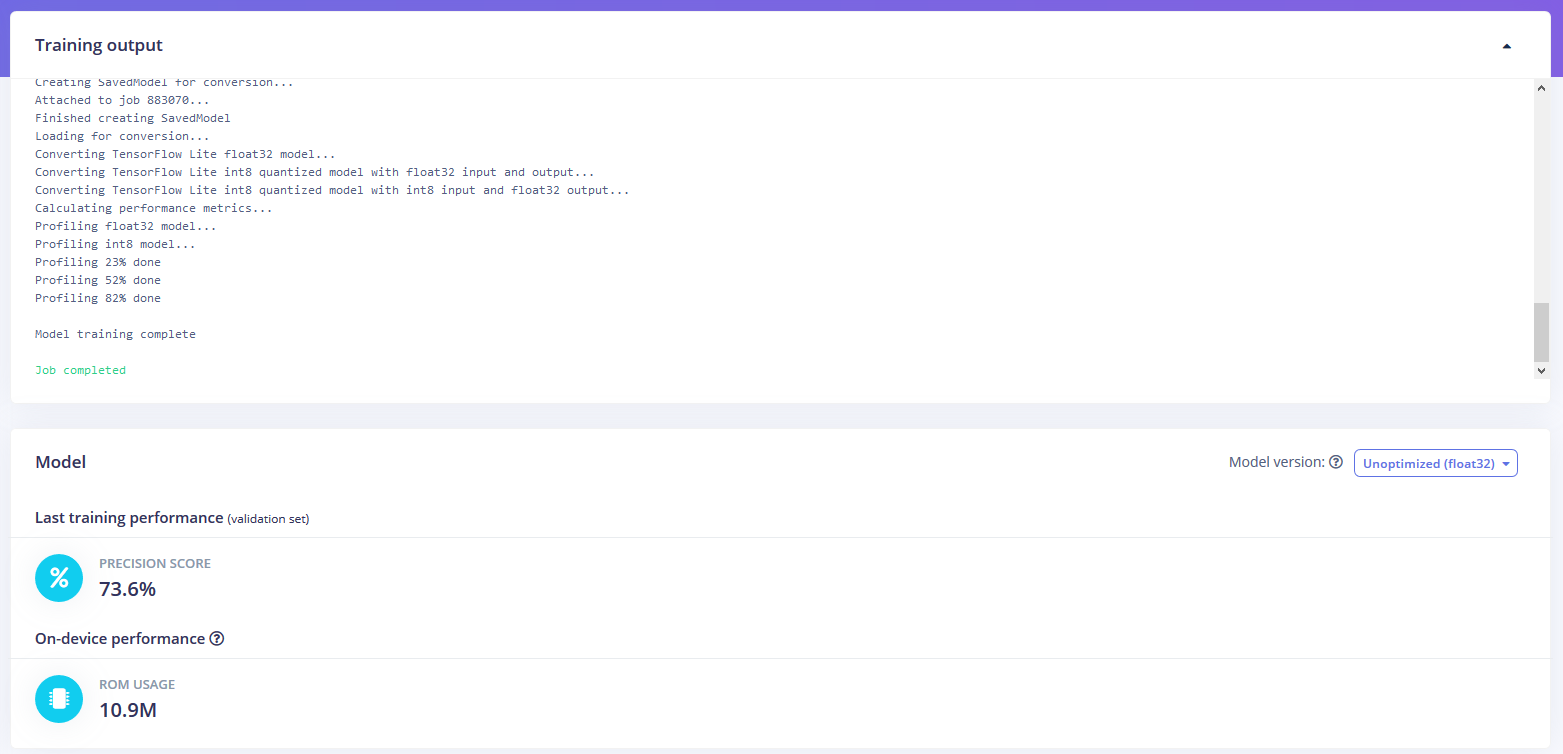
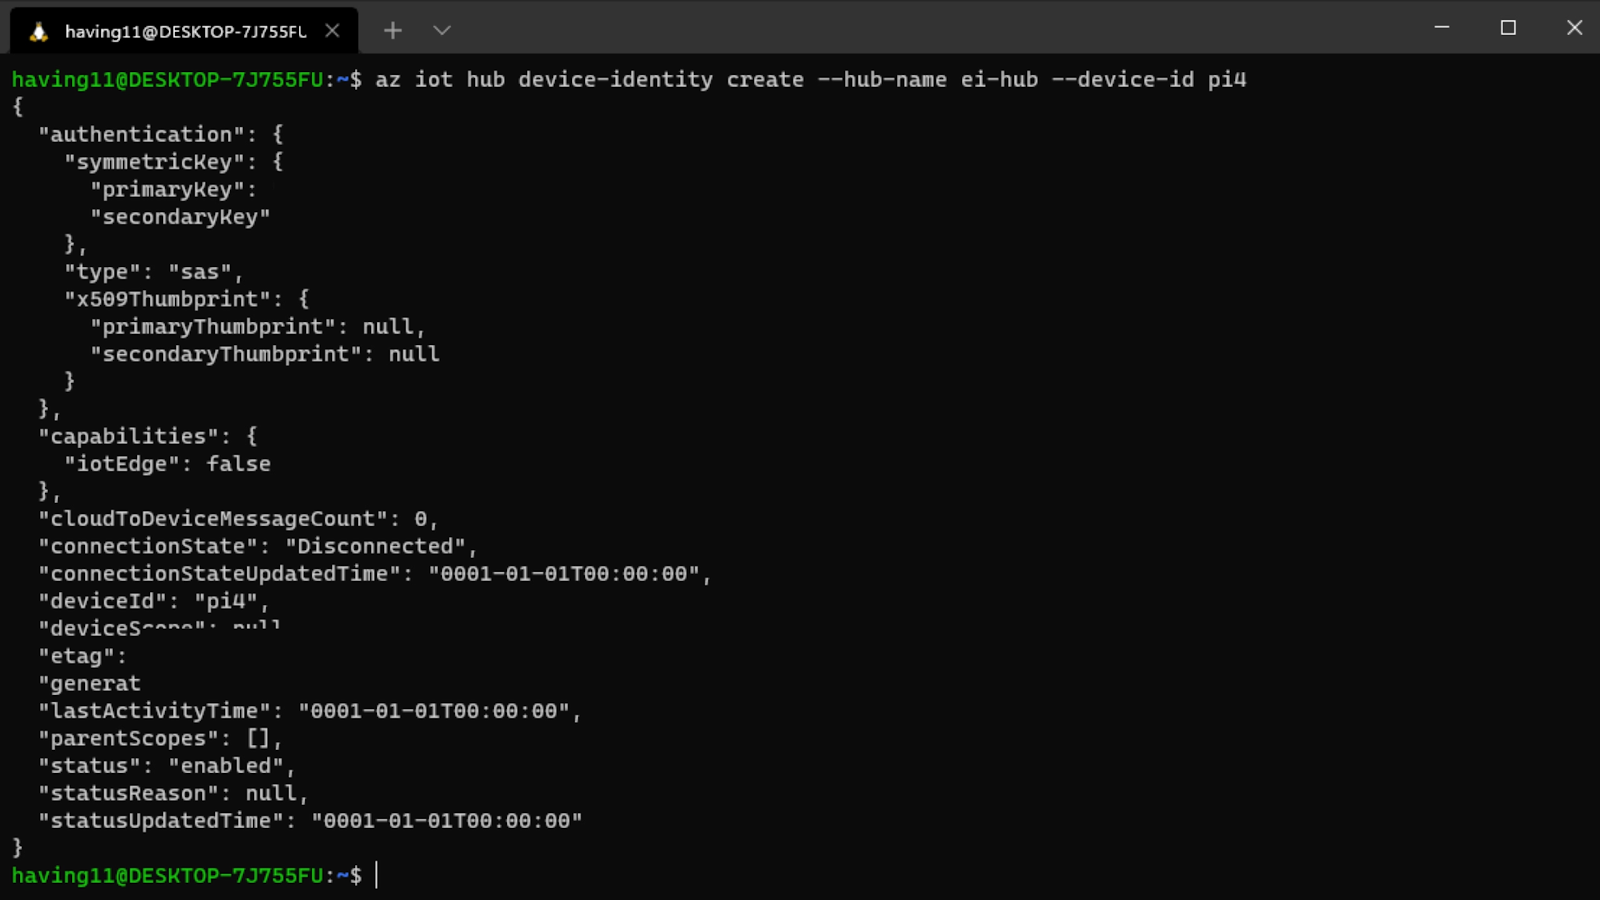
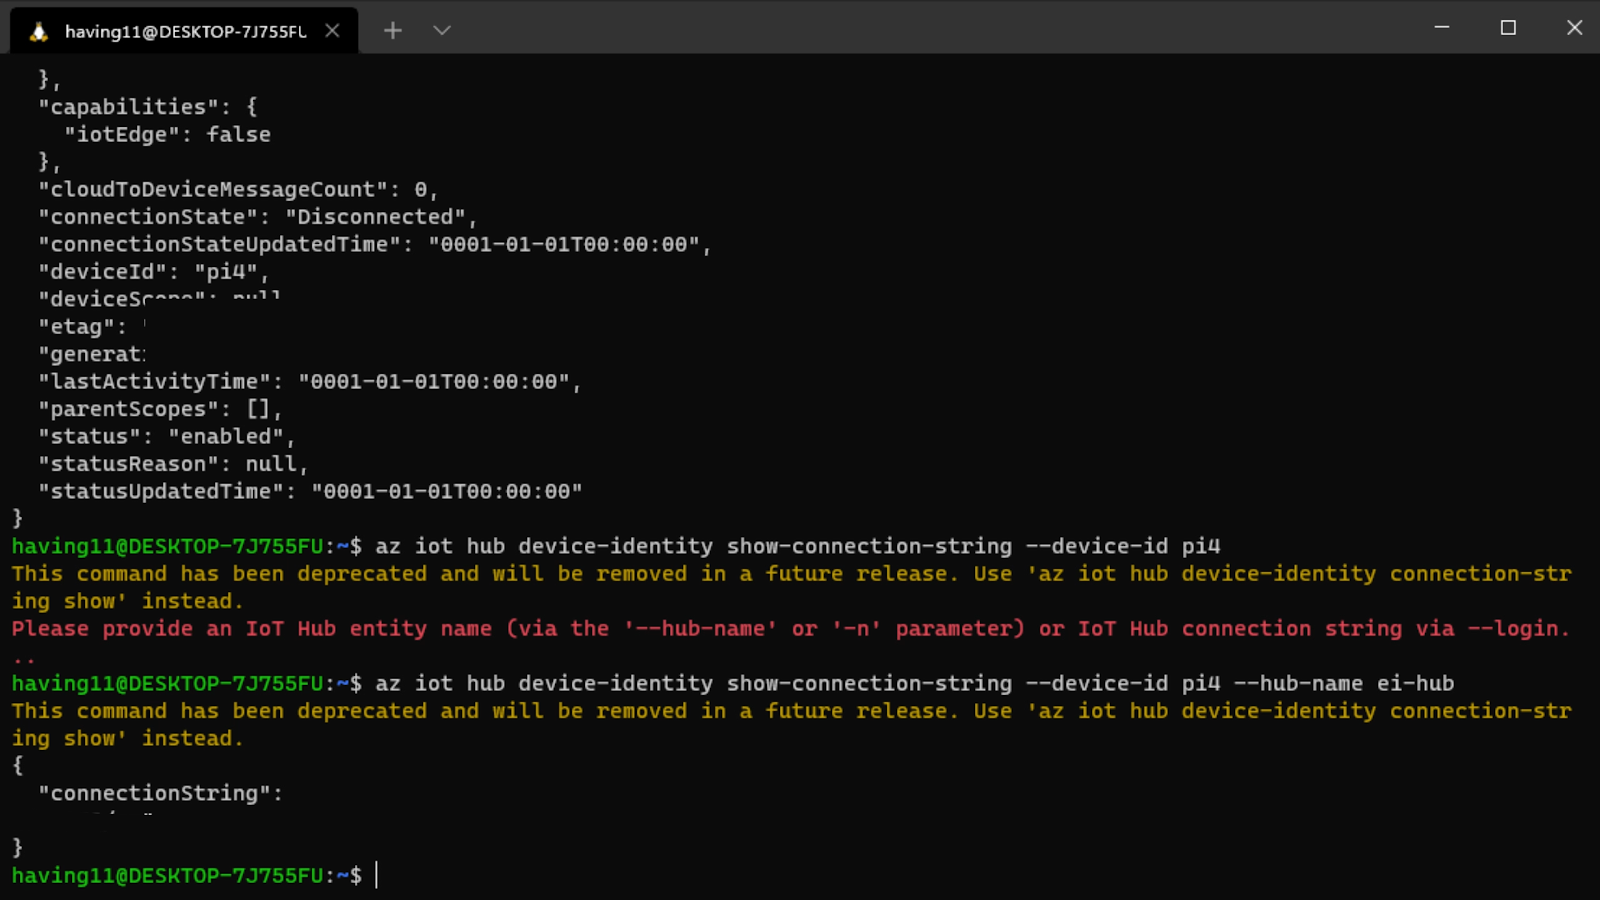
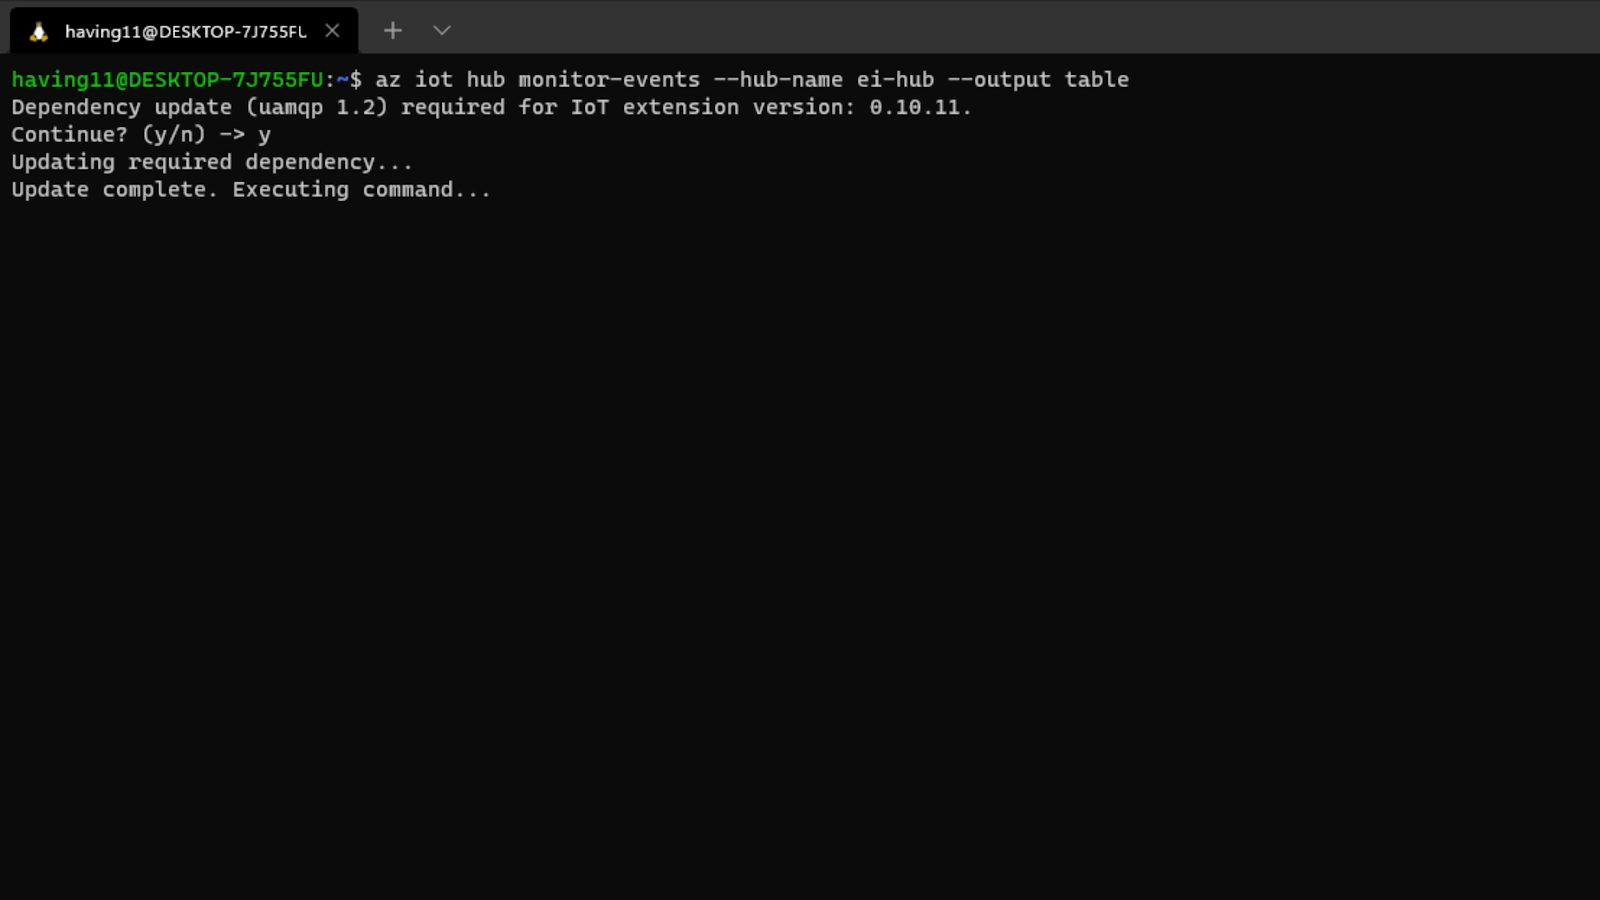
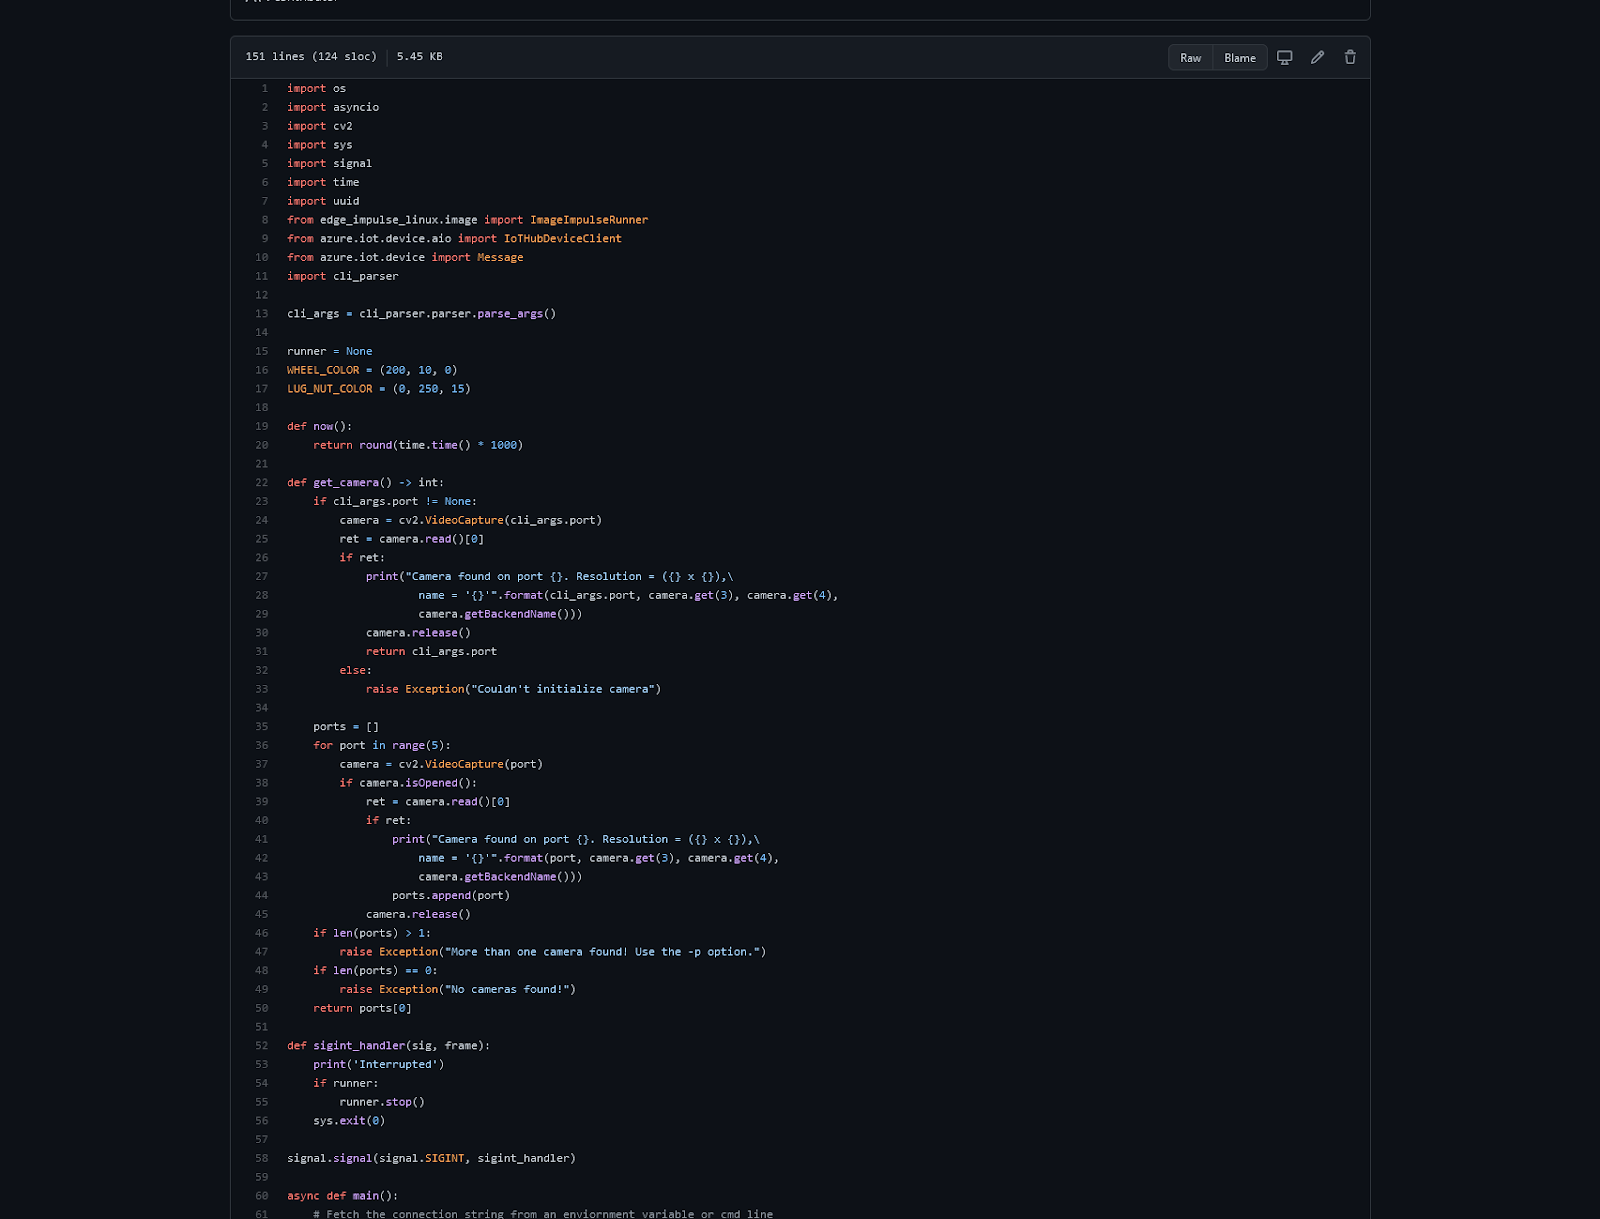
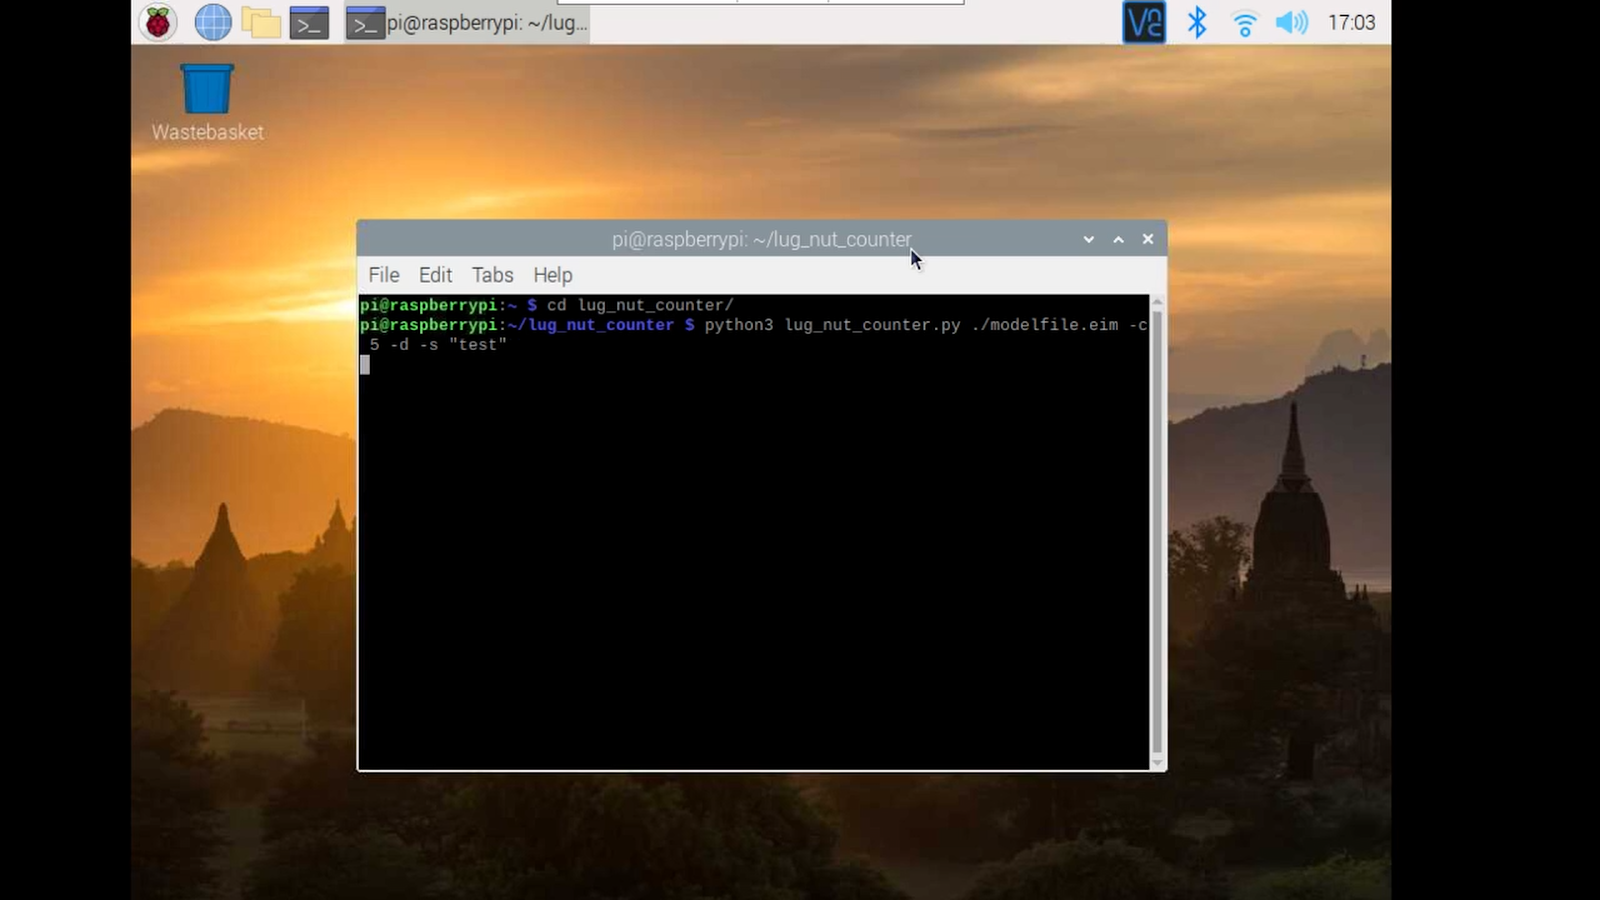
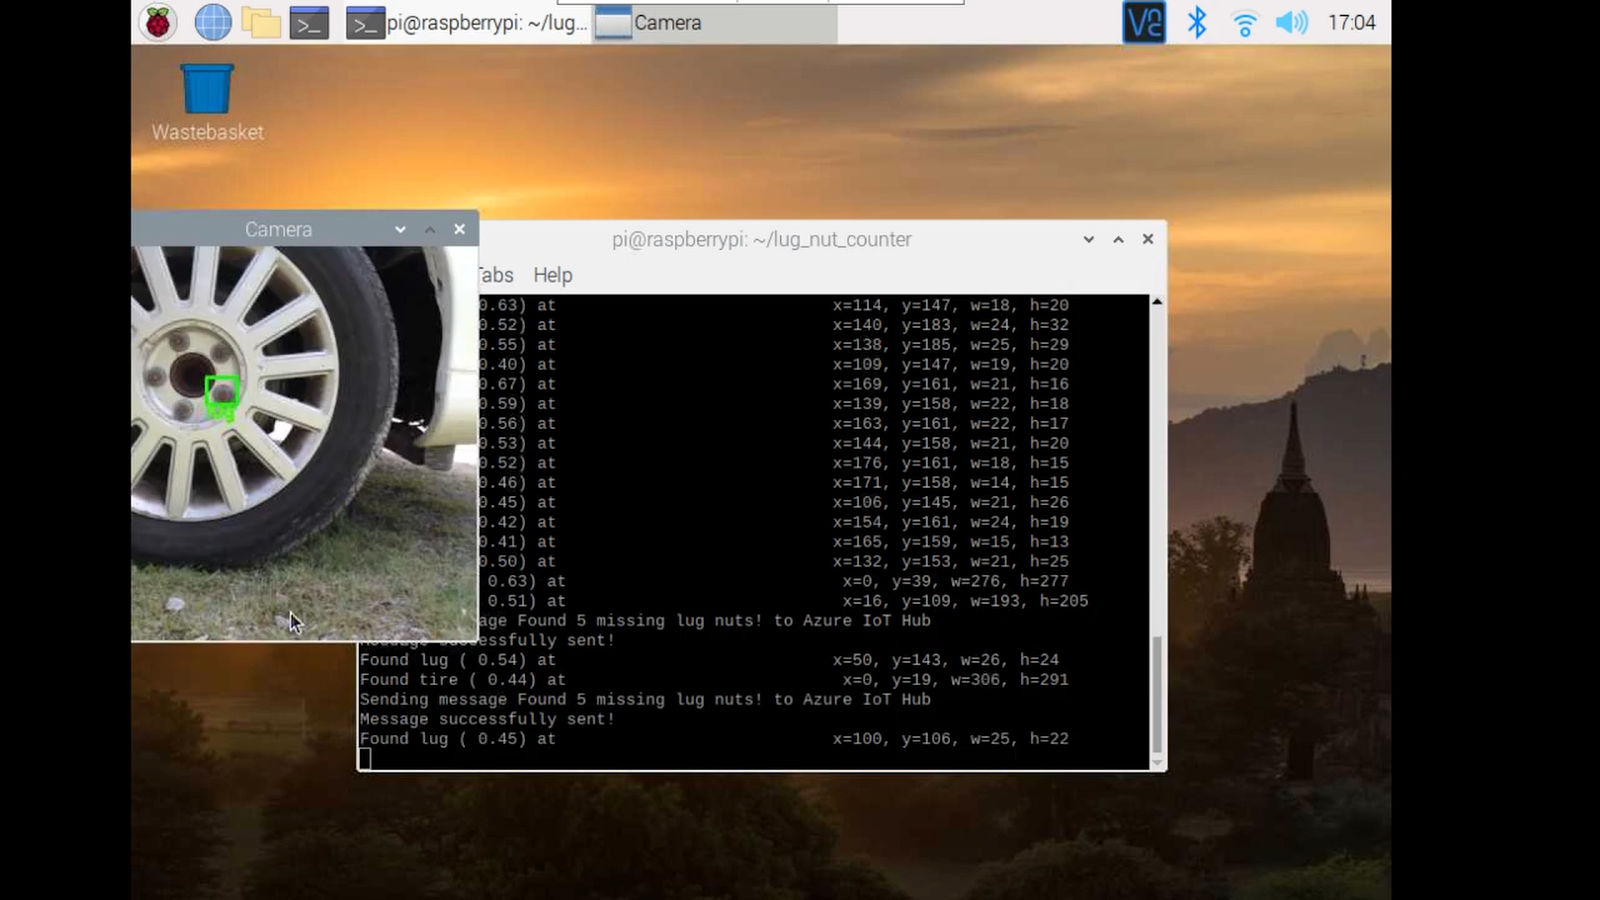
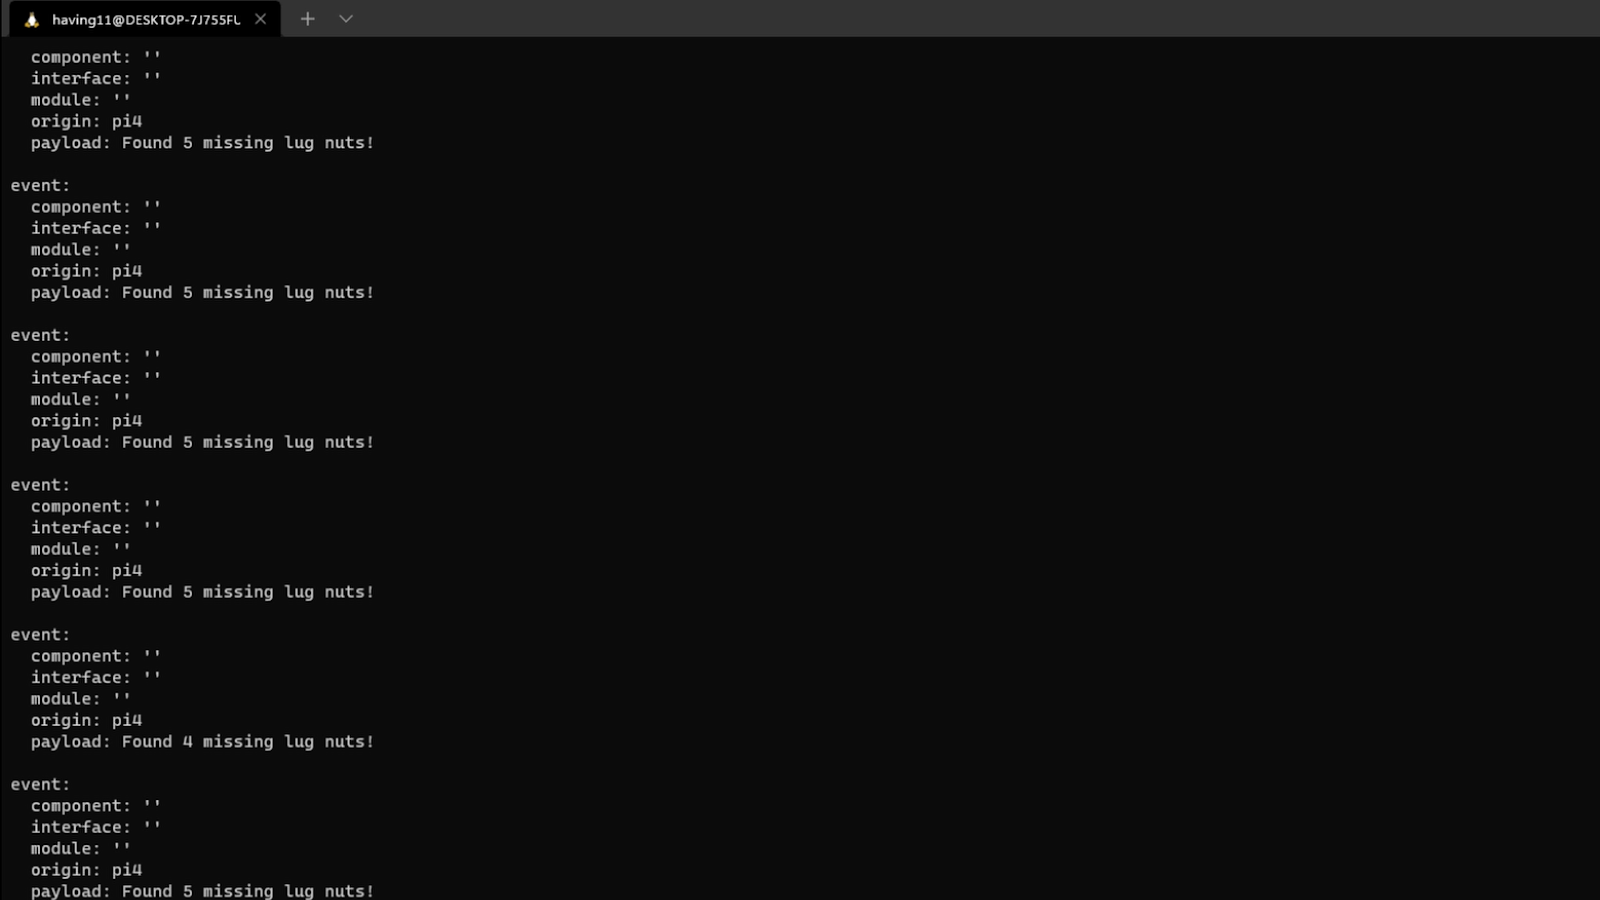

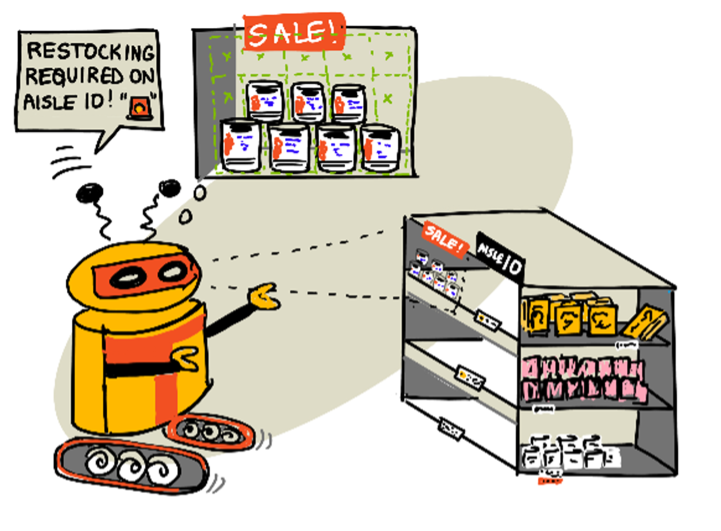


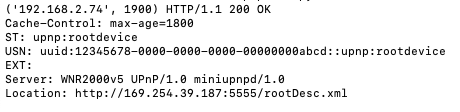
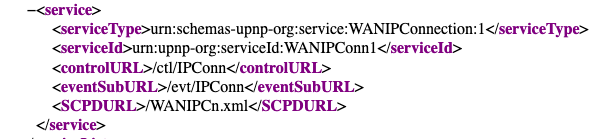
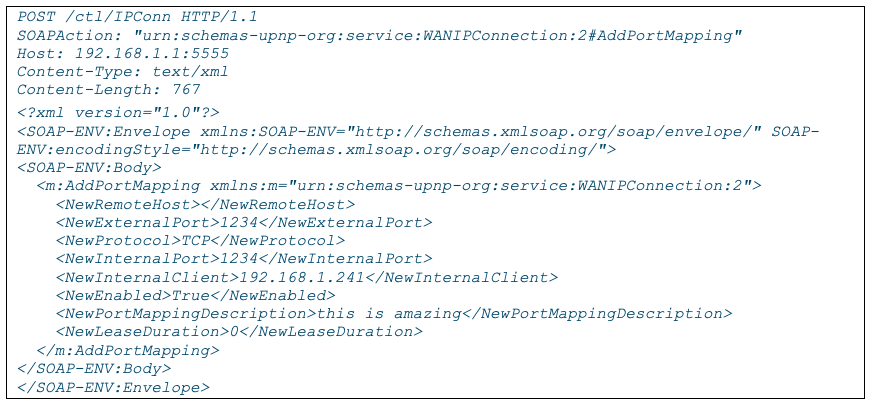
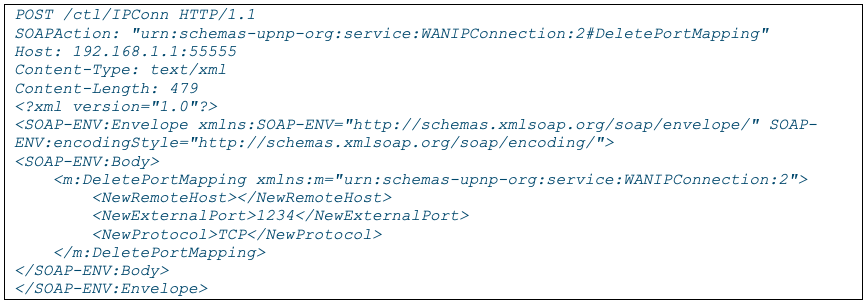


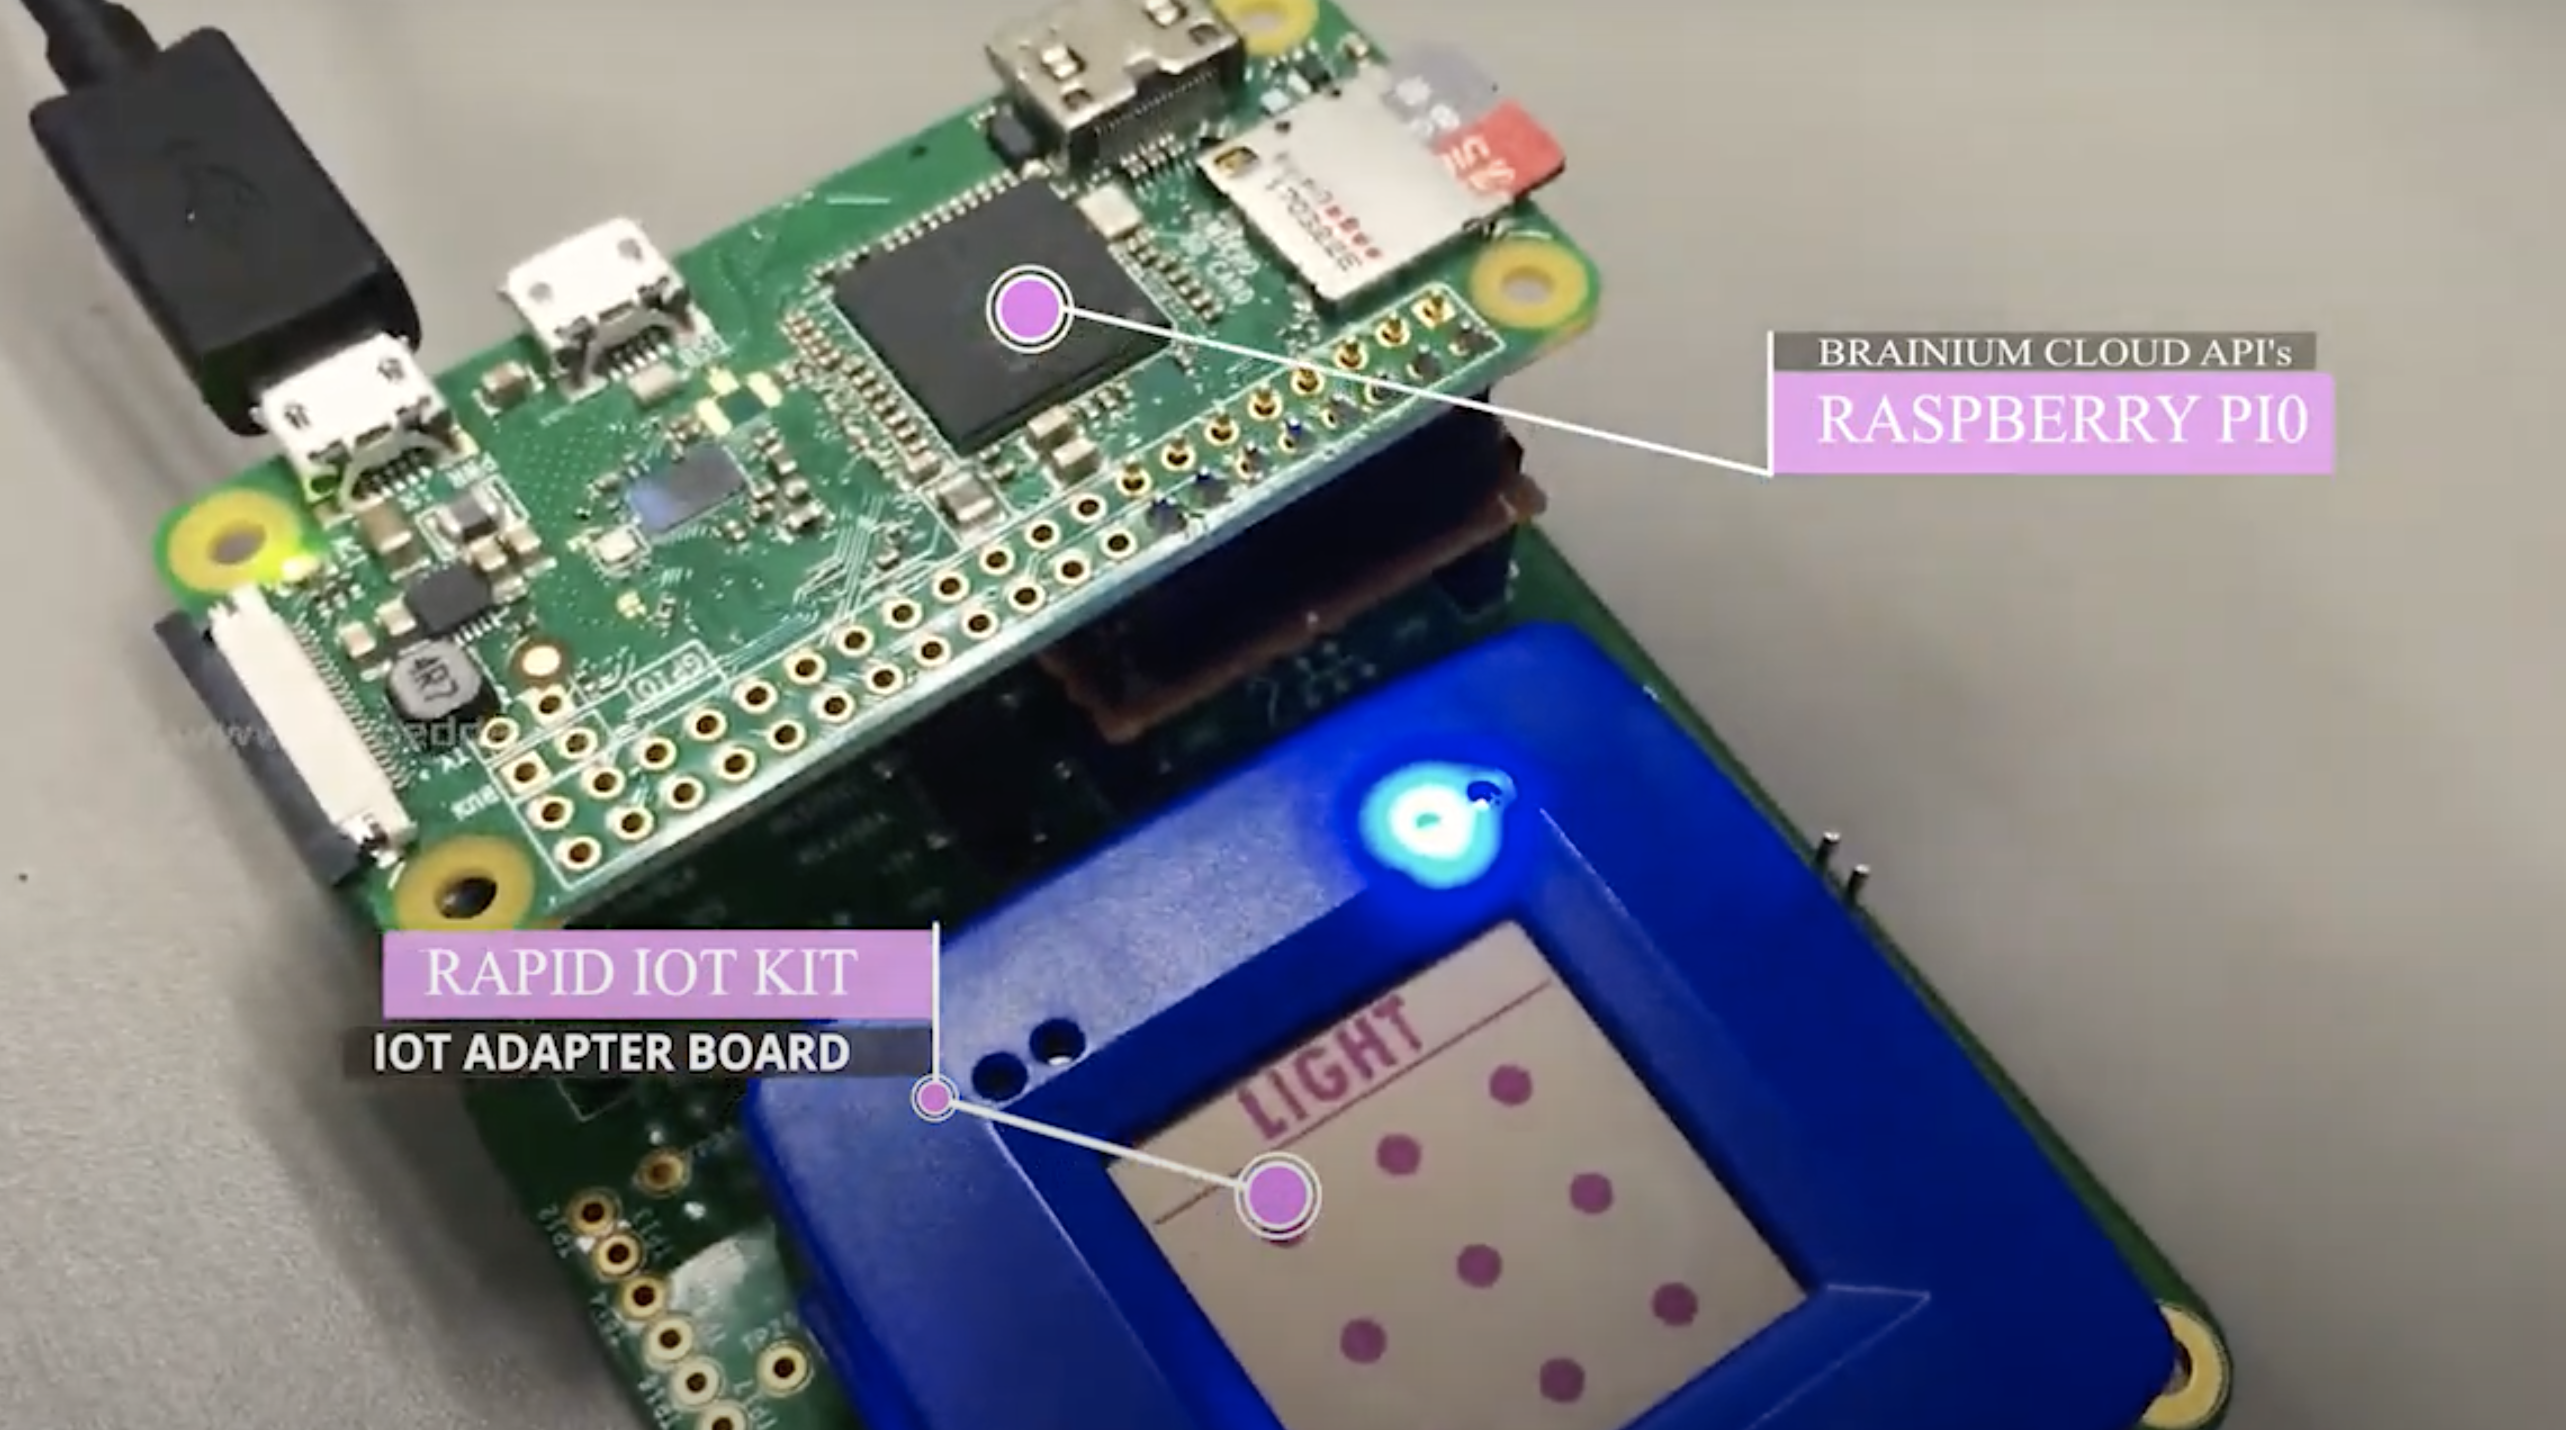
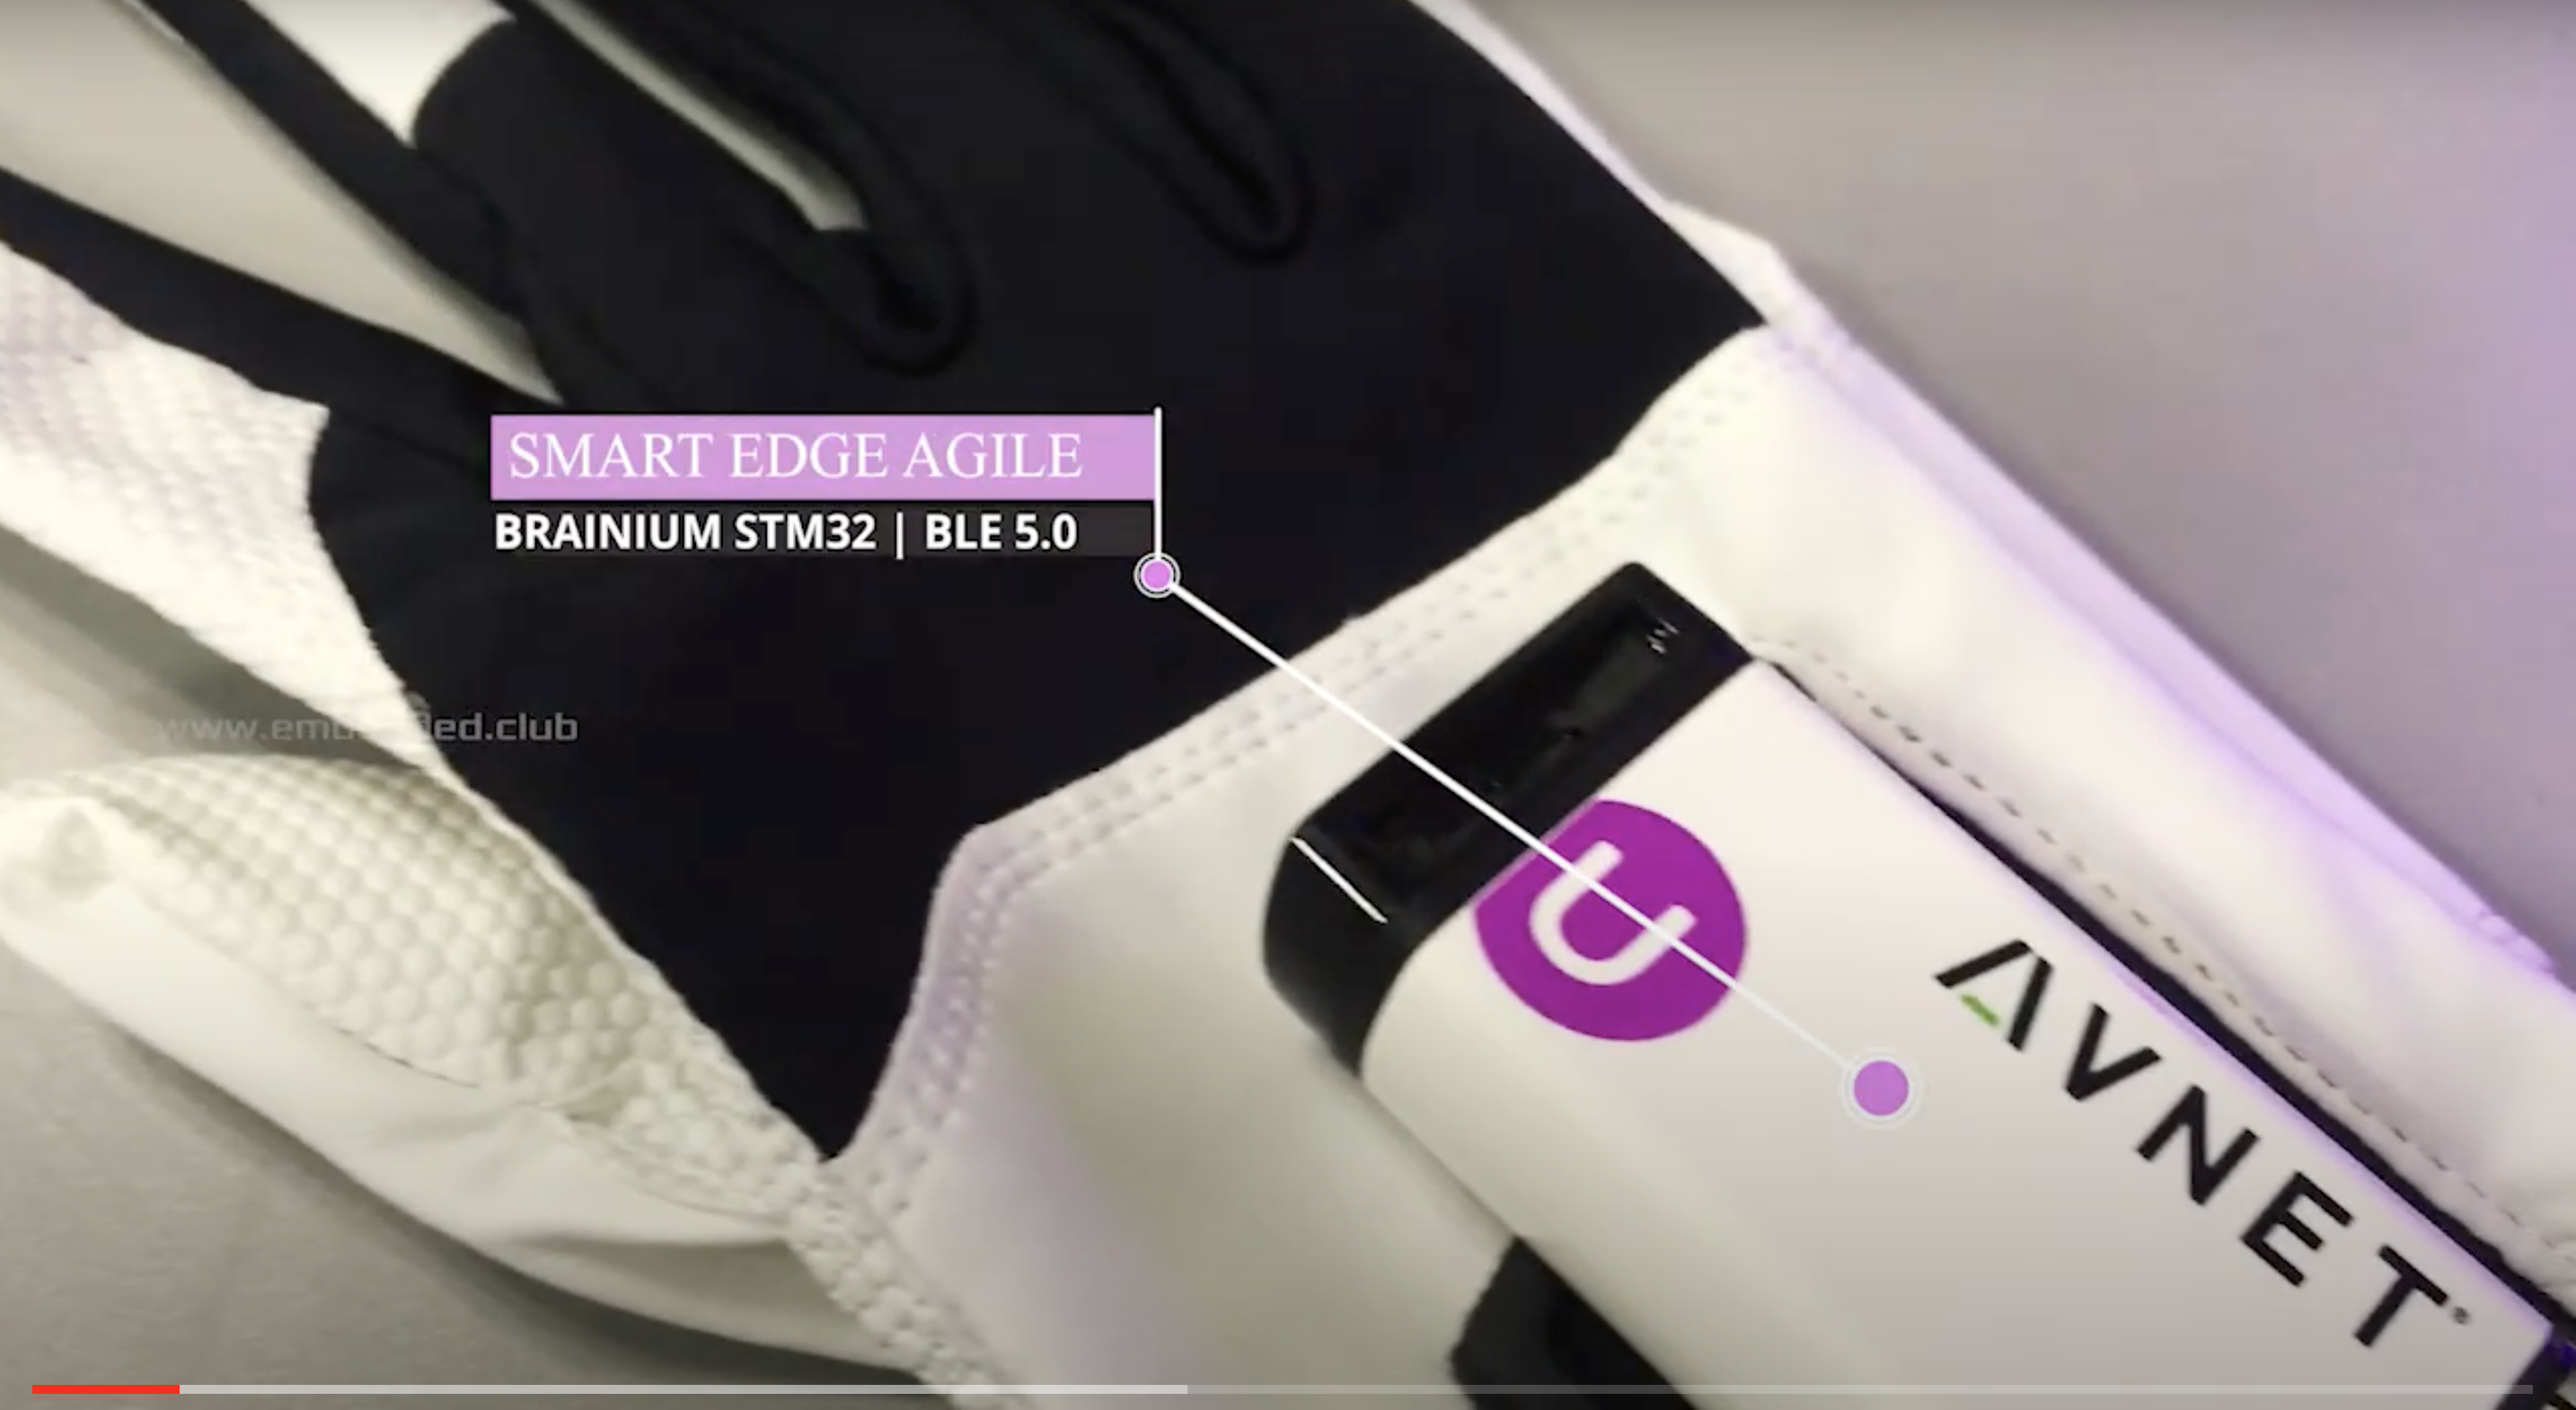
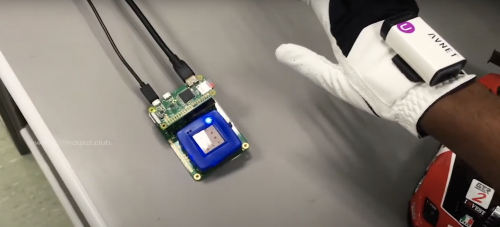
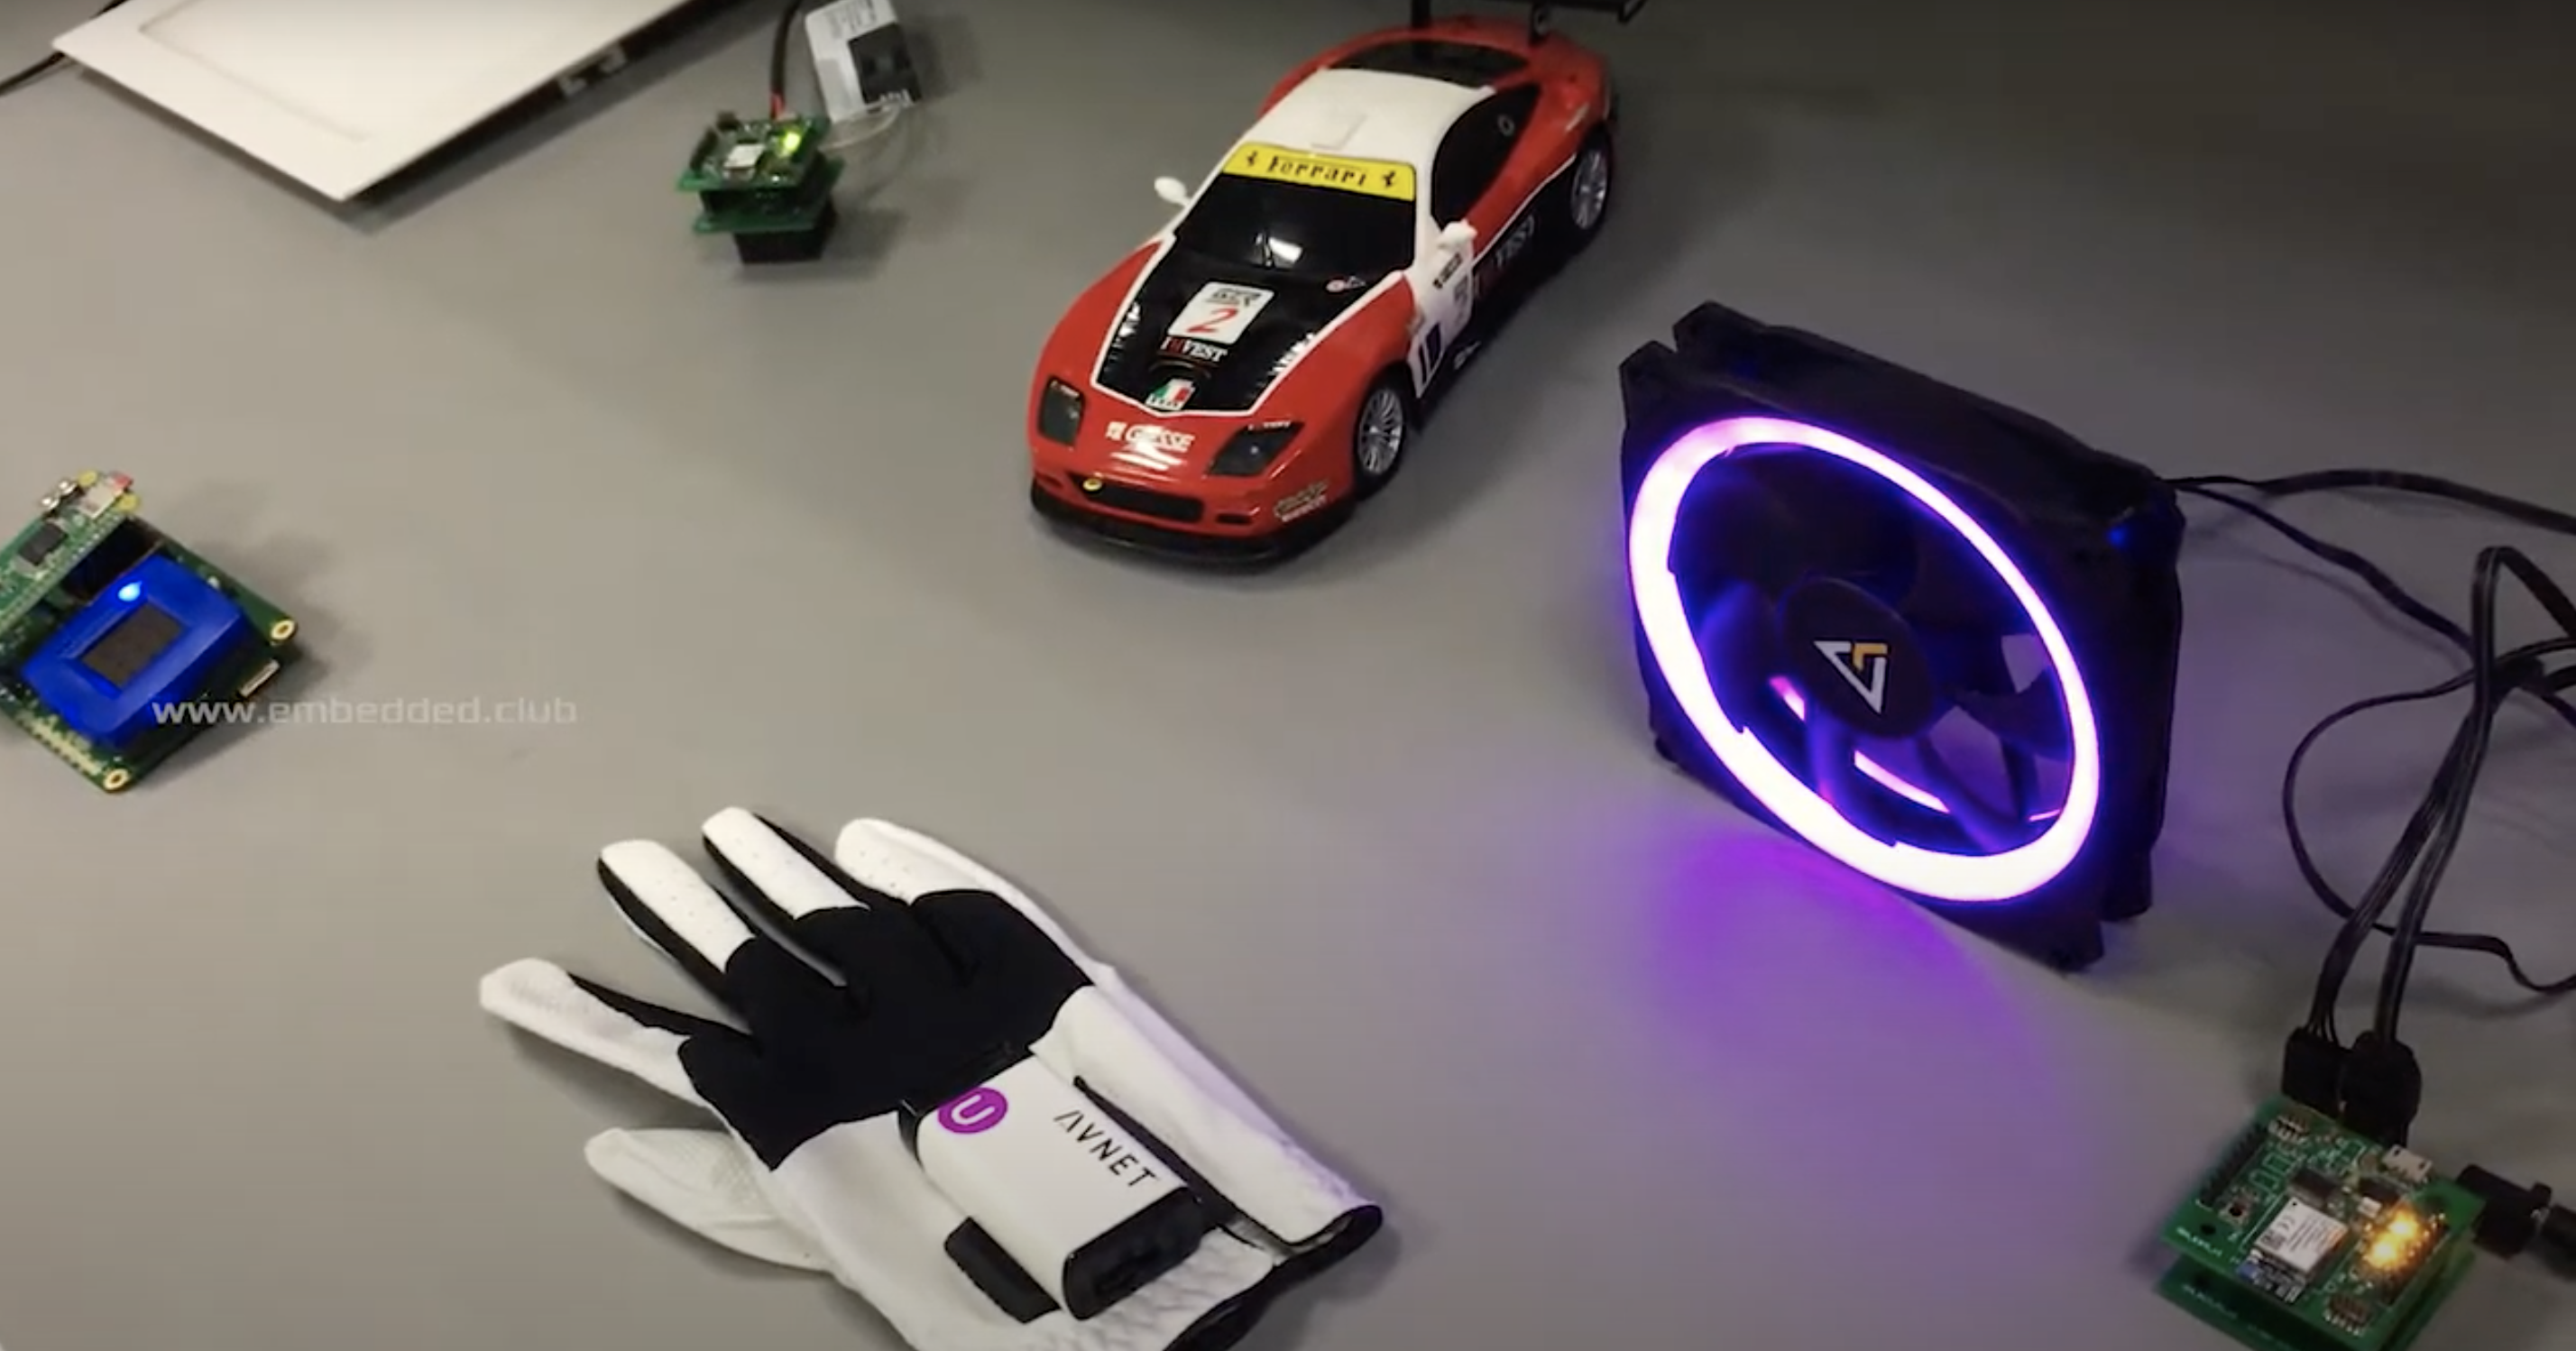
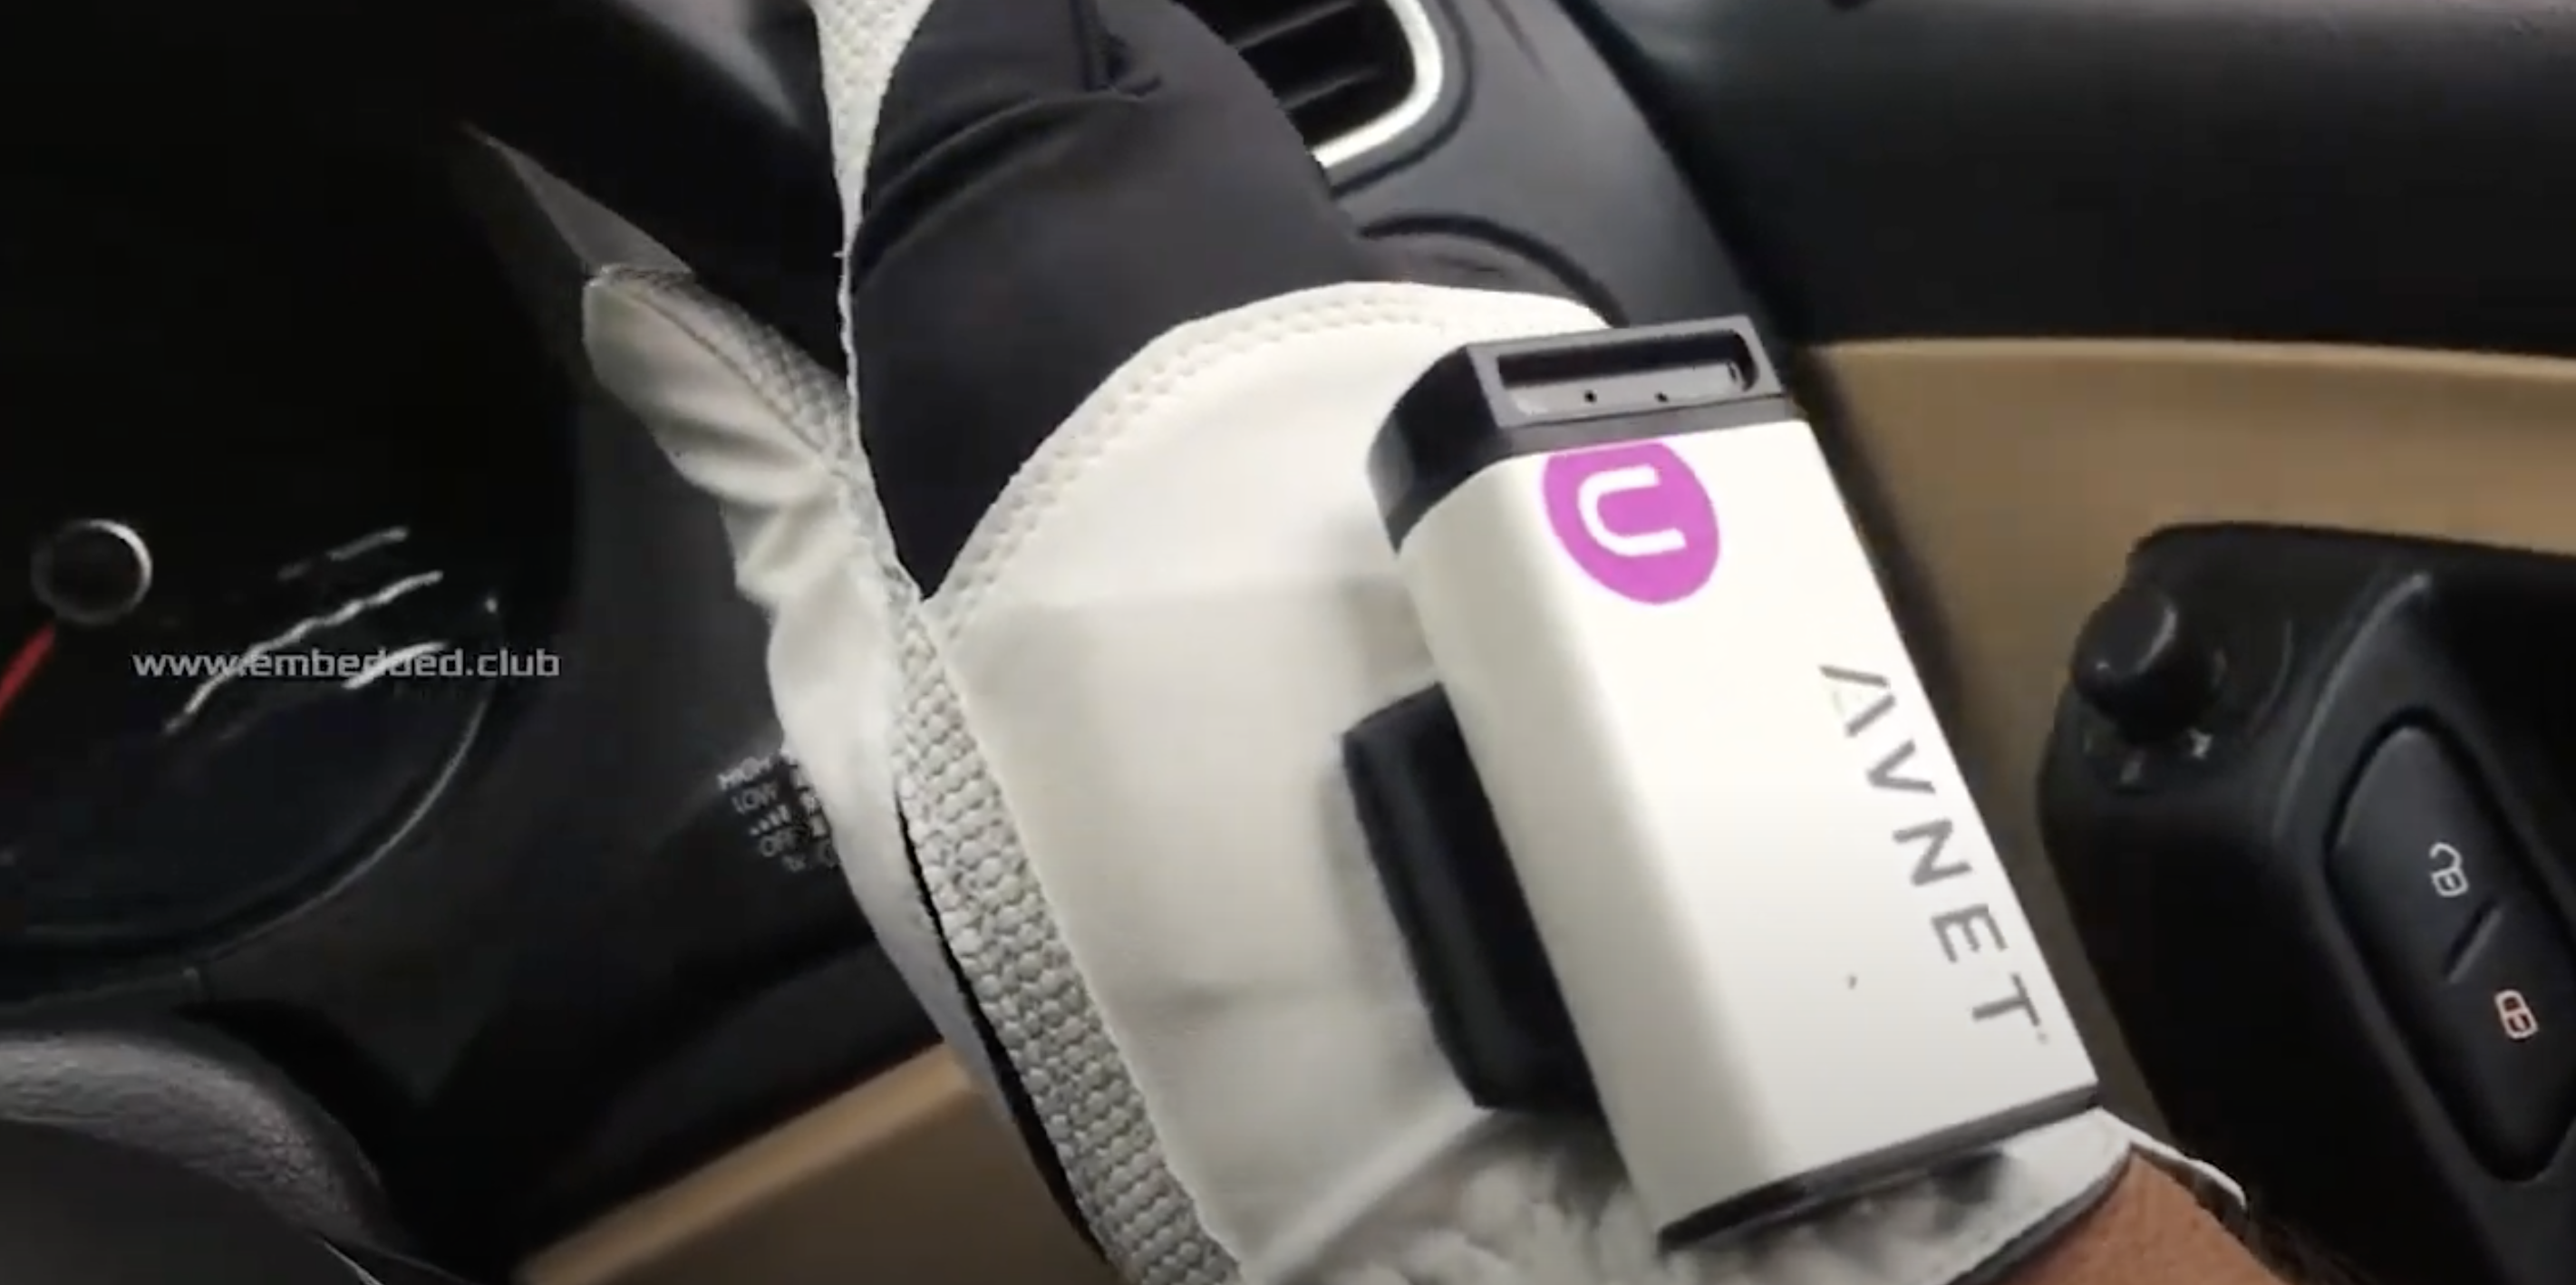