Post Syndicated from Ross Warren original https://aws.amazon.com/blogs/security/investigate-vpc-flow-with-amazon-detective/
Many Amazon Web Services (AWS) customers need enhanced insight into IP network flow. Traditionally, cost, the complexity of collection, and the time required for analysis has led to incomplete investigations of network flows. Having good telemetry is paramount, and VPC Flow Logs are a very important part of a robust centralized logging architecture. The information that VPC Flow Logs provide is frequently used by security analysts to determine the scope of security issues, to validate that network access rules are working as expected, and to help analysts investigate issues and diagnose network behaviors. Flow logs capture information about the IP traffic going to and from EC2 interfaces in a VPC. Each record describes aspects of the traffic flow, such as where it originated and where it was sent to, what network ports were used, and how many bytes were sent.
Amazon Detective now enables you to interactively examine the details of the virtual private cloud (VPC) network flows of your Amazon Elastic Compute Cloud (Amazon EC2) instances. Amazon Detective makes it easy to analyze, investigate, and quickly identify the root cause of potential security issues or suspicious activities. Detective automatically collects VPC flow logs from your monitored accounts, aggregates them by EC2 instance, and presents visual summaries and analytics about these network flows. Detective doesn’t require VPC Flow Logs to be configured and doesn’t impact existing flow log collection.
In this blog post, I describe how to use the new VPC flow feature in Detective to investigate an UnauthorizedAccess:EC2/TorClient finding from Amazon GuardDuty. Amazon GuardDuty is a threat detection service that continuously monitors for malicious activity and unauthorized behavior to protect your AWS accounts, workloads, and data stored in Amazon S3. GuardDuty documentation states that this alert can indicate unauthorized access to your AWS resources with the intent of hiding the unauthorized user’s true identity. I’ll demonstrate how to use Amazon Detective to investigate an instance that was flagged by Amazon GuardDuty to determine whether it is compromised or not.
Starting the investigation in GuardDuty
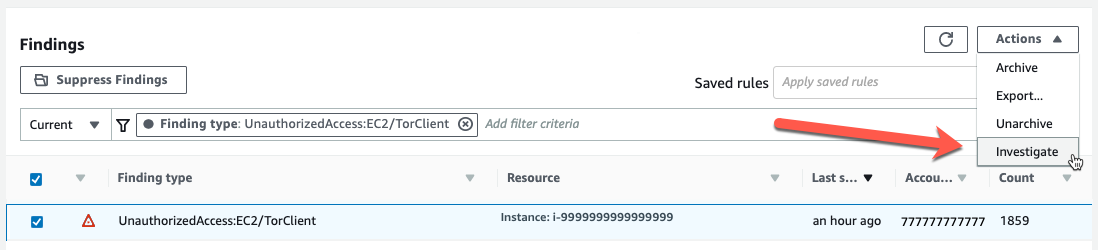
In my GuardDuty console, I’m going to select the UnauthorizedAccess:EC2/TorClient finding shown in Figure 1, choose the Actions menu, and select Investigate.

Figure 1: Investigating from the GuardDuty console
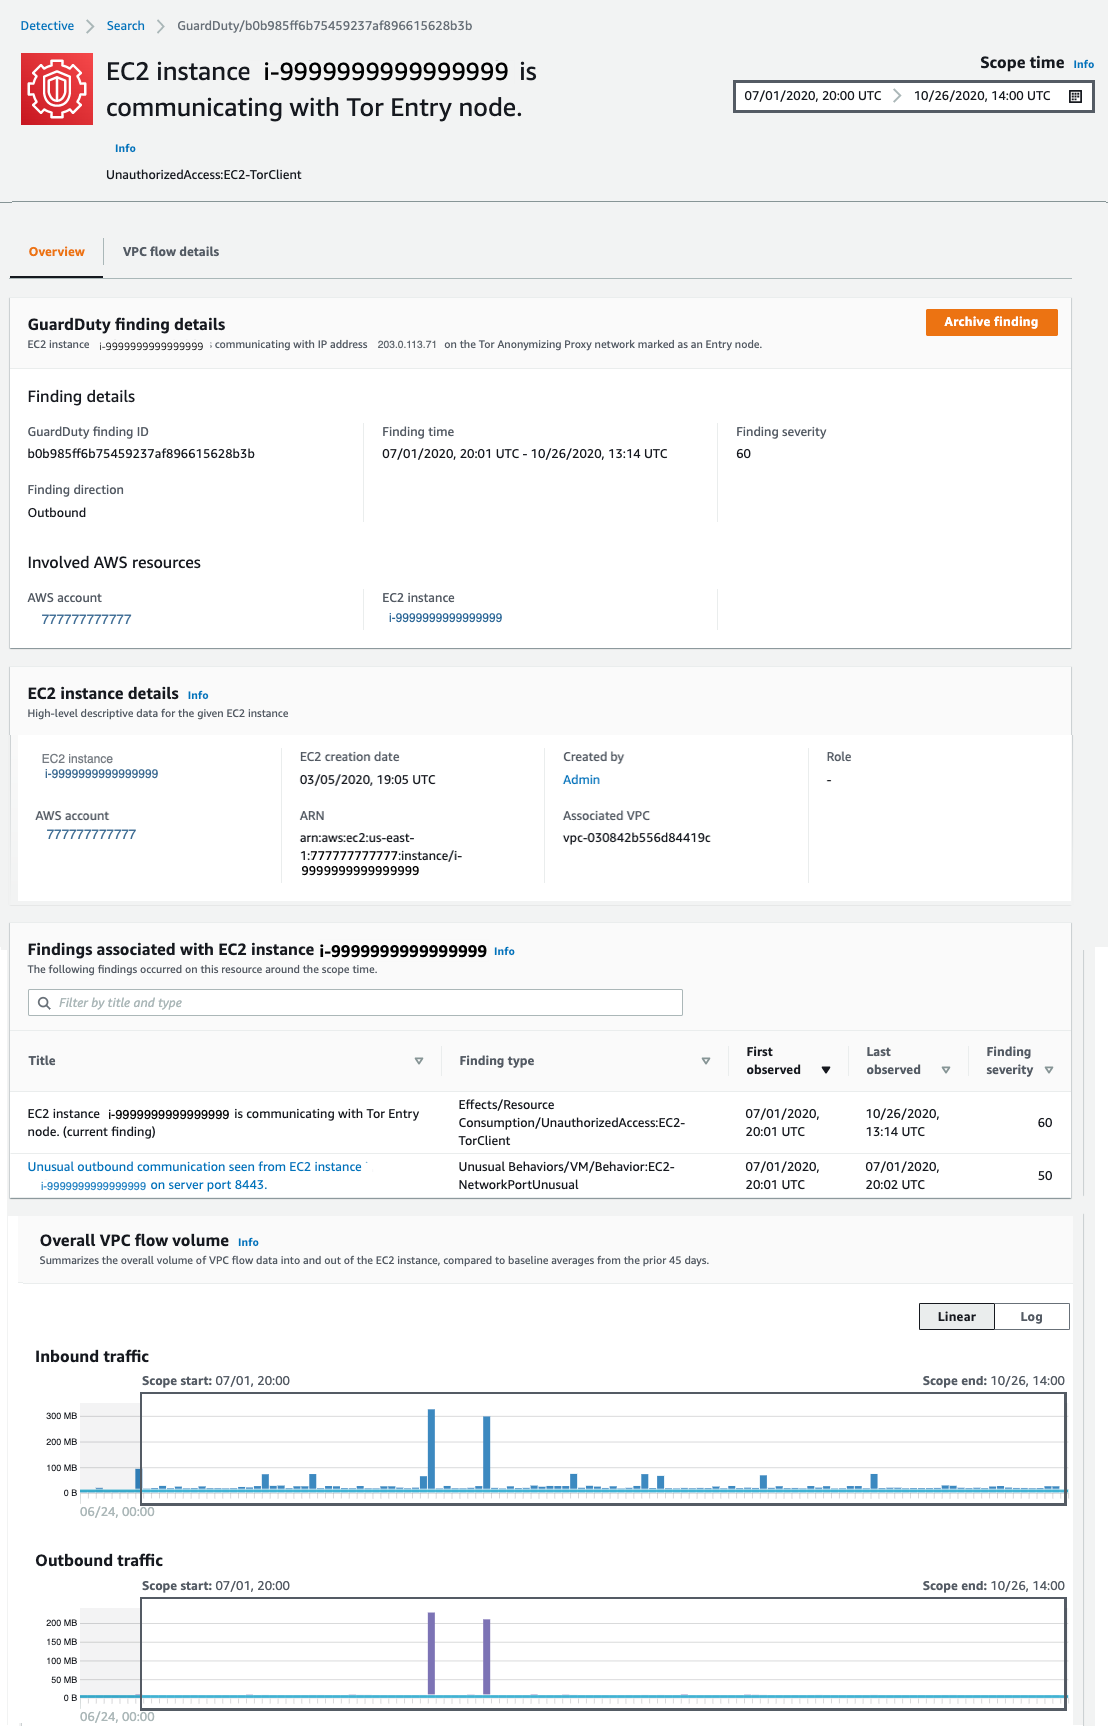
This opens a new browser tab and launches the Amazon Detective console, where I’m presented with the profile page for this finding, shown in Figure 2. You must have Detective enabled to pivot between a GuardDuty finding and Detective. Detective provides profile pages for supported GuardDuty findings and AWS resources (for example, IP address, EC2 instance, user, and role) that include information and data visualizations that summarize observed behaviors and give guidance for interpreting them. Profiles help analysts to determine whether the finding is of genuine concern or a false positive. For resources, profiles provide supporting details for an investigation into a finding or for a general hunt for suspicious activity.

Figure 2: Finding profile panel
In this case, the profile page for this GuardDuty UnauthorizedAccess:EC2/TorClient finding provides contextual and behavioral data about the EC2 instance on which GuardDuty has noted the issue. As I dive into this finding, I’m going to be asking questions that help assess whether the instance was in fact accessed unintentionally, such as, “What IP port or network service was in use at that time?,” “Were any large data transfers involved?,” “Was the traffic allowed by my security groups?” Profile pages in Detective organize content that helps security analysts investigate GuardDuty findings, examine unexpected network behavior, and identify other AWS resources that might be affected by a potential security issue.
I begin scrolling down the page and notice the Findings associated with EC2 instance i-9999999999999999 panel. Detective displays related findings to provide analysts with additional evidence and context about potentially related issues. The finding I’m investigating is listed there, as well as an Unusual Behaviors/VM/Behavior:EC2-NetworkPortUnusual finding. GuardDuty builds a baseline on your network traffic and will generate findings where there is traffic outside the calculated normal. While we might not investigate every instance of anomalous traffic, having these alerts correlated by Detective provides context for validating the issue. Keeping this in mind as I scroll down, at the bottom of this profile page, I find the Overall VPC flow volume panel. If you choose the Info link next to the panel title, you can see helpful tips that describe how to use the visualizations and provide ideas for questions to ask within your investigation. These info links are available throughout Detective. Check them out!
Investigating VPC flow in Detective
In this investigation, I’m very curious about the two large spikes in inbound traffic that I see in the Overall VPC flow volume panel, which seem to be visually associated with some unusual outbound traffic spikes. It’s most likely that these outbound spikes are related to the Unusual Behaviors/VM/Behavior:EC2-NetworkPortUnusual finding I mentioned earlier. To start the investigation, I choose the display details for scope time button, shown circled at the bottom of Figure 2. This expands the VPC Flow Details, shown in Figure 3.

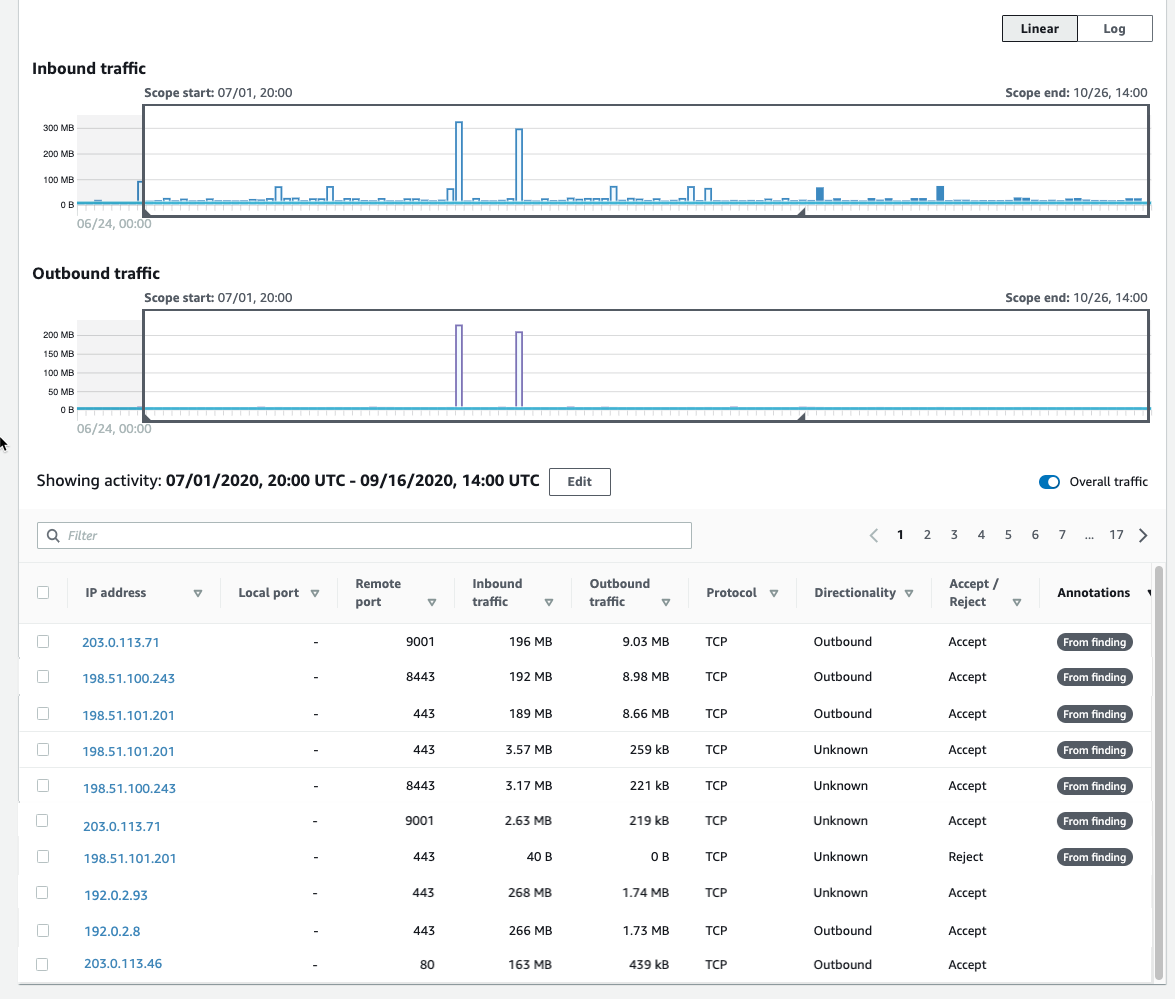
Figure 3: Our first look at VPC Flow Details
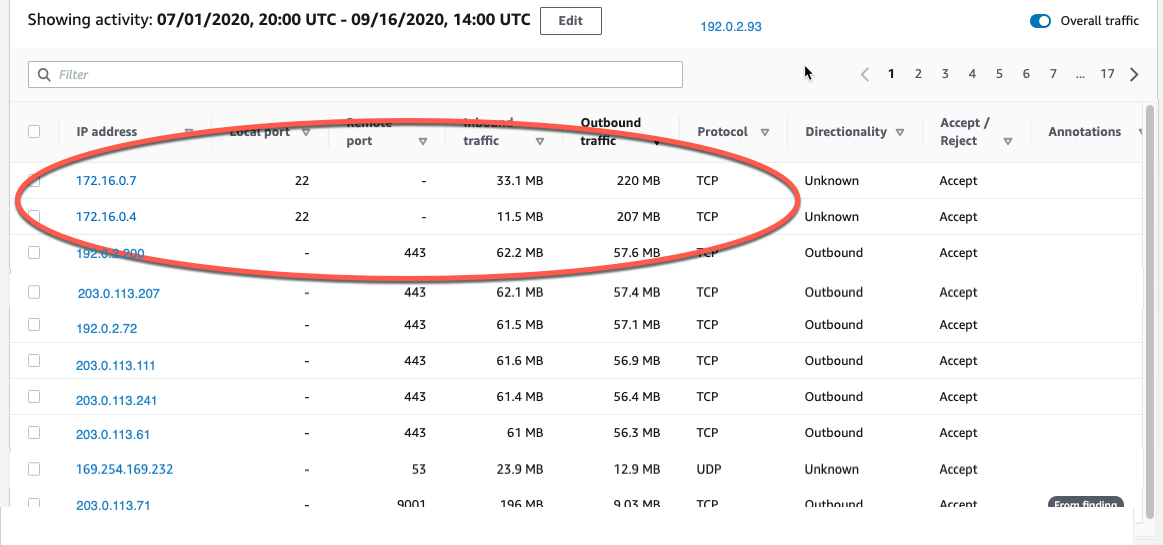
We now can see that each entry displays the volume of inbound traffic, the volume of outbound traffic, and whether the access request was accepted or rejected. Detective provides annotations on the VPC flows to help guide your investigation. These From finding annotations make it clear which flows and resources were involved in the finding. In this case, we can easily see (in Figure 3) the three IP addresses at the top of the list that triggered this GuardDuty finding.
I’m first going to focus on the spikes in traffic that are above the baseline. When I click on one of the spikes in the graph, the time window for the VPC flow activity now matches the dates of these spikes I’m investigating.
If I choose the Inbound Traffic column header, shown in Figure 4, I can find the flows that contributed to the spike during this time window.

Figure 4: Inbound traffic spikes
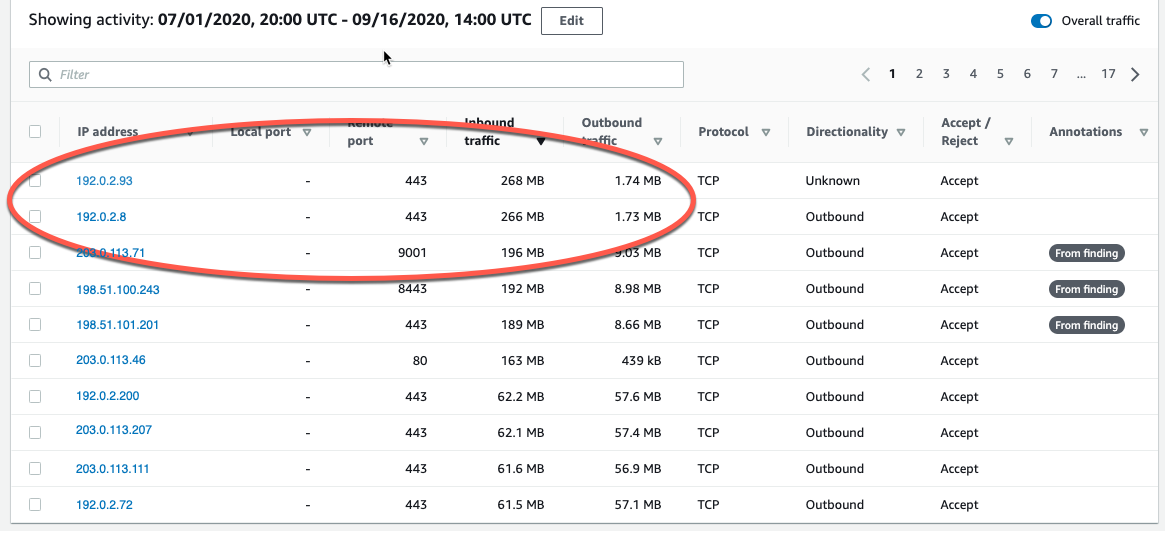
Note that the two large inbound spikes aren’t associated with the IP address from the UnauthorizedAccess:EC2/TorClient finding, based on the Detective annotation From finding. Let’s check the outbound traffic. If I do a quick sort of the table based on the outbound traffic column, as shown in Figure 5, we can also see the outbound spikes, and it isn’t immediately evident whether the spikes are associated with this finding. I could continue to investigate the spikes (because they are a visual anomaly), or focus just on the VPC flow traffic that GuardDuty and Detective have labeled as associated with this TOR finding.

Figure 5: Outbound traffic spikes
Let’s focus on the outbound and inbound spikes and see if we can determine what’s happening. The inbound spikes are on port 443, typically an HTTPS port, or a secure web connection. The outbound spikes are on port 22 (ssh), but go to IP addresses that look to be internal based on their addresses of 172.16.x.x. The port 443 traffic might indicate a web server that’s open to the internet and receiving traffic. With further investigation, we can determine if this idea is valid, and continue hunting for potentially malicious traffic.
A good next step would be to investigate the two specific IP addresses to rule out their involvement in the finding. I can do this by right-clicking on either of the external IP addresses and opening a new tab, where I can focus on investigating these two specific IP addresses. I would take this line of investigation to possibly rule out the involvement of these IP addresses in this finding, determine if they regularly communicate with my resources, find out what instance(s) they’re related to, and see if there are other findings associated with these instances or IP addresses. This deeper investigation is outside the scope of this blog post, but it’s something you should be doing in your own environment.
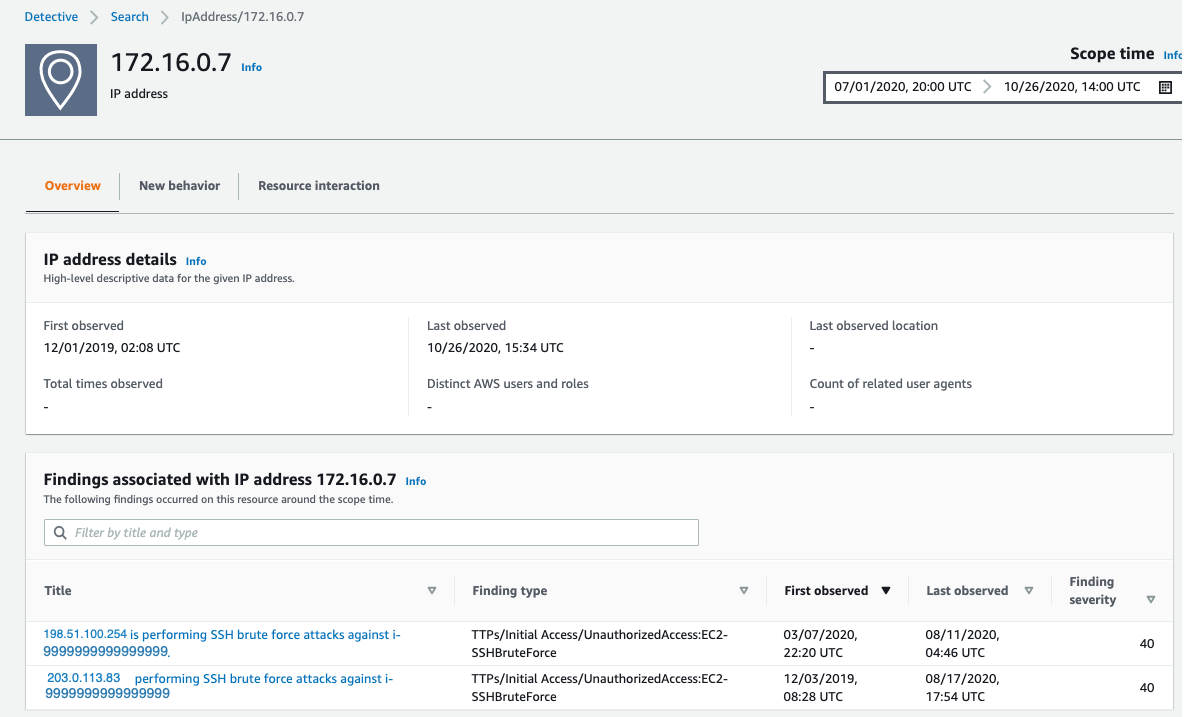
IP addresses in AWS are ephemeral in nature. The unique identifier in VPC flow logs is the Instance ID. At the time of this investigation, 172.16.0.7 is assigned to the instance related to this finding, so let’s continue to take a look at the internal 172.16.0.7 IP address with 218 MB outbound traffic on port 22. I choose 172.16.0.7, and Detective opens up the profile page for this specific IP address, as shown in Figure 6. Here we see some interesting correlations: two other GuardDuty findings related to SSH brute-force attacks. These could be related to our outbound port 22 spikes, because they’re certainly in the window of time we’re investigating.

Figure 6: IP address profile panel
As part of a deeper investigation, you would investigate the SSH brute-force findings for 198.51.100.254 and 203.0.113.83 but for now I’m interested what this IP is involved in. Detective easily associates this 172.16.0.7 IP address with the instance that was assigned the IP during the scope time. I scroll down to the bottom of the profile page for 172.16.0.7 and investigate the i-9999999999999999 instance by choosing the instance name.
Filtering VPC flow activity
In Detective, as the investigator we are looking at an instance profile panel, similar to the one in Figure 2, and since we’re interested in VPC flow details, I’m going to scroll down and select display details for scope time.
To focus on specific activity, I can filter the activity details by the following values:
- IP address
- Local or remote port
- Direction
- Protocol
- Whether the request was accepted or rejected
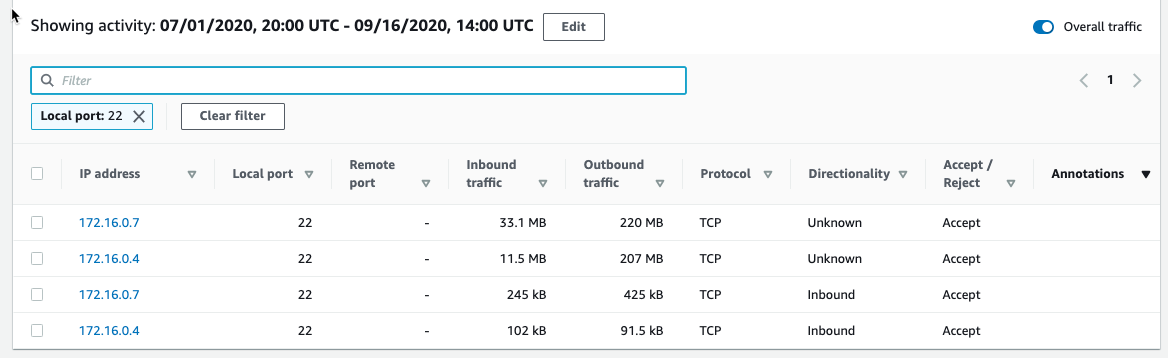
I’m going to filter these VPC flow details and just look at port 22 (sshd) inbound traffic. I select the Filter check box and select Local Port and 22, as shown in Figure 7. Detective fills in all the available ports for you, making it easy to complete this filter.

Figure 7: Port 22 traffic
The activity details show a few IP addresses related to port 22, and we’re still following the large outbound spikes of traffic. It’s outside the scope of this blog post, but now it would be time to start looking at your security groups and network access control lists (ACLs) and determine why port 22 is open to the internet and sending all this traffic.
Understanding traffic behavior
As an investigator, I now have a good picture of the traffic related to the initial finding, and by diving deeper we’re able to discover other interesting traffic during the same timeframe. While we may not always determine “who has done it,” the goal should be to improve our understanding of the behavior of our environment and gather important technical evidence. Detective helps you identify and investigate anomalies to give you insight into your environment. If we were to continue our investigation into the finding, here are some actions we can take within Detective.
Investigate VPC findings with Detective:
- Perform ports and utilization analysis
- Identify service and ephemeral ports
- Determine whether traffic was accepted or rejected based on security groups and NACL configurations
- Investigate possible reconnaissance traffic by exploring the significant amount of rejected traffic
- Correlate EC2 instances to TCP/IP ports and IPs
- Analyze traffic spikes and anomalies
- Discover traffic patterns and make behavioral correlations
Explore EC2 instance behavior with Detective:
- Directional Traffic Analysis
- Investigate possible data exfiltration events by digging into large transfers
- Enumerate distinct IP connections and sort and filter by protocol, amount of traffic, and traffic direction
- Gather data related to a spike in port count from a single IP address (potential brute force) or multiple IP addresses (distributed denial of service (DDoS))
Additional forensics steps to consider
- Snapshot EC2 Volumes
- Memory dump of EC2 instance
- Isolate EC2 instance
- Review your authentication strategy and assess whether the chosen authentication method is sufficient to protect your asset
Summary
Without requiring you to set up infrastructure or spend time configuring log ingestion, Detective collects, organizes, and presents relevant data for your threat analysis and investigations. Security and operations teams will find this new capability helpful for simplifying EC2 traffic analysis, validating security group permissions, and diagnosing EC2 instance behavior. Detective does the heavy lifting of storing, and analyzing VPC flow data so you can focus on quickly answering your investigative questions. VPC network flow details are available now in all Detective supported Regions and are included as part of your service subscription.
To get started, you can enable a 30-day free trial of Amazon Detective. See the AWS Regional Services page for all the regions where Detective is available. To learn more, visit the Amazon Detective product page.
Are you a visual learner? Check out Amazon Detective Overview and Demonstration. This video helps you learn how and when to use Amazon Detective to improve the security of your AWS resources.
If you have feedback about this post, submit comments in the Comments section below.
Want more AWS Security how-to content, news, and feature announcements? Follow us on Twitter.