Post Syndicated from Explosm.net original https://explosm.net/comics/make-more-friends
New Cyanide and Happiness Comic
Post Syndicated from Explosm.net original https://explosm.net/comics/make-more-friends
New Cyanide and Happiness Comic
Post Syndicated from The History Guy: History Deserves to Be Remembered original https://www.youtube.com/watch?v=8W0MD7I9ZcE
Post Syndicated from xkcd.com original https://xkcd.com/2999/

Post Syndicated from The History Guy: History Deserves to Be Remembered original https://www.youtube.com/watch?v=sjR_MkH1Nd4
Post Syndicated from Esra Kayabali original https://aws.amazon.com/blogs/aws/amazon-aurora-postgresql-and-amazon-dynamodb-zero-etl-integrations-with-amazon-redshift-now-generally-available/
Today, I am excited to announce the general availability of Amazon Aurora PostgreSQL-Compatible Edition and Amazon DynamoDB zero-ETL integrations with Amazon Redshift. Zero-ETL integration seamlessly makes transactional or operational data available in Amazon Redshift, removing the need to build and manage complex data pipelines that perform extract, transform, and load (ETL) operations. It automates the replication of source data to Amazon Redshift, simultaneously updating source data for you to use in Amazon Redshift for analytics and machine learning (ML) capabilities to derive timely insights and respond effectively to critical, time-sensitive events.
Using these new zero-ETL integrations, you can run unified analytics on your data from different applications without having to build and manage different data pipelines to write data from multiple relational and non-relational data sources into a single data warehouse. In this post, I provide two step-by-step walkthroughs on how to get started with both Amazon Aurora PostgreSQL and Amazon DynamoDB zero-ETL integrations with Amazon Redshift.
To create a zero-ETL integration, you specify a source and Amazon Redshift as the target. The integration replicates data from the source to the target data warehouse, making it available in Amazon Redshift seamlessly, and monitors the pipeline’s health.
Let’s explore how these new integrations work. In this post, you will learn how to create zero-ETL integrations to replicate data from different source databases (Aurora PostgreSQL and DynamoDB) to the same Amazon Redshift cluster. You will also learn how to select multiple tables or databases from Aurora PostgreSQL source databases to replicate data to the same Amazon Redshift cluster. You will observe how zero-ETL integrations provide flexibility without the operational burden of building and managing multiple ETL pipelines.
Getting started with Aurora PostgreSQL zero-ETL integration with Amazon Redshift
Before creating a database, I create a custom cluster parameter group because Aurora PostgreSQL zero-ETL integration with Amazon Redshift requires specific values for the Aurora DB cluster parameters. In the Amazon RDS console, I go to Parameter groups in the navigation pane. I choose Create parameter group.
I enter custom-pg-aurora-postgres-zero-etl for Parameter group name and Description. I choose Aurora PostgreSQL for Engine type and aurora-postgresql16 for Parameter group family (zero-ETL integration works with PostgreSQL 16.4 or above versions). Finally, I choose DB Cluster Parameter Group for Type and choose Create.

Next, I edit the newly created cluster parameter group by choosing it on the Parameter groups page. I choose Actions and then choose Edit. I set the following cluster parameter settings:
rds.logical_replication=1aurora.enhanced_logical_replication=1aurora.logical_replication_backup=0aurora.logical_replication_globaldb=0I choose Save Changes.

Next, I create an Aurora PostgreSQL database. When creating the database, you can set the configurations according to your needs. Remember to choose Aurora PostgreSQL (compatible with PostgreSQL 16.4 or above) from Available versions and the custom cluster parameter group (custom-pg-aurora-postgres-zero-etl in this case) for DB cluster parameter group in the Additional configuration section.
After the database becomes available, I connect to the Aurora PostgreSQL cluster, create a database named books, create a table named book_catalog in the default schema for this database and insert sample data to use with zero-ETL integration.

To get started with zero-ETL integration, I use an existing Amazon Redshift data warehouse. To create and manage Amazon Redshift resources, visit the Amazon Redshift Getting Started Guide.
In the Amazon RDS console, I go to the Zero-ETL integrations tab in the navigation pane and choose Create zero-ETL integration. I enter postgres-redshift-zero-etl for Integration identifier and Amazon Aurora zero-ETL integration with Amazon Redshift for Integration description. I choose Next.

On the next page, I choose Browse RDS databases to select the source database. For the Data filtering options, I use database.schema.table pattern. I include my table called book_catalog in Aurora PostgreSQL books database. The * in filters will replicate all book_catalog tables in all schemas within books database. I choose Include as filter type and enter books.*.book_catalog into the Filter expression field. I choose Next.

On the next page, I choose Browse Redshift data warehouses and select the existing Amazon Redshift data warehouse as the target. I must specify authorized principals and integration source on the target to enable Amazon Aurora to replicate into the data warehouse and enable case sensitivity. Amazon RDS can complete these steps for me during setup, or I can configure them manually in Amazon Redshift. For this demo, I choose Fix it for me and choose Next.

After the case sensitivity parameter and the resource policy for data warehouse are fixed, I choose Next on the next Add tags and encryption page. After I review the configuration, I choose Create zero-ETL integration.

After the integration succeeded, I choose the integration name to check the details.

Now, I need to create a database from integration to finish setting up. I go to the Amazon Redshift console, choose Zero-ETL integrations in the navigation pane and select the Aurora PostgreSQL integration I just created. I choose Create database from integration.

I choose books as Source named database and I enter zeroetl_aurorapg as the Destination database name. I choose Create database.

After the database is created, I return to the Aurora PostgreSQL integration page. On this page, I choose Query data to connect to the Amazon Redshift data warehouse to observe if the data is replicated. When I run a select query in the zeroetl_aurorapg database, I see that the data in book_catalog table is replicated to Amazon Redshift successfully.

As I said in the beginning, you can select multiple tables or databases from the Aurora PostgreSQL source database to replicate the data to the same Amazon Redshift cluster. To add another database to the same zero-ETL integration, all I have to do is to add another filter to the Data filtering options in the form of database.schema.table, replacing the database part with the database name I want to replicate. For this demo, I will select multiple tables to be replicated to the same data warehouse. I create another table named publisher in the Aurora PostgreSQL cluster and insert sample data to it.

I edit the Data filtering options to include publisher table for replication. To do this, I go to the postgres-redshift-zero-etl details page and choose Modify. I append books.*.publisher using comma in the Filter expression field. I choose Continue. I review the changes and choose Save changes. I observe that the Filtered data tables section on the integration details page has now 2 tables included for replication.

When I switch to the Amazon Redshift Query editor and refresh the tables, I can see that the new publisher table and its records are replicated to the data warehouse.

Now that I completed the Aurora PostgreSQL zero-ETL integration with Amazon Redshift, let’s create a DynamoDB zero-ETL integration with the same data warehouse.
Getting started with DynamoDB zero-ETL integration with Amazon Redshift
In this part, I proceed to create an Amazon DynamoDB zero-ETL integration using an existing Amazon DynamoDB table named Book_Catalog. The table has 2 items in it:

I go to the Amazon Redshift console and choose Zero-ETL integrations in the navigation pane. Then, I choose the arrow next to the Create zero-ETL integration and choose Create DynamoDB integration. I enter dynamodb-redshift-zero-etl for Integration name and Amazon DynamoDB zero-ETL integration with Amazon Redshift for Description. I choose Next.

On the next page, I choose Browse DynamoDB tables and select the Book_Catalog table. I must specify a resource policy with authorized principals and integration sources, and enable point-in-time recovery (PITR) on the source table before I create an integration. Amazon DynamoDB can do it for me, or I can change the configuration manually. I choose Fix it for me to automatically apply the required resource policies for the integration and enable PITR on the DynamoDB table. I choose Next.

Then, I choose my existing Amazon Redshift Serverless data warehouse as the target and choose Next.

I choose Next again in the Add tags and encryption page and choose Create DynamoDB integration in the Review and create page.
Now, I need to create a database from integration to finish setting up just like I did with Aurora PostgreSQL zero-ETL integration. In the Amazon Redshift console, I choose the DynamoDB integration and I choose Create database from integration. In the popup screen, I enter zeroetl_dynamodb as the Destination database name and choose Create database.

After the database is created, I go to the Amazon Redshift Zero-ETL integrations page and choose the DynamoDB integration I created. On this page, I choose Query data to connect to the Amazon Redshift data warehouse to observe if the data from DynamoDB Book_Catalog table is replicated. When I run a select query in the zeroetl_dynamodb database, I see that the data is replicated to Amazon Redshift successfully. Note that the data from DynamoDB is replicated in SUPER datatype column and can be accessed using PartiQL sql.

I insert another entry to the DynamoDB Book_Catalog table.

When I switch to the Amazon Redshift Query editor and refresh the select query, I can see that the new record is replicated to the data warehouse.

Zero-ETL integrations between Aurora PostgreSQL and DynamoDB with Amazon Redshift help you unify data from multiple database clusters and unlock insights in your data warehouse. Amazon Redshift allows cross-database queries and materialized views based off the multiple tables, giving you the opportunity to consolidate and simplify your analytics assets, improve operational efficiency, and optimize cost. You no longer have to worry about setting up and managing complex ETL pipelines.
Now available
Aurora PostgreSQL zero-ETL integration with Amazon Redshift is now available in US East (N. Virginia), US East (Ohio), US West (Oregon), Asia Pacific (Hong Kong), Asia Pacific (Mumbai), Asia Pacific (Singapore), Asia Pacific (Sydney), Asia Pacific (Tokyo), Europe (Frankfurt), Europe (Ireland), and Europe (Stockholm) AWS Regions.
Amazon DynamoDB zero-ETL integration with Amazon Redshift is now available in all commercial, China and GovCloud AWS Regions.
For pricing information, visit the Amazon Aurora and Amazon DynamoDB pricing pages.
To get started with this feature, visit Working with Aurora zero-ETL integrations with Amazon Redshift and Amazon Redshift Zero-ETL integrations documentation.
Post Syndicated from Patrick Kennedy original https://www.servethehome.com/hell-freezes-over-amd-and-intel-come-together-ocp/
Hell freezes over as AMD and Intel come together at OCP Summit 2024 to jointly drive the future x86 ISA through an industry advisory board
The post Hell Freezes Over as AMD and Intel Come Together for x86 appeared first on ServeTheHome.
Post Syndicated from jzb original https://lwn.net/Articles/994320/
Version 4.0.0 of the LibreSSL TLS/cryptography stack
has been released. Changes include a cleanup of the MD4 and MD5
implementations, removal of unused DSA methods, changes in libtls
protocol parsing to ignore unsupported TLSv1.1 and TLSv1.0 protocols,
and many more internal changes and bug fixes.
Post Syndicated from Patrick Kennedy original https://www.servethehome.com/meta-announces-amd-mi300x-for-ai-inference-marvell-fbnic-cisco-arista-broadcom/
Meta outlined its AI platforms at OCP Summit 2024, including GPUs from AMD and NVIDIA and networking from Marvell, Broadcom, Cisco and Arista
The post Meta Announces AMD Instinct MI300X for AI Inference and NVIDIA GB200 Catalina appeared first on ServeTheHome.
Post Syndicated from Crosstalk Solutions original https://www.youtube.com/watch?v=S5m70wmRvgA
Post Syndicated from Talks at Google original https://www.youtube.com/watch?v=CNv79v3NguI
Post Syndicated from Bala Krishna Gangisetty original https://www.backblaze.com/blog/introducing-scalable-application-keys-for-enhanced-security-and-performance/

If you work in an industry with high performance and security demands like video surveillance, internet of things (IoT), and mobile applications, a new Backblaze capability could help your cloud workflows—Scalable Application Keys. This new capability enables you to generate application keys for your Backblaze B2 Cloud Storage Buckets at 150 times the current scale. When you need high volume, short-lived application keys to upload your data to cloud storage, you can’t tolerate bottlenecks—the Scalable Application Keys feature removes them.
Today, I’m digging into the challenges solved by Scalable Application Keys, the use cases where it has the most impact, and the benefits of the feature.
Check out our documentation for more information on Scalable Application Keys and how to work with them.
Managing large volumes of data under strict security requirements sometimes requires using application keys programmatically to interact with cloud storage buckets. In the video surveillance industry, for example, you might upload massive amounts of video footage directly from security cameras to Backblaze B2, and you need to regularly refresh the application keys used by each of those cameras to maintain a robust security posture. However, this practice has a few unique requirements:
The irregular timing of key refreshes and the scale of operations can further amplify the problem, especially when hundreds or thousands of devices request new keys at the same time.
With the introduction of Scalable Application Keys, Backblaze B2 customers can generate and refresh keys at significantly higher volumes and throughput—without hitting hard limits on the number of keys. This feature is designed to accommodate the unique requirements of customers who need:
This feature is particularly beneficial for customers with many endpoints that all upload to Backblaze B2 cloud individually through the S3 Compatible API. For example:
Video surveillance: Companies with large networks of security cameras can now easily refresh keys for each device frequently. When you operate tens of thousands of cameras that record sensitive footage, you need to be able to refresh application keys regularly to maintain security. With Scalable Application Keys, you can handle refreshes efficiently and continue scaling the number of cameras in operation without worry.
Mobile applications: Developers of mobile apps that store data in B2 Cloud Storage can generate unique keys for each user’s device. This is especially useful for apps that rely on user-generated and user-uploaded content, where each end device needs its own application key.
IoT devices: Businesses managing large fleets of IoT devices, where each device needs a unique and regularly refreshed application key, can ensure secure, individualized access to cloud storage.
Scalable Application Keys not only solves existing limitations but also future-proofs your workflows by providing the flexibility and performance needed to scale without restriction.This feature allows you to securely manage access to B2 Cloud Storage, no matter the scale of your operations.
This feature is available upon request. If you’re an existing Backblaze B2 customer and want to get access to this capability, please contact our Support team to request access.
New to Backblaze? Contact our Sales team to learn more about how Scalable Application Keys can benefit your business and how to get started.
Once this feature is enabled, you can generate application keys at scale. Check out the documentation for more on how to use the feature.
Are you leveraging Scalable Application Keys to build more efficient and performant workflows? Share how it’s working for you so other organizations and developers can benefit from what you find. If you have any questions or feedback, please don’t hesitate to reach out to us.
The post Introducing Scalable Application Keys for Enhanced Security and Performance appeared first on Backblaze Blog | Cloud Storage & Cloud Backup
Post Syndicated from BeardedTinker original https://www.youtube.com/watch?v=L4PvsoMhRbU
Post Syndicated from JQ Lau original https://blog.cloudflare.com/analysis-of-the-epyc-145-performance-gain-in-cloudflare-gen-12-servers
Cloudflare’s network spans more than 330 cities in over 120 countries, serving over 60 million HTTP requests per second and 39 million DNS queries per second on average. These numbers will continue to grow, and at an accelerating pace, as will Cloudflare’s infrastructure to support them. While we can continue to scale out by deploying more servers, it is also paramount for us to develop and deploy more performant and more efficient servers.
At the heart of each server is the processor (central processing unit, or CPU). Even though many aspects of a server rack can be redesigned to improve the cost to serve a request, CPU remains the biggest lever, as it is typically the primary compute resource in a server, and the primary enabler of new technologies.
Cloudflare’s 12th Generation server with AMD EPYC 9684-X (codenamed Genoa-X) is 145% more performant and 63% more efficient. These are big numbers, but where do the performance gains come from? Cloudflare’s hardware system engineering team did a sensitivity analysis on three variants of 4th generation AMD EPYC processor to understand the contributing factors.
For the 4th generation AMD EPYC Processors, AMD offers three architectural variants:
mainstream classic Zen 4 cores, codenamed Genoa
efficiency optimized dense Zen 4c cores, codenamed Bergamo
cache optimized Zen 4 cores with 3D V-cache, codenamed Genoa-X

Figure 1 (from left to right): AMD EPYC 9654 (Genoa), AMD EPYC 9754 (Bergamo), AMD EPYC 9684X (Genoa-X)
Key features common across the 4th Generation AMD EPYC processors:
Up to 12x Core Complex Dies (CCDs)
Each core has a private 1MB L2 cache
The CCDs connect to memory, I/O, and each other through an I/O die
Configurable Thermal Design Power (cTDP) up to 400W
Support up to 12 channels of DDR5-4800 1DPC
Support up to 128 lanes PCIe Gen 5
Classic Zen 4 Cores (Genoa):
Each Core Complex (CCX) has 8x Zen 4 Cores (16x Threads)
Each CCX has a shared 32 MB L3 cache (4 MB/core)
Each CCD has 1x CCX
Dense Zen 4c Cores (Bergamo):
Each CCX has 8x Zen 4c Cores (16x Threads)
Each CCX has a shared 16 MB L3 cache (2 MB/core)
Each CCD has 2x CCX
Classic Zen 4 Cores with 3D V-cache (Genoa-X):
Each CCX has 8x Zen 4 Cores (16x Threads)
Each CCX has a shared 96MB L3 cache (12 MB/core)
Each CCD has 1x CCX
For more information on 4th generation AMD EPYC Processors architecture, see: https://www.amd.com/system/files/documents/4th-gen-epyc-processor-architecture-white-paper.pdf
The following table is a summary of the specification of the AMD EPYC 7713 CPU in our Gen 11 server against the three CPU candidates, one from each variant of the 4th generation AMD EPYC Processors architecture:
|
CPU Model |
||||
|
Series |
Milan |
Genoa |
Bergamo |
Genoa-X |
|
# of CPU Cores |
64 |
96 |
128 |
96 |
|
# of Threads |
128 |
192 |
256 |
192 |
|
Base Clock |
2.0 GHz |
2.4 GHz |
2.25 GHz |
2.4 GHz |
|
All Core Boost Clock |
~2.7 GHz* |
3.55 Ghz |
3.1 Ghz |
3.42 Ghz |
|
Total L3 Cache |
256 MB |
384 MB |
256 MB |
1152 MB |
|
L3 cache per core |
4 MB / core |
4 MB / core |
2 MB / core |
12 MB / core |
|
Maximum configurable TDP |
240W |
400W |
400W |
400W |
* AMD EPYC 7713 all core boost clock is based on Cloudflare production data, not the official specification from AMD
Readers may remember that Cloudflare introduced cf_benchmark when we evaluated Qualcomm’s ARM chips, using it as our first pass benchmark to shortlist AMD’s Rome CPU for our Gen 10 servers and to evaluate our chosen ARM CPU Ampere Altra Max against AWS Graviton 2. Likewise, we ran cf_benchmark against the three candidate CPUs for our 12th Gen servers: AMD EPYC 9654 (Genoa), AMD EPYC 9754 (Bergamo), and AMD EPYC 9684X (Genoa-X). The majority of cf_benchmark workloads are compute bound, and given more cores or higher CPU frequency, they score better. The graph and the table below show the benchmark performance comparison of the three CPU candidates with Genoa 9654 as the baseline, where > 1.00x indicates better performance.

|
Genoa 9654 (baseline) |
Bergamo 9754 |
Genoa-X 9684X |
|
|
openssl_pki |
1.00x |
1.16x |
1.01x |
|
openssl_aead |
1.00x |
1.20x |
1.01x |
|
luajit |
1.00x |
0.86x |
1.00x |
|
brotli |
1.00x |
1.11x |
0.98x |
|
gzip |
1.00x |
0.87x |
1.01x |
|
go |
1.00x |
1.09x |
1.00x |
Bergamo 9754 with 128 cores scores better in openssl_pki, openssl_aead, brotli, and go benchmark suites, and performs less favorably in luajit and gzip benchmark suites. Genoa-X 9684X (with significantly more L3 cache) doesn’t offer a significant boost in performance for these compute-bound benchmarks.
These benchmarks are representative of some of the common workloads Cloudflare runs, and are useful in identifying software scaling issues, system configuration bottlenecks, and the impact of CPU design choices on workload-specific performance. However, the benchmark suite is not an exhaustive list of all workloads Cloudflare runs in production, and in reality, the workloads included in the benchmark suites are almost certainly not the exclusive workload running on the CPU. In short, though benchmark results can be informative, they do not represent a good indication of production performance when a mix of these workloads run on the same processor.
To get an early indication of production performance, Cloudflare has an internal performance simulation tool that exercises our software stack to fetch a fixed asset repeatedly. The simulation tool can be configured to fetch a specified fixed-size asset and configured to include or exclude services like WAF or Workers in the request path. Below, we show the simulated performance between the three CPUs for an asset size of 10 KB, where >1.00x indicates better performance.
|
Milan 7713 |
Genoa 9654 |
Bergamo 9754 |
Genoa-X 9684X |
|
|
Lab simulation performance multiplier |
1.00x |
2.20x |
1.95x |
2.75x |
Based on these results, Bergamo 9754, which has the highest core count, but smallest L3 cache per core, is least performant among the three candidates, followed by Genoa 9654. The Genoa-X 9684X with the largest L3 cache per core is the most performant. This data suggests that our software stack is very sensitive to L3 cache size, in addition to core count and CPU frequency. This is interesting and worth a deep dive into a sensitivity analysis of our workload against a few (high level) CPU design points, especially core scaling, frequency scaling, and L2/L3 cache sizes scaling.
Number of cores is the headline specification that practically everyone talks about, and one of the easiest improvements CPU vendors can make to increase performance per socket. The AMD Genoa 9654 has 96 cores, 50% more than the 64 cores available on the AMD Milan 7713 CPUs that we used in our Gen 11 servers. Is more always better? Does Cloudflare’s primary workload scale with core count and effectively utilize all available cores?
The figure and table below shows the result of a core scaling experiment performed on an AMD Genoa 9654 configured with 96 cores, 80 cores, 64 cores, and 48 cores, which was done by incrementally disabling 2x CCD (8 cores/CCD) at each step. The result is GREAT, as Cloudflare’s simulated primary workload scales linearly with core count on AMD Genoa CPUs.

|
Core count |
Core increase |
Performance increase |
|
48 |
1.00x |
1.00 |
|
64 |
1.33x |
1.39x |
|
80 |
1.67x |
1.71x |
|
96 |
2.00x |
2.05x |
Thermal Design Power (TDP), is the maximum amount of heat generated by a CPU that the cooling system is designed to dissipate, but more commonly refers to the power consumption of the processor under the maximum theoretical loads. AMD Genoa 9654’s default TDP is 360W, but can be configured up to 400W TDP. Is more always better? Does Cloudflare continue to see meaningful performance improvement up to 400W, or does performance stagnate at some point?
The chart below shows the result of sweeping the TDP of the AMD Genoa 9654 (in power determinism mode) from 240W to 400W. (Note: x-axis step size is not linear).

Cloudflare’s simulated primary workload continues to see incremental performance improvements up to the maximum configurable 400W, albeit at a less favorable perf/watt ratio.
Looking at TDP sensitivity data is a quick and easy way to identify if performance stagnates at some power point, but what does power sensitivity actually measure? There are several factors contributing to CPU power consumption, but let’s focus on one of the primary factors: dynamic power consumption. Dynamic power consumption is approximately CV2f, where C is the switched load capacitance, V is the regulated voltage, and f is the frequency. In modern processors like the AMD Genoa 9654, the CPU dynamically scales its voltage along with frequency, so theoretically, CPU dynamic power is loosely proportional to f3. In other words, measuring TDP sensitivity is measuring the frequency sensitivity of a workload. Does the data agree? Yes!
|
cTDP |
All core boost frequency (GHz) |
Perf (rps) / baseline |
|
240 |
2.47 |
0.78x |
|
280 |
2.75 |
0.87x |
|
320 |
2.93 |
0.93x |
|
340 |
3.13 |
0.97x |
|
360 |
3.3 |
1.00x |
|
380 |
3.4 |
1.03x |
|
390 |
3.465 |
1.04x |
|
400 |
3.55 |
1.05x |
Instead of relying on an indirect measure through the TDP, let’s measure frequency sensitivity directly by sweeping the maximum boost frequency.

At above 3GHz, the data shows that Cloudflare’s primary workload sees roughly 2% incremental improvement for every 0.1GHz all core average frequency increment. We hit the 400W power cap at 3.545GHz. This is notably higher than the typical all core boost frequency that Cloudflare Gen 11 servers with AMD Milan 7713 at 2.7GHz see in production, or at 2.4GHz in our performance simulation, which is amazing!
What about L3 cache size sensitivity? L3 cache size is one of the primary design choices and major differences between the trio of Genoa, Bergamo, and Genoa-X. Genoa 9654 has 4 MB L3/core, Bergamo 9754 has 2 MB L3/core, and Genoa-X has 12 MB L3/core. L3 cache is the last and largest “memory” bank on-chip before having to access memory on DIMMs outside the chip that would take significantly more CPU cycles.
We ran an experiment on the Genoa 9654 to check how performance scales with L3 cache size. L3 cache size per core is reduced through MSR writes (but could also be done using Intel RDT) and L3 cache per core is increased by disabling physical cores in a CCD (which reduces the number of cores sharing the fixed size 32 MB L3 cache per CCD effectively growing the L3 cache per core). Below is the result of the experiment, where >1.00x indicates better performance:
|
L3 cache size increase vs baseline 4MB per core |
0.25x |
0.5x |
0.75x |
1x |
1.14x |
1.33x |
1.60x |
2.00x |
|
rps/core / baseline |
0.67x |
0.78x |
0.89x |
1.00x |
1.08x |
1.15x |
1.25x |
1.31x |
|
L3 cache miss rate per CCD |
56.04% |
39.15% |
30.37% |
23.55% |
22.39% |
19.73% |
16.94% |
14.28% |

Even though the expectation was that the impact of a different L3 cache size gets diminished by the faster DDR5 and larger memory bandwidth, Cloudflare’s simulated primary workload is quite sensitive to L3 cache size. The L3 cache miss rate dropped from 56% with only 1 MB L3 per core, to 14.28% with 8 MB L3/core. Changing the L3 cache size by 25% affects the performance by approximately 11%, and we continue to see performance increase to 2x L3 cache size, though the performance increase starts to diminish when we get to 2x L3 cache per core.
Do we see the same behavior when comparing Genoa 9654, Bergamo 9754 and Genoa-X 9684X? We ran an experiment comparing the impact of L3 cache size, controlling for core count and all core boost frequency, and we also saw significant deltas. Halving the L3 cache size from 4 MB/core to 2 MB/core reduces performance by 24%, roughly matching the experiment above. However, increasing the cache 3x from 4 MB/core to 12 MB/core only increases performance by 25%, less than the indication provided by previous experiments. This is likely because the performance gain we saw on experiment result above could be partially attributed to less cache contention due to reduced number of cores based on how we set up the test. Nevertheless, these are significant deltas!
|
L3/core |
2MB/core |
4MB/core |
12MB/core |
|
Perf (rps) / baseline |
0.76x |
1x |
1.25x |
The table below summarizes how each factor from sensitivity analysis above contributes to the overall performance gain. There are an additional 6% to 14% of unaccounted performance improvement that are contributed by other factors like larger L2 cache, higher memory bandwidth, and miscellaneous CPU architecture changes that improve IPC.
|
Milan 7713 |
Genoa 9654 |
Bergamo 9754 |
Genoa-X 9684X |
|
|
Lab simulation performance multiplier |
1x |
2.2x |
1.95x |
2.75x |
|
Performance multiplier due to Core scaling |
1x |
1.5x |
2x |
1.5x |
|
Performance multiplier due to Frequency scaling (*Note: Milan 7713 all core frequency is ~2.4GHz when running simulated workload at 100% CPU utilization) |
1x |
1.32x |
1.21x |
1.29x |
|
Performance multiplier due to L3 cache size scaling |
1x |
1x |
0.76x |
1.25x |
|
Performance multiplier due to other factors like larger L2 cache, higher memory bandwidth, miscellaneous CPU architecture changes that improve IPC |
1x |
1.11x |
1.06x |
1.14x |
How do these CPU candidates perform with real-world traffic and an actual production workload mix? The table below summarizes the performance of the three CPUs in lab simulation and in production. Genoa-X 9684X continues to outperform in production.
In addition, the Gen 12 server equipped with Genoa-X offered outstanding performance but only consumed 1.5x more power per system than our Gen 11 server with Milan 7713. In other words, we see a 63% increase in performance per watt. Genoa-X 9684X provides the best TCO improvement among the 3 options, and was ultimately chosen as the CPU for our Gen 12 server.
|
Milan 7713 |
Genoa 9654 |
Bergamo 9754 |
Genoa-X 9684X |
|
|
Lab simulation performance multiplier |
1x |
2.2x |
1.95x |
2.75x |
|
Production performance multiplier |
1x |
2x |
2.15x |
2.45x |
|
Production performance per watt multiplier |
1x |
1.33x |
1.38x |
1.63x |
The Gen 12 server with AMD Genoa-X 9684X is the most powerful and the most power efficient server Cloudflare has built to date. It serves as the underlying platform for all the incredible services that Cloudflare offers to our customers globally, and will help power the growth of Cloudflare infrastructure for the next several years with improved cost structure.
Hardware engineers at Cloudflare work closely with our infrastructure engineering partners and externally with our vendors to design and develop world-class servers to best serve our customers.
Come join us at Cloudflare to help build a better Internet!
Post Syndicated from corbet original https://lwn.net/Articles/994268/
Security updates have been issued by AlmaLinux (container-tools:rhel8, firefox, OpenIPMI, podman, and thunderbird), Debian (libapache-mod-jk, php7.4, and webkit2gtk), Fedora (edk2, koji, libgsf, rust-hyper-rustls, rust-reqwest, rust-rustls-native-certs, rust-rustls-native-certs0.7, rust-tonic, rust-tonic-build, rust-tonic-types, rust-tower, rust-tower-http, rust-tower-http0.5, and rust-tower0.4), Mageia (packages and thunderbird), Oracle (bind, container-tools:ol8, kernel, kernel-container, OpenIPMI, podman, and thunderbird), Red Hat (container-tools:rhel8, containernetworking-plugins, podman, and skopeo), SUSE (argocd-cli, bsdtar, keepalived, kernel, kyverno, libmozjs-115-0, libmozjs-128-0, libmozjs-78-0, OpenIPMI, opensc, php8, thunderbird, and xen), and Ubuntu (configobj, haproxy, imagemagick, nginx, and postgresql-10, postgresql-9.3).
Post Syndicated from daroc original https://lwn.net/Articles/993484/
Paul McKenney gave a presentation at Kangrejos this year that wasn’t (directly)
related to Rust. Instead, he spoke about the work he has been doing in concert
with many other contributors on improving the handling of subtle concurrency
problems in C++.
Although he cautioned that his talk was only an overview, and not a
substitute for reading the relevant papers, he hoped that the things the C++
community is working on would be of interest to the Rust developers present as
well, and potentially inform future work on the language. McKenney’s talk was,
as is his style, full of subtle examples of weird multithreaded behavior.
Interested readers may wish to refer to
his slides in an attempt to follow along.
Post Syndicated from Noelle Kagan original https://blog.cloudflare.com/protect-against-identity-based-attacks-by-sharing-cloudflare-user-risk-with-okta
Cloudflare One, our secure access service edge (SASE) platform, is introducing a new integration with Okta, the identity and access management (IAM) vendor, to share risk indicators in real-time and simplify how organizations can dynamically manage their security posture in response to changes across their environments.
For many organizations, it is becoming increasingly challenging and inefficient to adapt to risks across their growing attack surface. In particular, security teams struggle with multiple siloed tools that fail to share risk data effectively with each other, leading to excessive manual effort to extract signals from the noise. To address this complexity, Cloudflare launched risk posture management capabilities earlier this year to make it easier for organizations to accomplish three key jobs on one platform:
Evaluating risk posed by people by using first-party user entity and behavior analytics (UEBA) models
Exchanging risk telemetry with best-in-class security tools, and
Enforcing risk controls based on those dynamic first- and third-party risk scores.
Today’s announcement builds on these capabilities (particularly job #2) and our partnership with Okta by enabling organizations to share Cloudflare’s real-time user risk scores with Okta, which can then automatically enforce policies based on that user’s risk. In this way, organizations can adapt to evolving risks in less time with less manual effort.
Introduced earlier this year, Cloudflare’s user risk scoring analyzes real-time telemetry of user activities and behaviors and assigns a risk score of high, medium, or low. For example, if Cloudflare detects risky or suspicious activity from a user — such as impossible travel, where a user logs in from multiple geographically dispersed locations within a short time frame, data loss prevention (DLP) detections, or endpoint detections suggesting that the device is infected — the user’s risk score will increase. The activity leading to that scoring is logged for analysis.
Cloudflare includes predefined risk behaviors to help you get started. Administrators can create policies based on specific risk behaviors and adjust the risk level for each behavior based on their company’s tolerance.
Customers that opt in to this new integration will be able to share continually updated Cloudflare user risk scores with Identity Threat Protection with Okta AI. If a user is deemed too risky, Okta will automatically take action to mitigate the risk, such as enforcing multi-factor authentication (MFA) verification or universally logging the user out from all applications.
For example, a user has a low risk score from Cloudflare that was shared with Okta, but after exhibiting “impossible travel” behavior, the user’s risk level is raised to high. Cloudflare sends the updated score to Okta, which triggers a Universal Logout and an MFA challenge if the user attempts to log in again. Access to sensitive systems may be revoked completely until the user is verified.

Figure 1. Diagram showing risky behavior by a user, resulting in sign-out.
We begin by detecting risky behavior from a user (such as an “impossible travel” event between two geographic locations). Instances of risky behavior are called Risk Events. We perform two actions when we observe a Risk Event: logging the event and evaluating whether further action is required. For customers that have enabled Risk Score Sharing with Okta, any change in Risk Score is transmitted to Okta’s Identity Threat Protection (ITP).
Upon receiving a new event, Okta evaluates the change in user risk against the organization’s policies. These policies may include actions such as re-authenticating the user if they become high risk.
When we design new features, we aim for them to be extensible across the industry. For this reason, we chose the OpenID Shared Signals Framework Specification (SSF) to be the foundation of our transmission format. By doing this, we are able to leverage current and future providers that support the standard. The core functionality of SSF revolves around sharing Security Event Tokens (SETs), a specialized version of a JSON Web Token (JWT). Providers can produce and consume Security Event Tokens, forming a “network” of shared user risk information between providers.

Figure 2. Diagram showing a Security Event Token being transmitted from Cloudflare to Okta.
The diagram above (Figure 2) details the process of sharing risk. When sharing Risk Score changes with Okta, we bundle metadata about the risk event and user into the body of a Security Event Token. Following this, the JWT/SET is signed using our private key. This is an important step, as the signature is used to verify the sender’s identity (cryptographic authenticity) and that the payload body has not been tampered with (cryptographic integrity). In plain terms, this signature is used by Okta to verify that the event is unaltered and was sent by Cloudflare.
Once Okta has verified the authenticity and integrity of the SET token, they may use the risk metadata within the body to execute Identity Threat Protection policies defined by the customer. These policies could include actions such as “if a high risk score is received from Cloudflare, sign out the offending user”.
Learn more about the Shared Signals Framework and CAEP in Okta’s announcement blog post.
Cloudflare customers can easily enable risk score sharing from the Cloudflare One SSO setup page. This is available to customers whether you’ve already integrated with Okta or are setting up the integration for the first time. You will also be able to confirm that the feature was enabled in your audit logs.
If you’ve already integrated Okta within your Cloudflare One dashboard:
As an admin, navigate to Settings > Authentication and select the Okta login method.
Select “send risk score to Okta.”
If you haven’t yet integrated Okta within your Cloudflare One dashboard:
As an admin, navigate to Settings > Authentication and select a new login method.
Follow the instructions to add Okta as an SSO.
Select “send risk score to Okta.”
Now, whenever a user’s risk score changes within the organization, information is sent to Okta automatically and an audit log is documented.
In conclusion, the ability to incorporate rich context is essential for making accurate and informed access decisions. With vast amounts of data — including user logins, logouts, websites visited, and emails sent — human analysts would struggle to keep pace with modern security challenges. Cloudflare provides context in the form of a risk score, enabling Okta’s risk engine to make more informed policy decisions about users. This sharing of information powers the continuous evaluation required to enforce Zero Trust policies within your organization, ultimately strengthening your organization’s security posture.
Not yet a Cloudflare One customer? Reach out for a consultation or contact your account manager.
Post Syndicated from Bruce Schneier original https://www.schneier.com/blog/archives/2024/10/more-details-on-israel-sabotaging-hezbollah-pagers-and-walkie-talkies.html
The Washington Post has a long and detailed story about the operation that’s well worth reading (alternate version here).
The sales pitch came from a marketing official trusted by Hezbollah with links to Apollo. The marketing official, a woman whose identity and nationality officials declined to reveal, was a former Middle East sales representative for the Taiwanese firm who had established her own company and acquired a license to sell a line of pagers that bore the Apollo brand. Sometime in 2023, she offered Hezbollah a deal on one of the products her firm sold: the rugged and reliable AR924.
“She was the one in touch with Hezbollah, and explained to them why the bigger pager with the larger battery was better than the original model,” said an Israeli official briefed on details of the operation. One of the main selling points about the AR924 was that it was “possible to charge with a cable. And the batteries were longer lasting,” the official said.
As it turned out, the actual production of the devices was outsourced and the marketing official had no knowledge of the operation and was unaware that the pagers were physically assembled in Israel under Mossad oversight, officials said. Mossad’s pagers, each weighing less than three ounces, included a unique feature: a battery pack that concealed a tiny amount of a powerful explosive, according to the officials familiar with the plot.
In a feat of engineering, the bomb component was so carefully hidden as to be virtually undetectable, even if the device was taken apart, the officials said. Israeli officials believe that Hezbollah did disassemble some of the pagers and may have even X-rayed them.
Also invisible was Mossad’s remote access to the devices. An electronic signal from the intelligence service could trigger the explosion of thousands of the devices at once. But, to ensure maximum damage, the blast could also be triggered by a special two-step procedure required for viewing secure messages that had been encrypted.
“You had to push two buttons to read the message,” an official said. In practice, that meant using both hands.
Also read Bunnie Huang’s essay on what it means to live in a world where people can turn IoT devices into bombs. His conclusion:
Not all things that could exist should exist, and some ideas are better left unimplemented. Technology alone has no ethics: the difference between a patch and an exploit is the method in which a technology is disclosed. Exploding batteries have probably been conceived of and tested by spy agencies around the world, but never deployed en masse because while it may achieve a tactical win, it is too easy for weaker adversaries to copy the idea and justify its re-deployment in an asymmetric and devastating retaliation.
However, now that I’ve seen it executed, I am left with the terrifying realization that not only is it feasible, it’s relatively easy for any modestly-funded entity to implement. Not just our allies can do this—a wide cast of adversaries have this capability in their reach, from nation-states to cartels and gangs, to shady copycat battery factories just looking for a big payday (if chemical suppliers can moonlight in illicit drugs, what stops battery factories from dealing in bespoke munitions?). Bottom line is: we should approach the public policy debate around this assuming that someday, we could be victims of exploding batteries, too. Turning everyday objects into fragmentation grenades should be a crime, as it blurs the line between civilian and military technologies.
I fear that if we do not universally and swiftly condemn the practice of turning everyday gadgets into bombs, we risk legitimizing a military technology that can literally bring the front line of every conflict into your pocket, purse or home.
Post Syndicated from The History Guy: History Deserves to Be Remembered original https://www.youtube.com/watch?v=_ts39uxplbs
Post Syndicated from The Atlantic original https://www.youtube.com/watch?v=3clRU9XnD40
Post Syndicated from Bonnie Sheppard original https://www.raspberrypi.org/blog/debugging-positive-experience-secondary-school-students/
Artificial intelligence (AI) continues to change many areas of our lives, with new AI technologies and software having the potential to significantly impact the way programming is taught at schools. In our seminar series this year, we’ve already heard about new AI code generators that can support and motivate young people when learning to code, AI tools that can create personalised Parson’s Problems, and research into how generative AI could improve young people’s understanding of program error messages.

At times, it can seem like everything is being automated with AI. However, there are some parts of learning to program that cannot (and probably should not) be automated, such as understanding errors in code and how to fix them. Manually typing code might not be necessary in the future, but it will still be crucial to understand the code that is being generated and how to improve and develop it.
As important as debugging might be for the future of programming, it’s still often the task most disliked by novice programmers. Even if program error messages can be explained in the future or tools like LitterBox can flag bugs in an engaging way, actually fixing the issues involves time, effort, and resilience — which can be hard to come by at the end of a computing lesson in the late afternoon with 30 students crammed into an IT room.
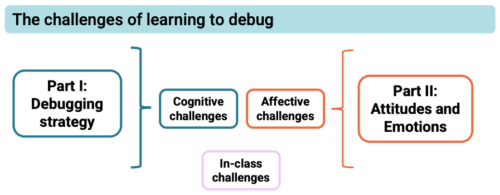
But what is it about debugging that young people find so hard, even when they’re given enough time to do it? And how can we make debugging a more motivating experience for young people? These are two of the questions that Laurie Gale, a PhD student at the Raspberry Pi Computing Education Research Centre, focused on in our July seminar.
Laurie has spent the past two years talking to teachers and students and developing tools (a visualiser of students’ programming behaviour and PRIMMDebug, a teaching process and tool for debugging) to understand why many secondary school students struggle with debugging. It has quickly become clear through his research that most issues are due to problematic debugging strategies and students’ negative experiences and attitudes.

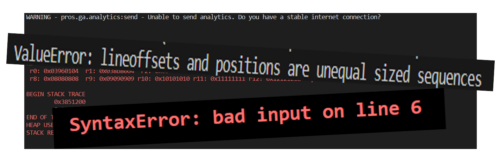
When students first start learning how to program, they have to remember a vast amount of new information, such as different variables, concepts, and program designs. Utilising this knowledge is often challenging because they’re already busy juggling all the content they’ve previously learnt and the challenges of the programming task at hand. When error messages inevitably appear that are confusing or misunderstood, it can become extremely difficult to debug effectively.
Given this information overload, students often don’t develop efficient strategies for debugging. When Laurie analysed the debugging efforts of 12- to 14-year-old secondary school students, he noticed some interesting differences between students who were more and less successful at debugging. While successful students generally seemed to make less frequent and more intentional changes, less successful students tinkered frequently with their broken programs, making one- or two-character edits before running the program again. In addition, the less successful students often ran the program soon after beginning the debugging exercise without allowing enough time to actually read the code and understand what it was meant to do.
The issue with these behaviours was that they often resulted in students adding errors when changing the program, which then compounded and made debugging increasingly difficult with each run. 74% of students also resorted to spamming, pressing ‘run’ again and again without changing anything. This strategy resonated with many of our seminar attendees, who reported doing the same thing after becoming frustrated.
Educators need to be aware of the negative consequences of students’ exasperating and often overwhelming experiences with debugging, especially if students are less confident in their programming skills to begin with. Even though spending 15 minutes on an exercise shows a remarkable level of tenaciousness and resilience, students’ attitudes to programming — and computing as a whole — can quickly go downhill if their strategies for identifying errors prove ineffective. Debugging becomes a vicious circle: if a student has negative experiences, they are less confident when having to bug-fix again in the future, which can lead to another set of unsuccessful attempts, which can further damage their confidence, and so on. Avoiding this downward spiral is essential.
Laurie stresses the importance of understanding the cognitive challenges of debugging and using the right tools and techniques to empower students and support them in developing effective strategies.
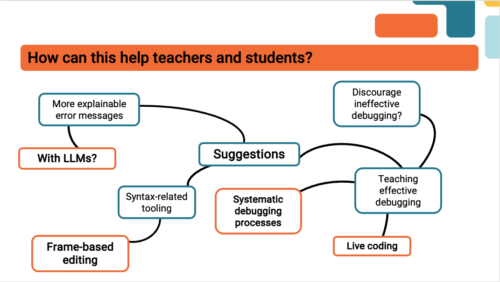
Some ideas of how to improve debugging skills that were mentioned by Laurie and our attendees included:
Most importantly, debugging should not be a daunting or stressful experience. Everyone in the seminar agreed that creating a positive error culture is essential.
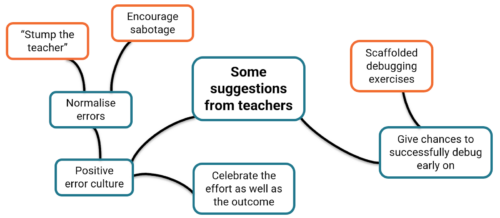
Some ideas you could explore in your classroom include:
In a welcoming classroom where students are given support and encouragement, debugging can be a rewarding experience. What may at first appear to be a failure — even a spectacular one — can be embraced as a valuable opportunity for learning. As a teacher in Laurie’s study said, “If something should have gone right and went badly wrong but somebody found something interesting on the way… you celebrate it. Take the fear out of it.”
Watch the recording of Laurie’s presentation:
In our current seminar series, we are exploring how to teach programming with and without AI.
Join us at our next seminar on Tuesday, 12 November at 17:00–18:30 GMT to hear Nicholas Gardella (University of Virginia) discuss the effects of using tools like GitHub Copilot on the motivation, workload, emotion, and self-efficacy of novice programmers. To sign up and take part in the seminar, click the button below — we’ll then send you information about joining. We hope to see you there.
The schedule of our upcoming seminars is online. You can catch up on past seminars on our previous seminars and recordings page.
The post How to make debugging a positive experience for secondary school students appeared first on Raspberry Pi Foundation.